Zip Codes with the Highest Percentage of Population Employed in Real Estate, Rental & Leasing in Columbus, OH
RELATED REPORTS & OPTIONS
Real Estate, Rental & Leasing
Columbus
Compare Zip Codes
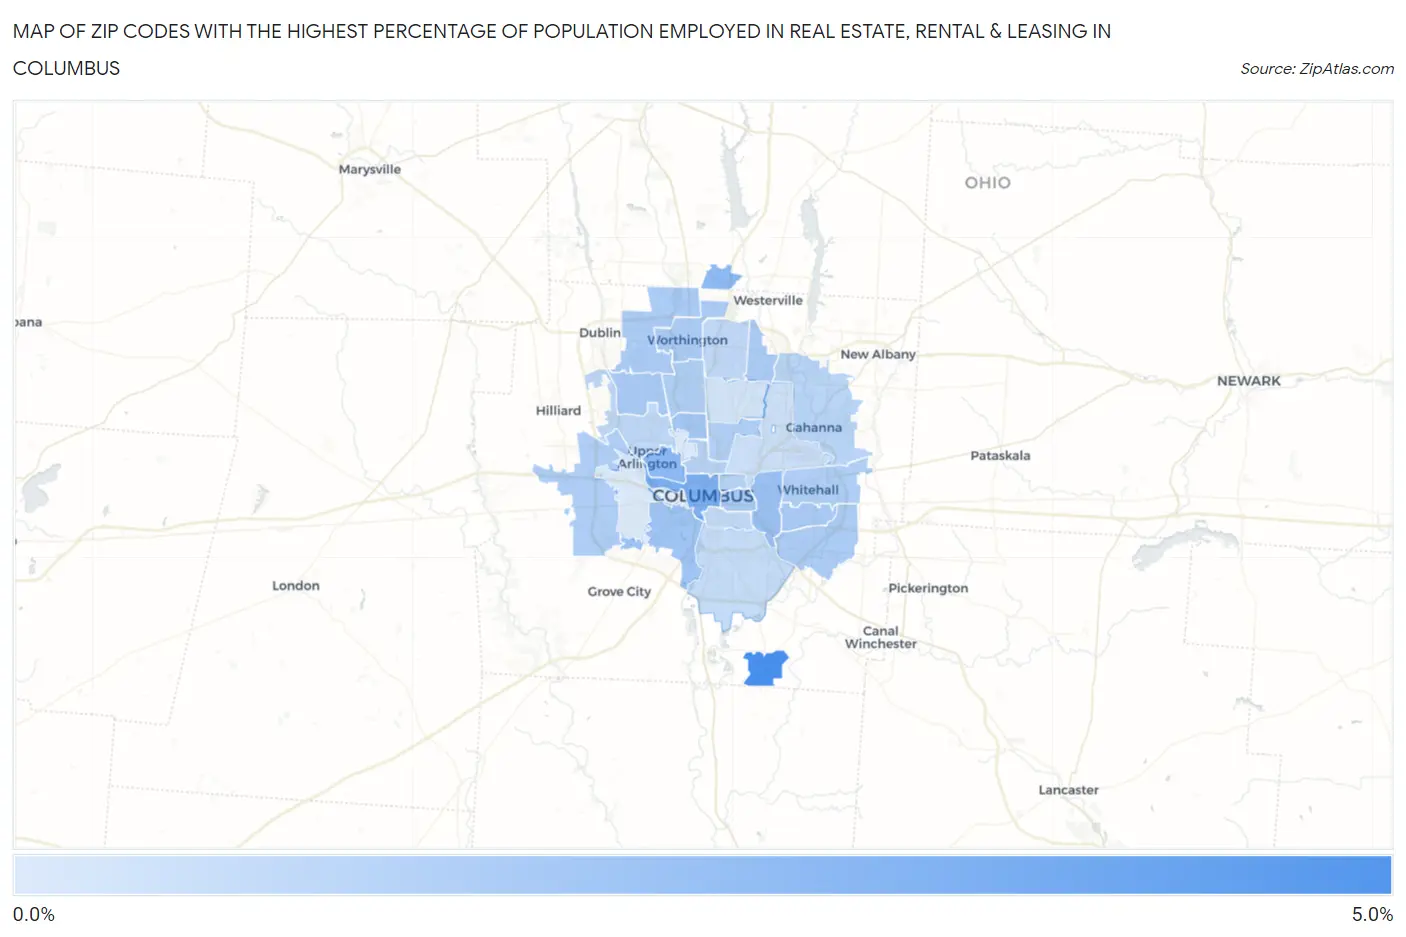
Map of Zip Codes with the Highest Percentage of Population Employed in Real Estate, Rental & Leasing in Columbus
0.0%
5.0%
Zip Codes with the Highest Percentage of Population Employed in Real Estate, Rental & Leasing in Columbus, OH
| Zip Code | % Employed | vs State | vs National | |
| 1. | 43217 | 4.7% | 1.5%(+3.27)#42 | 1.9%(+2.84)#1,538 |
| 2. | 43215 | 3.1% | 1.5%(+1.64)#87 | 1.9%(+1.21)#3,626 |
| 3. | 43212 | 2.7% | 1.5%(+1.26)#114 | 1.9%(+0.822)#4,705 |
| 4. | 43240 | 2.6% | 1.5%(+1.17)#123 | 1.9%(+0.730)#5,030 |
| 5. | 43209 | 2.3% | 1.5%(+0.846)#157 | 1.9%(+0.409)#6,300 |
| 6. | 43223 | 2.1% | 1.5%(+0.691)#186 | 1.9%(+0.254)#7,093 |
| 7. | 43202 | 2.0% | 1.5%(+0.546)#214 | 1.9%(+0.110)#7,824 |
| 8. | 43227 | 1.9% | 1.5%(+0.425)#243 | 1.9%(-0.012)#8,604 |
| 9. | 43220 | 1.8% | 1.5%(+0.390)#251 | 1.9%(-0.046)#8,832 |
| 10. | 43235 | 1.8% | 1.5%(+0.361)#255 | 1.9%(-0.076)#9,012 |
| 11. | 43231 | 1.8% | 1.5%(+0.347)#260 | 1.9%(-0.089)#9,113 |
| 12. | 43205 | 1.8% | 1.5%(+0.343)#262 | 1.9%(-0.094)#9,151 |
| 13. | 43232 | 1.8% | 1.5%(+0.341)#263 | 1.9%(-0.096)#9,160 |
| 14. | 43085 | 1.8% | 1.5%(+0.299)#273 | 1.9%(-0.138)#9,421 |
| 15. | 43228 | 1.7% | 1.5%(+0.273)#280 | 1.9%(-0.164)#9,566 |
| 16. | 43214 | 1.7% | 1.5%(+0.224)#293 | 1.9%(-0.212)#9,907 |
| 17. | 43213 | 1.7% | 1.5%(+0.217)#294 | 1.9%(-0.220)#9,960 |
| 18. | 43211 | 1.6% | 1.5%(+0.125)#322 | 1.9%(-0.312)#10,579 |
| 19. | 43201 | 1.4% | 1.5%(-0.020)#370 | 1.9%(-0.457)#11,710 |
| 20. | 43203 | 1.4% | 1.5%(-0.025)#372 | 1.9%(-0.462)#11,755 |
| 21. | 43230 | 1.4% | 1.5%(-0.086)#391 | 1.9%(-0.523)#12,218 |
| 22. | 43221 | 1.3% | 1.5%(-0.204)#429 | 1.9%(-0.641)#13,081 |
| 23. | 43229 | 1.2% | 1.5%(-0.273)#457 | 1.9%(-0.710)#13,634 |
| 24. | 43206 | 1.1% | 1.5%(-0.334)#479 | 1.9%(-0.771)#14,109 |
| 25. | 43207 | 1.1% | 1.5%(-0.403)#506 | 1.9%(-0.840)#14,699 |
| 26. | 43219 | 0.86% | 1.5%(-0.597)#577 | 1.9%(-1.03)#16,284 |
| 27. | 43224 | 0.67% | 1.5%(-0.785)#653 | 1.9%(-1.22)#17,709 |
| 28. | 43204 | 0.44% | 1.5%(-1.02)#725 | 1.9%(-1.46)#19,566 |
| 29. | 43210 | 0.41% | 1.5%(-1.05)#736 | 1.9%(-1.48)#19,736 |
1
Common Questions
What are the Top 10 Zip Codes with the Highest Percentage of Population Employed in Real Estate, Rental & Leasing in Columbus, OH?
Top 10 Zip Codes with the Highest Percentage of Population Employed in Real Estate, Rental & Leasing in Columbus, OH are:
What zip code has the Highest Percentage of Population Employed in Real Estate, Rental & Leasing in Columbus, OH?
43217 has the Highest Percentage of Population Employed in Real Estate, Rental & Leasing in Columbus, OH with 4.7%.
What is the Percentage of Population Employed in Real Estate, Rental & Leasing in Columbus, OH?
Percentage of Population Employed in Real Estate, Rental & Leasing in Columbus is 1.4%.
What is the Percentage of Population Employed in Real Estate, Rental & Leasing in Ohio?
Percentage of Population Employed in Real Estate, Rental & Leasing in Ohio is 1.5%.
What is the Percentage of Population Employed in Real Estate, Rental & Leasing in the United States?
Percentage of Population Employed in Real Estate, Rental & Leasing in the United States is 1.9%.