Zip Codes with the Highest Percentage of Population Employed in Health Diagnosing & Treating in Massillon, OH
RELATED REPORTS & OPTIONS
Health Diagnosing & Treating
Massillon
Compare Zip Codes
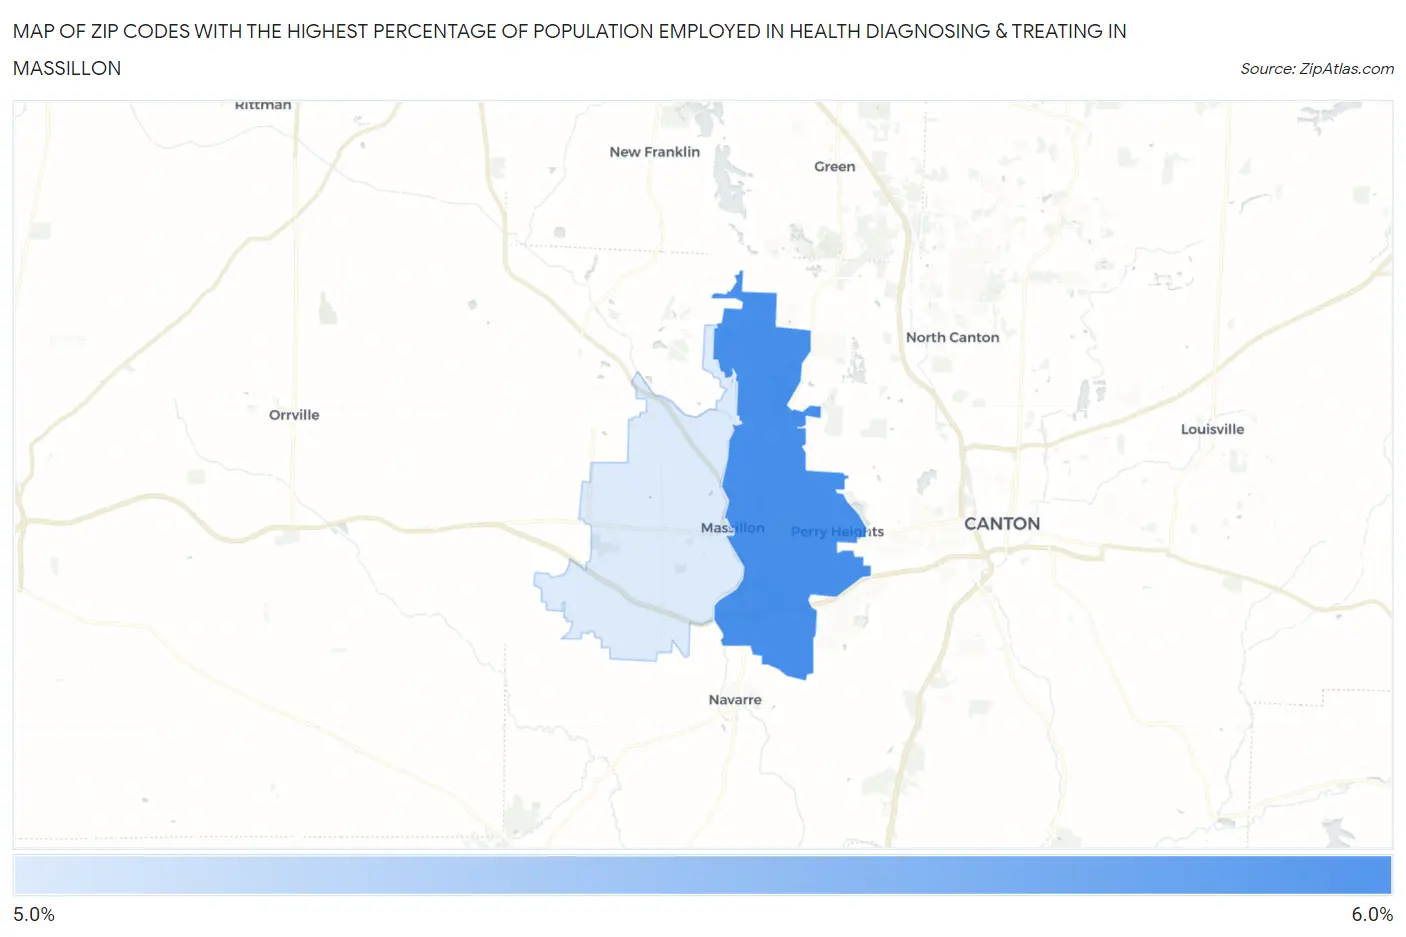
Map of Zip Codes with the Highest Percentage of Population Employed in Health Diagnosing & Treating in Massillon
0.0%
6.0%
Zip Codes with the Highest Percentage of Population Employed in Health Diagnosing & Treating in Massillon, OH
| Zip Code | % Employed | vs State | vs National | |
| 1. | 44646 | 5.9% | 7.2%(-1.28)#634 | 6.2%(-0.368)#14,327 |
| 2. | 44647 | 5.3% | 7.2%(-1.86)#705 | 6.2%(-0.955)#16,596 |
1
Common Questions
What are the Top Zip Codes with the Highest Percentage of Population Employed in Health Diagnosing & Treating in Massillon, OH?
Top Zip Codes with the Highest Percentage of Population Employed in Health Diagnosing & Treating in Massillon, OH are:
What zip code has the Highest Percentage of Population Employed in Health Diagnosing & Treating in Massillon, OH?
44646 has the Highest Percentage of Population Employed in Health Diagnosing & Treating in Massillon, OH with 5.9%.
What is the Percentage of Population Employed in Health Diagnosing & Treating in Massillon, OH?
Percentage of Population Employed in Health Diagnosing & Treating in Massillon is 3.5%.
What is the Percentage of Population Employed in Health Diagnosing & Treating in Ohio?
Percentage of Population Employed in Health Diagnosing & Treating in Ohio is 7.2%.
What is the Percentage of Population Employed in Health Diagnosing & Treating in the United States?
Percentage of Population Employed in Health Diagnosing & Treating in the United States is 6.2%.