Zip Codes with the Highest Percentage of Families with Income Below $10,000 in Columbus, OH
RELATED REPORTS & OPTIONS
Family Income | $0-10k
Columbus
Compare Zip Codes
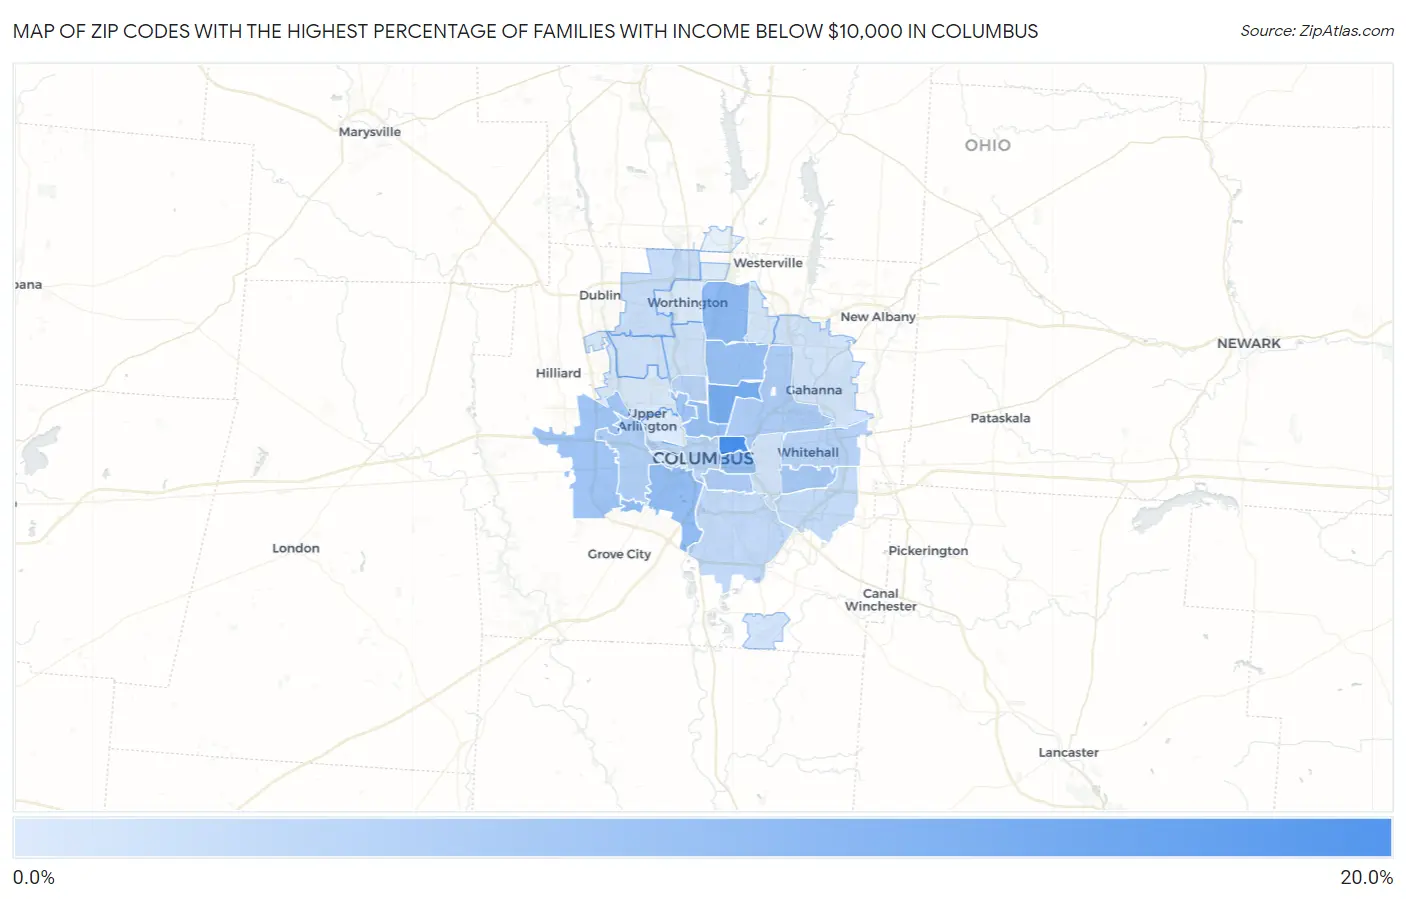
Map of Zip Codes with the Highest Percentage of Families with Income Below $10,000 in Columbus
0.0%
20.0%
Zip Codes with the Highest Percentage of Families with Income Below $10,000 in Columbus, OH
| Zip Code | Families with Income < $10k | vs State | vs National | |
| 1. | 43203 | 17.6% | 3.3%(+14.3)#17 | 3.1%(+14.5)#609 |
| 2. | 43211 | 11.7% | 3.3%(+8.40)#46 | 3.1%(+8.60)#1,393 |
| 3. | 43229 | 8.9% | 3.3%(+5.60)#98 | 3.1%(+5.80)#2,398 |
| 4. | 43223 | 8.6% | 3.3%(+5.30)#103 | 3.1%(+5.50)#2,562 |
| 5. | 43205 | 8.3% | 3.3%(+5.00)#118 | 3.1%(+5.20)#2,776 |
| 6. | 43224 | 8.0% | 3.3%(+4.70)#127 | 3.1%(+4.90)#2,947 |
| 7. | 43201 | 7.9% | 3.3%(+4.60)#130 | 3.1%(+4.80)#3,016 |
| 8. | 43210 | 7.1% | 3.3%(+3.80)#151 | 3.1%(+4.00)#3,561 |
| 9. | 43228 | 6.9% | 3.3%(+3.60)#155 | 3.1%(+3.80)#3,688 |
| 10. | 43227 | 6.5% | 3.3%(+3.20)#169 | 3.1%(+3.40)#4,109 |
| 11. | 43219 | 5.7% | 3.3%(+2.40)#196 | 3.1%(+2.60)#5,022 |
| 12. | 43206 | 5.5% | 3.3%(+2.20)#208 | 3.1%(+2.40)#5,323 |
| 13. | 43204 | 5.0% | 3.3%(+1.70)#241 | 3.1%(+1.90)#6,082 |
| 14. | 43213 | 4.3% | 3.3%(+1.000)#282 | 3.1%(+1.20)#7,411 |
| 15. | 43202 | 4.3% | 3.3%(+1.000)#283 | 3.1%(+1.20)#7,448 |
| 16. | 43215 | 4.1% | 3.3%(+0.800)#308 | 3.1%(+1.000)#7,938 |
| 17. | 43207 | 3.2% | 3.3%(-0.100)#396 | 3.1%(+0.100)#10,416 |
| 18. | 43232 | 3.1% | 3.3%(-0.200)#411 | 3.1%(=0.000)#10,758 |
| 19. | 43235 | 2.5% | 3.3%(-0.800)#487 | 3.1%(-0.600)#13,041 |
| 20. | 43220 | 1.7% | 3.3%(-1.60)#629 | 3.1%(-1.40)#16,760 |
| 21. | 43214 | 1.7% | 3.3%(-1.60)#631 | 3.1%(-1.40)#16,783 |
| 22. | 43230 | 1.6% | 3.3%(-1.70)#648 | 3.1%(-1.50)#17,178 |
| 23. | 43209 | 1.5% | 3.3%(-1.80)#671 | 3.1%(-1.60)#17,740 |
| 24. | 43231 | 1.4% | 3.3%(-1.90)#693 | 3.1%(-1.70)#18,282 |
| 25. | 43217 | 1.4% | 3.3%(-1.90)#705 | 3.1%(-1.70)#18,533 |
| 26. | 43221 | 0.70% | 3.3%(-2.60)#808 | 3.1%(-2.40)#21,669 |
| 27. | 43212 | 0.40% | 3.3%(-2.90)#870 | 3.1%(-2.70)#23,032 |
| 28. | 43222 | 0.40% | 3.3%(-2.90)#883 | 3.1%(-2.70)#23,199 |
| 29. | 43085 | 0.30% | 3.3%(-3.00)#888 | 3.1%(-2.80)#23,367 |
1
Common Questions
What are the Top 10 Zip Codes with the Highest Percentage of Families with Income Below $10,000 in Columbus, OH?
Top 10 Zip Codes with the Highest Percentage of Families with Income Below $10,000 in Columbus, OH are:
What zip code has the Highest Percentage of Families with Income Below $10,000 in Columbus, OH?
43203 has the Highest Percentage of Families with Income Below $10,000 in Columbus, OH with 17.6%.
What is the Percentage of Families with Income Below $10,000 in Columbus, OH?
Percentage of Families with Income Below $10,000 in Columbus is 4.3%.
What is the Percentage of Families with Income Below $10,000 in Ohio?
Percentage of Families with Income Below $10,000 in Ohio is 3.3%.
What is the Percentage of Families with Income Below $10,000 in the United States?
Percentage of Families with Income Below $10,000 in the United States is 3.1%.