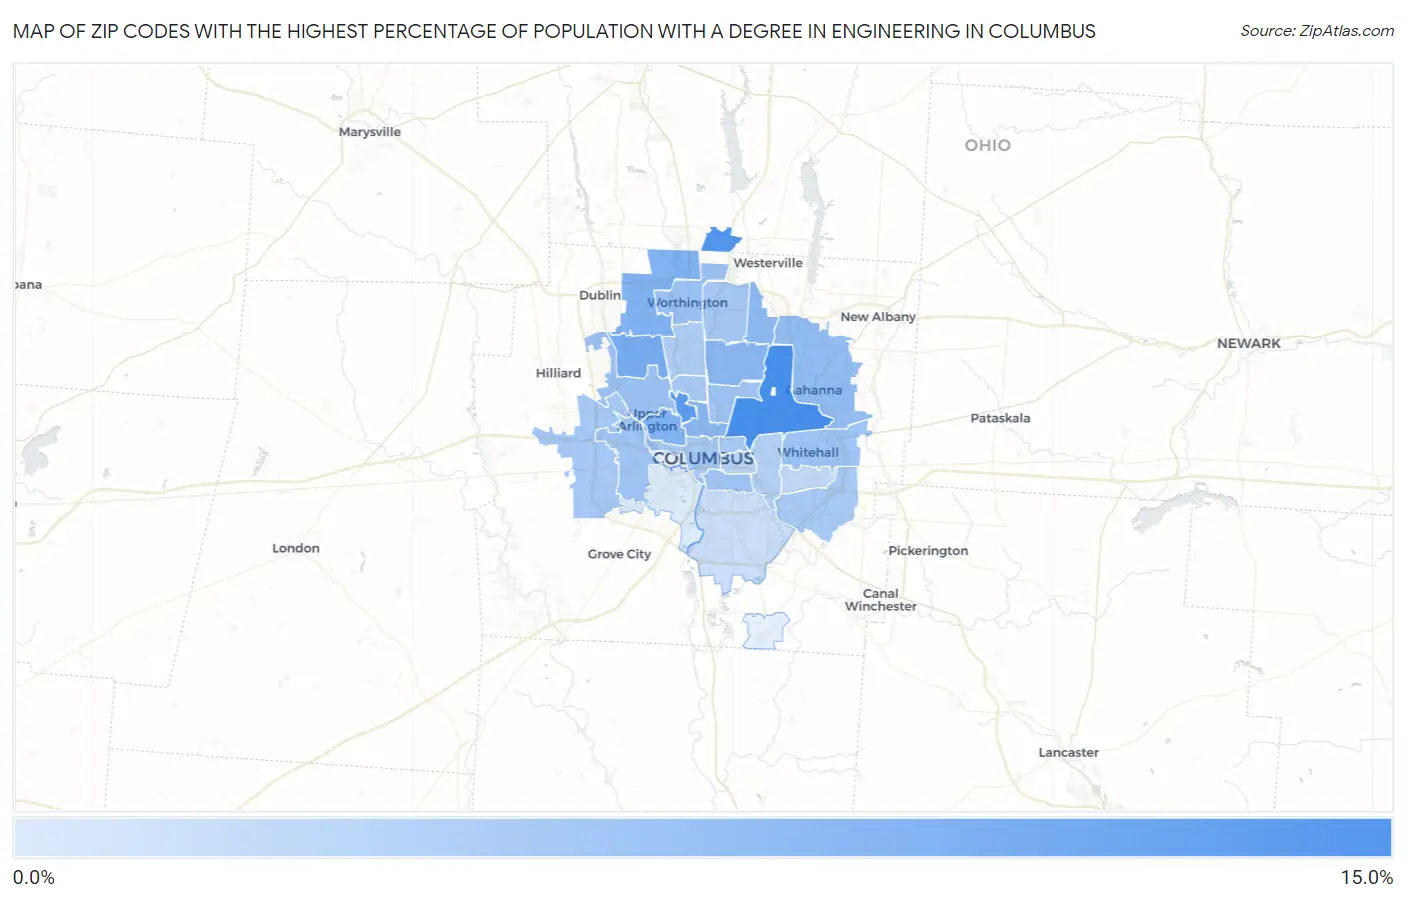
Zip Codes with the Highest Percentage of Population with a Degree in Engineering in Columbus, OH
RELATED REPORTS & OPTIONS
Engineering
Columbus
Compare Zip Codes
Map of Zip Codes with the Highest Percentage of Population with a Degree in Engineering in Columbus
0.0%
15.0%
Zip Codes with the Highest Percentage of Population with a Degree in Engineering in Columbus, OH
| Zip Code | % Graduates | vs State | vs National | |
| 1. | 43219 | 13.7% | 7.4%(+6.30)#83 | 7.6%(+6.03)#2,145 |
| 2. | 43240 | 12.6% | 7.4%(+5.24)#104 | 7.6%(+4.97)#2,572 |
| 3. | 43210 | 12.0% | 7.4%(+4.66)#119 | 7.6%(+4.39)#2,878 |
| 4. | 43220 | 9.1% | 7.4%(+1.72)#244 | 7.6%(+1.45)#5,446 |
| 5. | 43212 | 8.5% | 7.4%(+1.08)#285 | 7.6%(+0.803)#6,359 |
| 6. | 43235 | 8.4% | 7.4%(+0.989)#287 | 7.6%(+0.716)#6,479 |
| 7. | 43224 | 7.5% | 7.4%(+0.165)#349 | 7.6%(-0.108)#7,932 |
| 8. | 43201 | 7.5% | 7.4%(+0.103)#356 | 7.6%(-0.170)#8,045 |
| 9. | 43231 | 7.0% | 7.4%(-0.340)#386 | 7.6%(-0.613)#8,910 |
| 10. | 43230 | 6.8% | 7.4%(-0.587)#405 | 7.6%(-0.860)#9,420 |
| 11. | 43085 | 6.2% | 7.4%(-1.19)#462 | 7.6%(-1.46)#10,733 |
| 12. | 43221 | 6.0% | 7.4%(-1.36)#482 | 7.6%(-1.63)#11,144 |
| 13. | 43213 | 5.8% | 7.4%(-1.61)#505 | 7.6%(-1.88)#11,783 |
| 14. | 43204 | 5.4% | 7.4%(-1.95)#541 | 7.6%(-2.22)#12,597 |
| 15. | 43206 | 5.4% | 7.4%(-1.95)#542 | 7.6%(-2.22)#12,614 |
| 16. | 43211 | 5.4% | 7.4%(-1.97)#544 | 7.6%(-2.24)#12,650 |
| 17. | 43229 | 5.1% | 7.4%(-2.30)#568 | 7.6%(-2.57)#13,482 |
| 18. | 43228 | 5.0% | 7.4%(-2.36)#572 | 7.6%(-2.63)#13,619 |
| 19. | 43215 | 4.9% | 7.4%(-2.45)#581 | 7.6%(-2.72)#13,893 |
| 20. | 43203 | 4.9% | 7.4%(-2.47)#586 | 7.6%(-2.74)#13,957 |
| 21. | 43232 | 4.8% | 7.4%(-2.59)#596 | 7.6%(-2.86)#14,286 |
| 22. | 43202 | 4.7% | 7.4%(-2.68)#606 | 7.6%(-2.95)#14,532 |
| 23. | 43214 | 4.4% | 7.4%(-3.00)#643 | 7.6%(-3.27)#15,383 |
| 24. | 43209 | 3.7% | 7.4%(-3.72)#706 | 7.6%(-3.99)#17,274 |
| 25. | 43205 | 3.1% | 7.4%(-4.27)#755 | 7.6%(-4.54)#18,623 |
| 26. | 43227 | 2.8% | 7.4%(-4.58)#772 | 7.6%(-4.85)#19,310 |
| 27. | 43207 | 2.0% | 7.4%(-5.40)#822 | 7.6%(-5.68)#20,991 |
| 28. | 43223 | 0.36% | 7.4%(-7.01)#881 | 7.6%(-7.29)#23,277 |
1
Common Questions
What are the Top 10 Zip Codes with the Highest Percentage of Population with a Degree in Engineering in Columbus, OH?
Top 10 Zip Codes with the Highest Percentage of Population with a Degree in Engineering in Columbus, OH are:
What zip code has the Highest Percentage of Population with a Degree in Engineering in Columbus, OH?
43219 has the Highest Percentage of Population with a Degree in Engineering in Columbus, OH with 13.7%.
What is the Percentage of Population with a Degree in Engineering in Columbus, OH?
Percentage of Population with a Degree in Engineering in Columbus is 6.4%.
What is the Percentage of Population with a Degree in Engineering in Ohio?
Percentage of Population with a Degree in Engineering in Ohio is 7.4%.
What is the Percentage of Population with a Degree in Engineering in the United States?
Percentage of Population with a Degree in Engineering in the United States is 7.6%.