Zip Codes with the Highest Percentage of Population with a Degree in Computers and Mathematics in Columbus, OH

RELATED REPORTS & OPTIONS

Computers and Mathematics
Population
Families and Households
Female Fertility
Female Fertility (Unmarried)
Race (Community Size)
Race (Percentage)
Ancestry (Community Size)
AfghanAfricanAlbanianAlsatianAmericanApacheArabArgentineanArmenianAustralianAustrianBahamianBangladeshiBarbadianBasqueBelgianBelizeanBhutaneseBlackfeetBolivianBrazilianBritishBritish West IndianBulgarianBurmeseCambodianCanadianCape VerdeanCarpatho RusynCelticCentral AmericanCentral American IndianCherokeeChileanChippewaChoctawColombianCosta RicanCreeCreekCroatianCrowCubanCzechCzechoslovakianDanishDelawareDominicanDutchDutch West IndianEastern EuropeanEcuadorianEgyptianEnglishEstonianEthiopianEuropeanFilipinoFinnishFrenchFrench American IndianFrench CanadianGermanGerman RussianGhanaianGreekGuamanian / ChamorroGuatemalanGuyaneseHaitianHonduranHungarianIcelanderIndian (Asian)IndonesianInupiatIranianIraqiIrishIroquoisIsraeliItalianJamaicanJapaneseJordanianKenyanKoreanLaotianLatvianLebaneseLiberianLithuanianLumbeeLuxembourgerMacedonianMalaysianMalteseMexicanMexican American IndianMongolianMoroccanNative HawaiianNavajoNew ZealanderNicaraguanNigerianNorthern EuropeanNorwegianPakistaniPalestinianPanamanianParaguayanPennsylvania GermanPeruvianPolishPortuguesePuerto RicanRomanianRussianSalvadoranSamoanScandinavianScotch-IrishScottishSeminoleSenegaleseSerbianSierra LeoneanSiouxSlavicSlovakSloveneSomaliSouth AfricanSouth AmericanSouth American IndianSpaniardSpanishSri LankanSubsaharan AfricanSudaneseSwedishSwissSyrianThaiTrinidadian and TobagonianTurkishUgandanUkrainianUruguayanVenezuelanVietnameseWelshWest IndianYaquiYugoslavianZimbabwean
Ancestry (Percentage)
AfghanAfricanAlbanianAlsatianAmericanApacheArabArgentineanArmenianAustralianAustrianBahamianBangladeshiBarbadianBasqueBelgianBelizeanBhutaneseBlackfeetBolivianBrazilianBritishBritish West IndianBulgarianBurmeseCambodianCanadianCape VerdeanCarpatho RusynCelticCentral AmericanCentral American IndianCherokeeChileanChippewaChoctawColombianCosta RicanCreeCreekCroatianCrowCubanCzechCzechoslovakianDanishDelawareDominicanDutchDutch West IndianEastern EuropeanEcuadorianEgyptianEnglishEstonianEthiopianEuropeanFilipinoFinnishFrenchFrench American IndianFrench CanadianGermanGerman RussianGhanaianGreekGuamanian / ChamorroGuatemalanGuyaneseHaitianHonduranHungarianIcelanderIndian (Asian)IndonesianInupiatIranianIraqiIrishIroquoisIsraeliItalianJamaicanJapaneseJordanianKenyanKoreanLaotianLatvianLebaneseLiberianLithuanianLumbeeLuxembourgerMacedonianMalaysianMalteseMexicanMexican American IndianMongolianMoroccanNative HawaiianNavajoNew ZealanderNicaraguanNigerianNorthern EuropeanNorwegianPakistaniPalestinianPanamanianParaguayanPennsylvania GermanPeruvianPolishPortuguesePuerto RicanRomanianRussianSalvadoranSamoanScandinavianScotch-IrishScottishSeminoleSenegaleseSerbianSierra LeoneanSiouxSlavicSlovakSloveneSomaliSouth AfricanSouth AmericanSouth American IndianSpaniardSpanishSri LankanSubsaharan AfricanSudaneseSwedishSwissSyrianThaiTrinidadian and TobagonianTurkishUgandanUkrainianUruguayanVenezuelanVietnameseWelshWest IndianYaquiYugoslavianZimbabwean
Immigrant Origin (Total)
AfghanistanAfricaAlbaniaArgentinaArmeniaAsiaAustraliaBahamasBangladeshBarbadosBelarusBelgiumBelizeBosnia and HerzegovinaBrazilBulgariaBurma / MyanmarCambodiaCameroonCanadaCaribbeanCentral AmericaChileChinaColombiaCongoCosta RicaCubaCzechoslovakiaDominican RepublicEastern AfricaEastern AsiaEastern EuropeEcuadorEgyptEl SalvadorEnglandEritreaEthiopiaEuropeFranceGermanyGhanaGreeceGuatemalaGuyanaHaitiHondurasHong KongHungaryIndiaIndonesiaIranIraqIrelandIsraelItalyJamaicaJapanJordanKazakhstanKenyaKoreaKuwaitLaosLatin AmericaLatviaLebanonLiberiaLithuaniaMalaysiaMexicoMiddle AfricaMoroccoNepalNetherlandsNigeriaNorth MacedoniaNorthern AfricaNorthern EuropeOceaniaPakistanPanamaPeruPhilippinesPolandRomaniaRussiaSaudi ArabiaScotlandSenegalSerbiaSierra LeoneSingaporeSomaliaSouth AfricaSouth AmericaSouth Central AsiaSouth Eastern AsiaSouthern EuropeSpainSri LankaSudanSwitzerlandSyriaTaiwanThailandTrinidad and TobagoTurkeyUgandaUkraineUruguayUzbekistanVenezuelaVietnamWestern AfricaWestern AsiaWestern EuropeZaireZimbabwe
Immigrant Origin (Percentage)
AfghanistanAfricaAlbaniaArgentinaArmeniaAsiaAustraliaBahamasBangladeshBarbadosBelarusBelgiumBelizeBosnia and HerzegovinaBrazilBulgariaBurma / MyanmarCambodiaCameroonCanadaCaribbeanCentral AmericaChileChinaColombiaCongoCosta RicaCubaCzechoslovakiaDominican RepublicEastern AfricaEastern AsiaEastern EuropeEcuadorEgyptEl SalvadorEnglandEritreaEthiopiaEuropeFranceGermanyGhanaGreeceGuatemalaGuyanaHaitiHondurasHong KongHungaryIndiaIndonesiaIranIraqIrelandIsraelItalyJamaicaJapanJordanKazakhstanKenyaKoreaKuwaitLaosLatin AmericaLatviaLebanonLiberiaLithuaniaMalaysiaMexicoMiddle AfricaMoroccoNepalNetherlandsNigeriaNorth MacedoniaNorthern AfricaNorthern EuropeOceaniaPakistanPanamaPeruPhilippinesPolandRomaniaRussiaSaudi ArabiaScotlandSenegalSerbiaSierra LeoneSingaporeSomaliaSouth AfricaSouth AmericaSouth Central AsiaSouth Eastern AsiaSouthern EuropeSpainSri LankaSudanSwitzerlandSyriaTaiwanThailandTrinidad and TobagoTurkeyUgandaUkraineUruguayUzbekistanVenezuelaVietnamWestern AfricaWestern AsiaWestern EuropeZaireZimbabwe
Income
Income (Families)
Income (Households)
Poverty
Poverty (Families)
Unemployment
Employment Occupations
Employment Industries
Employer Class
Commute Time
Commute Means
School Enrollment
Education by Degree Field
Occupancy
Finances
Physical Characteristics
Columbus
Compare Zip Codes
Comparison Subject

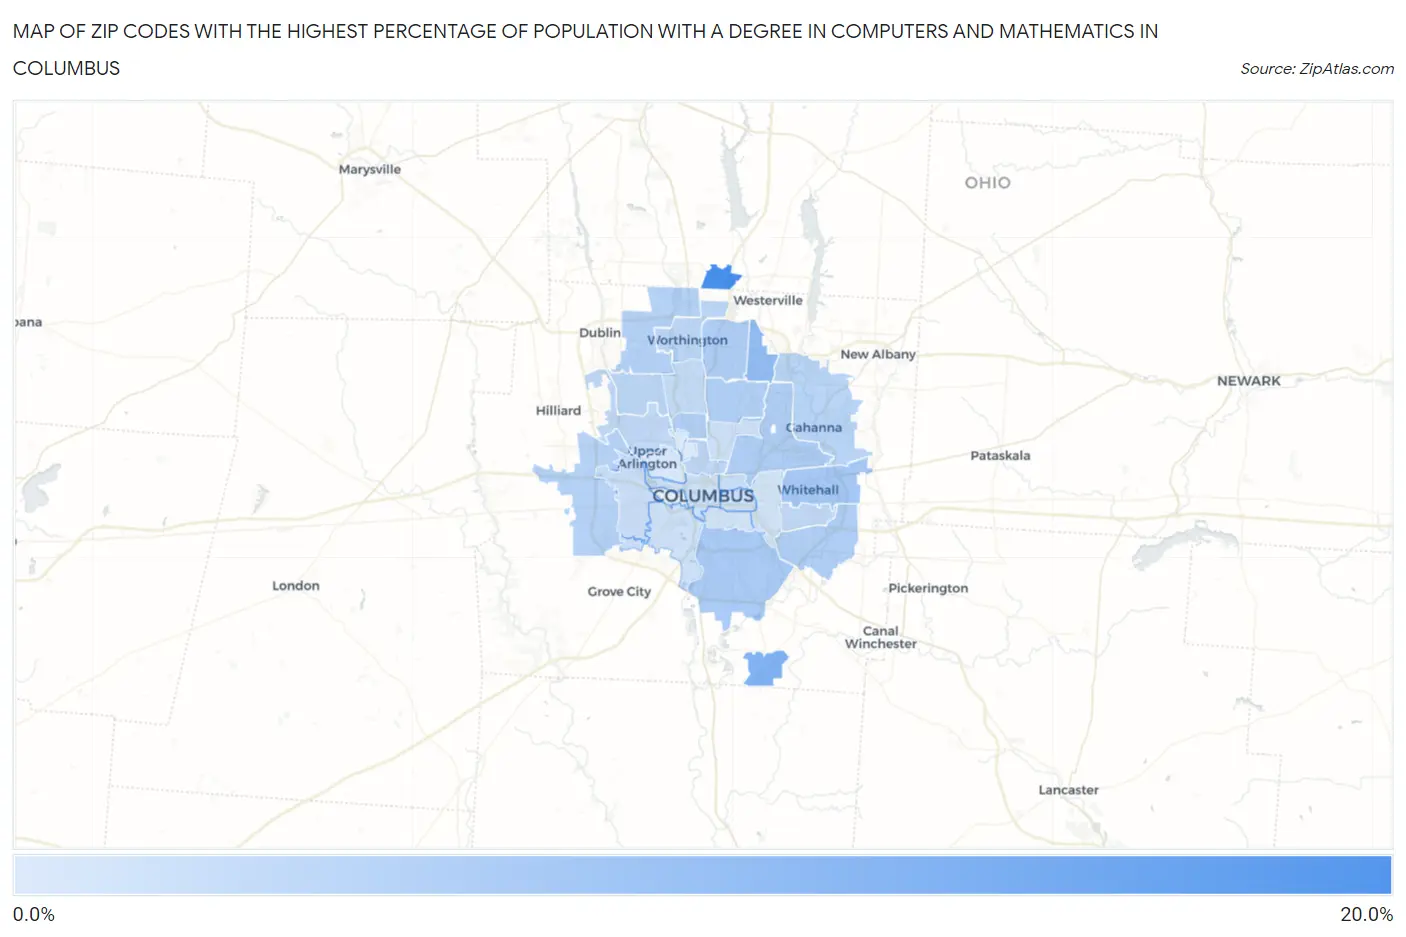
Map of Zip Codes with the Highest Percentage of Population with a Degree in Computers and Mathematics in Columbus

0.0%
20.0%
Zip Codes with the Highest Percentage of Population with a Degree in Computers and Mathematics in Columbus Map

Zip Codes with the Highest Percentage of Population with a Degree in Computers and Mathematics in Columbus, OH

Zip Code % Graduates vs State vs National
1.4324019.5%4.1%(+15.4)#154.9%(+14.6)#483
2.4321712.0%4.1%(+7.87)#424.9%(+7.11)#1,214
3.432319.9%4.1%(+5.75)#614.9%(+4.99)#1,799
4.432137.6%4.1%(+3.43)#1004.9%(+2.67)#3,282
5.432077.1%4.1%(+3.01)#1114.9%(+2.25)#3,700
6.432296.7%4.1%(+2.55)#1244.9%(+1.79)#4,219
7.432196.6%4.1%(+2.43)#1264.9%(+1.67)#4,374
8.432326.3%4.1%(+2.14)#1464.9%(+1.38)#4,808
9.432026.1%4.1%(+1.94)#1614.9%(+1.18)#5,161
10.432246.0%4.1%(+1.86)#1664.9%(+1.10)#5,314
11.432355.8%4.1%(+1.64)#1774.9%(+0.885)#5,710
12.432285.8%4.1%(+1.64)#1794.9%(+0.876)#5,730
13.432305.1%4.1%(+0.938)#2294.9%(+0.178)#7,274
14.432205.0%4.1%(+0.907)#2364.9%(+0.147)#7,356
15.430854.9%4.1%(+0.799)#2424.9%(+0.039)#7,612
16.432014.8%4.1%(+0.623)#2644.9%(-0.137)#8,114
17.432274.5%4.1%(+0.396)#2904.9%(-0.364)#8,780
18.432214.3%4.1%(+0.195)#3114.9%(-0.565)#9,442
19.432143.8%4.1%(-0.343)#3794.9%(-1.10)#11,223
20.432043.4%4.1%(-0.764)#4414.9%(-1.52)#12,758
21.432033.3%4.1%(-0.845)#4484.9%(-1.60)#13,053
22.432112.8%4.1%(-1.29)#4914.9%(-2.05)#14,631
23.432232.8%4.1%(-1.36)#4994.9%(-2.12)#14,888
24.432152.7%4.1%(-1.40)#5074.9%(-2.16)#15,038
25.432052.7%4.1%(-1.45)#5214.9%(-2.21)#15,215
26.432062.4%4.1%(-1.72)#5564.9%(-2.48)#16,231
27.432092.4%4.1%(-1.73)#5584.9%(-2.49)#16,266
28.432121.8%4.1%(-2.34)#6514.9%(-3.10)#18,258
29.432101.2%4.1%(-2.89)#7134.9%(-3.65)#19,885

Common Questions

What are the Top 10 Zip Codes with the Highest Percentage of Population with a Degree in Computers and Mathematics in Columbus, OH?
Top 10 Zip Codes with the Highest Percentage of Population with a Degree in Computers and Mathematics in Columbus, OH are:
#1
19.5%
#2
12.0%
#3
9.9%
#4
7.6%
#5
7.1%
#6
6.7%
#7
6.6%
#8
6.3%
#9
6.1%
#10
6.0%
What zip code has the Highest Percentage of Population with a Degree in Computers and Mathematics in Columbus, OH?
43240 has the Highest Percentage of Population with a Degree in Computers and Mathematics in Columbus, OH with 19.5%.
What is the Percentage of Population with a Degree in Computers and Mathematics in Columbus, OH?
Percentage of Population with a Degree in Computers and Mathematics in Columbus is 5.7%.
What is the Percentage of Population with a Degree in Computers and Mathematics in Ohio?
Percentage of Population with a Degree in Computers and Mathematics in Ohio is 4.1%.
What is the Percentage of Population with a Degree in Computers and Mathematics in the United States?
Percentage of Population with a Degree in Computers and Mathematics in the United States is 4.9%.