Zip Codes with the Highest Percentage of Population Employed in Health Diagnosing & Treating in Lima, OH
RELATED REPORTS & OPTIONS
Health Diagnosing & Treating
Lima
Compare Zip Codes
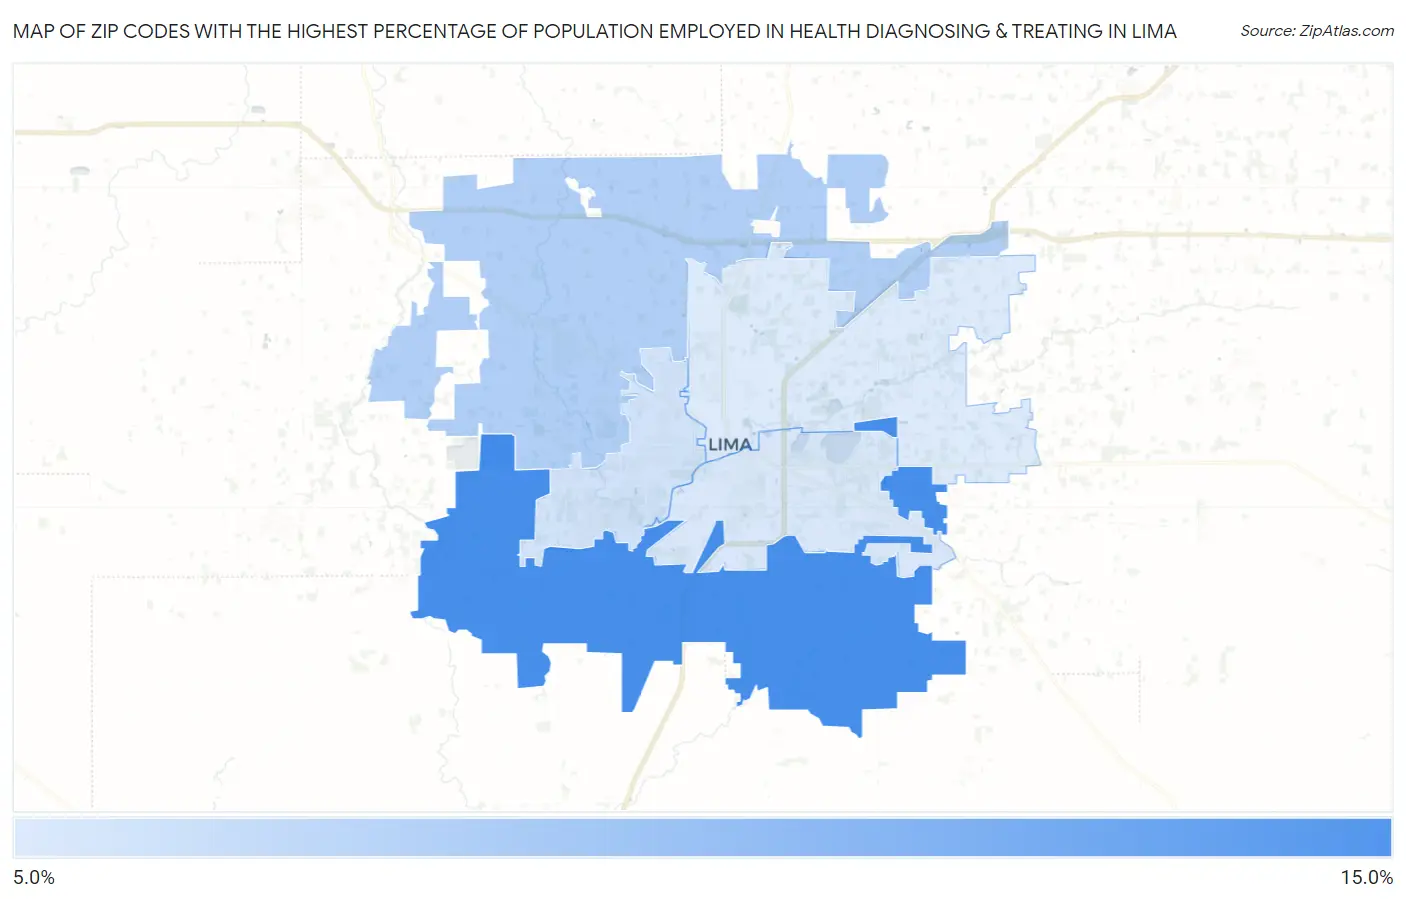
Map of Zip Codes with the Highest Percentage of Population Employed in Health Diagnosing & Treating in Lima
0.0%
15.0%
Zip Codes with the Highest Percentage of Population Employed in Health Diagnosing & Treating in Lima, OH
| Zip Code | % Employed | vs State | vs National | |
| 1. | 45806 | 12.1% | 7.2%(+5.00)#78 | 6.2%(+5.90)#2,139 |
| 2. | 45807 | 7.2% | 7.2%(+0.010)#446 | 6.2%(+0.916)#9,834 |
| 3. | 45805 | 5.7% | 7.2%(-1.50)#658 | 6.2%(-0.590)#15,153 |
| 4. | 45804 | 5.3% | 7.2%(-1.87)#706 | 6.2%(-0.962)#16,621 |
| 5. | 45801 | 5.1% | 7.2%(-2.03)#729 | 6.2%(-1.12)#17,252 |
1
Common Questions
What are the Top 3 Zip Codes with the Highest Percentage of Population Employed in Health Diagnosing & Treating in Lima, OH?
Top 3 Zip Codes with the Highest Percentage of Population Employed in Health Diagnosing & Treating in Lima, OH are:
What zip code has the Highest Percentage of Population Employed in Health Diagnosing & Treating in Lima, OH?
45806 has the Highest Percentage of Population Employed in Health Diagnosing & Treating in Lima, OH with 12.1%.
What is the Percentage of Population Employed in Health Diagnosing & Treating in Lima, OH?
Percentage of Population Employed in Health Diagnosing & Treating in Lima is 3.8%.
What is the Percentage of Population Employed in Health Diagnosing & Treating in Ohio?
Percentage of Population Employed in Health Diagnosing & Treating in Ohio is 7.2%.
What is the Percentage of Population Employed in Health Diagnosing & Treating in the United States?
Percentage of Population Employed in Health Diagnosing & Treating in the United States is 6.2%.