Zip Codes with the Most Immigrants from Eastern Europe in Columbus, OH

RELATED REPORTS & OPTIONS

Eastern Europe
Population
Families and Households
Female Fertility
Female Fertility (Unmarried)
Race (Community Size)
Race (Percentage)
Ancestry (Community Size)
AfghanAfricanAlbanianAlsatianAmericanApacheArabArgentineanArmenianAustralianAustrianBahamianBangladeshiBarbadianBasqueBelgianBelizeanBhutaneseBlackfeetBolivianBrazilianBritishBritish West IndianBulgarianBurmeseCambodianCanadianCape VerdeanCarpatho RusynCelticCentral AmericanCentral American IndianCherokeeChileanChippewaChoctawColombianCosta RicanCreeCreekCroatianCrowCubanCzechCzechoslovakianDanishDelawareDominicanDutchDutch West IndianEastern EuropeanEcuadorianEgyptianEnglishEstonianEthiopianEuropeanFilipinoFinnishFrenchFrench American IndianFrench CanadianGermanGerman RussianGhanaianGreekGuamanian / ChamorroGuatemalanGuyaneseHaitianHonduranHungarianIcelanderIndian (Asian)IndonesianInupiatIranianIraqiIrishIroquoisIsraeliItalianJamaicanJapaneseJordanianKenyanKoreanLaotianLatvianLebaneseLiberianLithuanianLumbeeLuxembourgerMacedonianMalaysianMalteseMexicanMexican American IndianMongolianMoroccanNative HawaiianNavajoNew ZealanderNicaraguanNigerianNorthern EuropeanNorwegianPakistaniPalestinianPanamanianParaguayanPennsylvania GermanPeruvianPolishPortuguesePuerto RicanRomanianRussianSalvadoranSamoanScandinavianScotch-IrishScottishSeminoleSenegaleseSerbianSierra LeoneanSiouxSlavicSlovakSloveneSomaliSouth AfricanSouth AmericanSouth American IndianSpaniardSpanishSri LankanSubsaharan AfricanSudaneseSwedishSwissSyrianThaiTrinidadian and TobagonianTurkishUgandanUkrainianUruguayanVenezuelanVietnameseWelshWest IndianYaquiYugoslavianZimbabwean
Ancestry (Percentage)
AfghanAfricanAlbanianAlsatianAmericanApacheArabArgentineanArmenianAustralianAustrianBahamianBangladeshiBarbadianBasqueBelgianBelizeanBhutaneseBlackfeetBolivianBrazilianBritishBritish West IndianBulgarianBurmeseCambodianCanadianCape VerdeanCarpatho RusynCelticCentral AmericanCentral American IndianCherokeeChileanChippewaChoctawColombianCosta RicanCreeCreekCroatianCrowCubanCzechCzechoslovakianDanishDelawareDominicanDutchDutch West IndianEastern EuropeanEcuadorianEgyptianEnglishEstonianEthiopianEuropeanFilipinoFinnishFrenchFrench American IndianFrench CanadianGermanGerman RussianGhanaianGreekGuamanian / ChamorroGuatemalanGuyaneseHaitianHonduranHungarianIcelanderIndian (Asian)IndonesianInupiatIranianIraqiIrishIroquoisIsraeliItalianJamaicanJapaneseJordanianKenyanKoreanLaotianLatvianLebaneseLiberianLithuanianLumbeeLuxembourgerMacedonianMalaysianMalteseMexicanMexican American IndianMongolianMoroccanNative HawaiianNavajoNew ZealanderNicaraguanNigerianNorthern EuropeanNorwegianPakistaniPalestinianPanamanianParaguayanPennsylvania GermanPeruvianPolishPortuguesePuerto RicanRomanianRussianSalvadoranSamoanScandinavianScotch-IrishScottishSeminoleSenegaleseSerbianSierra LeoneanSiouxSlavicSlovakSloveneSomaliSouth AfricanSouth AmericanSouth American IndianSpaniardSpanishSri LankanSubsaharan AfricanSudaneseSwedishSwissSyrianThaiTrinidadian and TobagonianTurkishUgandanUkrainianUruguayanVenezuelanVietnameseWelshWest IndianYaquiYugoslavianZimbabwean
Immigrant Origin (Total)
AfghanistanAfricaAlbaniaArgentinaArmeniaAsiaAustraliaBahamasBangladeshBarbadosBelarusBelgiumBelizeBosnia and HerzegovinaBrazilBulgariaBurma / MyanmarCambodiaCameroonCanadaCaribbeanCentral AmericaChileChinaColombiaCongoCosta RicaCubaCzechoslovakiaDominican RepublicEastern AfricaEastern AsiaEastern EuropeEcuadorEgyptEl SalvadorEnglandEritreaEthiopiaEuropeFranceGermanyGhanaGreeceGuatemalaGuyanaHaitiHondurasHong KongHungaryIndiaIndonesiaIranIraqIrelandIsraelItalyJamaicaJapanJordanKazakhstanKenyaKoreaKuwaitLaosLatin AmericaLatviaLebanonLiberiaLithuaniaMalaysiaMexicoMiddle AfricaMoroccoNepalNetherlandsNigeriaNorth MacedoniaNorthern AfricaNorthern EuropeOceaniaPakistanPanamaPeruPhilippinesPolandRomaniaRussiaSaudi ArabiaScotlandSenegalSerbiaSierra LeoneSingaporeSomaliaSouth AfricaSouth AmericaSouth Central AsiaSouth Eastern AsiaSouthern EuropeSpainSri LankaSudanSwitzerlandSyriaTaiwanThailandTrinidad and TobagoTurkeyUgandaUkraineUruguayUzbekistanVenezuelaVietnamWestern AfricaWestern AsiaWestern EuropeZaireZimbabwe
Immigrant Origin (Percentage)
AfghanistanAfricaAlbaniaArgentinaArmeniaAsiaAustraliaBahamasBangladeshBarbadosBelarusBelgiumBelizeBosnia and HerzegovinaBrazilBulgariaBurma / MyanmarCambodiaCameroonCanadaCaribbeanCentral AmericaChileChinaColombiaCongoCosta RicaCubaCzechoslovakiaDominican RepublicEastern AfricaEastern AsiaEastern EuropeEcuadorEgyptEl SalvadorEnglandEritreaEthiopiaEuropeFranceGermanyGhanaGreeceGuatemalaGuyanaHaitiHondurasHong KongHungaryIndiaIndonesiaIranIraqIrelandIsraelItalyJamaicaJapanJordanKazakhstanKenyaKoreaKuwaitLaosLatin AmericaLatviaLebanonLiberiaLithuaniaMalaysiaMexicoMiddle AfricaMoroccoNepalNetherlandsNigeriaNorth MacedoniaNorthern AfricaNorthern EuropeOceaniaPakistanPanamaPeruPhilippinesPolandRomaniaRussiaSaudi ArabiaScotlandSenegalSerbiaSierra LeoneSingaporeSomaliaSouth AfricaSouth AmericaSouth Central AsiaSouth Eastern AsiaSouthern EuropeSpainSri LankaSudanSwitzerlandSyriaTaiwanThailandTrinidad and TobagoTurkeyUgandaUkraineUruguayUzbekistanVenezuelaVietnamWestern AfricaWestern AsiaWestern EuropeZaireZimbabwe
Income
Income (Families)
Income (Households)
Poverty
Poverty (Families)
Unemployment
Employment Occupations
Employment Industries
Employer Class
Commute Time
Commute Means
School Enrollment
Education by Degree Field
Occupancy
Finances
Physical Characteristics
Columbus
Compare Zip Codes
Comparison Subject

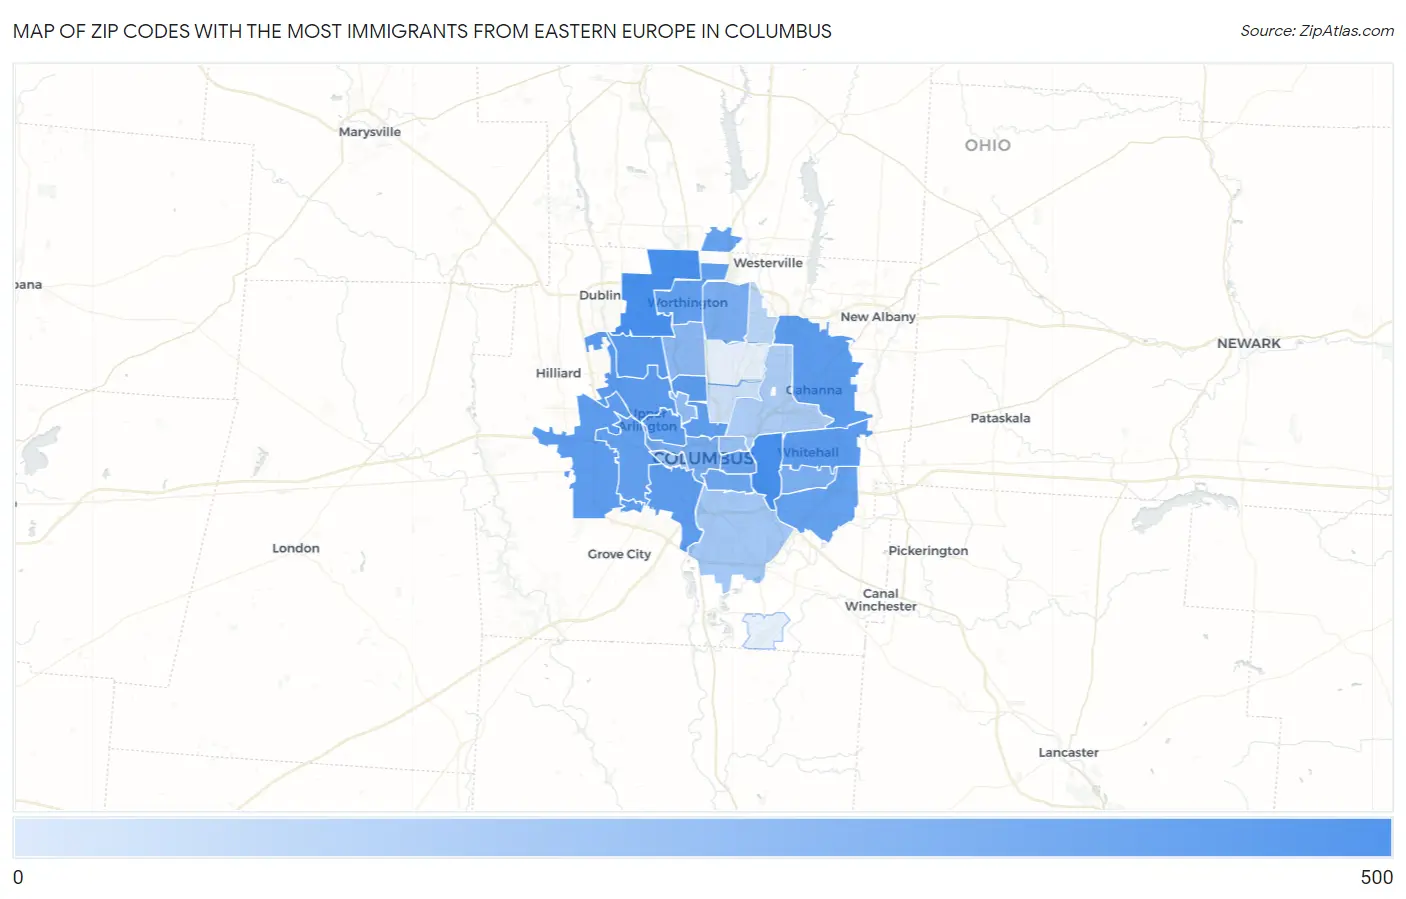
Map of Zip Codes with the Most Immigrants from Eastern Europe in Columbus

0
500
Zip Codes with the Most Immigrants from Eastern Europe in Columbus Map

Zip Codes with the Most Immigrants from Eastern Europe in Columbus, OH

Zip Code Eastern Europe vs State vs National
1.4320943852,367(0.84%)#252,208,794(0.02%)#1,152
2.4323542352,367(0.81%)#272,208,794(0.02%)#1,201
3.4322022452,367(0.43%)#532,208,794(0.01%)#2,418
4.4321321352,367(0.41%)#592,208,794(0.01%)#2,535
5.4322120052,367(0.38%)#652,208,794(0.01%)#2,689
6.4323018352,367(0.35%)#702,208,794(0.01%)#2,887
7.4320218052,367(0.34%)#732,208,794(0.01%)#2,938
8.4322317852,367(0.34%)#742,208,794(0.01%)#2,963
9.4321216852,367(0.32%)#762,208,794(0.01%)#3,091
10.4322816552,367(0.32%)#782,208,794(0.01%)#3,133
11.4320115952,367(0.30%)#812,208,794(0.01%)#3,237
12.4308514252,367(0.27%)#972,208,794(0.01%)#3,519
13.4320414052,367(0.27%)#982,208,794(0.01%)#3,556
14.4323213552,367(0.26%)#1042,208,794(0.01%)#3,648
15.4324012852,367(0.24%)#1092,208,794(0.01%)#3,809
16.4320510052,367(0.19%)#1322,208,794(0.00%)#4,455
17.432068952,367(0.17%)#1462,208,794(0.00%)#4,755
18.432156352,367(0.12%)#1732,208,794(0.00%)#5,634
19.432295452,367(0.10%)#1832,208,794(0.00%)#6,019
20.432275052,367(0.10%)#1922,208,794(0.00%)#6,232
21.432142852,367(0.05%)#2472,208,794(0.00%)#7,678
22.432102252,367(0.04%)#2772,208,794(0.00%)#8,311
23.432031552,367(0.03%)#3152,208,794(0.00%)#9,281
24.432221552,367(0.03%)#3172,208,794(0.00%)#9,320
25.43207952,367(0.02%)#3612,208,794(0.00%)#10,366
26.43219652,367(0.01%)#3912,208,794(0.00%)#11,094
27.43231352,367(0.01%)#4252,208,794(0.00%)#11,963
28.43211152,367(0.00%)#4452,208,794(0.00%)#12,643

Common Questions

What are the Top 10 Zip Codes with the Most Immigrants from Eastern Europe in Columbus, OH?
Top 10 Zip Codes with the Most Immigrants from Eastern Europe in Columbus, OH are:
#1
438
#2
423
#3
224
#4
213
#5
200
#6
183
#7
180
#8
178
#9
168
#10
165
What zip code has the Most Immigrants from Eastern Europe in Columbus, OH?
43209 has the Most Immigrants from Eastern Europe in Columbus, OH with 438.
What is the Total Immigrants from Eastern Europe in Columbus, OH?
Total Immigrants from Eastern Europe in Columbus is 4,167.
What is the Total Immigrants from Eastern Europe in Ohio?
Total Immigrants from Eastern Europe in Ohio is 52,367.
What is the Total Immigrants from Eastern Europe in the United States?
Total Immigrants from Eastern Europe in the United States is 2,208,794.