Zip Codes with the Highest Percentage of Population with a Degree in Arts and Humanities in Columbus, OH

RELATED REPORTS & OPTIONS

Arts and Humanities
Population
Families and Households
Female Fertility
Female Fertility (Unmarried)
Race (Community Size)
Race (Percentage)
Ancestry (Community Size)
AfghanAfricanAlbanianAlsatianAmericanApacheArabArgentineanArmenianAustralianAustrianBahamianBangladeshiBarbadianBasqueBelgianBelizeanBhutaneseBlackfeetBolivianBrazilianBritishBritish West IndianBulgarianBurmeseCambodianCanadianCape VerdeanCarpatho RusynCelticCentral AmericanCentral American IndianCherokeeChileanChippewaChoctawColombianCosta RicanCreeCreekCroatianCrowCubanCzechCzechoslovakianDanishDelawareDominicanDutchDutch West IndianEastern EuropeanEcuadorianEgyptianEnglishEstonianEthiopianEuropeanFilipinoFinnishFrenchFrench American IndianFrench CanadianGermanGerman RussianGhanaianGreekGuamanian / ChamorroGuatemalanGuyaneseHaitianHonduranHungarianIcelanderIndian (Asian)IndonesianInupiatIranianIraqiIrishIroquoisIsraeliItalianJamaicanJapaneseJordanianKenyanKoreanLaotianLatvianLebaneseLiberianLithuanianLumbeeLuxembourgerMacedonianMalaysianMalteseMexicanMexican American IndianMongolianMoroccanNative HawaiianNavajoNew ZealanderNicaraguanNigerianNorthern EuropeanNorwegianPakistaniPalestinianPanamanianParaguayanPennsylvania GermanPeruvianPolishPortuguesePuerto RicanRomanianRussianSalvadoranSamoanScandinavianScotch-IrishScottishSeminoleSenegaleseSerbianSierra LeoneanSiouxSlavicSlovakSloveneSomaliSouth AfricanSouth AmericanSouth American IndianSpaniardSpanishSri LankanSubsaharan AfricanSudaneseSwedishSwissSyrianThaiTrinidadian and TobagonianTurkishUgandanUkrainianUruguayanVenezuelanVietnameseWelshWest IndianYaquiYugoslavianZimbabwean
Ancestry (Percentage)
AfghanAfricanAlbanianAlsatianAmericanApacheArabArgentineanArmenianAustralianAustrianBahamianBangladeshiBarbadianBasqueBelgianBelizeanBhutaneseBlackfeetBolivianBrazilianBritishBritish West IndianBulgarianBurmeseCambodianCanadianCape VerdeanCarpatho RusynCelticCentral AmericanCentral American IndianCherokeeChileanChippewaChoctawColombianCosta RicanCreeCreekCroatianCrowCubanCzechCzechoslovakianDanishDelawareDominicanDutchDutch West IndianEastern EuropeanEcuadorianEgyptianEnglishEstonianEthiopianEuropeanFilipinoFinnishFrenchFrench American IndianFrench CanadianGermanGerman RussianGhanaianGreekGuamanian / ChamorroGuatemalanGuyaneseHaitianHonduranHungarianIcelanderIndian (Asian)IndonesianInupiatIranianIraqiIrishIroquoisIsraeliItalianJamaicanJapaneseJordanianKenyanKoreanLaotianLatvianLebaneseLiberianLithuanianLumbeeLuxembourgerMacedonianMalaysianMalteseMexicanMexican American IndianMongolianMoroccanNative HawaiianNavajoNew ZealanderNicaraguanNigerianNorthern EuropeanNorwegianPakistaniPalestinianPanamanianParaguayanPennsylvania GermanPeruvianPolishPortuguesePuerto RicanRomanianRussianSalvadoranSamoanScandinavianScotch-IrishScottishSeminoleSenegaleseSerbianSierra LeoneanSiouxSlavicSlovakSloveneSomaliSouth AfricanSouth AmericanSouth American IndianSpaniardSpanishSri LankanSubsaharan AfricanSudaneseSwedishSwissSyrianThaiTrinidadian and TobagonianTurkishUgandanUkrainianUruguayanVenezuelanVietnameseWelshWest IndianYaquiYugoslavianZimbabwean
Immigrant Origin (Total)
AfghanistanAfricaAlbaniaArgentinaArmeniaAsiaAustraliaBahamasBangladeshBarbadosBelarusBelgiumBelizeBosnia and HerzegovinaBrazilBulgariaBurma / MyanmarCambodiaCameroonCanadaCaribbeanCentral AmericaChileChinaColombiaCongoCosta RicaCubaCzechoslovakiaDominican RepublicEastern AfricaEastern AsiaEastern EuropeEcuadorEgyptEl SalvadorEnglandEritreaEthiopiaEuropeFranceGermanyGhanaGreeceGuatemalaGuyanaHaitiHondurasHong KongHungaryIndiaIndonesiaIranIraqIrelandIsraelItalyJamaicaJapanJordanKazakhstanKenyaKoreaKuwaitLaosLatin AmericaLatviaLebanonLiberiaLithuaniaMalaysiaMexicoMiddle AfricaMoroccoNepalNetherlandsNigeriaNorth MacedoniaNorthern AfricaNorthern EuropeOceaniaPakistanPanamaPeruPhilippinesPolandRomaniaRussiaSaudi ArabiaScotlandSenegalSerbiaSierra LeoneSingaporeSomaliaSouth AfricaSouth AmericaSouth Central AsiaSouth Eastern AsiaSouthern EuropeSpainSri LankaSudanSwitzerlandSyriaTaiwanThailandTrinidad and TobagoTurkeyUgandaUkraineUruguayUzbekistanVenezuelaVietnamWestern AfricaWestern AsiaWestern EuropeZaireZimbabwe
Immigrant Origin (Percentage)
AfghanistanAfricaAlbaniaArgentinaArmeniaAsiaAustraliaBahamasBangladeshBarbadosBelarusBelgiumBelizeBosnia and HerzegovinaBrazilBulgariaBurma / MyanmarCambodiaCameroonCanadaCaribbeanCentral AmericaChileChinaColombiaCongoCosta RicaCubaCzechoslovakiaDominican RepublicEastern AfricaEastern AsiaEastern EuropeEcuadorEgyptEl SalvadorEnglandEritreaEthiopiaEuropeFranceGermanyGhanaGreeceGuatemalaGuyanaHaitiHondurasHong KongHungaryIndiaIndonesiaIranIraqIrelandIsraelItalyJamaicaJapanJordanKazakhstanKenyaKoreaKuwaitLaosLatin AmericaLatviaLebanonLiberiaLithuaniaMalaysiaMexicoMiddle AfricaMoroccoNepalNetherlandsNigeriaNorth MacedoniaNorthern AfricaNorthern EuropeOceaniaPakistanPanamaPeruPhilippinesPolandRomaniaRussiaSaudi ArabiaScotlandSenegalSerbiaSierra LeoneSingaporeSomaliaSouth AfricaSouth AmericaSouth Central AsiaSouth Eastern AsiaSouthern EuropeSpainSri LankaSudanSwitzerlandSyriaTaiwanThailandTrinidad and TobagoTurkeyUgandaUkraineUruguayUzbekistanVenezuelaVietnamWestern AfricaWestern AsiaWestern EuropeZaireZimbabwe
Income
Income (Families)
Income (Households)
Poverty
Poverty (Families)
Unemployment
Employment Occupations
Employment Industries
Employer Class
Commute Time
Commute Means
School Enrollment
Education by Degree Field
Occupancy
Finances
Physical Characteristics
Columbus
Compare Zip Codes
Comparison Subject

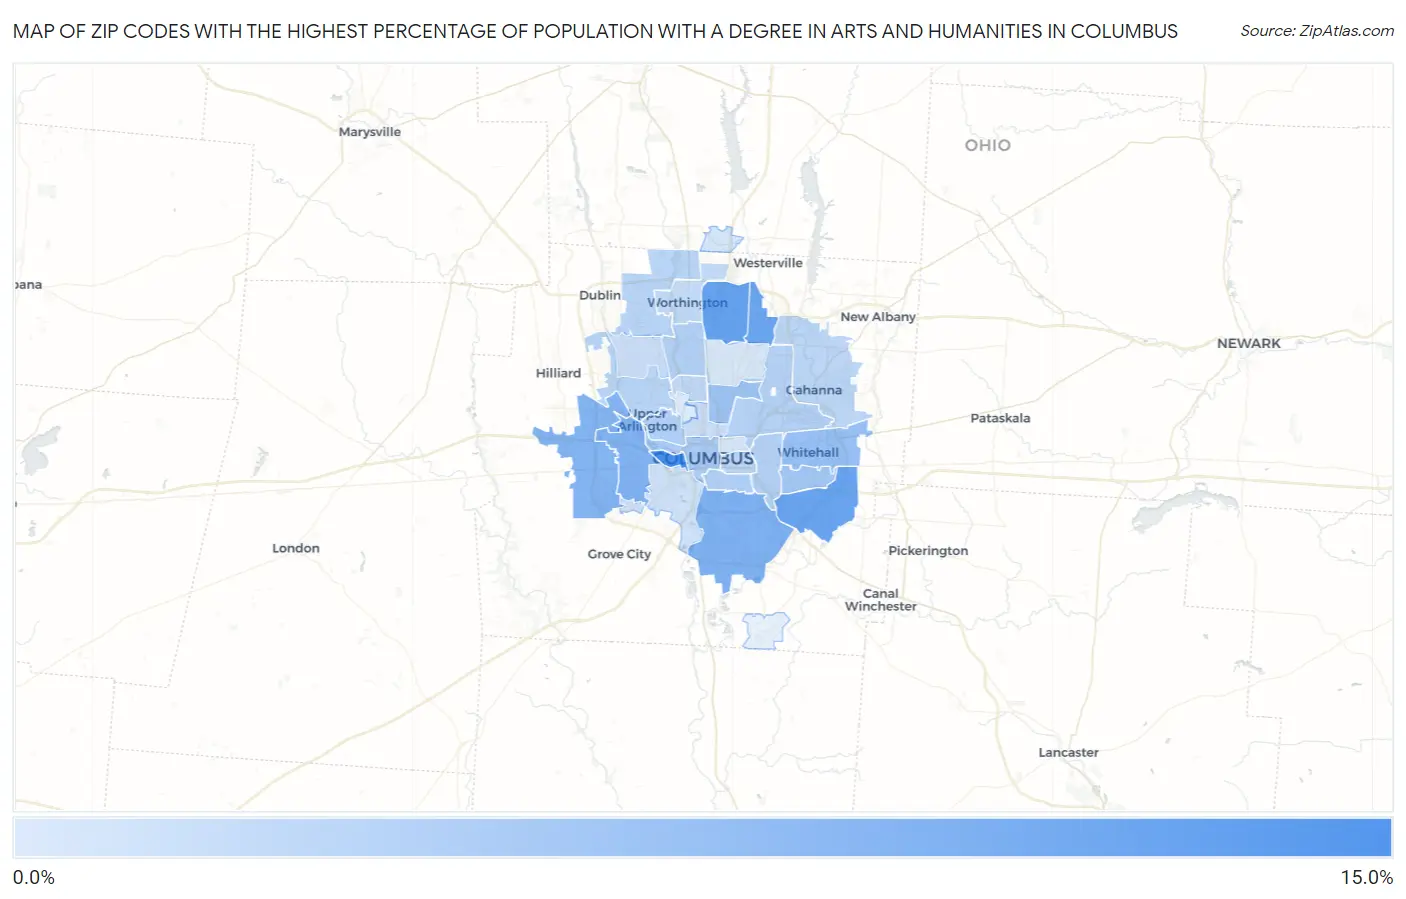
Map of Zip Codes with the Highest Percentage of Population with a Degree in Arts and Humanities in Columbus

0.0%
15.0%
Zip Codes with the Highest Percentage of Population with a Degree in Arts and Humanities in Columbus Map

Zip Codes with the Highest Percentage of Population with a Degree in Arts and Humanities in Columbus, OH

Zip Code % Graduates vs State vs National
1.4322212.4%5.8%(+6.65)#1516.0%(+6.44)#4,023
2.4322910.5%5.8%(+4.70)#1936.0%(+4.49)#5,662
3.4323210.2%5.8%(+4.42)#2076.0%(+4.21)#5,979
4.432319.9%5.8%(+4.16)#2176.0%(+3.95)#6,327
5.432078.9%5.8%(+3.10)#2696.0%(+2.89)#7,938
6.432048.6%5.8%(+2.83)#2896.0%(+2.62)#8,406
7.432288.5%5.8%(+2.68)#2966.0%(+2.47)#8,715
8.432137.3%5.8%(+1.47)#3886.0%(+1.26)#11,327
9.432116.8%5.8%(+1.04)#4276.0%(+0.832)#12,415
10.432276.5%5.8%(+0.708)#4586.0%(+0.497)#13,285
11.432156.1%5.8%(+0.316)#4966.0%(+0.105)#14,393
12.432125.6%5.8%(-0.215)#5566.0%(-0.426)#15,925
13.432065.4%5.8%(-0.338)#5736.0%(-0.549)#16,276
14.432145.4%5.8%(-0.370)#5776.0%(-0.581)#16,365
15.432095.3%5.8%(-0.480)#5936.0%(-0.691)#16,691
16.432195.3%5.8%(-0.520)#6026.0%(-0.731)#16,814
17.432355.1%5.8%(-0.718)#6236.0%(-0.929)#17,395
18.432215.0%5.8%(-0.794)#6326.0%(-1.00)#17,636
19.432304.9%5.8%(-0.853)#6396.0%(-1.06)#17,809
20.432054.9%5.8%(-0.925)#6456.0%(-1.14)#18,009
21.432024.6%5.8%(-1.21)#6816.0%(-1.42)#18,804
22.430854.5%5.8%(-1.33)#6956.0%(-1.54)#19,121
23.432204.1%5.8%(-1.69)#7306.0%(-1.90)#20,069
24.432014.0%5.8%(-1.78)#7376.0%(-1.99)#20,328
25.432233.7%5.8%(-2.07)#7596.0%(-2.28)#21,063
26.432403.4%5.8%(-2.34)#7876.0%(-2.56)#21,737
27.432033.3%5.8%(-2.50)#7976.0%(-2.71)#22,080
28.432243.2%5.8%(-2.55)#8076.0%(-2.76)#22,181
29.432102.9%5.8%(-2.88)#8366.0%(-3.09)#22,855

Common Questions

What are the Top 10 Zip Codes with the Highest Percentage of Population with a Degree in Arts and Humanities in Columbus, OH?
Top 10 Zip Codes with the Highest Percentage of Population with a Degree in Arts and Humanities in Columbus, OH are:
#1
12.4%
#2
10.5%
#3
10.2%
#4
9.9%
#5
8.9%
#6
8.6%
#7
8.5%
#8
7.3%
#9
6.8%
#10
6.5%
What zip code has the Highest Percentage of Population with a Degree in Arts and Humanities in Columbus, OH?
43222 has the Highest Percentage of Population with a Degree in Arts and Humanities in Columbus, OH with 12.4%.
What is the Percentage of Population with a Degree in Arts and Humanities in Columbus, OH?
Percentage of Population with a Degree in Arts and Humanities in Columbus is 6.2%.
What is the Percentage of Population with a Degree in Arts and Humanities in Ohio?
Percentage of Population with a Degree in Arts and Humanities in Ohio is 5.8%.
What is the Percentage of Population with a Degree in Arts and Humanities in the United States?
Percentage of Population with a Degree in Arts and Humanities in the United States is 6.0%.