Zip Codes with the Highest Percentage of Population Employed in Accommodation & Food Services in Columbus, OH

RELATED REPORTS & OPTIONS

Accommodation & Food Services
Population
Families and Households
Female Fertility
Female Fertility (Unmarried)
Race (Community Size)
Race (Percentage)
Ancestry (Community Size)
AfghanAfricanAlbanianAlsatianAmericanApacheArabArgentineanArmenianAustralianAustrianBahamianBangladeshiBarbadianBasqueBelgianBelizeanBhutaneseBlackfeetBolivianBrazilianBritishBritish West IndianBulgarianBurmeseCambodianCanadianCape VerdeanCarpatho RusynCelticCentral AmericanCentral American IndianCherokeeChileanChippewaChoctawColombianCosta RicanCreeCreekCroatianCrowCubanCzechCzechoslovakianDanishDelawareDominicanDutchDutch West IndianEastern EuropeanEcuadorianEgyptianEnglishEstonianEthiopianEuropeanFilipinoFinnishFrenchFrench American IndianFrench CanadianGermanGerman RussianGhanaianGreekGuamanian / ChamorroGuatemalanGuyaneseHaitianHonduranHungarianIcelanderIndian (Asian)IndonesianInupiatIranianIraqiIrishIroquoisIsraeliItalianJamaicanJapaneseJordanianKenyanKoreanLaotianLatvianLebaneseLiberianLithuanianLumbeeLuxembourgerMacedonianMalaysianMalteseMexicanMexican American IndianMongolianMoroccanNative HawaiianNavajoNew ZealanderNicaraguanNigerianNorthern EuropeanNorwegianPakistaniPalestinianPanamanianParaguayanPennsylvania GermanPeruvianPolishPortuguesePuerto RicanRomanianRussianSalvadoranSamoanScandinavianScotch-IrishScottishSeminoleSenegaleseSerbianSierra LeoneanSiouxSlavicSlovakSloveneSomaliSouth AfricanSouth AmericanSouth American IndianSpaniardSpanishSri LankanSubsaharan AfricanSudaneseSwedishSwissSyrianThaiTrinidadian and TobagonianTurkishUgandanUkrainianUruguayanVenezuelanVietnameseWelshWest IndianYaquiYugoslavianZimbabwean
Ancestry (Percentage)
AfghanAfricanAlbanianAlsatianAmericanApacheArabArgentineanArmenianAustralianAustrianBahamianBangladeshiBarbadianBasqueBelgianBelizeanBhutaneseBlackfeetBolivianBrazilianBritishBritish West IndianBulgarianBurmeseCambodianCanadianCape VerdeanCarpatho RusynCelticCentral AmericanCentral American IndianCherokeeChileanChippewaChoctawColombianCosta RicanCreeCreekCroatianCrowCubanCzechCzechoslovakianDanishDelawareDominicanDutchDutch West IndianEastern EuropeanEcuadorianEgyptianEnglishEstonianEthiopianEuropeanFilipinoFinnishFrenchFrench American IndianFrench CanadianGermanGerman RussianGhanaianGreekGuamanian / ChamorroGuatemalanGuyaneseHaitianHonduranHungarianIcelanderIndian (Asian)IndonesianInupiatIranianIraqiIrishIroquoisIsraeliItalianJamaicanJapaneseJordanianKenyanKoreanLaotianLatvianLebaneseLiberianLithuanianLumbeeLuxembourgerMacedonianMalaysianMalteseMexicanMexican American IndianMongolianMoroccanNative HawaiianNavajoNew ZealanderNicaraguanNigerianNorthern EuropeanNorwegianPakistaniPalestinianPanamanianParaguayanPennsylvania GermanPeruvianPolishPortuguesePuerto RicanRomanianRussianSalvadoranSamoanScandinavianScotch-IrishScottishSeminoleSenegaleseSerbianSierra LeoneanSiouxSlavicSlovakSloveneSomaliSouth AfricanSouth AmericanSouth American IndianSpaniardSpanishSri LankanSubsaharan AfricanSudaneseSwedishSwissSyrianThaiTrinidadian and TobagonianTurkishUgandanUkrainianUruguayanVenezuelanVietnameseWelshWest IndianYaquiYugoslavianZimbabwean
Immigrant Origin (Total)
AfghanistanAfricaAlbaniaArgentinaArmeniaAsiaAustraliaBahamasBangladeshBarbadosBelarusBelgiumBelizeBosnia and HerzegovinaBrazilBulgariaBurma / MyanmarCambodiaCameroonCanadaCaribbeanCentral AmericaChileChinaColombiaCongoCosta RicaCubaCzechoslovakiaDominican RepublicEastern AfricaEastern AsiaEastern EuropeEcuadorEgyptEl SalvadorEnglandEritreaEthiopiaEuropeFranceGermanyGhanaGreeceGuatemalaGuyanaHaitiHondurasHong KongHungaryIndiaIndonesiaIranIraqIrelandIsraelItalyJamaicaJapanJordanKazakhstanKenyaKoreaKuwaitLaosLatin AmericaLatviaLebanonLiberiaLithuaniaMalaysiaMexicoMiddle AfricaMoroccoNepalNetherlandsNigeriaNorth MacedoniaNorthern AfricaNorthern EuropeOceaniaPakistanPanamaPeruPhilippinesPolandRomaniaRussiaSaudi ArabiaScotlandSenegalSerbiaSierra LeoneSingaporeSomaliaSouth AfricaSouth AmericaSouth Central AsiaSouth Eastern AsiaSouthern EuropeSpainSri LankaSudanSwitzerlandSyriaTaiwanThailandTrinidad and TobagoTurkeyUgandaUkraineUruguayUzbekistanVenezuelaVietnamWestern AfricaWestern AsiaWestern EuropeZaireZimbabwe
Immigrant Origin (Percentage)
AfghanistanAfricaAlbaniaArgentinaArmeniaAsiaAustraliaBahamasBangladeshBarbadosBelarusBelgiumBelizeBosnia and HerzegovinaBrazilBulgariaBurma / MyanmarCambodiaCameroonCanadaCaribbeanCentral AmericaChileChinaColombiaCongoCosta RicaCubaCzechoslovakiaDominican RepublicEastern AfricaEastern AsiaEastern EuropeEcuadorEgyptEl SalvadorEnglandEritreaEthiopiaEuropeFranceGermanyGhanaGreeceGuatemalaGuyanaHaitiHondurasHong KongHungaryIndiaIndonesiaIranIraqIrelandIsraelItalyJamaicaJapanJordanKazakhstanKenyaKoreaKuwaitLaosLatin AmericaLatviaLebanonLiberiaLithuaniaMalaysiaMexicoMiddle AfricaMoroccoNepalNetherlandsNigeriaNorth MacedoniaNorthern AfricaNorthern EuropeOceaniaPakistanPanamaPeruPhilippinesPolandRomaniaRussiaSaudi ArabiaScotlandSenegalSerbiaSierra LeoneSingaporeSomaliaSouth AfricaSouth AmericaSouth Central AsiaSouth Eastern AsiaSouthern EuropeSpainSri LankaSudanSwitzerlandSyriaTaiwanThailandTrinidad and TobagoTurkeyUgandaUkraineUruguayUzbekistanVenezuelaVietnamWestern AfricaWestern AsiaWestern EuropeZaireZimbabwe
Income
Income (Families)
Income (Households)
Poverty
Poverty (Families)
Unemployment
Employment Occupations
Employment Industries
Employer Class
Commute Time
Commute Means
School Enrollment
Education by Degree Field
Occupancy
Finances
Physical Characteristics
Columbus
Compare Zip Codes
Comparison Subject

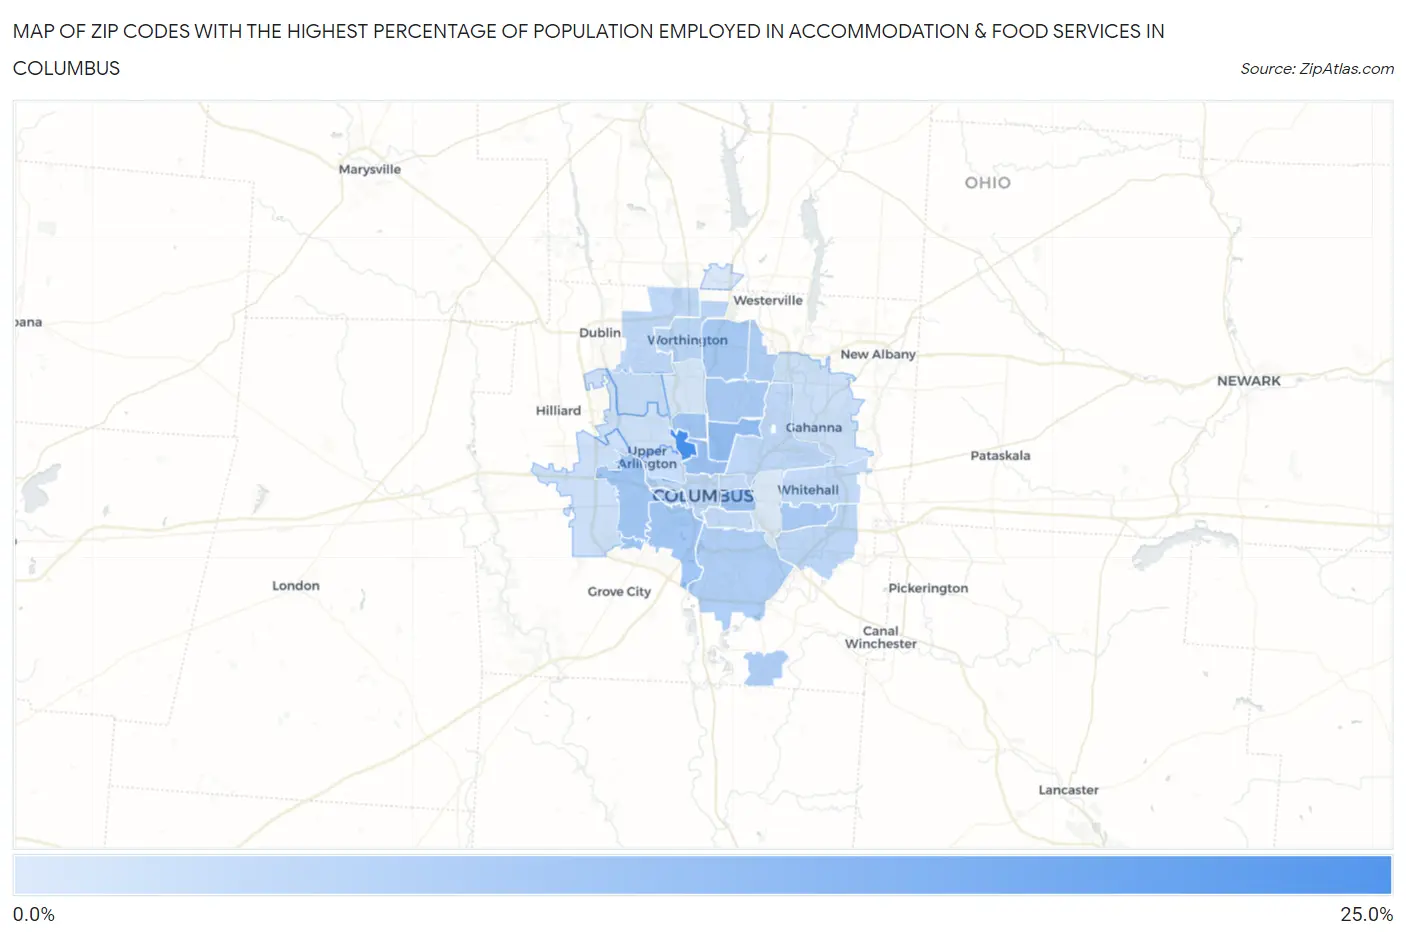
Map of Zip Codes with the Highest Percentage of Population Employed in Accommodation & Food Services in Columbus

0.0%
25.0%
Zip Codes with the Highest Percentage of Population Employed in Accommodation & Food Services in Columbus Map

Zip Codes with the Highest Percentage of Population Employed in Accommodation & Food Services in Columbus, OH

Zip Code % Employed vs State vs National
1.4321021.0%7.0%(+14.0)#346.9%(+14.1)#747
2.4321112.3%7.0%(+5.28)#1056.9%(+5.41)#2,672
3.4320111.2%7.0%(+4.20)#1376.9%(+4.32)#3,392
4.4320510.8%7.0%(+3.75)#1556.9%(+3.87)#3,753
5.4320210.5%7.0%(+3.49)#1656.9%(+3.62)#3,996
6.4322310.5%7.0%(+3.47)#1676.9%(+3.60)#4,019
7.4320410.4%7.0%(+3.41)#1746.9%(+3.54)#4,083
8.4322910.0%7.0%(+2.95)#2016.9%(+3.08)#4,596
9.432279.6%7.0%(+2.63)#2206.9%(+2.76)#5,002
10.432249.6%7.0%(+2.57)#2236.9%(+2.70)#5,100
11.432179.2%7.0%(+2.23)#2536.9%(+2.35)#5,606
12.432078.9%7.0%(+1.87)#2746.9%(+2.00)#6,155
13.432228.8%7.0%(+1.81)#2846.9%(+1.93)#6,256
14.432318.8%7.0%(+1.76)#2916.9%(+1.89)#6,353
15.432327.8%7.0%(+0.750)#3736.9%(+0.878)#8,342
16.430857.6%7.0%(+0.613)#3916.9%(+0.741)#8,692
17.432157.4%7.0%(+0.384)#4176.9%(+0.511)#9,276
18.432357.3%7.0%(+0.331)#4216.9%(+0.459)#9,403
19.432197.3%7.0%(+0.324)#4236.9%(+0.451)#9,428
20.432136.9%7.0%(-0.154)#4746.9%(-0.026)#10,707
21.432066.8%7.0%(-0.181)#4786.9%(-0.054)#10,807
22.432036.7%7.0%(-0.297)#5016.9%(-0.169)#11,170
23.432206.7%7.0%(-0.356)#5126.9%(-0.229)#11,345
24.432126.3%7.0%(-0.686)#5616.9%(-0.558)#12,403
25.432306.0%7.0%(-1.03)#6036.9%(-0.905)#13,516
26.432285.9%7.0%(-1.09)#6116.9%(-0.964)#13,722
27.432215.7%7.0%(-1.36)#6426.9%(-1.23)#14,533
28.432145.0%7.0%(-2.03)#7346.9%(-1.90)#16,895
29.432404.6%7.0%(-2.42)#7846.9%(-2.29)#18,199
30.432094.3%7.0%(-2.75)#8286.9%(-2.62)#19,328

Common Questions

What are the Top 10 Zip Codes with the Highest Percentage of Population Employed in Accommodation & Food Services in Columbus, OH?
Top 10 Zip Codes with the Highest Percentage of Population Employed in Accommodation & Food Services in Columbus, OH are:
#1
21.0%
#2
12.3%
#3
11.2%
#4
10.8%
#5
10.5%
#6
10.5%
#7
10.4%
#8
10.0%
#9
9.6%
#10
9.6%
What zip code has the Highest Percentage of Population Employed in Accommodation & Food Services in Columbus, OH?
43210 has the Highest Percentage of Population Employed in Accommodation & Food Services in Columbus, OH with 21.0%.
What is the Percentage of Population Employed in Accommodation & Food Services in Columbus, OH?
Percentage of Population Employed in Accommodation & Food Services in Columbus is 7.8%.
What is the Percentage of Population Employed in Accommodation & Food Services in Ohio?
Percentage of Population Employed in Accommodation & Food Services in Ohio is 7.0%.
What is the Percentage of Population Employed in Accommodation & Food Services in the United States?
Percentage of Population Employed in Accommodation & Food Services in the United States is 6.9%.