Zip Codes with the Highest Percentage of Households Without a Vehicle in Columbus, OH

RELATED REPORTS & OPTIONS

Households without a Cars
Population
Families and Households
Female Fertility
Female Fertility (Unmarried)
Race (Community Size)
Race (Percentage)
Ancestry (Community Size)
AfghanAfricanAlbanianAlsatianAmericanApacheArabArgentineanArmenianAustralianAustrianBahamianBangladeshiBarbadianBasqueBelgianBelizeanBhutaneseBlackfeetBolivianBrazilianBritishBritish West IndianBulgarianBurmeseCambodianCanadianCape VerdeanCarpatho RusynCelticCentral AmericanCentral American IndianCherokeeChileanChippewaChoctawColombianCosta RicanCreeCreekCroatianCrowCubanCzechCzechoslovakianDanishDelawareDominicanDutchDutch West IndianEastern EuropeanEcuadorianEgyptianEnglishEstonianEthiopianEuropeanFilipinoFinnishFrenchFrench American IndianFrench CanadianGermanGerman RussianGhanaianGreekGuamanian / ChamorroGuatemalanGuyaneseHaitianHonduranHungarianIcelanderIndian (Asian)IndonesianInupiatIranianIraqiIrishIroquoisIsraeliItalianJamaicanJapaneseJordanianKenyanKoreanLaotianLatvianLebaneseLiberianLithuanianLumbeeLuxembourgerMacedonianMalaysianMalteseMexicanMexican American IndianMongolianMoroccanNative HawaiianNavajoNew ZealanderNicaraguanNigerianNorthern EuropeanNorwegianPakistaniPalestinianPanamanianParaguayanPennsylvania GermanPeruvianPolishPortuguesePuerto RicanRomanianRussianSalvadoranSamoanScandinavianScotch-IrishScottishSeminoleSenegaleseSerbianSierra LeoneanSiouxSlavicSlovakSloveneSomaliSouth AfricanSouth AmericanSouth American IndianSpaniardSpanishSri LankanSubsaharan AfricanSudaneseSwedishSwissSyrianThaiTrinidadian and TobagonianTurkishUgandanUkrainianUruguayanVenezuelanVietnameseWelshWest IndianYaquiYugoslavianZimbabwean
Ancestry (Percentage)
AfghanAfricanAlbanianAlsatianAmericanApacheArabArgentineanArmenianAustralianAustrianBahamianBangladeshiBarbadianBasqueBelgianBelizeanBhutaneseBlackfeetBolivianBrazilianBritishBritish West IndianBulgarianBurmeseCambodianCanadianCape VerdeanCarpatho RusynCelticCentral AmericanCentral American IndianCherokeeChileanChippewaChoctawColombianCosta RicanCreeCreekCroatianCrowCubanCzechCzechoslovakianDanishDelawareDominicanDutchDutch West IndianEastern EuropeanEcuadorianEgyptianEnglishEstonianEthiopianEuropeanFilipinoFinnishFrenchFrench American IndianFrench CanadianGermanGerman RussianGhanaianGreekGuamanian / ChamorroGuatemalanGuyaneseHaitianHonduranHungarianIcelanderIndian (Asian)IndonesianInupiatIranianIraqiIrishIroquoisIsraeliItalianJamaicanJapaneseJordanianKenyanKoreanLaotianLatvianLebaneseLiberianLithuanianLumbeeLuxembourgerMacedonianMalaysianMalteseMexicanMexican American IndianMongolianMoroccanNative HawaiianNavajoNew ZealanderNicaraguanNigerianNorthern EuropeanNorwegianPakistaniPalestinianPanamanianParaguayanPennsylvania GermanPeruvianPolishPortuguesePuerto RicanRomanianRussianSalvadoranSamoanScandinavianScotch-IrishScottishSeminoleSenegaleseSerbianSierra LeoneanSiouxSlavicSlovakSloveneSomaliSouth AfricanSouth AmericanSouth American IndianSpaniardSpanishSri LankanSubsaharan AfricanSudaneseSwedishSwissSyrianThaiTrinidadian and TobagonianTurkishUgandanUkrainianUruguayanVenezuelanVietnameseWelshWest IndianYaquiYugoslavianZimbabwean
Immigrant Origin (Total)
AfghanistanAfricaAlbaniaArgentinaArmeniaAsiaAustraliaBahamasBangladeshBarbadosBelarusBelgiumBelizeBosnia and HerzegovinaBrazilBulgariaBurma / MyanmarCambodiaCameroonCanadaCaribbeanCentral AmericaChileChinaColombiaCongoCosta RicaCubaCzechoslovakiaDominican RepublicEastern AfricaEastern AsiaEastern EuropeEcuadorEgyptEl SalvadorEnglandEritreaEthiopiaEuropeFranceGermanyGhanaGreeceGuatemalaGuyanaHaitiHondurasHong KongHungaryIndiaIndonesiaIranIraqIrelandIsraelItalyJamaicaJapanJordanKazakhstanKenyaKoreaKuwaitLaosLatin AmericaLatviaLebanonLiberiaLithuaniaMalaysiaMexicoMiddle AfricaMoroccoNepalNetherlandsNigeriaNorth MacedoniaNorthern AfricaNorthern EuropeOceaniaPakistanPanamaPeruPhilippinesPolandRomaniaRussiaSaudi ArabiaScotlandSenegalSerbiaSierra LeoneSingaporeSomaliaSouth AfricaSouth AmericaSouth Central AsiaSouth Eastern AsiaSouthern EuropeSpainSri LankaSudanSwitzerlandSyriaTaiwanThailandTrinidad and TobagoTurkeyUgandaUkraineUruguayUzbekistanVenezuelaVietnamWestern AfricaWestern AsiaWestern EuropeZaireZimbabwe
Immigrant Origin (Percentage)
AfghanistanAfricaAlbaniaArgentinaArmeniaAsiaAustraliaBahamasBangladeshBarbadosBelarusBelgiumBelizeBosnia and HerzegovinaBrazilBulgariaBurma / MyanmarCambodiaCameroonCanadaCaribbeanCentral AmericaChileChinaColombiaCongoCosta RicaCubaCzechoslovakiaDominican RepublicEastern AfricaEastern AsiaEastern EuropeEcuadorEgyptEl SalvadorEnglandEritreaEthiopiaEuropeFranceGermanyGhanaGreeceGuatemalaGuyanaHaitiHondurasHong KongHungaryIndiaIndonesiaIranIraqIrelandIsraelItalyJamaicaJapanJordanKazakhstanKenyaKoreaKuwaitLaosLatin AmericaLatviaLebanonLiberiaLithuaniaMalaysiaMexicoMiddle AfricaMoroccoNepalNetherlandsNigeriaNorth MacedoniaNorthern AfricaNorthern EuropeOceaniaPakistanPanamaPeruPhilippinesPolandRomaniaRussiaSaudi ArabiaScotlandSenegalSerbiaSierra LeoneSingaporeSomaliaSouth AfricaSouth AmericaSouth Central AsiaSouth Eastern AsiaSouthern EuropeSpainSri LankaSudanSwitzerlandSyriaTaiwanThailandTrinidad and TobagoTurkeyUgandaUkraineUruguayUzbekistanVenezuelaVietnamWestern AfricaWestern AsiaWestern EuropeZaireZimbabwe
Income
Income (Families)
Income (Households)
Poverty
Poverty (Families)
Unemployment
Employment Occupations
Employment Industries
Employer Class
Commute Time
Commute Means
School Enrollment
Education by Degree Field
Occupancy
Finances
Physical Characteristics
Columbus
Compare Zip Codes
Comparison Subject

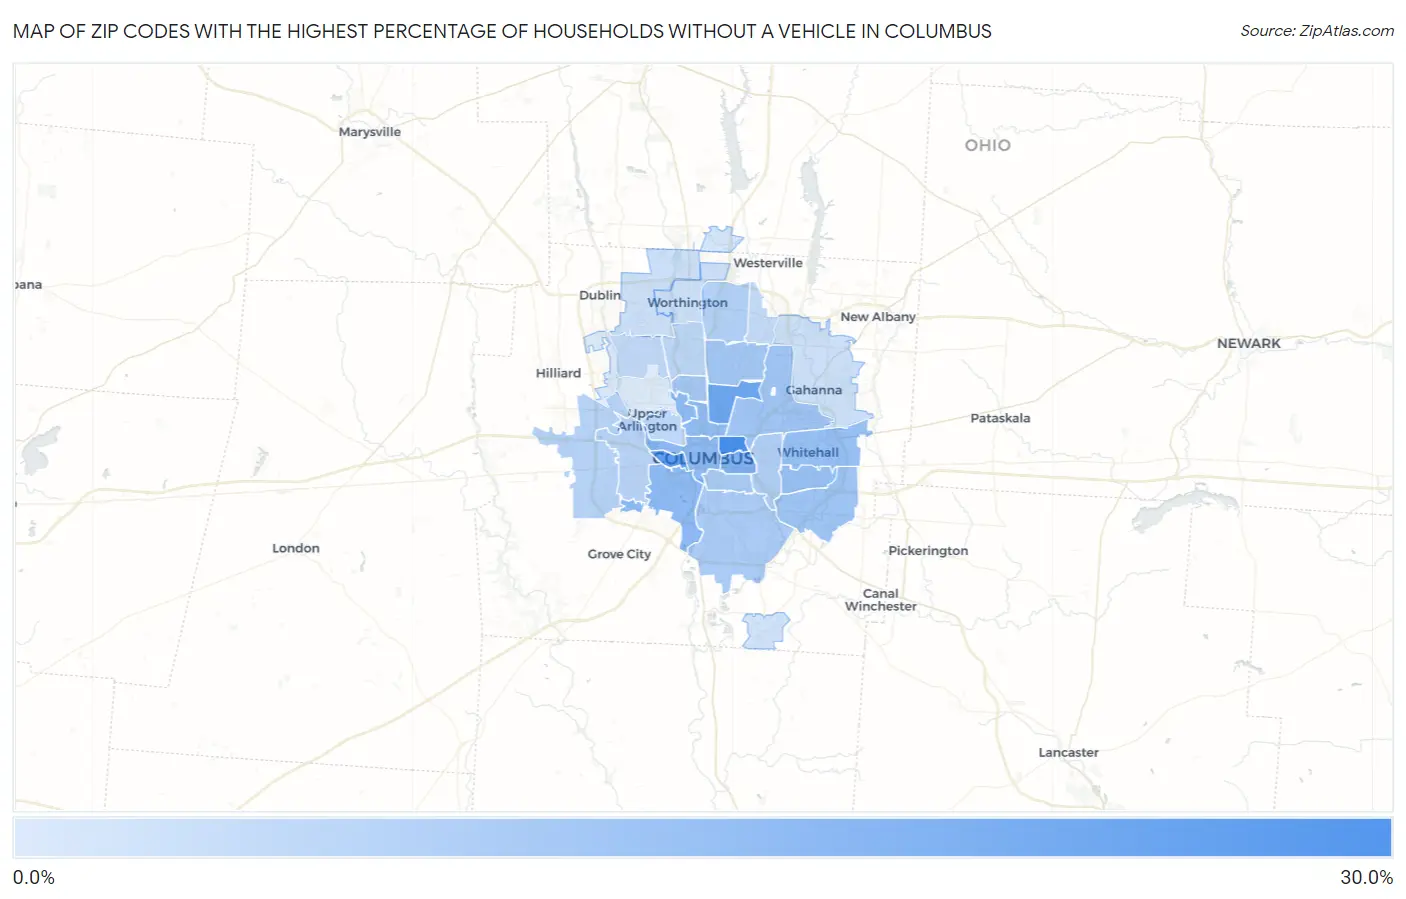
Map of Zip Codes with the Highest Percentage of Households Without a Vehicle in Columbus

0.0%
30.0%
Zip Codes with the Highest Percentage of Households Without a Vehicle in Columbus Map

Zip Codes with the Highest Percentage of Households Without a Vehicle in Columbus, OH

Zip Code Housholds Without a Car vs State vs National
1.4320326.8%7.4%(+19.4)#438.3%(+18.5)#956
2.4322222.1%7.4%(+14.7)#578.3%(+13.8)#1,294
3.4321119.6%7.4%(+12.2)#668.3%(+11.3)#1,553
4.4320516.2%7.4%(+8.80)#998.3%(+7.90)#2,111
5.4322314.1%7.4%(+6.70)#1298.3%(+5.80)#2,661
6.4321514.1%7.4%(+6.70)#1308.3%(+5.80)#2,669
7.4321014.1%7.4%(+6.70)#1318.3%(+5.80)#2,672
8.4320113.4%7.4%(+6.00)#1368.3%(+5.10)#2,916
9.4322712.4%7.4%(+5.00)#1608.3%(+4.10)#3,363
10.4321312.3%7.4%(+4.90)#1618.3%(+4.00)#3,408
11.4323211.3%7.4%(+3.90)#1768.3%(+3.00)#3,932
12.4321910.8%7.4%(+3.40)#1908.3%(+2.50)#4,241
13.4322410.6%7.4%(+3.20)#1998.3%(+2.30)#4,378
14.4320210.0%7.4%(+2.60)#2158.3%(+1.70)#4,862
15.432069.8%7.4%(+2.40)#2248.3%(+1.50)#5,021
16.432079.4%7.4%(+2.00)#2308.3%(+1.10)#5,337
17.432098.2%7.4%(+0.800)#2838.3%(-0.100)#6,654
18.432298.0%7.4%(+0.600)#2928.3%(-0.300)#6,896
19.432287.6%7.4%(+0.200)#3128.3%(-0.700)#7,529
20.432047.0%7.4%(-0.400)#3478.3%(-1.30)#8,525
21.432146.3%7.4%(-1.10)#3898.3%(-2.00)#9,801
22.432126.1%7.4%(-1.30)#4058.3%(-2.20)#10,226
23.432205.7%7.4%(-1.70)#4358.3%(-2.60)#11,127
24.432315.3%7.4%(-2.10)#4718.3%(-3.00)#12,112
25.432354.0%7.4%(-3.40)#6128.3%(-4.30)#15,687
26.432303.9%7.4%(-3.50)#6238.3%(-4.40)#15,976
27.430853.9%7.4%(-3.50)#6248.3%(-4.40)#16,024
28.432173.3%7.4%(-4.10)#7268.3%(-5.00)#18,190
29.432402.9%7.4%(-4.50)#7638.3%(-5.40)#19,505
30.432211.4%7.4%(-6.00)#9258.3%(-6.90)#24,414

Common Questions

What are the Top 10 Zip Codes with the Highest Percentage of Households Without a Vehicle in Columbus, OH?
Top 10 Zip Codes with the Highest Percentage of Households Without a Vehicle in Columbus, OH are:
#1
26.8%
#2
22.1%
#3
19.6%
#4
16.2%
#5
14.1%
#6
14.1%
#7
14.1%
#8
13.4%
#9
12.4%
#10
12.3%
What zip code has the Highest Percentage of Households Without a Vehicle in Columbus, OH?
43203 has the Highest Percentage of Households Without a Vehicle in Columbus, OH with 26.8%.
What is the Percentage of Households Without a Vehicle in Columbus, OH?
Percentage of Households Without a Vehicle in Columbus is 8.2%.
What is the Percentage of Households Without a Vehicle in Ohio?
Percentage of Households Without a Vehicle in Ohio is 7.4%.
What is the Percentage of Households Without a Vehicle in the United States?
Percentage of Households Without a Vehicle in the United States is 8.3%.