Zip Codes with the Highest Percentage of Population with a Degree in Science and Engineering in Columbus, OH
RELATED REPORTS & OPTIONS
Science and Engineering
Columbus
Compare Zip Codes
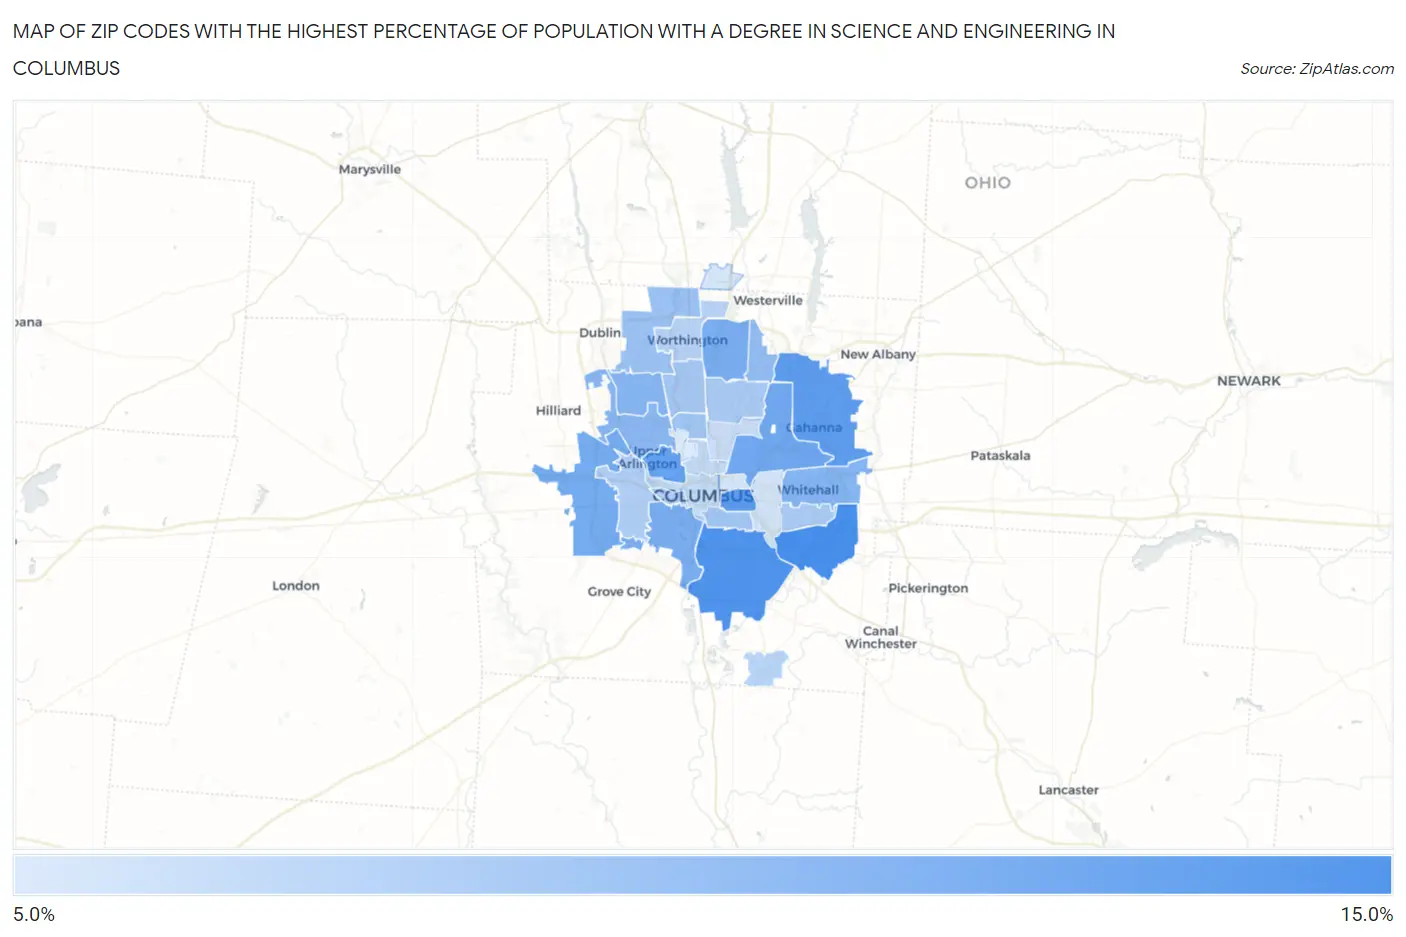
Map of Zip Codes with the Highest Percentage of Population with a Degree in Science and Engineering in Columbus
0.0%
15.0%
Zip Codes with the Highest Percentage of Population with a Degree in Science and Engineering in Columbus, OH
| Zip Code | % Graduates | vs State | vs National | |
| 1. | 43232 | 12.7% | 11.8%(+0.844)#531 | 9.8%(+2.88)#9,772 |
| 2. | 43207 | 12.3% | 11.8%(+0.479)#555 | 9.8%(+2.51)#10,382 |
| 3. | 43205 | 11.7% | 11.8%(-0.155)#604 | 9.8%(+1.88)#11,553 |
| 4. | 43230 | 11.5% | 11.8%(-0.269)#608 | 9.8%(+1.76)#11,745 |
| 5. | 43212 | 11.1% | 11.8%(-0.703)#643 | 9.8%(+1.33)#12,589 |
| 6. | 43219 | 10.6% | 11.8%(-1.21)#685 | 9.8%(+0.827)#13,729 |
| 7. | 43228 | 10.3% | 11.8%(-1.49)#709 | 9.8%(+0.546)#14,334 |
| 8. | 43223 | 10.2% | 11.8%(-1.65)#722 | 9.8%(+0.384)#14,681 |
| 9. | 43229 | 10.2% | 11.8%(-1.66)#724 | 9.8%(+0.369)#14,698 |
| 10. | 43213 | 9.6% | 11.8%(-2.21)#764 | 9.8%(-0.176)#15,914 |
| 11. | 43220 | 9.5% | 11.8%(-2.30)#770 | 9.8%(-0.272)#16,144 |
| 12. | 43221 | 9.3% | 11.8%(-2.47)#780 | 9.8%(-0.435)#16,521 |
| 13. | 43231 | 8.9% | 11.8%(-2.92)#806 | 9.8%(-0.887)#17,567 |
| 14. | 43235 | 8.6% | 11.8%(-3.26)#817 | 9.8%(-1.23)#18,353 |
| 15. | 43202 | 8.2% | 11.8%(-3.64)#838 | 9.8%(-1.61)#19,249 |
| 16. | 43206 | 8.2% | 11.8%(-3.66)#840 | 9.8%(-1.63)#19,312 |
| 17. | 43214 | 8.0% | 11.8%(-3.84)#852 | 9.8%(-1.81)#19,696 |
| 18. | 43227 | 7.9% | 11.8%(-3.96)#860 | 9.8%(-1.93)#19,978 |
| 19. | 43224 | 7.8% | 11.8%(-4.01)#864 | 9.8%(-1.97)#20,074 |
| 20. | 43204 | 7.5% | 11.8%(-4.31)#878 | 9.8%(-2.28)#20,712 |
| 21. | 43222 | 7.5% | 11.8%(-4.35)#880 | 9.8%(-2.32)#20,789 |
| 22. | 43085 | 7.1% | 11.8%(-4.67)#897 | 9.8%(-2.64)#21,429 |
| 23. | 43217 | 7.0% | 11.8%(-4.81)#901 | 9.8%(-2.78)#21,727 |
| 24. | 43201 | 6.6% | 11.8%(-5.22)#916 | 9.8%(-3.19)#22,418 |
| 25. | 43215 | 6.4% | 11.8%(-5.36)#920 | 9.8%(-3.33)#22,680 |
| 26. | 43211 | 6.3% | 11.8%(-5.56)#928 | 9.8%(-3.52)#23,001 |
| 27. | 43209 | 5.8% | 11.8%(-6.01)#942 | 9.8%(-3.98)#23,743 |
| 28. | 43203 | 5.7% | 11.8%(-6.10)#943 | 9.8%(-4.07)#23,861 |
| 29. | 43240 | 5.7% | 11.8%(-6.12)#944 | 9.8%(-4.08)#23,881 |
| 30. | 43210 | 5.4% | 11.8%(-6.42)#953 | 9.8%(-4.39)#24,262 |
1
Common Questions
What are the Top 10 Zip Codes with the Highest Percentage of Population with a Degree in Science and Engineering in Columbus, OH?
Top 10 Zip Codes with the Highest Percentage of Population with a Degree in Science and Engineering in Columbus, OH are:
What zip code has the Highest Percentage of Population with a Degree in Science and Engineering in Columbus, OH?
43232 has the Highest Percentage of Population with a Degree in Science and Engineering in Columbus, OH with 12.7%.
What is the Percentage of Population with a Degree in Science and Engineering in Columbus, OH?
Percentage of Population with a Degree in Science and Engineering in Columbus is 9.1%.
What is the Percentage of Population with a Degree in Science and Engineering in Ohio?
Percentage of Population with a Degree in Science and Engineering in Ohio is 11.8%.
What is the Percentage of Population with a Degree in Science and Engineering in the United States?
Percentage of Population with a Degree in Science and Engineering in the United States is 9.8%.