Zip Codes with the Highest Percentage of Population Employed in Health Diagnosing & Treating in Dayton, OH
RELATED REPORTS & OPTIONS
Health Diagnosing & Treating
Dayton
Compare Zip Codes
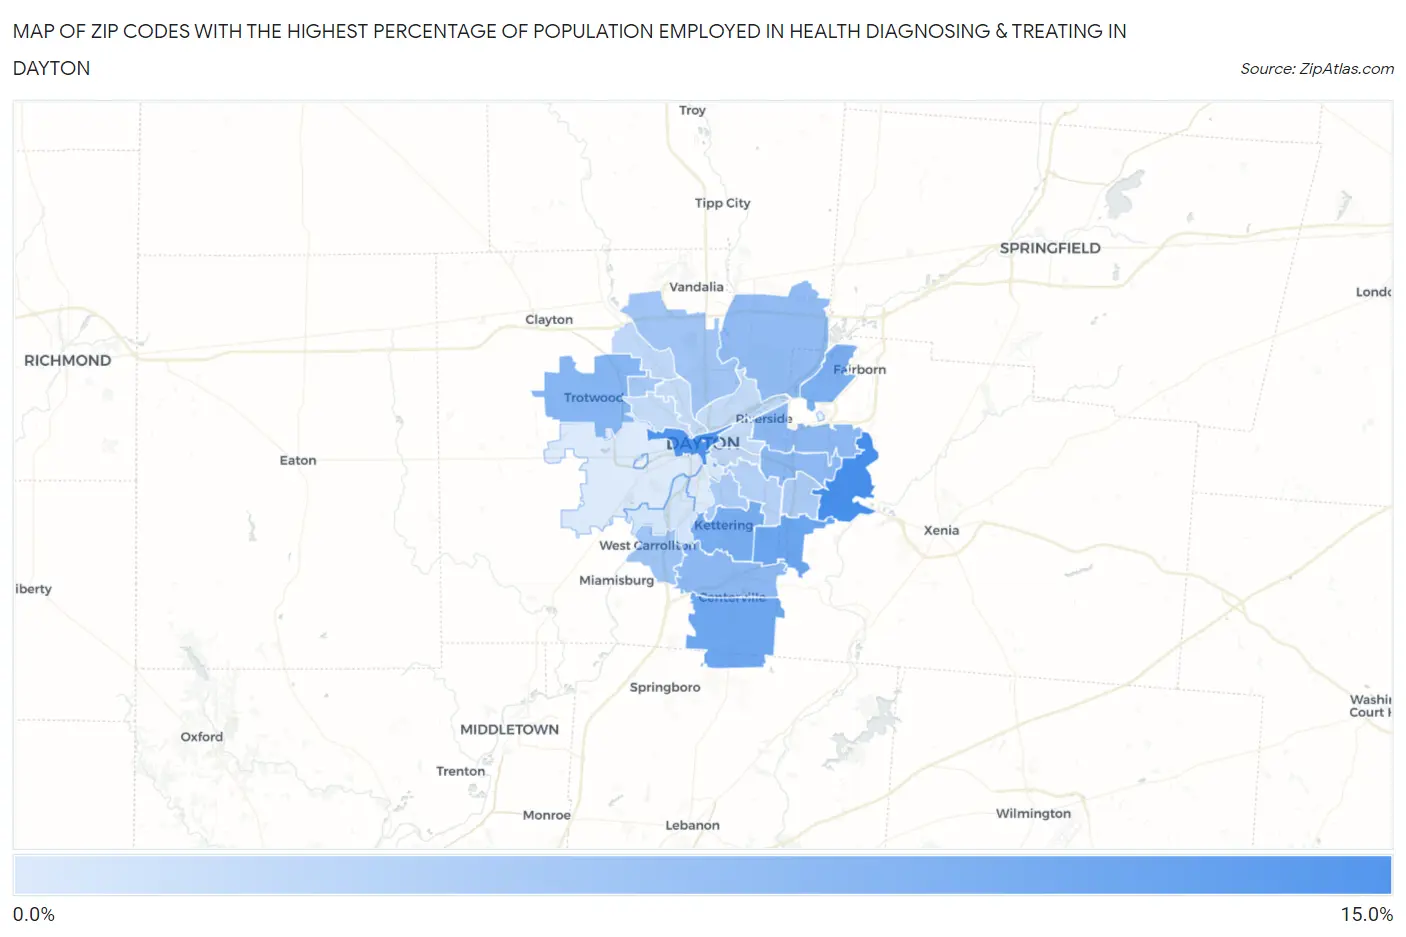
Map of Zip Codes with the Highest Percentage of Population Employed in Health Diagnosing & Treating in Dayton
0.0%
15.0%
Zip Codes with the Highest Percentage of Population Employed in Health Diagnosing & Treating in Dayton, OH
| Zip Code | % Employed | vs State | vs National | |
| 1. | 45434 | 12.4% | 7.2%(+5.24)#72 | 6.2%(+6.15)#2,005 |
| 2. | 45402 | 11.8% | 7.2%(+4.65)#95 | 6.2%(+5.55)#2,329 |
| 3. | 45440 | 10.0% | 7.2%(+2.89)#164 | 6.2%(+3.79)#3,846 |
| 4. | 45458 | 9.9% | 7.2%(+2.76)#172 | 6.2%(+3.66)#3,991 |
| 5. | 45429 | 9.3% | 7.2%(+2.13)#210 | 6.2%(+3.04)#4,885 |
| 6. | 45433 | 8.9% | 7.2%(+1.75)#248 | 6.2%(+2.66)#5,527 |
| 7. | 45426 | 8.4% | 7.2%(+1.23)#298 | 6.2%(+2.13)#6,567 |
| 8. | 45432 | 8.0% | 7.2%(+0.862)#336 | 6.2%(+1.77)#7,467 |
| 9. | 45431 | 7.9% | 7.2%(+0.767)#346 | 6.2%(+1.67)#7,713 |
| 10. | 45459 | 7.9% | 7.2%(+0.730)#348 | 6.2%(+1.64)#7,803 |
| 11. | 45424 | 7.6% | 7.2%(+0.462)#379 | 6.2%(+1.37)#8,478 |
| 12. | 45449 | 6.8% | 7.2%(-0.368)#505 | 6.2%(+0.539)#11,045 |
| 13. | 45414 | 6.7% | 7.2%(-0.462)#519 | 6.2%(+0.445)#11,339 |
| 14. | 45416 | 6.3% | 7.2%(-0.857)#573 | 6.2%(+0.049)#12,772 |
| 15. | 45419 | 6.1% | 7.2%(-1.02)#595 | 6.2%(-0.110)#13,391 |
| 16. | 45430 | 6.0% | 7.2%(-1.11)#608 | 6.2%(-0.202)#13,729 |
| 17. | 45420 | 5.5% | 7.2%(-1.61)#671 | 6.2%(-0.703)#15,627 |
| 18. | 45415 | 4.8% | 7.2%(-2.36)#777 | 6.2%(-1.45)#18,519 |
| 19. | 45410 | 4.6% | 7.2%(-2.52)#800 | 6.2%(-1.61)#19,123 |
| 20. | 45405 | 4.6% | 7.2%(-2.57)#811 | 6.2%(-1.67)#19,344 |
| 21. | 45406 | 4.6% | 7.2%(-2.58)#813 | 6.2%(-1.67)#19,367 |
| 22. | 45404 | 4.6% | 7.2%(-2.58)#814 | 6.2%(-1.67)#19,375 |
| 23. | 45403 | 4.5% | 7.2%(-2.68)#823 | 6.2%(-1.77)#19,722 |
| 24. | 45439 | 3.6% | 7.2%(-3.60)#924 | 6.2%(-2.69)#22,751 |
| 25. | 45409 | 3.0% | 7.2%(-4.13)#970 | 6.2%(-3.22)#24,249 |
| 26. | 45417 | 3.0% | 7.2%(-4.17)#974 | 6.2%(-3.26)#24,365 |
1
Common Questions
What are the Top 10 Zip Codes with the Highest Percentage of Population Employed in Health Diagnosing & Treating in Dayton, OH?
Top 10 Zip Codes with the Highest Percentage of Population Employed in Health Diagnosing & Treating in Dayton, OH are:
What zip code has the Highest Percentage of Population Employed in Health Diagnosing & Treating in Dayton, OH?
45434 has the Highest Percentage of Population Employed in Health Diagnosing & Treating in Dayton, OH with 12.4%.
What is the Percentage of Population Employed in Health Diagnosing & Treating in Dayton, OH?
Percentage of Population Employed in Health Diagnosing & Treating in Dayton is 5.1%.
What is the Percentage of Population Employed in Health Diagnosing & Treating in Ohio?
Percentage of Population Employed in Health Diagnosing & Treating in Ohio is 7.2%.
What is the Percentage of Population Employed in Health Diagnosing & Treating in the United States?
Percentage of Population Employed in Health Diagnosing & Treating in the United States is 6.2%.