Zip Codes with the Highest Percentage of Households with Income Above $100,000 in Columbus, OH
RELATED REPORTS & OPTIONS
Household Income | $100k+
Columbus
Compare Zip Codes
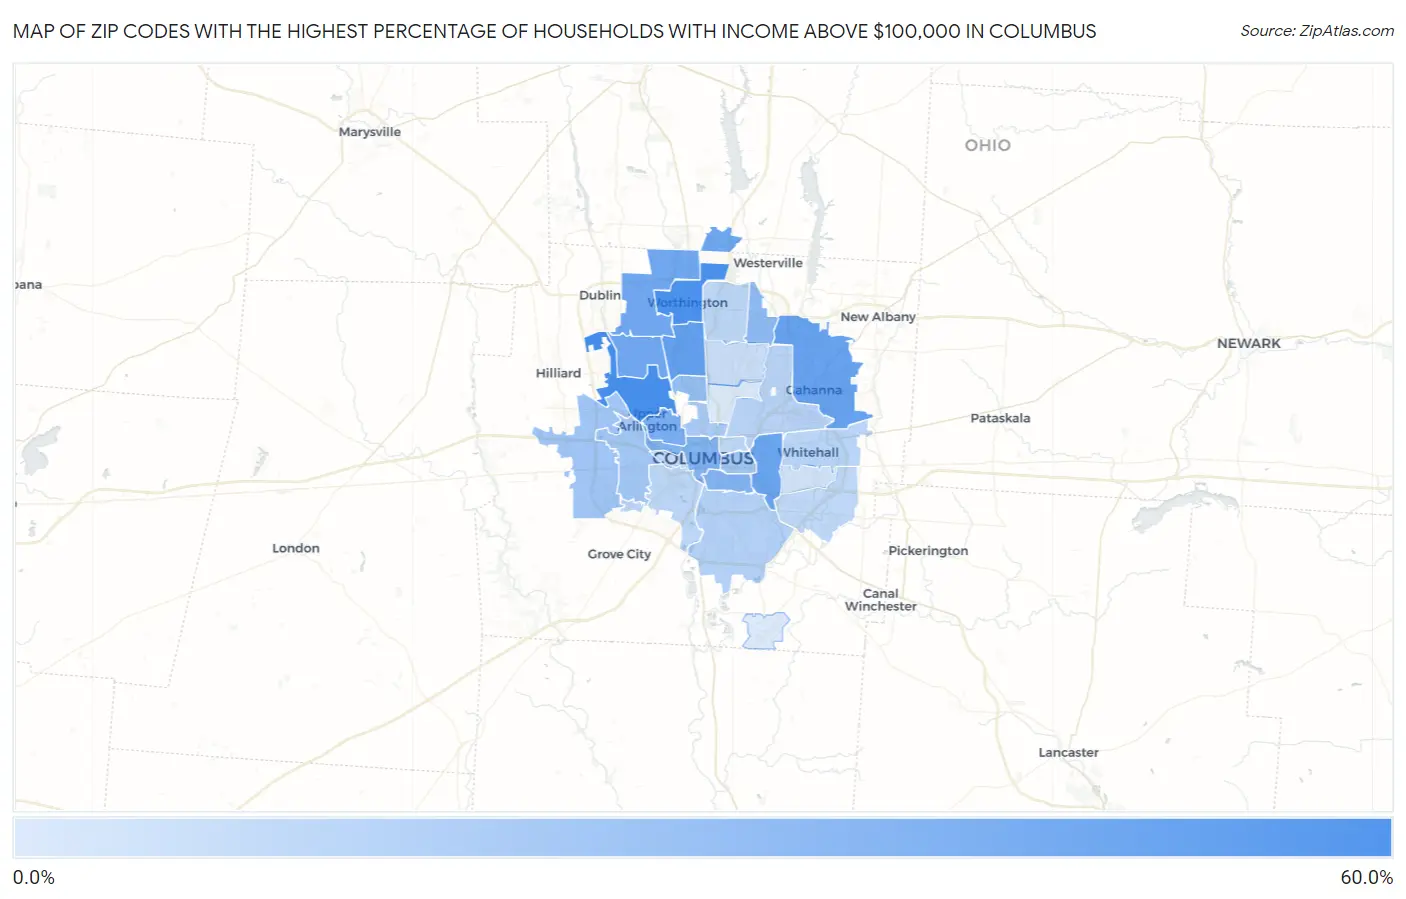
Map of Zip Codes with the Highest Percentage of Households with Income Above $100,000 in Columbus
0.0%
60.0%
Zip Codes with the Highest Percentage of Households with Income Above $100,000 in Columbus, OH
| Zip Code | Households with Income > $100k | vs State | vs National | |
| 1. | 43221 | 55.1% | 31.5%(+23.6)#61 | 37.3%(+17.8)#3,419 |
| 2. | 43085 | 53.2% | 31.5%(+21.7)#77 | 37.3%(+15.9)#3,920 |
| 3. | 43214 | 45.2% | 31.5%(+13.7)#154 | 37.3%(+7.90)#6,539 |
| 4. | 43230 | 44.0% | 31.5%(+12.5)#170 | 37.3%(+6.70)#6,999 |
| 5. | 43209 | 42.2% | 31.5%(+10.7)#203 | 37.3%(+4.90)#7,804 |
| 6. | 43240 | 41.9% | 31.5%(+10.4)#210 | 37.3%(+4.60)#7,940 |
| 7. | 43235 | 41.0% | 31.5%(+9.50)#223 | 37.3%(+3.70)#8,391 |
| 8. | 43220 | 40.7% | 31.5%(+9.20)#232 | 37.3%(+3.40)#8,554 |
| 9. | 43212 | 37.9% | 31.5%(+6.40)#286 | 37.3%(+0.600)#10,043 |
| 10. | 43215 | 34.7% | 31.5%(+3.20)#366 | 37.3%(-2.60)#11,947 |
| 11. | 43206 | 34.5% | 31.5%(+3.00)#373 | 37.3%(-2.80)#12,076 |
| 12. | 43231 | 31.2% | 31.5%(-0.300)#469 | 37.3%(-6.10)#14,464 |
| 13. | 43202 | 28.9% | 31.5%(-2.60)#557 | 37.3%(-8.40)#16,321 |
| 14. | 43228 | 25.7% | 31.5%(-5.80)#676 | 37.3%(-11.6)#19,130 |
| 15. | 43205 | 25.1% | 31.5%(-6.40)#697 | 37.3%(-12.2)#19,669 |
| 16. | 43204 | 25.0% | 31.5%(-6.50)#700 | 37.3%(-12.3)#19,736 |
| 17. | 43201 | 23.3% | 31.5%(-8.20)#760 | 37.3%(-14.0)#21,308 |
| 18. | 43207 | 20.5% | 31.5%(-11.0)#851 | 37.3%(-16.8)#23,628 |
| 19. | 43219 | 19.3% | 31.5%(-12.2)#894 | 37.3%(-18.0)#24,592 |
| 20. | 43213 | 18.5% | 31.5%(-13.0)#917 | 37.3%(-18.8)#25,172 |
| 21. | 43229 | 18.1% | 31.5%(-13.4)#929 | 37.3%(-19.2)#25,459 |
| 22. | 43223 | 18.1% | 31.5%(-13.4)#930 | 37.3%(-19.2)#25,468 |
| 23. | 43232 | 17.2% | 31.5%(-14.3)#949 | 37.3%(-20.1)#26,082 |
| 24. | 43203 | 17.0% | 31.5%(-14.5)#959 | 37.3%(-20.3)#26,227 |
| 25. | 43222 | 14.6% | 31.5%(-16.9)#1,024 | 37.3%(-22.7)#27,783 |
| 26. | 43224 | 14.3% | 31.5%(-17.2)#1,027 | 37.3%(-23.0)#27,925 |
| 27. | 43227 | 12.3% | 31.5%(-19.2)#1,060 | 37.3%(-25.0)#28,896 |
| 28. | 43211 | 9.4% | 31.5%(-22.1)#1,096 | 37.3%(-27.9)#30,018 |
| 29. | 43217 | 9.3% | 31.5%(-22.2)#1,101 | 37.3%(-28.0)#30,058 |
1
Common Questions
What are the Top 10 Zip Codes with the Highest Percentage of Households with Income Above $100,000 in Columbus, OH?
Top 10 Zip Codes with the Highest Percentage of Households with Income Above $100,000 in Columbus, OH are:
What zip code has the Highest Percentage of Households with Income Above $100,000 in Columbus, OH?
43221 has the Highest Percentage of Households with Income Above $100,000 in Columbus, OH with 55.1%.
What is the Percentage of Households with Income Above $100,000 in Columbus, OH?
Percentage of Households with Income Above $100,000 in Columbus is 28.3%.
What is the Percentage of Households with Income Above $100,000 in Ohio?
Percentage of Households with Income Above $100,000 in Ohio is 31.5%.
What is the Percentage of Households with Income Above $100,000 in the United States?
Percentage of Households with Income Above $100,000 in the United States is 37.3%.