Zip Codes with the Highest Percentage of Population Employed in Computer & Mathematics in Columbus, OH

RELATED REPORTS & OPTIONS

Computer & Mathematics
Population
Families and Households
Female Fertility
Female Fertility (Unmarried)
Race (Community Size)
Race (Percentage)
Ancestry (Community Size)
AfghanAfricanAlbanianAlsatianAmericanApacheArabArgentineanArmenianAustralianAustrianBahamianBangladeshiBarbadianBasqueBelgianBelizeanBhutaneseBlackfeetBolivianBrazilianBritishBritish West IndianBulgarianBurmeseCambodianCanadianCape VerdeanCarpatho RusynCelticCentral AmericanCentral American IndianCherokeeChileanChippewaChoctawColombianCosta RicanCreeCreekCroatianCrowCubanCzechCzechoslovakianDanishDelawareDominicanDutchDutch West IndianEastern EuropeanEcuadorianEgyptianEnglishEstonianEthiopianEuropeanFilipinoFinnishFrenchFrench American IndianFrench CanadianGermanGerman RussianGhanaianGreekGuamanian / ChamorroGuatemalanGuyaneseHaitianHonduranHungarianIcelanderIndian (Asian)IndonesianInupiatIranianIraqiIrishIroquoisIsraeliItalianJamaicanJapaneseJordanianKenyanKoreanLaotianLatvianLebaneseLiberianLithuanianLumbeeLuxembourgerMacedonianMalaysianMalteseMexicanMexican American IndianMongolianMoroccanNative HawaiianNavajoNew ZealanderNicaraguanNigerianNorthern EuropeanNorwegianPakistaniPalestinianPanamanianParaguayanPennsylvania GermanPeruvianPolishPortuguesePuerto RicanRomanianRussianSalvadoranSamoanScandinavianScotch-IrishScottishSeminoleSenegaleseSerbianSierra LeoneanSiouxSlavicSlovakSloveneSomaliSouth AfricanSouth AmericanSouth American IndianSpaniardSpanishSri LankanSubsaharan AfricanSudaneseSwedishSwissSyrianThaiTrinidadian and TobagonianTurkishUgandanUkrainianUruguayanVenezuelanVietnameseWelshWest IndianYaquiYugoslavianZimbabwean
Ancestry (Percentage)
AfghanAfricanAlbanianAlsatianAmericanApacheArabArgentineanArmenianAustralianAustrianBahamianBangladeshiBarbadianBasqueBelgianBelizeanBhutaneseBlackfeetBolivianBrazilianBritishBritish West IndianBulgarianBurmeseCambodianCanadianCape VerdeanCarpatho RusynCelticCentral AmericanCentral American IndianCherokeeChileanChippewaChoctawColombianCosta RicanCreeCreekCroatianCrowCubanCzechCzechoslovakianDanishDelawareDominicanDutchDutch West IndianEastern EuropeanEcuadorianEgyptianEnglishEstonianEthiopianEuropeanFilipinoFinnishFrenchFrench American IndianFrench CanadianGermanGerman RussianGhanaianGreekGuamanian / ChamorroGuatemalanGuyaneseHaitianHonduranHungarianIcelanderIndian (Asian)IndonesianInupiatIranianIraqiIrishIroquoisIsraeliItalianJamaicanJapaneseJordanianKenyanKoreanLaotianLatvianLebaneseLiberianLithuanianLumbeeLuxembourgerMacedonianMalaysianMalteseMexicanMexican American IndianMongolianMoroccanNative HawaiianNavajoNew ZealanderNicaraguanNigerianNorthern EuropeanNorwegianPakistaniPalestinianPanamanianParaguayanPennsylvania GermanPeruvianPolishPortuguesePuerto RicanRomanianRussianSalvadoranSamoanScandinavianScotch-IrishScottishSeminoleSenegaleseSerbianSierra LeoneanSiouxSlavicSlovakSloveneSomaliSouth AfricanSouth AmericanSouth American IndianSpaniardSpanishSri LankanSubsaharan AfricanSudaneseSwedishSwissSyrianThaiTrinidadian and TobagonianTurkishUgandanUkrainianUruguayanVenezuelanVietnameseWelshWest IndianYaquiYugoslavianZimbabwean
Immigrant Origin (Total)
AfghanistanAfricaAlbaniaArgentinaArmeniaAsiaAustraliaBahamasBangladeshBarbadosBelarusBelgiumBelizeBosnia and HerzegovinaBrazilBulgariaBurma / MyanmarCambodiaCameroonCanadaCaribbeanCentral AmericaChileChinaColombiaCongoCosta RicaCubaCzechoslovakiaDominican RepublicEastern AfricaEastern AsiaEastern EuropeEcuadorEgyptEl SalvadorEnglandEritreaEthiopiaEuropeFranceGermanyGhanaGreeceGuatemalaGuyanaHaitiHondurasHong KongHungaryIndiaIndonesiaIranIraqIrelandIsraelItalyJamaicaJapanJordanKazakhstanKenyaKoreaKuwaitLaosLatin AmericaLatviaLebanonLiberiaLithuaniaMalaysiaMexicoMiddle AfricaMoroccoNepalNetherlandsNigeriaNorth MacedoniaNorthern AfricaNorthern EuropeOceaniaPakistanPanamaPeruPhilippinesPolandRomaniaRussiaSaudi ArabiaScotlandSenegalSerbiaSierra LeoneSingaporeSomaliaSouth AfricaSouth AmericaSouth Central AsiaSouth Eastern AsiaSouthern EuropeSpainSri LankaSudanSwitzerlandSyriaTaiwanThailandTrinidad and TobagoTurkeyUgandaUkraineUruguayUzbekistanVenezuelaVietnamWestern AfricaWestern AsiaWestern EuropeZaireZimbabwe
Immigrant Origin (Percentage)
AfghanistanAfricaAlbaniaArgentinaArmeniaAsiaAustraliaBahamasBangladeshBarbadosBelarusBelgiumBelizeBosnia and HerzegovinaBrazilBulgariaBurma / MyanmarCambodiaCameroonCanadaCaribbeanCentral AmericaChileChinaColombiaCongoCosta RicaCubaCzechoslovakiaDominican RepublicEastern AfricaEastern AsiaEastern EuropeEcuadorEgyptEl SalvadorEnglandEritreaEthiopiaEuropeFranceGermanyGhanaGreeceGuatemalaGuyanaHaitiHondurasHong KongHungaryIndiaIndonesiaIranIraqIrelandIsraelItalyJamaicaJapanJordanKazakhstanKenyaKoreaKuwaitLaosLatin AmericaLatviaLebanonLiberiaLithuaniaMalaysiaMexicoMiddle AfricaMoroccoNepalNetherlandsNigeriaNorth MacedoniaNorthern AfricaNorthern EuropeOceaniaPakistanPanamaPeruPhilippinesPolandRomaniaRussiaSaudi ArabiaScotlandSenegalSerbiaSierra LeoneSingaporeSomaliaSouth AfricaSouth AmericaSouth Central AsiaSouth Eastern AsiaSouthern EuropeSpainSri LankaSudanSwitzerlandSyriaTaiwanThailandTrinidad and TobagoTurkeyUgandaUkraineUruguayUzbekistanVenezuelaVietnamWestern AfricaWestern AsiaWestern EuropeZaireZimbabwe
Income
Income (Families)
Income (Households)
Poverty
Poverty (Families)
Unemployment
Employment Occupations
Employment Industries
Employer Class
Commute Time
Commute Means
School Enrollment
Education by Degree Field
Occupancy
Finances
Physical Characteristics
Columbus
Compare Zip Codes
Comparison Subject

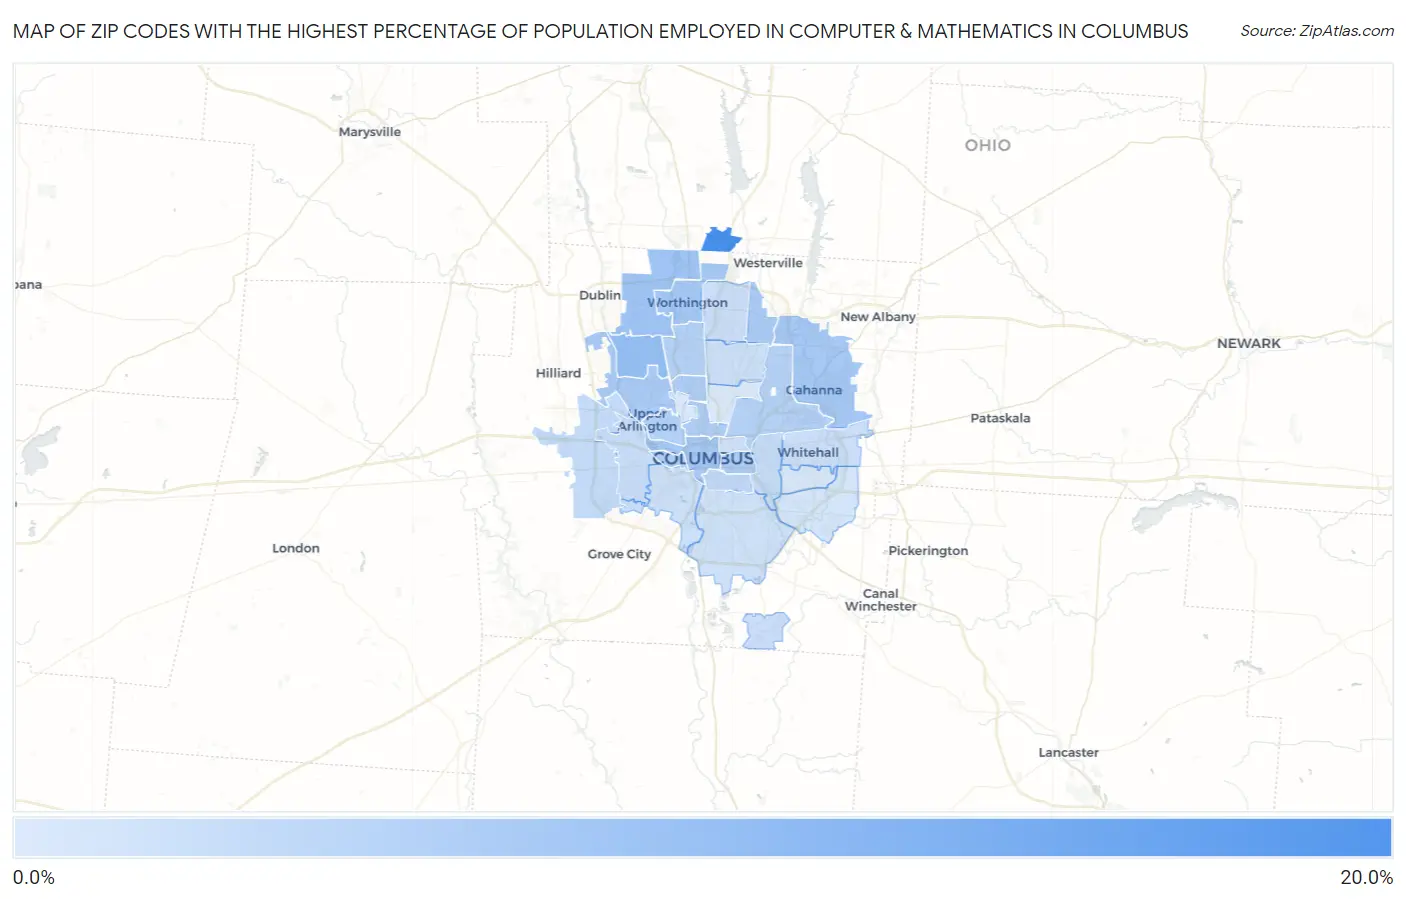
Map of Zip Codes with the Highest Percentage of Population Employed in Computer & Mathematics in Columbus

0.0%
20.0%
Zip Codes with the Highest Percentage of Population Employed in Computer & Mathematics in Columbus Map

Zip Codes with the Highest Percentage of Population Employed in Computer & Mathematics in Columbus, OH

Zip Code % Employed vs State vs National
1.4324016.0%3.0%(+12.9)#43.5%(+12.4)#220
2.432207.9%3.0%(+4.84)#193.5%(+4.35)#1,247
3.432356.9%3.0%(+3.83)#353.5%(+3.34)#1,700
4.430856.4%3.0%(+3.36)#473.5%(+2.87)#2,004
5.432306.2%3.0%(+3.19)#503.5%(+2.70)#2,131
6.432156.2%3.0%(+3.18)#513.5%(+2.69)#2,136
7.432316.0%3.0%(+2.93)#633.5%(+2.44)#2,347
8.432215.8%3.0%(+2.81)#683.5%(+2.32)#2,456
9.432225.5%3.0%(+2.47)#813.5%(+1.98)#2,785
10.432055.5%3.0%(+2.47)#823.5%(+1.97)#2,786
11.432015.5%3.0%(+2.45)#843.5%(+1.96)#2,802
12.432025.2%3.0%(+2.20)#933.5%(+1.71)#3,078
13.432124.9%3.0%(+1.90)#1053.5%(+1.41)#3,439
14.432144.7%3.0%(+1.69)#1193.5%(+1.19)#3,766
15.432194.7%3.0%(+1.68)#1203.5%(+1.19)#3,770
16.432063.6%3.0%(+0.579)#1983.5%(+0.088)#5,932
17.432283.4%3.0%(+0.332)#2273.5%(-0.159)#6,584
18.432093.1%3.0%(+0.112)#2493.5%(-0.379)#7,275
19.432043.1%3.0%(+0.068)#2533.5%(-0.423)#7,404
20.432292.8%3.0%(-0.186)#2813.5%(-0.677)#8,285
21.432132.8%3.0%(-0.216)#2833.5%(-0.707)#8,381
22.432172.8%3.0%(-0.218)#2853.5%(-0.709)#8,393
23.432232.6%3.0%(-0.437)#3223.5%(-0.929)#9,229
24.432242.5%3.0%(-0.513)#3393.5%(-1.00)#9,553
25.432032.4%3.0%(-0.659)#3623.5%(-1.15)#10,134
26.432072.3%3.0%(-0.708)#3673.5%(-1.20)#10,346
27.432322.0%3.0%(-1.04)#4333.5%(-1.53)#11,828
28.432271.5%3.0%(-1.52)#5323.5%(-2.01)#14,261
29.432101.3%3.0%(-1.70)#5793.5%(-2.19)#15,342
30.432111.1%3.0%(-1.97)#6463.5%(-2.46)#16,980

Common Questions

What are the Top 10 Zip Codes with the Highest Percentage of Population Employed in Computer & Mathematics in Columbus, OH?
Top 10 Zip Codes with the Highest Percentage of Population Employed in Computer & Mathematics in Columbus, OH are:
#1
16.0%
#2
7.9%
#3
6.9%
#4
6.4%
#5
6.2%
#6
6.2%
#7
6.0%
#8
5.8%
#9
5.5%
#10
5.5%
What zip code has the Highest Percentage of Population Employed in Computer & Mathematics in Columbus, OH?
43240 has the Highest Percentage of Population Employed in Computer & Mathematics in Columbus, OH with 16.0%.
What is the Percentage of Population Employed in Computer & Mathematics in Columbus, OH?
Percentage of Population Employed in Computer & Mathematics in Columbus is 5.2%.
What is the Percentage of Population Employed in Computer & Mathematics in Ohio?
Percentage of Population Employed in Computer & Mathematics in Ohio is 3.0%.
What is the Percentage of Population Employed in Computer & Mathematics in the United States?
Percentage of Population Employed in Computer & Mathematics in the United States is 3.5%.