Zip Codes with the Highest Percentage of Population with a Degree in Liberal Arts and History in Columbus, OH

RELATED REPORTS & OPTIONS

Liberal Arts and History
Population
Families and Households
Female Fertility
Female Fertility (Unmarried)
Race (Community Size)
Race (Percentage)
Ancestry (Community Size)
AfghanAfricanAlbanianAlsatianAmericanApacheArabArgentineanArmenianAustralianAustrianBahamianBangladeshiBarbadianBasqueBelgianBelizeanBhutaneseBlackfeetBolivianBrazilianBritishBritish West IndianBulgarianBurmeseCambodianCanadianCape VerdeanCarpatho RusynCelticCentral AmericanCentral American IndianCherokeeChileanChippewaChoctawColombianCosta RicanCreeCreekCroatianCrowCubanCzechCzechoslovakianDanishDelawareDominicanDutchDutch West IndianEastern EuropeanEcuadorianEgyptianEnglishEstonianEthiopianEuropeanFilipinoFinnishFrenchFrench American IndianFrench CanadianGermanGerman RussianGhanaianGreekGuamanian / ChamorroGuatemalanGuyaneseHaitianHonduranHungarianIcelanderIndian (Asian)IndonesianInupiatIranianIraqiIrishIroquoisIsraeliItalianJamaicanJapaneseJordanianKenyanKoreanLaotianLatvianLebaneseLiberianLithuanianLumbeeLuxembourgerMacedonianMalaysianMalteseMexicanMexican American IndianMongolianMoroccanNative HawaiianNavajoNew ZealanderNicaraguanNigerianNorthern EuropeanNorwegianPakistaniPalestinianPanamanianParaguayanPennsylvania GermanPeruvianPolishPortuguesePuerto RicanRomanianRussianSalvadoranSamoanScandinavianScotch-IrishScottishSeminoleSenegaleseSerbianSierra LeoneanSiouxSlavicSlovakSloveneSomaliSouth AfricanSouth AmericanSouth American IndianSpaniardSpanishSri LankanSubsaharan AfricanSudaneseSwedishSwissSyrianThaiTrinidadian and TobagonianTurkishUgandanUkrainianUruguayanVenezuelanVietnameseWelshWest IndianYaquiYugoslavianZimbabwean
Ancestry (Percentage)
AfghanAfricanAlbanianAlsatianAmericanApacheArabArgentineanArmenianAustralianAustrianBahamianBangladeshiBarbadianBasqueBelgianBelizeanBhutaneseBlackfeetBolivianBrazilianBritishBritish West IndianBulgarianBurmeseCambodianCanadianCape VerdeanCarpatho RusynCelticCentral AmericanCentral American IndianCherokeeChileanChippewaChoctawColombianCosta RicanCreeCreekCroatianCrowCubanCzechCzechoslovakianDanishDelawareDominicanDutchDutch West IndianEastern EuropeanEcuadorianEgyptianEnglishEstonianEthiopianEuropeanFilipinoFinnishFrenchFrench American IndianFrench CanadianGermanGerman RussianGhanaianGreekGuamanian / ChamorroGuatemalanGuyaneseHaitianHonduranHungarianIcelanderIndian (Asian)IndonesianInupiatIranianIraqiIrishIroquoisIsraeliItalianJamaicanJapaneseJordanianKenyanKoreanLaotianLatvianLebaneseLiberianLithuanianLumbeeLuxembourgerMacedonianMalaysianMalteseMexicanMexican American IndianMongolianMoroccanNative HawaiianNavajoNew ZealanderNicaraguanNigerianNorthern EuropeanNorwegianPakistaniPalestinianPanamanianParaguayanPennsylvania GermanPeruvianPolishPortuguesePuerto RicanRomanianRussianSalvadoranSamoanScandinavianScotch-IrishScottishSeminoleSenegaleseSerbianSierra LeoneanSiouxSlavicSlovakSloveneSomaliSouth AfricanSouth AmericanSouth American IndianSpaniardSpanishSri LankanSubsaharan AfricanSudaneseSwedishSwissSyrianThaiTrinidadian and TobagonianTurkishUgandanUkrainianUruguayanVenezuelanVietnameseWelshWest IndianYaquiYugoslavianZimbabwean
Immigrant Origin (Total)
AfghanistanAfricaAlbaniaArgentinaArmeniaAsiaAustraliaBahamasBangladeshBarbadosBelarusBelgiumBelizeBosnia and HerzegovinaBrazilBulgariaBurma / MyanmarCambodiaCameroonCanadaCaribbeanCentral AmericaChileChinaColombiaCongoCosta RicaCubaCzechoslovakiaDominican RepublicEastern AfricaEastern AsiaEastern EuropeEcuadorEgyptEl SalvadorEnglandEritreaEthiopiaEuropeFranceGermanyGhanaGreeceGuatemalaGuyanaHaitiHondurasHong KongHungaryIndiaIndonesiaIranIraqIrelandIsraelItalyJamaicaJapanJordanKazakhstanKenyaKoreaKuwaitLaosLatin AmericaLatviaLebanonLiberiaLithuaniaMalaysiaMexicoMiddle AfricaMoroccoNepalNetherlandsNigeriaNorth MacedoniaNorthern AfricaNorthern EuropeOceaniaPakistanPanamaPeruPhilippinesPolandRomaniaRussiaSaudi ArabiaScotlandSenegalSerbiaSierra LeoneSingaporeSomaliaSouth AfricaSouth AmericaSouth Central AsiaSouth Eastern AsiaSouthern EuropeSpainSri LankaSudanSwitzerlandSyriaTaiwanThailandTrinidad and TobagoTurkeyUgandaUkraineUruguayUzbekistanVenezuelaVietnamWestern AfricaWestern AsiaWestern EuropeZaireZimbabwe
Immigrant Origin (Percentage)
AfghanistanAfricaAlbaniaArgentinaArmeniaAsiaAustraliaBahamasBangladeshBarbadosBelarusBelgiumBelizeBosnia and HerzegovinaBrazilBulgariaBurma / MyanmarCambodiaCameroonCanadaCaribbeanCentral AmericaChileChinaColombiaCongoCosta RicaCubaCzechoslovakiaDominican RepublicEastern AfricaEastern AsiaEastern EuropeEcuadorEgyptEl SalvadorEnglandEritreaEthiopiaEuropeFranceGermanyGhanaGreeceGuatemalaGuyanaHaitiHondurasHong KongHungaryIndiaIndonesiaIranIraqIrelandIsraelItalyJamaicaJapanJordanKazakhstanKenyaKoreaKuwaitLaosLatin AmericaLatviaLebanonLiberiaLithuaniaMalaysiaMexicoMiddle AfricaMoroccoNepalNetherlandsNigeriaNorth MacedoniaNorthern AfricaNorthern EuropeOceaniaPakistanPanamaPeruPhilippinesPolandRomaniaRussiaSaudi ArabiaScotlandSenegalSerbiaSierra LeoneSingaporeSomaliaSouth AfricaSouth AmericaSouth Central AsiaSouth Eastern AsiaSouthern EuropeSpainSri LankaSudanSwitzerlandSyriaTaiwanThailandTrinidad and TobagoTurkeyUgandaUkraineUruguayUzbekistanVenezuelaVietnamWestern AfricaWestern AsiaWestern EuropeZaireZimbabwe
Income
Income (Families)
Income (Households)
Poverty
Poverty (Families)
Unemployment
Employment Occupations
Employment Industries
Employer Class
Commute Time
Commute Means
School Enrollment
Education by Degree Field
Occupancy
Finances
Physical Characteristics
Columbus
Compare Zip Codes
Comparison Subject

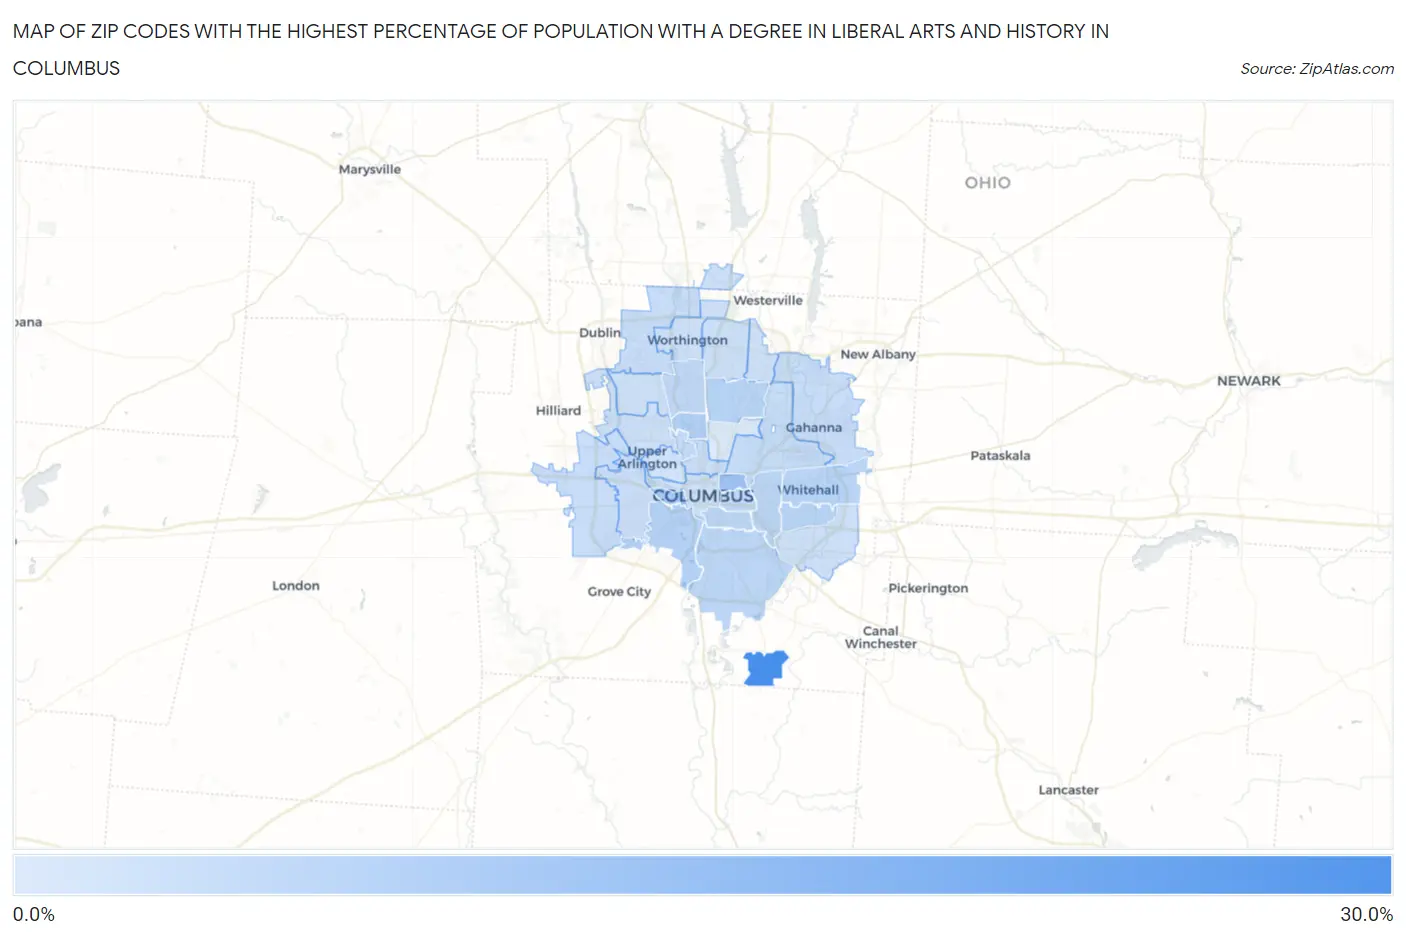
Map of Zip Codes with the Highest Percentage of Population with a Degree in Liberal Arts and History in Columbus

0.0%
30.0%
Zip Codes with the Highest Percentage of Population with a Degree in Liberal Arts and History in Columbus Map

Zip Codes with the Highest Percentage of Population with a Degree in Liberal Arts and History in Columbus, OH

Zip Code % Graduates vs State vs National
1.4321726.0%4.2%(+21.8)#154.9%(+21.1)#538
2.4320310.5%4.2%(+6.30)#764.9%(+5.63)#2,817
3.432229.0%4.2%(+4.76)#1124.9%(+4.08)#3,899
4.432027.2%4.2%(+3.02)#1674.9%(+2.34)#6,017
5.432236.8%4.2%(+2.58)#1884.9%(+1.91)#6,784
6.432276.2%4.2%(+1.99)#2264.9%(+1.32)#8,039
7.432246.1%4.2%(+1.87)#2404.9%(+1.20)#8,336
8.432136.0%4.2%(+1.79)#2484.9%(+1.12)#8,540
9.432065.8%4.2%(+1.56)#2664.9%(+0.882)#9,153
10.432075.6%4.2%(+1.38)#2824.9%(+0.706)#9,626
11.432095.5%4.2%(+1.31)#2954.9%(+0.638)#9,845
12.432105.0%4.2%(+0.782)#3464.9%(+0.107)#11,411
13.432144.9%4.2%(+0.736)#3494.9%(+0.061)#11,545
14.432054.6%4.2%(+0.405)#3864.9%(-0.269)#12,637
15.432194.3%4.2%(+0.129)#4174.9%(-0.545)#13,547
16.432303.9%4.2%(-0.326)#4704.9%(-1.00)#15,263
17.432283.9%4.2%(-0.339)#4724.9%(-1.01)#15,295
18.432353.8%4.2%(-0.386)#4764.9%(-1.06)#15,476
19.432013.7%4.2%(-0.529)#4964.9%(-1.20)#16,006
20.432043.4%4.2%(-0.828)#5494.9%(-1.50)#17,076
21.432293.3%4.2%(-0.946)#5654.9%(-1.62)#17,464
22.432323.2%4.2%(-0.972)#5724.9%(-1.65)#17,560
23.432403.2%4.2%(-1.02)#5804.9%(-1.69)#17,724
24.432213.1%4.2%(-1.14)#5984.9%(-1.82)#18,143
25.432203.0%4.2%(-1.21)#6074.9%(-1.89)#18,403
26.430853.0%4.2%(-1.24)#6114.9%(-1.92)#18,522
27.432152.9%4.2%(-1.27)#6154.9%(-1.94)#18,603
28.432312.8%4.2%(-1.39)#6264.9%(-2.06)#18,979
29.432122.6%4.2%(-1.63)#6654.9%(-2.30)#19,749
30.432110.71%4.2%(-3.49)#8544.9%(-4.16)#23,807

Common Questions

What are the Top 10 Zip Codes with the Highest Percentage of Population with a Degree in Liberal Arts and History in Columbus, OH?
Top 10 Zip Codes with the Highest Percentage of Population with a Degree in Liberal Arts and History in Columbus, OH are:
#1
26.0%
#2
10.5%
#3
9.0%
#4
7.2%
#5
6.8%
#6
6.2%
#7
6.1%
#8
6.0%
#9
5.8%
#10
5.6%
What zip code has the Highest Percentage of Population with a Degree in Liberal Arts and History in Columbus, OH?
43217 has the Highest Percentage of Population with a Degree in Liberal Arts and History in Columbus, OH with 26.0%.
What is the Percentage of Population with a Degree in Liberal Arts and History in Columbus, OH?
Percentage of Population with a Degree in Liberal Arts and History in Columbus is 4.0%.
What is the Percentage of Population with a Degree in Liberal Arts and History in Ohio?
Percentage of Population with a Degree in Liberal Arts and History in Ohio is 4.2%.
What is the Percentage of Population with a Degree in Liberal Arts and History in the United States?
Percentage of Population with a Degree in Liberal Arts and History in the United States is 4.9%.