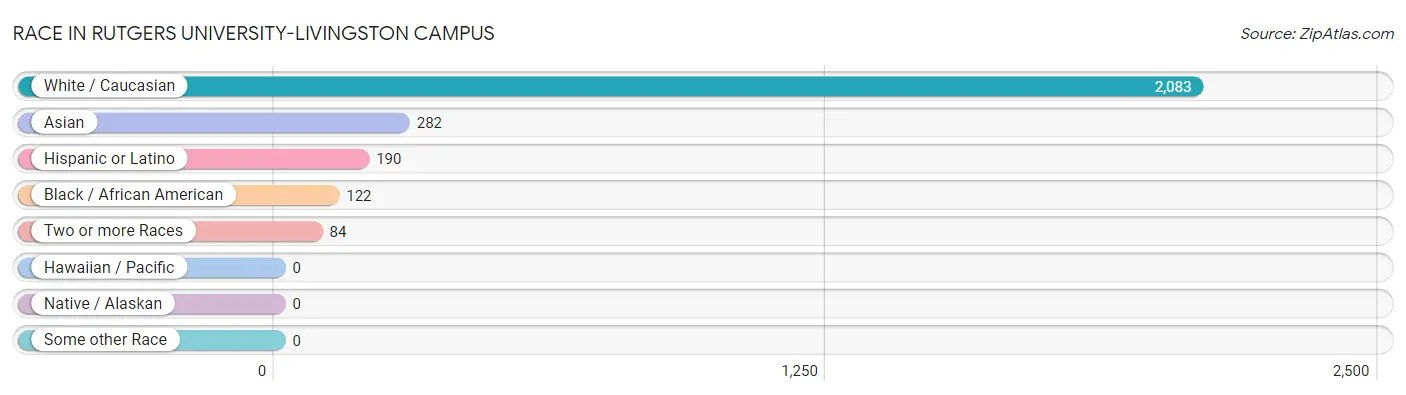
The most populous races in Rutgers University-Livingston Campus are White / Caucasian (2,083 | 81.0%), Asian (282 | 11.0%), and Hispanic or Latino (190 | 7.4%).
Race
# Population
% Population
Asian
282
11.0%
Black / African American
122
4.8%
Hawaiian / Pacific
0
0.0%
Hispanic or Latino
190
7.4%
Native / Alaskan
0
0.0%
White / Caucasian
2,083
81.0%
Two or more Races
84
3.3%
Some other Race
0
0.0%
Total
2,571
100.0%
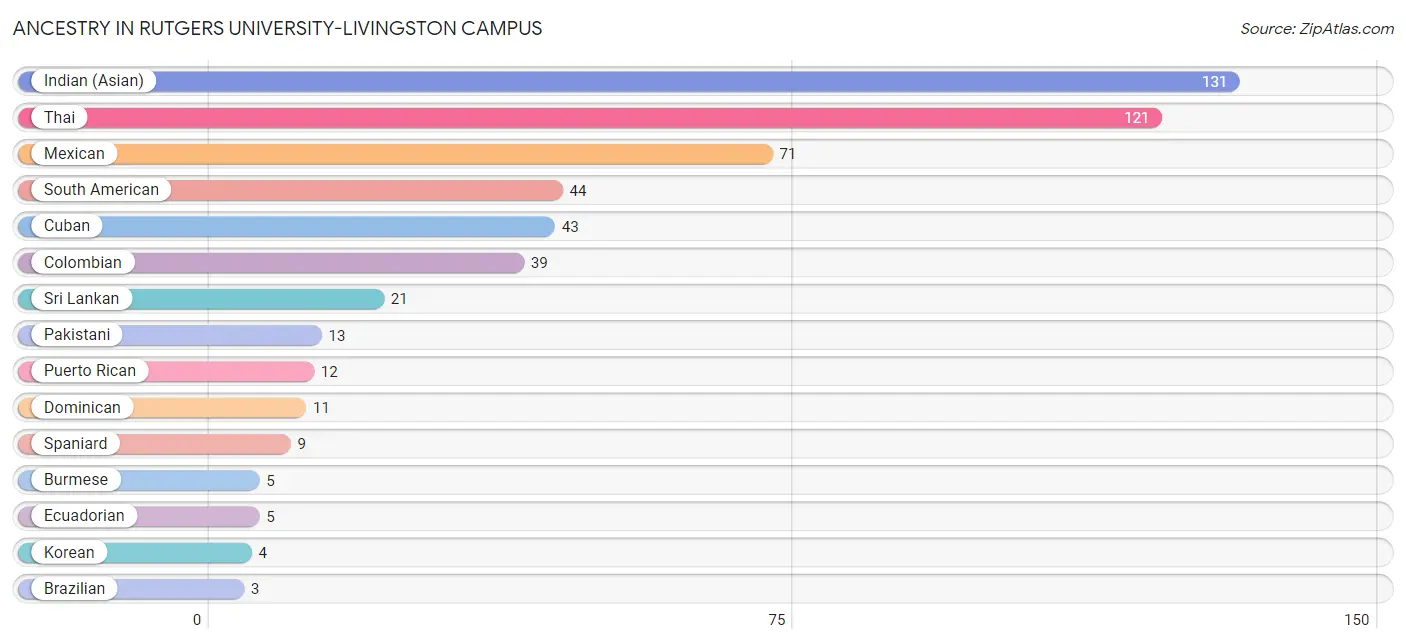
Ancestry in Rutgers University-Livingston Campus
The most populous ancestries reported in Rutgers University-Livingston Campus are Indian (Asian) (131 | 5.1%), Thai (121 | 4.7%), Mexican (71 | 2.8%), South American (44 | 1.7%), and Cuban (43 | 1.7%), together accounting for 15.9% of all Rutgers University-Livingston Campus residents.
Ancestry
# Population
% Population
Brazilian
3
0.1%
Burmese
5
0.2%
Colombian
39
1.5%
Cuban
43
1.7%
Dominican
11
0.4%
Ecuadorian
5
0.2%
Indian (Asian)
131
5.1%
Korean
4
0.2%
Mexican
71
2.8%
Pakistani
13
0.5%
Puerto Rican
12
0.5%
South American
44
1.7%
Spaniard
9
0.4%
Sri Lankan
21
0.8%
Thai
121
4.7%
View All 15 Rows
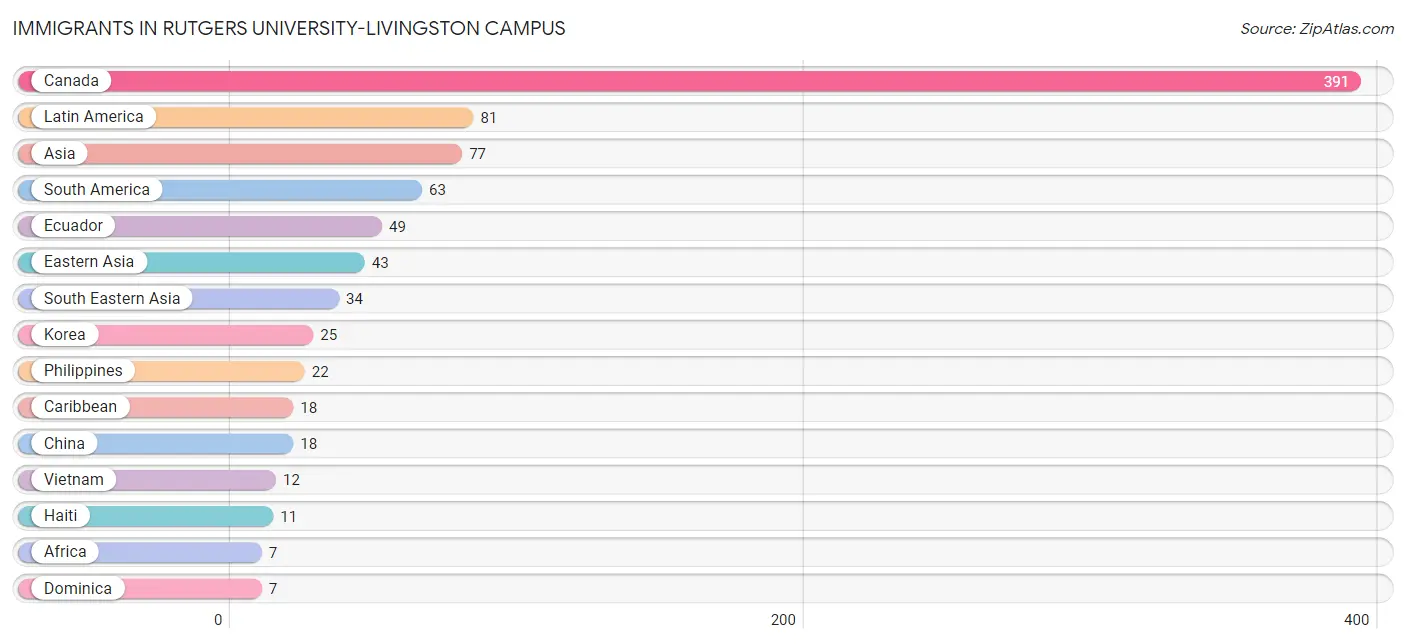
Immigrants in Rutgers University-Livingston Campus
The most numerous immigrant groups reported in Rutgers University-Livingston Campus came from Canada (391 | 15.2%), Latin America (81 | 3.2%), Asia (77 | 3.0%), South America (63 | 2.5%), and Ecuador (49 | 1.9%), together accounting for 25.7% of all Rutgers University-Livingston Campus residents.
Immigration Origin
# Population
% Population
Africa
7
0.3%
Asia
77
3.0%
Canada
391
15.2%
Caribbean
18
0.7%
China
18
0.7%
Dominica
7
0.3%
Eastern Africa
5
0.2%
Eastern Asia
43
1.7%
Eastern Europe
7
0.3%
Ecuador
49
1.9%
Europe
7
0.3%
Ghana
2
0.1%
Haiti
11
0.4%
Korea
25
1.0%
Latin America
81
3.2%
Philippines
22
0.9%
Russia
7
0.3%
South America
63
2.5%
South Eastern Asia
34
1.3%
Vietnam
12
0.5%
Western Africa
2
0.1%
View All 21 Rows
Sex and Age in Rutgers University-Livingston Campus
Sex and Age in Rutgers University-Livingston Campus
The most populous age groups in Rutgers University-Livingston Campus are 15 to 19 Years (703 | 48.5%) for men and 15 to 19 Years (603 | 53.7%) for women.
Age Bracket
Male
Female
Under 5 Years
0 (0.0%)
0 (0.0%)
5 to 9 Years
0 (0.0%)
0 (0.0%)
10 to 14 Years
0 (0.0%)
0 (0.0%)
15 to 19 Years
703 (48.5%)
603 (53.7%)
20 to 24 Years
697 (48.1%)
516 (46.0%)
25 to 29 Years
33 (2.3%)
1 (0.1%)
30 to 34 Years
9 (0.6%)
0 (0.0%)
35 to 39 Years
6 (0.4%)
3 (0.3%)
40 to 44 Years
0 (0.0%)
0 (0.0%)
45 to 49 Years
0 (0.0%)
0 (0.0%)
50 to 54 Years
0 (0.0%)
0 (0.0%)
55 to 59 Years
0 (0.0%)
0 (0.0%)
60 to 64 Years
0 (0.0%)
0 (0.0%)
65 to 69 Years
0 (0.0%)
0 (0.0%)
70 to 74 Years
0 (0.0%)
0 (0.0%)
75 to 79 Years
0 (0.0%)
0 (0.0%)
80 to 84 Years
0 (0.0%)
0 (0.0%)
85 Years and over
0 (0.0%)
0 (0.0%)
Total
1,448 (100.0%)
1,123 (100.0%)
Families and Households in Rutgers University-Livingston Campus
Median Family Size in Rutgers University-Livingston Campus
Family Type
# Families
Family Size
Married-Couple
0 (0.0%)
-
Single Male/Father
0 (0.0%)
-
Single Female/Mother
0 (0.0%)
-
Total Families
0 (0.0%)
-
Median Household Size in Rutgers University-Livingston Campus
Household Type
# Households
Household Size
Married-Couple
0 (0.0%)
-
Single Male/Father
0 (0.0%)
-
Single Female/Mother
0 (0.0%)
-
Non-family
0 (0.0%)
-
Total Households
0 (0.0%)
-
Household Size by Marriage Status in Rutgers University-Livingston Campus
Household Size
Family Households
Nonfamily Households
1-Person Households
-
0 (0.0%)
2-Person Households
0 (0.0%)
0 (0.0%)
3-Person Households
0 (0.0%)
0 (0.0%)
4-Person Households
0 (0.0%)
0 (0.0%)
5-Person Households
0 (0.0%)
0 (0.0%)
6-Person Households
0 (0.0%)
0 (0.0%)
7+ Person Households
0 (0.0%)
0 (0.0%)
Total
0 (0.0%)
0 (0.0%)
Female Fertility in Rutgers University-Livingston Campus
Fertility by Age in Rutgers University-Livingston Campus
Age Bracket
Women with Births
Births / 1,000 Women
15 to 19 years
0 (0.0%)
0.0
20 to 34 years
0 (0.0%)
0.0
35 to 50 years
0 (0.0%)
0.0
Total
0 (0.0%)
0.0
Fertility by Age by Marriage Status in Rutgers University-Livingston Campus
Age Bracket
Married
Unmarried
15 to 19 years
0 (0.0%)
0 (0.0%)
20 to 34 years
0 (0.0%)
0 (0.0%)
35 to 50 years
0 (0.0%)
0 (0.0%)
Total
0 (0.0%)
0 (0.0%)
Fertility by Education in Rutgers University-Livingston Campus
Educational Attainment
Women with Births
Births / 1,000 Women
Less than High School
0 (0.0%)
0.0
High School Diploma
0 (0.0%)
0.0
College or Associate's Degree
0 (0.0%)
0.0
Bachelor's Degree
0 (0.0%)
0.0
Graduate Degree
0 (0.0%)
0.0
Total
0 (0.0%)
0.0
Fertility by Education by Marriage Status in Rutgers University-Livingston Campus
Educational Attainment
Married
Unmarried
Less than High School
0 (0.0%)
0 (0.0%)
High School Diploma
0 (0.0%)
0 (0.0%)
College or Associate's Degree
0 (0.0%)
0 (0.0%)
Bachelor's Degree
0 (0.0%)
0 (0.0%)
Graduate Degree
0 (0.0%)
0 (0.0%)
Total
0 (0.0%)
0 (0.0%)
Income in Rutgers University-Livingston Campus
Income Overview in Rutgers University-Livingston Campus
Characteristic
Number
Measure
Per Capita Income
2,571
$6,700
Median Family Income
0
$0
Mean Family Income
0
$0
Median Household Income
0
$0
Mean Household Income
0
$0
Income Deficit
0
$0
Wage / Income Gap (%)
2,571
0.00%
Wage / Income Gap ($)
2,571
100.00¢ per $1
Gini / Inequality Index
2,571
0.00
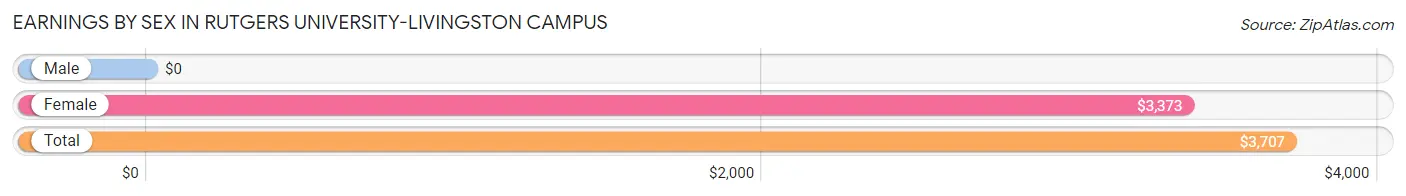
Earnings by Sex in Rutgers University-Livingston Campus
Sex
Number
Average Earnings
Male
1,226 (60.9%)
$0
Female
787 (39.1%)
$3,373
Total
2,013 (100.0%)
$3,707
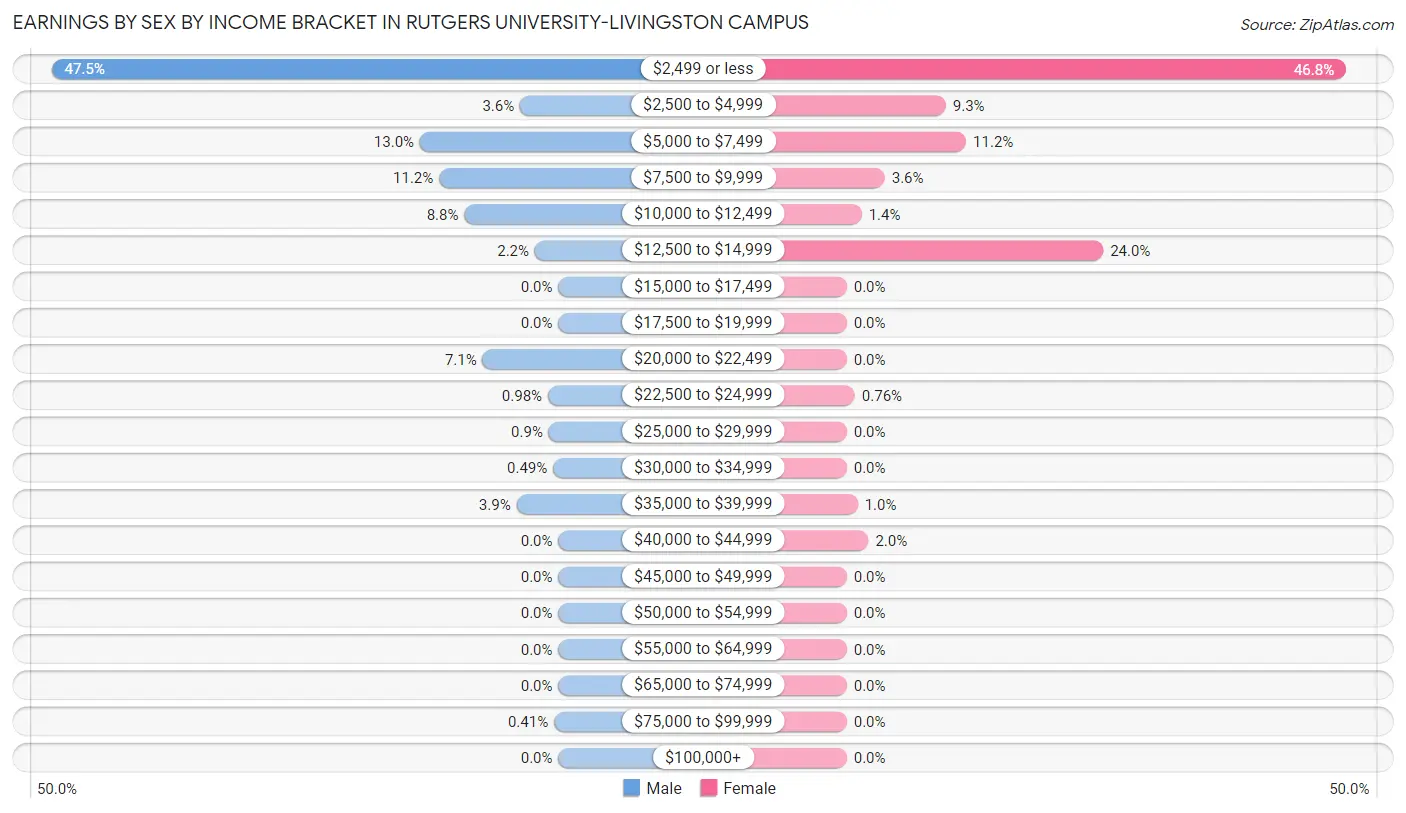
Earnings by Sex by Income Bracket in Rutgers University-Livingston Campus
The most common earnings brackets in Rutgers University-Livingston Campus are $2,499 or less for men (582 | 47.5%) and $2,499 or less for women (368 | 46.8%).
Income
Male
Female
$2,499 or less
582 (47.5%)
368 (46.8%)
$2,500 to $4,999
44 (3.6%)
73 (9.3%)
$5,000 to $7,499
159 (13.0%)
88 (11.2%)
$7,500 to $9,999
137 (11.2%)
28 (3.6%)
$10,000 to $12,499
108 (8.8%)
11 (1.4%)
$12,500 to $14,999
27 (2.2%)
189 (24.0%)
$15,000 to $17,499
0 (0.0%)
0 (0.0%)
$17,500 to $19,999
0 (0.0%)
0 (0.0%)
$20,000 to $22,499
87 (7.1%)
0 (0.0%)
$22,500 to $24,999
12 (1.0%)
6 (0.8%)
$25,000 to $29,999
11 (0.9%)
0 (0.0%)
$30,000 to $34,999
6 (0.5%)
0 (0.0%)
$35,000 to $39,999
48 (3.9%)
8 (1.0%)
$40,000 to $44,999
0 (0.0%)
16 (2.0%)
$45,000 to $49,999
0 (0.0%)
0 (0.0%)
$50,000 to $54,999
0 (0.0%)
0 (0.0%)
$55,000 to $64,999
0 (0.0%)
0 (0.0%)
$65,000 to $74,999
0 (0.0%)
0 (0.0%)
$75,000 to $99,999
5 (0.4%)
0 (0.0%)
$100,000+
0 (0.0%)
0 (0.0%)
Total
1,226 (100.0%)
787 (100.0%)
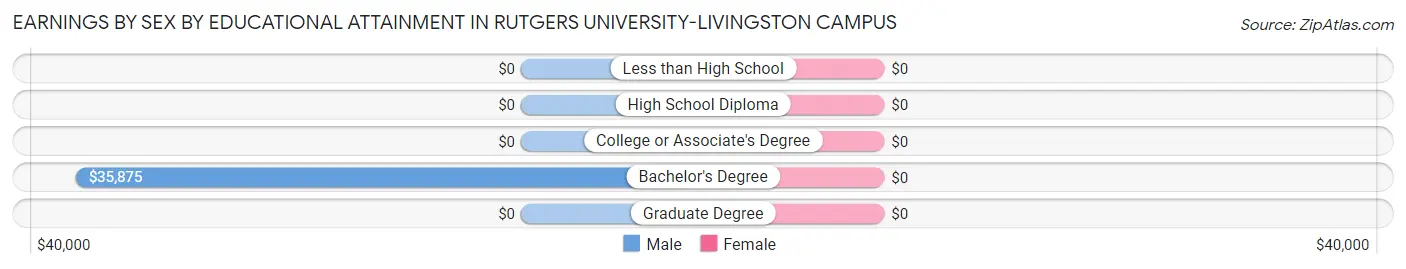
Earnings by Sex by Educational Attainment in Rutgers University-Livingston Campus
Educational Attainment
Male Income
Female Income
Less than High School
-
-
High School Diploma
-
-
College or Associate's Degree
-
-
Bachelor's Degree
$35,875
$0
Graduate Degree
-
-
Total
$35,938
$0
Family Income in Rutgers University-Livingston Campus
Family Income Brackets in Rutgers University-Livingston Campus
Income Bracket
# Families
% Families
Less than $10,000
0
0.0%
$10,000 to $14,999
0
0.0%
$15,000 to $24,999
0
0.0%
$25,000 to $34,999
0
0.0%
$35,000 to $49,999
0
0.0%
$50,000 to $74,999
0
0.0%
$75,000 to $99,999
0
0.0%
$100,000 to $149,999
0
0.0%
$150,000 to $199,999
0
0.0%
$200,000+
0
0.0%
Family Income by Famaliy Size in Rutgers University-Livingston Campus
Income Bracket
# Families
Median Income
2-Person Families
0 (0.0%)
$0
3-Person Families
0 (0.0%)
$0
4-Person Families
0 (0.0%)
$0
5-Person Families
0 (0.0%)
$0
6-Person Families
0 (0.0%)
$0
7+ Person Families
0 (0.0%)
$0
Total
0 (0.0%)
$0
Family Income by Number of Earners in Rutgers University-Livingston Campus
Number of Earners
# Families
Median Income
No Earners
0 (0.0%)
$0
1 Earner
0 (0.0%)
$0
2 Earners
0 (0.0%)
$0
3+ Earners
0 (0.0%)
$0
Total
0 (0.0%)
$0
Household Income in Rutgers University-Livingston Campus
Household Income Brackets in Rutgers University-Livingston Campus
Income Bracket
# Households
% Households
Less than $10,000
0
0.0%
$10,000 to $14,999
0
0.0%
$15,000 to $24,999
0
0.0%
$25,000 to $34,999
0
0.0%
$35,000 to $49,999
0
0.0%
$50,000 to $74,999
0
0.0%
$75,000 to $99,999
0
0.0%
$100,000 to $149,999
0
0.0%
$150,000 to $199,999
0
0.0%
$200,000+
0
0.0%
Household Income by Householder Age in Rutgers University-Livingston Campus
Income Bracket
# Households
Median Income
15 to 24 Years
0 (0.0%)
$0
25 to 44 Years
0 (0.0%)
$0
45 to 64 Years
0 (0.0%)
$0
65+ Years
0 (0.0%)
$0
Total
0 (0.0%)
$0
Poverty in Rutgers University-Livingston Campus
Income Below Poverty by Sex and Age in Rutgers University-Livingston Campus
Age Bracket
Male
Female
Under 5 Years
0 (0.0%)
0 (0.0%)
5 Years
0 (0.0%)
0 (0.0%)
6 to 11 Years
0 (0.0%)
0 (0.0%)
12 to 14 Years
0 (0.0%)
0 (0.0%)
15 Years
0 (0.0%)
0 (0.0%)
16 and 17 Years
0 (0.0%)
0 (0.0%)
18 to 24 Years
0 (0.0%)
0 (0.0%)
25 to 34 Years
0 (0.0%)
0 (0.0%)
35 to 44 Years
0 (0.0%)
0 (0.0%)
45 to 54 Years
0 (0.0%)
0 (0.0%)
55 to 64 Years
0 (0.0%)
0 (0.0%)
65 to 74 Years
0 (0.0%)
0 (0.0%)
75 Years and over
0 (0.0%)
0 (0.0%)
Total
0 (0.0%)
0 (0.0%)
Income Above Poverty by Sex and Age in Rutgers University-Livingston Campus
Age Bracket
Male
Female
Under 5 Years
0 (0.0%)
0 (0.0%)
5 Years
0 (0.0%)
0 (0.0%)
6 to 11 Years
0 (0.0%)
0 (0.0%)
12 to 14 Years
0 (0.0%)
0 (0.0%)
15 Years
0 (0.0%)
0 (0.0%)
16 and 17 Years
0 (0.0%)
0 (0.0%)
18 to 24 Years
0 (0.0%)
0 (0.0%)
25 to 34 Years
0 (0.0%)
0 (0.0%)
35 to 44 Years
0 (0.0%)
0 (0.0%)
45 to 54 Years
0 (0.0%)
0 (0.0%)
55 to 64 Years
0 (0.0%)
0 (0.0%)
65 to 74 Years
0 (0.0%)
0 (0.0%)
75 Years and over
0 (0.0%)
0 (0.0%)
Total
0 (0.0%)
0 (0.0%)
Income Below Poverty Among Married-Couple Families in Rutgers University-Livingston Campus
Children
Above Poverty
Below Poverty
No Children
0 (0.0%)
0 (0.0%)
1 or 2 Children
0 (0.0%)
0 (0.0%)
3 or 4 Children
0 (0.0%)
0 (0.0%)
5 or more Children
0 (0.0%)
0 (0.0%)
Total
0 (0.0%)
0 (0.0%)
Income Below Poverty Among Single-Parent Households in Rutgers University-Livingston Campus
Children
Single Father
Single Mother
No Children
0 (0.0%)
0 (0.0%)
1 or 2 Children
0 (0.0%)
0 (0.0%)
3 or 4 Children
0 (0.0%)
0 (0.0%)
5 or more Children
0 (0.0%)
0 (0.0%)
Total
0 (0.0%)
0 (0.0%)
Income Below Poverty Among Married-Couple vs Single-Parent Households in Rutgers University-Livingston Campus
Children
Married-Couple Families
Single-Parent Households
No Children
0 (0.0%)
0 (0.0%)
1 or 2 Children
0 (0.0%)
0 (0.0%)
3 or 4 Children
0 (0.0%)
0 (0.0%)
5 or more Children
0 (0.0%)
0 (0.0%)
Total
0 (0.0%)
0 (0.0%)
Employment Characteristics in Rutgers University-Livingston Campus
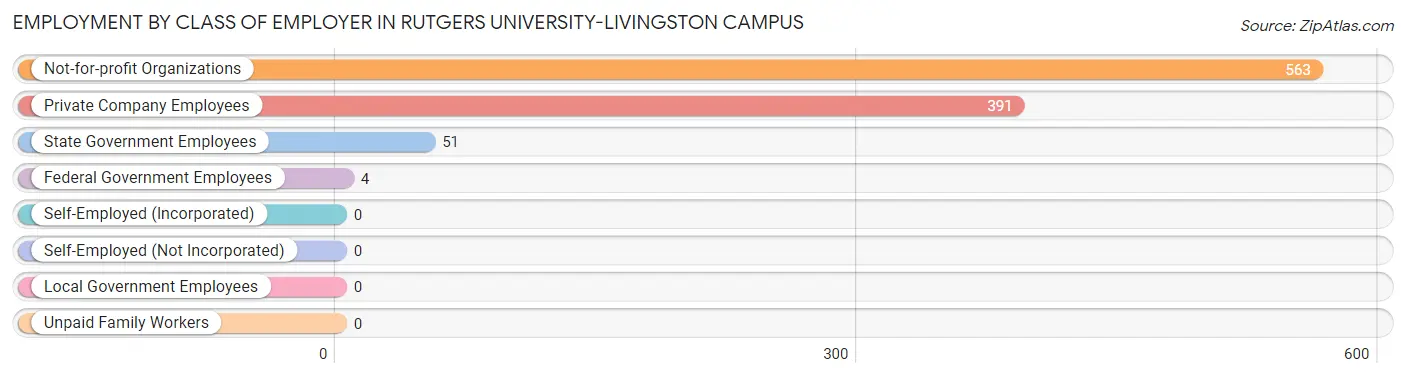
Employment by Class of Employer in Rutgers University-Livingston Campus
Among the 1,009 employed individuals in Rutgers University-Livingston Campus, not-for-profit organizations (563 | 55.8%), private company employees (391 | 38.8%), and state government employees (51 | 5.1%) make up the most common classes of employment.
Employer Class
# Employees
% Employees
Private Company Employees
391
38.8%
Self-Employed (Incorporated)
0
0.0%
Self-Employed (Not Incorporated)
0
0.0%
Not-for-profit Organizations
563
55.8%
Local Government Employees
0
0.0%
State Government Employees
51
5.1%
Federal Government Employees
4
0.4%
Unpaid Family Workers
0
0.0%
Total
1,009
100.0%
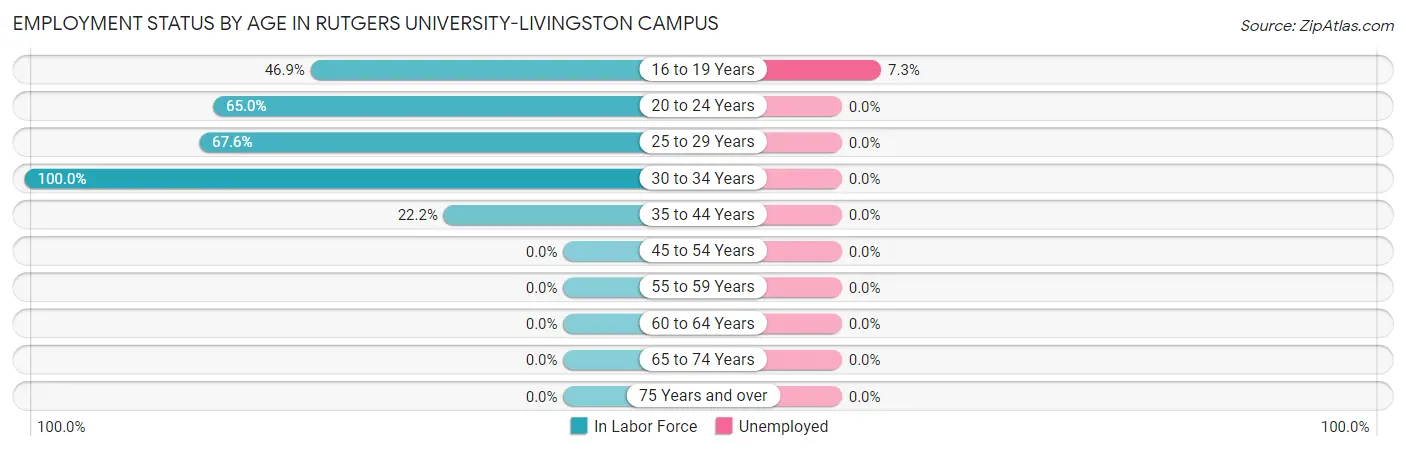
Employment Status by Age in Rutgers University-Livingston Campus
According to the labor force statistics for Rutgers University-Livingston Campus, out of the total population over 16 years of age (2,571), 55.8% or 1,435 individuals are in the labor force, with 3.1% or 44 of them unemployed. The age group with the highest labor force participation rate is 30 to 34 years, with 100.0% or 9 individuals in the labor force. Within the labor force, the 16 to 19 years age range has the highest percentage of unemployed individuals, with 7.3% or 45 of them being unemployed.
Age Bracket
In Labor Force
Unemployed
16 to 19 Years
613 (46.9%)
45 (7.3%)
20 to 24 Years
788 (65.0%)
0 (0.0%)
25 to 29 Years
23 (67.6%)
0 (0.0%)
30 to 34 Years
9 (100.0%)
0 (0.0%)
35 to 44 Years
2 (22.2%)
0 (0.0%)
45 to 54 Years
0 (0.0%)
0 (0.0%)
55 to 59 Years
0 (0.0%)
0 (0.0%)
60 to 64 Years
0 (0.0%)
0 (0.0%)
65 to 74 Years
0 (0.0%)
0 (0.0%)
75 Years and over
0 (0.0%)
0 (0.0%)
Total
1,435 (55.8%)
44 (3.1%)
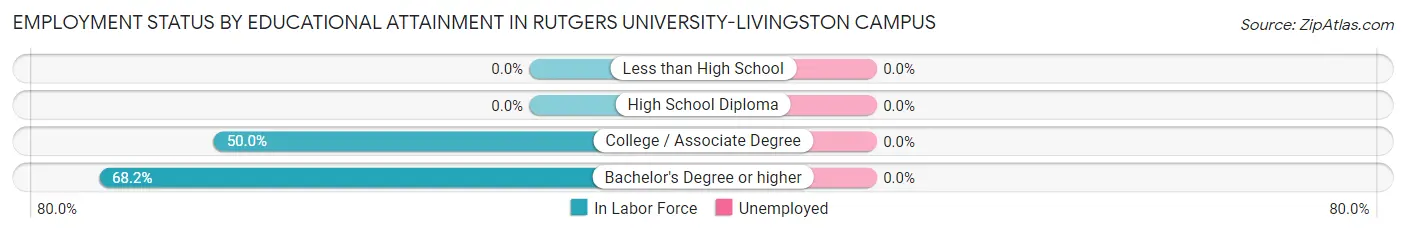
Employment Status by Educational Attainment in Rutgers University-Livingston Campus
Educational Attainment
In Labor Force
Unemployed
Less than High School
0 (0.0%)
0 (0.0%)
High School Diploma
0 (0.0%)
0 (0.0%)
College / Associate Degree
4 (50.0%)
0 (0.0%)
Bachelor's Degree or higher
30 (68.2%)
0 (0.0%)
Total
34 (65.4%)
0 (0.0%)
Employment Occupations by Sex in Rutgers University-Livingston Campus
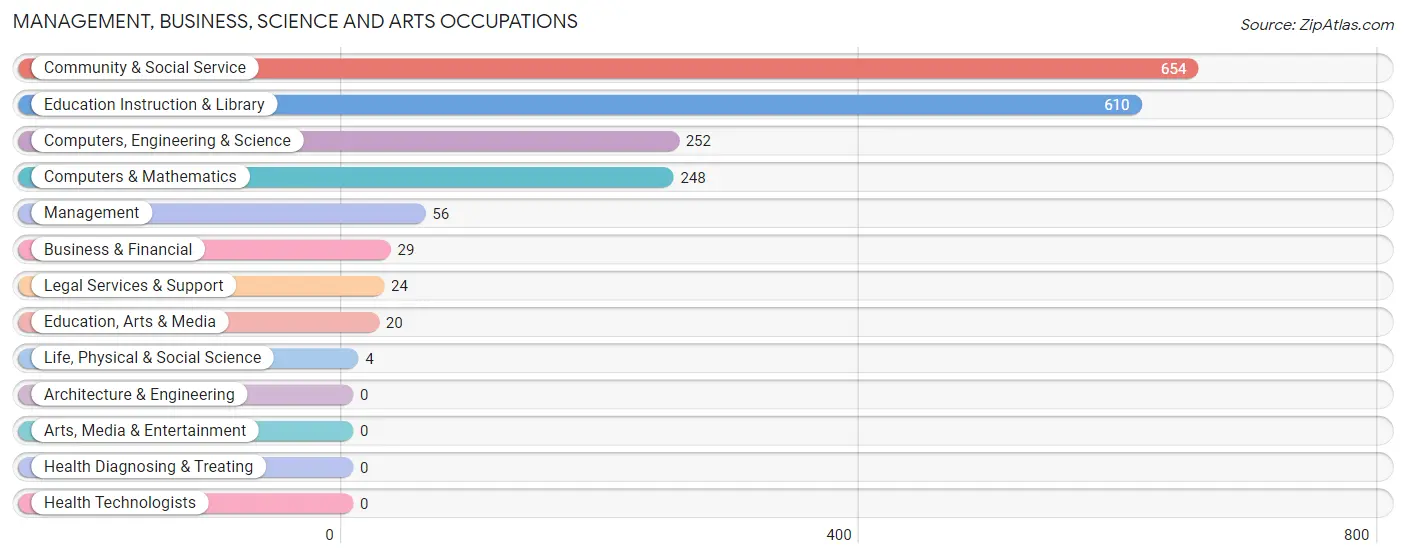
Management, Business, Science and Arts Occupations
The most common Management, Business, Science and Arts occupations in Rutgers University-Livingston Campus are Community & Social Service (654 | 47.0%), Education Instruction & Library (610 | 43.9%), Computers, Engineering & Science (252 | 18.1%), Computers & Mathematics (248 | 17.8%), and Management (56 | 4.0%).
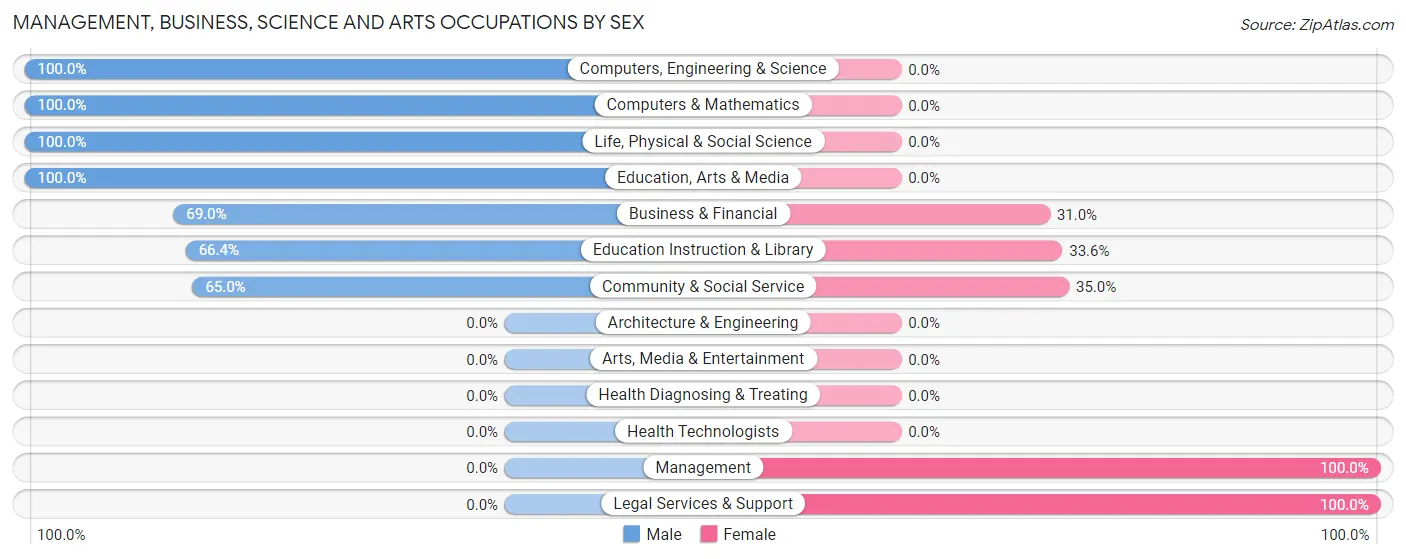
Management, Business, Science and Arts Occupations by Sex
Within the Management, Business, Science and Arts occupations in Rutgers University-Livingston Campus, the most male-oriented occupations are Computers, Engineering & Science (100.0%), Computers & Mathematics (100.0%), and Life, Physical & Social Science (100.0%), while the most female-oriented occupations are Management (100.0%), Legal Services & Support (100.0%), and Community & Social Service (35.0%).
Occupation
Male
Female
Management
0 (0.0%)
56 (100.0%)
Business & Financial
20 (69.0%)
9 (31.0%)
Computers, Engineering & Science
252 (100.0%)
0 (0.0%)
Computers & Mathematics
248 (100.0%)
0 (0.0%)
Architecture & Engineering
0 (0.0%)
0 (0.0%)
Life, Physical & Social Science
4 (100.0%)
0 (0.0%)
Community & Social Service
425 (65.0%)
229 (35.0%)
Education, Arts & Media
20 (100.0%)
0 (0.0%)
Legal Services & Support
0 (0.0%)
24 (100.0%)
Education Instruction & Library
405 (66.4%)
205 (33.6%)
Arts, Media & Entertainment
0 (0.0%)
0 (0.0%)
Health Diagnosing & Treating
0 (0.0%)
0 (0.0%)
Health Technologists
0 (0.0%)
0 (0.0%)
Total (Category)
697 (70.3%)
294 (29.7%)
Total (Overall)
1,015 (73.0%)
375 (27.0%)
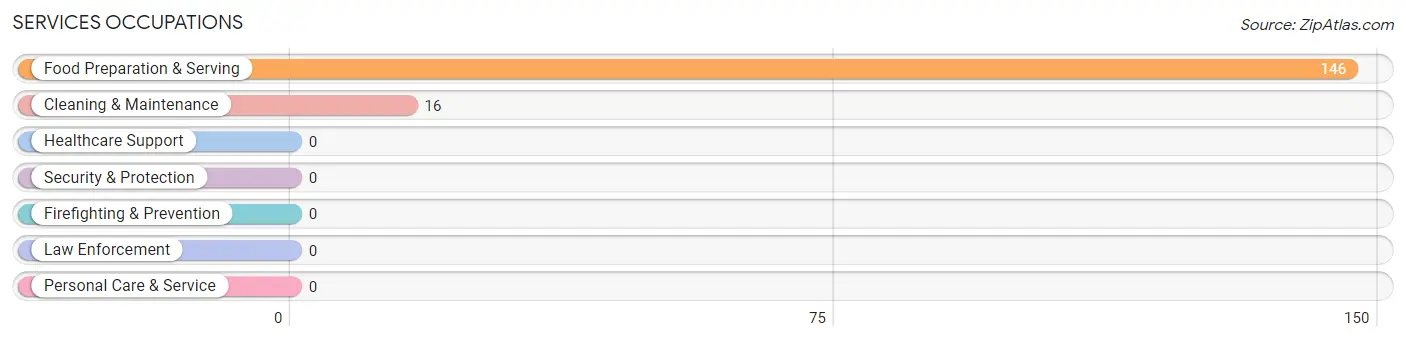
Services Occupations
The most common Services occupations in Rutgers University-Livingston Campus are Food Preparation & Serving (146 | 10.5%), and Cleaning & Maintenance (16 | 1.1%).
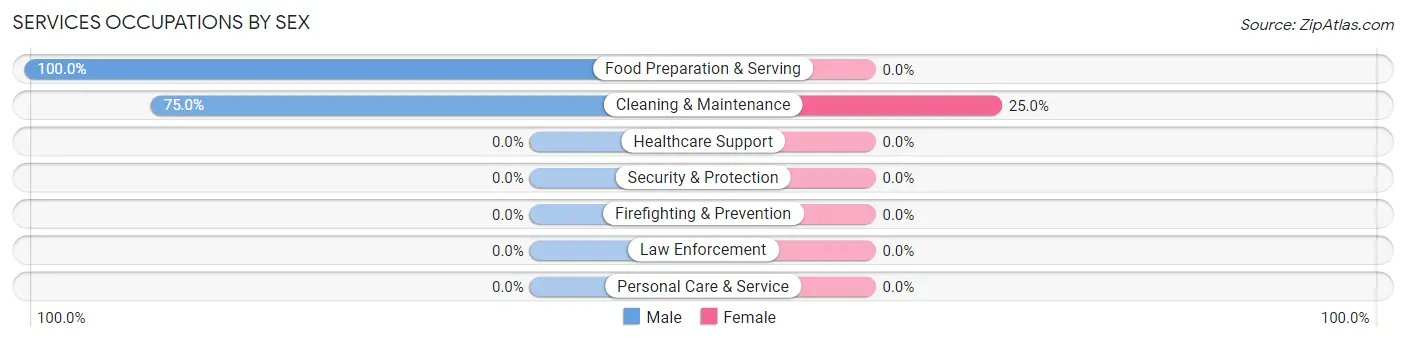
Services Occupations by Sex
Occupation
Male
Female
Healthcare Support
0 (0.0%)
0 (0.0%)
Security & Protection
0 (0.0%)
0 (0.0%)
Firefighting & Prevention
0 (0.0%)
0 (0.0%)
Law Enforcement
0 (0.0%)
0 (0.0%)
Food Preparation & Serving
146 (100.0%)
0 (0.0%)
Cleaning & Maintenance
12 (75.0%)
4 (25.0%)
Personal Care & Service
0 (0.0%)
0 (0.0%)
Total (Category)
158 (97.5%)
4 (2.5%)
Total (Overall)
1,015 (73.0%)
375 (27.0%)
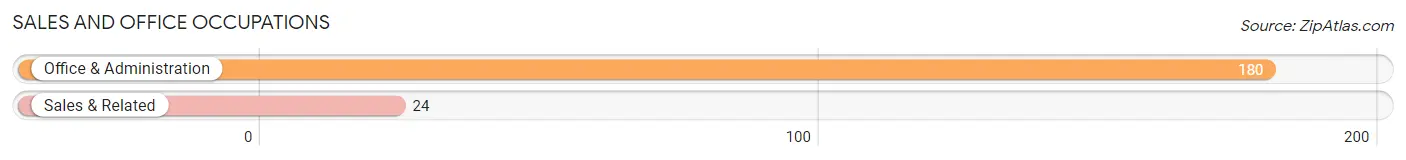
Sales and Office Occupations
The most common Sales and Office occupations in Rutgers University-Livingston Campus are Office & Administration (180 | 13.0%), and Sales & Related (24 | 1.7%).
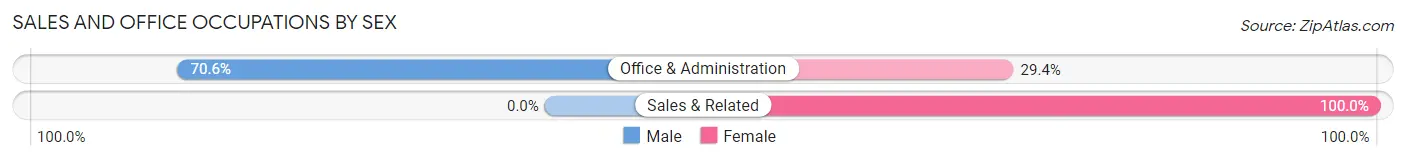
Sales and Office Occupations by Sex
Occupation
Male
Female
Sales & Related
0 (0.0%)
24 (100.0%)
Office & Administration
127 (70.6%)
53 (29.4%)
Total (Category)
127 (62.3%)
77 (37.8%)
Total (Overall)
1,015 (73.0%)
375 (27.0%)
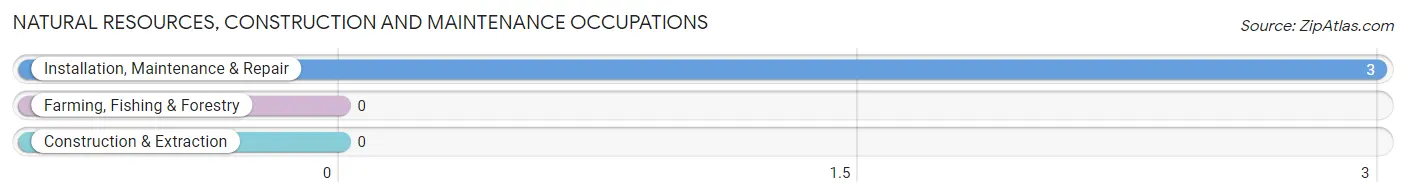
Natural Resources, Construction and Maintenance Occupations
The most common Natural Resources, Construction and Maintenance occupations in Rutgers University-Livingston Campus are , and Installation, Maintenance & Repair (3 | 0.2%).
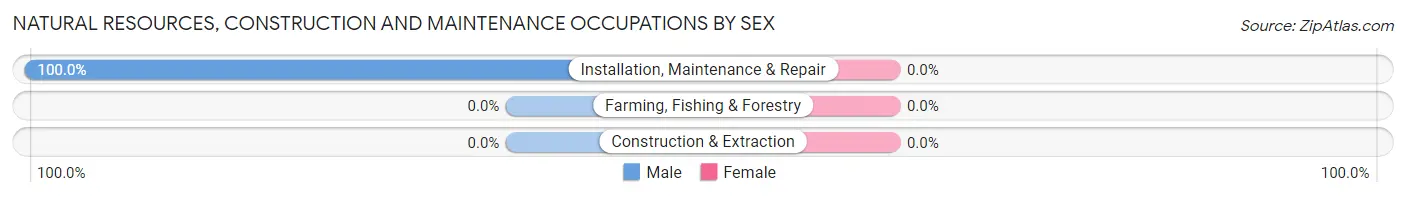
Natural Resources, Construction and Maintenance Occupations by Sex
Occupation
Male
Female
Farming, Fishing & Forestry
0 (0.0%)
0 (0.0%)
Construction & Extraction
0 (0.0%)
0 (0.0%)
Installation, Maintenance & Repair
3 (100.0%)
0 (0.0%)
Total (Category)
3 (100.0%)
0 (0.0%)
Total (Overall)
1,015 (73.0%)
375 (27.0%)
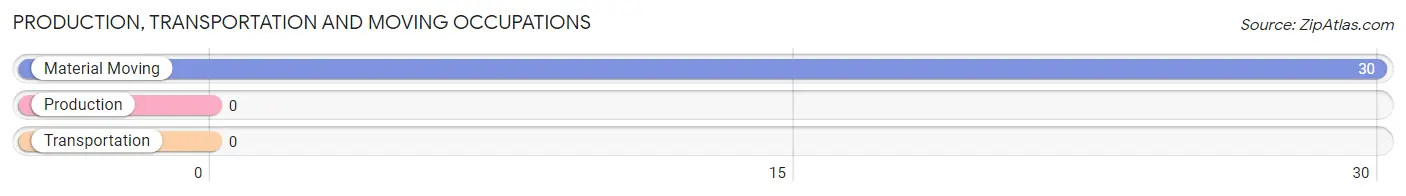
Production, Transportation and Moving Occupations
The most common Production, Transportation and Moving occupations in Rutgers University-Livingston Campus are , and Material Moving (30 | 2.2%).
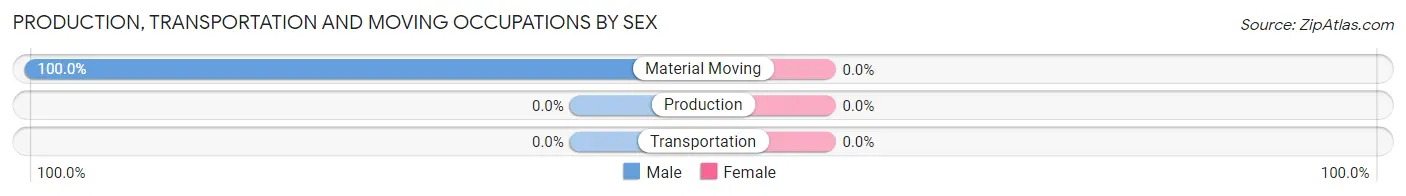
Production, Transportation and Moving Occupations by Sex
Occupation
Male
Female
Production
0 (0.0%)
0 (0.0%)
Transportation
0 (0.0%)
0 (0.0%)
Material Moving
30 (100.0%)
0 (0.0%)
Total (Category)
30 (100.0%)
0 (0.0%)
Total (Overall)
1,015 (73.0%)
375 (27.0%)
Employment Industries by Sex in Rutgers University-Livingston Campus
Employment Industries in Rutgers University-Livingston Campus
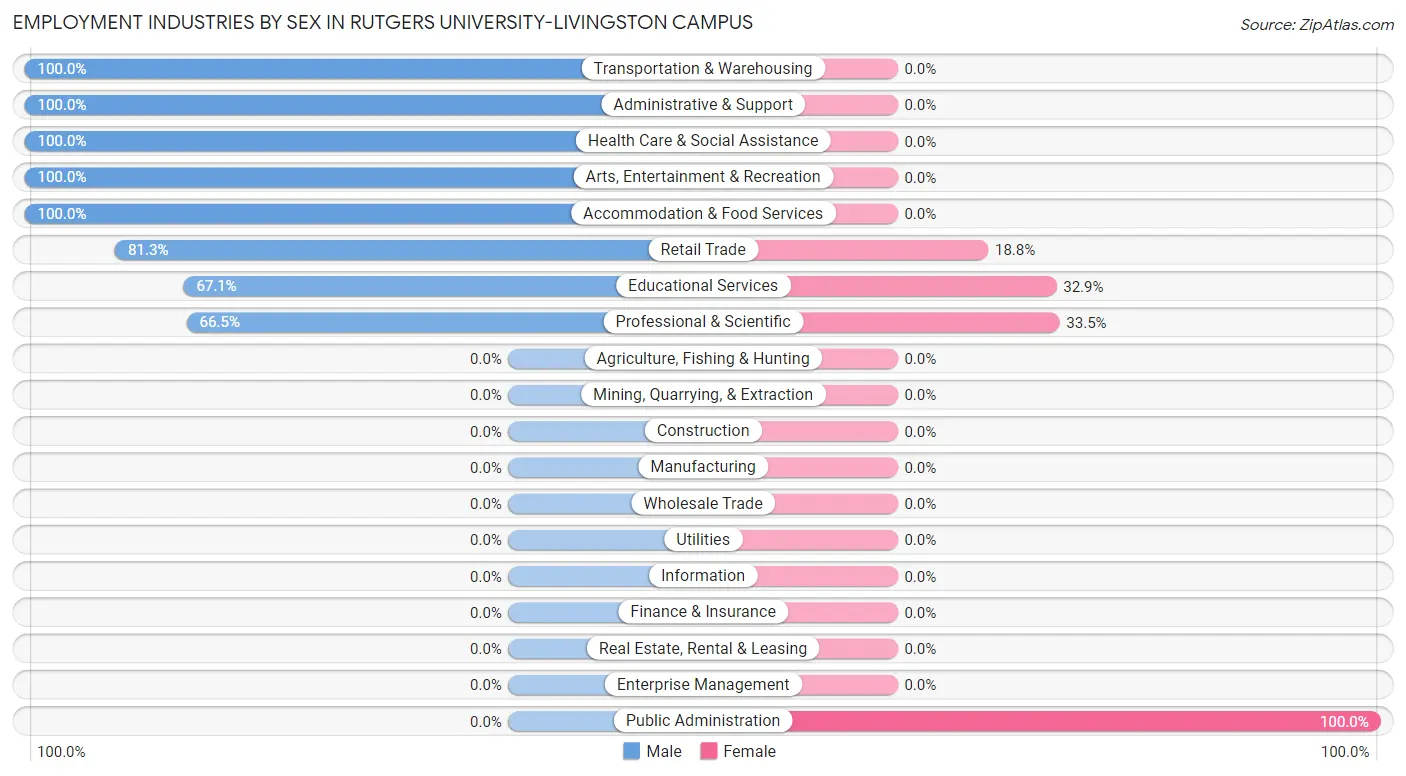
The major employment industries in Rutgers University-Livingston Campus include Educational Services (833 | 59.9%), Professional & Scientific (167 | 12.0%), Health Care & Social Assistance (157 | 11.3%), Accommodation & Food Services (146 | 10.5%), and Transportation & Warehousing (17 | 1.2%).
Employment Industries by Sex in Rutgers University-Livingston Campus
The Rutgers University-Livingston Campus industries that see more men than women are Transportation & Warehousing (100.0%), Administrative & Support (100.0%), and Health Care & Social Assistance (100.0%), whereas the industries that tend to have a higher number of women are Public Administration (100.0%), Professional & Scientific (33.5%), and Educational Services (32.9%).
Industry
Male
Female
Agriculture, Fishing & Hunting
0 (0.0%)
0 (0.0%)
Mining, Quarrying, & Extraction
0 (0.0%)
0 (0.0%)
Construction
0 (0.0%)
0 (0.0%)
Manufacturing
0 (0.0%)
0 (0.0%)
Wholesale Trade
0 (0.0%)
0 (0.0%)
Retail Trade
13 (81.2%)
3 (18.8%)
Transportation & Warehousing
17 (100.0%)
0 (0.0%)
Utilities
0 (0.0%)
0 (0.0%)
Information
0 (0.0%)
0 (0.0%)
Finance & Insurance
0 (0.0%)
0 (0.0%)
Real Estate, Rental & Leasing
0 (0.0%)
0 (0.0%)
Professional & Scientific
111 (66.5%)
56 (33.5%)
Enterprise Management
0 (0.0%)
0 (0.0%)
Administrative & Support
5 (100.0%)
0 (0.0%)
Educational Services
559 (67.1%)
274 (32.9%)
Health Care & Social Assistance
157 (100.0%)
0 (0.0%)
Arts, Entertainment & Recreation
7 (100.0%)
0 (0.0%)
Accommodation & Food Services
146 (100.0%)
0 (0.0%)
Public Administration
0 (0.0%)
4 (100.0%)
Total
1,015 (73.0%)
375 (27.0%)
Education in Rutgers University-Livingston Campus
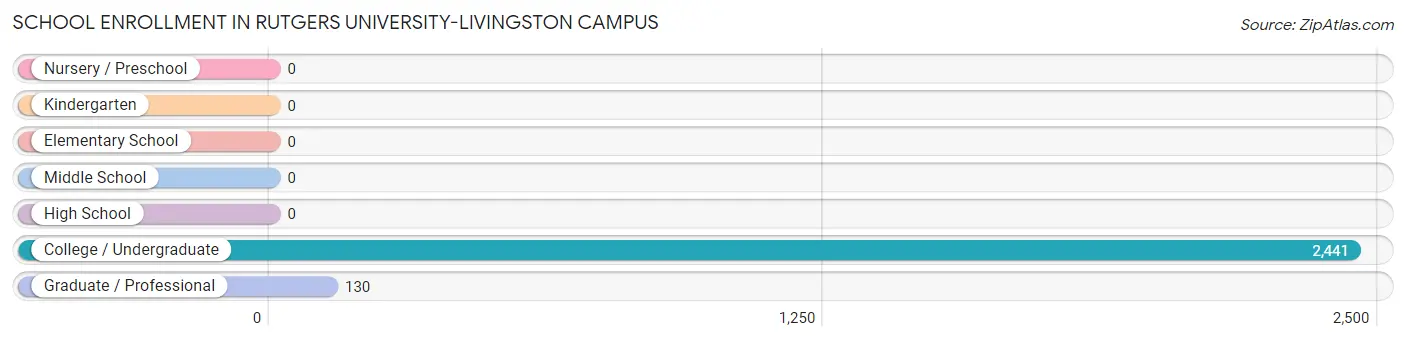
School Enrollment in Rutgers University-Livingston Campus
The most common levels of schooling among the 2,571 students in Rutgers University-Livingston Campus are college / undergraduate (2,441 | 94.9%), and graduate / professional (130 | 5.1%).
School Level
# Students
% Students
Nursery / Preschool
0
0.0%
Kindergarten
0
0.0%
Elementary School
0
0.0%
Middle School
0
0.0%
High School
0
0.0%
College / Undergraduate
2,441
94.9%
Graduate / Professional
130
5.1%
Total
2,571
100.0%
School Enrollment by Age by Funding Source in Rutgers University-Livingston Campus
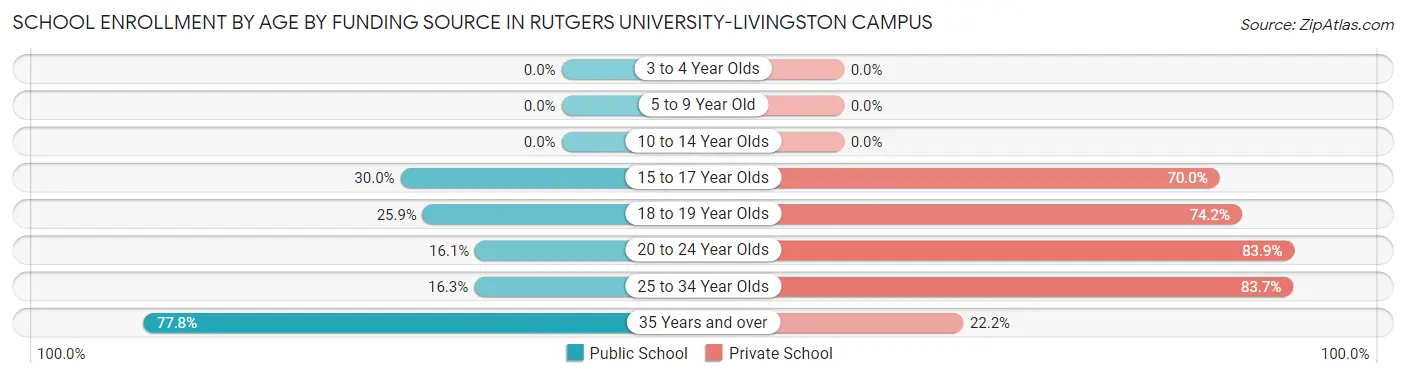
Out of a total of 2,571 students who are enrolled in schools in Rutgers University-Livingston Campus, 2,023 (78.7%) attend a private institution, while the remaining 548 (21.3%) are enrolled in public schools. The age group of 20 to 24 year olds has the highest likelihood of being enrolled in private schools, with 1,018 (83.9% in the age bracket) enrolled. Conversely, the age group of 35 years and over has the lowest likelihood of being enrolled in a private school, with 7 (77.8% in the age bracket) attending a public institution.
Age Bracket
Public School
Private School
3 to 4 Year Olds
0 (0.0%)
0 (0.0%)
5 to 9 Year Old
0 (0.0%)
0 (0.0%)
10 to 14 Year Olds
0 (0.0%)
0 (0.0%)
15 to 17 Year Olds
3 (30.0%)
7 (70.0%)
18 to 19 Year Olds
335 (25.9%)
961 (74.2%)
20 to 24 Year Olds
195 (16.1%)
1,018 (83.9%)
25 to 34 Year Olds
7 (16.3%)
36 (83.7%)
35 Years and over
7 (77.8%)
2 (22.2%)
Total
548 (21.3%)
2,023 (78.7%)
Educational Attainment by Field of Study in Rutgers University-Livingston Campus
Physical & health sciences (25 | 50.0%), computers & mathematics (11 | 22.0%), visual & performing arts (5 | 10.0%), engineering (4 | 8.0%), and bio, nature & agricultural (3 | 6.0%) are the most common fields of study among 50 individuals in Rutgers University-Livingston Campus who have obtained a bachelor's degree or higher.
Field of Study
# Graduates
% Graduates
Computers & Mathematics
11
22.0%
Bio, Nature & Agricultural
3
6.0%
Physical & Health Sciences
25
50.0%
Psychology
0
0.0%
Social Sciences
0
0.0%
Engineering
4
8.0%
Multidisciplinary Studies
0
0.0%
Science & Technology
0
0.0%
Business
0
0.0%
Education
0
0.0%
Literature & Languages
1
2.0%
Liberal Arts & History
1
2.0%
Visual & Performing Arts
5
10.0%
Communications
0
0.0%
Arts & Humanities
0
0.0%
Total
50
100.0%
Transportation & Commute in Rutgers University-Livingston Campus
Vehicle Availability by Sex in Rutgers University-Livingston Campus
Vehicles Available
Male
Female
No Vehicle
0 (0.0%)
0 (0.0%)
1 Vehicle
0 (0.0%)
0 (0.0%)
2 Vehicles
0 (0.0%)
0 (0.0%)
3 Vehicles
0 (0.0%)
0 (0.0%)
4 Vehicles
0 (0.0%)
0 (0.0%)
5 or more Vehicles
0 (0.0%)
0 (0.0%)
Total
0 (0.0%)
0 (0.0%)
Commute Time in Rutgers University-Livingston Campus
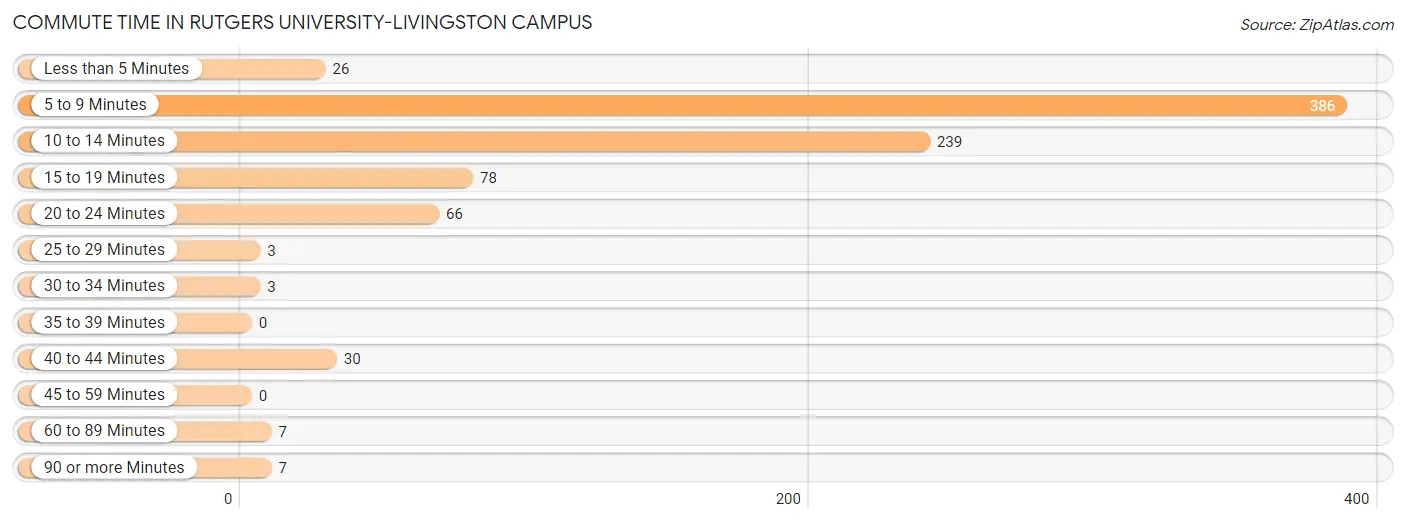
The most frequently occuring commute durations in Rutgers University-Livingston Campus are 5 to 9 minutes (386 commuters, 45.7%), 10 to 14 minutes (239 commuters, 28.3%), and 15 to 19 minutes (78 commuters, 9.2%).
Commute Time
# Commuters
% Commuters
Less than 5 Minutes
26
3.1%
5 to 9 Minutes
386
45.7%
10 to 14 Minutes
239
28.3%
15 to 19 Minutes
78
9.2%
20 to 24 Minutes
66
7.8%
25 to 29 Minutes
3
0.4%
30 to 34 Minutes
3
0.4%
35 to 39 Minutes
0
0.0%
40 to 44 Minutes
30
3.5%
45 to 59 Minutes
0
0.0%
60 to 89 Minutes
7
0.8%
90 or more Minutes
7
0.8%
Commute Time by Sex in Rutgers University-Livingston Campus
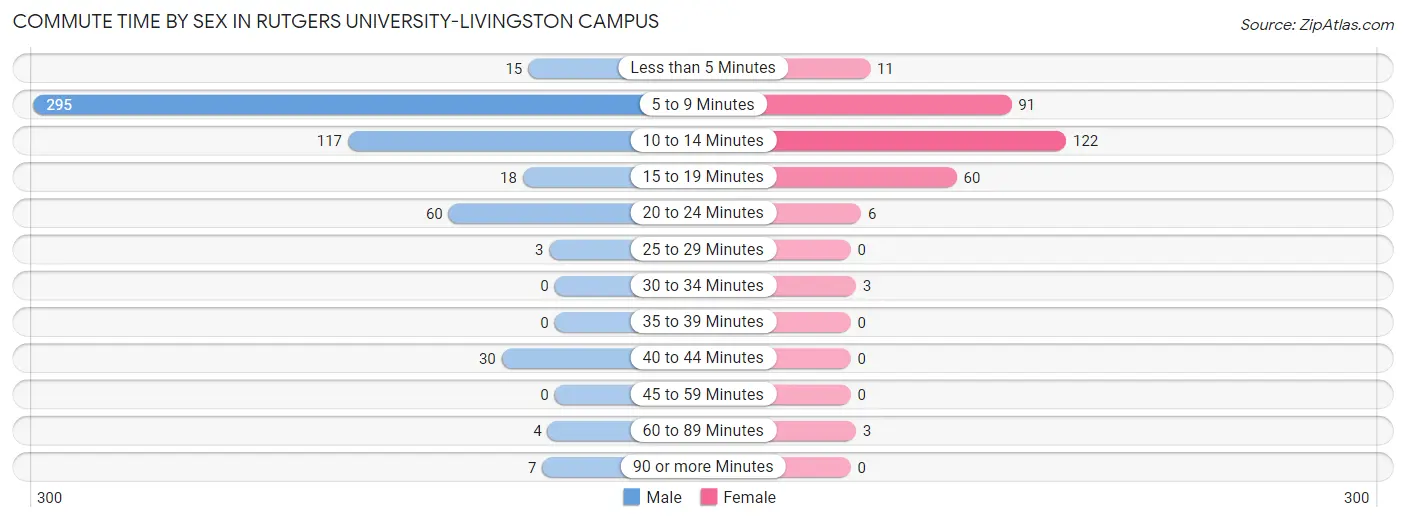
The most common commute times in Rutgers University-Livingston Campus are 5 to 9 minutes (295 commuters, 53.7%) for males and 10 to 14 minutes (122 commuters, 41.2%) for females.
Commute Time
Male
Female
Less than 5 Minutes
15 (2.7%)
11 (3.7%)
5 to 9 Minutes
295 (53.7%)
91 (30.7%)
10 to 14 Minutes
117 (21.3%)
122 (41.2%)
15 to 19 Minutes
18 (3.3%)
60 (20.3%)
20 to 24 Minutes
60 (10.9%)
6 (2.0%)
25 to 29 Minutes
3 (0.5%)
0 (0.0%)
30 to 34 Minutes
0 (0.0%)
3 (1.0%)
35 to 39 Minutes
0 (0.0%)
0 (0.0%)
40 to 44 Minutes
30 (5.5%)
0 (0.0%)
45 to 59 Minutes
0 (0.0%)
0 (0.0%)
60 to 89 Minutes
4 (0.7%)
3 (1.0%)
90 or more Minutes
7 (1.3%)
0 (0.0%)
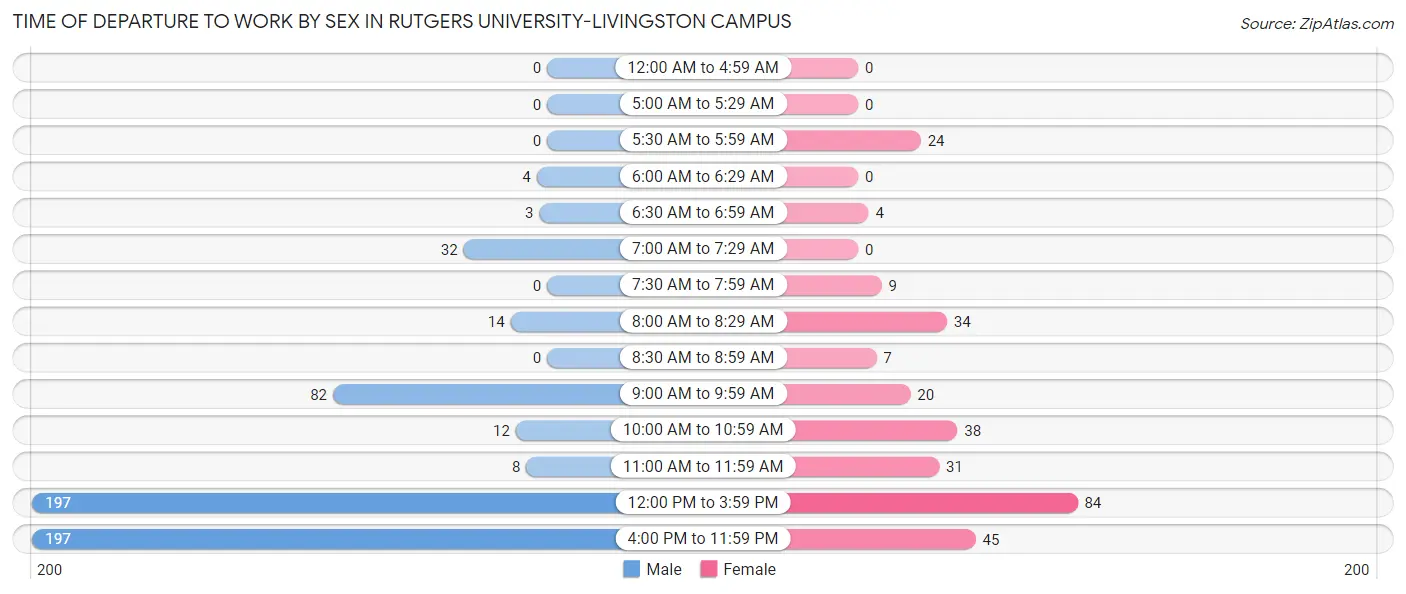
Time of Departure to Work by Sex in Rutgers University-Livingston Campus
The most frequent times of departure to work in Rutgers University-Livingston Campus are 12:00 PM to 3:59 PM (197, 35.9%) for males and 12:00 PM to 3:59 PM (84, 28.4%) for females.
Time of Departure
Male
Female
12:00 AM to 4:59 AM
0 (0.0%)
0 (0.0%)
5:00 AM to 5:29 AM
0 (0.0%)
0 (0.0%)
5:30 AM to 5:59 AM
0 (0.0%)
24 (8.1%)
6:00 AM to 6:29 AM
4 (0.7%)
0 (0.0%)
6:30 AM to 6:59 AM
3 (0.5%)
4 (1.3%)
7:00 AM to 7:29 AM
32 (5.8%)
0 (0.0%)
7:30 AM to 7:59 AM
0 (0.0%)
9 (3.0%)
8:00 AM to 8:29 AM
14 (2.5%)
34 (11.5%)
8:30 AM to 8:59 AM
0 (0.0%)
7 (2.4%)
9:00 AM to 9:59 AM
82 (14.9%)
20 (6.8%)
10:00 AM to 10:59 AM
12 (2.2%)
38 (12.8%)
11:00 AM to 11:59 AM
8 (1.5%)
31 (10.5%)
12:00 PM to 3:59 PM
197 (35.9%)
84 (28.4%)
4:00 PM to 11:59 PM
197 (35.9%)
45 (15.2%)
Total
549 (100.0%)
296 (100.0%)
Housing Occupancy in Rutgers University-Livingston Campus
Occupancy by Ownership in Rutgers University-Livingston Campus
Occupancy
# Housing Units
% Housing Units
Owner Occupied Housing Units
0
0.0%
Renter-Occupied Housing Units
0
0.0%
Total Occupied Housing Units
0
0.0%
Occupancy by Household Size in Rutgers University-Livingston Campus
Household Size
# Housing Units
% Housing Units
1-Person Household
0
0.0%
2-Person Household
0
0.0%
3-Person Household
0
0.0%
4+ Person Household
0
0.0%
Total Housing Units
0
0.0%
Occupancy by Ownership by Household Size in Rutgers University-Livingston Campus
Household Size
Owner-occupied
Renter-occupied
1-Person Household
0 (0.0%)
0 (0.0%)
2-Person Household
0 (0.0%)
0 (0.0%)
3-Person Household
0 (0.0%)
0 (0.0%)
4+ Person Household
0 (0.0%)
0 (0.0%)
Total Housing Units
0 (0.0%)
0 (0.0%)
Occupancy by Educational Attainment in Rutgers University-Livingston Campus
Household Size
Owner-occupied
Renter-occupied
Less than High School
0 (0.0%)
0 (0.0%)
High School Diploma
0 (0.0%)
0 (0.0%)
College/Associate Degree
0 (0.0%)
0 (0.0%)
Bachelor's Degree or higher
0 (0.0%)
0 (0.0%)
Occupancy by Age of Householder in Rutgers University-Livingston Campus
Age Bracket
# Households
% Households
Under 35 Years
0
0.0%
35 to 44 Years
0
0.0%
45 to 54 Years
0
0.0%
55 to 64 Years
0
0.0%
65 to 74 Years
0
0.0%
75 to 84 Years
0
0.0%
85 Years and Over
0
0.0%
Total
0
0.0%
Housing Finances in Rutgers University-Livingston Campus
Median Income by Occupancy in Rutgers University-Livingston Campus
Occupancy Type
# Households
Median Income
Owner-Occupied
0 (0.0%)
$0
Renter-Occupied
0 (0.0%)
$0
Average
0 (0.0%)
$0
Occupancy by Householder Income Bracket in Rutgers University-Livingston Campus
Income Bracket
Owner-occupied
Renter-occupied
Less than $5,000
0 (0.0%)
0 (0.0%)
$5,000 to $9,999
0 (0.0%)
0 (0.0%)
$10,000 to $14,999
0 (0.0%)
0 (0.0%)
$15,000 to $19,999
0 (0.0%)
0 (0.0%)
$20,000 to $24,999
0 (0.0%)
0 (0.0%)
$25,000 to $34,999
0 (0.0%)
0 (0.0%)
$35,000 to $49,999
0 (0.0%)
0 (0.0%)
$50,000 to $74,999
0 (0.0%)
0 (0.0%)
$75,000 to $99,999
0 (0.0%)
0 (0.0%)
$100,000 to $149,999
0 (0.0%)
0 (0.0%)
$150,000 or more
0 (0.0%)
0 (0.0%)
Total
0 (0.0%)
0 (0.0%)
Monthly Housing Cost Tiers in Rutgers University-Livingston Campus
Monthly Cost
Owner-occupied
Renter-occupied
Less than $300
0 (0.0%)
0 (0.0%)
$300 to $499
0 (0.0%)
0 (0.0%)
$500 to $799
0 (0.0%)
0 (0.0%)
$800 to $999
0 (0.0%)
0 (0.0%)
$1,000 to $1,499
0 (0.0%)
0 (0.0%)
$1,500 to $1,999
0 (0.0%)
0 (0.0%)
$2,000 to $2,499
0 (0.0%)
0 (0.0%)
$2,500 to $2,999
0 (0.0%)
0 (0.0%)
$3,000 or more
0 (0.0%)
0 (0.0%)
Total
0 (0.0%)
0 (0.0%)
Physical Housing Characteristics in Rutgers University-Livingston Campus
Housing Structures in Rutgers University-Livingston Campus
Structure Type
# Housing Units
% Housing Units
Single Unit, Detached
0
0.0%
Single Unit, Attached
0
0.0%
2 Unit Apartments
0
0.0%
3 or 4 Unit Apartments
0
0.0%
5 to 9 Unit Apartments
0
0.0%
10 or more Apartments
0
0.0%
Mobile Home / Other
0
0.0%
Total
0
0.0%
Housing Structures by Occupancy in Rutgers University-Livingston Campus
Structure Type
Owner-occupied
Renter-occupied
Single Unit, Detached
0 (0.0%)
0 (0.0%)
Single Unit, Attached
0 (0.0%)
0 (0.0%)
2 Unit Apartments
0 (0.0%)
0 (0.0%)
3 or 4 Unit Apartments
0 (0.0%)
0 (0.0%)
5 to 9 Unit Apartments
0 (0.0%)
0 (0.0%)
10 or more Apartments
0 (0.0%)
0 (0.0%)
Mobile Home / Other
0 (0.0%)
0 (0.0%)
Total
0 (0.0%)
0 (0.0%)
Housing Structures by Number of Rooms in Rutgers University-Livingston Campus
Number of Rooms
Owner-occupied
Renter-occupied
1 Room
0 (0.0%)
0 (0.0%)
2 or 3 Rooms
0 (0.0%)
0 (0.0%)
4 or 5 Rooms
0 (0.0%)
0 (0.0%)
6 or 7 Rooms
0 (0.0%)
0 (0.0%)
8 or more Rooms
0 (0.0%)
0 (0.0%)
Total
0 (0.0%)
0 (0.0%)
Housing Structure by Heating Type in Rutgers University-Livingston Campus
Heating Type
Owner-occupied
Renter-occupied
Utility Gas
0 (0.0%)
0 (0.0%)
Bottled, Tank, or LP Gas
0 (0.0%)
0 (0.0%)
Electricity
0 (0.0%)
0 (0.0%)
Fuel Oil or Kerosene
0 (0.0%)
0 (0.0%)
Coal or Coke
0 (0.0%)
0 (0.0%)
All other Fuels
0 (0.0%)
0 (0.0%)
No Fuel Used
0 (0.0%)
0 (0.0%)
Total
0 (0.0%)
0 (0.0%)
Household Vehicle Usage in Rutgers University-Livingston Campus
Vehicles per Household
Owner-occupied
Renter-occupied
No Vehicle
0 (0.0%)
0 (0.0%)
1 Vehicle
0 (0.0%)
0 (0.0%)
2 Vehicles
0 (0.0%)
0 (0.0%)
3 or more Vehicles
0 (0.0%)
0 (0.0%)
Total
0 (0.0%)
0 (0.0%)
Real Estate & Mortgages in Rutgers University-Livingston Campus
Real Estate and Mortgage Overview in Rutgers University-Livingston Campus
Characteristic
Without Mortgage
With Mortgage
Housing Units
0
0
Median Property Value
-
-
Median Household Income
-
-
Monthly Housing Costs
-
-
Real Estate Taxes
-
-
Property Value by Mortgage Status in Rutgers University-Livingston Campus
Property Value
Without Mortgage
With Mortgage
Less than $50,000
0 (0.0%)
0 (0.0%)
$50,000 to $99,999
0 (0.0%)
0 (0.0%)
$100,000 to $299,999
0 (0.0%)
0 (0.0%)
$300,000 to $499,999
0 (0.0%)
0 (0.0%)
$500,000 to $749,999
0 (0.0%)
0 (0.0%)
$750,000 to $999,999
0 (0.0%)
0 (0.0%)
$1,000,000 or more
0 (0.0%)
0 (0.0%)
Total
0 (0.0%)
0 (0.0%)
Household Income by Mortgage Status in Rutgers University-Livingston Campus
Household Income
Without Mortgage
With Mortgage
Less than $10,000
0 (0.0%)
0 (0.0%)
$10,000 to $24,999
0 (0.0%)
0 (0.0%)
$25,000 to $34,999
0 (0.0%)
0 (0.0%)
$35,000 to $49,999
0 (0.0%)
0 (0.0%)
$50,000 to $74,999
0 (0.0%)
0 (0.0%)
$75,000 to $99,999
0 (0.0%)
0 (0.0%)
$100,000 to $149,999
0 (0.0%)
0 (0.0%)
$150,000 or more
0 (0.0%)
0 (0.0%)
Total
0 (0.0%)
0 (0.0%)
Property Value to Household Income Ratio in Rutgers University-Livingston Campus
Value-to-Income Ratio
Without Mortgage
With Mortgage
Less than 2.0x
0 (0.0%)
0 (0.0%)
2.0x to 2.9x
0 (0.0%)
0 (0.0%)
3.0x to 3.9x
0 (0.0%)
0 (0.0%)
4.0x or more
0 (0.0%)
0 (0.0%)
Total
0 (0.0%)
0 (0.0%)
Real Estate Taxes by Mortgage Status in Rutgers University-Livingston Campus
Property Taxes
Without Mortgage
With Mortgage
Less than $800
0 (0.0%)
0 (0.0%)
$800 to $1,499
0 (0.0%)
0 (0.0%)
$800 to $1,499
0 (0.0%)
0 (0.0%)
Total
0 (0.0%)
0 (0.0%)
Health & Disability in Rutgers University-Livingston Campus
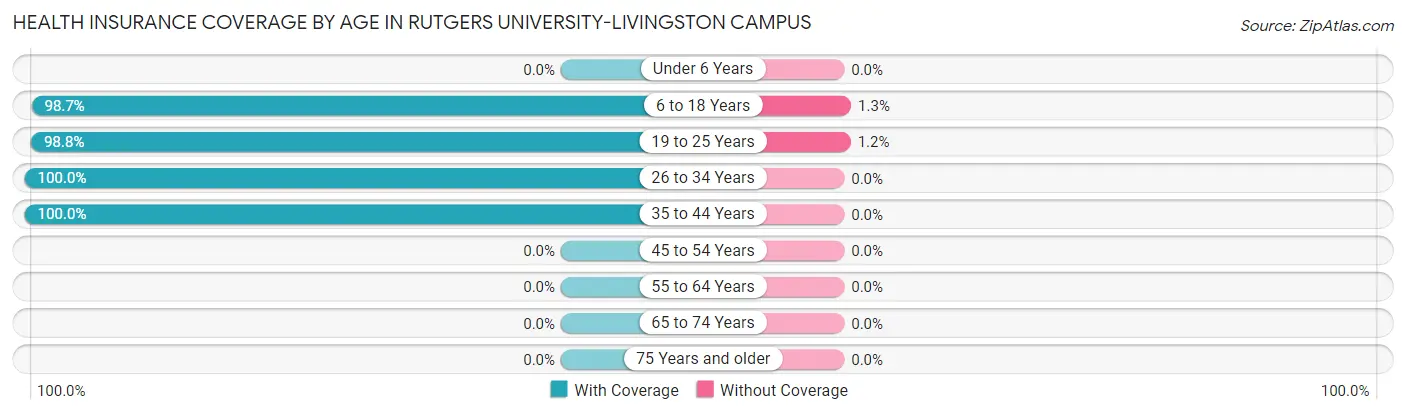
Health Insurance Coverage by Age in Rutgers University-Livingston Campus
Age Bracket
With Coverage
Without Coverage
Under 6 Years
0 (0.0%)
0 (0.0%)
6 to 18 Years
693 (98.7%)
9 (1.3%)
19 to 25 Years
1,815 (98.8%)
22 (1.2%)
26 to 34 Years
23 (100.0%)
0 (0.0%)
35 to 44 Years
9 (100.0%)
0 (0.0%)
45 to 54 Years
0 (0.0%)
0 (0.0%)
55 to 64 Years
0 (0.0%)
0 (0.0%)
65 to 74 Years
0 (0.0%)
0 (0.0%)
75 Years and older
0 (0.0%)
0 (0.0%)
Total
2,540 (98.8%)
31 (1.2%)
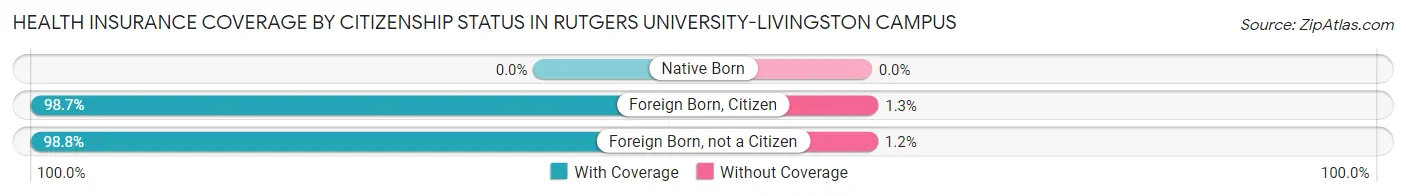
Health Insurance Coverage by Citizenship Status in Rutgers University-Livingston Campus
Citizenship Status
With Coverage
Without Coverage
Native Born
0 (0.0%)
0 (0.0%)
Foreign Born, Citizen
693 (98.7%)
9 (1.3%)
Foreign Born, not a Citizen
1,815 (98.8%)
22 (1.2%)
Health Insurance Coverage by Household Income in Rutgers University-Livingston Campus
Household Income
With Coverage
Without Coverage
Under $25,000
0 (0.0%)
0 (0.0%)
$25,000 to $49,999
0 (0.0%)
0 (0.0%)
$50,000 to $74,999
0 (0.0%)
0 (0.0%)
$75,000 to $99,999
0 (0.0%)
0 (0.0%)
$100,000 and over
0 (0.0%)
0 (0.0%)
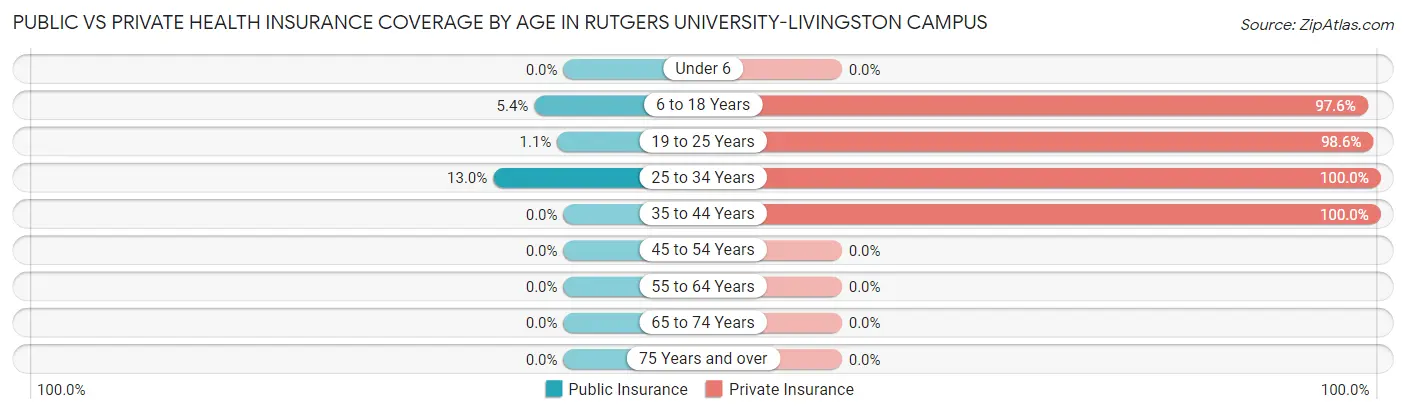
Public vs Private Health Insurance Coverage by Age in Rutgers University-Livingston Campus
Age Bracket
Public Insurance
Private Insurance
Under 6
0 (0.0%)
0 (0.0%)
6 to 18 Years
38 (5.4%)
685 (97.6%)
19 to 25 Years
21 (1.1%)
1,812 (98.6%)
25 to 34 Years
3 (13.0%)
23 (100.0%)
35 to 44 Years
0 (0.0%)
9 (100.0%)
45 to 54 Years
0 (0.0%)
0 (0.0%)
55 to 64 Years
0 (0.0%)
0 (0.0%)
65 to 74 Years
0 (0.0%)
0 (0.0%)
75 Years and over
0 (0.0%)
0 (0.0%)
Total
62 (2.4%)
2,529 (98.4%)
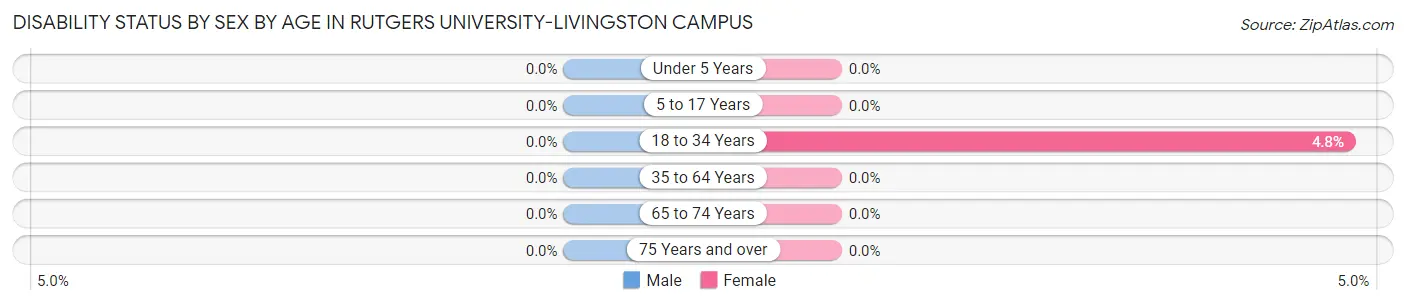
Disability Status by Sex by Age in Rutgers University-Livingston Campus
Age Bracket
Male
Female
Under 5 Years
0 (0.0%)
0 (0.0%)
5 to 17 Years
0 (0.0%)
0 (0.0%)
18 to 34 Years
0 (0.0%)
53 (4.8%)
35 to 64 Years
0 (0.0%)
0 (0.0%)
65 to 74 Years
0 (0.0%)
0 (0.0%)
75 Years and over
0 (0.0%)
0 (0.0%)
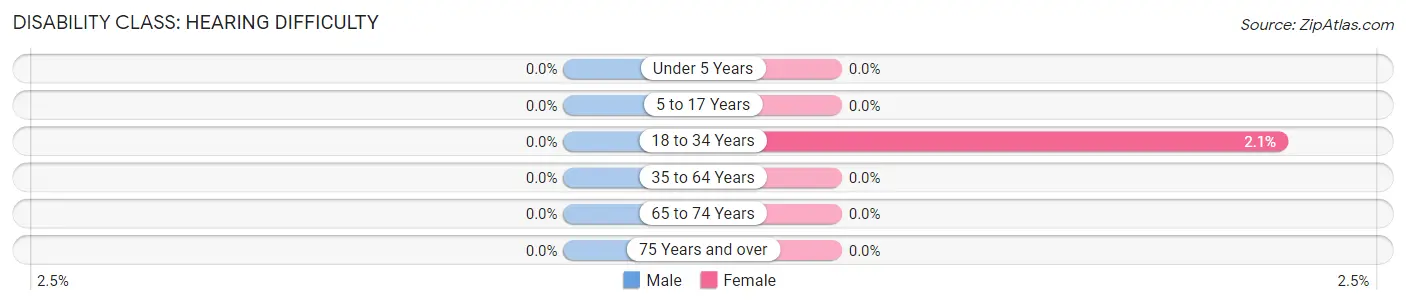
Disability Class by Sex by Age in Rutgers University-Livingston Campus
Disability Class: Hearing Difficulty
Age Bracket
Male
Female
Under 5 Years
0 (0.0%)
0 (0.0%)
5 to 17 Years
0 (0.0%)
0 (0.0%)
18 to 34 Years
0 (0.0%)
23 (2.1%)
35 to 64 Years
0 (0.0%)
0 (0.0%)
65 to 74 Years
0 (0.0%)
0 (0.0%)
75 Years and over
0 (0.0%)
0 (0.0%)
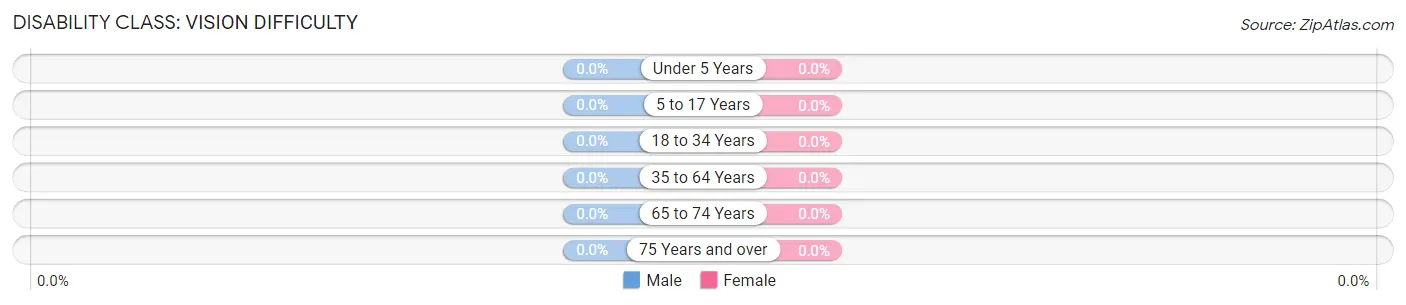
Disability Class: Vision Difficulty
Age Bracket
Male
Female
Under 5 Years
0 (0.0%)
0 (0.0%)
5 to 17 Years
0 (0.0%)
0 (0.0%)
18 to 34 Years
0 (0.0%)
0 (0.0%)
35 to 64 Years
0 (0.0%)
0 (0.0%)
65 to 74 Years
0 (0.0%)
0 (0.0%)
75 Years and over
0 (0.0%)
0 (0.0%)
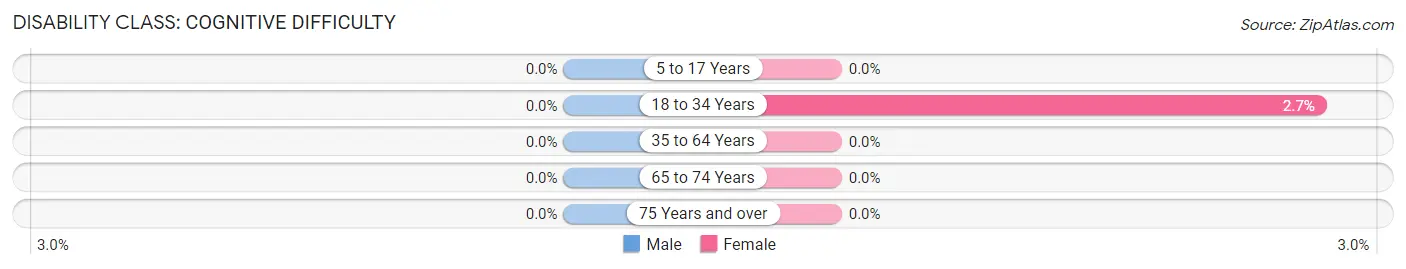
Disability Class: Cognitive Difficulty
Age Bracket
Male
Female
5 to 17 Years
0 (0.0%)
0 (0.0%)
18 to 34 Years
0 (0.0%)
30 (2.7%)
35 to 64 Years
0 (0.0%)
0 (0.0%)
65 to 74 Years
0 (0.0%)
0 (0.0%)
75 Years and over
0 (0.0%)
0 (0.0%)
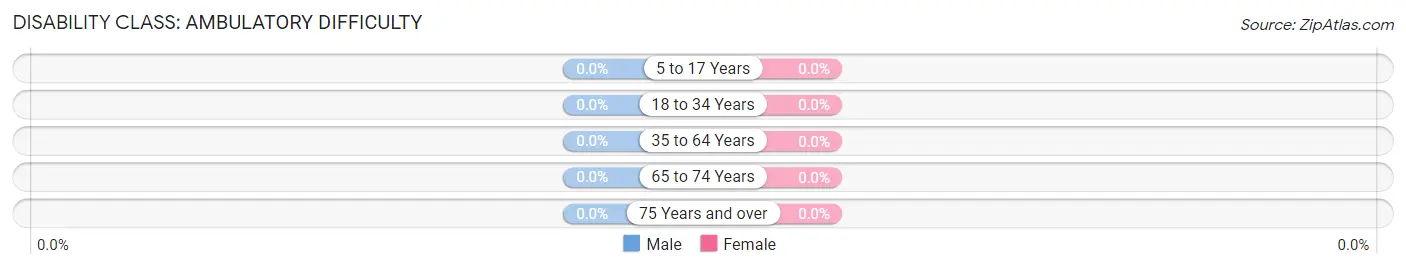
Disability Class: Ambulatory Difficulty
Age Bracket
Male
Female
5 to 17 Years
0 (0.0%)
0 (0.0%)
18 to 34 Years
0 (0.0%)
0 (0.0%)
35 to 64 Years
0 (0.0%)
0 (0.0%)
65 to 74 Years
0 (0.0%)
0 (0.0%)
75 Years and over
0 (0.0%)
0 (0.0%)
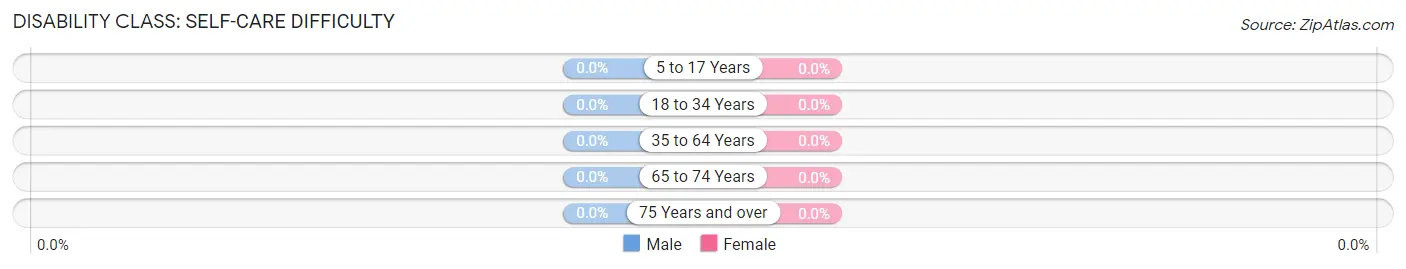
Disability Class: Self-Care Difficulty
Age Bracket
Male
Female
5 to 17 Years
0 (0.0%)
0 (0.0%)
18 to 34 Years
0 (0.0%)
0 (0.0%)
35 to 64 Years
0 (0.0%)
0 (0.0%)
65 to 74 Years
0 (0.0%)
0 (0.0%)
75 Years and over
0 (0.0%)
0 (0.0%)
Technology Access in Rutgers University-Livingston Campus
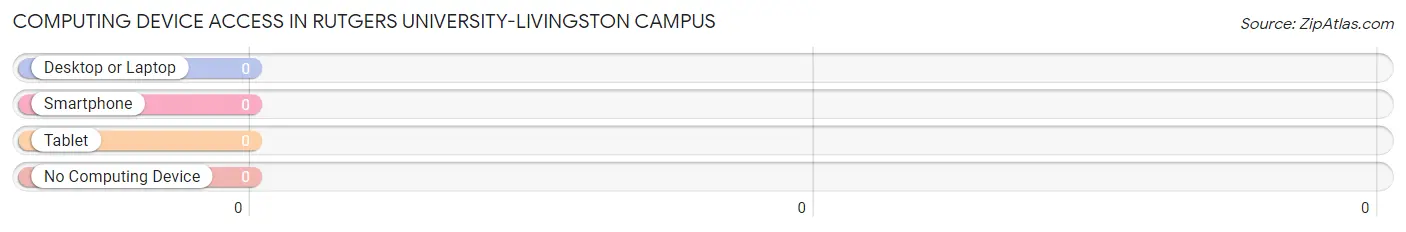
Computing Device Access in Rutgers University-Livingston Campus
Device Type
# Households
% Households
Desktop or Laptop
0
0.0%
Smartphone
0
0.0%
Tablet
0
0.0%
No Computing Device
0
0.0%
Total
0
0.0%
Internet Access in Rutgers University-Livingston Campus
Internet Type
# Households
% Households
Dial-Up Internet
0
0.0%
Broadband Home
0
0.0%
Cellular Data Only
0
0.0%
Satellite Internet
0
0.0%
No Internet
0
0.0%
Total
0
0.0%
Common Questions
What is the Total Population of Rutgers University-Livingston Campus?
Total Population of Rutgers University-Livingston Campus is 2,571.
What is the Total Male Population of Rutgers University-Livingston Campus?
Total Male Population of Rutgers University-Livingston Campus is 1,448.
What is the Total Female Population of Rutgers University-Livingston Campus?
Total Female Population of Rutgers University-Livingston Campus is 1,123.
What is the Ratio of Males per 100 Females in Rutgers University-Livingston Campus?
There are 128.94 Males per 100 Females in Rutgers University-Livingston Campus.
What is the Ratio of Females per 100 Males in Rutgers University-Livingston Campus?
There are 77.56 Females per 100 Males in Rutgers University-Livingston Campus.
What is the Median Population Age in Rutgers University-Livingston Campus?
Median Population Age in Rutgers University-Livingston Campus is 20.0 Years.
What is Per Capita Income in Rutgers University-Livingston Campus?
Per Capita income in Rutgers University-Livingston Campus is $6,700.
How Large is the Labor Force in Rutgers University-Livingston Campus?
There are 1,435 People in the Labor Forcein in Rutgers University-Livingston Campus.
What is the Percentage of People in the Labor Force in Rutgers University-Livingston Campus?
55.8% of People are in the Labor Force in Rutgers University-Livingston Campus.
What is the Unemployment Rate in Rutgers University-Livingston Campus?
Unemployment Rate in Rutgers University-Livingston Campus is 3.1%.
Report Title
Report Link
HTML Copy & Paste Link
Social Media
Copy and paste the folowing code into any webpage where you would like this interactive chart to display