North Wildwood, NJ
North Wildwood Map
North Wildwood Overview
3,639
TOTAL POPULATION
1,778
MALE POPULATION
1,861
FEMALE POPULATION
95.54
MALES / 100 FEMALES
104.67
FEMALES / 100 MALES
62.9
MEDIAN AGE
2.4
AVG FAMILY SIZE
1.9
AVG HOUSEHOLD SIZE
$70,156
PER CAPITA INCOME
$89,350
AVG FAMILY INCOME
$81,102
AVG HOUSEHOLD INCOME
42.6%
WAGE / INCOME GAP [ % ]
57.4¢/ $1
WAGE / INCOME GAP [ $ ]
0.57
INEQUALITY / GINI INDEX
1,493
LABOR FORCE [ PEOPLE ]
42.9%
PERCENT IN LABOR FORCE
3.0%
UNEMPLOYMENT RATE
North Wildwood Area Codes
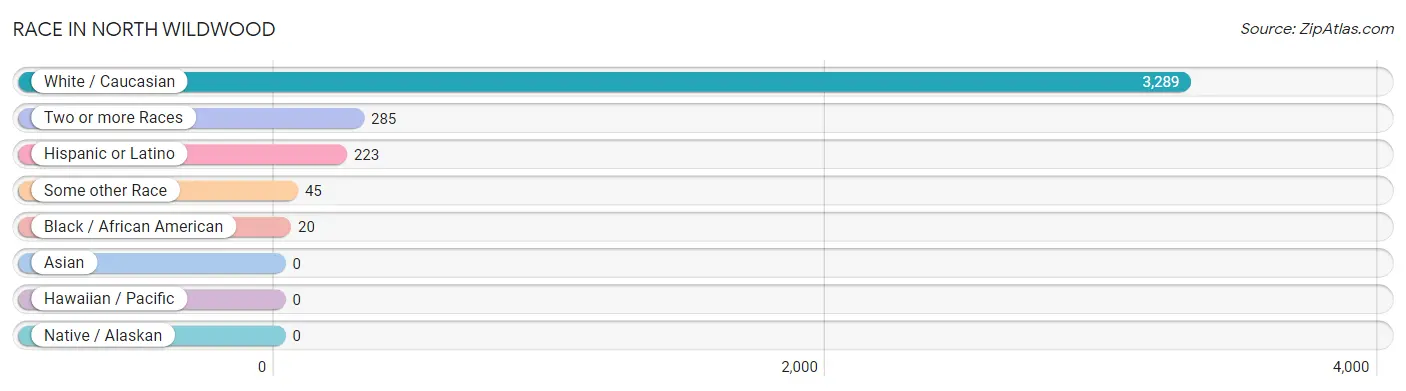
Race in North Wildwood
The most populous races in North Wildwood are White / Caucasian (3,289 | 90.4%), Two or more Races (285 | 7.8%), and Hispanic or Latino (223 | 6.1%).
| Race | # Population | % Population |
| Asian | 0 | 0.0% |
| Black / African American | 20 | 0.5% |
| Hawaiian / Pacific | 0 | 0.0% |
| Hispanic or Latino | 223 | 6.1% |
| Native / Alaskan | 0 | 0.0% |
| White / Caucasian | 3,289 | 90.4% |
| Two or more Races | 285 | 7.8% |
| Some other Race | 45 | 1.2% |
| Total | 3,639 | 100.0% |
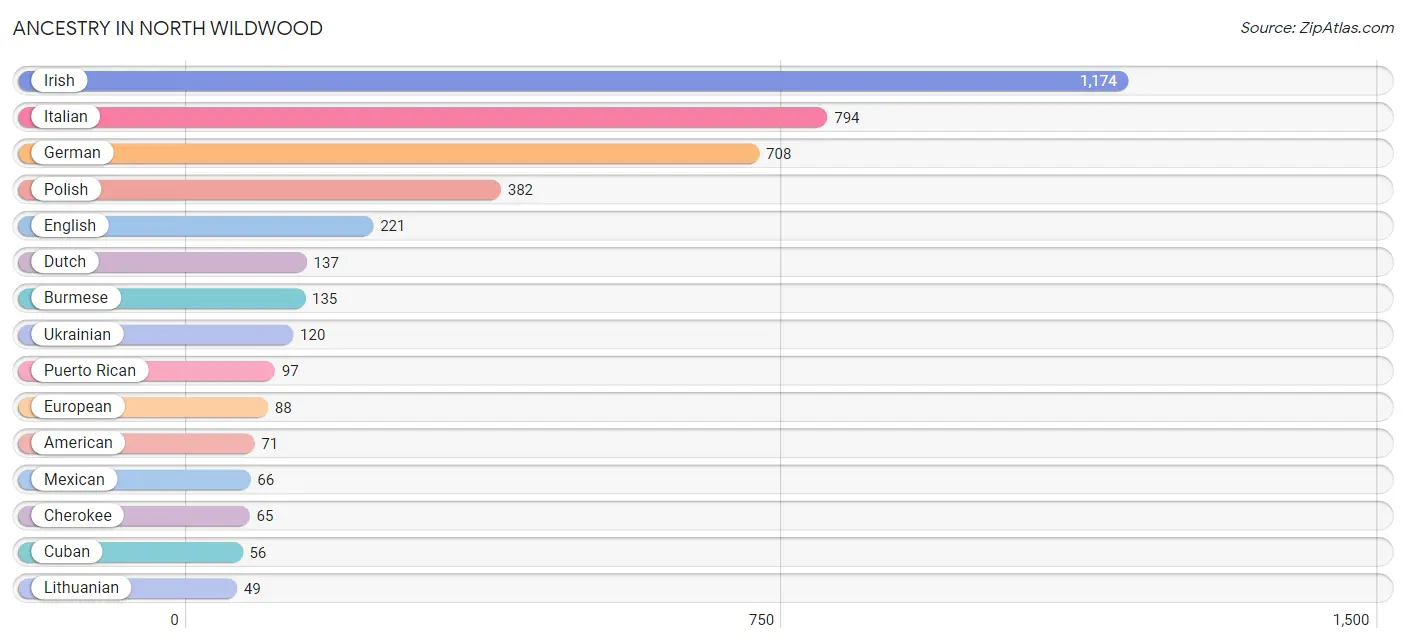
Ancestry in North Wildwood
The most populous ancestries reported in North Wildwood are Irish (1,174 | 32.3%), Italian (794 | 21.8%), German (708 | 19.5%), Polish (382 | 10.5%), and English (221 | 6.1%), together accounting for 90.1% of all North Wildwood residents.
| Ancestry | # Population | % Population |
| African | 29 | 0.8% |
| American | 71 | 1.9% |
| Burmese | 135 | 3.7% |
| Canadian | 30 | 0.8% |
| Cherokee | 65 | 1.8% |
| Cuban | 56 | 1.5% |
| Delaware | 29 | 0.8% |
| Dutch | 137 | 3.8% |
| Eastern European | 13 | 0.4% |
| English | 221 | 6.1% |
| European | 88 | 2.4% |
| French | 11 | 0.3% |
| German | 708 | 19.5% |
| Greek | 38 | 1.0% |
| Hungarian | 6 | 0.2% |
| Irish | 1,174 | 32.3% |
| Italian | 794 | 21.8% |
| Lithuanian | 49 | 1.3% |
| Mexican | 66 | 1.8% |
| Norwegian | 13 | 0.4% |
| Pennsylvania German | 4 | 0.1% |
| Peruvian | 4 | 0.1% |
| Polish | 382 | 10.5% |
| Portuguese | 3 | 0.1% |
| Puerto Rican | 97 | 2.7% |
| Romanian | 23 | 0.6% |
| Scotch-Irish | 16 | 0.4% |
| Scottish | 9 | 0.3% |
| Serbian | 8 | 0.2% |
| Slovak | 7 | 0.2% |
| South American | 4 | 0.1% |
| Subsaharan African | 29 | 0.8% |
| Swedish | 14 | 0.4% |
| Turkish | 20 | 0.5% |
| Ukrainian | 120 | 3.3% |
| Welsh | 18 | 0.5% | View All 36 Rows |
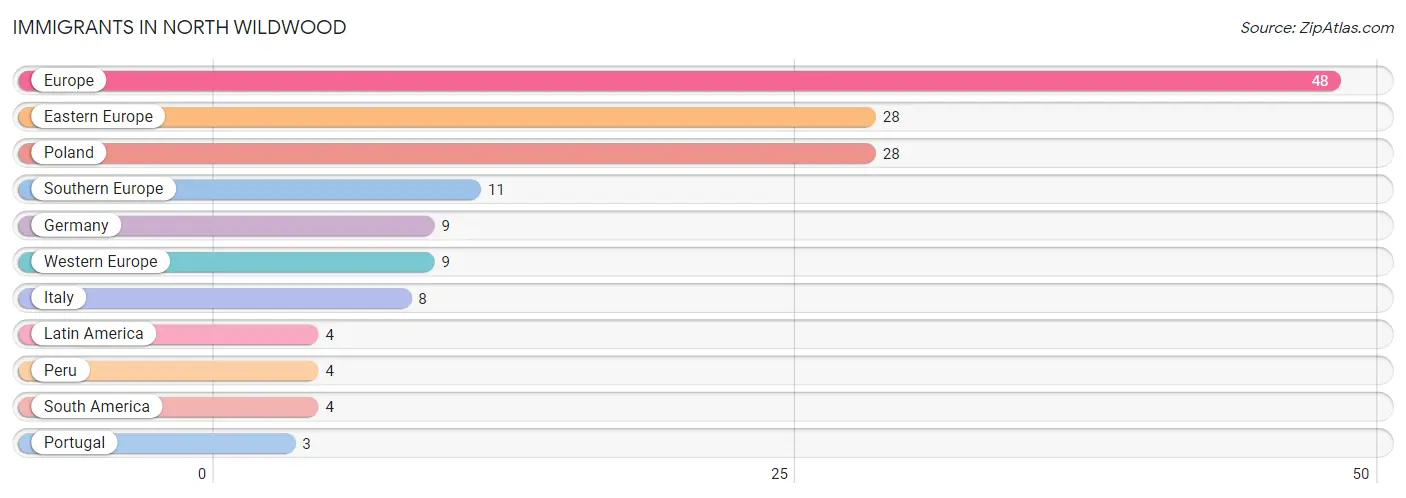
Immigrants in North Wildwood
The most numerous immigrant groups reported in North Wildwood came from Europe (48 | 1.3%), Eastern Europe (28 | 0.8%), Poland (28 | 0.8%), Southern Europe (11 | 0.3%), and Germany (9 | 0.3%), together accounting for 3.4% of all North Wildwood residents.
| Immigration Origin | # Population | % Population |
| Eastern Europe | 28 | 0.8% |
| Europe | 48 | 1.3% |
| Germany | 9 | 0.3% |
| Italy | 8 | 0.2% |
| Latin America | 4 | 0.1% |
| Peru | 4 | 0.1% |
| Poland | 28 | 0.8% |
| Portugal | 3 | 0.1% |
| South America | 4 | 0.1% |
| Southern Europe | 11 | 0.3% |
| Western Europe | 9 | 0.3% | View All 11 Rows |
Sex and Age in North Wildwood
Sex and Age in North Wildwood
The most populous age groups in North Wildwood are 70 to 74 Years (339 | 19.1%) for men and 70 to 74 Years (308 | 16.6%) for women.
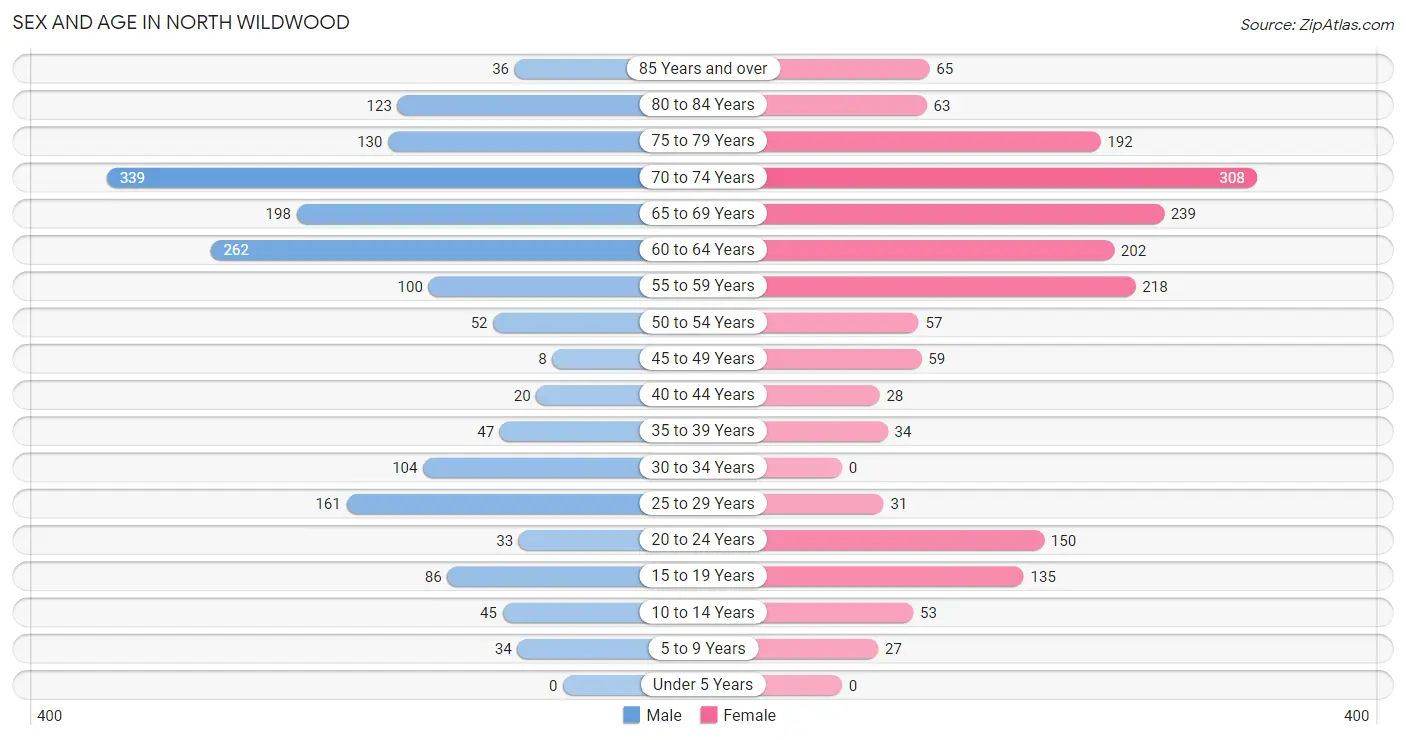
| Age Bracket | Male | Female |
| Under 5 Years | 0 (0.0%) | 0 (0.0%) |
| 5 to 9 Years | 34 (1.9%) | 27 (1.5%) |
| 10 to 14 Years | 45 (2.5%) | 53 (2.9%) |
| 15 to 19 Years | 86 (4.8%) | 135 (7.2%) |
| 20 to 24 Years | 33 (1.9%) | 150 (8.1%) |
| 25 to 29 Years | 161 (9.1%) | 31 (1.7%) |
| 30 to 34 Years | 104 (5.9%) | 0 (0.0%) |
| 35 to 39 Years | 47 (2.6%) | 34 (1.8%) |
| 40 to 44 Years | 20 (1.1%) | 28 (1.5%) |
| 45 to 49 Years | 8 (0.4%) | 59 (3.2%) |
| 50 to 54 Years | 52 (2.9%) | 57 (3.1%) |
| 55 to 59 Years | 100 (5.6%) | 218 (11.7%) |
| 60 to 64 Years | 262 (14.7%) | 202 (10.8%) |
| 65 to 69 Years | 198 (11.1%) | 239 (12.8%) |
| 70 to 74 Years | 339 (19.1%) | 308 (16.6%) |
| 75 to 79 Years | 130 (7.3%) | 192 (10.3%) |
| 80 to 84 Years | 123 (6.9%) | 63 (3.4%) |
| 85 Years and over | 36 (2.0%) | 65 (3.5%) |
| Total | 1,778 (100.0%) | 1,861 (100.0%) |
Families and Households in North Wildwood
Median Family Size in North Wildwood
The median family size in North Wildwood is 2.38 persons per family, with single female/mother families (97 | 8.8%) accounting for the largest median family size of 2.62 persons per family. On the other hand, single male/father families (45 | 4.1%) represent the smallest median family size with 1.87 persons per family.
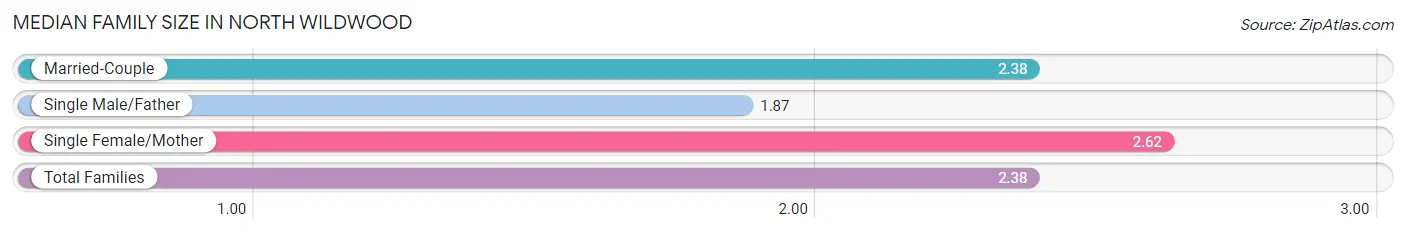
| Family Type | # Families | Family Size |
| Married-Couple | 963 (87.2%) | 2.38 |
| Single Male/Father | 45 (4.1%) | 1.87 |
| Single Female/Mother | 97 (8.8%) | 2.62 |
| Total Families | 1,105 (100.0%) | 2.38 |
Median Household Size in North Wildwood
The median household size in North Wildwood is 1.95 persons per household, with single female/mother households (97 | 5.2%) accounting for the largest median household size of 2.62 persons per household. non-family households (764 | 40.9%) represent the smallest median household size with 1.29 persons per household.
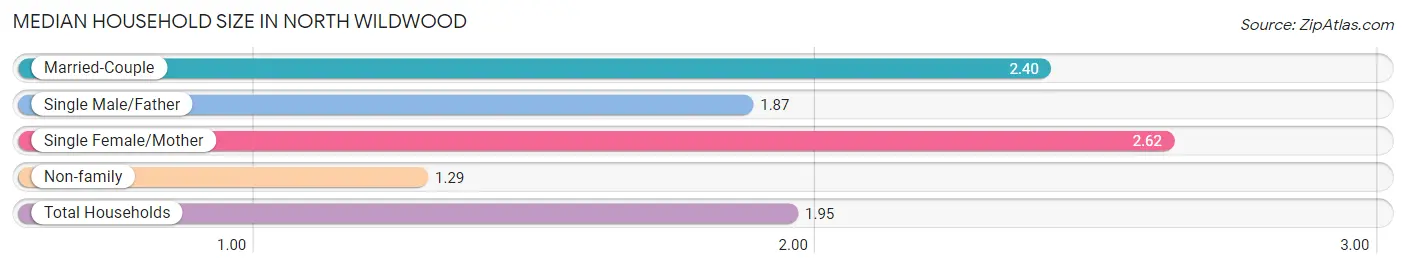
| Household Type | # Households | Household Size |
| Married-Couple | 963 (51.5%) | 2.40 |
| Single Male/Father | 45 (2.4%) | 1.87 |
| Single Female/Mother | 97 (5.2%) | 2.62 |
| Non-family | 764 (40.9%) | 1.29 |
| Total Households | 1,869 (100.0%) | 1.95 |
Household Size by Marriage Status in North Wildwood
Out of a total of 1,869 households in North Wildwood, 1,105 (59.1%) are family households, while 764 (40.9%) are nonfamily households. The most numerous type of family households are 2-person households, comprising 873, and the most common type of nonfamily households are 1-person households, comprising 591.
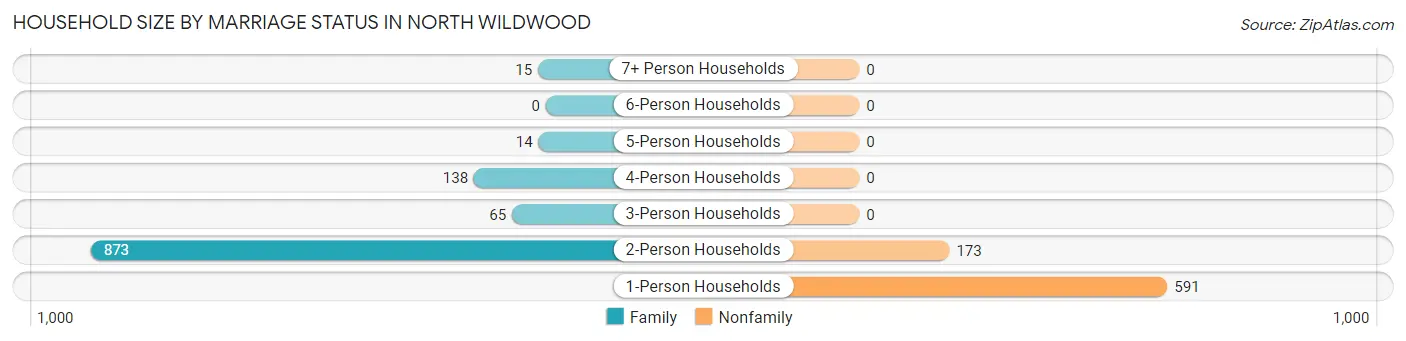
| Household Size | Family Households | Nonfamily Households |
| 1-Person Households | - | 591 (31.6%) |
| 2-Person Households | 873 (46.7%) | 173 (9.3%) |
| 3-Person Households | 65 (3.5%) | 0 (0.0%) |
| 4-Person Households | 138 (7.4%) | 0 (0.0%) |
| 5-Person Households | 14 (0.7%) | 0 (0.0%) |
| 6-Person Households | 0 (0.0%) | 0 (0.0%) |
| 7+ Person Households | 15 (0.8%) | 0 (0.0%) |
| Total | 1,105 (59.1%) | 764 (40.9%) |
Female Fertility in North Wildwood
Fertility by Age in North Wildwood
| Age Bracket | Women with Births | Births / 1,000 Women |
| 15 to 19 years | 0 (0.0%) | 0.0 |
| 20 to 34 years | 0 (0.0%) | 0.0 |
| 35 to 50 years | 0 (0.0%) | 0.0 |
| Total | 0 (0.0%) | 0.0 |
Fertility by Age by Marriage Status in North Wildwood
| Age Bracket | Married | Unmarried |
| 15 to 19 years | 0 (0.0%) | 0 (0.0%) |
| 20 to 34 years | 0 (0.0%) | 0 (0.0%) |
| 35 to 50 years | 0 (0.0%) | 0 (0.0%) |
| Total | 0 (0.0%) | 0 (0.0%) |
Fertility by Education in North Wildwood
| Educational Attainment | Women with Births | Births / 1,000 Women |
| Less than High School | 0 (0.0%) | 0.0 |
| High School Diploma | 0 (0.0%) | 0.0 |
| College or Associate's Degree | 0 (0.0%) | 0.0 |
| Bachelor's Degree | 0 (0.0%) | 0.0 |
| Graduate Degree | 0 (0.0%) | 0.0 |
| Total | 0 (0.0%) | 0.0 |
Fertility by Education by Marriage Status in North Wildwood
| Educational Attainment | Married | Unmarried |
| Less than High School | 0 (0.0%) | 0 (0.0%) |
| High School Diploma | 0 (0.0%) | 0 (0.0%) |
| College or Associate's Degree | 0 (0.0%) | 0 (0.0%) |
| Bachelor's Degree | 0 (0.0%) | 0 (0.0%) |
| Graduate Degree | 0 (0.0%) | 0 (0.0%) |
| Total | 0 (0.0%) | 0 (0.0%) |
Income in North Wildwood
Income Overview in North Wildwood
Per Capita Income in North Wildwood is $70,156, while median incomes of families and households are $89,350 and $81,102 respectively.
| Characteristic | Number | Measure |
| Per Capita Income | 3,639 | $70,156 |
| Median Family Income | 1,105 | $89,350 |
| Mean Family Income | 1,105 | $179,663 |
| Median Household Income | 1,869 | $81,102 |
| Mean Household Income | 1,869 | $142,219 |
| Income Deficit | 1,105 | $0 |
| Wage / Income Gap (%) | 3,639 | 42.58% |
| Wage / Income Gap ($) | 3,639 | 57.42¢ per $1 |
| Gini / Inequality Index | 3,639 | 0.57 |
Earnings by Sex in North Wildwood
Average Earnings in North Wildwood are $34,362, $41,898 for men and $24,056 for women, a difference of 42.6%.
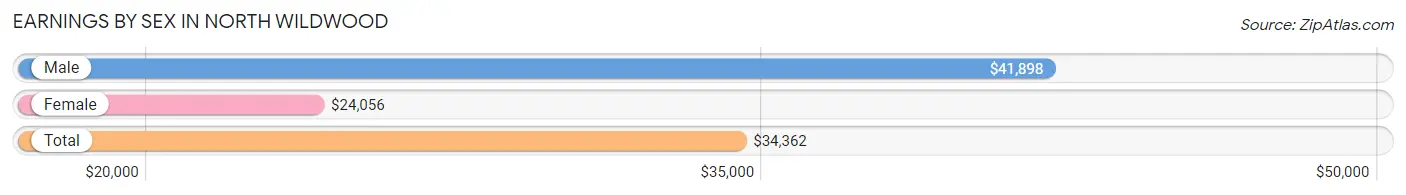
| Sex | Number | Average Earnings |
| Male | 788 (49.0%) | $41,898 |
| Female | 820 (51.0%) | $24,056 |
| Total | 1,608 (100.0%) | $34,362 |
Earnings by Sex by Income Bracket in North Wildwood
The most common earnings brackets in North Wildwood are $100,000+ for men (193 | 24.5%) and $75,000 to $99,999 for women (123 | 15.0%).
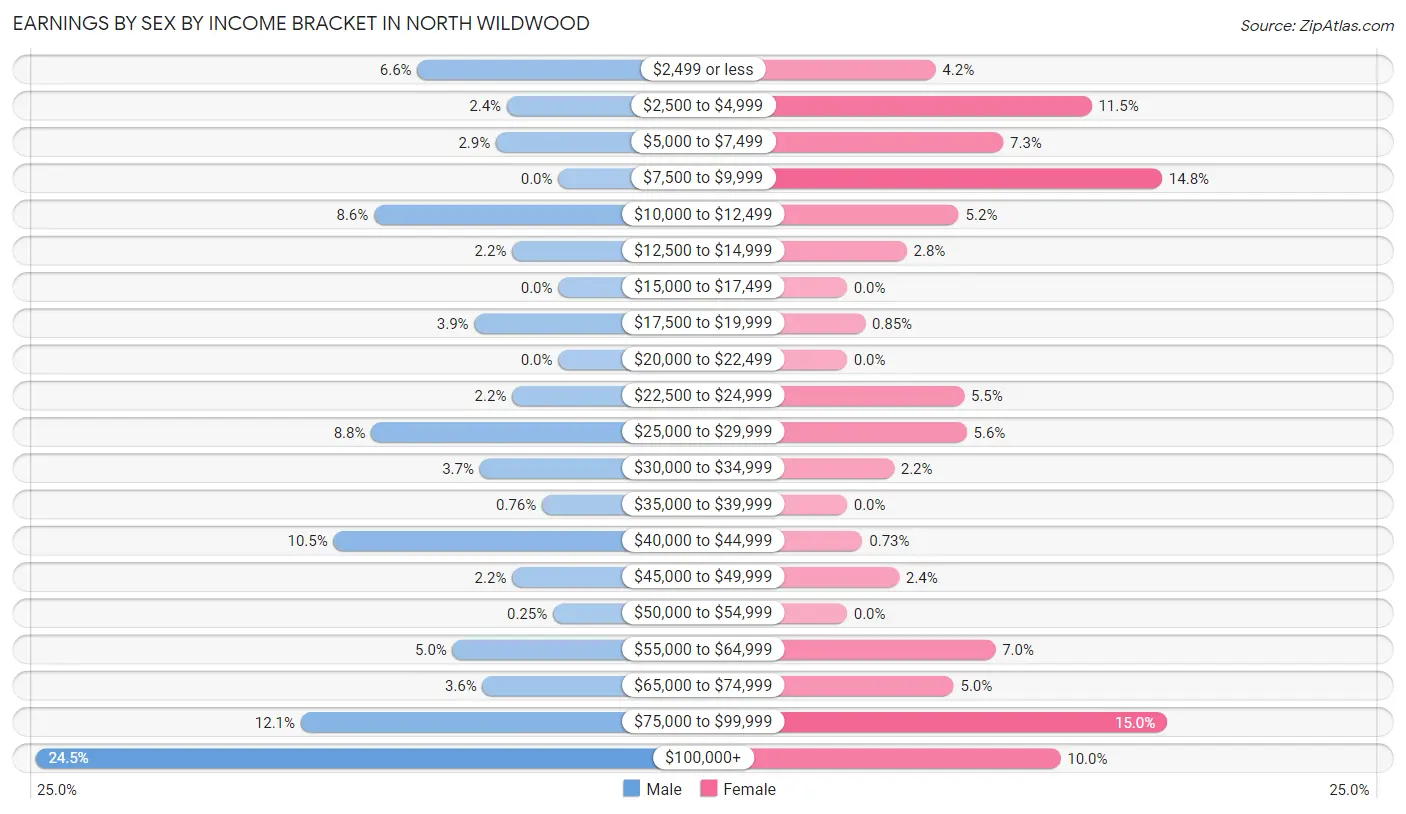
| Income | Male | Female |
| $2,499 or less | 52 (6.6%) | 34 (4.2%) |
| $2,500 to $4,999 | 19 (2.4%) | 94 (11.5%) |
| $5,000 to $7,499 | 23 (2.9%) | 60 (7.3%) |
| $7,500 to $9,999 | 0 (0.0%) | 121 (14.8%) |
| $10,000 to $12,499 | 68 (8.6%) | 43 (5.2%) |
| $12,500 to $14,999 | 17 (2.2%) | 23 (2.8%) |
| $15,000 to $17,499 | 0 (0.0%) | 0 (0.0%) |
| $17,500 to $19,999 | 31 (3.9%) | 7 (0.9%) |
| $20,000 to $22,499 | 0 (0.0%) | 0 (0.0%) |
| $22,500 to $24,999 | 17 (2.2%) | 45 (5.5%) |
| $25,000 to $29,999 | 69 (8.8%) | 46 (5.6%) |
| $30,000 to $34,999 | 29 (3.7%) | 18 (2.2%) |
| $35,000 to $39,999 | 6 (0.8%) | 0 (0.0%) |
| $40,000 to $44,999 | 83 (10.5%) | 6 (0.7%) |
| $45,000 to $49,999 | 17 (2.2%) | 20 (2.4%) |
| $50,000 to $54,999 | 2 (0.3%) | 0 (0.0%) |
| $55,000 to $64,999 | 39 (5.0%) | 57 (7.0%) |
| $65,000 to $74,999 | 28 (3.5%) | 41 (5.0%) |
| $75,000 to $99,999 | 95 (12.1%) | 123 (15.0%) |
| $100,000+ | 193 (24.5%) | 82 (10.0%) |
| Total | 788 (100.0%) | 820 (100.0%) |
Earnings by Sex by Educational Attainment in North Wildwood
Average earnings in North Wildwood are $47,292 for men and $28,235 for women, a difference of 40.3%. Men with an educational attainment of bachelor's degree enjoy the highest average annual earnings of $122,917, while those with high school diploma education earn the least with $41,944. Women with an educational attainment of graduate degree earn the most with the average annual earnings of $94,583, while those with college or associate's degree education have the smallest earnings of $23,790.
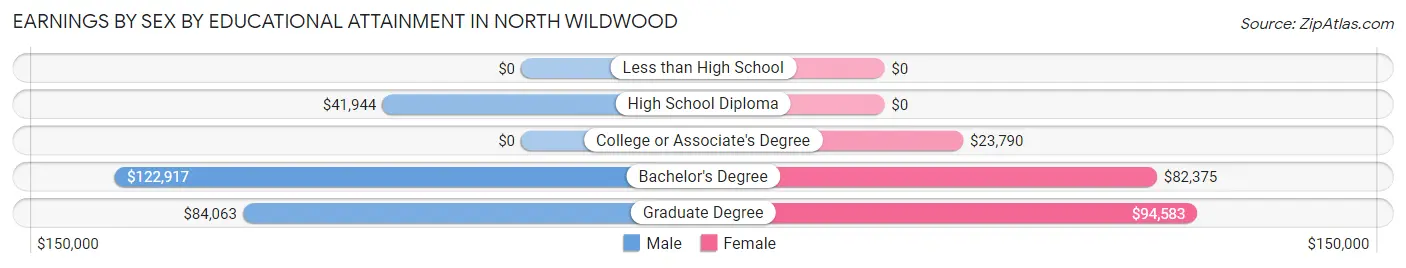
| Educational Attainment | Male Income | Female Income |
| Less than High School | - | - |
| High School Diploma | $41,944 | $0 |
| College or Associate's Degree | - | - |
| Bachelor's Degree | $122,917 | $82,375 |
| Graduate Degree | $84,063 | $94,583 |
| Total | $47,292 | $28,235 |
Family Income in North Wildwood
Family Income Brackets in North Wildwood
According to the North Wildwood family income data, there are 360 families falling into the $75,000 to $99,999 income range, which is the most common income bracket and makes up 32.6% of all families.
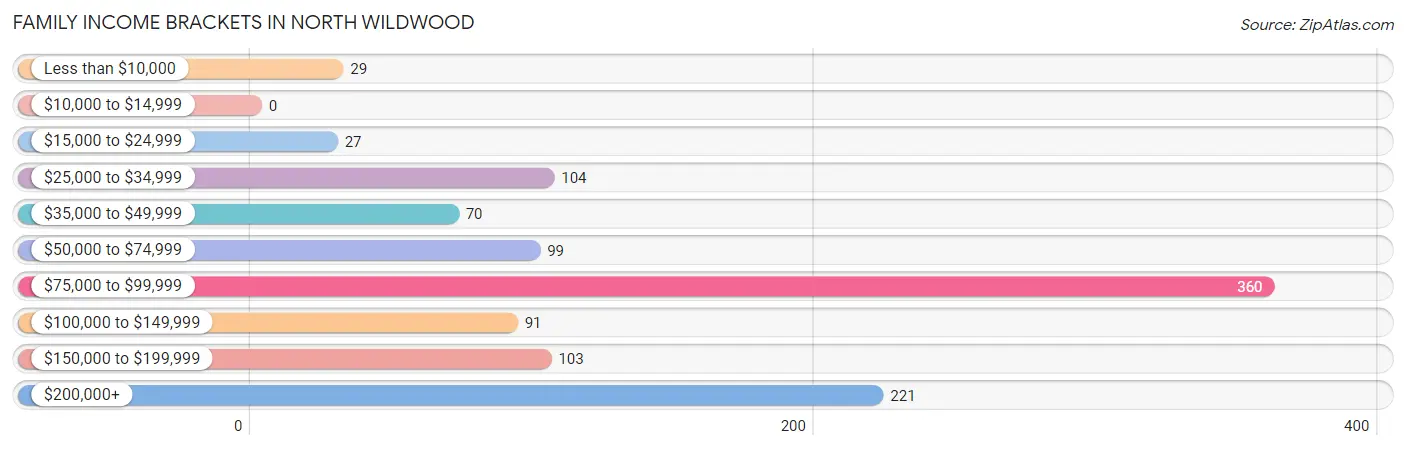
| Income Bracket | # Families | % Families |
| Less than $10,000 | 29 | 2.6% |
| $10,000 to $14,999 | 0 | 0.0% |
| $15,000 to $24,999 | 27 | 2.4% |
| $25,000 to $34,999 | 104 | 9.4% |
| $35,000 to $49,999 | 70 | 6.3% |
| $50,000 to $74,999 | 99 | 9.0% |
| $75,000 to $99,999 | 360 | 32.6% |
| $100,000 to $149,999 | 91 | 8.2% |
| $150,000 to $199,999 | 103 | 9.3% |
| $200,000+ | 221 | 20.0% |
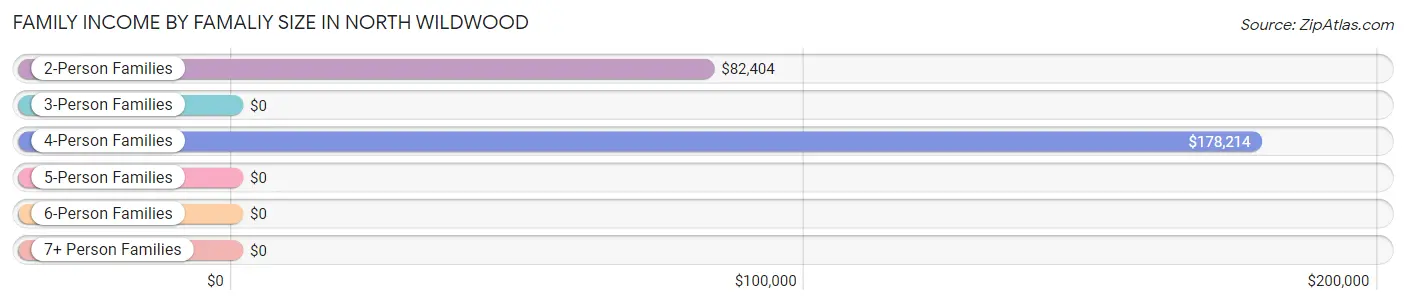
Family Income by Famaliy Size in North Wildwood
4-person families (138 | 12.5%) account for the highest median family income in North Wildwood with $178,214 per family, while 4-person families (138 | 12.5%) have the highest median income of $44,554 per family member.
| Income Bracket | # Families | Median Income |
| 2-Person Families | 887 (80.3%) | $82,404 |
| 3-Person Families | 65 (5.9%) | $0 |
| 4-Person Families | 138 (12.5%) | $178,214 |
| 5-Person Families | 0 (0.0%) | $0 |
| 6-Person Families | 0 (0.0%) | $0 |
| 7+ Person Families | 15 (1.4%) | $0 |
| Total | 1,105 (100.0%) | $89,350 |
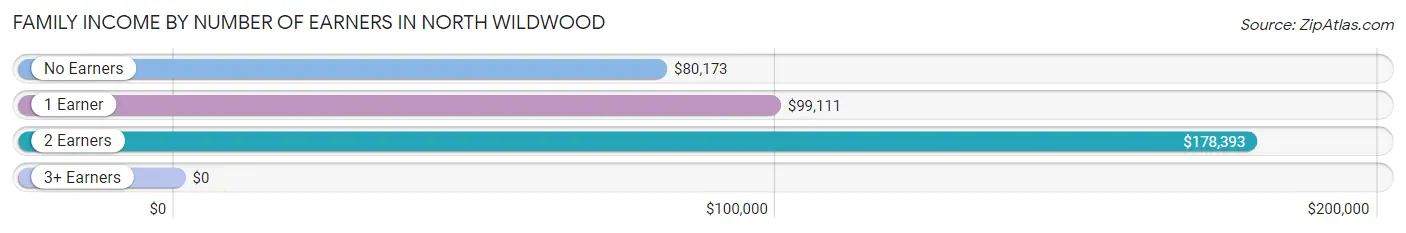
Family Income by Number of Earners in North Wildwood
| Number of Earners | # Families | Median Income |
| No Earners | 483 (43.7%) | $80,173 |
| 1 Earner | 368 (33.3%) | $99,111 |
| 2 Earners | 146 (13.2%) | $178,393 |
| 3+ Earners | 108 (9.8%) | $0 |
| Total | 1,105 (100.0%) | $89,350 |
Household Income in North Wildwood
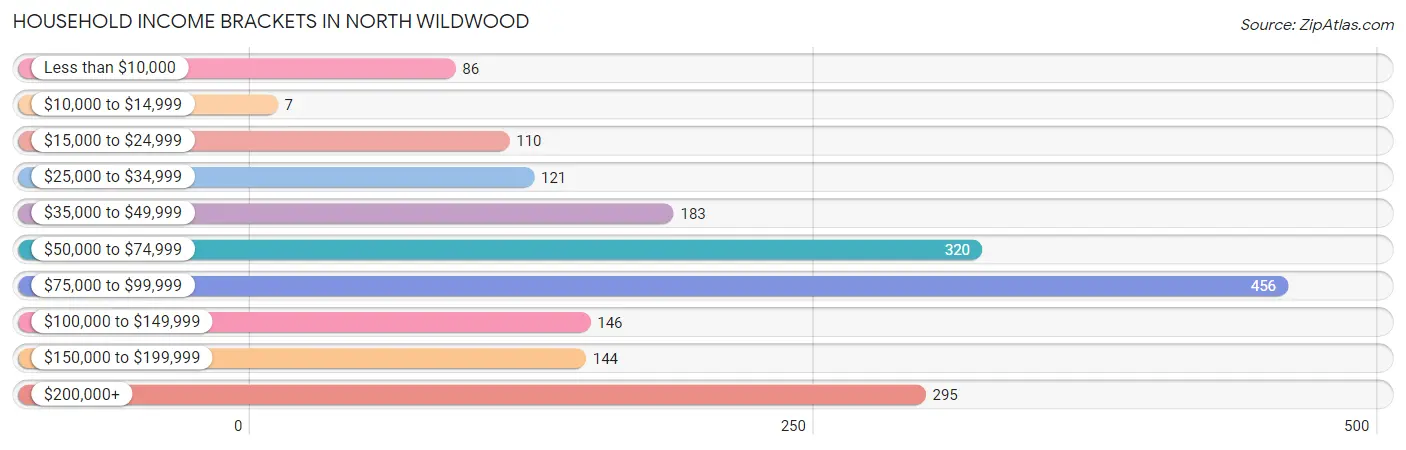
Household Income Brackets in North Wildwood
With 456 households falling in the category, the $75,000 to $99,999 income range is the most frequent in North Wildwood, accounting for 24.4% of all households. In contrast, only 7 households (0.4%) fall into the $10,000 to $14,999 income bracket, making it the least populous group.
| Income Bracket | # Households | % Households |
| Less than $10,000 | 86 | 4.6% |
| $10,000 to $14,999 | 7 | 0.4% |
| $15,000 to $24,999 | 110 | 5.9% |
| $25,000 to $34,999 | 121 | 6.5% |
| $35,000 to $49,999 | 183 | 9.8% |
| $50,000 to $74,999 | 320 | 17.1% |
| $75,000 to $99,999 | 456 | 24.4% |
| $100,000 to $149,999 | 146 | 7.8% |
| $150,000 to $199,999 | 144 | 7.7% |
| $200,000+ | 295 | 15.8% |
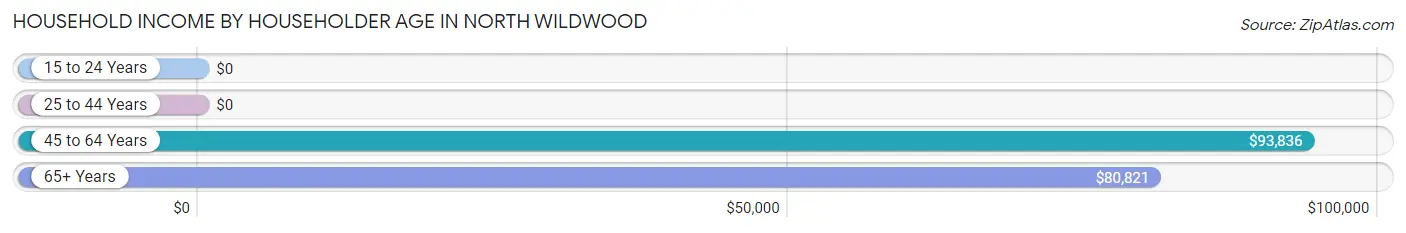
Household Income by Householder Age in North Wildwood
The median household income in North Wildwood is $81,102, with the highest median household income of $93,836 found in the 45 to 64 years age bracket for the primary householder. A total of 589 households (31.5%) fall into this category.
| Income Bracket | # Households | Median Income |
| 15 to 24 Years | 0 (0.0%) | $0 |
| 25 to 44 Years | 215 (11.5%) | $0 |
| 45 to 64 Years | 589 (31.5%) | $93,836 |
| 65+ Years | 1,065 (57.0%) | $80,821 |
| Total | 1,869 (100.0%) | $81,102 |
Poverty in North Wildwood
Income Below Poverty by Sex and Age in North Wildwood
With 5.2% poverty level for males and 9.3% for females among the residents of North Wildwood, 55 to 64 year old males and 18 to 24 year old females are the most vulnerable to poverty, with 58 males (16.0%) and 114 females (76.0%) in their respective age groups living below the poverty level.
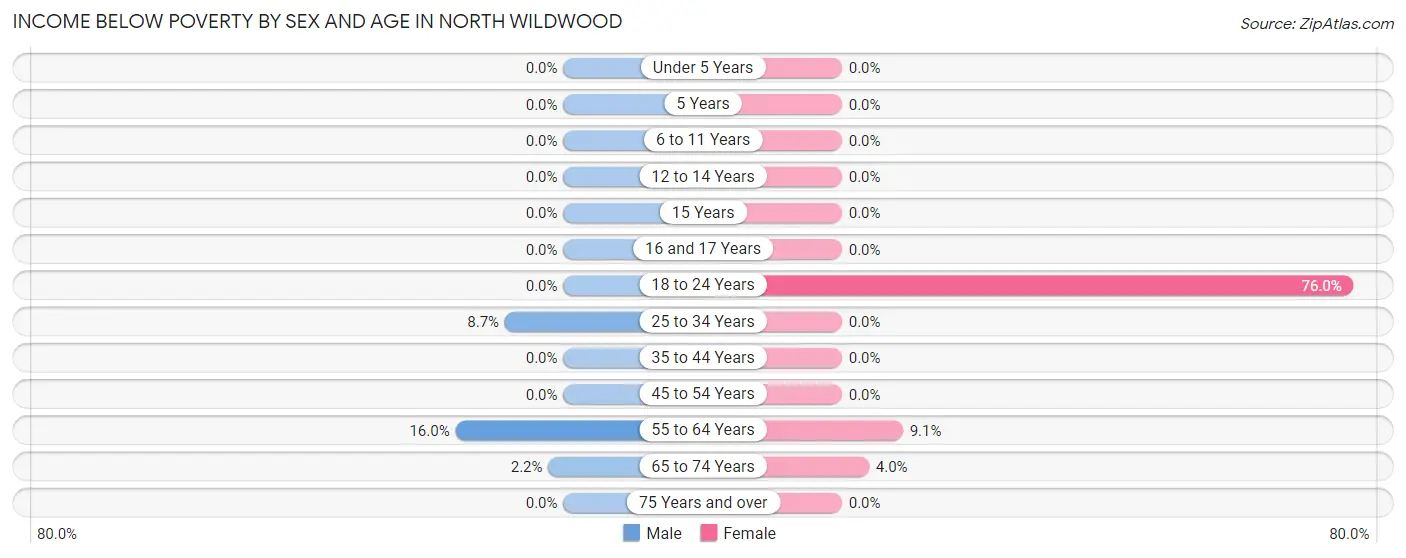
| Age Bracket | Male | Female |
| Under 5 Years | 0 (0.0%) | 0 (0.0%) |
| 5 Years | 0 (0.0%) | 0 (0.0%) |
| 6 to 11 Years | 0 (0.0%) | 0 (0.0%) |
| 12 to 14 Years | 0 (0.0%) | 0 (0.0%) |
| 15 Years | 0 (0.0%) | 0 (0.0%) |
| 16 and 17 Years | 0 (0.0%) | 0 (0.0%) |
| 18 to 24 Years | 0 (0.0%) | 114 (76.0%) |
| 25 to 34 Years | 23 (8.7%) | 0 (0.0%) |
| 35 to 44 Years | 0 (0.0%) | 0 (0.0%) |
| 45 to 54 Years | 0 (0.0%) | 0 (0.0%) |
| 55 to 64 Years | 58 (16.0%) | 38 (9.0%) |
| 65 to 74 Years | 12 (2.2%) | 22 (4.0%) |
| 75 Years and over | 0 (0.0%) | 0 (0.0%) |
| Total | 93 (5.2%) | 174 (9.3%) |
Income Above Poverty by Sex and Age in North Wildwood
According to the poverty statistics in North Wildwood, males aged 6 to 11 years and females aged 6 to 11 years are the age groups that are most secure financially, with 100.0% of males and 100.0% of females in these age groups living above the poverty line.
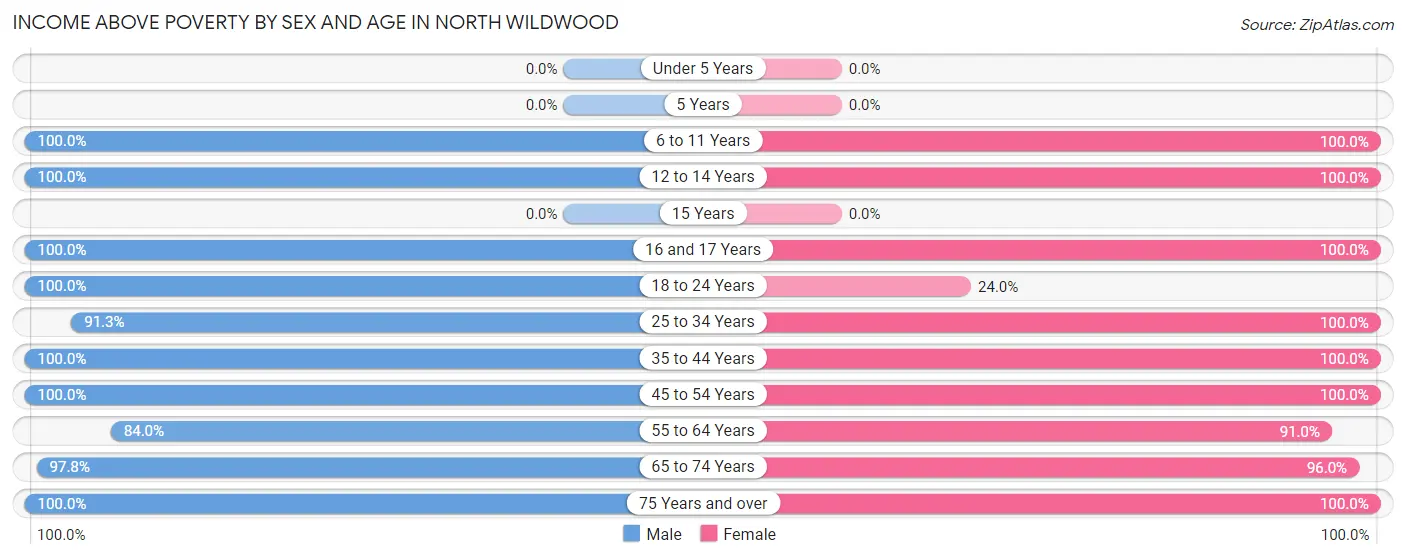
| Age Bracket | Male | Female |
| Under 5 Years | 0 (0.0%) | 0 (0.0%) |
| 5 Years | 0 (0.0%) | 0 (0.0%) |
| 6 to 11 Years | 34 (100.0%) | 63 (100.0%) |
| 12 to 14 Years | 45 (100.0%) | 17 (100.0%) |
| 15 Years | 0 (0.0%) | 0 (0.0%) |
| 16 and 17 Years | 40 (100.0%) | 135 (100.0%) |
| 18 to 24 Years | 79 (100.0%) | 36 (24.0%) |
| 25 to 34 Years | 242 (91.3%) | 31 (100.0%) |
| 35 to 44 Years | 67 (100.0%) | 62 (100.0%) |
| 45 to 54 Years | 60 (100.0%) | 116 (100.0%) |
| 55 to 64 Years | 304 (84.0%) | 382 (90.9%) |
| 65 to 74 Years | 525 (97.8%) | 525 (96.0%) |
| 75 Years and over | 289 (100.0%) | 320 (100.0%) |
| Total | 1,685 (94.8%) | 1,687 (90.6%) |
Income Below Poverty Among Married-Couple Families in North Wildwood
The poverty statistics for married-couple families in North Wildwood show that 3.0% or 29 of the total 963 families live below the poverty line. Families with no children have the highest poverty rate of 3.4%, comprising of 29 families. On the other hand, families with 1 or 2 children have the lowest poverty rate of 0.0%, which includes 0 families.
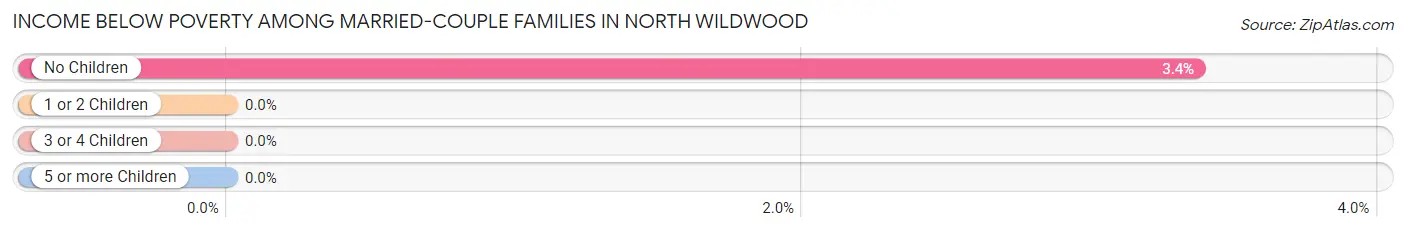
| Children | Above Poverty | Below Poverty |
| No Children | 831 (96.6%) | 29 (3.4%) |
| 1 or 2 Children | 88 (100.0%) | 0 (0.0%) |
| 3 or 4 Children | 15 (100.0%) | 0 (0.0%) |
| 5 or more Children | 0 (0.0%) | 0 (0.0%) |
| Total | 934 (97.0%) | 29 (3.0%) |
Income Below Poverty Among Single-Parent Households in North Wildwood
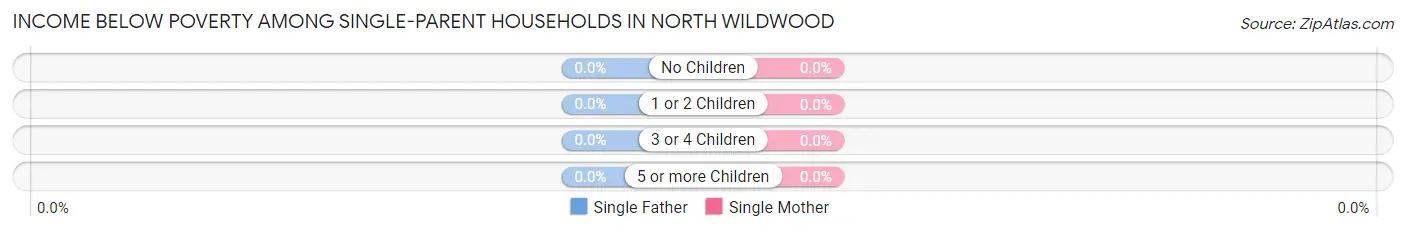
| Children | Single Father | Single Mother |
| No Children | 0 (0.0%) | 0 (0.0%) |
| 1 or 2 Children | 0 (0.0%) | 0 (0.0%) |
| 3 or 4 Children | 0 (0.0%) | 0 (0.0%) |
| 5 or more Children | 0 (0.0%) | 0 (0.0%) |
| Total | 0 (0.0%) | 0 (0.0%) |
Income Below Poverty Among Married-Couple vs Single-Parent Households in North Wildwood
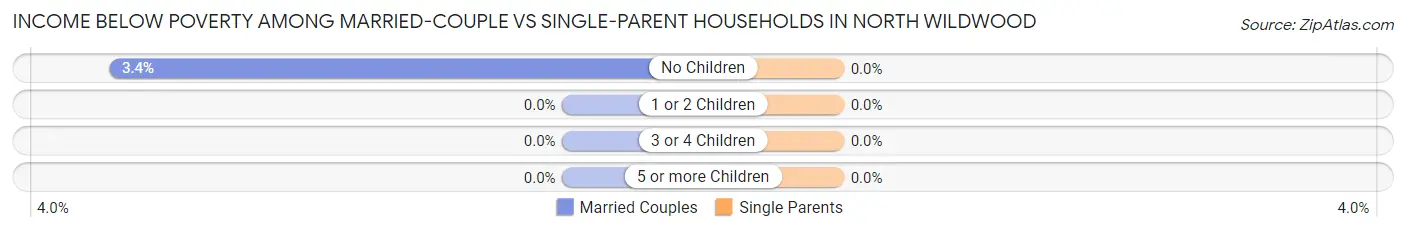
| Children | Married-Couple Families | Single-Parent Households |
| No Children | 29 (3.4%) | 0 (0.0%) |
| 1 or 2 Children | 0 (0.0%) | 0 (0.0%) |
| 3 or 4 Children | 0 (0.0%) | 0 (0.0%) |
| 5 or more Children | 0 (0.0%) | 0 (0.0%) |
| Total | 29 (3.0%) | 0 (0.0%) |
Employment Characteristics in North Wildwood
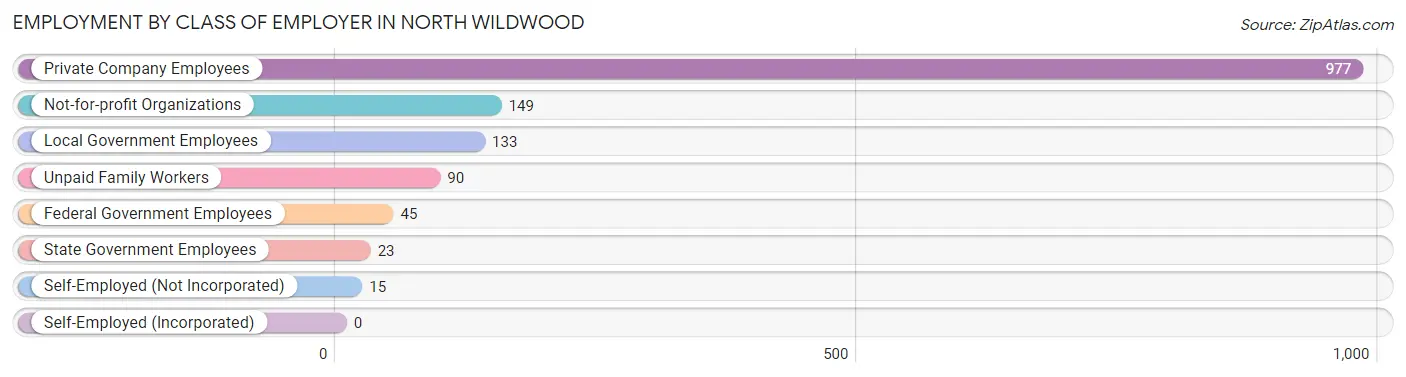
Employment by Class of Employer in North Wildwood
Among the 1,432 employed individuals in North Wildwood, private company employees (977 | 68.2%), not-for-profit organizations (149 | 10.4%), and local government employees (133 | 9.3%) make up the most common classes of employment.
| Employer Class | # Employees | % Employees |
| Private Company Employees | 977 | 68.2% |
| Self-Employed (Incorporated) | 0 | 0.0% |
| Self-Employed (Not Incorporated) | 15 | 1.1% |
| Not-for-profit Organizations | 149 | 10.4% |
| Local Government Employees | 133 | 9.3% |
| State Government Employees | 23 | 1.6% |
| Federal Government Employees | 45 | 3.1% |
| Unpaid Family Workers | 90 | 6.3% |
| Total | 1,432 | 100.0% |
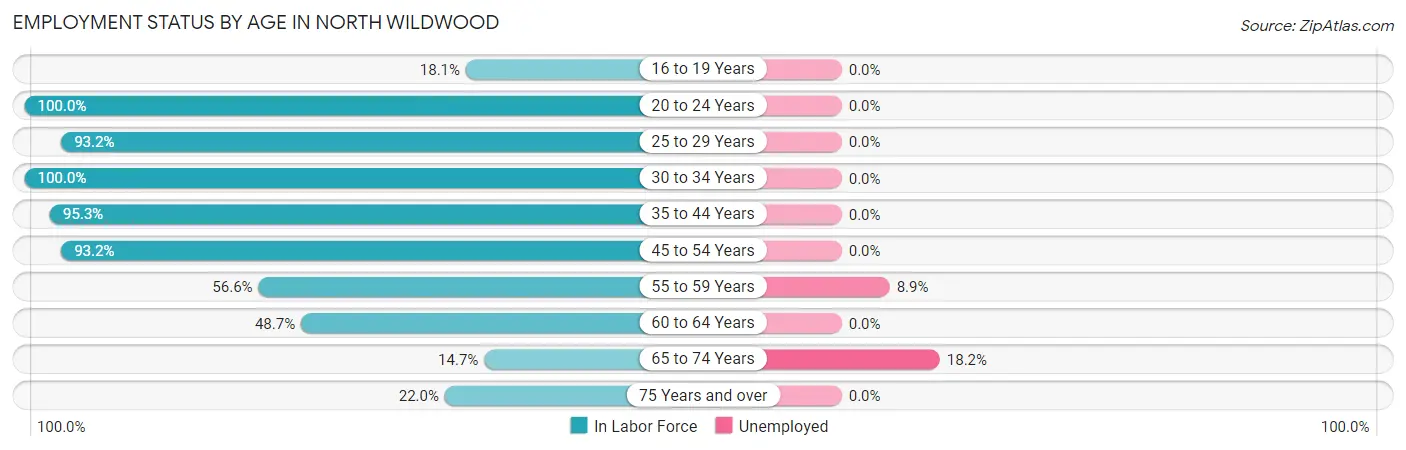
Employment Status by Age in North Wildwood
According to the labor force statistics for North Wildwood, out of the total population over 16 years of age (3,480), 42.9% or 1,493 individuals are in the labor force, with 3.0% or 45 of them unemployed. The age group with the highest labor force participation rate is 20 to 24 years, with 100.0% or 183 individuals in the labor force. Within the labor force, the 65 to 74 years age range has the highest percentage of unemployed individuals, with 18.2% or 29 of them being unemployed.
| Age Bracket | In Labor Force | Unemployed |
| 16 to 19 Years | 40 (18.1%) | 0 (0.0%) |
| 20 to 24 Years | 183 (100.0%) | 0 (0.0%) |
| 25 to 29 Years | 179 (93.2%) | 0 (0.0%) |
| 30 to 34 Years | 104 (100.0%) | 0 (0.0%) |
| 35 to 44 Years | 123 (95.3%) | 0 (0.0%) |
| 45 to 54 Years | 164 (93.2%) | 0 (0.0%) |
| 55 to 59 Years | 180 (56.6%) | 16 (8.9%) |
| 60 to 64 Years | 226 (48.7%) | 0 (0.0%) |
| 65 to 74 Years | 159 (14.7%) | 29 (18.2%) |
| 75 Years and over | 134 (22.0%) | 0 (0.0%) |
| Total | 1,493 (42.9%) | 45 (3.0%) |
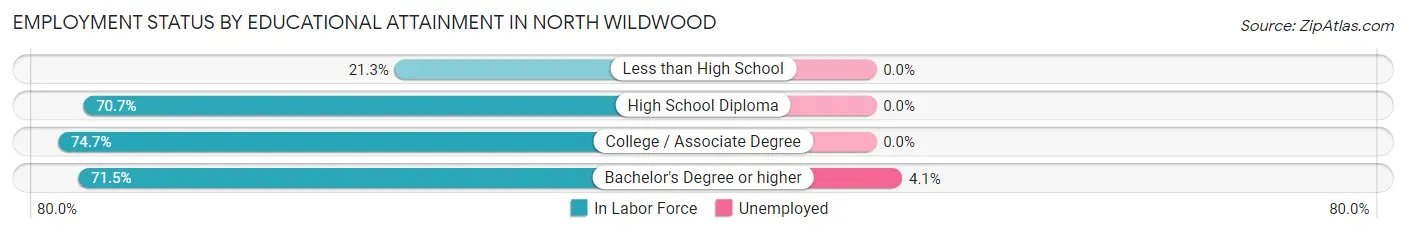
Employment Status by Educational Attainment in North Wildwood
According to labor force statistics for North Wildwood, 70.6% of individuals (976) out of the total population between 25 and 64 years of age (1,383) are in the labor force, with 1.6% or 16 of them being unemployed. The group with the highest labor force participation rate are those with the educational attainment of college / associate degree, with 74.7% or 319 individuals in the labor force. Within the labor force, individuals with bachelor's degree or higher education have the highest percentage of unemployment, with 4.1% or 16 of them being unemployed.
| Educational Attainment | In Labor Force | Unemployed |
| Less than High School | 10 (21.3%) | 0 (0.0%) |
| High School Diploma | 260 (70.7%) | 0 (0.0%) |
| College / Associate Degree | 319 (74.7%) | 0 (0.0%) |
| Bachelor's Degree or higher | 387 (71.5%) | 22 (4.1%) |
| Total | 976 (70.6%) | 22 (1.6%) |
Employment Occupations by Sex in North Wildwood
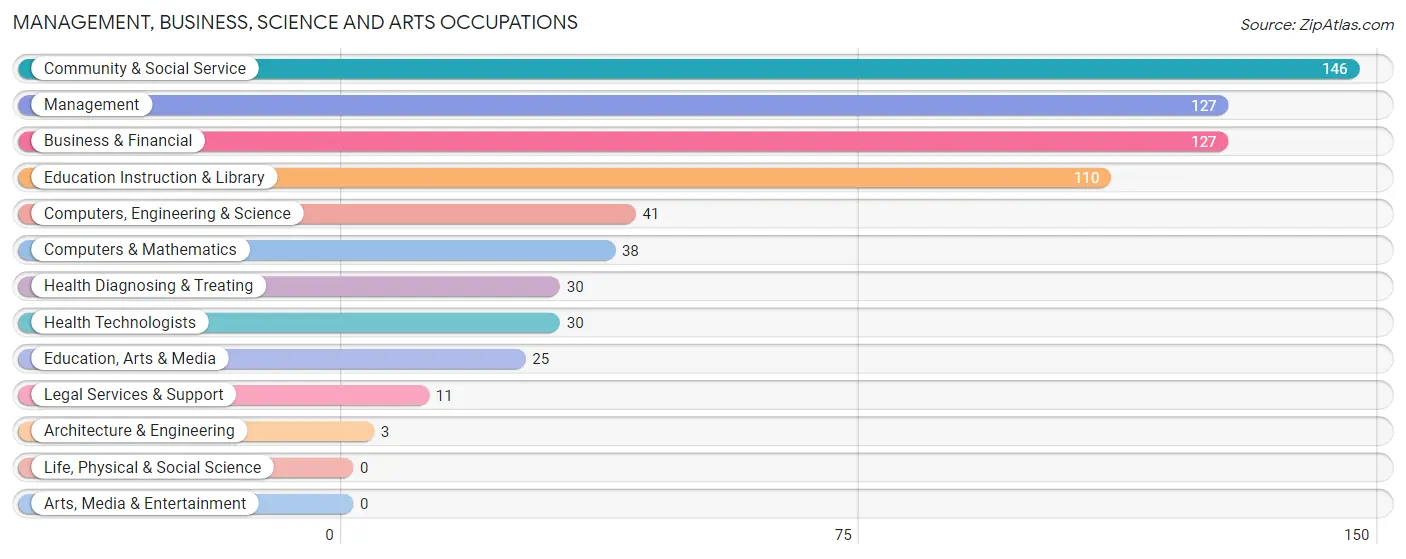
Management, Business, Science and Arts Occupations
The most common Management, Business, Science and Arts occupations in North Wildwood are Community & Social Service (146 | 10.1%), Management (127 | 8.8%), Business & Financial (127 | 8.8%), Education Instruction & Library (110 | 7.6%), and Computers, Engineering & Science (41 | 2.8%).
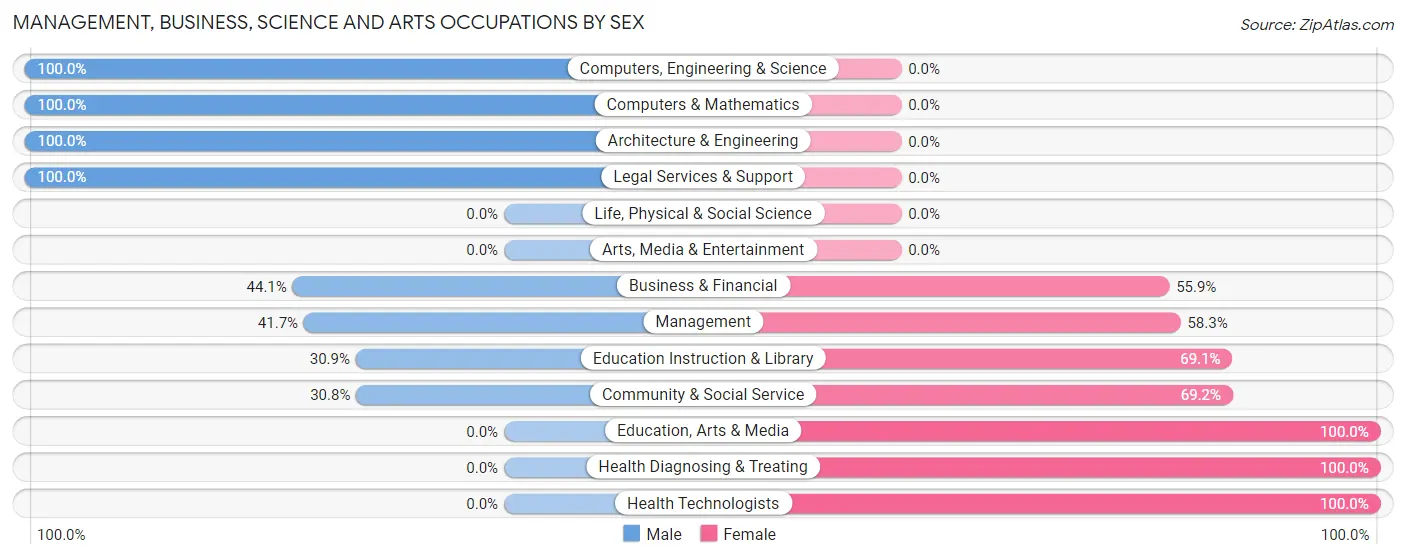
Management, Business, Science and Arts Occupations by Sex
Within the Management, Business, Science and Arts occupations in North Wildwood, the most male-oriented occupations are Computers, Engineering & Science (100.0%), Computers & Mathematics (100.0%), and Architecture & Engineering (100.0%), while the most female-oriented occupations are Education, Arts & Media (100.0%), Health Diagnosing & Treating (100.0%), and Health Technologists (100.0%).
| Occupation | Male | Female |
| Management | 53 (41.7%) | 74 (58.3%) |
| Business & Financial | 56 (44.1%) | 71 (55.9%) |
| Computers, Engineering & Science | 41 (100.0%) | 0 (0.0%) |
| Computers & Mathematics | 38 (100.0%) | 0 (0.0%) |
| Architecture & Engineering | 3 (100.0%) | 0 (0.0%) |
| Life, Physical & Social Science | 0 (0.0%) | 0 (0.0%) |
| Community & Social Service | 45 (30.8%) | 101 (69.2%) |
| Education, Arts & Media | 0 (0.0%) | 25 (100.0%) |
| Legal Services & Support | 11 (100.0%) | 0 (0.0%) |
| Education Instruction & Library | 34 (30.9%) | 76 (69.1%) |
| Arts, Media & Entertainment | 0 (0.0%) | 0 (0.0%) |
| Health Diagnosing & Treating | 0 (0.0%) | 30 (100.0%) |
| Health Technologists | 0 (0.0%) | 30 (100.0%) |
| Total (Category) | 195 (41.4%) | 276 (58.6%) |
| Total (Overall) | 680 (47.0%) | 767 (53.0%) |
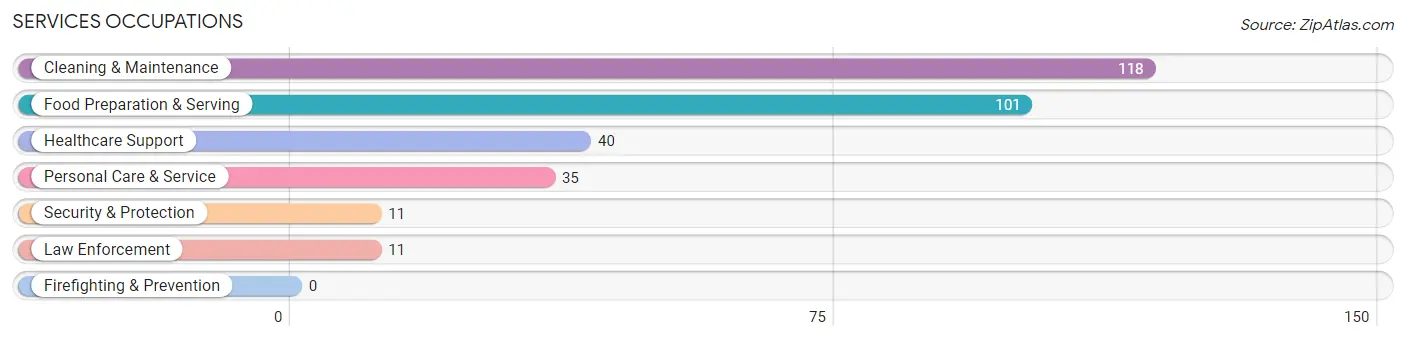
Services Occupations
The most common Services occupations in North Wildwood are Cleaning & Maintenance (118 | 8.2%), Food Preparation & Serving (101 | 7.0%), Healthcare Support (40 | 2.8%), Personal Care & Service (35 | 2.4%), and Security & Protection (11 | 0.8%).
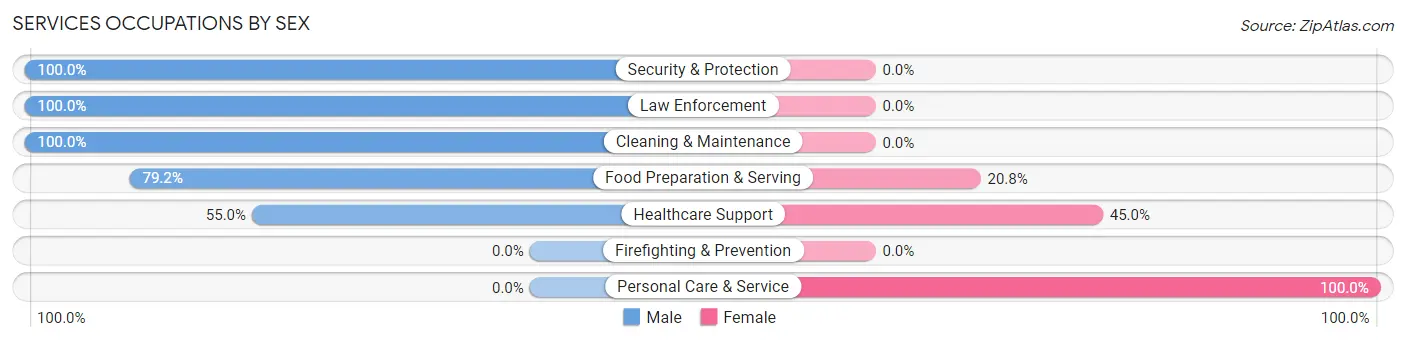
Services Occupations by Sex
Within the Services occupations in North Wildwood, the most male-oriented occupations are Security & Protection (100.0%), Law Enforcement (100.0%), and Cleaning & Maintenance (100.0%), while the most female-oriented occupations are Personal Care & Service (100.0%), Healthcare Support (45.0%), and Food Preparation & Serving (20.8%).
| Occupation | Male | Female |
| Healthcare Support | 22 (55.0%) | 18 (45.0%) |
| Security & Protection | 11 (100.0%) | 0 (0.0%) |
| Firefighting & Prevention | 0 (0.0%) | 0 (0.0%) |
| Law Enforcement | 11 (100.0%) | 0 (0.0%) |
| Food Preparation & Serving | 80 (79.2%) | 21 (20.8%) |
| Cleaning & Maintenance | 118 (100.0%) | 0 (0.0%) |
| Personal Care & Service | 0 (0.0%) | 35 (100.0%) |
| Total (Category) | 231 (75.7%) | 74 (24.3%) |
| Total (Overall) | 680 (47.0%) | 767 (53.0%) |
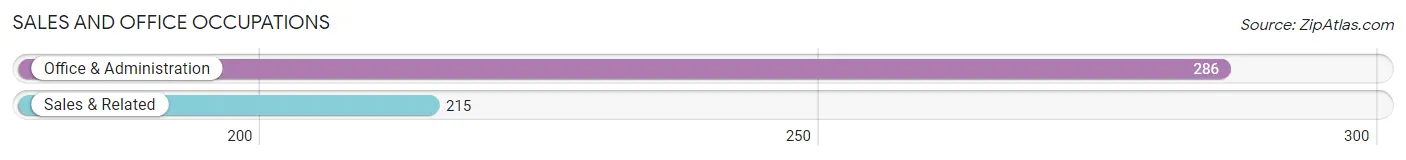
Sales and Office Occupations
The most common Sales and Office occupations in North Wildwood are Office & Administration (286 | 19.8%), and Sales & Related (215 | 14.9%).
Sales and Office Occupations by Sex
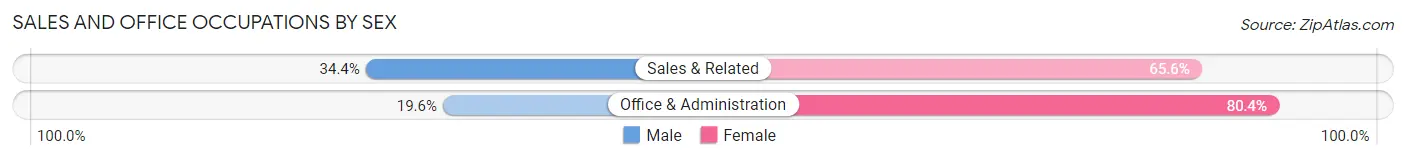
| Occupation | Male | Female |
| Sales & Related | 74 (34.4%) | 141 (65.6%) |
| Office & Administration | 56 (19.6%) | 230 (80.4%) |
| Total (Category) | 130 (26.0%) | 371 (74.1%) |
| Total (Overall) | 680 (47.0%) | 767 (53.0%) |
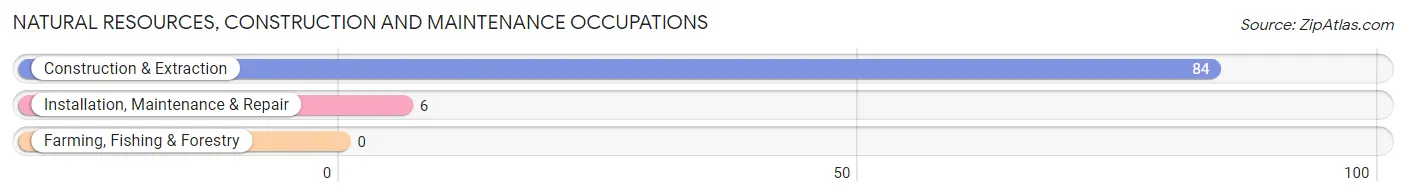
Natural Resources, Construction and Maintenance Occupations
The most common Natural Resources, Construction and Maintenance occupations in North Wildwood are Construction & Extraction (84 | 5.8%), and Installation, Maintenance & Repair (6 | 0.4%).
Natural Resources, Construction and Maintenance Occupations by Sex
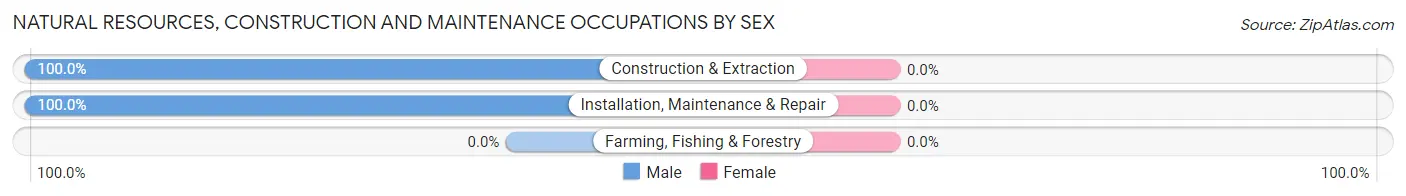
| Occupation | Male | Female |
| Farming, Fishing & Forestry | 0 (0.0%) | 0 (0.0%) |
| Construction & Extraction | 84 (100.0%) | 0 (0.0%) |
| Installation, Maintenance & Repair | 6 (100.0%) | 0 (0.0%) |
| Total (Category) | 90 (100.0%) | 0 (0.0%) |
| Total (Overall) | 680 (47.0%) | 767 (53.0%) |
Production, Transportation and Moving Occupations
The most common Production, Transportation and Moving occupations in North Wildwood are Transportation (75 | 5.2%), and Material Moving (5 | 0.4%).
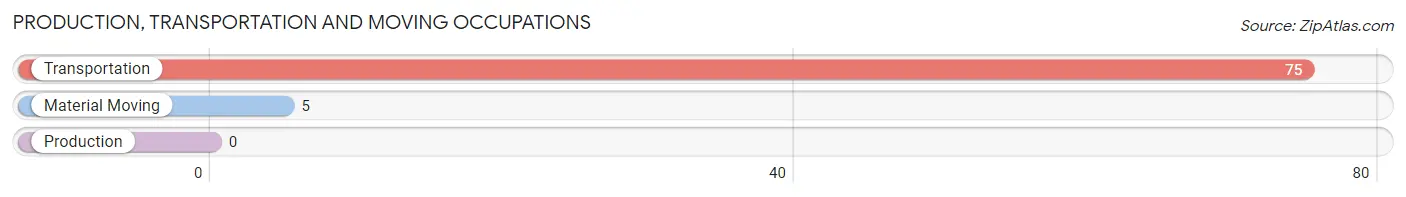
Production, Transportation and Moving Occupations by Sex
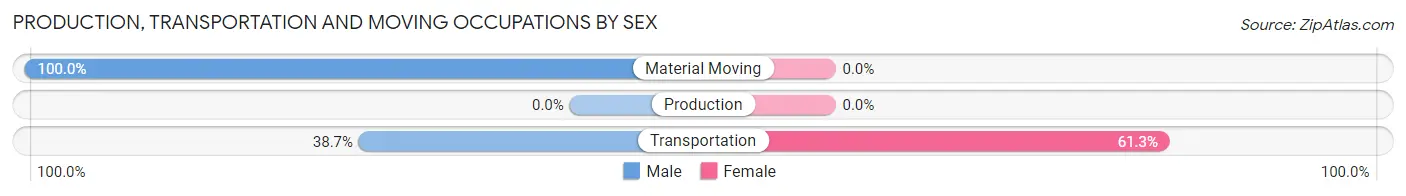
| Occupation | Male | Female |
| Production | 0 (0.0%) | 0 (0.0%) |
| Transportation | 29 (38.7%) | 46 (61.3%) |
| Material Moving | 5 (100.0%) | 0 (0.0%) |
| Total (Category) | 34 (42.5%) | 46 (57.5%) |
| Total (Overall) | 680 (47.0%) | 767 (53.0%) |
Employment Industries by Sex in North Wildwood
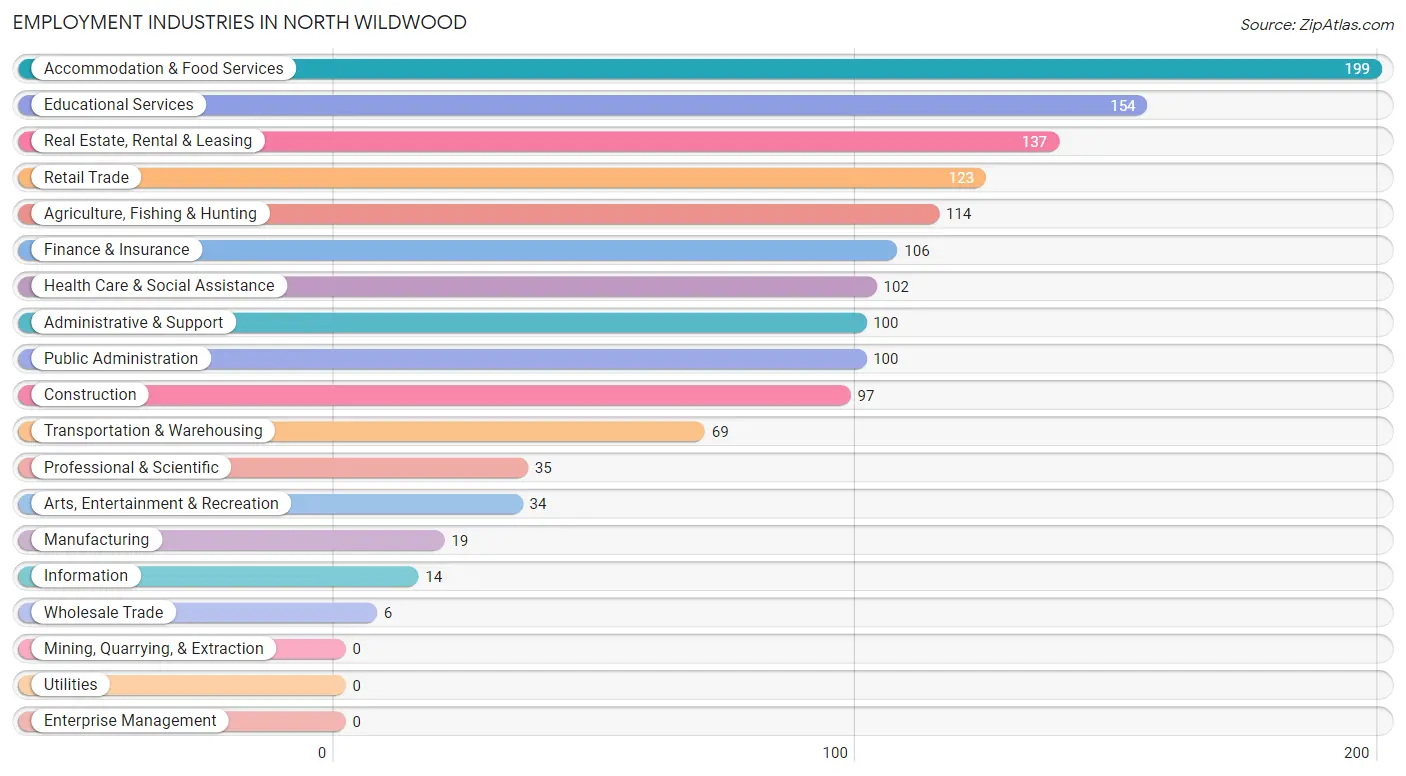
Employment Industries in North Wildwood
The major employment industries in North Wildwood include Accommodation & Food Services (199 | 13.8%), Educational Services (154 | 10.6%), Real Estate, Rental & Leasing (137 | 9.5%), Retail Trade (123 | 8.5%), and Agriculture, Fishing & Hunting (114 | 7.9%).
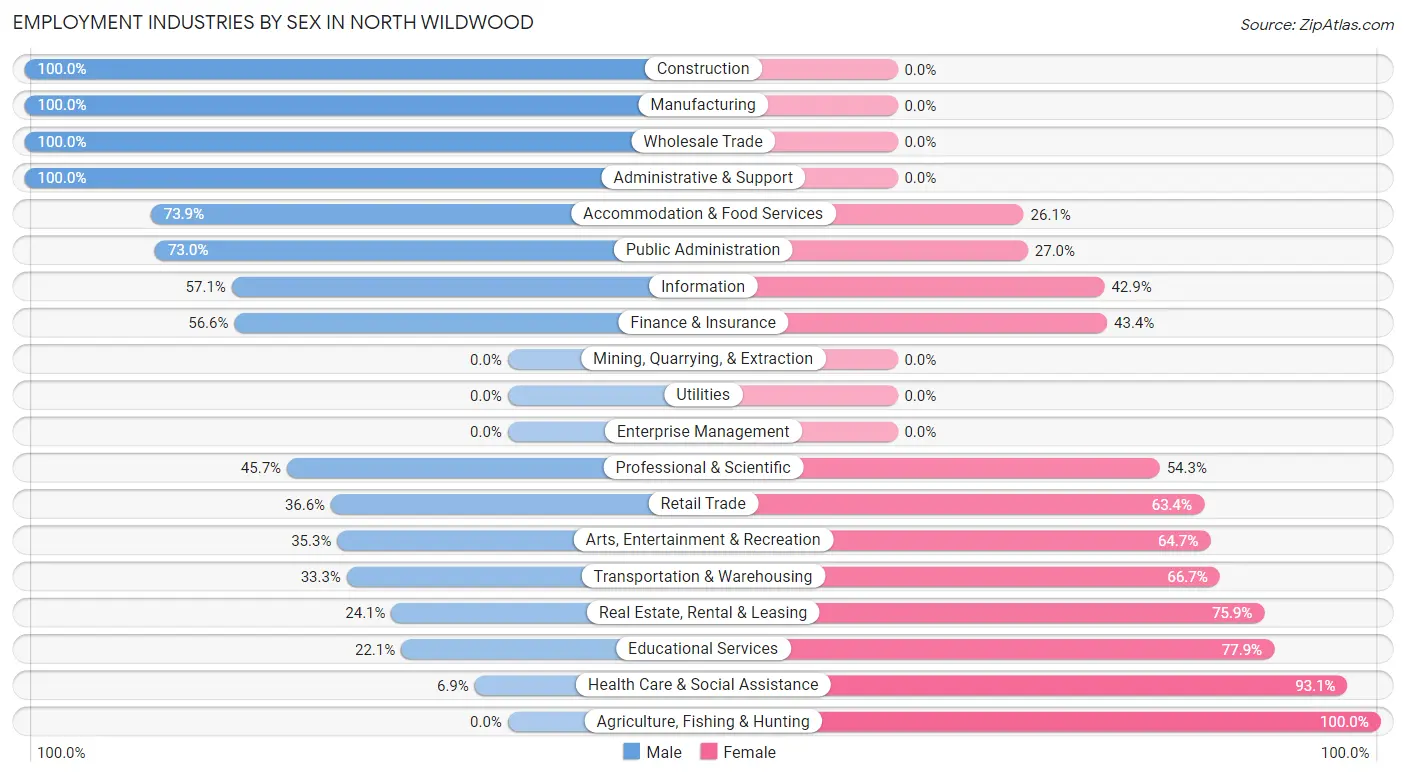
Employment Industries by Sex in North Wildwood
The North Wildwood industries that see more men than women are Construction (100.0%), Manufacturing (100.0%), and Wholesale Trade (100.0%), whereas the industries that tend to have a higher number of women are Agriculture, Fishing & Hunting (100.0%), Health Care & Social Assistance (93.1%), and Educational Services (77.9%).
| Industry | Male | Female |
| Agriculture, Fishing & Hunting | 0 (0.0%) | 114 (100.0%) |
| Mining, Quarrying, & Extraction | 0 (0.0%) | 0 (0.0%) |
| Construction | 97 (100.0%) | 0 (0.0%) |
| Manufacturing | 19 (100.0%) | 0 (0.0%) |
| Wholesale Trade | 6 (100.0%) | 0 (0.0%) |
| Retail Trade | 45 (36.6%) | 78 (63.4%) |
| Transportation & Warehousing | 23 (33.3%) | 46 (66.7%) |
| Utilities | 0 (0.0%) | 0 (0.0%) |
| Information | 8 (57.1%) | 6 (42.9%) |
| Finance & Insurance | 60 (56.6%) | 46 (43.4%) |
| Real Estate, Rental & Leasing | 33 (24.1%) | 104 (75.9%) |
| Professional & Scientific | 16 (45.7%) | 19 (54.3%) |
| Enterprise Management | 0 (0.0%) | 0 (0.0%) |
| Administrative & Support | 100 (100.0%) | 0 (0.0%) |
| Educational Services | 34 (22.1%) | 120 (77.9%) |
| Health Care & Social Assistance | 7 (6.9%) | 95 (93.1%) |
| Arts, Entertainment & Recreation | 12 (35.3%) | 22 (64.7%) |
| Accommodation & Food Services | 147 (73.9%) | 52 (26.1%) |
| Public Administration | 73 (73.0%) | 27 (27.0%) |
| Total | 680 (47.0%) | 767 (53.0%) |
Education in North Wildwood
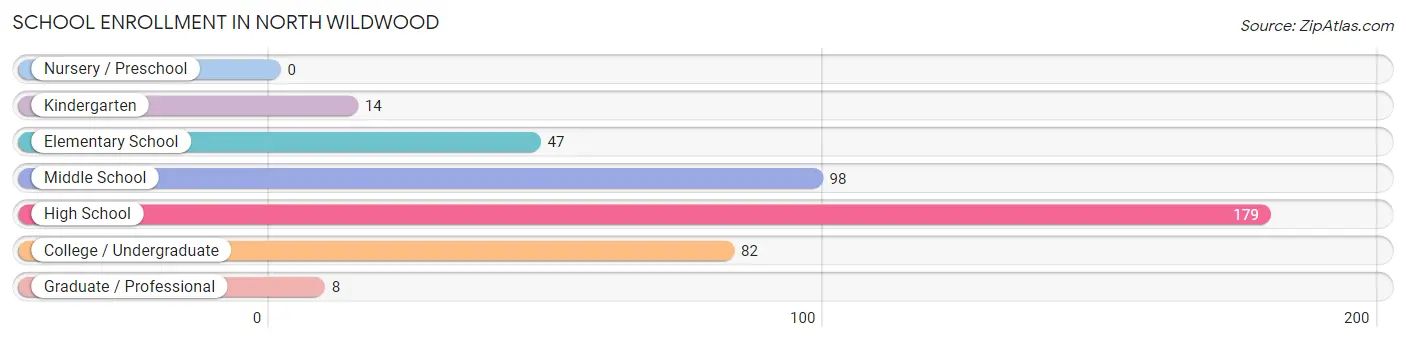
School Enrollment in North Wildwood
The most common levels of schooling among the 428 students in North Wildwood are high school (179 | 41.8%), middle school (98 | 22.9%), and college / undergraduate (82 | 19.2%).
| School Level | # Students | % Students |
| Nursery / Preschool | 0 | 0.0% |
| Kindergarten | 14 | 3.3% |
| Elementary School | 47 | 11.0% |
| Middle School | 98 | 22.9% |
| High School | 179 | 41.8% |
| College / Undergraduate | 82 | 19.2% |
| Graduate / Professional | 8 | 1.9% |
| Total | 428 | 100.0% |
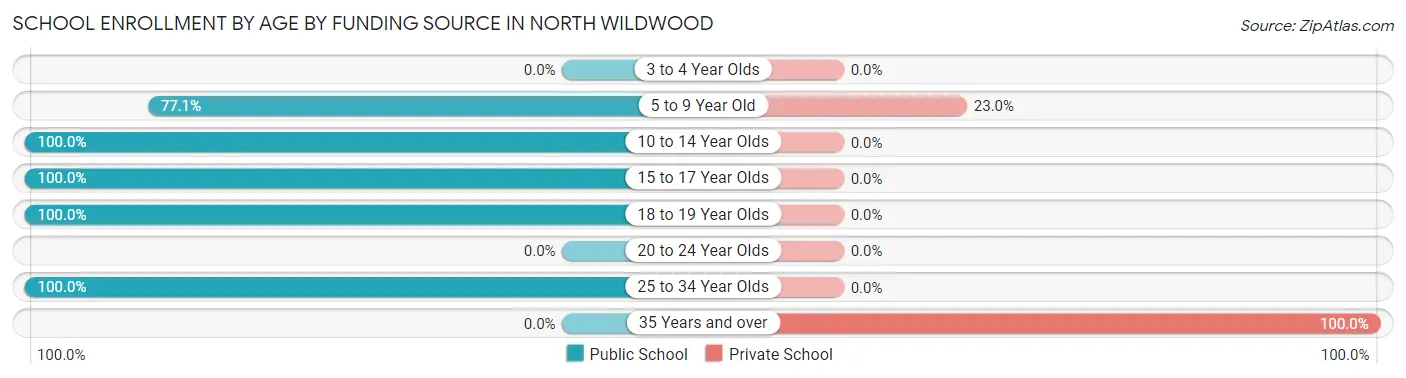
School Enrollment by Age by Funding Source in North Wildwood
Out of a total of 428 students who are enrolled in schools in North Wildwood, 26 (6.1%) attend a private institution, while the remaining 402 (93.9%) are enrolled in public schools. The age group of 35 years and over has the highest likelihood of being enrolled in private schools, with 12 (100.0% in the age bracket) enrolled. Conversely, the age group of 10 to 14 year olds has the lowest likelihood of being enrolled in a private school, with 98 (100.0% in the age bracket) attending a public institution.
| Age Bracket | Public School | Private School |
| 3 to 4 Year Olds | 0 (0.0%) | 0 (0.0%) |
| 5 to 9 Year Old | 47 (77.0%) | 14 (23.0%) |
| 10 to 14 Year Olds | 98 (100.0%) | 0 (0.0%) |
| 15 to 17 Year Olds | 175 (100.0%) | 0 (0.0%) |
| 18 to 19 Year Olds | 46 (100.0%) | 0 (0.0%) |
| 20 to 24 Year Olds | 0 (0.0%) | 0 (0.0%) |
| 25 to 34 Year Olds | 36 (100.0%) | 0 (0.0%) |
| 35 Years and over | 0 (0.0%) | 12 (100.0%) |
| Total | 402 (93.9%) | 26 (6.1%) |
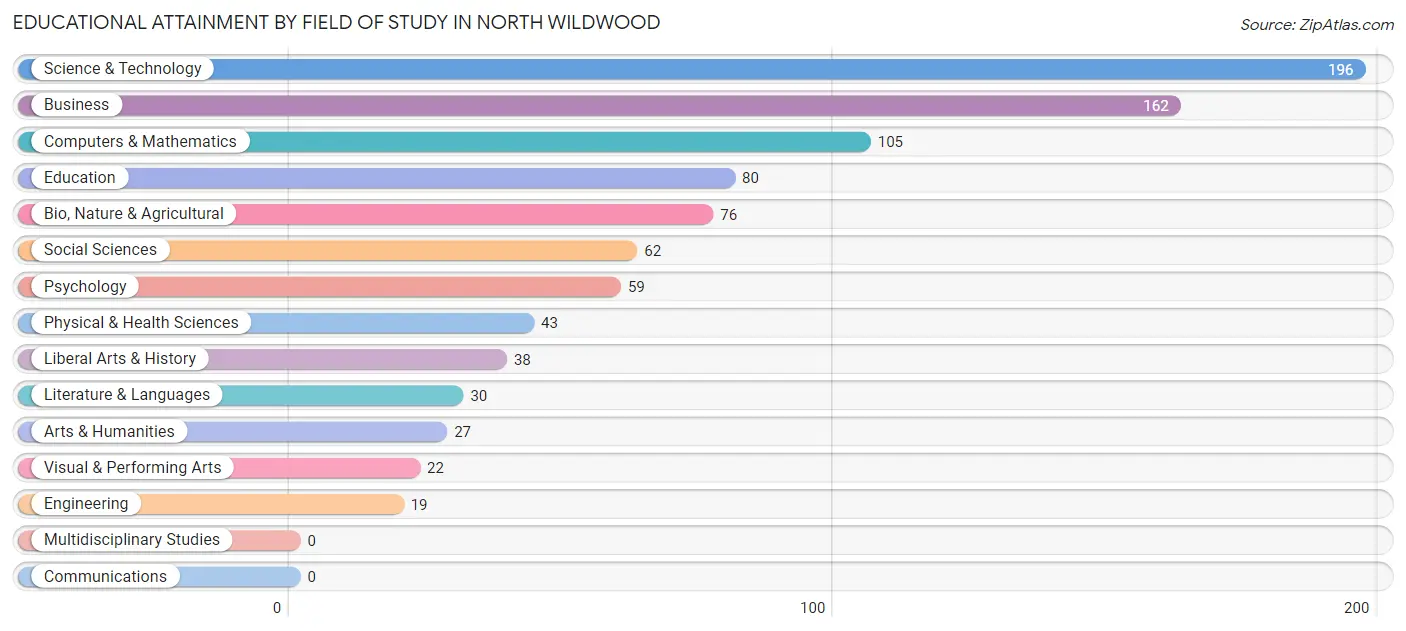
Educational Attainment by Field of Study in North Wildwood
Science & technology (196 | 21.3%), business (162 | 17.6%), computers & mathematics (105 | 11.4%), education (80 | 8.7%), and bio, nature & agricultural (76 | 8.3%) are the most common fields of study among 919 individuals in North Wildwood who have obtained a bachelor's degree or higher.
| Field of Study | # Graduates | % Graduates |
| Computers & Mathematics | 105 | 11.4% |
| Bio, Nature & Agricultural | 76 | 8.3% |
| Physical & Health Sciences | 43 | 4.7% |
| Psychology | 59 | 6.4% |
| Social Sciences | 62 | 6.8% |
| Engineering | 19 | 2.1% |
| Multidisciplinary Studies | 0 | 0.0% |
| Science & Technology | 196 | 21.3% |
| Business | 162 | 17.6% |
| Education | 80 | 8.7% |
| Literature & Languages | 30 | 3.3% |
| Liberal Arts & History | 38 | 4.1% |
| Visual & Performing Arts | 22 | 2.4% |
| Communications | 0 | 0.0% |
| Arts & Humanities | 27 | 2.9% |
| Total | 919 | 100.0% |
Transportation & Commute in North Wildwood
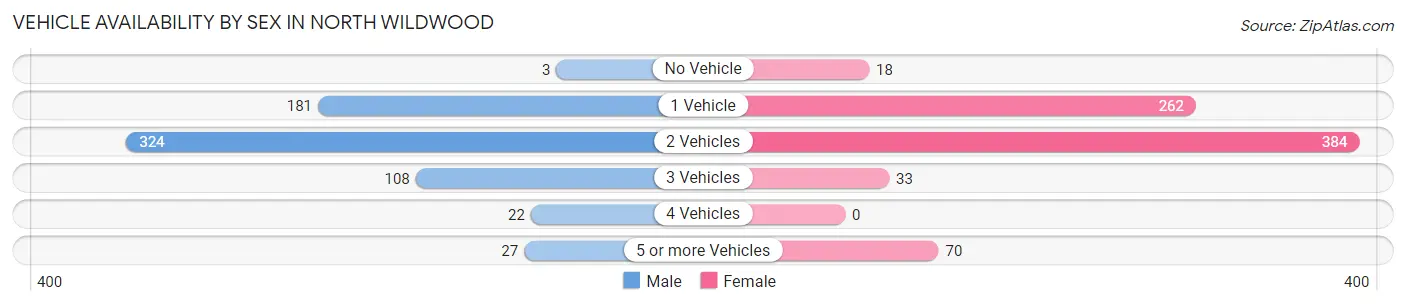
Vehicle Availability by Sex in North Wildwood
The most prevalent vehicle ownership categories in North Wildwood are males with 2 vehicles (324, accounting for 48.7%) and females with 2 vehicles (384, making up 42.2%).
| Vehicles Available | Male | Female |
| No Vehicle | 3 (0.4%) | 18 (2.4%) |
| 1 Vehicle | 181 (27.2%) | 262 (34.2%) |
| 2 Vehicles | 324 (48.7%) | 384 (50.1%) |
| 3 Vehicles | 108 (16.2%) | 33 (4.3%) |
| 4 Vehicles | 22 (3.3%) | 0 (0.0%) |
| 5 or more Vehicles | 27 (4.1%) | 70 (9.1%) |
| Total | 665 (100.0%) | 767 (100.0%) |
Commute Time in North Wildwood
The most frequently occuring commute durations in North Wildwood are 10 to 14 minutes (340 commuters, 24.5%), 90 or more minutes (212 commuters, 15.3%), and 15 to 19 minutes (207 commuters, 14.9%).
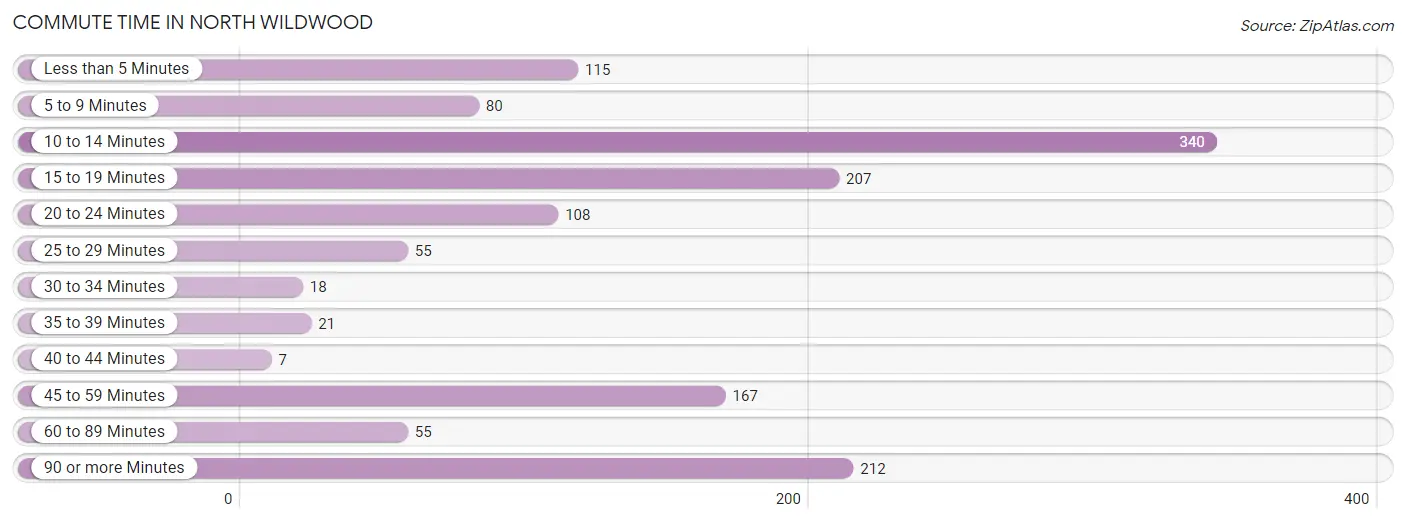
| Commute Time | # Commuters | % Commuters |
| Less than 5 Minutes | 115 | 8.3% |
| 5 to 9 Minutes | 80 | 5.8% |
| 10 to 14 Minutes | 340 | 24.5% |
| 15 to 19 Minutes | 207 | 14.9% |
| 20 to 24 Minutes | 108 | 7.8% |
| 25 to 29 Minutes | 55 | 4.0% |
| 30 to 34 Minutes | 18 | 1.3% |
| 35 to 39 Minutes | 21 | 1.5% |
| 40 to 44 Minutes | 7 | 0.5% |
| 45 to 59 Minutes | 167 | 12.1% |
| 60 to 89 Minutes | 55 | 4.0% |
| 90 or more Minutes | 212 | 15.3% |
Commute Time by Sex in North Wildwood
The most common commute times in North Wildwood are 10 to 14 minutes (156 commuters, 23.8%) for males and 10 to 14 minutes (184 commuters, 25.2%) for females.
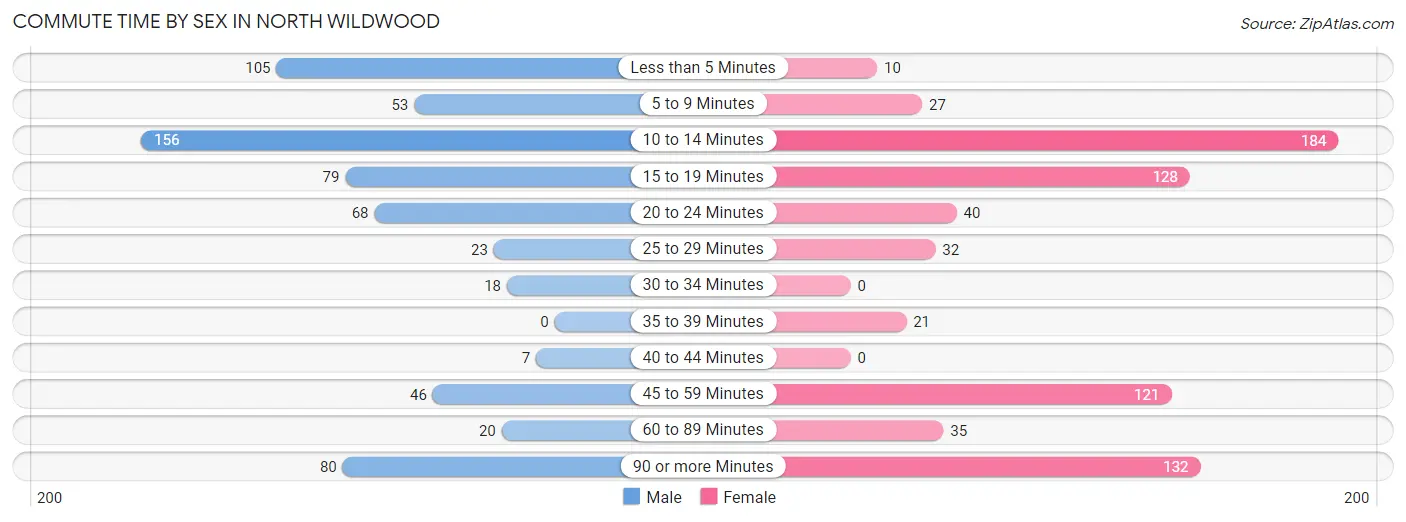
| Commute Time | Male | Female |
| Less than 5 Minutes | 105 (16.0%) | 10 (1.4%) |
| 5 to 9 Minutes | 53 (8.1%) | 27 (3.7%) |
| 10 to 14 Minutes | 156 (23.8%) | 184 (25.2%) |
| 15 to 19 Minutes | 79 (12.1%) | 128 (17.5%) |
| 20 to 24 Minutes | 68 (10.4%) | 40 (5.5%) |
| 25 to 29 Minutes | 23 (3.5%) | 32 (4.4%) |
| 30 to 34 Minutes | 18 (2.8%) | 0 (0.0%) |
| 35 to 39 Minutes | 0 (0.0%) | 21 (2.9%) |
| 40 to 44 Minutes | 7 (1.1%) | 0 (0.0%) |
| 45 to 59 Minutes | 46 (7.0%) | 121 (16.6%) |
| 60 to 89 Minutes | 20 (3.0%) | 35 (4.8%) |
| 90 or more Minutes | 80 (12.2%) | 132 (18.1%) |
Time of Departure to Work by Sex in North Wildwood
The most frequent times of departure to work in North Wildwood are 8:00 AM to 8:29 AM (119, 18.2%) for males and 8:00 AM to 8:29 AM (168, 23.0%) for females.
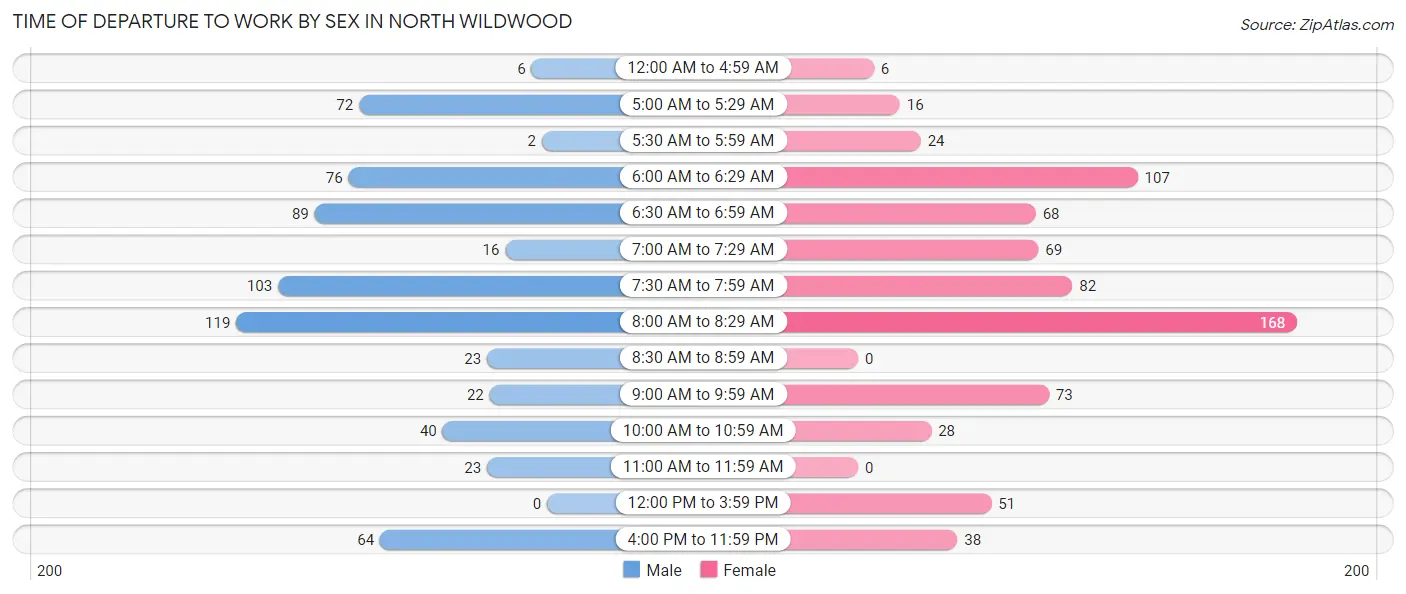
| Time of Departure | Male | Female |
| 12:00 AM to 4:59 AM | 6 (0.9%) | 6 (0.8%) |
| 5:00 AM to 5:29 AM | 72 (11.0%) | 16 (2.2%) |
| 5:30 AM to 5:59 AM | 2 (0.3%) | 24 (3.3%) |
| 6:00 AM to 6:29 AM | 76 (11.6%) | 107 (14.7%) |
| 6:30 AM to 6:59 AM | 89 (13.6%) | 68 (9.3%) |
| 7:00 AM to 7:29 AM | 16 (2.4%) | 69 (9.5%) |
| 7:30 AM to 7:59 AM | 103 (15.7%) | 82 (11.2%) |
| 8:00 AM to 8:29 AM | 119 (18.2%) | 168 (23.0%) |
| 8:30 AM to 8:59 AM | 23 (3.5%) | 0 (0.0%) |
| 9:00 AM to 9:59 AM | 22 (3.4%) | 73 (10.0%) |
| 10:00 AM to 10:59 AM | 40 (6.1%) | 28 (3.8%) |
| 11:00 AM to 11:59 AM | 23 (3.5%) | 0 (0.0%) |
| 12:00 PM to 3:59 PM | 0 (0.0%) | 51 (7.0%) |
| 4:00 PM to 11:59 PM | 64 (9.8%) | 38 (5.2%) |
| Total | 655 (100.0%) | 730 (100.0%) |
Housing Occupancy in North Wildwood
Occupancy by Ownership in North Wildwood
Of the total 1,869 dwellings in North Wildwood, owner-occupied units account for 1,409 (75.4%), while renter-occupied units make up 460 (24.6%).
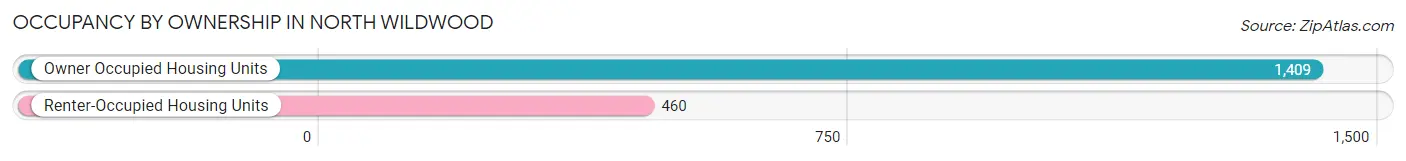
| Occupancy | # Housing Units | % Housing Units |
| Owner Occupied Housing Units | 1,409 | 75.4% |
| Renter-Occupied Housing Units | 460 | 24.6% |
| Total Occupied Housing Units | 1,869 | 100.0% |
Occupancy by Household Size in North Wildwood
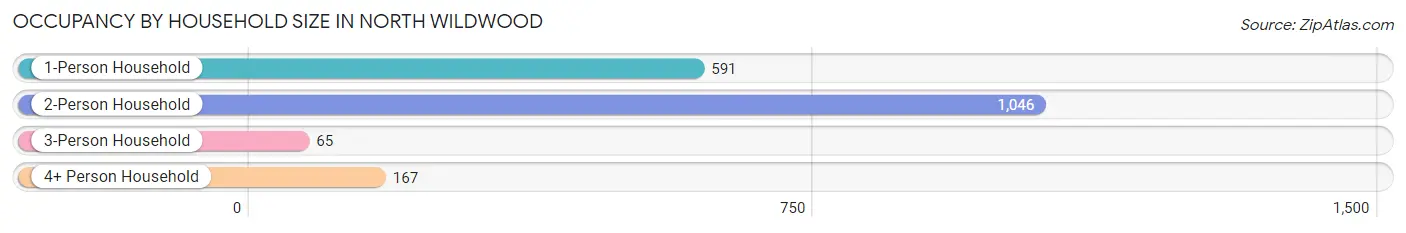
| Household Size | # Housing Units | % Housing Units |
| 1-Person Household | 591 | 31.6% |
| 2-Person Household | 1,046 | 56.0% |
| 3-Person Household | 65 | 3.5% |
| 4+ Person Household | 167 | 8.9% |
| Total Housing Units | 1,869 | 100.0% |
Occupancy by Ownership by Household Size in North Wildwood
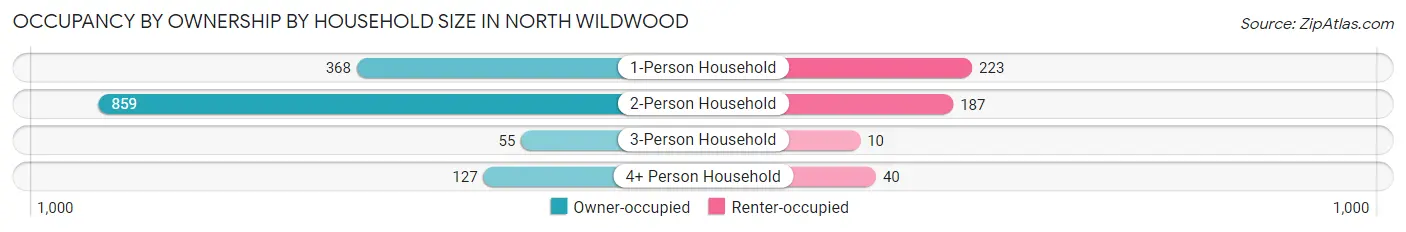
| Household Size | Owner-occupied | Renter-occupied |
| 1-Person Household | 368 (62.3%) | 223 (37.7%) |
| 2-Person Household | 859 (82.1%) | 187 (17.9%) |
| 3-Person Household | 55 (84.6%) | 10 (15.4%) |
| 4+ Person Household | 127 (76.0%) | 40 (23.9%) |
| Total Housing Units | 1,409 (75.4%) | 460 (24.6%) |
Occupancy by Educational Attainment in North Wildwood
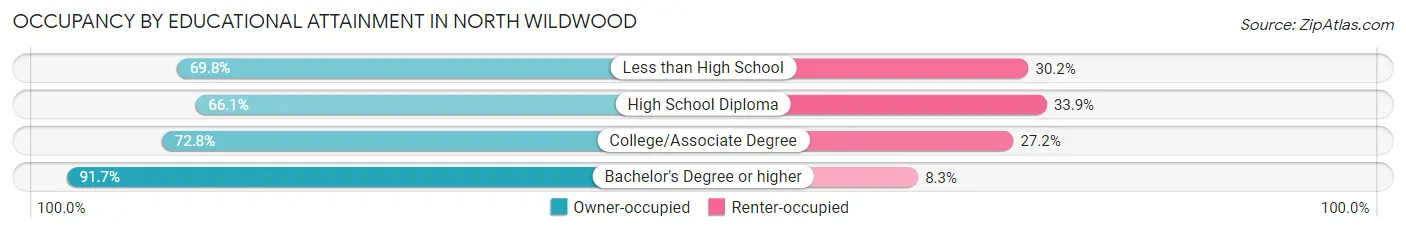
| Household Size | Owner-occupied | Renter-occupied |
| Less than High School | 67 (69.8%) | 29 (30.2%) |
| High School Diploma | 502 (66.1%) | 257 (33.9%) |
| College/Associate Degree | 345 (72.8%) | 129 (27.2%) |
| Bachelor's Degree or higher | 495 (91.7%) | 45 (8.3%) |
Occupancy by Age of Householder in North Wildwood
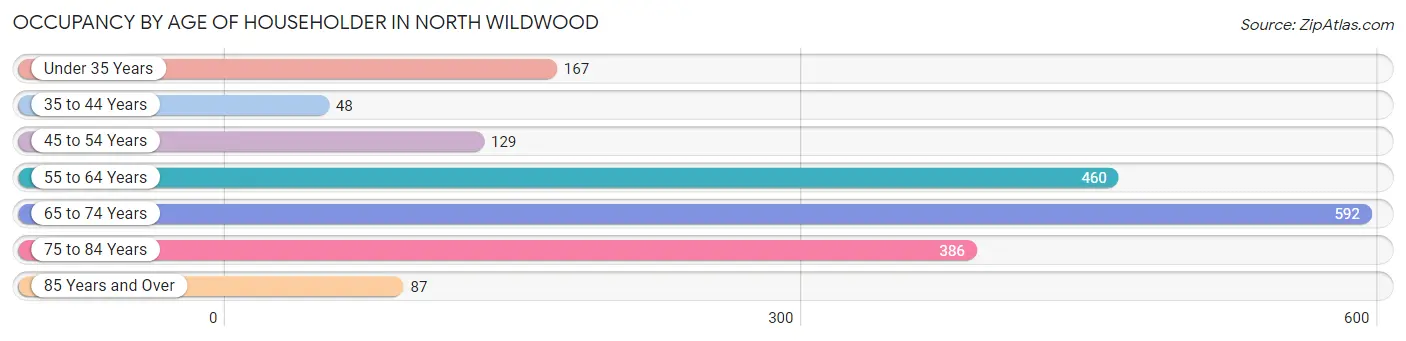
| Age Bracket | # Households | % Households |
| Under 35 Years | 167 | 8.9% |
| 35 to 44 Years | 48 | 2.6% |
| 45 to 54 Years | 129 | 6.9% |
| 55 to 64 Years | 460 | 24.6% |
| 65 to 74 Years | 592 | 31.7% |
| 75 to 84 Years | 386 | 20.6% |
| 85 Years and Over | 87 | 4.6% |
| Total | 1,869 | 100.0% |
Housing Finances in North Wildwood
Median Income by Occupancy in North Wildwood
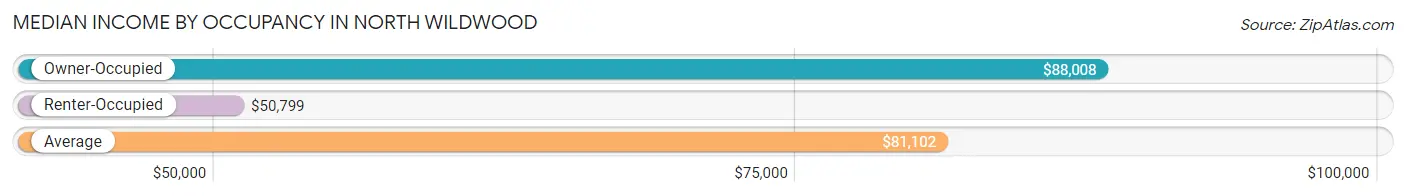
| Occupancy Type | # Households | Median Income |
| Owner-Occupied | 1,409 (75.4%) | $88,008 |
| Renter-Occupied | 460 (24.6%) | $50,799 |
| Average | 1,869 (100.0%) | $81,102 |
Occupancy by Householder Income Bracket in North Wildwood
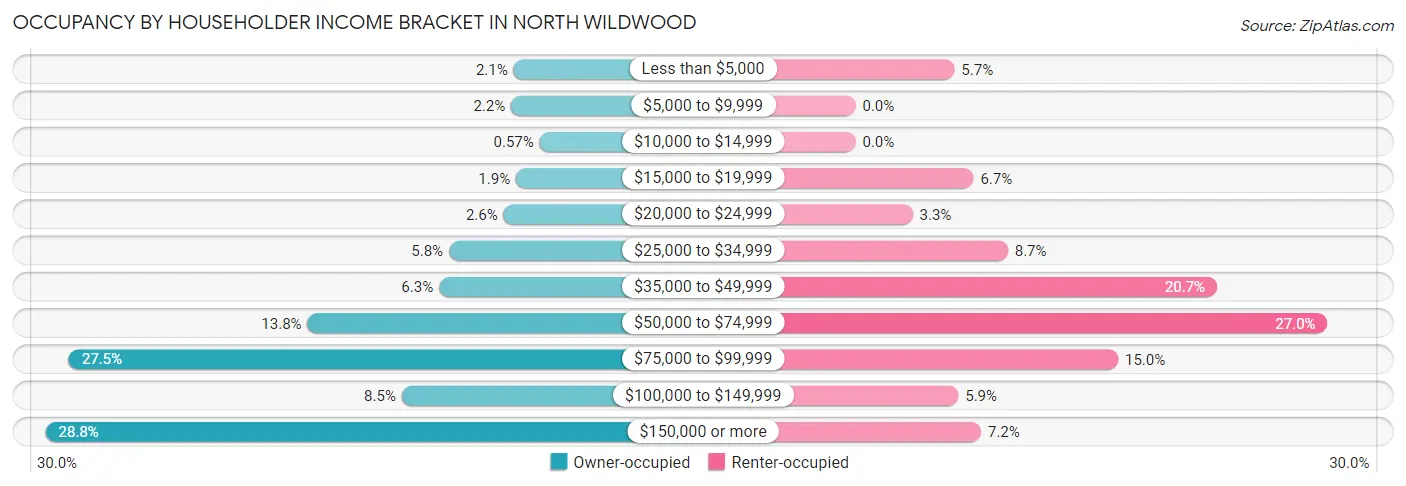
| Income Bracket | Owner-occupied | Renter-occupied |
| Less than $5,000 | 29 (2.1%) | 26 (5.7%) |
| $5,000 to $9,999 | 31 (2.2%) | 0 (0.0%) |
| $10,000 to $14,999 | 8 (0.6%) | 0 (0.0%) |
| $15,000 to $19,999 | 27 (1.9%) | 31 (6.7%) |
| $20,000 to $24,999 | 37 (2.6%) | 15 (3.3%) |
| $25,000 to $34,999 | 81 (5.8%) | 40 (8.7%) |
| $35,000 to $49,999 | 89 (6.3%) | 95 (20.6%) |
| $50,000 to $74,999 | 195 (13.8%) | 124 (27.0%) |
| $75,000 to $99,999 | 387 (27.5%) | 69 (15.0%) |
| $100,000 to $149,999 | 119 (8.5%) | 27 (5.9%) |
| $150,000 or more | 406 (28.8%) | 33 (7.2%) |
| Total | 1,409 (100.0%) | 460 (100.0%) |
Monthly Housing Cost Tiers in North Wildwood
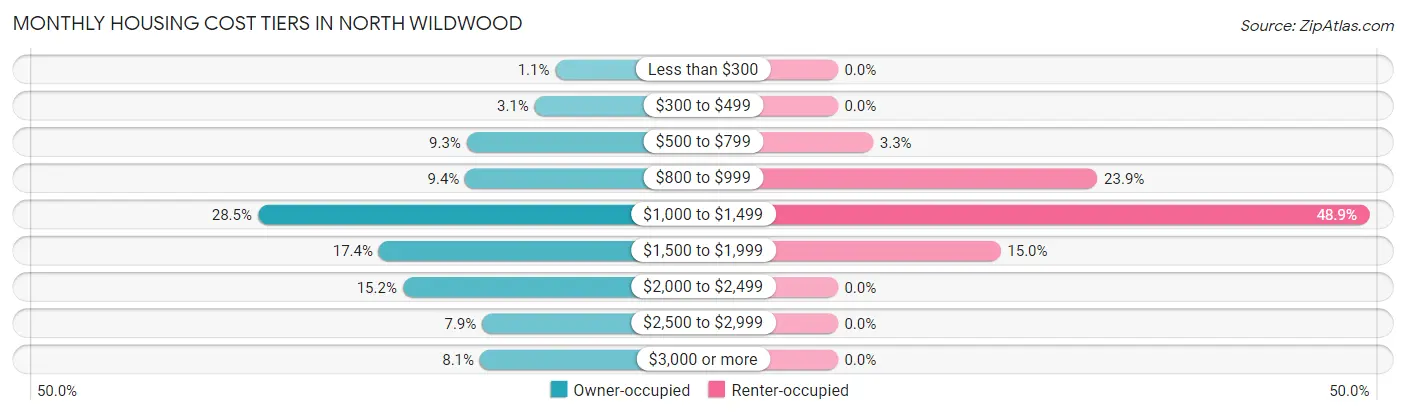
| Monthly Cost | Owner-occupied | Renter-occupied |
| Less than $300 | 16 (1.1%) | 0 (0.0%) |
| $300 to $499 | 43 (3.0%) | 0 (0.0%) |
| $500 to $799 | 131 (9.3%) | 15 (3.3%) |
| $800 to $999 | 133 (9.4%) | 110 (23.9%) |
| $1,000 to $1,499 | 402 (28.5%) | 225 (48.9%) |
| $1,500 to $1,999 | 245 (17.4%) | 69 (15.0%) |
| $2,000 to $2,499 | 214 (15.2%) | 0 (0.0%) |
| $2,500 to $2,999 | 111 (7.9%) | 0 (0.0%) |
| $3,000 or more | 114 (8.1%) | 0 (0.0%) |
| Total | 1,409 (100.0%) | 460 (100.0%) |
Physical Housing Characteristics in North Wildwood
Housing Structures in North Wildwood
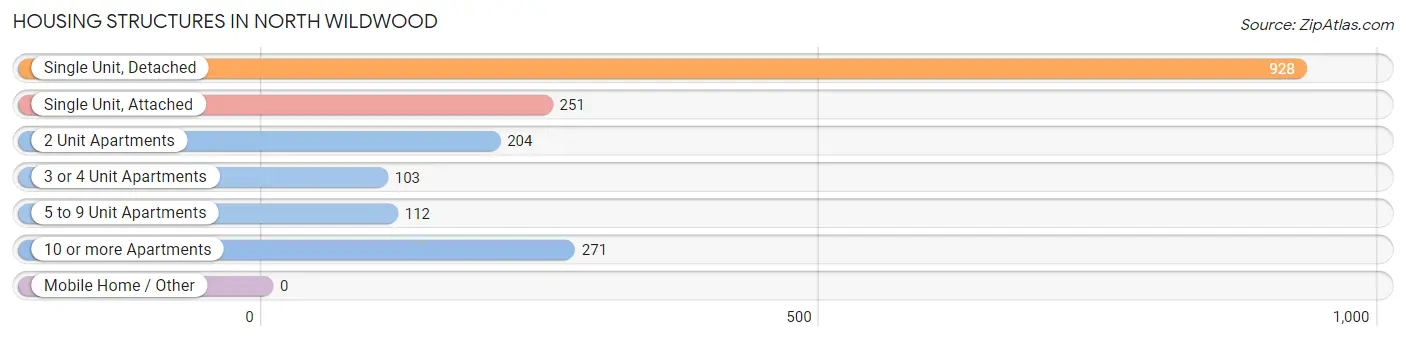
| Structure Type | # Housing Units | % Housing Units |
| Single Unit, Detached | 928 | 49.6% |
| Single Unit, Attached | 251 | 13.4% |
| 2 Unit Apartments | 204 | 10.9% |
| 3 or 4 Unit Apartments | 103 | 5.5% |
| 5 to 9 Unit Apartments | 112 | 6.0% |
| 10 or more Apartments | 271 | 14.5% |
| Mobile Home / Other | 0 | 0.0% |
| Total | 1,869 | 100.0% |
Housing Structures by Occupancy in North Wildwood
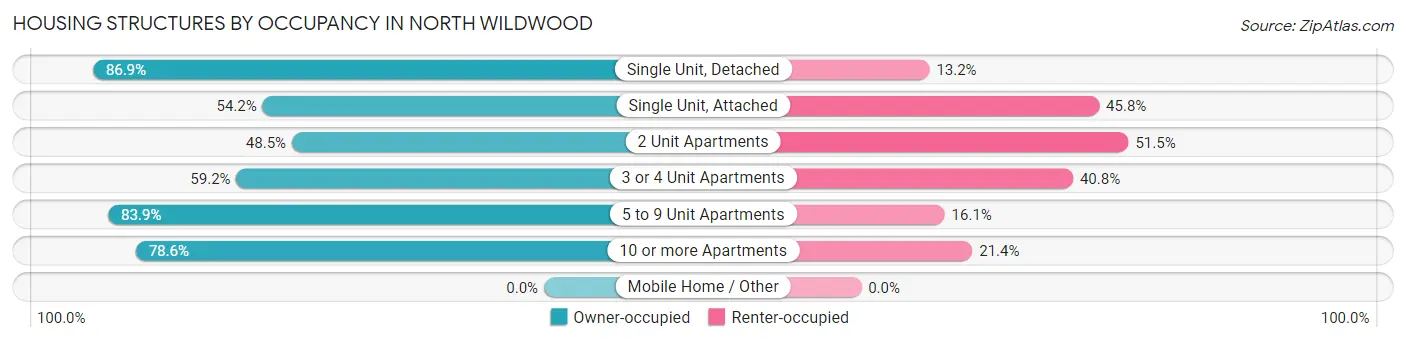
| Structure Type | Owner-occupied | Renter-occupied |
| Single Unit, Detached | 806 (86.9%) | 122 (13.2%) |
| Single Unit, Attached | 136 (54.2%) | 115 (45.8%) |
| 2 Unit Apartments | 99 (48.5%) | 105 (51.5%) |
| 3 or 4 Unit Apartments | 61 (59.2%) | 42 (40.8%) |
| 5 to 9 Unit Apartments | 94 (83.9%) | 18 (16.1%) |
| 10 or more Apartments | 213 (78.6%) | 58 (21.4%) |
| Mobile Home / Other | 0 (0.0%) | 0 (0.0%) |
| Total | 1,409 (75.4%) | 460 (24.6%) |
Housing Structures by Number of Rooms in North Wildwood
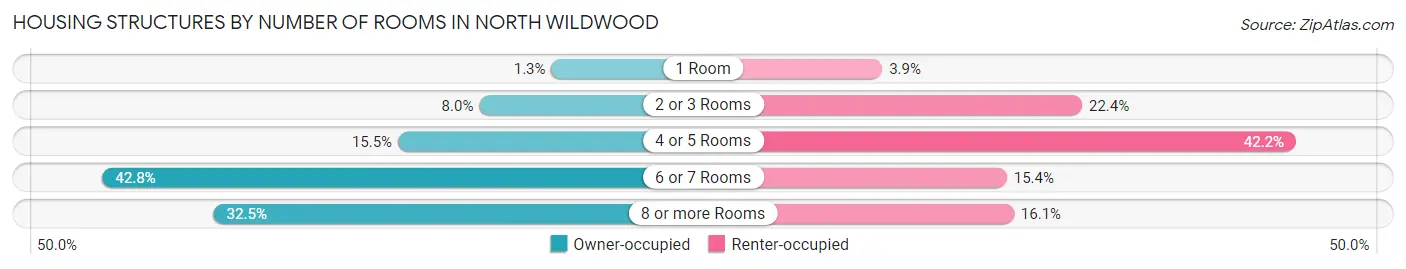
| Number of Rooms | Owner-occupied | Renter-occupied |
| 1 Room | 18 (1.3%) | 18 (3.9%) |
| 2 or 3 Rooms | 112 (8.0%) | 103 (22.4%) |
| 4 or 5 Rooms | 218 (15.5%) | 194 (42.2%) |
| 6 or 7 Rooms | 603 (42.8%) | 71 (15.4%) |
| 8 or more Rooms | 458 (32.5%) | 74 (16.1%) |
| Total | 1,409 (100.0%) | 460 (100.0%) |
Housing Structure by Heating Type in North Wildwood
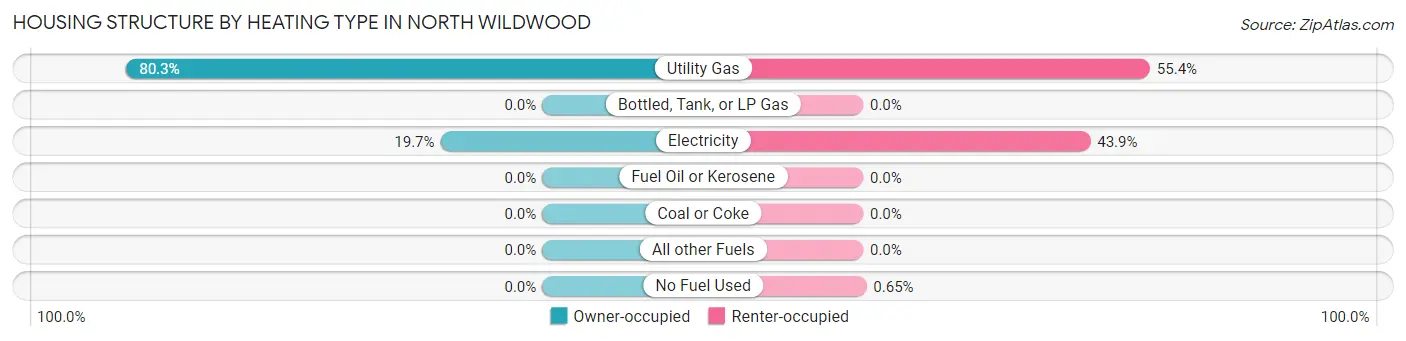
| Heating Type | Owner-occupied | Renter-occupied |
| Utility Gas | 1,132 (80.3%) | 255 (55.4%) |
| Bottled, Tank, or LP Gas | 0 (0.0%) | 0 (0.0%) |
| Electricity | 277 (19.7%) | 202 (43.9%) |
| Fuel Oil or Kerosene | 0 (0.0%) | 0 (0.0%) |
| Coal or Coke | 0 (0.0%) | 0 (0.0%) |
| All other Fuels | 0 (0.0%) | 0 (0.0%) |
| No Fuel Used | 0 (0.0%) | 3 (0.6%) |
| Total | 1,409 (100.0%) | 460 (100.0%) |
Household Vehicle Usage in North Wildwood
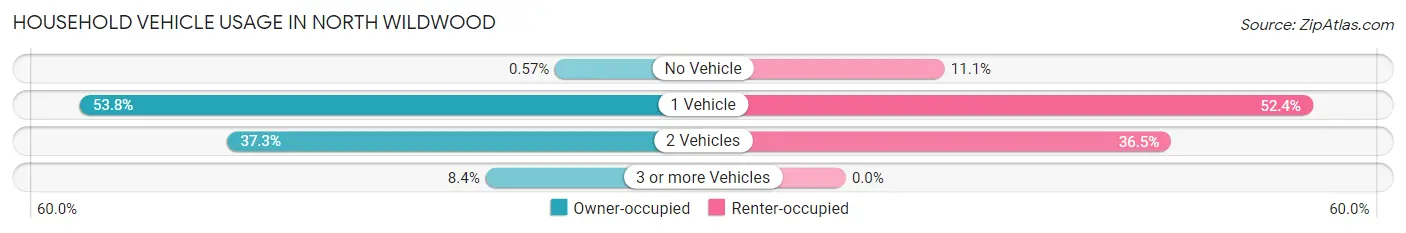
| Vehicles per Household | Owner-occupied | Renter-occupied |
| No Vehicle | 8 (0.6%) | 51 (11.1%) |
| 1 Vehicle | 758 (53.8%) | 241 (52.4%) |
| 2 Vehicles | 525 (37.3%) | 168 (36.5%) |
| 3 or more Vehicles | 118 (8.4%) | 0 (0.0%) |
| Total | 1,409 (100.0%) | 460 (100.0%) |
Real Estate & Mortgages in North Wildwood
Real Estate and Mortgage Overview in North Wildwood
| Characteristic | Without Mortgage | With Mortgage |
| Housing Units | 622 | 787 |
| Median Property Value | $449,000 | $430,500 |
| Median Household Income | $71,071 | $262 |
| Monthly Housing Costs | $1,018 | $114 |
| Real Estate Taxes | $5,582 | $0 |
Property Value by Mortgage Status in North Wildwood
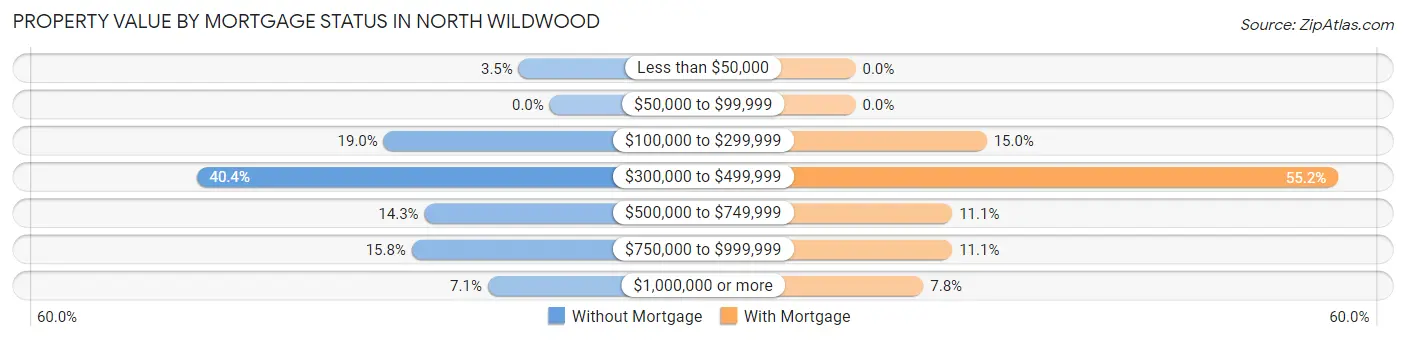
| Property Value | Without Mortgage | With Mortgage |
| Less than $50,000 | 22 (3.5%) | 0 (0.0%) |
| $50,000 to $99,999 | 0 (0.0%) | 0 (0.0%) |
| $100,000 to $299,999 | 118 (19.0%) | 118 (15.0%) |
| $300,000 to $499,999 | 251 (40.4%) | 434 (55.1%) |
| $500,000 to $749,999 | 89 (14.3%) | 87 (11.1%) |
| $750,000 to $999,999 | 98 (15.8%) | 87 (11.1%) |
| $1,000,000 or more | 44 (7.1%) | 61 (7.7%) |
| Total | 622 (100.0%) | 787 (100.0%) |
Household Income by Mortgage Status in North Wildwood
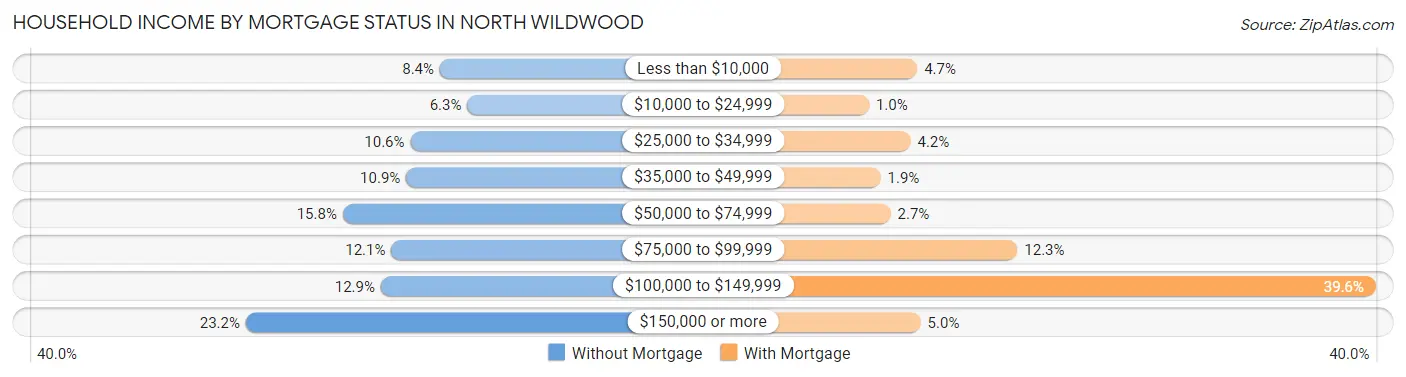
| Household Income | Without Mortgage | With Mortgage |
| Less than $10,000 | 52 (8.4%) | 37 (4.7%) |
| $10,000 to $24,999 | 39 (6.3%) | 8 (1.0%) |
| $25,000 to $34,999 | 66 (10.6%) | 33 (4.2%) |
| $35,000 to $49,999 | 68 (10.9%) | 15 (1.9%) |
| $50,000 to $74,999 | 98 (15.8%) | 21 (2.7%) |
| $75,000 to $99,999 | 75 (12.1%) | 97 (12.3%) |
| $100,000 to $149,999 | 80 (12.9%) | 312 (39.6%) |
| $150,000 or more | 144 (23.2%) | 39 (5.0%) |
| Total | 622 (100.0%) | 787 (100.0%) |
Property Value to Household Income Ratio in North Wildwood
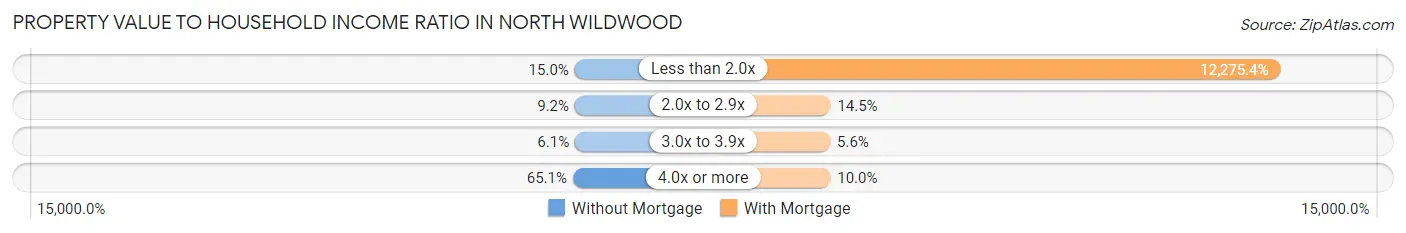
| Value-to-Income Ratio | Without Mortgage | With Mortgage |
| Less than 2.0x | 93 (14.9%) | 96,607 (12,275.4%) |
| 2.0x to 2.9x | 57 (9.2%) | 114 (14.5%) |
| 3.0x to 3.9x | 38 (6.1%) | 44 (5.6%) |
| 4.0x or more | 405 (65.1%) | 79 (10.0%) |
| Total | 622 (100.0%) | 787 (100.0%) |
Real Estate Taxes by Mortgage Status in North Wildwood
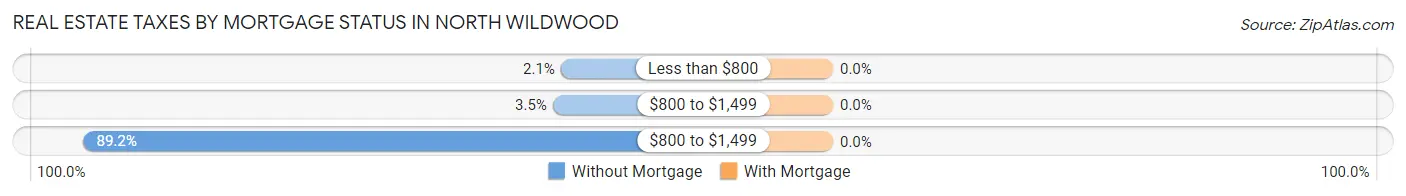
| Property Taxes | Without Mortgage | With Mortgage |
| Less than $800 | 13 (2.1%) | 0 (0.0%) |
| $800 to $1,499 | 22 (3.5%) | 0 (0.0%) |
| $800 to $1,499 | 555 (89.2%) | 0 (0.0%) |
| Total | 622 (100.0%) | 787 (100.0%) |
Health & Disability in North Wildwood
Health Insurance Coverage by Age in North Wildwood
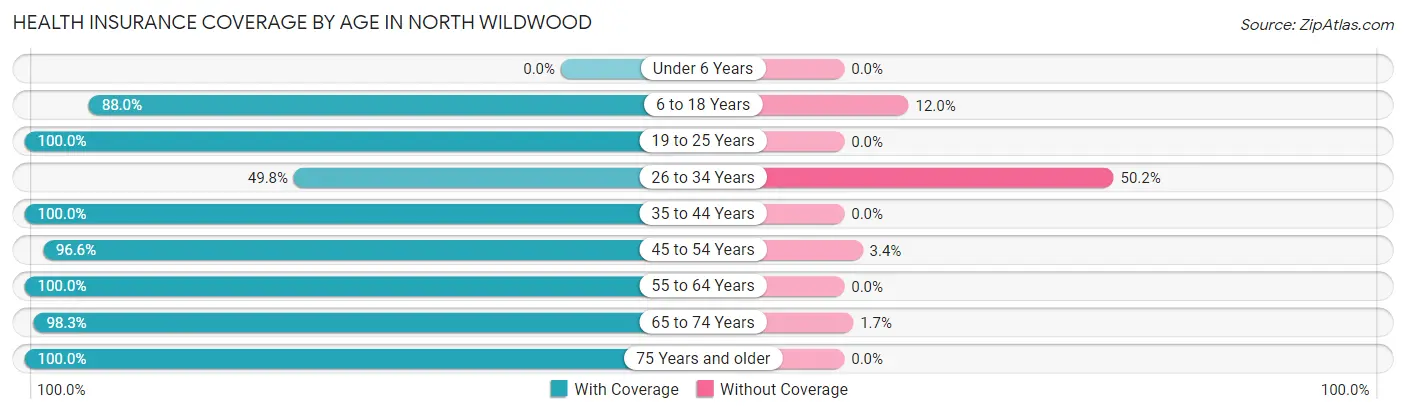
| Age Bracket | With Coverage | Without Coverage |
| Under 6 Years | 0 (0.0%) | 0 (0.0%) |
| 6 to 18 Years | 294 (88.0%) | 40 (12.0%) |
| 19 to 25 Years | 284 (100.0%) | 0 (0.0%) |
| 26 to 34 Years | 120 (49.8%) | 121 (50.2%) |
| 35 to 44 Years | 129 (100.0%) | 0 (0.0%) |
| 45 to 54 Years | 170 (96.6%) | 6 (3.4%) |
| 55 to 64 Years | 782 (100.0%) | 0 (0.0%) |
| 65 to 74 Years | 1,066 (98.3%) | 18 (1.7%) |
| 75 Years and older | 609 (100.0%) | 0 (0.0%) |
| Total | 3,454 (94.9%) | 185 (5.1%) |
Health Insurance Coverage by Citizenship Status in North Wildwood
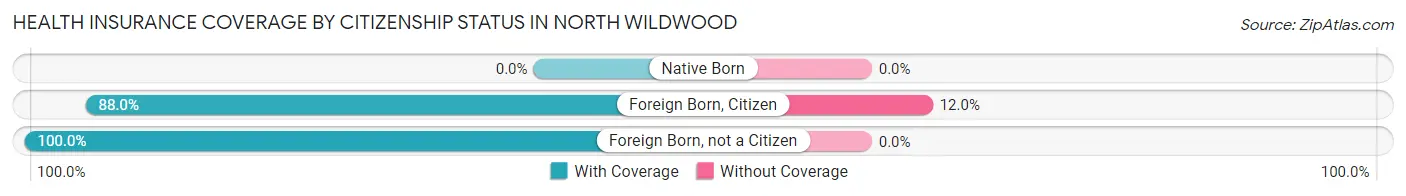
| Citizenship Status | With Coverage | Without Coverage |
| Native Born | 0 (0.0%) | 0 (0.0%) |
| Foreign Born, Citizen | 294 (88.0%) | 40 (12.0%) |
| Foreign Born, not a Citizen | 284 (100.0%) | 0 (0.0%) |
Health Insurance Coverage by Household Income in North Wildwood
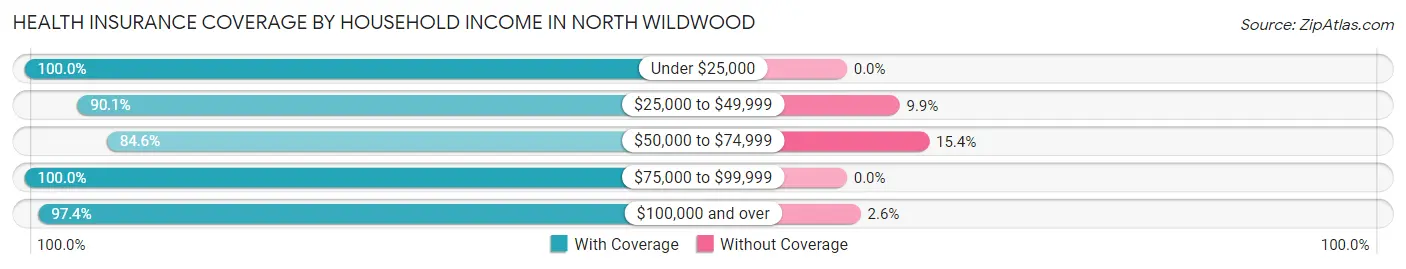
| Household Income | With Coverage | Without Coverage |
| Under $25,000 | 275 (100.0%) | 0 (0.0%) |
| $25,000 to $49,999 | 529 (90.1%) | 58 (9.9%) |
| $50,000 to $74,999 | 505 (84.6%) | 92 (15.4%) |
| $75,000 to $99,999 | 831 (100.0%) | 0 (0.0%) |
| $100,000 and over | 1,314 (97.4%) | 35 (2.6%) |
Public vs Private Health Insurance Coverage by Age in North Wildwood
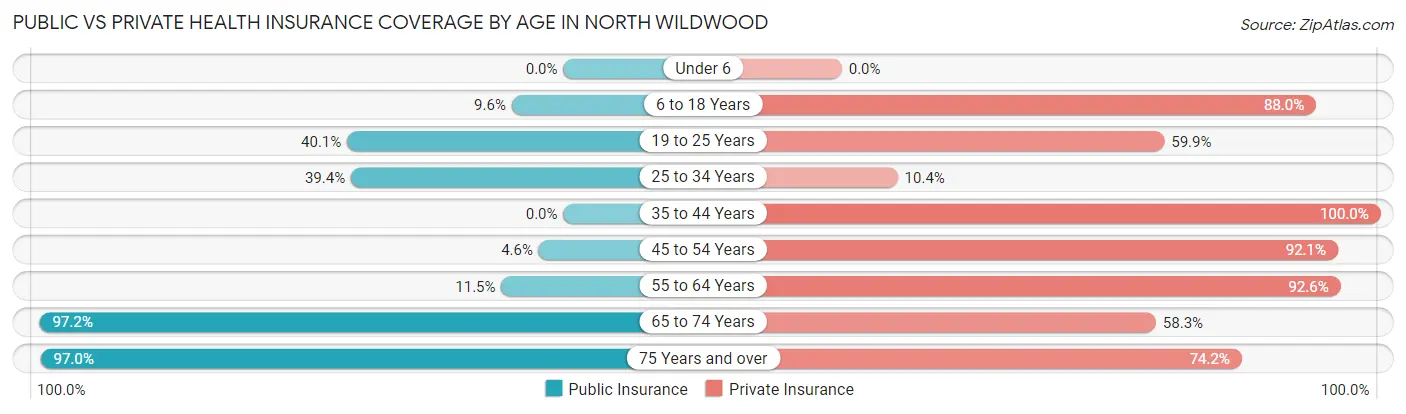
| Age Bracket | Public Insurance | Private Insurance |
| Under 6 | 0 (0.0%) | 0 (0.0%) |
| 6 to 18 Years | 32 (9.6%) | 294 (88.0%) |
| 19 to 25 Years | 114 (40.1%) | 170 (59.9%) |
| 25 to 34 Years | 95 (39.4%) | 25 (10.4%) |
| 35 to 44 Years | 0 (0.0%) | 129 (100.0%) |
| 45 to 54 Years | 8 (4.5%) | 162 (92.0%) |
| 55 to 64 Years | 90 (11.5%) | 724 (92.6%) |
| 65 to 74 Years | 1,054 (97.2%) | 632 (58.3%) |
| 75 Years and over | 591 (97.0%) | 452 (74.2%) |
| Total | 1,984 (54.5%) | 2,588 (71.1%) |
Disability Status by Sex by Age in North Wildwood
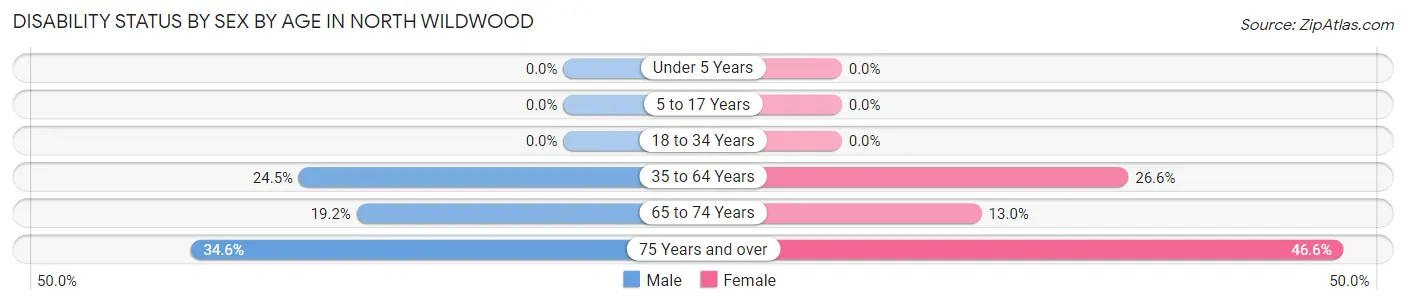
| Age Bracket | Male | Female |
| Under 5 Years | 0 (0.0%) | 0 (0.0%) |
| 5 to 17 Years | 0 (0.0%) | 0 (0.0%) |
| 18 to 34 Years | 0 (0.0%) | 0 (0.0%) |
| 35 to 64 Years | 120 (24.5%) | 159 (26.6%) |
| 65 to 74 Years | 103 (19.2%) | 71 (13.0%) |
| 75 Years and over | 100 (34.6%) | 149 (46.6%) |
Disability Class by Sex by Age in North Wildwood
Disability Class: Hearing Difficulty
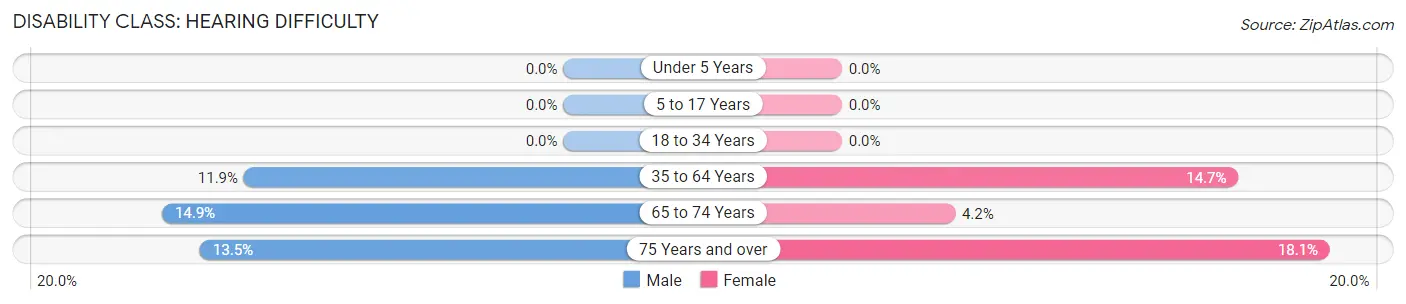
| Age Bracket | Male | Female |
| Under 5 Years | 0 (0.0%) | 0 (0.0%) |
| 5 to 17 Years | 0 (0.0%) | 0 (0.0%) |
| 18 to 34 Years | 0 (0.0%) | 0 (0.0%) |
| 35 to 64 Years | 58 (11.9%) | 88 (14.7%) |
| 65 to 74 Years | 80 (14.9%) | 23 (4.2%) |
| 75 Years and over | 39 (13.5%) | 58 (18.1%) |
Disability Class: Vision Difficulty
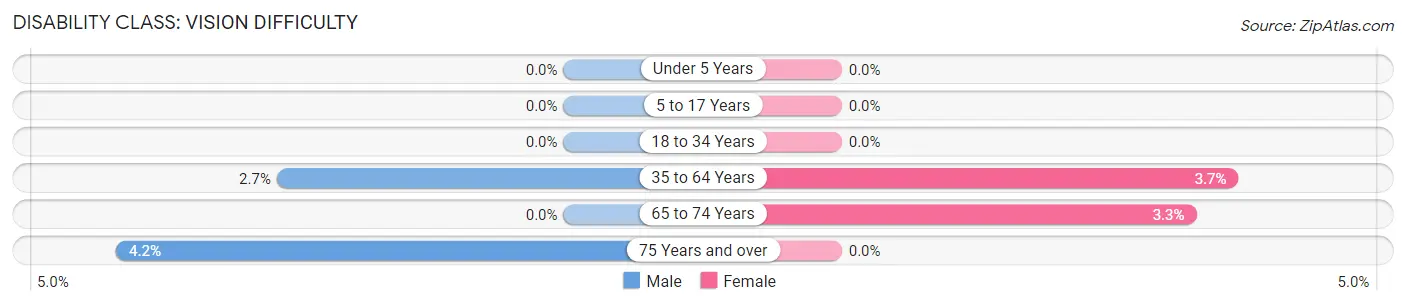
| Age Bracket | Male | Female |
| Under 5 Years | 0 (0.0%) | 0 (0.0%) |
| 5 to 17 Years | 0 (0.0%) | 0 (0.0%) |
| 18 to 34 Years | 0 (0.0%) | 0 (0.0%) |
| 35 to 64 Years | 13 (2.7%) | 22 (3.7%) |
| 65 to 74 Years | 0 (0.0%) | 18 (3.3%) |
| 75 Years and over | 12 (4.2%) | 0 (0.0%) |
Disability Class: Cognitive Difficulty
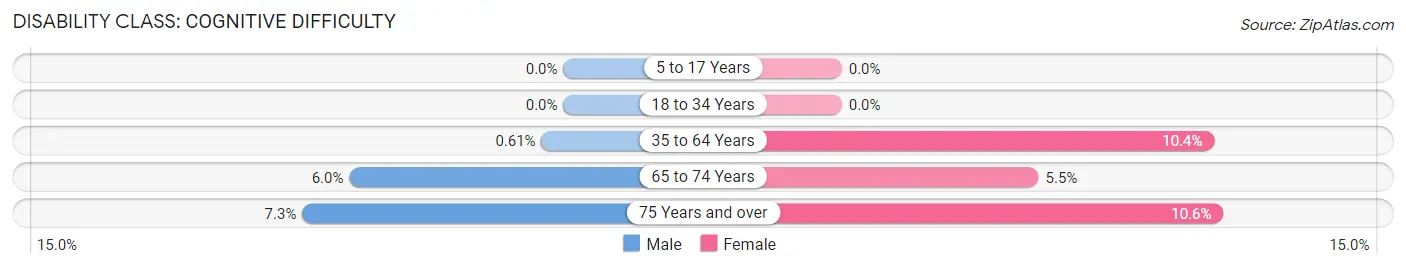
| Age Bracket | Male | Female |
| 5 to 17 Years | 0 (0.0%) | 0 (0.0%) |
| 18 to 34 Years | 0 (0.0%) | 0 (0.0%) |
| 35 to 64 Years | 3 (0.6%) | 62 (10.4%) |
| 65 to 74 Years | 32 (6.0%) | 30 (5.5%) |
| 75 Years and over | 21 (7.3%) | 34 (10.6%) |
Disability Class: Ambulatory Difficulty
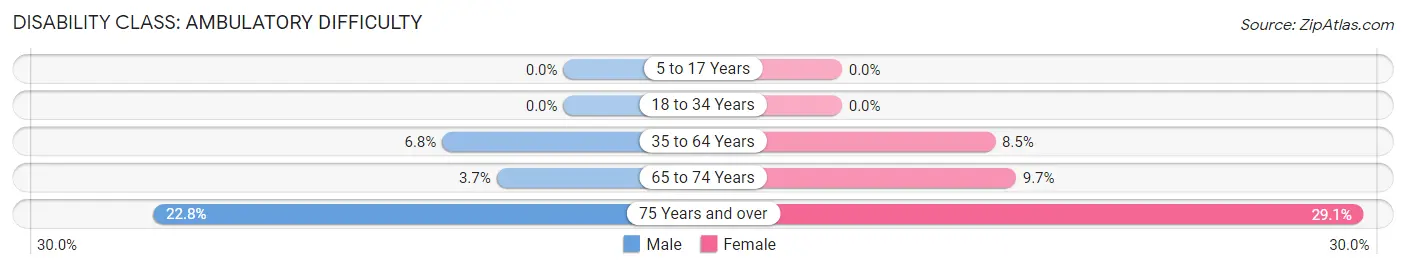
| Age Bracket | Male | Female |
| 5 to 17 Years | 0 (0.0%) | 0 (0.0%) |
| 18 to 34 Years | 0 (0.0%) | 0 (0.0%) |
| 35 to 64 Years | 33 (6.8%) | 51 (8.5%) |
| 65 to 74 Years | 20 (3.7%) | 53 (9.7%) |
| 75 Years and over | 66 (22.8%) | 93 (29.1%) |
Disability Class: Self-Care Difficulty
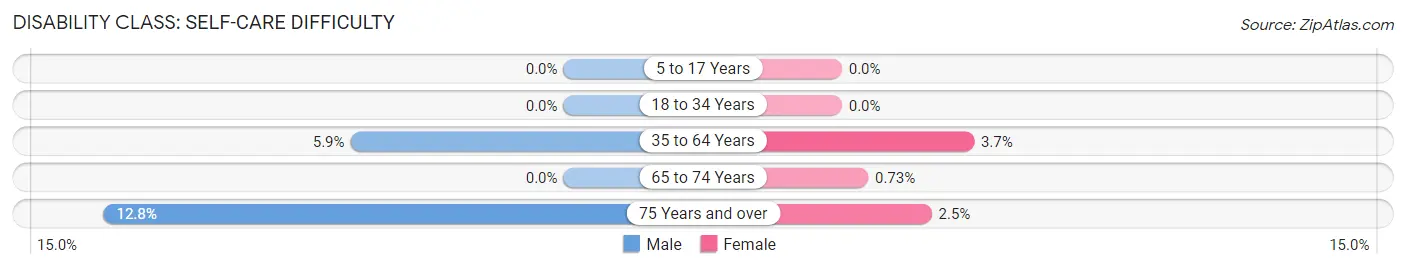
| Age Bracket | Male | Female |
| 5 to 17 Years | 0 (0.0%) | 0 (0.0%) |
| 18 to 34 Years | 0 (0.0%) | 0 (0.0%) |
| 35 to 64 Years | 29 (5.9%) | 22 (3.7%) |
| 65 to 74 Years | 0 (0.0%) | 4 (0.7%) |
| 75 Years and over | 37 (12.8%) | 8 (2.5%) |
Technology Access in North Wildwood
Computing Device Access in North Wildwood
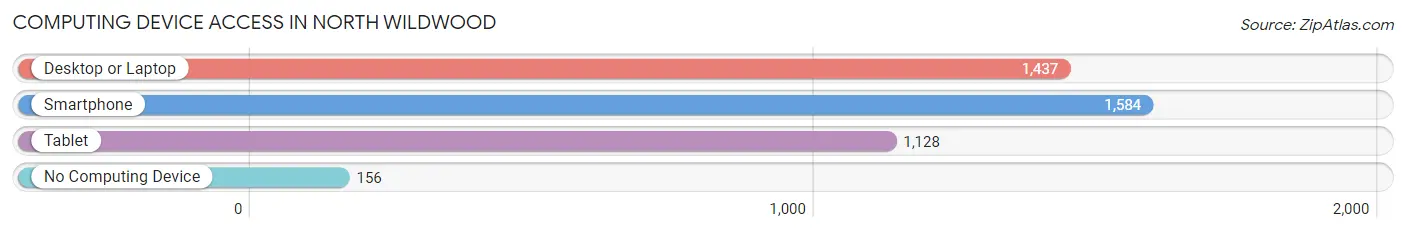
| Device Type | # Households | % Households |
| Desktop or Laptop | 1,437 | 76.9% |
| Smartphone | 1,584 | 84.8% |
| Tablet | 1,128 | 60.4% |
| No Computing Device | 156 | 8.4% |
| Total | 1,869 | 100.0% |
Internet Access in North Wildwood
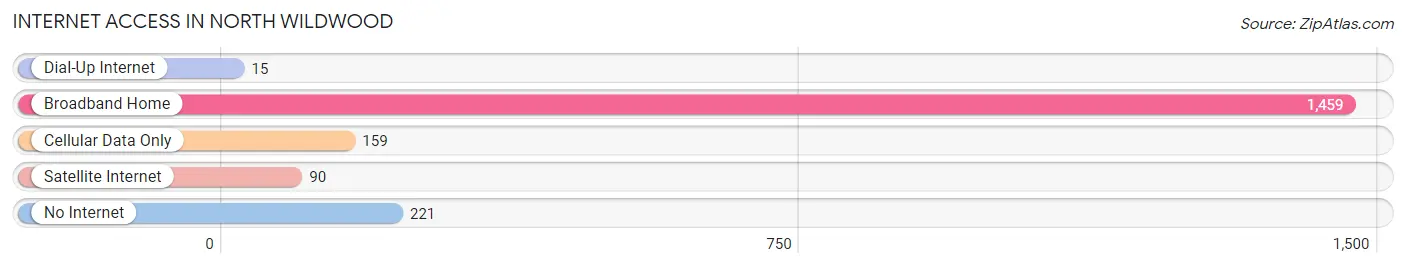
| Internet Type | # Households | % Households |
| Dial-Up Internet | 15 | 0.8% |
| Broadband Home | 1,459 | 78.1% |
| Cellular Data Only | 159 | 8.5% |
| Satellite Internet | 90 | 4.8% |
| No Internet | 221 | 11.8% |
| Total | 1,869 | 100.0% |
North Wildwood Summary
Wildwood, New Jersey is a city located in Cape May County, New Jersey, United States. It is part of the Ocean City Metropolitan Statistical Area. The city is located on a barrier island, and is the northernmost city in the state of New Jersey. It is bordered to the north by the Borough of North Wildwood, to the east by the Atlantic Ocean, to the south by the City of Wildwood Crest, and to the west by the Borough of West Wildwood. The city is known for its beaches, boardwalk, and amusement parks.
History
The area that is now Wildwood was originally inhabited by the Lenape Native Americans. The first European settlers arrived in the area in the late 1600s. The area was originally known as “Five Mile Beach”, and was part of Lower Township. In 1885, the area was incorporated as the Borough of Wildwood. The borough was reincorporated as the City of Wildwood in 1912.
In the early 1900s, the city began to develop as a resort destination. The first hotel was built in 1906, and the first boardwalk was constructed in 1910. The boardwalk was expanded in the 1920s, and the city began to attract more visitors. In the 1950s, the city began to develop its amusement parks, which included Morey’s Piers and the Wildwood Beachfront Waterpark.
Geography
Wildwood is located at 39°2'25"N 74°45'45"W (39.040278, -74.762500). According to the United States Census Bureau, the city has a total area of 2.2 square miles (5.7 km2), of which, 1.9 square miles (4.9 km2) of it is land and 0.3 square miles (0.8 km2) of it (13.64%) is water.
The city is located on a barrier island, and is bordered to the north by the Borough of North Wildwood, to the east by the Atlantic Ocean, to the south by the City of Wildwood Crest, and to the west by the Borough of West Wildwood.
Economy
Wildwood’s economy is largely based on tourism. The city is home to several amusement parks, including Morey’s Piers and the Wildwood Beachfront Waterpark. The city also has a variety of restaurants, bars, and shops. The city is also home to several hotels and motels.
Demographics
As of the 2010 United States Census, there were 5,325 people, 2,521 households, and 1,323 families residing in the city. The population density was 2,817.3 per square mile (1,091.2/km2). There were 5,945 housing units at an average density of 3,097.3 per square mile (1,196.2/km2). The racial makeup of the city was 97.2% White, 0.7% African American, 0.2% Native American, 0.7% Asian, 0.1% Pacific Islander, 0.4% from other races, and 0.7% from two or more races. Hispanic or Latino of any race were 2.2% of the population.
There were 2,521 households, out of which 17.3% had children under the age of 18 living with them, 36.2% were married couples living together, 11.7% had a female householder with no husband present, and 48.2% were non-families. 39.2% of all households were made up of individuals, and 16.2% had someone living alone who was 65 years of age or older. The average household size was 2.09 and the average family size was 2.81.
In the city, the population was spread out, with 17.2% under the age of 18, 8.2% from 18 to 24, 25.2% from 25 to 44, 28.2% from 45 to 64, and 21.2% who were 65 years of age or older. The median age was 44 years. For every 100 females, there were 91.3 males. For every 100 females age 18 and over, there were 88.3 males.
The median income for a household in the city was $37,917, and the median income for a family was $50,000. Males had a median income of $35,000 versus $25,000 for females. The per capita income for the city was $22,845. About 8.2% of families and 11.2% of the population were below the poverty line, including 16.2% of those under age 18 and 8.2% of those age 65 or over.
Common Questions
What is the Total Population of North Wildwood?
Total Population of North Wildwood is 3,639.
What is the Total Male Population of North Wildwood?
Total Male Population of North Wildwood is 1,778.
What is the Total Female Population of North Wildwood?
Total Female Population of North Wildwood is 1,861.
What is the Ratio of Males per 100 Females in North Wildwood?
There are 95.54 Males per 100 Females in North Wildwood.
What is the Ratio of Females per 100 Males in North Wildwood?
There are 104.67 Females per 100 Males in North Wildwood.
What is the Median Population Age in North Wildwood?
Median Population Age in North Wildwood is 62.9 Years.
What is the Average Family Size in North Wildwood
Average Family Size in North Wildwood is 2.4 People.
What is the Average Household Size in North Wildwood
Average Household Size in North Wildwood is 1.9 People.
What is Per Capita Income in North Wildwood?
Per Capita income in North Wildwood is $70,156.
What is the Median Family Income in North Wildwood?
Median Family Income in North Wildwood is $89,350.
What is the Median Household income in North Wildwood?
Median Household Income in North Wildwood is $81,102.
What is Income or Wage Gap in North Wildwood?
Income or Wage Gap in North Wildwood is 42.6%.
Women in North Wildwood earn 57.4 cents for every dollar earned by a man.
What is Inequality or Gini Index in North Wildwood?
Inequality or Gini Index in North Wildwood is 0.57.
How Large is the Labor Force in North Wildwood?
There are 1,493 People in the Labor Forcein in North Wildwood.
What is the Percentage of People in the Labor Force in North Wildwood?
42.9% of People are in the Labor Force in North Wildwood.
What is the Unemployment Rate in North Wildwood?
Unemployment Rate in North Wildwood is 3.0%.