Warren County, NJ
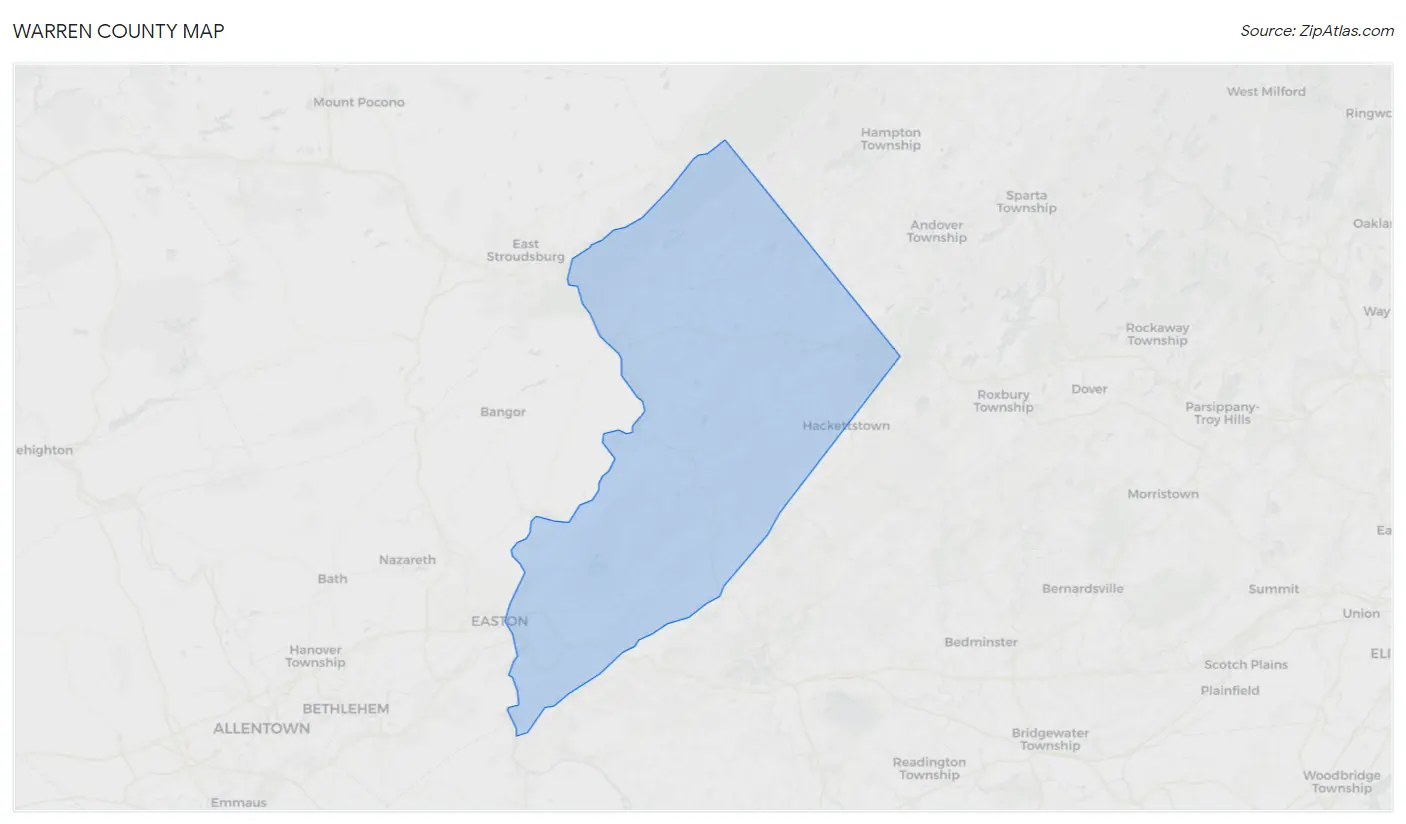
Warren County Map
Warren County Overview
109,739
TOTAL POPULATION
54,469
MALE POPULATION
55,270
FEMALE POPULATION
98.55
MALES / 100 FEMALES
101.47
FEMALES / 100 MALES
44.0
MEDIAN AGE
3.0
AVG FAMILY SIZE
2.4
AVG HOUSEHOLD SIZE
$45,517
PER CAPITA INCOME
$113,083
AVG FAMILY INCOME
$92,620
AVG HOUSEHOLD INCOME
34.9%
WAGE / INCOME GAP [ % ]
65.1¢/ $1
WAGE / INCOME GAP [ $ ]
$11,858
FAMILY INCOME DEFICIT
0.42
INEQUALITY / GINI INDEX
60,398
LABOR FORCE [ PEOPLE ]
66.0%
PERCENT IN LABOR FORCE
6.0%
UNEMPLOYMENT RATE
Warren County Area Codes
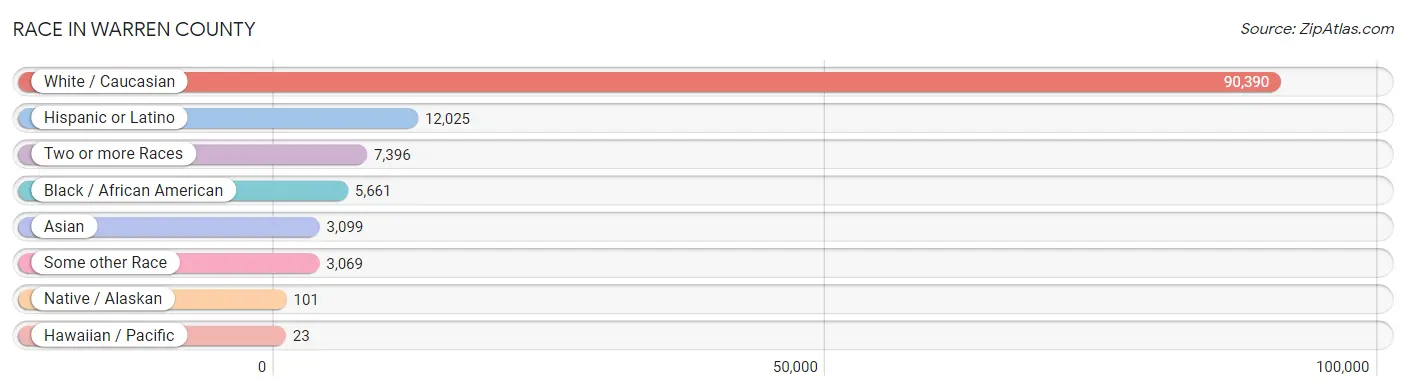
Race in Warren County
The most populous races in Warren County are White / Caucasian (90,390 | 82.4%), Hispanic or Latino (12,025 | 11.0%), and Two or more Races (7,396 | 6.7%).
| Race | # Population | % Population |
| Asian | 3,099 | 2.8% |
| Black / African American | 5,661 | 5.2% |
| Hawaiian / Pacific | 23 | 0.0% |
| Hispanic or Latino | 12,025 | 11.0% |
| Native / Alaskan | 101 | 0.1% |
| White / Caucasian | 90,390 | 82.4% |
| Two or more Races | 7,396 | 6.7% |
| Some other Race | 3,069 | 2.8% |
| Total | 109,739 | 100.0% |
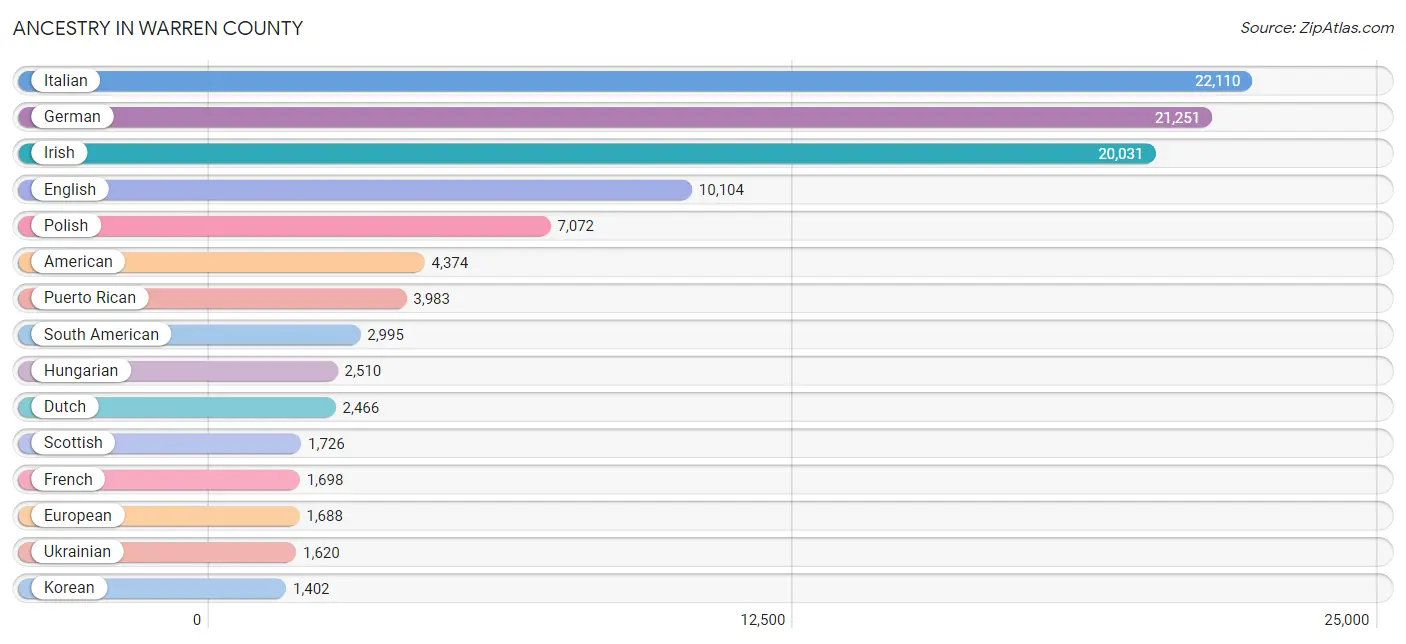
Ancestry in Warren County
The most populous ancestries reported in Warren County are Italian (22,110 | 20.2%), German (21,251 | 19.4%), Irish (20,031 | 18.2%), English (10,104 | 9.2%), and Polish (7,072 | 6.4%), together accounting for 73.4% of all Warren County residents.
| Ancestry | # Population | % Population |
| Afghan | 42 | 0.0% |
| African | 174 | 0.2% |
| Albanian | 223 | 0.2% |
| Alsatian | 21 | 0.0% |
| American | 4,374 | 4.0% |
| Arab | 673 | 0.6% |
| Arapaho | 6 | 0.0% |
| Argentinean | 169 | 0.2% |
| Armenian | 111 | 0.1% |
| Australian | 12 | 0.0% |
| Austrian | 231 | 0.2% |
| Bahamian | 11 | 0.0% |
| Bangladeshi | 11 | 0.0% |
| Belgian | 25 | 0.0% |
| Belizean | 4 | 0.0% |
| Bermudan | 12 | 0.0% |
| Bhutanese | 93 | 0.1% |
| Blackfeet | 49 | 0.0% |
| Brazilian | 121 | 0.1% |
| British | 488 | 0.4% |
| British West Indian | 37 | 0.0% |
| Bulgarian | 38 | 0.0% |
| Burmese | 313 | 0.3% |
| Canadian | 106 | 0.1% |
| Celtic | 29 | 0.0% |
| Central American | 1,393 | 1.3% |
| Central American Indian | 7 | 0.0% |
| Cherokee | 89 | 0.1% |
| Chilean | 57 | 0.1% |
| Colombian | 1,229 | 1.1% |
| Costa Rican | 528 | 0.5% |
| Croatian | 129 | 0.1% |
| Crow | 6 | 0.0% |
| Cuban | 674 | 0.6% |
| Czech | 318 | 0.3% |
| Czechoslovakian | 132 | 0.1% |
| Danish | 336 | 0.3% |
| Delaware | 41 | 0.0% |
| Dominican | 866 | 0.8% |
| Dutch | 2,466 | 2.2% |
| Eastern European | 401 | 0.4% |
| Ecuadorian | 558 | 0.5% |
| Egyptian | 177 | 0.2% |
| English | 10,104 | 9.2% |
| Estonian | 37 | 0.0% |
| Ethiopian | 19 | 0.0% |
| European | 1,688 | 1.5% |
| Fijian | 23 | 0.0% |
| Finnish | 100 | 0.1% |
| French | 1,698 | 1.5% |
| French American Indian | 2 | 0.0% |
| French Canadian | 448 | 0.4% |
| German | 21,251 | 19.4% |
| Ghanaian | 140 | 0.1% |
| Greek | 1,005 | 0.9% |
| Guatemalan | 263 | 0.2% |
| Guyanese | 334 | 0.3% |
| Haitian | 634 | 0.6% |
| Honduran | 235 | 0.2% |
| Hungarian | 2,510 | 2.3% |
| Indian (Asian) | 860 | 0.8% |
| Inupiat | 4 | 0.0% |
| Iranian | 17 | 0.0% |
| Irish | 20,031 | 18.2% |
| Iroquois | 15 | 0.0% |
| Israeli | 5 | 0.0% |
| Italian | 22,110 | 20.2% |
| Jamaican | 132 | 0.1% |
| Japanese | 25 | 0.0% |
| Kenyan | 46 | 0.0% |
| Korean | 1,402 | 1.3% |
| Laotian | 54 | 0.1% |
| Latvian | 53 | 0.1% |
| Lebanese | 302 | 0.3% |
| Lithuanian | 749 | 0.7% |
| Lumbee | 6 | 0.0% |
| Luxembourger | 4 | 0.0% |
| Macedonian | 10 | 0.0% |
| Mexican | 939 | 0.9% |
| Native Hawaiian | 179 | 0.2% |
| Navajo | 55 | 0.1% |
| Nicaraguan | 77 | 0.1% |
| Nigerian | 308 | 0.3% |
| Northern European | 66 | 0.1% |
| Norwegian | 875 | 0.8% |
| Okinawan | 11 | 0.0% |
| Pakistani | 70 | 0.1% |
| Paraguayan | 16 | 0.0% |
| Pennsylvania German | 357 | 0.3% |
| Peruvian | 743 | 0.7% |
| Polish | 7,072 | 6.4% |
| Portuguese | 731 | 0.7% |
| Potawatomi | 5 | 0.0% |
| Puerto Rican | 3,983 | 3.6% |
| Romanian | 220 | 0.2% |
| Russian | 1,185 | 1.1% |
| Salvadoran | 290 | 0.3% |
| Samoan | 55 | 0.1% |
| Scandinavian | 253 | 0.2% |
| Scotch-Irish | 778 | 0.7% |
| Scottish | 1,726 | 1.6% |
| Seminole | 32 | 0.0% |
| Serbian | 29 | 0.0% |
| Sioux | 3 | 0.0% |
| Slavic | 74 | 0.1% |
| Slovak | 738 | 0.7% |
| Slovene | 5 | 0.0% |
| South African | 50 | 0.1% |
| South American | 2,995 | 2.7% |
| South American Indian | 49 | 0.0% |
| Spaniard | 579 | 0.5% |
| Spanish | 244 | 0.2% |
| Spanish American Indian | 34 | 0.0% |
| Sri Lankan | 356 | 0.3% |
| Subsaharan African | 1,029 | 0.9% |
| Swedish | 780 | 0.7% |
| Swiss | 512 | 0.5% |
| Syrian | 35 | 0.0% |
| Thai | 779 | 0.7% |
| Tongan | 10 | 0.0% |
| Trinidadian and Tobagonian | 188 | 0.2% |
| Turkish | 59 | 0.1% |
| Ugandan | 188 | 0.2% |
| Ukrainian | 1,620 | 1.5% |
| Uruguayan | 155 | 0.1% |
| Venezuelan | 68 | 0.1% |
| Vietnamese | 49 | 0.0% |
| Welsh | 979 | 0.9% |
| West Indian | 19 | 0.0% |
| Yugoslavian | 129 | 0.1% | View All 130 Rows |
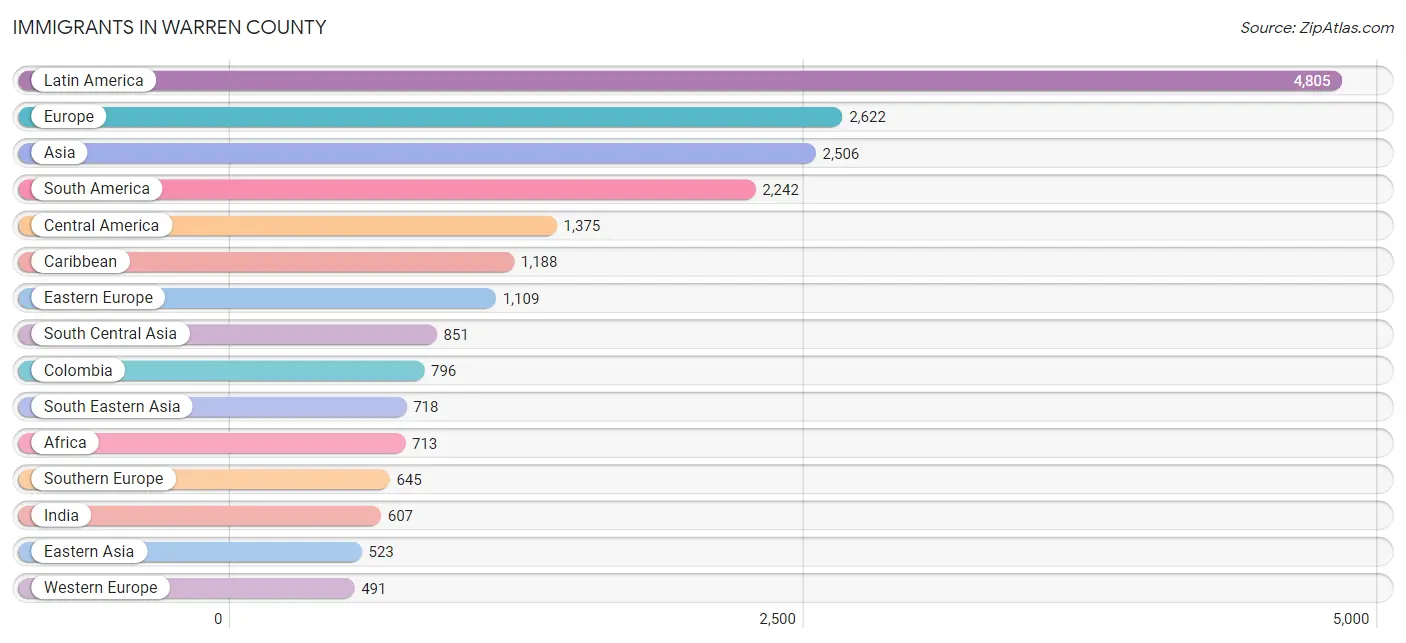
Immigrants in Warren County
The most numerous immigrant groups reported in Warren County came from Latin America (4,805 | 4.4%), Europe (2,622 | 2.4%), Asia (2,506 | 2.3%), South America (2,242 | 2.0%), and Central America (1,375 | 1.3%), together accounting for 12.3% of all Warren County residents.
| Immigration Origin | # Population | % Population |
| Afghanistan | 42 | 0.0% |
| Africa | 713 | 0.6% |
| Albania | 25 | 0.0% |
| Argentina | 84 | 0.1% |
| Armenia | 15 | 0.0% |
| Asia | 2,506 | 2.3% |
| Austria | 58 | 0.1% |
| Bahamas | 11 | 0.0% |
| Bangladesh | 74 | 0.1% |
| Belize | 13 | 0.0% |
| Bosnia and Herzegovina | 36 | 0.0% |
| Brazil | 226 | 0.2% |
| Bulgaria | 38 | 0.0% |
| Cambodia | 25 | 0.0% |
| Canada | 158 | 0.1% |
| Caribbean | 1,188 | 1.1% |
| Central America | 1,375 | 1.3% |
| Chile | 90 | 0.1% |
| China | 458 | 0.4% |
| Colombia | 796 | 0.7% |
| Costa Rica | 405 | 0.4% |
| Cuba | 237 | 0.2% |
| Czechoslovakia | 10 | 0.0% |
| Denmark | 21 | 0.0% |
| Dominica | 22 | 0.0% |
| Dominican Republic | 405 | 0.4% |
| Eastern Africa | 99 | 0.1% |
| Eastern Asia | 523 | 0.5% |
| Eastern Europe | 1,109 | 1.0% |
| Ecuador | 377 | 0.3% |
| Egypt | 179 | 0.2% |
| El Salvador | 86 | 0.1% |
| England | 114 | 0.1% |
| Europe | 2,622 | 2.4% |
| France | 15 | 0.0% |
| Germany | 285 | 0.3% |
| Ghana | 102 | 0.1% |
| Greece | 55 | 0.1% |
| Guatemala | 217 | 0.2% |
| Guyana | 84 | 0.1% |
| Haiti | 318 | 0.3% |
| Honduras | 230 | 0.2% |
| Hong Kong | 10 | 0.0% |
| Hungary | 68 | 0.1% |
| India | 607 | 0.5% |
| Indonesia | 35 | 0.0% |
| Iran | 19 | 0.0% |
| Ireland | 68 | 0.1% |
| Italy | 416 | 0.4% |
| Jamaica | 120 | 0.1% |
| Japan | 21 | 0.0% |
| Kazakhstan | 21 | 0.0% |
| Kenya | 34 | 0.0% |
| Korea | 44 | 0.0% |
| Latin America | 4,805 | 4.4% |
| Latvia | 12 | 0.0% |
| Lebanon | 36 | 0.0% |
| Lithuania | 25 | 0.0% |
| Mexico | 388 | 0.4% |
| Middle Africa | 46 | 0.0% |
| Moldova | 84 | 0.1% |
| Netherlands | 89 | 0.1% |
| Nicaragua | 36 | 0.0% |
| Nigeria | 199 | 0.2% |
| North Macedonia | 31 | 0.0% |
| Northern Africa | 179 | 0.2% |
| Northern Europe | 377 | 0.3% |
| Oceania | 8 | 0.0% |
| Pakistan | 68 | 0.1% |
| Peru | 384 | 0.4% |
| Philippines | 469 | 0.4% |
| Poland | 343 | 0.3% |
| Portugal | 73 | 0.1% |
| Romania | 84 | 0.1% |
| Russia | 29 | 0.0% |
| Scotland | 9 | 0.0% |
| Serbia | 14 | 0.0% |
| Singapore | 16 | 0.0% |
| South Africa | 17 | 0.0% |
| South America | 2,242 | 2.0% |
| South Central Asia | 851 | 0.8% |
| South Eastern Asia | 718 | 0.6% |
| Southern Europe | 645 | 0.6% |
| Spain | 101 | 0.1% |
| Sweden | 5 | 0.0% |
| Switzerland | 44 | 0.0% |
| Syria | 259 | 0.2% |
| Taiwan | 6 | 0.0% |
| Trinidad and Tobago | 70 | 0.1% |
| Turkey | 19 | 0.0% |
| Uganda | 65 | 0.1% |
| Ukraine | 173 | 0.2% |
| Uruguay | 119 | 0.1% |
| Uzbekistan | 14 | 0.0% |
| Venezuela | 66 | 0.1% |
| Vietnam | 173 | 0.2% |
| Western Africa | 352 | 0.3% |
| Western Asia | 414 | 0.4% |
| Western Europe | 491 | 0.4% | View All 99 Rows |
Sex and Age in Warren County
Sex and Age in Warren County
The most populous age groups in Warren County are 60 to 64 Years (4,902 | 9.0%) for men and 55 to 59 Years (4,528 | 8.2%) for women.
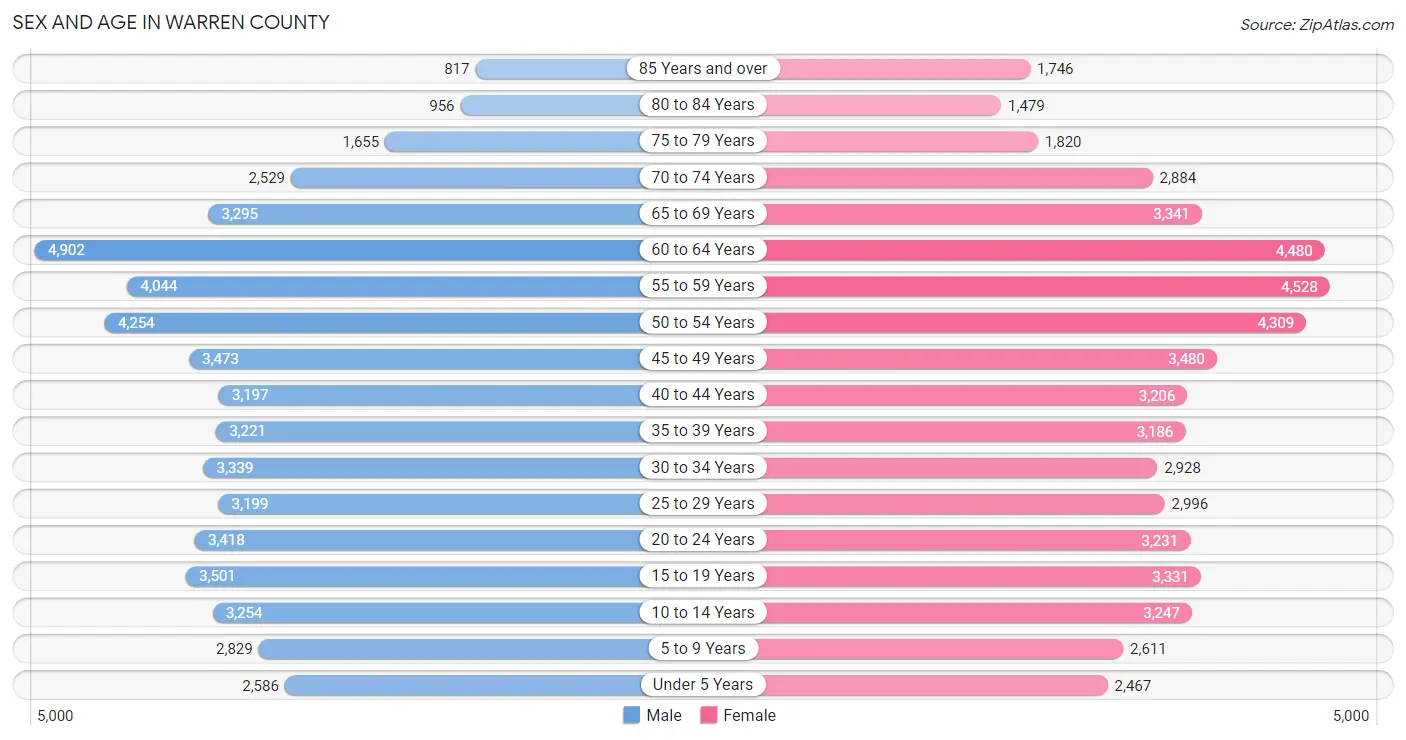
| Age Bracket | Male | Female |
| Under 5 Years | 2,586 (4.8%) | 2,467 (4.5%) |
| 5 to 9 Years | 2,829 (5.2%) | 2,611 (4.7%) |
| 10 to 14 Years | 3,254 (6.0%) | 3,247 (5.9%) |
| 15 to 19 Years | 3,501 (6.4%) | 3,331 (6.0%) |
| 20 to 24 Years | 3,418 (6.3%) | 3,231 (5.9%) |
| 25 to 29 Years | 3,199 (5.9%) | 2,996 (5.4%) |
| 30 to 34 Years | 3,339 (6.1%) | 2,928 (5.3%) |
| 35 to 39 Years | 3,221 (5.9%) | 3,186 (5.8%) |
| 40 to 44 Years | 3,197 (5.9%) | 3,206 (5.8%) |
| 45 to 49 Years | 3,473 (6.4%) | 3,480 (6.3%) |
| 50 to 54 Years | 4,254 (7.8%) | 4,309 (7.8%) |
| 55 to 59 Years | 4,044 (7.4%) | 4,528 (8.2%) |
| 60 to 64 Years | 4,902 (9.0%) | 4,480 (8.1%) |
| 65 to 69 Years | 3,295 (6.0%) | 3,341 (6.0%) |
| 70 to 74 Years | 2,529 (4.6%) | 2,884 (5.2%) |
| 75 to 79 Years | 1,655 (3.0%) | 1,820 (3.3%) |
| 80 to 84 Years | 956 (1.8%) | 1,479 (2.7%) |
| 85 Years and over | 817 (1.5%) | 1,746 (3.2%) |
| Total | 54,469 (100.0%) | 55,270 (100.0%) |
Families and Households in Warren County
Median Family Size in Warren County
The median family size in Warren County is 3.00 persons per family, with married-couple families (22,944 | 78.5%) accounting for the largest median family size of 3.08 persons per family. On the other hand, single female/mother families (4,129 | 14.1%) represent the smallest median family size with 2.63 persons per family.
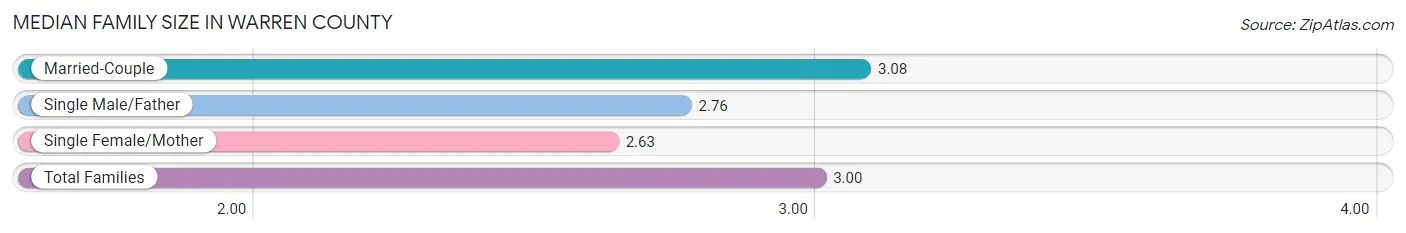
| Family Type | # Families | Family Size |
| Married-Couple | 22,944 (78.5%) | 3.08 |
| Single Male/Father | 2,169 (7.4%) | 2.76 |
| Single Female/Mother | 4,129 (14.1%) | 2.63 |
| Total Families | 29,242 (100.0%) | 3.00 |
Median Household Size in Warren County
The median household size in Warren County is 2.43 persons per household, with single male/father households (2,169 | 4.9%) accounting for the largest median household size of 3.18 persons per household. non-family households (15,128 | 34.1%) represent the smallest median household size with 1.19 persons per household.
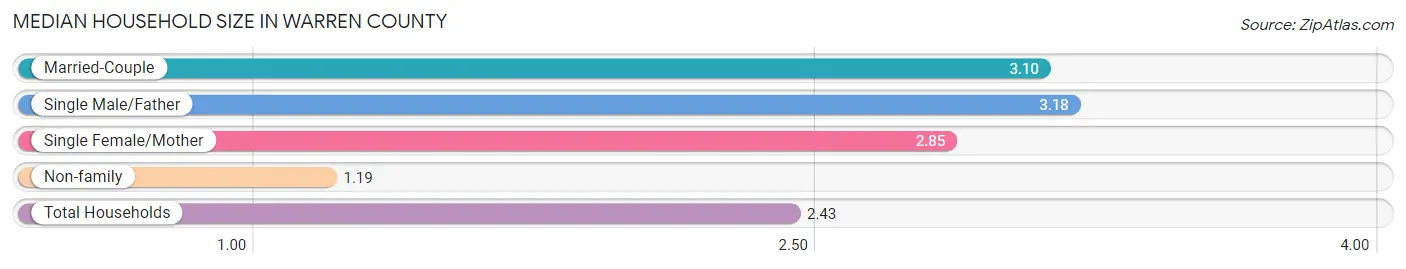
| Household Type | # Households | Household Size |
| Married-Couple | 22,944 (51.7%) | 3.10 |
| Single Male/Father | 2,169 (4.9%) | 3.18 |
| Single Female/Mother | 4,129 (9.3%) | 2.85 |
| Non-family | 15,128 (34.1%) | 1.19 |
| Total Households | 44,370 (100.0%) | 2.43 |
Household Size by Marriage Status in Warren County
Out of a total of 44,370 households in Warren County, 29,242 (65.9%) are family households, while 15,128 (34.1%) are nonfamily households. The most numerous type of family households are 2-person households, comprising 13,048, and the most common type of nonfamily households are 1-person households, comprising 12,874.
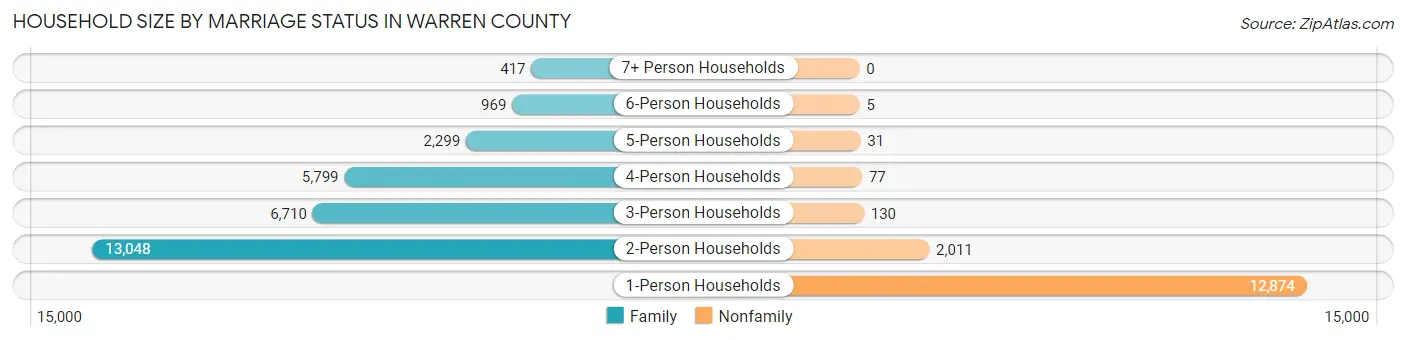
| Household Size | Family Households | Nonfamily Households |
| 1-Person Households | - | 12,874 (29.0%) |
| 2-Person Households | 13,048 (29.4%) | 2,011 (4.5%) |
| 3-Person Households | 6,710 (15.1%) | 130 (0.3%) |
| 4-Person Households | 5,799 (13.1%) | 77 (0.2%) |
| 5-Person Households | 2,299 (5.2%) | 31 (0.1%) |
| 6-Person Households | 969 (2.2%) | 5 (0.0%) |
| 7+ Person Households | 417 (0.9%) | 0 (0.0%) |
| Total | 29,242 (65.9%) | 15,128 (34.1%) |
Female Fertility in Warren County
Fertility by Age in Warren County
Average fertility rate in Warren County is 44.0 births per 1,000 women. Women in the age bracket of 20 to 34 years have the highest fertility rate with 73.0 births per 1,000 women. Women in the age bracket of 20 to 34 years acount for 65.4% of all women with births.
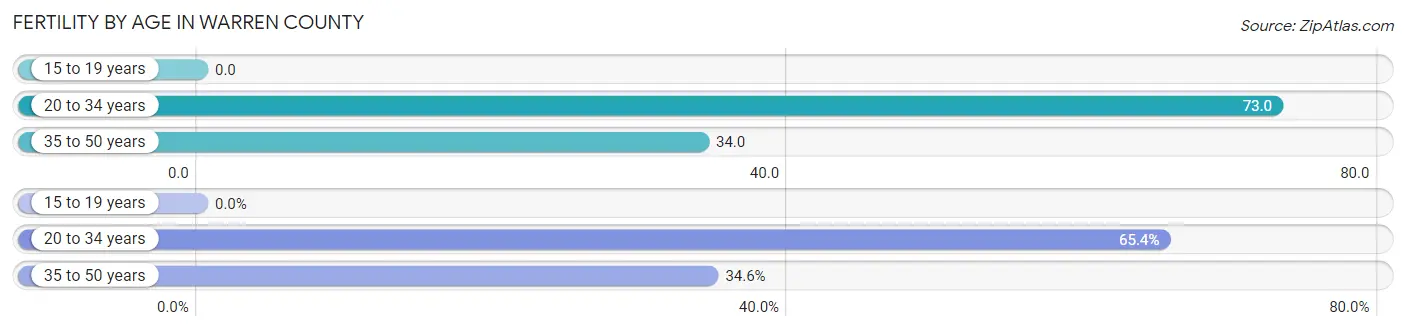
| Age Bracket | Women with Births | Births / 1,000 Women |
| 15 to 19 years | 0 (0.0%) | 0.0 |
| 20 to 34 years | 668 (65.4%) | 73.0 |
| 35 to 50 years | 354 (34.6%) | 34.0 |
| Total | 1,022 (100.0%) | 44.0 |
Fertility by Age by Marriage Status in Warren County
84.1% of women with births (1,022) in Warren County are married. The highest percentage of unmarried women with births falls into 20 to 34 years age bracket with 22.3% of them unmarried at the time of birth, while the lowest percentage of unmarried women with births belong to 35 to 50 years age bracket with 3.7% of them unmarried.
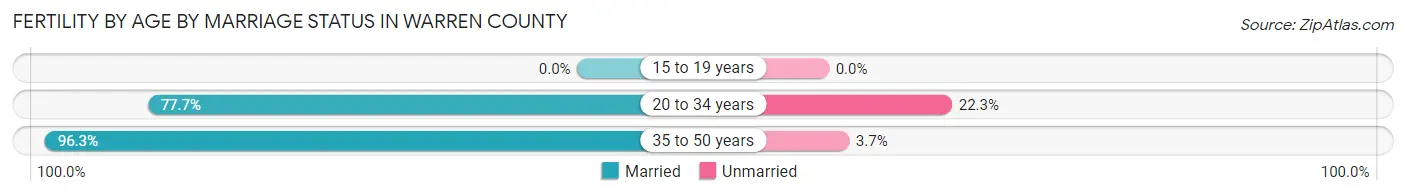
| Age Bracket | Married | Unmarried |
| 15 to 19 years | 0 (0.0%) | 0 (0.0%) |
| 20 to 34 years | 519 (77.7%) | 149 (22.3%) |
| 35 to 50 years | 341 (96.3%) | 13 (3.7%) |
| Total | 860 (84.2%) | 162 (15.9%) |
Fertility by Education in Warren County
Average fertility rate in Warren County is 44.0 births per 1,000 women. Women with the education attainment of graduate degree have the highest fertility rate of 61.0 births per 1,000 women, while women with the education attainment of less than high school have the lowest fertility at 7.0 births per 1,000 women. Women with the education attainment of bachelor's degree represent 33.6% of all women with births.
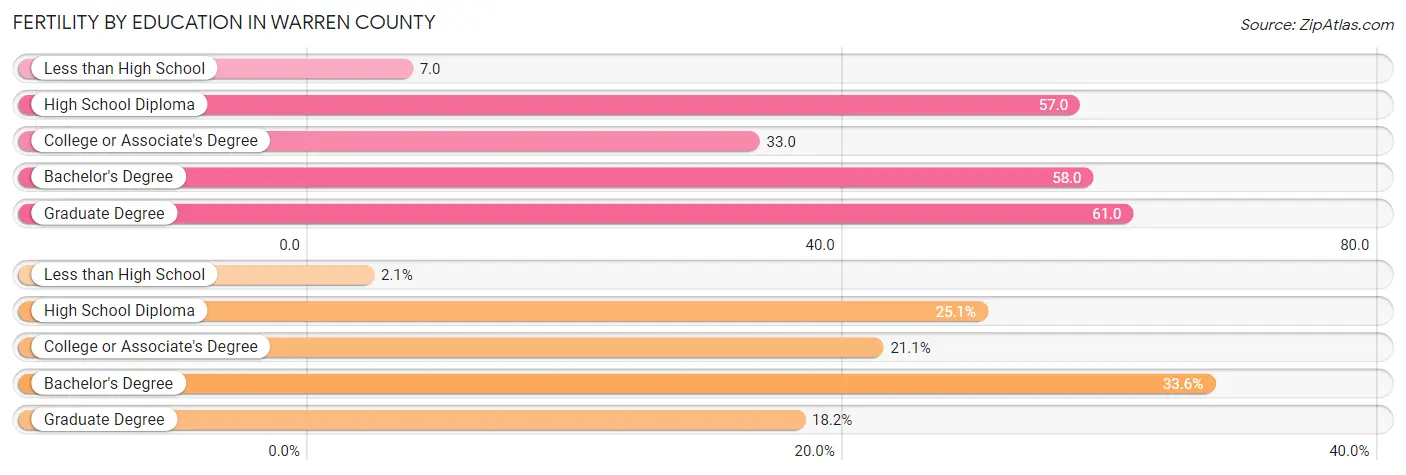
| Educational Attainment | Women with Births | Births / 1,000 Women |
| Less than High School | 21 (2.1%) | 7.0 |
| High School Diploma | 256 (25.1%) | 57.0 |
| College or Associate's Degree | 216 (21.1%) | 33.0 |
| Bachelor's Degree | 343 (33.6%) | 58.0 |
| Graduate Degree | 186 (18.2%) | 61.0 |
| Total | 1,022 (100.0%) | 44.0 |
Fertility by Education by Marriage Status in Warren County
15.9% of women with births in Warren County are unmarried. Women with the educational attainment of graduate degree are most likely to be married with 100.0% of them married at childbirth, while women with the educational attainment of less than high school are least likely to be married with 100.0% of them unmarried at childbirth.
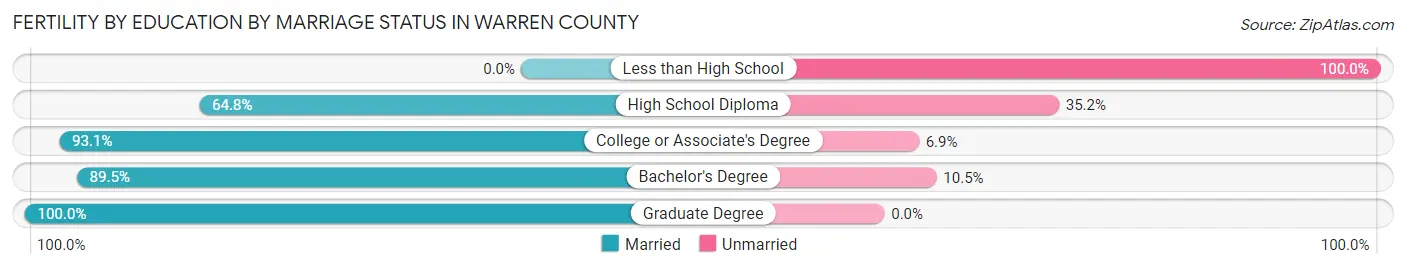
| Educational Attainment | Married | Unmarried |
| Less than High School | 0 (0.0%) | 21 (100.0%) |
| High School Diploma | 166 (64.8%) | 90 (35.2%) |
| College or Associate's Degree | 201 (93.1%) | 15 (6.9%) |
| Bachelor's Degree | 307 (89.5%) | 36 (10.5%) |
| Graduate Degree | 186 (100.0%) | 0 (0.0%) |
| Total | 860 (84.2%) | 162 (15.9%) |
Income in Warren County
Income Overview in Warren County
Per Capita Income in Warren County is $45,517, while median incomes of families and households are $113,083 and $92,620 respectively.
| Characteristic | Number | Measure |
| Per Capita Income | 109,739 | $45,517 |
| Median Family Income | 29,242 | $113,083 |
| Mean Family Income | 29,242 | $132,750 |
| Median Household Income | 44,370 | $92,620 |
| Mean Household Income | 44,370 | $110,838 |
| Income Deficit | 29,242 | $11,858 |
| Wage / Income Gap (%) | 109,739 | 34.94% |
| Wage / Income Gap ($) | 109,739 | 65.06¢ per $1 |
| Gini / Inequality Index | 109,739 | 0.42 |
Earnings by Sex in Warren County
Average Earnings in Warren County are $48,631, $58,915 for men and $38,331 for women, a difference of 34.9%.
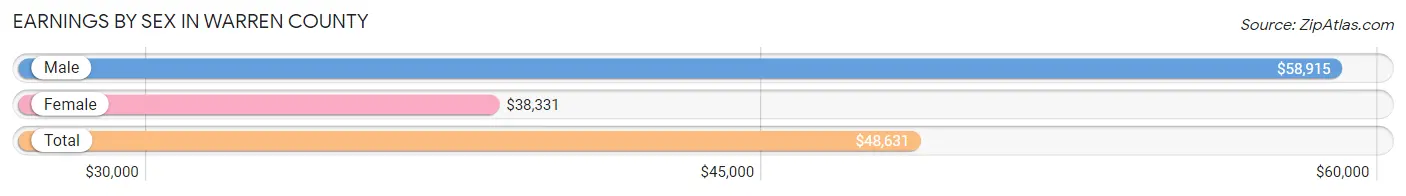
| Sex | Number | Average Earnings |
| Male | 33,366 (53.5%) | $58,915 |
| Female | 28,967 (46.5%) | $38,331 |
| Total | 62,333 (100.0%) | $48,631 |
Earnings by Sex by Income Bracket in Warren County
The most common earnings brackets in Warren County are $100,000+ for men (8,381 | 25.1%) and $100,000+ for women (3,239 | 11.2%).
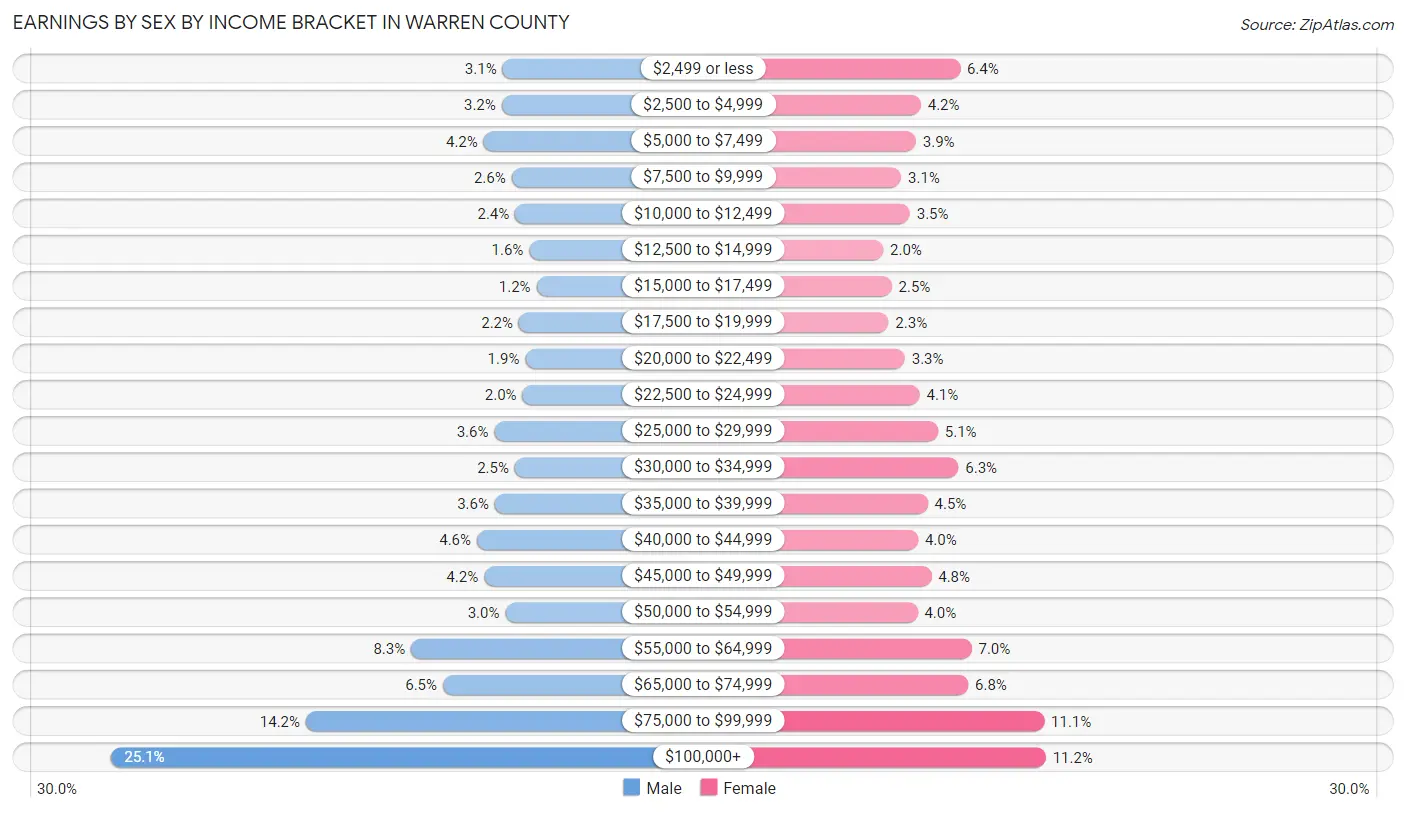
| Income | Male | Female |
| $2,499 or less | 1,049 (3.1%) | 1,841 (6.4%) |
| $2,500 to $4,999 | 1,064 (3.2%) | 1,204 (4.2%) |
| $5,000 to $7,499 | 1,403 (4.2%) | 1,124 (3.9%) |
| $7,500 to $9,999 | 877 (2.6%) | 883 (3.0%) |
| $10,000 to $12,499 | 811 (2.4%) | 1,026 (3.5%) |
| $12,500 to $14,999 | 547 (1.6%) | 591 (2.0%) |
| $15,000 to $17,499 | 412 (1.2%) | 731 (2.5%) |
| $17,500 to $19,999 | 740 (2.2%) | 677 (2.3%) |
| $20,000 to $22,499 | 619 (1.9%) | 945 (3.3%) |
| $22,500 to $24,999 | 675 (2.0%) | 1,186 (4.1%) |
| $25,000 to $29,999 | 1,200 (3.6%) | 1,483 (5.1%) |
| $30,000 to $34,999 | 817 (2.5%) | 1,815 (6.3%) |
| $35,000 to $39,999 | 1,192 (3.6%) | 1,316 (4.5%) |
| $40,000 to $44,999 | 1,527 (4.6%) | 1,159 (4.0%) |
| $45,000 to $49,999 | 1,396 (4.2%) | 1,376 (4.8%) |
| $50,000 to $54,999 | 994 (3.0%) | 1,151 (4.0%) |
| $55,000 to $64,999 | 2,762 (8.3%) | 2,031 (7.0%) |
| $65,000 to $74,999 | 2,165 (6.5%) | 1,976 (6.8%) |
| $75,000 to $99,999 | 4,735 (14.2%) | 3,213 (11.1%) |
| $100,000+ | 8,381 (25.1%) | 3,239 (11.2%) |
| Total | 33,366 (100.0%) | 28,967 (100.0%) |
Earnings by Sex by Educational Attainment in Warren County
Average earnings in Warren County are $67,308 for men and $45,843 for women, a difference of 31.9%. Men with an educational attainment of graduate degree enjoy the highest average annual earnings of $109,650, while those with less than high school education earn the least with $33,777. Women with an educational attainment of graduate degree earn the most with the average annual earnings of $72,778, while those with less than high school education have the smallest earnings of $22,625.
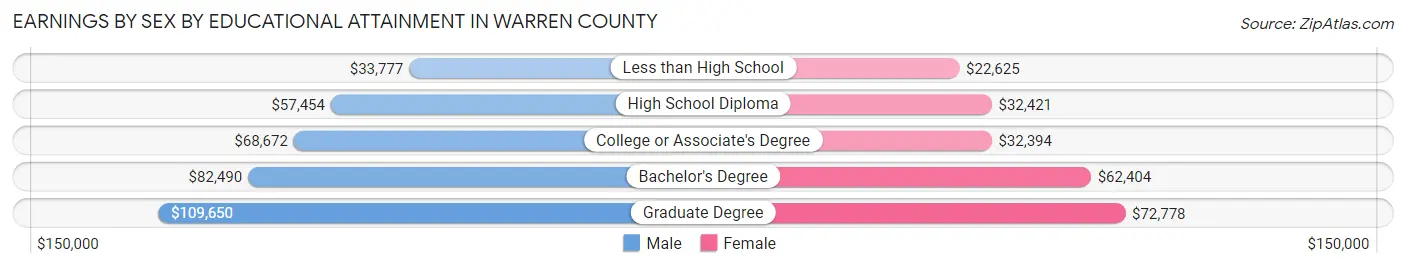
| Educational Attainment | Male Income | Female Income |
| Less than High School | $33,777 | $22,625 |
| High School Diploma | $57,454 | $32,421 |
| College or Associate's Degree | $68,672 | $32,394 |
| Bachelor's Degree | $82,490 | $62,404 |
| Graduate Degree | $109,650 | $72,778 |
| Total | $67,308 | $45,843 |
Family Income in Warren County
Family Income Brackets in Warren County
According to the Warren County family income data, there are 6,901 families falling into the $100,000 to $149,999 income range, which is the most common income bracket and makes up 23.6% of all families. Conversely, the $10,000 to $14,999 income bracket is the least frequent group with only 409 families (1.4%) belonging to this category.
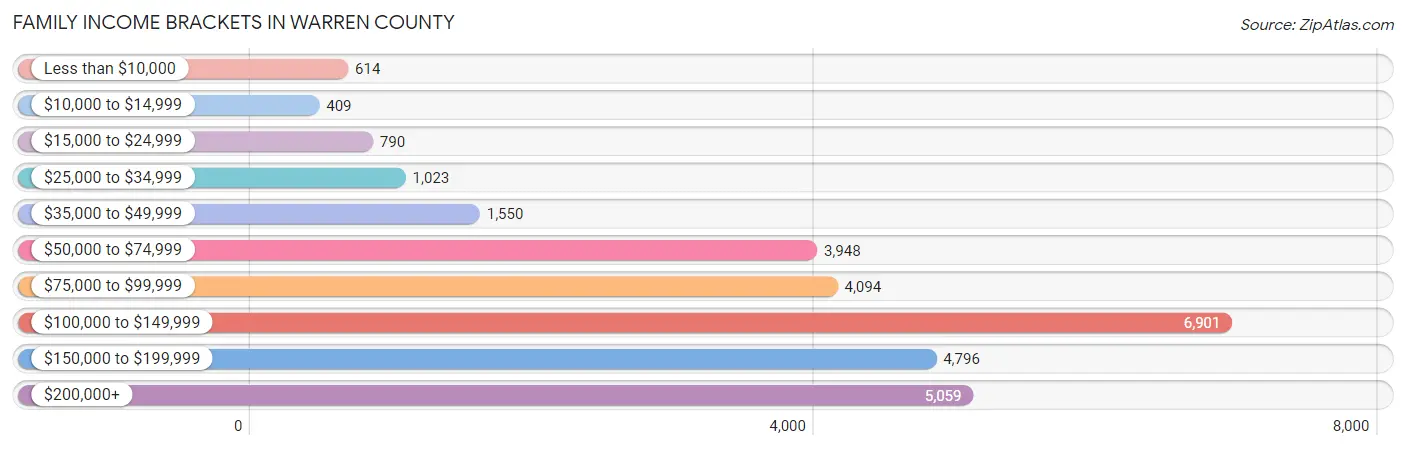
| Income Bracket | # Families | % Families |
| Less than $10,000 | 614 | 2.1% |
| $10,000 to $14,999 | 409 | 1.4% |
| $15,000 to $24,999 | 790 | 2.7% |
| $25,000 to $34,999 | 1,023 | 3.5% |
| $35,000 to $49,999 | 1,550 | 5.3% |
| $50,000 to $74,999 | 3,948 | 13.5% |
| $75,000 to $99,999 | 4,094 | 14.0% |
| $100,000 to $149,999 | 6,901 | 23.6% |
| $150,000 to $199,999 | 4,796 | 16.4% |
| $200,000+ | 5,059 | 17.3% |
Family Income by Famaliy Size in Warren County
7+ person families (388 | 1.3%) account for the highest median family income in Warren County with $161,115 per family, while 2-person families (13,788 | 47.1%) have the highest median income of $46,314 per family member.
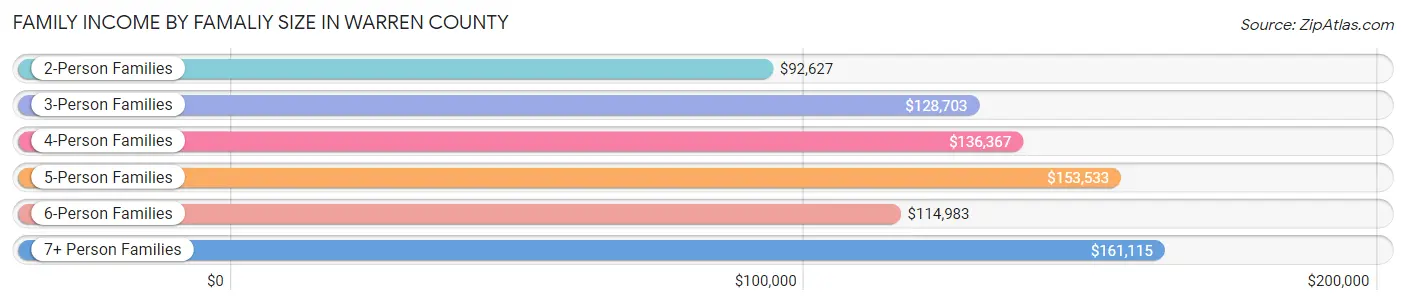
| Income Bracket | # Families | Median Income |
| 2-Person Families | 13,788 (47.1%) | $92,627 |
| 3-Person Families | 6,642 (22.7%) | $128,703 |
| 4-Person Families | 5,538 (18.9%) | $136,367 |
| 5-Person Families | 2,135 (7.3%) | $153,533 |
| 6-Person Families | 751 (2.6%) | $114,983 |
| 7+ Person Families | 388 (1.3%) | $161,115 |
| Total | 29,242 (100.0%) | $113,083 |
Family Income by Number of Earners in Warren County
The median family income in Warren County is $113,083, with families comprising 3+ earners (4,276) having the highest median family income of $181,033, while families with no earners (4,269) have the lowest median family income of $58,125, accounting for 14.6% and 14.6% of families, respectively.
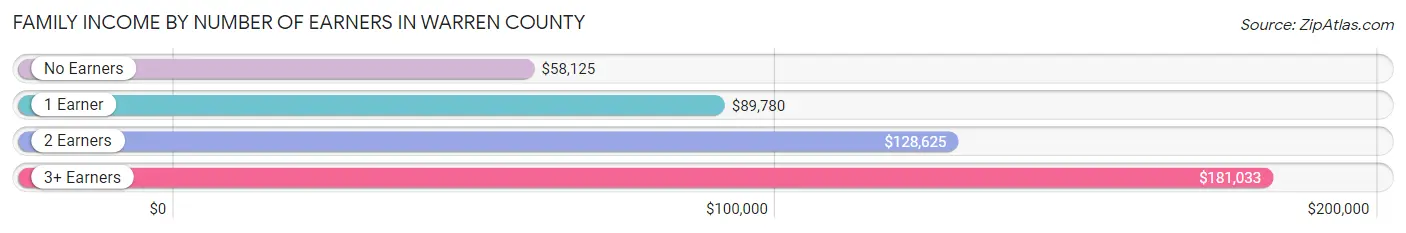
| Number of Earners | # Families | Median Income |
| No Earners | 4,269 (14.6%) | $58,125 |
| 1 Earner | 7,665 (26.2%) | $89,780 |
| 2 Earners | 13,032 (44.6%) | $128,625 |
| 3+ Earners | 4,276 (14.6%) | $181,033 |
| Total | 29,242 (100.0%) | $113,083 |
Household Income in Warren County
Household Income Brackets in Warren County
With 9,451 households falling in the category, the $100,000 to $149,999 income range is the most frequent in Warren County, accounting for 21.3% of all households. In contrast, only 1,331 households (3.0%) fall into the $10,000 to $14,999 income bracket, making it the least populous group.
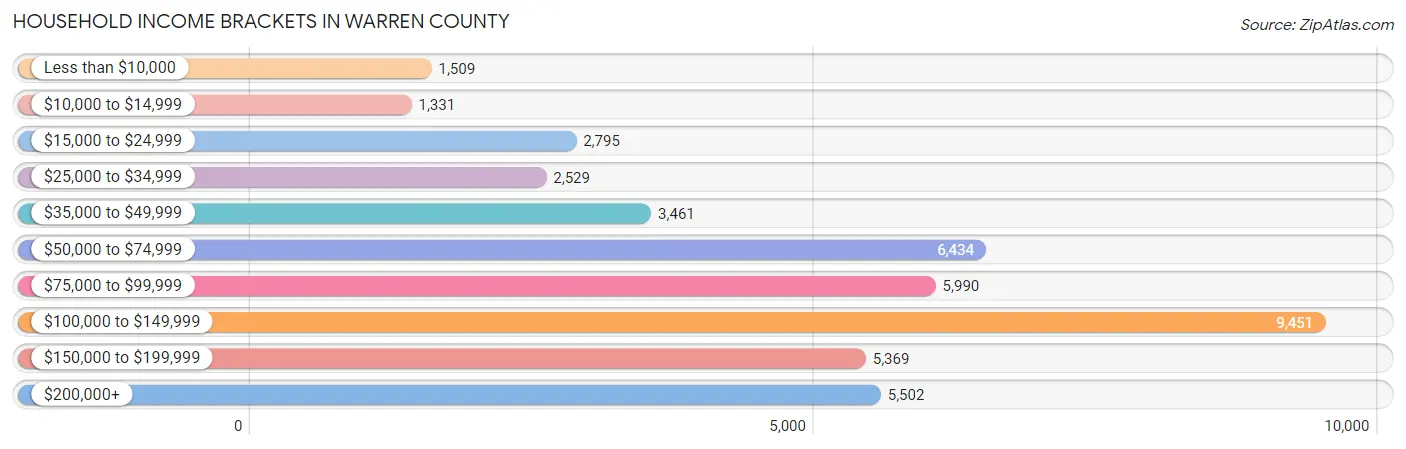
| Income Bracket | # Households | % Households |
| Less than $10,000 | 1,509 | 3.4% |
| $10,000 to $14,999 | 1,331 | 3.0% |
| $15,000 to $24,999 | 2,795 | 6.3% |
| $25,000 to $34,999 | 2,529 | 5.7% |
| $35,000 to $49,999 | 3,461 | 7.8% |
| $50,000 to $74,999 | 6,434 | 14.5% |
| $75,000 to $99,999 | 5,990 | 13.5% |
| $100,000 to $149,999 | 9,451 | 21.3% |
| $150,000 to $199,999 | 5,369 | 12.1% |
| $200,000+ | 5,502 | 12.4% |
Household Income by Householder Age in Warren County
The median household income in Warren County is $92,620, with the highest median household income of $110,260 found in the 45 to 64 years age bracket for the primary householder. A total of 19,259 households (43.4%) fall into this category. Meanwhile, the 15 to 24 years age bracket for the primary householder has the lowest median household income of $30,750, with 505 households (1.1%) in this group.
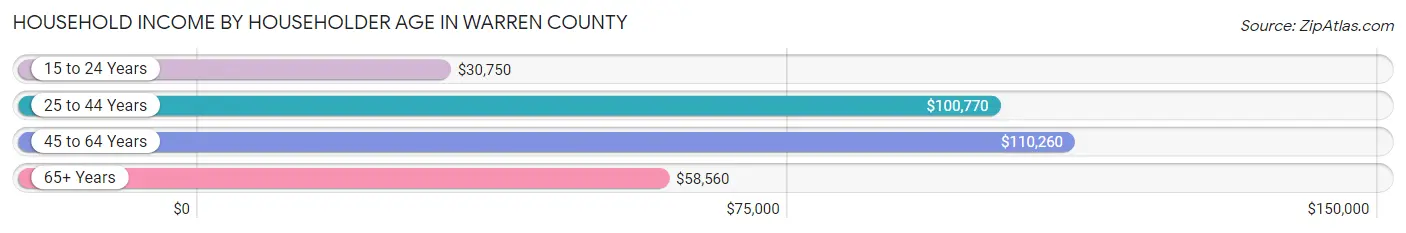
| Income Bracket | # Households | Median Income |
| 15 to 24 Years | 505 (1.1%) | $30,750 |
| 25 to 44 Years | 11,617 (26.2%) | $100,770 |
| 45 to 64 Years | 19,259 (43.4%) | $110,260 |
| 65+ Years | 12,989 (29.3%) | $58,560 |
| Total | 44,370 (100.0%) | $92,620 |
Poverty in Warren County
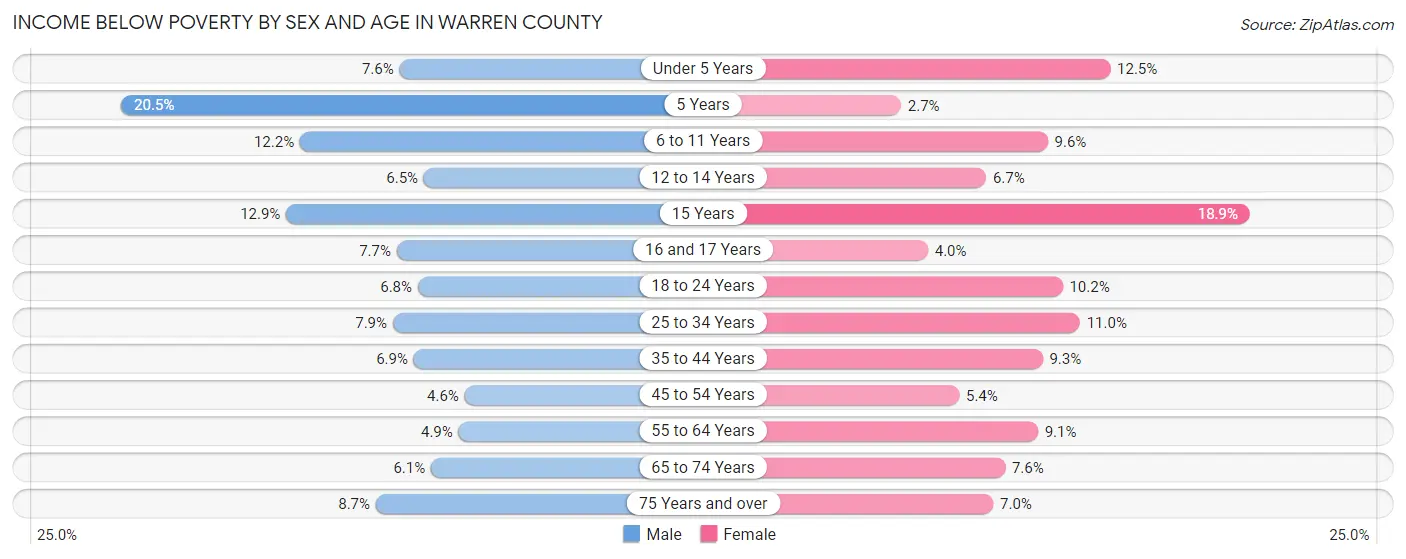
Income Below Poverty by Sex and Age in Warren County
With 6.9% poverty level for males and 8.6% for females among the residents of Warren County, 5 year old males and 15 year old females are the most vulnerable to poverty, with 79 males (20.5%) and 128 females (18.9%) in their respective age groups living below the poverty level.
| Age Bracket | Male | Female |
| Under 5 Years | 196 (7.6%) | 299 (12.4%) |
| 5 Years | 79 (20.5%) | 11 (2.7%) |
| 6 to 11 Years | 399 (12.2%) | 351 (9.6%) |
| 12 to 14 Years | 150 (6.5%) | 114 (6.7%) |
| 15 Years | 71 (12.9%) | 128 (18.9%) |
| 16 and 17 Years | 124 (7.7%) | 56 (4.0%) |
| 18 to 24 Years | 306 (6.8%) | 414 (10.2%) |
| 25 to 34 Years | 515 (7.9%) | 652 (11.0%) |
| 35 to 44 Years | 444 (6.9%) | 595 (9.3%) |
| 45 to 54 Years | 353 (4.6%) | 423 (5.4%) |
| 55 to 64 Years | 433 (4.9%) | 819 (9.1%) |
| 65 to 74 Years | 356 (6.1%) | 463 (7.6%) |
| 75 Years and over | 290 (8.7%) | 332 (7.0%) |
| Total | 3,716 (6.9%) | 4,657 (8.6%) |
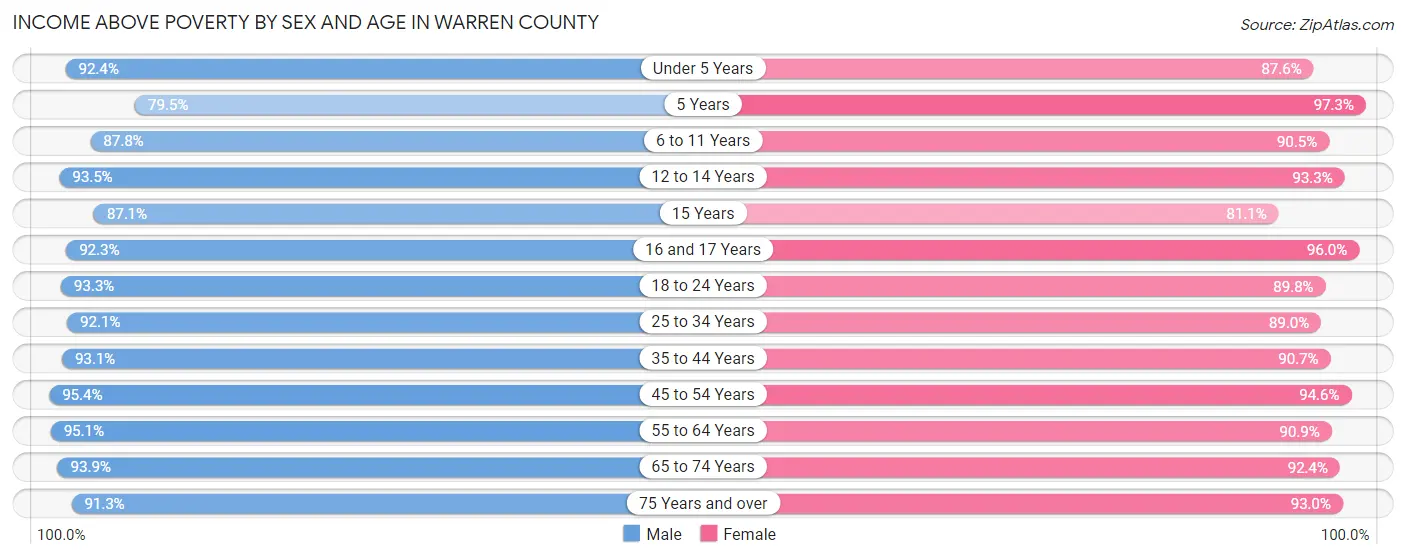
Income Above Poverty by Sex and Age in Warren County
According to the poverty statistics in Warren County, males aged 45 to 54 years and females aged 5 years are the age groups that are most secure financially, with 95.4% of males and 97.3% of females in these age groups living above the poverty line.
| Age Bracket | Male | Female |
| Under 5 Years | 2,383 (92.4%) | 2,102 (87.5%) |
| 5 Years | 306 (79.5%) | 391 (97.3%) |
| 6 to 11 Years | 2,867 (87.8%) | 3,325 (90.4%) |
| 12 to 14 Years | 2,168 (93.5%) | 1,591 (93.3%) |
| 15 Years | 481 (87.1%) | 548 (81.1%) |
| 16 and 17 Years | 1,481 (92.3%) | 1,349 (96.0%) |
| 18 to 24 Years | 4,229 (93.2%) | 3,627 (89.8%) |
| 25 to 34 Years | 5,997 (92.1%) | 5,255 (89.0%) |
| 35 to 44 Years | 5,951 (93.1%) | 5,795 (90.7%) |
| 45 to 54 Years | 7,357 (95.4%) | 7,348 (94.6%) |
| 55 to 64 Years | 8,471 (95.1%) | 8,189 (90.9%) |
| 65 to 74 Years | 5,442 (93.9%) | 5,651 (92.4%) |
| 75 Years and over | 3,045 (91.3%) | 4,395 (93.0%) |
| Total | 50,178 (93.1%) | 49,566 (91.4%) |
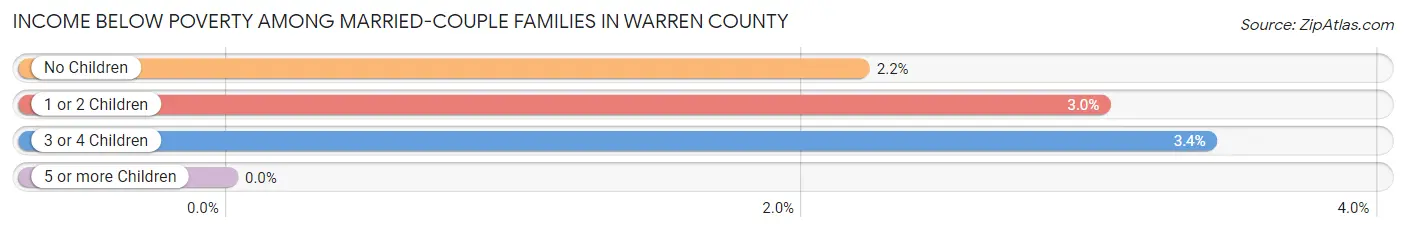
Income Below Poverty Among Married-Couple Families in Warren County
The poverty statistics for married-couple families in Warren County show that 2.5% or 581 of the total 22,944 families live below the poverty line. Families with 3 or 4 children have the highest poverty rate of 3.4%, comprising of 44 families. On the other hand, families with 5 or more children have the lowest poverty rate of 0.0%, which includes 0 families.
| Children | Above Poverty | Below Poverty |
| No Children | 13,612 (97.8%) | 306 (2.2%) |
| 1 or 2 Children | 7,374 (97.0%) | 231 (3.0%) |
| 3 or 4 Children | 1,246 (96.6%) | 44 (3.4%) |
| 5 or more Children | 131 (100.0%) | 0 (0.0%) |
| Total | 22,363 (97.5%) | 581 (2.5%) |
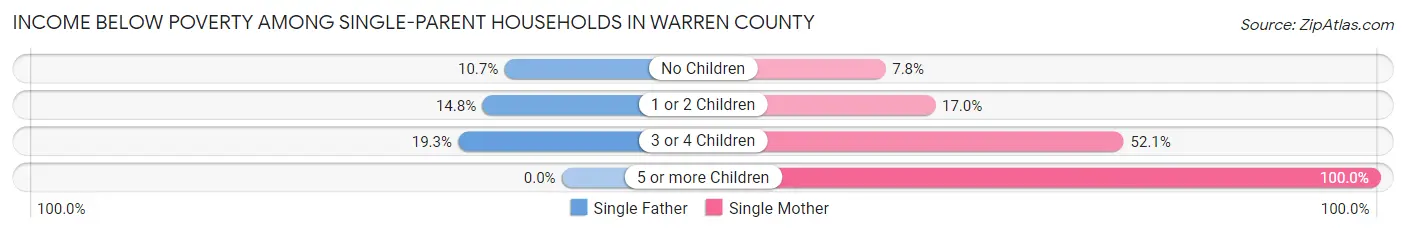
Income Below Poverty Among Single-Parent Households in Warren County
According to the poverty data in Warren County, 12.6% or 274 single-father households and 15.7% or 649 single-mother households are living below the poverty line. Among single-father households, those with 3 or 4 children have the highest poverty rate, with 28 households (19.3%) experiencing poverty. Likewise, among single-mother households, those with 5 or more children have the highest poverty rate, with 54 households (100.0%) falling below the poverty line.
| Children | Single Father | Single Mother |
| No Children | 109 (10.7%) | 151 (7.7%) |
| 1 or 2 Children | 137 (14.8%) | 322 (17.0%) |
| 3 or 4 Children | 28 (19.3%) | 122 (52.1%) |
| 5 or more Children | 0 (0.0%) | 54 (100.0%) |
| Total | 274 (12.6%) | 649 (15.7%) |
Income Below Poverty Among Married-Couple vs Single-Parent Households in Warren County
The poverty data for Warren County shows that 581 of the married-couple family households (2.5%) and 923 of the single-parent households (14.7%) are living below the poverty level. Within the married-couple family households, those with 3 or 4 children have the highest poverty rate, with 44 households (3.4%) falling below the poverty line. Among the single-parent households, those with 5 or more children have the highest poverty rate, with 54 household (40.6%) living below poverty.
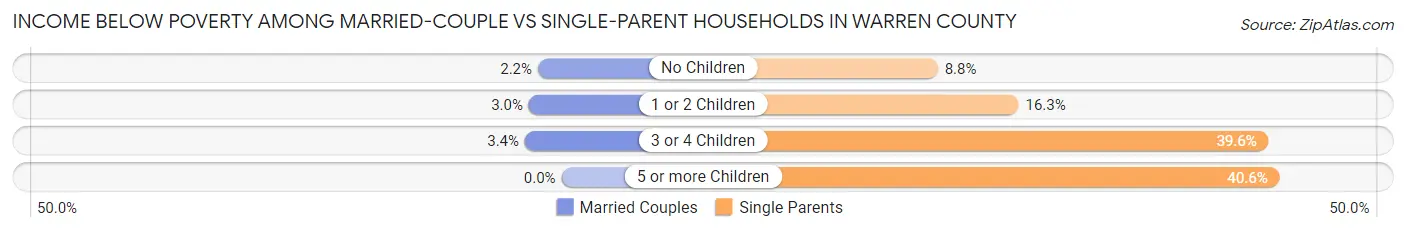
| Children | Married-Couple Families | Single-Parent Households |
| No Children | 306 (2.2%) | 260 (8.8%) |
| 1 or 2 Children | 231 (3.0%) | 459 (16.3%) |
| 3 or 4 Children | 44 (3.4%) | 150 (39.6%) |
| 5 or more Children | 0 (0.0%) | 54 (40.6%) |
| Total | 581 (2.5%) | 923 (14.7%) |
Employment Characteristics in Warren County
Employment by Class of Employer in Warren County
Among the 55,352 employed individuals in Warren County, private company employees (37,652 | 68.0%), local government employees (5,163 | 9.3%), and not-for-profit organizations (4,578 | 8.3%) make up the most common classes of employment.
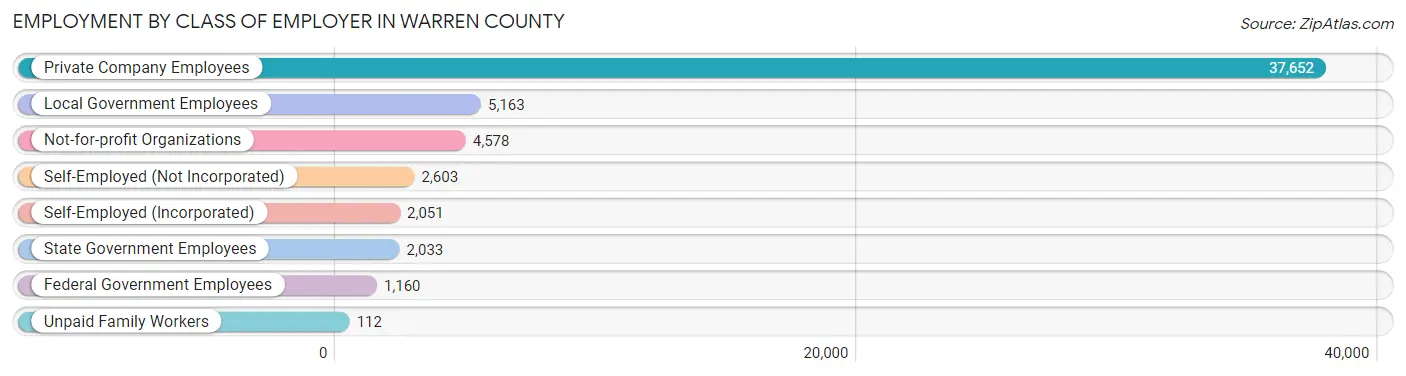
| Employer Class | # Employees | % Employees |
| Private Company Employees | 37,652 | 68.0% |
| Self-Employed (Incorporated) | 2,051 | 3.7% |
| Self-Employed (Not Incorporated) | 2,603 | 4.7% |
| Not-for-profit Organizations | 4,578 | 8.3% |
| Local Government Employees | 5,163 | 9.3% |
| State Government Employees | 2,033 | 3.7% |
| Federal Government Employees | 1,160 | 2.1% |
| Unpaid Family Workers | 112 | 0.2% |
| Total | 55,352 | 100.0% |
Employment Status by Age in Warren County
According to the labor force statistics for Warren County, out of the total population over 16 years of age (91,512), 66.0% or 60,398 individuals are in the labor force, with 6.0% or 3,624 of them unemployed. The age group with the highest labor force participation rate is 30 to 34 years, with 90.2% or 5,653 individuals in the labor force. Within the labor force, the 16 to 19 years age range has the highest percentage of unemployed individuals, with 14.3% or 369 of them being unemployed.
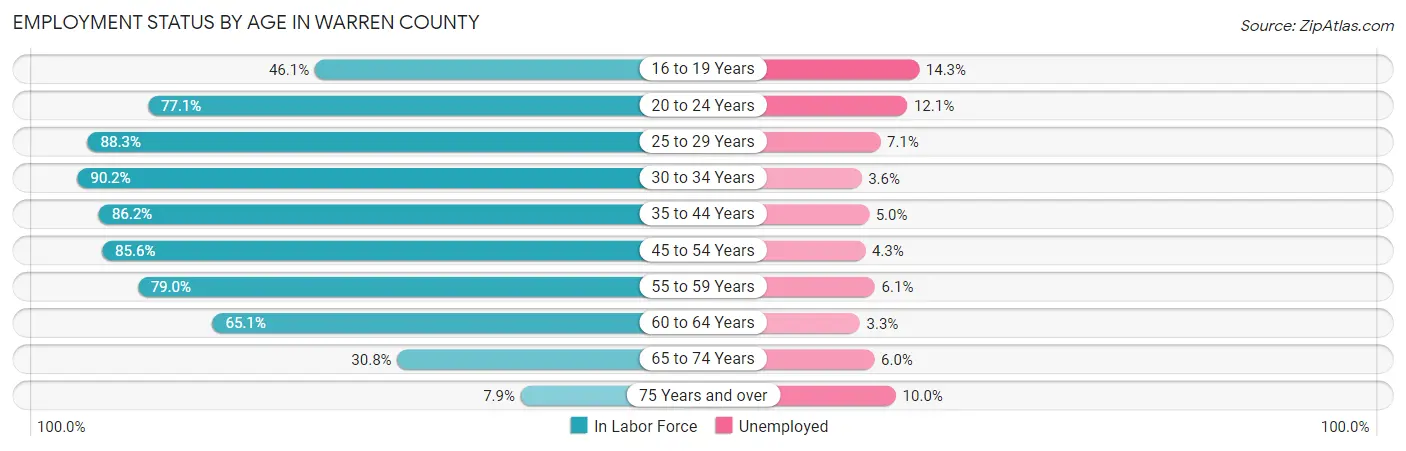
| Age Bracket | In Labor Force | Unemployed |
| 16 to 19 Years | 2,581 (46.1%) | 369 (14.3%) |
| 20 to 24 Years | 5,126 (77.1%) | 620 (12.1%) |
| 25 to 29 Years | 5,470 (88.3%) | 388 (7.1%) |
| 30 to 34 Years | 5,653 (90.2%) | 204 (3.6%) |
| 35 to 44 Years | 11,042 (86.2%) | 552 (5.0%) |
| 45 to 54 Years | 13,282 (85.6%) | 571 (4.3%) |
| 55 to 59 Years | 6,772 (79.0%) | 413 (6.1%) |
| 60 to 64 Years | 6,108 (65.1%) | 202 (3.3%) |
| 65 to 74 Years | 3,711 (30.8%) | 223 (6.0%) |
| 75 Years and over | 669 (7.9%) | 67 (10.0%) |
| Total | 60,398 (66.0%) | 3,624 (6.0%) |
Employment Status by Educational Attainment in Warren County
According to labor force statistics for Warren County, 82.2% of individuals (48,286) out of the total population between 25 and 64 years of age (58,742) are in the labor force, with 4.8% or 2,318 of them being unemployed. The group with the highest labor force participation rate are those with the educational attainment of bachelor's degree or higher, with 89.1% or 20,072 individuals in the labor force. Within the labor force, individuals with high school diploma education have the highest percentage of unemployment, with 5.8% or 805 of them being unemployed.
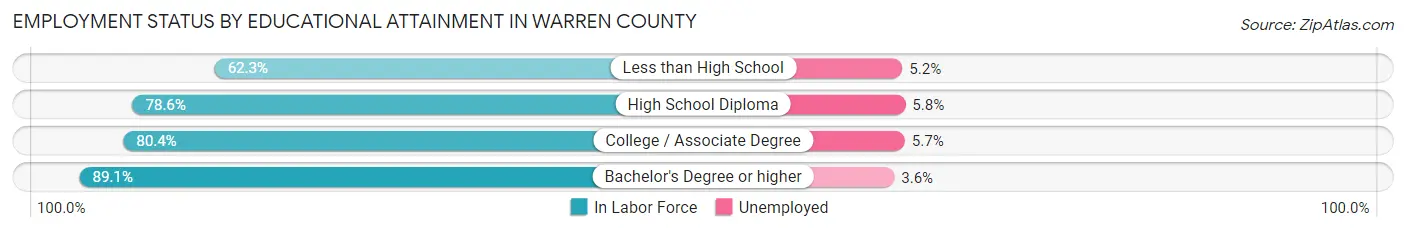
| Educational Attainment | In Labor Force | Unemployed |
| Less than High School | 1,877 (62.3%) | 157 (5.2%) |
| High School Diploma | 13,881 (78.6%) | 1,024 (5.8%) |
| College / Associate Degree | 12,496 (80.4%) | 886 (5.7%) |
| Bachelor's Degree or higher | 20,072 (89.1%) | 811 (3.6%) |
| Total | 48,286 (82.2%) | 2,820 (4.8%) |
Employment Occupations by Sex in Warren County
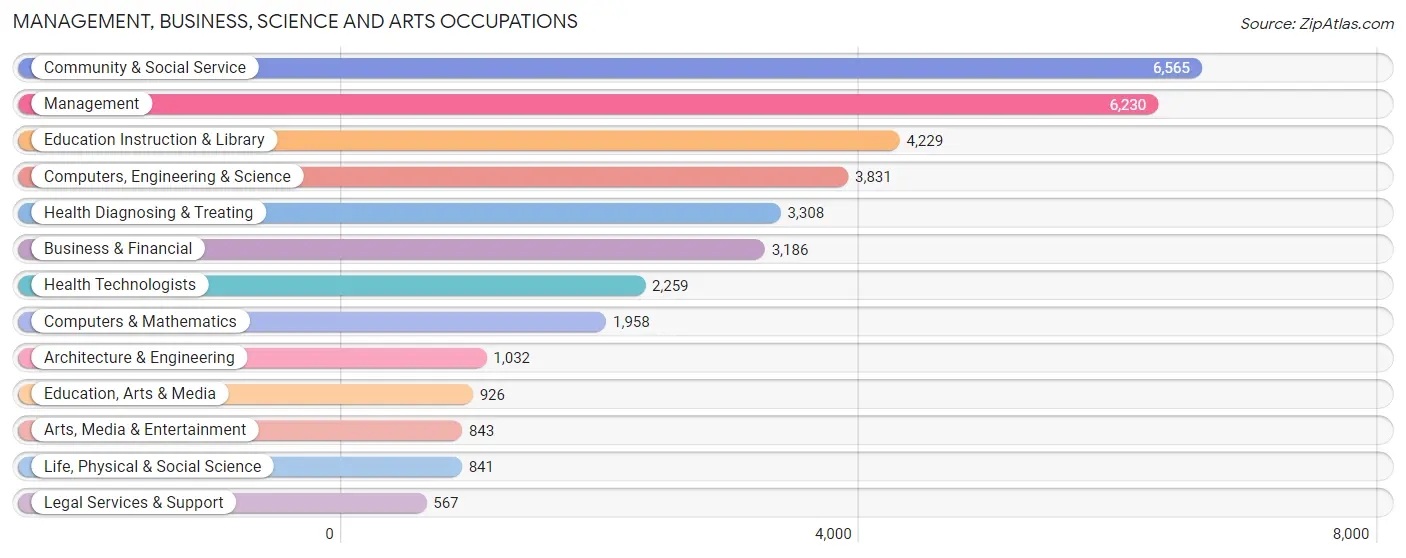
Management, Business, Science and Arts Occupations
The most common Management, Business, Science and Arts occupations in Warren County are Community & Social Service (6,565 | 11.6%), Management (6,230 | 11.0%), Education Instruction & Library (4,229 | 7.4%), Computers, Engineering & Science (3,831 | 6.8%), and Health Diagnosing & Treating (3,308 | 5.8%).
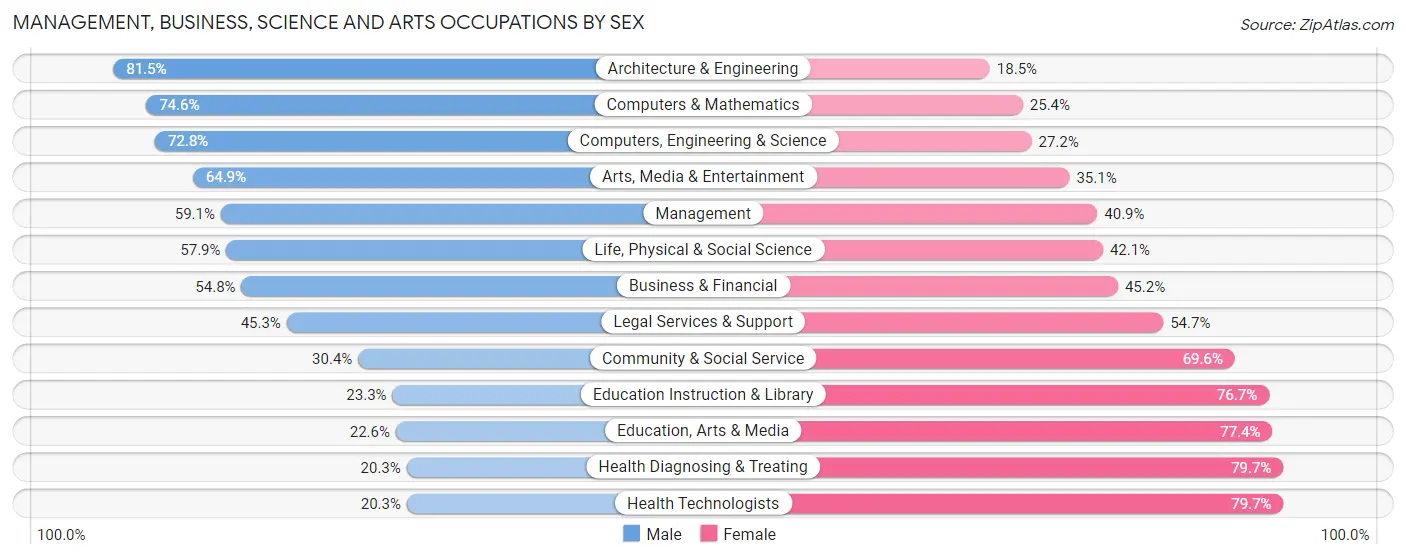
Management, Business, Science and Arts Occupations by Sex
Within the Management, Business, Science and Arts occupations in Warren County, the most male-oriented occupations are Architecture & Engineering (81.5%), Computers & Mathematics (74.6%), and Computers, Engineering & Science (72.8%), while the most female-oriented occupations are Health Technologists (79.7%), Health Diagnosing & Treating (79.7%), and Education, Arts & Media (77.4%).
| Occupation | Male | Female |
| Management | 3,680 (59.1%) | 2,550 (40.9%) |
| Business & Financial | 1,745 (54.8%) | 1,441 (45.2%) |
| Computers, Engineering & Science | 2,789 (72.8%) | 1,042 (27.2%) |
| Computers & Mathematics | 1,461 (74.6%) | 497 (25.4%) |
| Architecture & Engineering | 841 (81.5%) | 191 (18.5%) |
| Life, Physical & Social Science | 487 (57.9%) | 354 (42.1%) |
| Community & Social Service | 1,997 (30.4%) | 4,568 (69.6%) |
| Education, Arts & Media | 209 (22.6%) | 717 (77.4%) |
| Legal Services & Support | 257 (45.3%) | 310 (54.7%) |
| Education Instruction & Library | 984 (23.3%) | 3,245 (76.7%) |
| Arts, Media & Entertainment | 547 (64.9%) | 296 (35.1%) |
| Health Diagnosing & Treating | 672 (20.3%) | 2,636 (79.7%) |
| Health Technologists | 458 (20.3%) | 1,801 (79.7%) |
| Total (Category) | 10,883 (47.1%) | 12,237 (52.9%) |
| Total (Overall) | 30,578 (53.9%) | 26,163 (46.1%) |
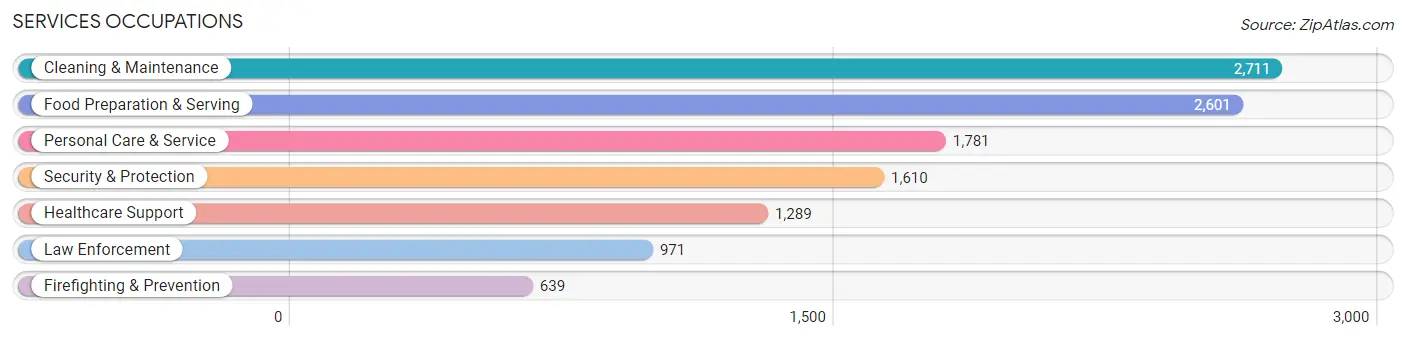
Services Occupations
The most common Services occupations in Warren County are Cleaning & Maintenance (2,711 | 4.8%), Food Preparation & Serving (2,601 | 4.6%), Personal Care & Service (1,781 | 3.1%), Security & Protection (1,610 | 2.8%), and Healthcare Support (1,289 | 2.3%).
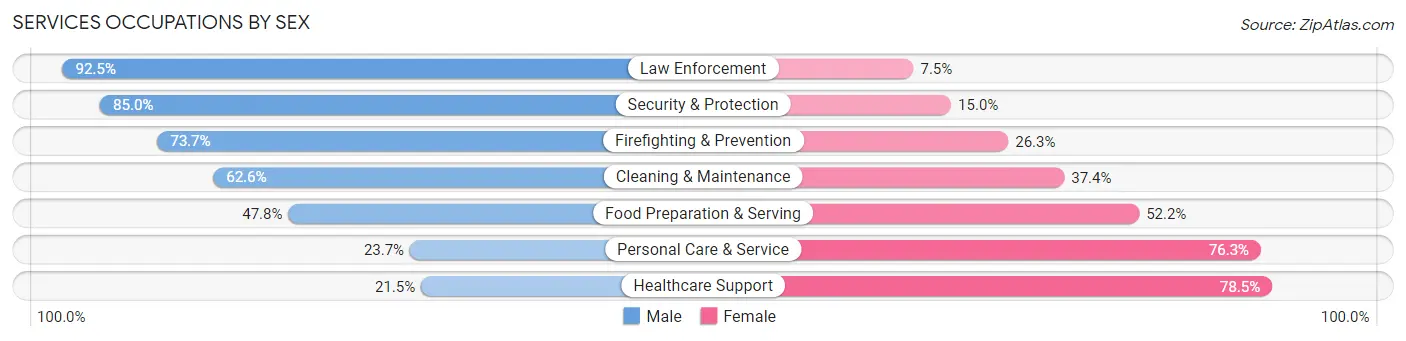
Services Occupations by Sex
Within the Services occupations in Warren County, the most male-oriented occupations are Law Enforcement (92.5%), Security & Protection (85.0%), and Firefighting & Prevention (73.7%), while the most female-oriented occupations are Healthcare Support (78.5%), Personal Care & Service (76.3%), and Food Preparation & Serving (52.2%).
| Occupation | Male | Female |
| Healthcare Support | 277 (21.5%) | 1,012 (78.5%) |
| Security & Protection | 1,369 (85.0%) | 241 (15.0%) |
| Firefighting & Prevention | 471 (73.7%) | 168 (26.3%) |
| Law Enforcement | 898 (92.5%) | 73 (7.5%) |
| Food Preparation & Serving | 1,243 (47.8%) | 1,358 (52.2%) |
| Cleaning & Maintenance | 1,698 (62.6%) | 1,013 (37.4%) |
| Personal Care & Service | 422 (23.7%) | 1,359 (76.3%) |
| Total (Category) | 5,009 (50.1%) | 4,983 (49.9%) |
| Total (Overall) | 30,578 (53.9%) | 26,163 (46.1%) |
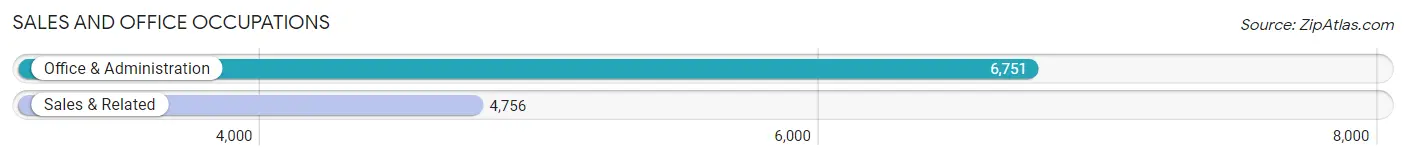
Sales and Office Occupations
The most common Sales and Office occupations in Warren County are Office & Administration (6,751 | 11.9%), and Sales & Related (4,756 | 8.4%).
Sales and Office Occupations by Sex
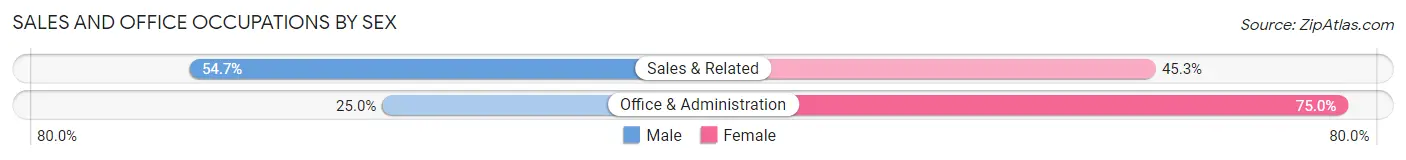
| Occupation | Male | Female |
| Sales & Related | 2,602 (54.7%) | 2,154 (45.3%) |
| Office & Administration | 1,687 (25.0%) | 5,064 (75.0%) |
| Total (Category) | 4,289 (37.3%) | 7,218 (62.7%) |
| Total (Overall) | 30,578 (53.9%) | 26,163 (46.1%) |
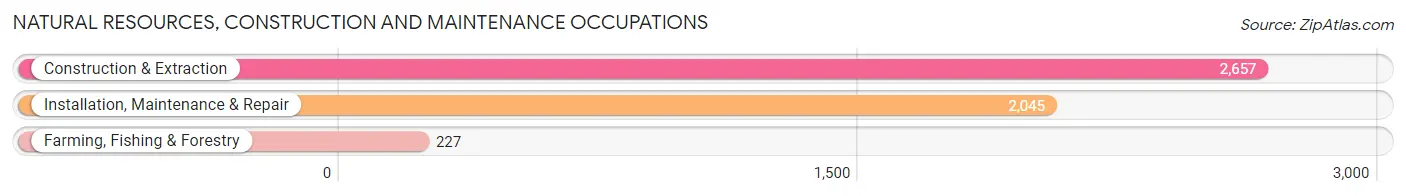
Natural Resources, Construction and Maintenance Occupations
The most common Natural Resources, Construction and Maintenance occupations in Warren County are Construction & Extraction (2,657 | 4.7%), Installation, Maintenance & Repair (2,045 | 3.6%), and Farming, Fishing & Forestry (227 | 0.4%).
Natural Resources, Construction and Maintenance Occupations by Sex
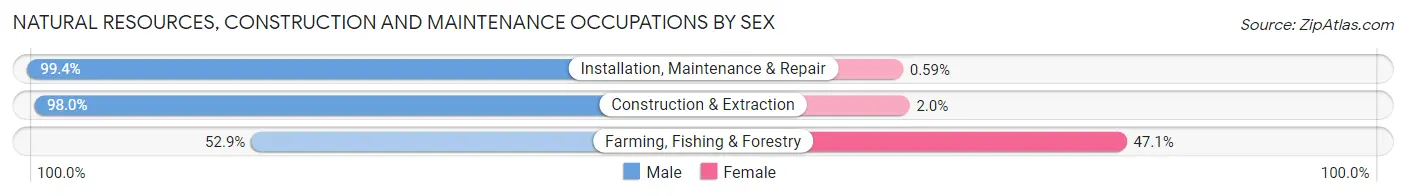
| Occupation | Male | Female |
| Farming, Fishing & Forestry | 120 (52.9%) | 107 (47.1%) |
| Construction & Extraction | 2,604 (98.0%) | 53 (2.0%) |
| Installation, Maintenance & Repair | 2,033 (99.4%) | 12 (0.6%) |
| Total (Category) | 4,757 (96.5%) | 172 (3.5%) |
| Total (Overall) | 30,578 (53.9%) | 26,163 (46.1%) |
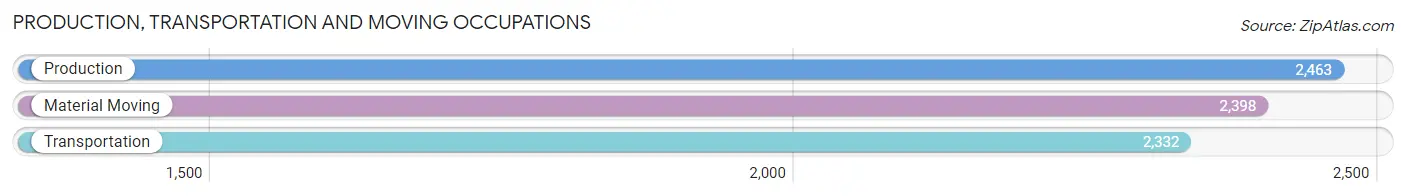
Production, Transportation and Moving Occupations
The most common Production, Transportation and Moving occupations in Warren County are Production (2,463 | 4.3%), Material Moving (2,398 | 4.2%), and Transportation (2,332 | 4.1%).
Production, Transportation and Moving Occupations by Sex
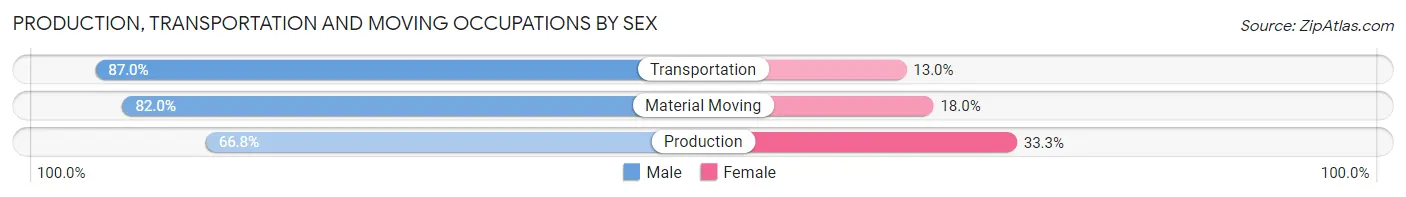
| Occupation | Male | Female |
| Production | 1,644 (66.7%) | 819 (33.3%) |
| Transportation | 2,029 (87.0%) | 303 (13.0%) |
| Material Moving | 1,967 (82.0%) | 431 (18.0%) |
| Total (Category) | 5,640 (78.4%) | 1,553 (21.6%) |
| Total (Overall) | 30,578 (53.9%) | 26,163 (46.1%) |
Employment Industries by Sex in Warren County
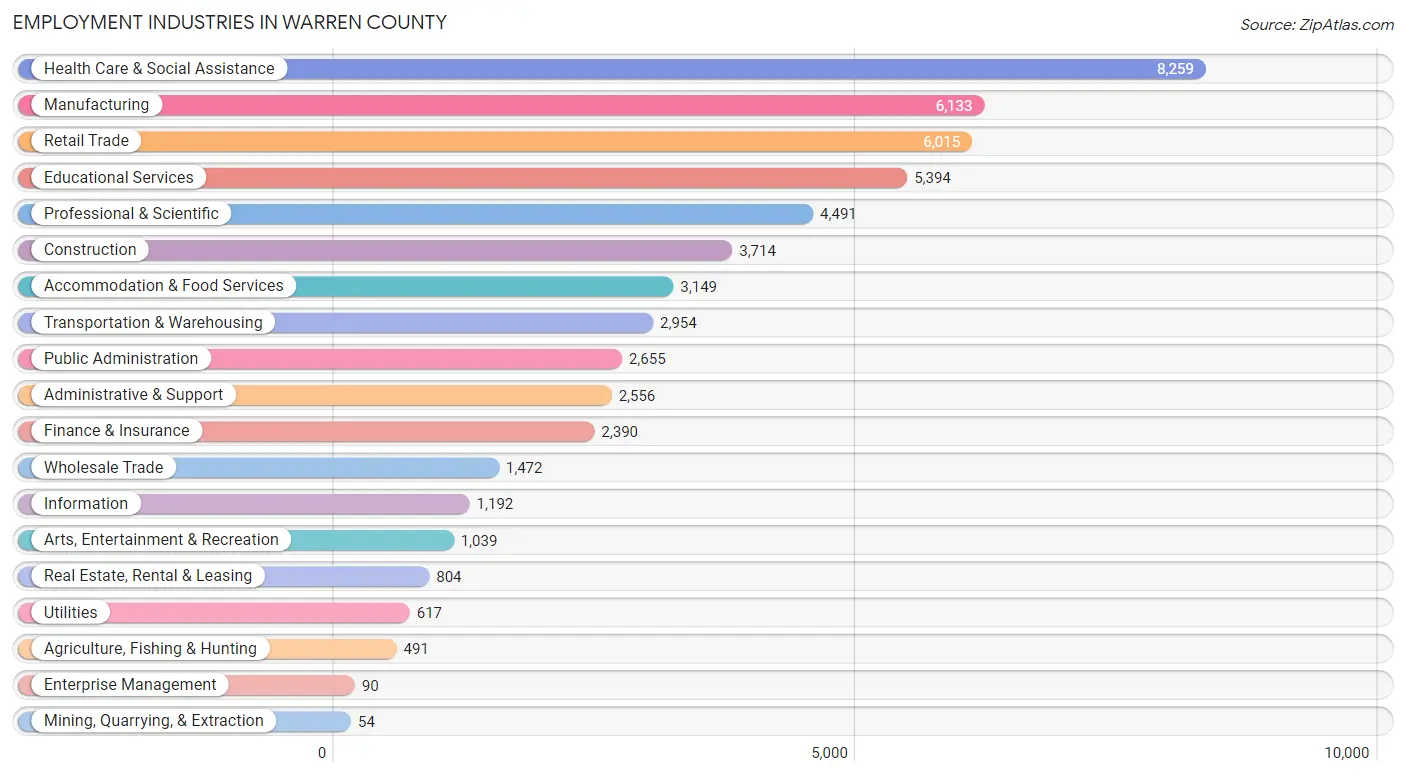
Employment Industries in Warren County
The major employment industries in Warren County include Health Care & Social Assistance (8,259 | 14.6%), Manufacturing (6,133 | 10.8%), Retail Trade (6,015 | 10.6%), Educational Services (5,394 | 9.5%), and Professional & Scientific (4,491 | 7.9%).
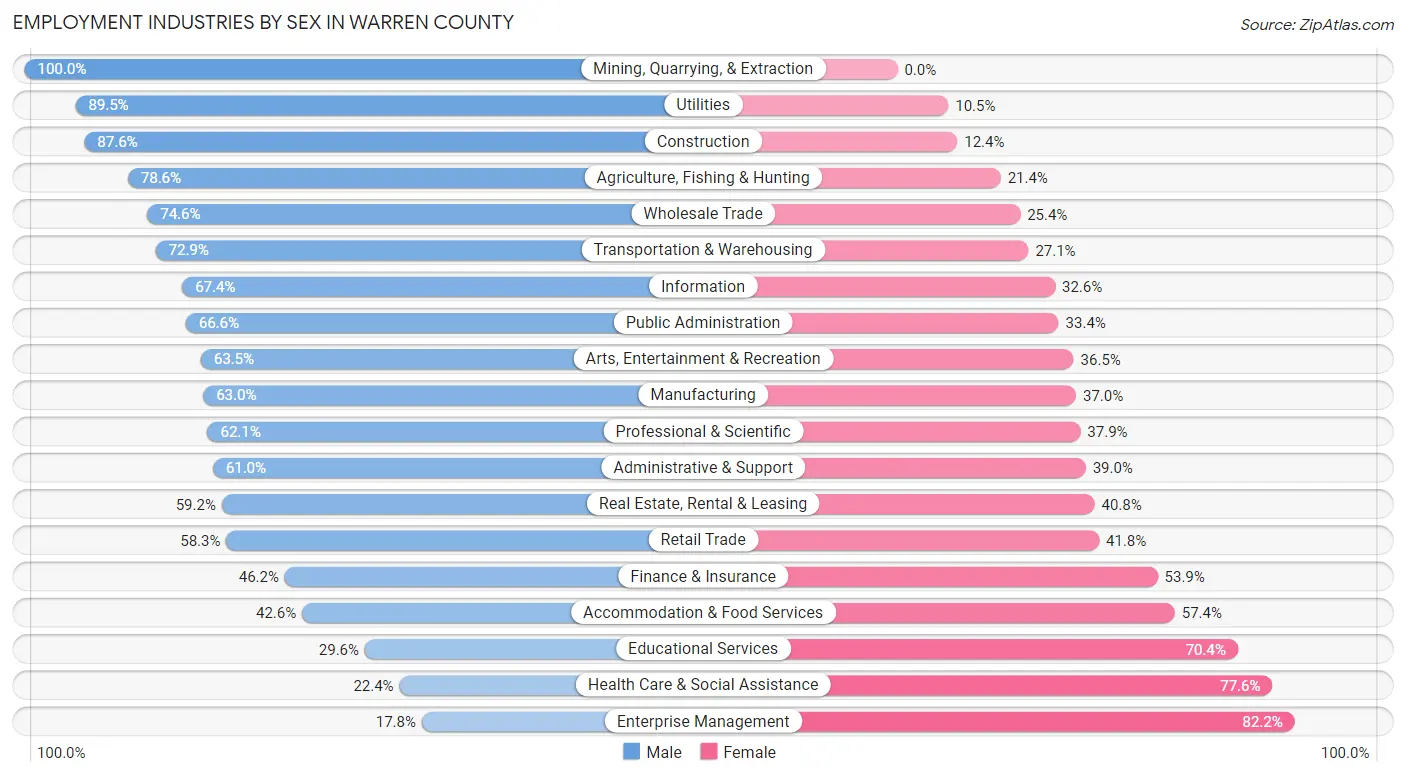
Employment Industries by Sex in Warren County
The Warren County industries that see more men than women are Mining, Quarrying, & Extraction (100.0%), Utilities (89.5%), and Construction (87.6%), whereas the industries that tend to have a higher number of women are Enterprise Management (82.2%), Health Care & Social Assistance (77.6%), and Educational Services (70.4%).
| Industry | Male | Female |
| Agriculture, Fishing & Hunting | 386 (78.6%) | 105 (21.4%) |
| Mining, Quarrying, & Extraction | 54 (100.0%) | 0 (0.0%) |
| Construction | 3,254 (87.6%) | 460 (12.4%) |
| Manufacturing | 3,865 (63.0%) | 2,268 (37.0%) |
| Wholesale Trade | 1,098 (74.6%) | 374 (25.4%) |
| Retail Trade | 3,504 (58.3%) | 2,511 (41.7%) |
| Transportation & Warehousing | 2,153 (72.9%) | 801 (27.1%) |
| Utilities | 552 (89.5%) | 65 (10.5%) |
| Information | 803 (67.4%) | 389 (32.6%) |
| Finance & Insurance | 1,103 (46.2%) | 1,287 (53.8%) |
| Real Estate, Rental & Leasing | 476 (59.2%) | 328 (40.8%) |
| Professional & Scientific | 2,790 (62.1%) | 1,701 (37.9%) |
| Enterprise Management | 16 (17.8%) | 74 (82.2%) |
| Administrative & Support | 1,560 (61.0%) | 996 (39.0%) |
| Educational Services | 1,595 (29.6%) | 3,799 (70.4%) |
| Health Care & Social Assistance | 1,851 (22.4%) | 6,408 (77.6%) |
| Arts, Entertainment & Recreation | 660 (63.5%) | 379 (36.5%) |
| Accommodation & Food Services | 1,341 (42.6%) | 1,808 (57.4%) |
| Public Administration | 1,769 (66.6%) | 886 (33.4%) |
| Total | 30,578 (53.9%) | 26,163 (46.1%) |
Education in Warren County
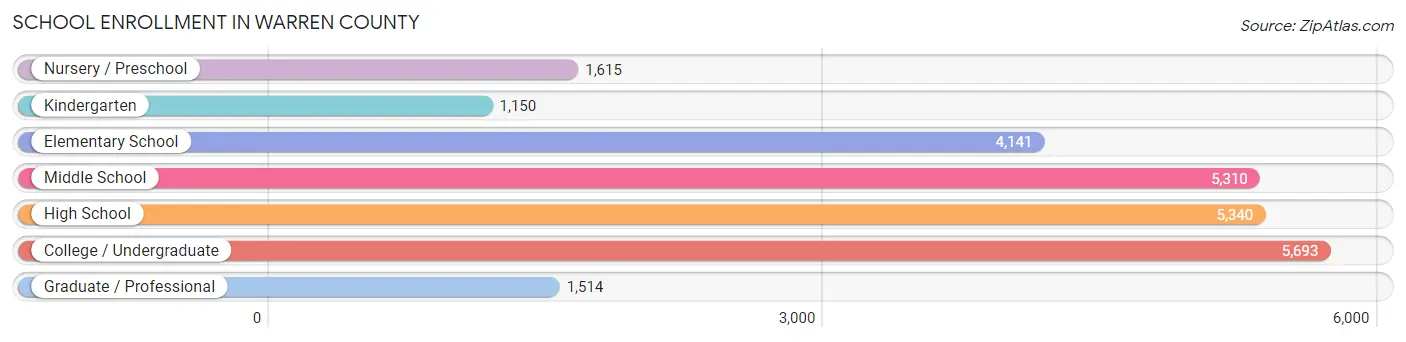
School Enrollment in Warren County
The most common levels of schooling among the 24,763 students in Warren County are college / undergraduate (5,693 | 23.0%), high school (5,340 | 21.6%), and middle school (5,310 | 21.4%).
| School Level | # Students | % Students |
| Nursery / Preschool | 1,615 | 6.5% |
| Kindergarten | 1,150 | 4.6% |
| Elementary School | 4,141 | 16.7% |
| Middle School | 5,310 | 21.4% |
| High School | 5,340 | 21.6% |
| College / Undergraduate | 5,693 | 23.0% |
| Graduate / Professional | 1,514 | 6.1% |
| Total | 24,763 | 100.0% |
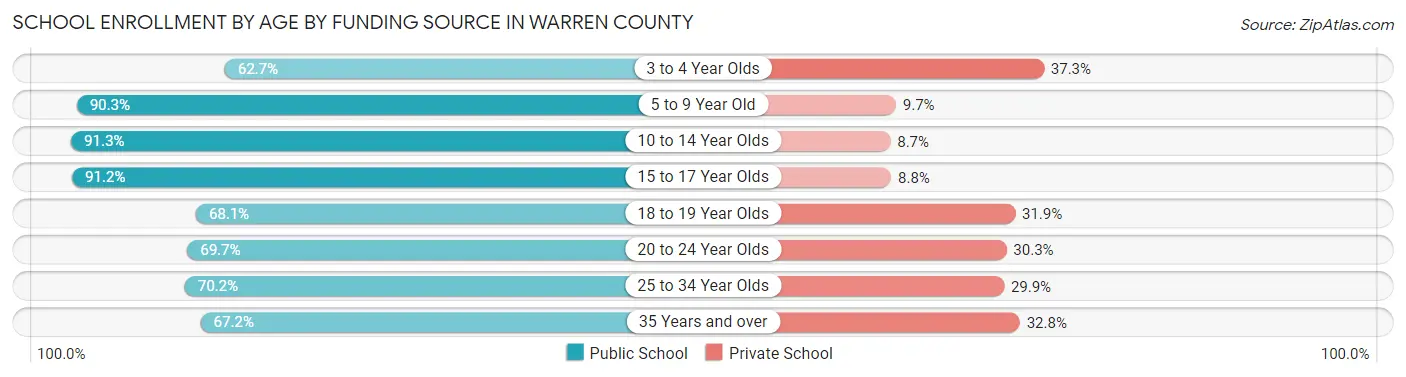
School Enrollment by Age by Funding Source in Warren County
Out of a total of 24,763 students who are enrolled in schools in Warren County, 4,383 (17.7%) attend a private institution, while the remaining 20,380 (82.3%) are enrolled in public schools. The age group of 3 to 4 year olds has the highest likelihood of being enrolled in private schools, with 550 (37.3% in the age bracket) enrolled. Conversely, the age group of 10 to 14 year olds has the lowest likelihood of being enrolled in a private school, with 5,796 (91.3% in the age bracket) attending a public institution.
| Age Bracket | Public School | Private School |
| 3 to 4 Year Olds | 925 (62.7%) | 550 (37.3%) |
| 5 to 9 Year Old | 4,670 (90.3%) | 503 (9.7%) |
| 10 to 14 Year Olds | 5,796 (91.3%) | 551 (8.7%) |
| 15 to 17 Year Olds | 3,660 (91.2%) | 355 (8.8%) |
| 18 to 19 Year Olds | 1,442 (68.1%) | 676 (31.9%) |
| 20 to 24 Year Olds | 1,980 (69.7%) | 861 (30.3%) |
| 25 to 34 Year Olds | 886 (70.2%) | 377 (29.8%) |
| 35 Years and over | 1,029 (67.2%) | 502 (32.8%) |
| Total | 20,380 (82.3%) | 4,383 (17.7%) |
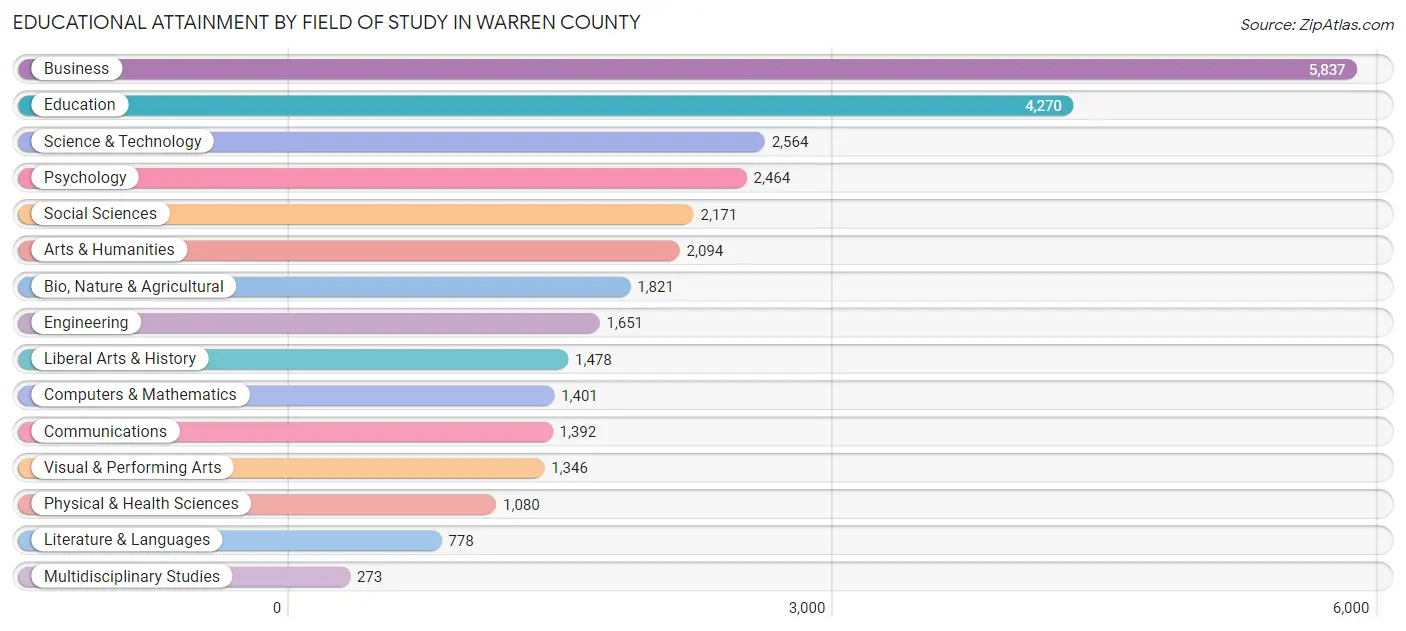
Educational Attainment by Field of Study in Warren County
Business (5,837 | 19.1%), education (4,270 | 14.0%), science & technology (2,564 | 8.4%), psychology (2,464 | 8.1%), and social sciences (2,171 | 7.1%) are the most common fields of study among 30,620 individuals in Warren County who have obtained a bachelor's degree or higher.
| Field of Study | # Graduates | % Graduates |
| Computers & Mathematics | 1,401 | 4.6% |
| Bio, Nature & Agricultural | 1,821 | 5.9% |
| Physical & Health Sciences | 1,080 | 3.5% |
| Psychology | 2,464 | 8.1% |
| Social Sciences | 2,171 | 7.1% |
| Engineering | 1,651 | 5.4% |
| Multidisciplinary Studies | 273 | 0.9% |
| Science & Technology | 2,564 | 8.4% |
| Business | 5,837 | 19.1% |
| Education | 4,270 | 14.0% |
| Literature & Languages | 778 | 2.5% |
| Liberal Arts & History | 1,478 | 4.8% |
| Visual & Performing Arts | 1,346 | 4.4% |
| Communications | 1,392 | 4.5% |
| Arts & Humanities | 2,094 | 6.8% |
| Total | 30,620 | 100.0% |
Transportation & Commute in Warren County
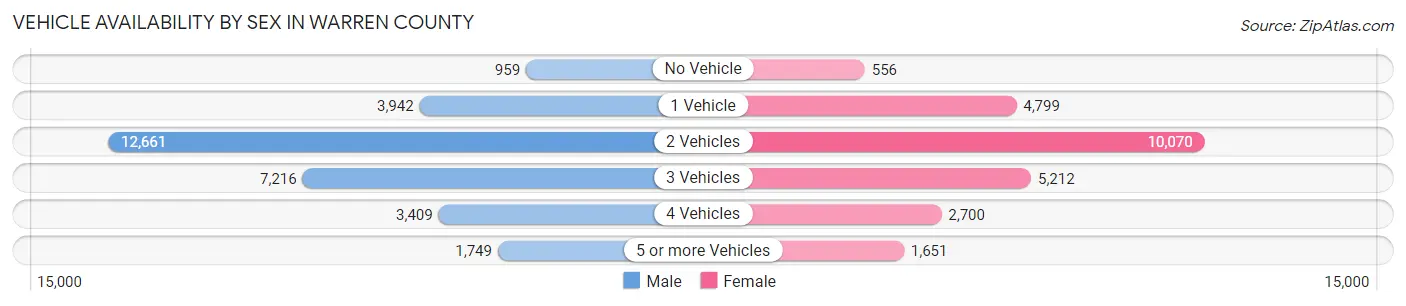
Vehicle Availability by Sex in Warren County
The most prevalent vehicle ownership categories in Warren County are males with 2 vehicles (12,661, accounting for 42.3%) and females with 2 vehicles (10,070, making up 50.7%).
| Vehicles Available | Male | Female |
| No Vehicle | 959 (3.2%) | 556 (2.2%) |
| 1 Vehicle | 3,942 (13.2%) | 4,799 (19.2%) |
| 2 Vehicles | 12,661 (42.3%) | 10,070 (40.3%) |
| 3 Vehicles | 7,216 (24.1%) | 5,212 (20.9%) |
| 4 Vehicles | 3,409 (11.4%) | 2,700 (10.8%) |
| 5 or more Vehicles | 1,749 (5.8%) | 1,651 (6.6%) |
| Total | 29,936 (100.0%) | 24,988 (100.0%) |
Commute Time in Warren County
The most frequently occuring commute durations in Warren County are 30 to 34 minutes (6,478 commuters, 13.0%), 60 to 89 minutes (6,394 commuters, 12.8%), and 45 to 59 minutes (5,659 commuters, 11.3%).
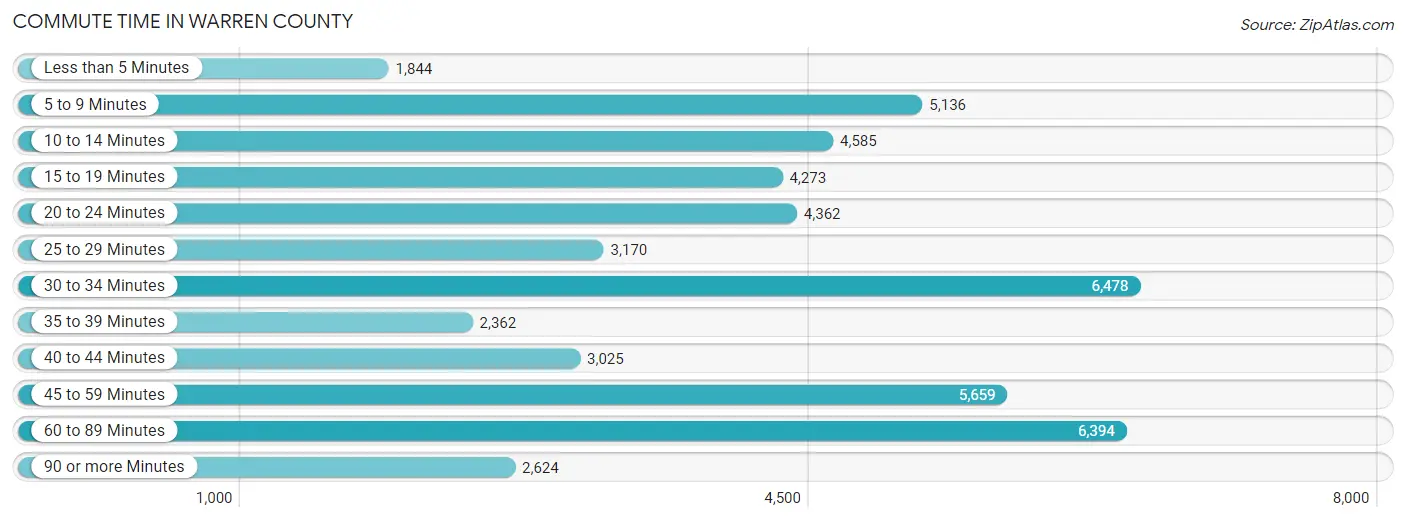
| Commute Time | # Commuters | % Commuters |
| Less than 5 Minutes | 1,844 | 3.7% |
| 5 to 9 Minutes | 5,136 | 10.3% |
| 10 to 14 Minutes | 4,585 | 9.2% |
| 15 to 19 Minutes | 4,273 | 8.6% |
| 20 to 24 Minutes | 4,362 | 8.7% |
| 25 to 29 Minutes | 3,170 | 6.4% |
| 30 to 34 Minutes | 6,478 | 13.0% |
| 35 to 39 Minutes | 2,362 | 4.7% |
| 40 to 44 Minutes | 3,025 | 6.1% |
| 45 to 59 Minutes | 5,659 | 11.3% |
| 60 to 89 Minutes | 6,394 | 12.8% |
| 90 or more Minutes | 2,624 | 5.3% |
Commute Time by Sex in Warren County
The most common commute times in Warren County are 60 to 89 minutes (4,640 commuters, 17.1%) for males and 30 to 34 minutes (3,097 commuters, 13.6%) for females.
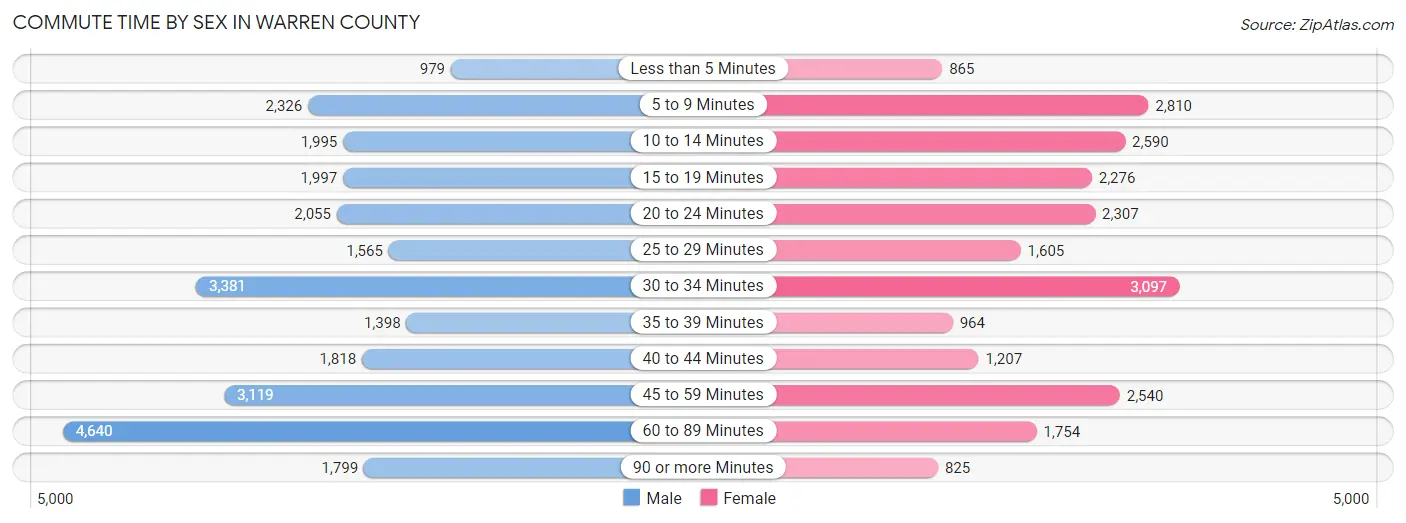
| Commute Time | Male | Female |
| Less than 5 Minutes | 979 (3.6%) | 865 (3.8%) |
| 5 to 9 Minutes | 2,326 (8.6%) | 2,810 (12.3%) |
| 10 to 14 Minutes | 1,995 (7.4%) | 2,590 (11.3%) |
| 15 to 19 Minutes | 1,997 (7.4%) | 2,276 (10.0%) |
| 20 to 24 Minutes | 2,055 (7.6%) | 2,307 (10.1%) |
| 25 to 29 Minutes | 1,565 (5.8%) | 1,605 (7.0%) |
| 30 to 34 Minutes | 3,381 (12.5%) | 3,097 (13.6%) |
| 35 to 39 Minutes | 1,398 (5.2%) | 964 (4.2%) |
| 40 to 44 Minutes | 1,818 (6.7%) | 1,207 (5.3%) |
| 45 to 59 Minutes | 3,119 (11.5%) | 2,540 (11.1%) |
| 60 to 89 Minutes | 4,640 (17.1%) | 1,754 (7.7%) |
| 90 or more Minutes | 1,799 (6.7%) | 825 (3.6%) |
Time of Departure to Work by Sex in Warren County
The most frequent times of departure to work in Warren County are 6:00 AM to 6:29 AM (3,903, 14.4%) for males and 7:00 AM to 7:29 AM (3,273, 14.3%) for females.
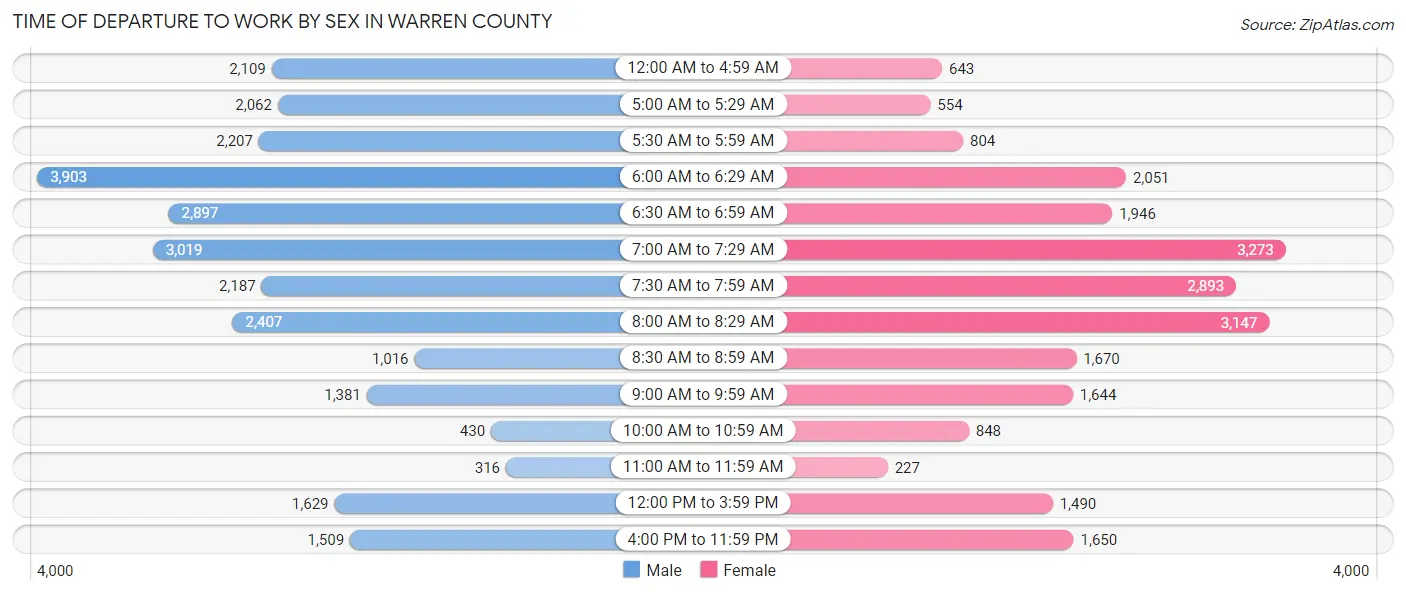
| Time of Departure | Male | Female |
| 12:00 AM to 4:59 AM | 2,109 (7.8%) | 643 (2.8%) |
| 5:00 AM to 5:29 AM | 2,062 (7.6%) | 554 (2.4%) |
| 5:30 AM to 5:59 AM | 2,207 (8.2%) | 804 (3.5%) |
| 6:00 AM to 6:29 AM | 3,903 (14.4%) | 2,051 (9.0%) |
| 6:30 AM to 6:59 AM | 2,897 (10.7%) | 1,946 (8.5%) |
| 7:00 AM to 7:29 AM | 3,019 (11.2%) | 3,273 (14.3%) |
| 7:30 AM to 7:59 AM | 2,187 (8.1%) | 2,893 (12.7%) |
| 8:00 AM to 8:29 AM | 2,407 (8.9%) | 3,147 (13.8%) |
| 8:30 AM to 8:59 AM | 1,016 (3.7%) | 1,670 (7.3%) |
| 9:00 AM to 9:59 AM | 1,381 (5.1%) | 1,644 (7.2%) |
| 10:00 AM to 10:59 AM | 430 (1.6%) | 848 (3.7%) |
| 11:00 AM to 11:59 AM | 316 (1.2%) | 227 (1.0%) |
| 12:00 PM to 3:59 PM | 1,629 (6.0%) | 1,490 (6.5%) |
| 4:00 PM to 11:59 PM | 1,509 (5.6%) | 1,650 (7.2%) |
| Total | 27,072 (100.0%) | 22,840 (100.0%) |
Housing Occupancy in Warren County
Occupancy by Ownership in Warren County
Of the total 44,370 dwellings in Warren County, owner-occupied units account for 32,287 (72.8%), while renter-occupied units make up 12,083 (27.2%).
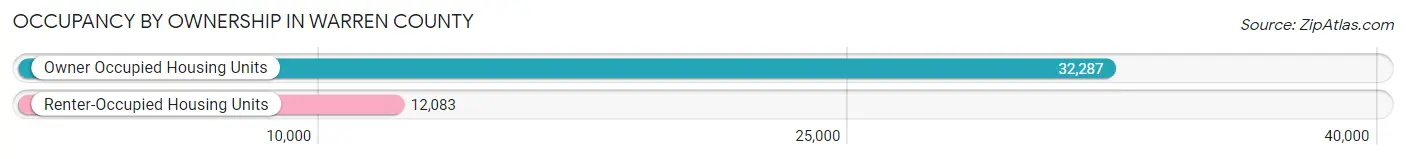
| Occupancy | # Housing Units | % Housing Units |
| Owner Occupied Housing Units | 32,287 | 72.8% |
| Renter-Occupied Housing Units | 12,083 | 27.2% |
| Total Occupied Housing Units | 44,370 | 100.0% |
Occupancy by Household Size in Warren County
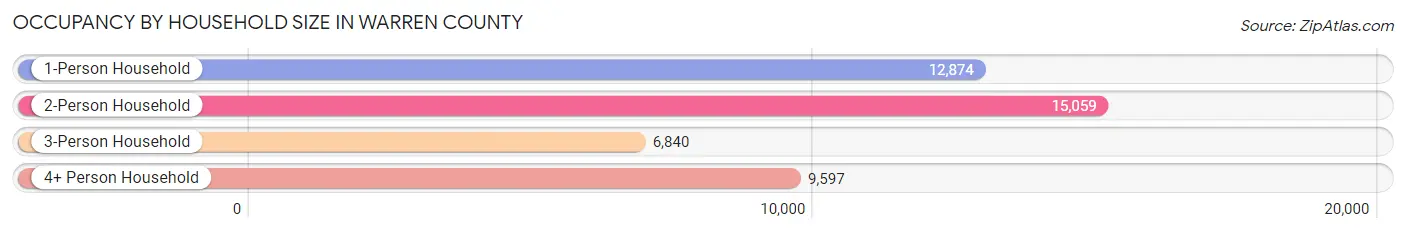
| Household Size | # Housing Units | % Housing Units |
| 1-Person Household | 12,874 | 29.0% |
| 2-Person Household | 15,059 | 33.9% |
| 3-Person Household | 6,840 | 15.4% |
| 4+ Person Household | 9,597 | 21.6% |
| Total Housing Units | 44,370 | 100.0% |
Occupancy by Ownership by Household Size in Warren County

| Household Size | Owner-occupied | Renter-occupied |
| 1-Person Household | 7,190 (55.8%) | 5,684 (44.2%) |
| 2-Person Household | 11,826 (78.5%) | 3,233 (21.5%) |
| 3-Person Household | 5,561 (81.3%) | 1,279 (18.7%) |
| 4+ Person Household | 7,710 (80.3%) | 1,887 (19.7%) |
| Total Housing Units | 32,287 (72.8%) | 12,083 (27.2%) |
Occupancy by Educational Attainment in Warren County
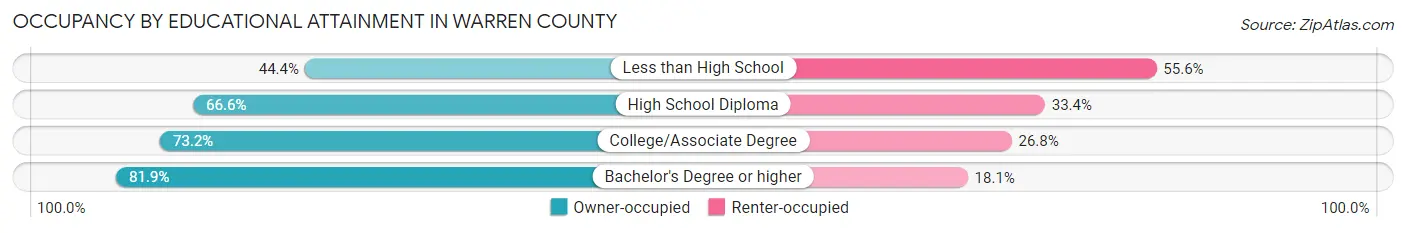
| Household Size | Owner-occupied | Renter-occupied |
| Less than High School | 1,138 (44.4%) | 1,423 (55.6%) |
| High School Diploma | 8,905 (66.6%) | 4,472 (33.4%) |
| College/Associate Degree | 8,664 (73.2%) | 3,178 (26.8%) |
| Bachelor's Degree or higher | 13,580 (81.9%) | 3,010 (18.1%) |
Occupancy by Age of Householder in Warren County
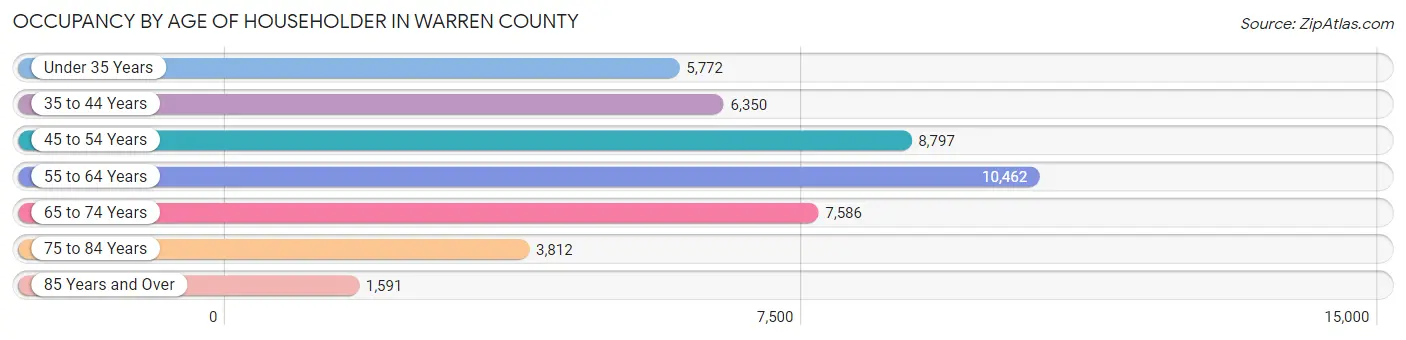
| Age Bracket | # Households | % Households |
| Under 35 Years | 5,772 | 13.0% |
| 35 to 44 Years | 6,350 | 14.3% |
| 45 to 54 Years | 8,797 | 19.8% |
| 55 to 64 Years | 10,462 | 23.6% |
| 65 to 74 Years | 7,586 | 17.1% |
| 75 to 84 Years | 3,812 | 8.6% |
| 85 Years and Over | 1,591 | 3.6% |
| Total | 44,370 | 100.0% |
Housing Finances in Warren County
Median Income by Occupancy in Warren County
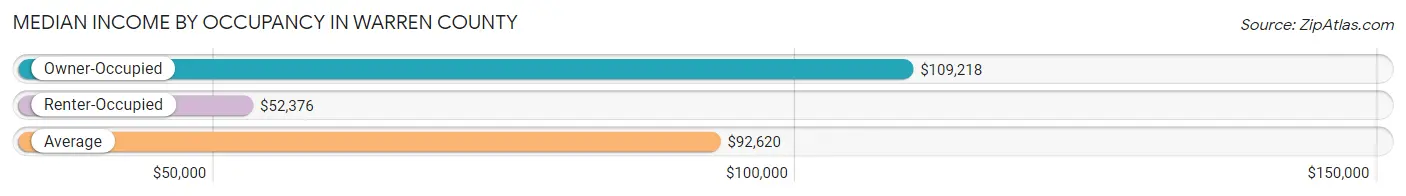
| Occupancy Type | # Households | Median Income |
| Owner-Occupied | 32,287 (72.8%) | $109,218 |
| Renter-Occupied | 12,083 (27.2%) | $52,376 |
| Average | 44,370 (100.0%) | $92,620 |
Occupancy by Householder Income Bracket in Warren County
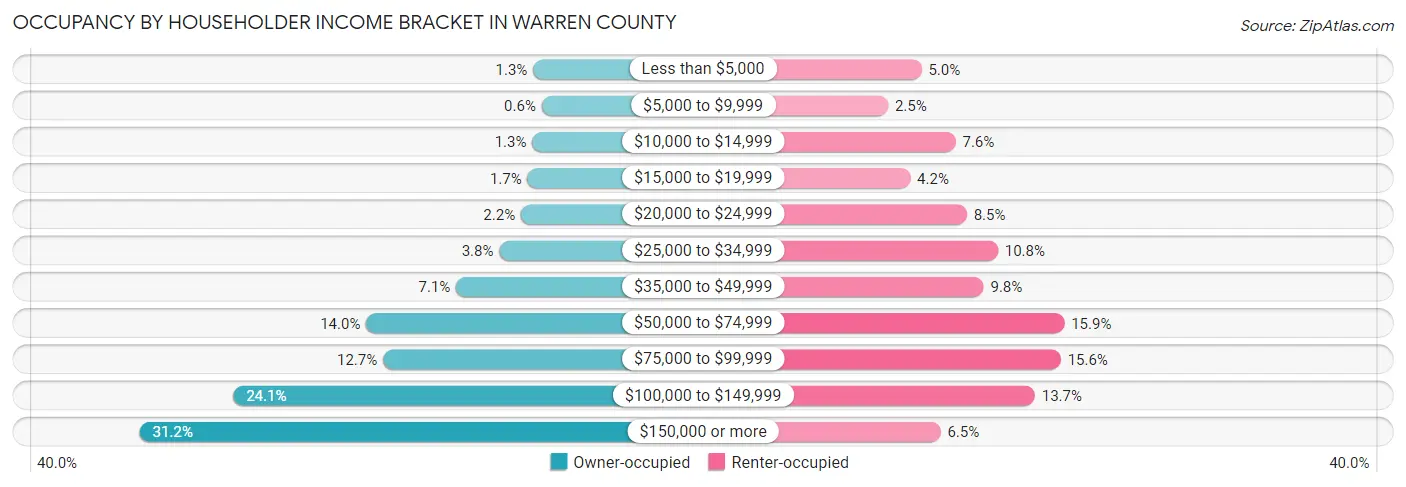
| Income Bracket | Owner-occupied | Renter-occupied |
| Less than $5,000 | 405 (1.3%) | 607 (5.0%) |
| $5,000 to $9,999 | 195 (0.6%) | 299 (2.5%) |
| $10,000 to $14,999 | 427 (1.3%) | 921 (7.6%) |
| $15,000 to $19,999 | 543 (1.7%) | 503 (4.2%) |
| $20,000 to $24,999 | 705 (2.2%) | 1,023 (8.5%) |
| $25,000 to $34,999 | 1,235 (3.8%) | 1,310 (10.8%) |
| $35,000 to $49,999 | 2,300 (7.1%) | 1,178 (9.8%) |
| $50,000 to $74,999 | 4,511 (14.0%) | 1,921 (15.9%) |
| $75,000 to $99,999 | 4,098 (12.7%) | 1,889 (15.6%) |
| $100,000 to $149,999 | 7,781 (24.1%) | 1,650 (13.7%) |
| $150,000 or more | 10,087 (31.2%) | 782 (6.5%) |
| Total | 32,287 (100.0%) | 12,083 (100.0%) |
Monthly Housing Cost Tiers in Warren County
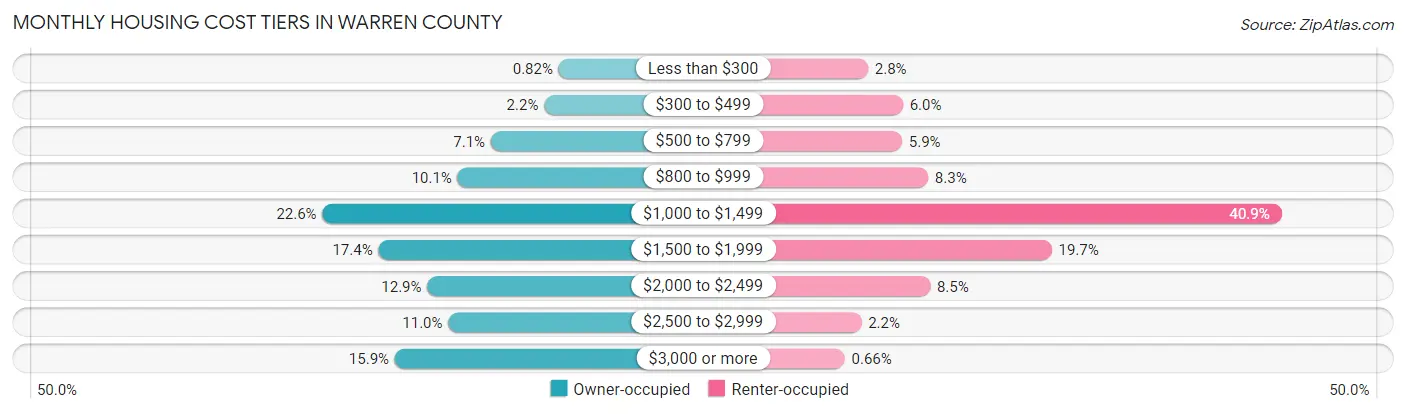
| Monthly Cost | Owner-occupied | Renter-occupied |
| Less than $300 | 264 (0.8%) | 338 (2.8%) |
| $300 to $499 | 698 (2.2%) | 726 (6.0%) |
| $500 to $799 | 2,283 (7.1%) | 716 (5.9%) |
| $800 to $999 | 3,271 (10.1%) | 1,006 (8.3%) |
| $1,000 to $1,499 | 7,290 (22.6%) | 4,939 (40.9%) |
| $1,500 to $1,999 | 5,626 (17.4%) | 2,381 (19.7%) |
| $2,000 to $2,499 | 4,171 (12.9%) | 1,029 (8.5%) |
| $2,500 to $2,999 | 3,548 (11.0%) | 265 (2.2%) |
| $3,000 or more | 5,136 (15.9%) | 80 (0.7%) |
| Total | 32,287 (100.0%) | 12,083 (100.0%) |
Physical Housing Characteristics in Warren County
Housing Structures in Warren County
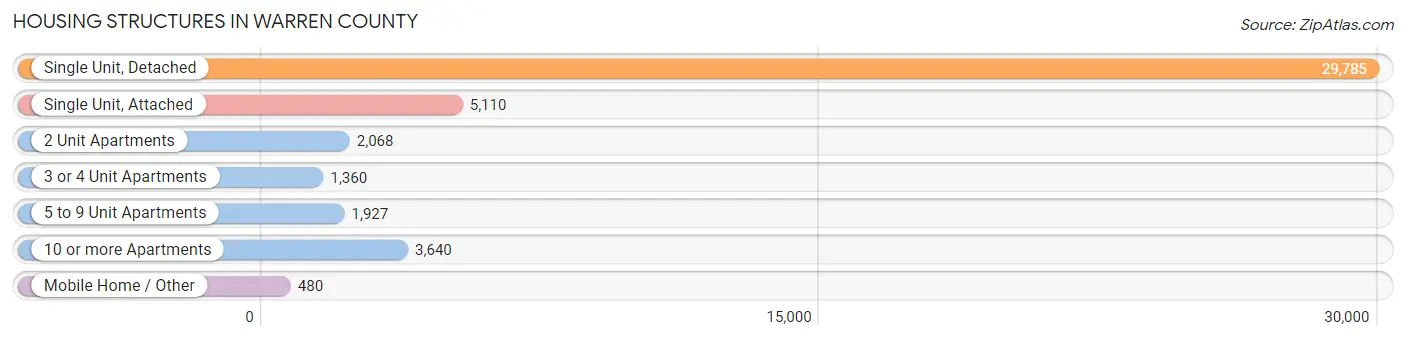
| Structure Type | # Housing Units | % Housing Units |
| Single Unit, Detached | 29,785 | 67.1% |
| Single Unit, Attached | 5,110 | 11.5% |
| 2 Unit Apartments | 2,068 | 4.7% |
| 3 or 4 Unit Apartments | 1,360 | 3.1% |
| 5 to 9 Unit Apartments | 1,927 | 4.3% |
| 10 or more Apartments | 3,640 | 8.2% |
| Mobile Home / Other | 480 | 1.1% |
| Total | 44,370 | 100.0% |
Housing Structures by Occupancy in Warren County
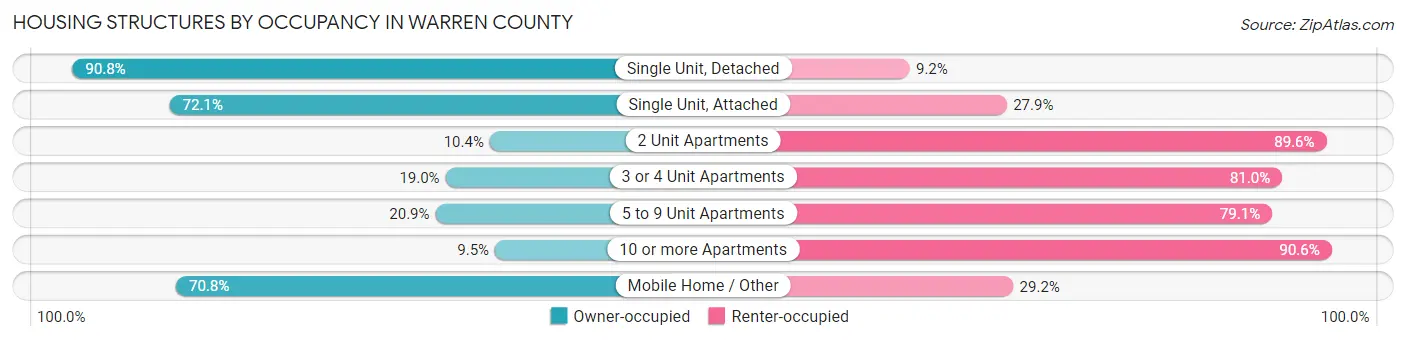
| Structure Type | Owner-occupied | Renter-occupied |
| Single Unit, Detached | 27,043 (90.8%) | 2,742 (9.2%) |
| Single Unit, Attached | 3,683 (72.1%) | 1,427 (27.9%) |
| 2 Unit Apartments | 216 (10.4%) | 1,852 (89.6%) |
| 3 or 4 Unit Apartments | 258 (19.0%) | 1,102 (81.0%) |
| 5 to 9 Unit Apartments | 403 (20.9%) | 1,524 (79.1%) |
| 10 or more Apartments | 344 (9.5%) | 3,296 (90.5%) |
| Mobile Home / Other | 340 (70.8%) | 140 (29.2%) |
| Total | 32,287 (72.8%) | 12,083 (27.2%) |
Housing Structures by Number of Rooms in Warren County
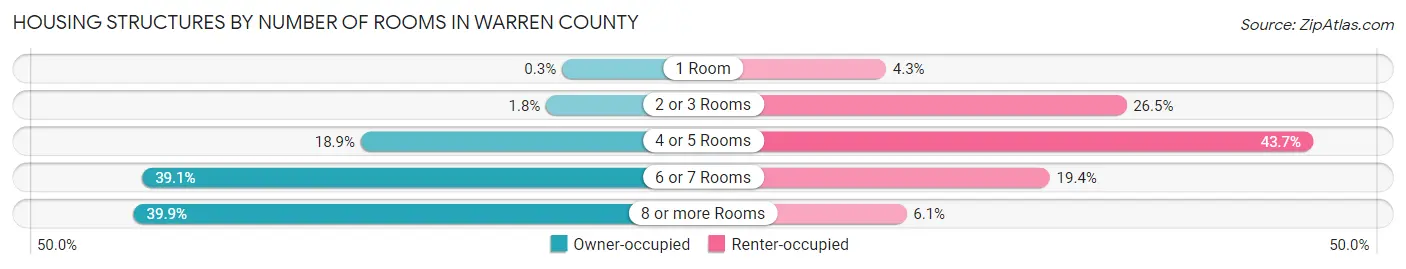
| Number of Rooms | Owner-occupied | Renter-occupied |
| 1 Room | 97 (0.3%) | 513 (4.3%) |
| 2 or 3 Rooms | 569 (1.8%) | 3,200 (26.5%) |
| 4 or 5 Rooms | 6,106 (18.9%) | 5,284 (43.7%) |
| 6 or 7 Rooms | 12,630 (39.1%) | 2,344 (19.4%) |
| 8 or more Rooms | 12,885 (39.9%) | 742 (6.1%) |
| Total | 32,287 (100.0%) | 12,083 (100.0%) |
Housing Structure by Heating Type in Warren County
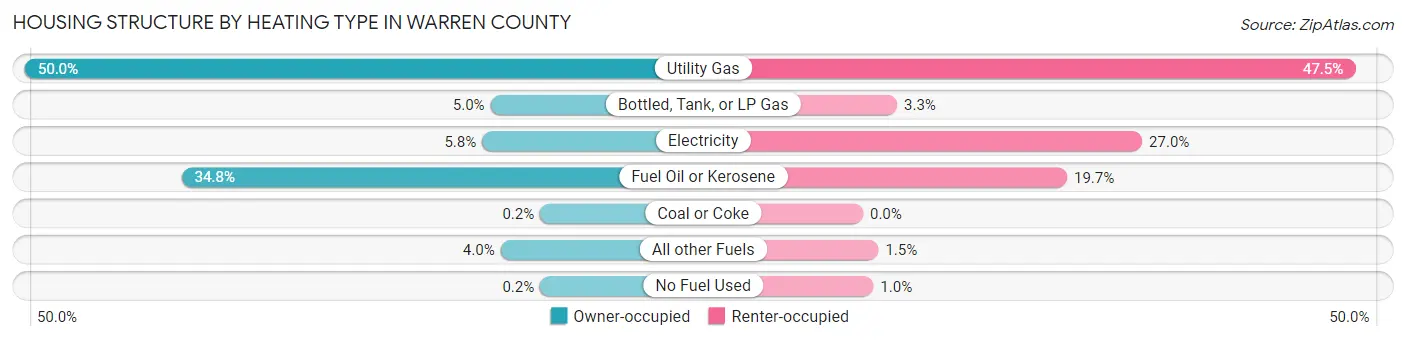
| Heating Type | Owner-occupied | Renter-occupied |
| Utility Gas | 16,134 (50.0%) | 5,743 (47.5%) |
| Bottled, Tank, or LP Gas | 1,610 (5.0%) | 398 (3.3%) |
| Electricity | 1,872 (5.8%) | 3,259 (27.0%) |
| Fuel Oil or Kerosene | 11,246 (34.8%) | 2,382 (19.7%) |
| Coal or Coke | 63 (0.2%) | 0 (0.0%) |
| All other Fuels | 1,297 (4.0%) | 180 (1.5%) |
| No Fuel Used | 65 (0.2%) | 121 (1.0%) |
| Total | 32,287 (100.0%) | 12,083 (100.0%) |
Household Vehicle Usage in Warren County
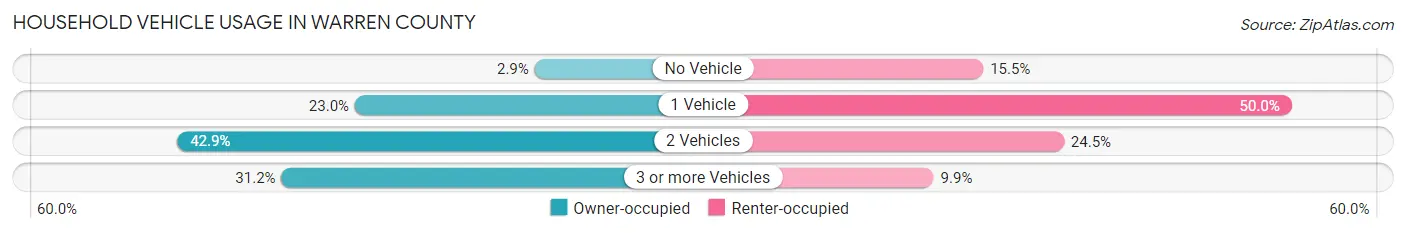
| Vehicles per Household | Owner-occupied | Renter-occupied |
| No Vehicle | 928 (2.9%) | 1,872 (15.5%) |
| 1 Vehicle | 7,426 (23.0%) | 6,046 (50.0%) |
| 2 Vehicles | 13,851 (42.9%) | 2,964 (24.5%) |
| 3 or more Vehicles | 10,082 (31.2%) | 1,201 (9.9%) |
| Total | 32,287 (100.0%) | 12,083 (100.0%) |
Real Estate & Mortgages in Warren County
Real Estate and Mortgage Overview in Warren County
| Characteristic | Without Mortgage | With Mortgage |
| Housing Units | 11,355 | 20,932 |
| Median Property Value | $279,900 | $315,100 |
| Median Household Income | $80,295 | $7,906 |
| Monthly Housing Costs | $1,003 | $5,111 |
| Real Estate Taxes | $7,632 | $294 |
Property Value by Mortgage Status in Warren County
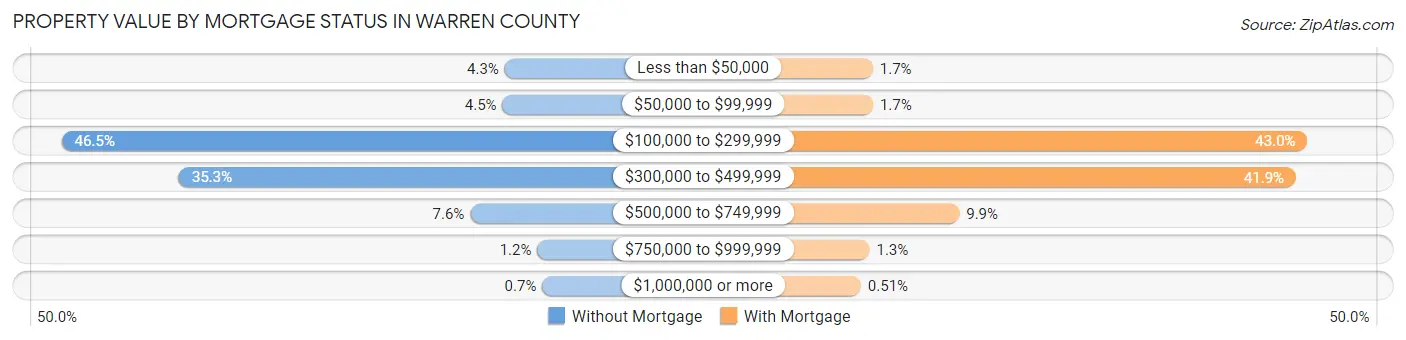
| Property Value | Without Mortgage | With Mortgage |
| Less than $50,000 | 486 (4.3%) | 345 (1.7%) |
| $50,000 to $99,999 | 510 (4.5%) | 348 (1.7%) |
| $100,000 to $299,999 | 5,278 (46.5%) | 9,006 (43.0%) |
| $300,000 to $499,999 | 4,010 (35.3%) | 8,778 (41.9%) |
| $500,000 to $749,999 | 859 (7.6%) | 2,069 (9.9%) |
| $750,000 to $999,999 | 133 (1.2%) | 279 (1.3%) |
| $1,000,000 or more | 79 (0.7%) | 107 (0.5%) |
| Total | 11,355 (100.0%) | 20,932 (100.0%) |
Household Income by Mortgage Status in Warren County
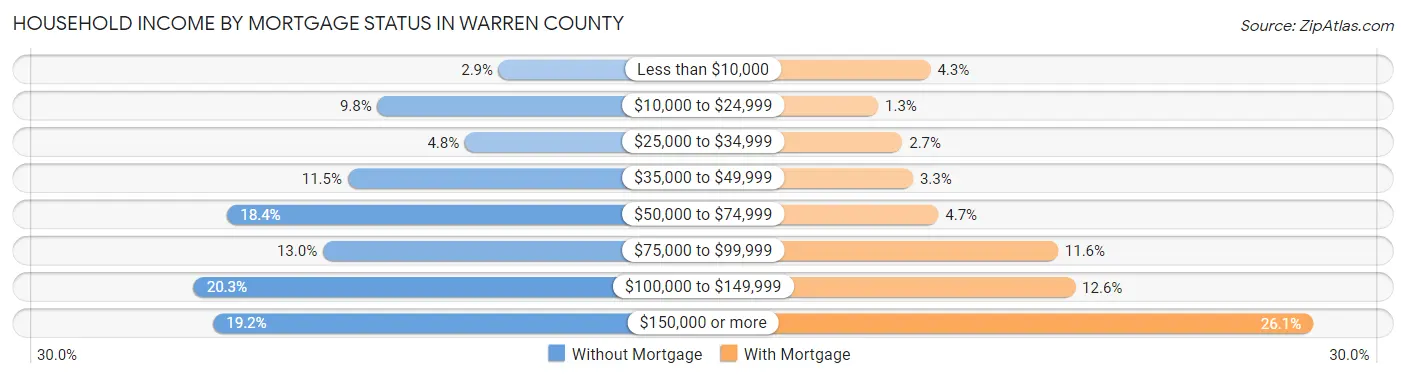
| Household Income | Without Mortgage | With Mortgage |
| Less than $10,000 | 329 (2.9%) | 896 (4.3%) |
| $10,000 to $24,999 | 1,116 (9.8%) | 271 (1.3%) |
| $25,000 to $34,999 | 549 (4.8%) | 559 (2.7%) |
| $35,000 to $49,999 | 1,309 (11.5%) | 686 (3.3%) |
| $50,000 to $74,999 | 2,091 (18.4%) | 991 (4.7%) |
| $75,000 to $99,999 | 1,471 (13.0%) | 2,420 (11.6%) |
| $100,000 to $149,999 | 2,309 (20.3%) | 2,627 (12.6%) |
| $150,000 or more | 2,181 (19.2%) | 5,472 (26.1%) |
| Total | 11,355 (100.0%) | 20,932 (100.0%) |
Property Value to Household Income Ratio in Warren County
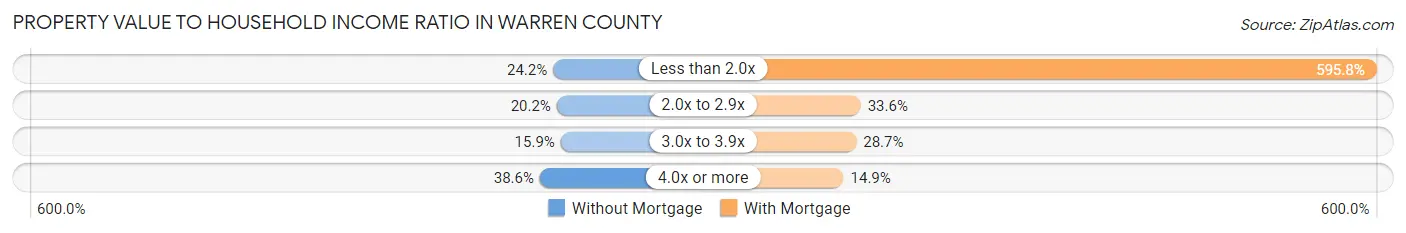
| Value-to-Income Ratio | Without Mortgage | With Mortgage |
| Less than 2.0x | 2,746 (24.2%) | 124,718 (595.8%) |
| 2.0x to 2.9x | 2,292 (20.2%) | 7,030 (33.6%) |
| 3.0x to 3.9x | 1,804 (15.9%) | 6,013 (28.7%) |
| 4.0x or more | 4,388 (38.6%) | 3,120 (14.9%) |
| Total | 11,355 (100.0%) | 20,932 (100.0%) |
Real Estate Taxes by Mortgage Status in Warren County
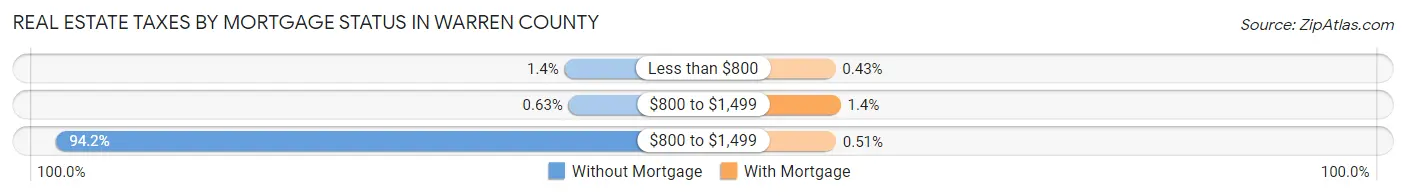
| Property Taxes | Without Mortgage | With Mortgage |
| Less than $800 | 156 (1.4%) | 91 (0.4%) |
| $800 to $1,499 | 72 (0.6%) | 287 (1.4%) |
| $800 to $1,499 | 10,695 (94.2%) | 107 (0.5%) |
| Total | 11,355 (100.0%) | 20,932 (100.0%) |
Health & Disability in Warren County
Health Insurance Coverage by Age in Warren County
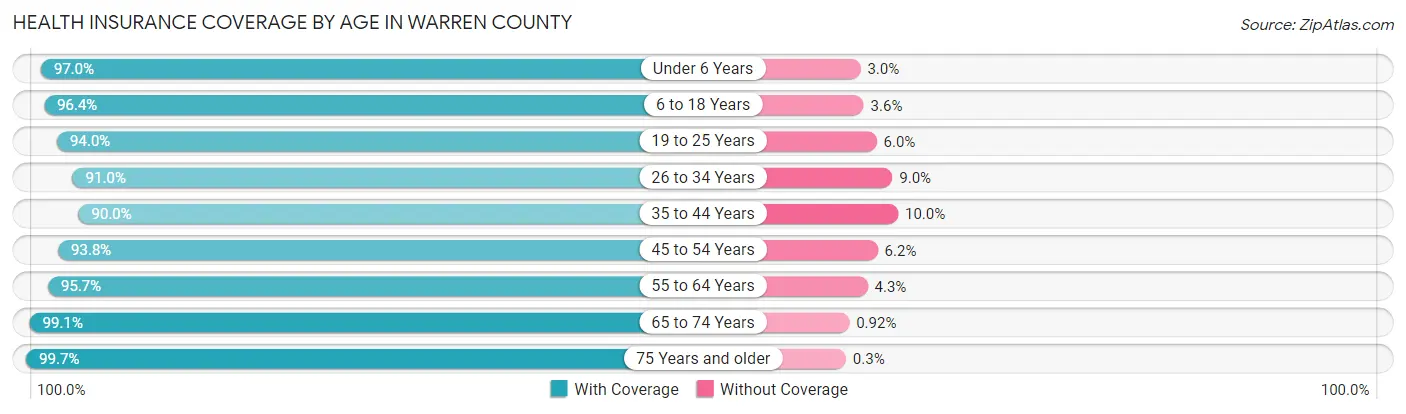
| Age Bracket | With Coverage | Without Coverage |
| Under 6 Years | 5,713 (97.0%) | 178 (3.0%) |
| 6 to 18 Years | 15,980 (96.4%) | 599 (3.6%) |
| 19 to 25 Years | 8,812 (94.0%) | 565 (6.0%) |
| 26 to 34 Years | 9,996 (91.0%) | 984 (9.0%) |
| 35 to 44 Years | 11,494 (90.0%) | 1,282 (10.0%) |
| 45 to 54 Years | 14,518 (93.8%) | 963 (6.2%) |
| 55 to 64 Years | 17,134 (95.7%) | 778 (4.3%) |
| 65 to 74 Years | 11,803 (99.1%) | 109 (0.9%) |
| 75 Years and older | 8,038 (99.7%) | 24 (0.3%) |
| Total | 103,488 (95.0%) | 5,482 (5.0%) |
Health Insurance Coverage by Citizenship Status in Warren County
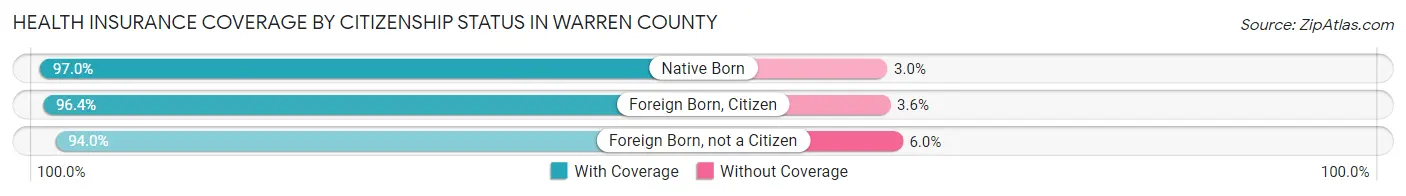
| Citizenship Status | With Coverage | Without Coverage |
| Native Born | 5,713 (97.0%) | 178 (3.0%) |
| Foreign Born, Citizen | 15,980 (96.4%) | 599 (3.6%) |
| Foreign Born, not a Citizen | 8,812 (94.0%) | 565 (6.0%) |
Health Insurance Coverage by Household Income in Warren County
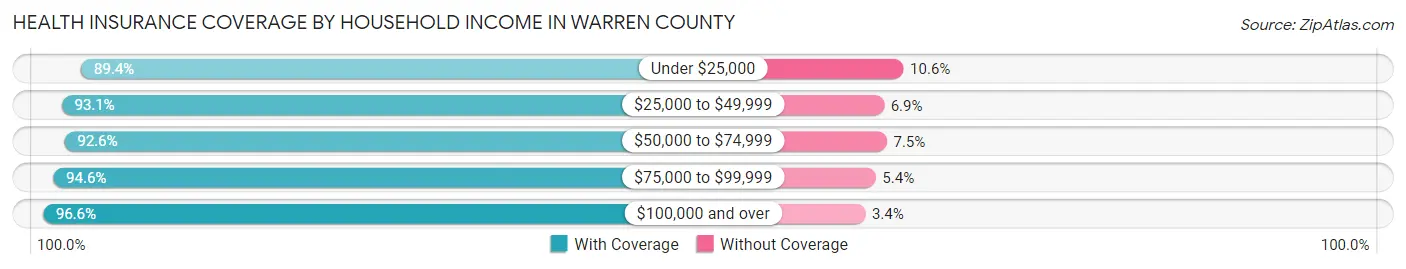
| Household Income | With Coverage | Without Coverage |
| Under $25,000 | 7,528 (89.4%) | 889 (10.6%) |
| $25,000 to $49,999 | 9,456 (93.1%) | 702 (6.9%) |
| $50,000 to $74,999 | 12,237 (92.5%) | 985 (7.4%) |
| $75,000 to $99,999 | 13,722 (94.6%) | 777 (5.4%) |
| $100,000 and over | 59,354 (96.6%) | 2,096 (3.4%) |
Public vs Private Health Insurance Coverage by Age in Warren County
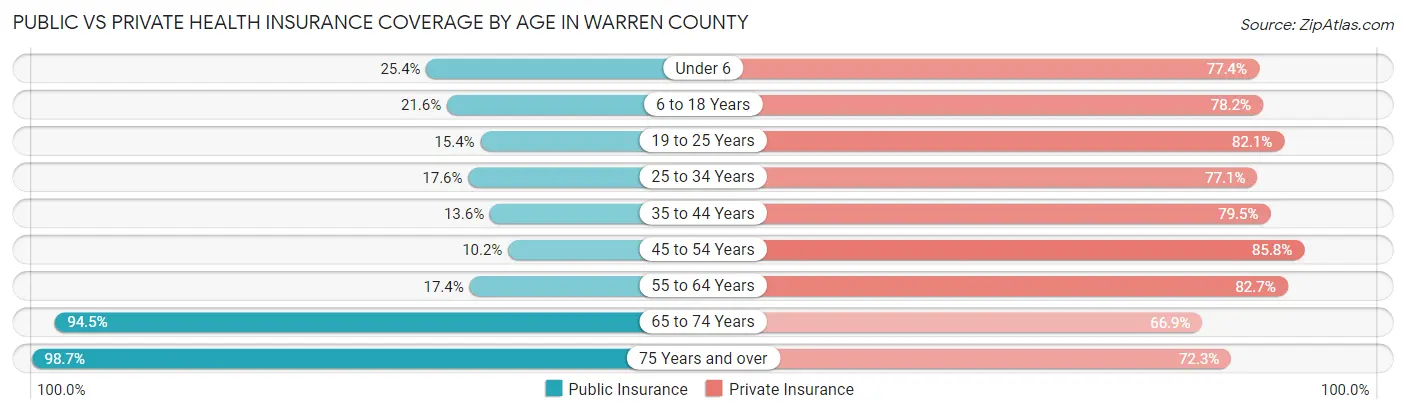
| Age Bracket | Public Insurance | Private Insurance |
| Under 6 | 1,497 (25.4%) | 4,560 (77.4%) |
| 6 to 18 Years | 3,579 (21.6%) | 12,958 (78.2%) |
| 19 to 25 Years | 1,444 (15.4%) | 7,698 (82.1%) |
| 25 to 34 Years | 1,936 (17.6%) | 8,467 (77.1%) |
| 35 to 44 Years | 1,740 (13.6%) | 10,161 (79.5%) |
| 45 to 54 Years | 1,585 (10.2%) | 13,282 (85.8%) |
| 55 to 64 Years | 3,118 (17.4%) | 14,816 (82.7%) |
| 65 to 74 Years | 11,255 (94.5%) | 7,971 (66.9%) |
| 75 Years and over | 7,958 (98.7%) | 5,826 (72.3%) |
| Total | 34,112 (31.3%) | 85,739 (78.7%) |
Disability Status by Sex by Age in Warren County
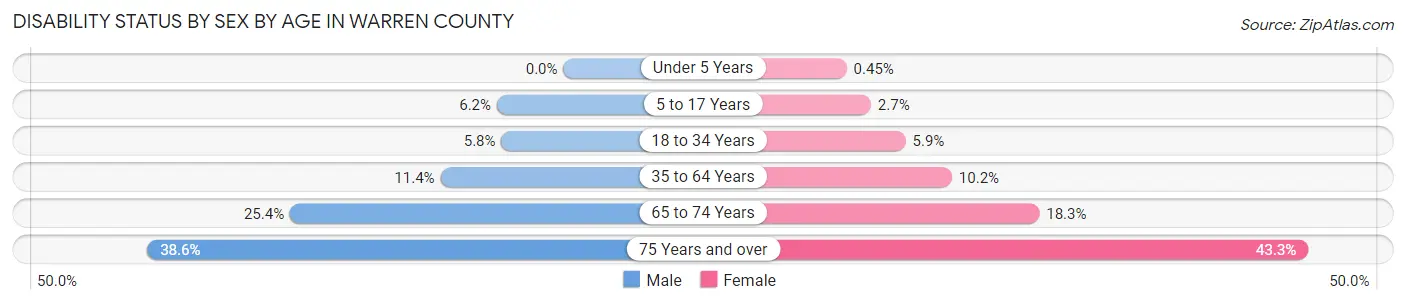
| Age Bracket | Male | Female |
| Under 5 Years | 0 (0.0%) | 11 (0.4%) |
| 5 to 17 Years | 508 (6.2%) | 214 (2.7%) |
| 18 to 34 Years | 644 (5.8%) | 616 (5.9%) |
| 35 to 64 Years | 2,625 (11.4%) | 2,367 (10.2%) |
| 65 to 74 Years | 1,471 (25.4%) | 1,121 (18.3%) |
| 75 Years and over | 1,288 (38.6%) | 2,046 (43.3%) |
Disability Class by Sex by Age in Warren County
Disability Class: Hearing Difficulty
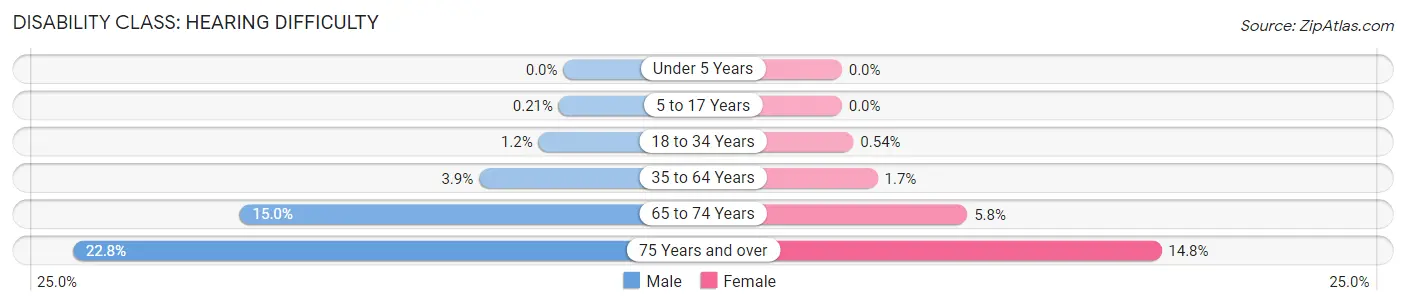
| Age Bracket | Male | Female |
| Under 5 Years | 0 (0.0%) | 0 (0.0%) |
| 5 to 17 Years | 17 (0.2%) | 0 (0.0%) |
| 18 to 34 Years | 129 (1.1%) | 56 (0.5%) |
| 35 to 64 Years | 899 (3.9%) | 385 (1.7%) |
| 65 to 74 Years | 871 (15.0%) | 356 (5.8%) |
| 75 Years and over | 759 (22.8%) | 701 (14.8%) |
Disability Class: Vision Difficulty
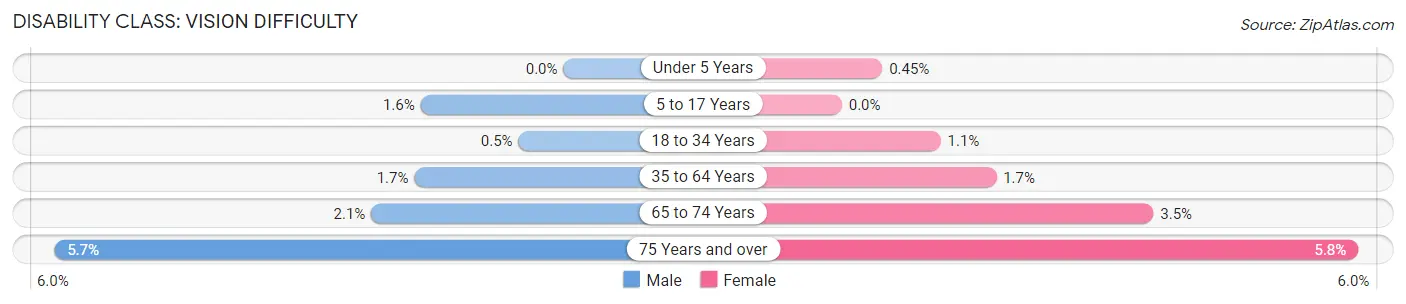
| Age Bracket | Male | Female |
| Under 5 Years | 0 (0.0%) | 11 (0.4%) |
| 5 to 17 Years | 131 (1.6%) | 0 (0.0%) |
| 18 to 34 Years | 56 (0.5%) | 114 (1.1%) |
| 35 to 64 Years | 382 (1.7%) | 398 (1.7%) |
| 65 to 74 Years | 124 (2.1%) | 212 (3.5%) |
| 75 Years and over | 189 (5.7%) | 272 (5.8%) |
Disability Class: Cognitive Difficulty
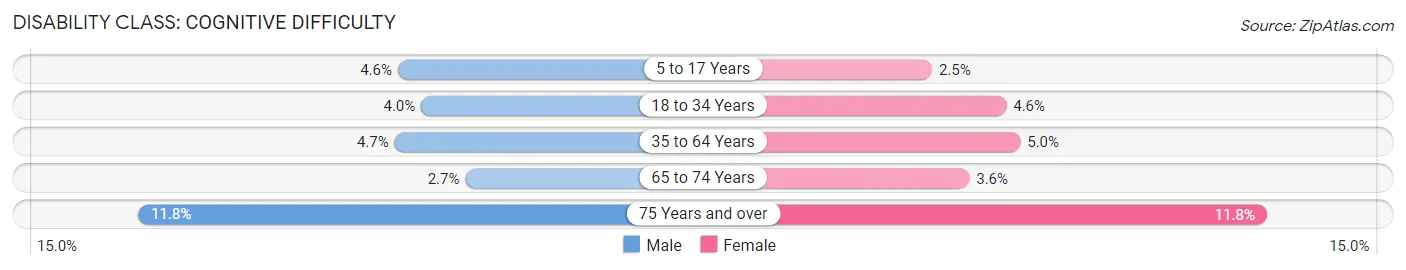
| Age Bracket | Male | Female |
| 5 to 17 Years | 380 (4.6%) | 199 (2.5%) |
| 18 to 34 Years | 443 (4.0%) | 476 (4.6%) |
| 35 to 64 Years | 1,082 (4.7%) | 1,150 (5.0%) |
| 65 to 74 Years | 158 (2.7%) | 217 (3.5%) |
| 75 Years and over | 395 (11.8%) | 559 (11.8%) |
Disability Class: Ambulatory Difficulty
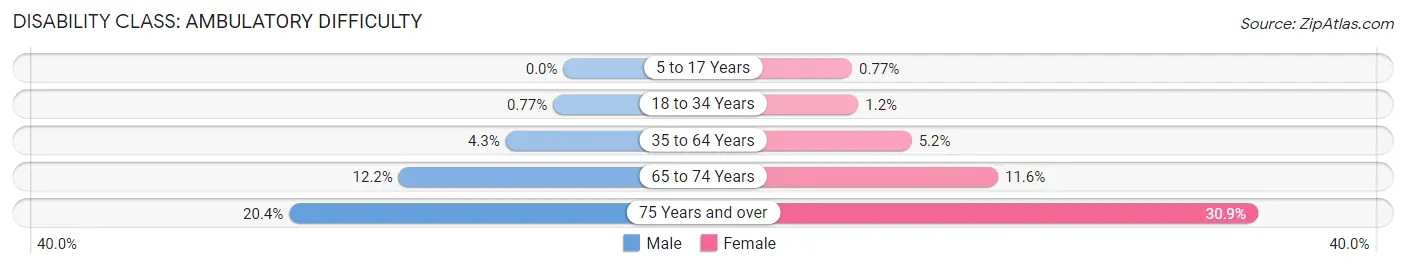
| Age Bracket | Male | Female |
| 5 to 17 Years | 0 (0.0%) | 61 (0.8%) |
| 18 to 34 Years | 86 (0.8%) | 128 (1.2%) |
| 35 to 64 Years | 988 (4.3%) | 1,202 (5.2%) |
| 65 to 74 Years | 709 (12.2%) | 709 (11.6%) |
| 75 Years and over | 679 (20.4%) | 1,460 (30.9%) |
Disability Class: Self-Care Difficulty
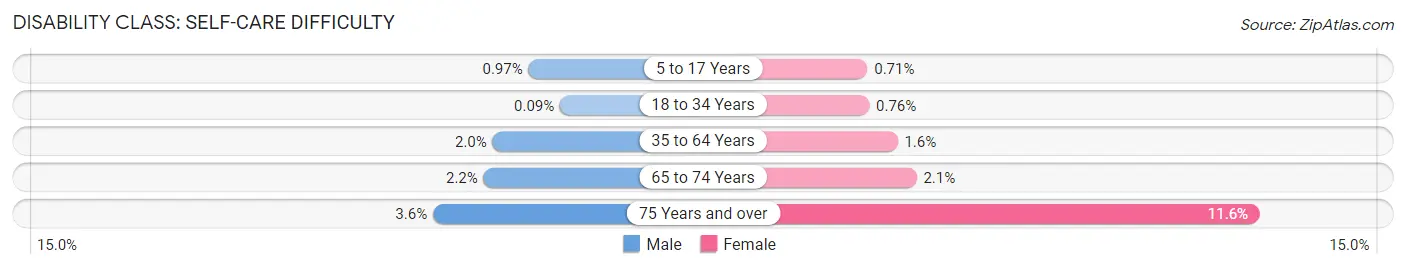
| Age Bracket | Male | Female |
| 5 to 17 Years | 80 (1.0%) | 56 (0.7%) |
| 18 to 34 Years | 10 (0.1%) | 79 (0.8%) |
| 35 to 64 Years | 454 (2.0%) | 359 (1.5%) |
| 65 to 74 Years | 129 (2.2%) | 127 (2.1%) |
| 75 Years and over | 121 (3.6%) | 550 (11.6%) |
Technology Access in Warren County
Computing Device Access in Warren County
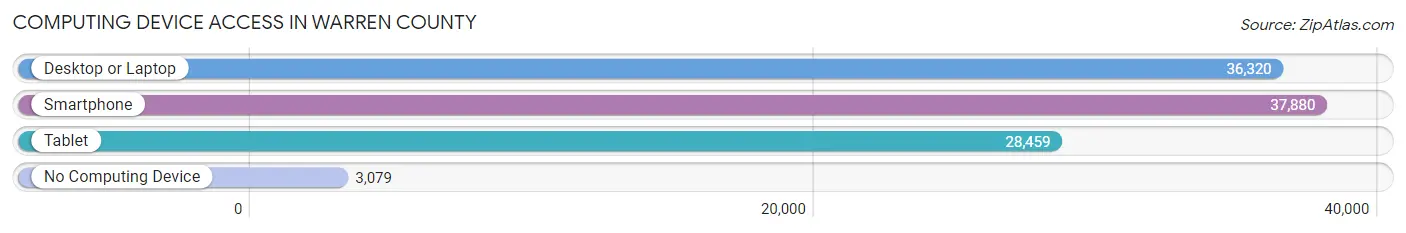
| Device Type | # Households | % Households |
| Desktop or Laptop | 36,320 | 81.9% |
| Smartphone | 37,880 | 85.4% |
| Tablet | 28,459 | 64.1% |
| No Computing Device | 3,079 | 6.9% |
| Total | 44,370 | 100.0% |
Internet Access in Warren County
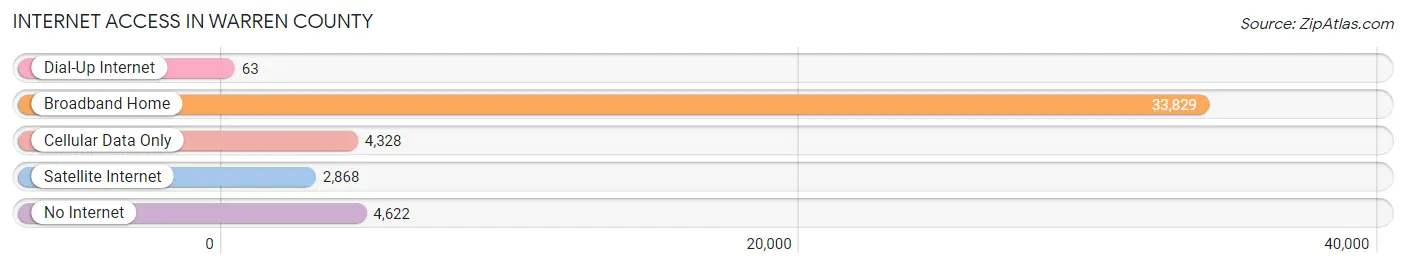
| Internet Type | # Households | % Households |
| Dial-Up Internet | 63 | 0.1% |
| Broadband Home | 33,829 | 76.2% |
| Cellular Data Only | 4,328 | 9.8% |
| Satellite Internet | 2,868 | 6.5% |
| No Internet | 4,622 | 10.4% |
| Total | 44,370 | 100.0% |
Warren County Summary
Warren County, New Jersey is located in the northwestern corner of the state and is part of the Lehigh Valley region. It is bordered by the Delaware River to the west, the Musconetcong River to the north, and the counties of Morris, Sussex, and Hunterdon to the east and south. The county seat is Belvidere, and the largest city is Phillipsburg.
Geography
Warren County covers an area of 362 square miles and is the fifth-largest county in New Jersey. It is mostly rural, with rolling hills and valleys, and is home to the Delaware Water Gap National Recreation Area. The county is divided into three distinct regions: the Highlands, the Piedmont, and the Kittatinny Valley. The Highlands are located in the northern part of the county and are characterized by steep hills and valleys. The Piedmont is located in the central part of the county and is characterized by rolling hills and valleys. The Kittatinny Valley is located in the southern part of the county and is characterized by flat terrain.
The county is home to several rivers, including the Delaware, Musconetcong, and Paulinskill. It is also home to several lakes, including Lake Hopatcong, the largest lake in New Jersey.
History
The area that is now Warren County was originally inhabited by the Lenape Native Americans. The first European settlers arrived in the area in the late 17th century. The county was officially established in 1824 and was named after General Joseph Warren, a hero of the American Revolution.
The county was largely agricultural until the mid-19th century, when the Delaware, Lackawanna, and Western Railroad was built through the county. This led to the development of several small towns and villages, including Phillipsburg, which became the county seat in 1851.
Economy
Warren County has a diverse economy, with a mix of manufacturing, retail, and service industries. The county is home to several large employers, including Mars Chocolate North America, which has a factory in Hackettstown, and the Warren Haven Nursing Home in Oxford.
The county is also home to several tourist attractions, including the Delaware Water Gap National Recreation Area, which attracts millions of visitors each year. The county is also home to several wineries, including the Four Sisters Winery in Belvidere.
Demographics
As of the 2010 census, Warren County had a population of 108,692. The racial makeup of the county was 90.3% White, 4.2% Black or African American, 0.3% Native American, 2.2% Asian, and 2.9% from two or more races. The median household income was $68,945, and the median family income was $80,890.
Conclusion
Warren County, New Jersey is a rural county located in the northwestern corner of the state. It is home to the Delaware Water Gap National Recreation Area and several other tourist attractions. The county has a diverse economy, with a mix of manufacturing, retail, and service industries. As of the 2010 census, the population of Warren County was 108,692, with a median household income of $68,945.
Common Questions
What is the Total Population of Warren County?
Total Population of Warren County is 109,739.
What is the Total Male Population of Warren County?
Total Male Population of Warren County is 54,469.
What is the Total Female Population of Warren County?
Total Female Population of Warren County is 55,270.
What is the Ratio of Males per 100 Females in Warren County?
There are 98.55 Males per 100 Females in Warren County.
What is the Ratio of Females per 100 Males in Warren County?
There are 101.47 Females per 100 Males in Warren County.
What is the Median Population Age in Warren County?
Median Population Age in Warren County is 44.0 Years.
What is the Average Family Size in Warren County
Average Family Size in Warren County is 3.0 People.
What is the Average Household Size in Warren County
Average Household Size in Warren County is 2.4 People.
What is Per Capita Income in Warren County?
Per Capita income in Warren County is $45,517.
What is the Median Family Income in Warren County?
Median Family Income in Warren County is $113,083.
What is the Median Household income in Warren County?
Median Household Income in Warren County is $92,620.
What is Income or Wage Gap in Warren County?
Income or Wage Gap in Warren County is 34.9%.
Women in Warren County earn 65.1 cents for every dollar earned by a man.
What is Family Income Deficit in Warren County?
Family Income Deficit in Warren County is $11,858.
Families that are below poverty line in Warren County earn $11,858 less on average than the poverty threshold level.
What is Inequality or Gini Index in Warren County?
Inequality or Gini Index in Warren County is 0.42.
How Large is the Labor Force in Warren County?
There are 60,398 People in the Labor Forcein in Warren County.
What is the Percentage of People in the Labor Force in Warren County?
66.0% of People are in the Labor Force in Warren County.
What is the Unemployment Rate in Warren County?
Unemployment Rate in Warren County is 6.0%.