Union County, NJ
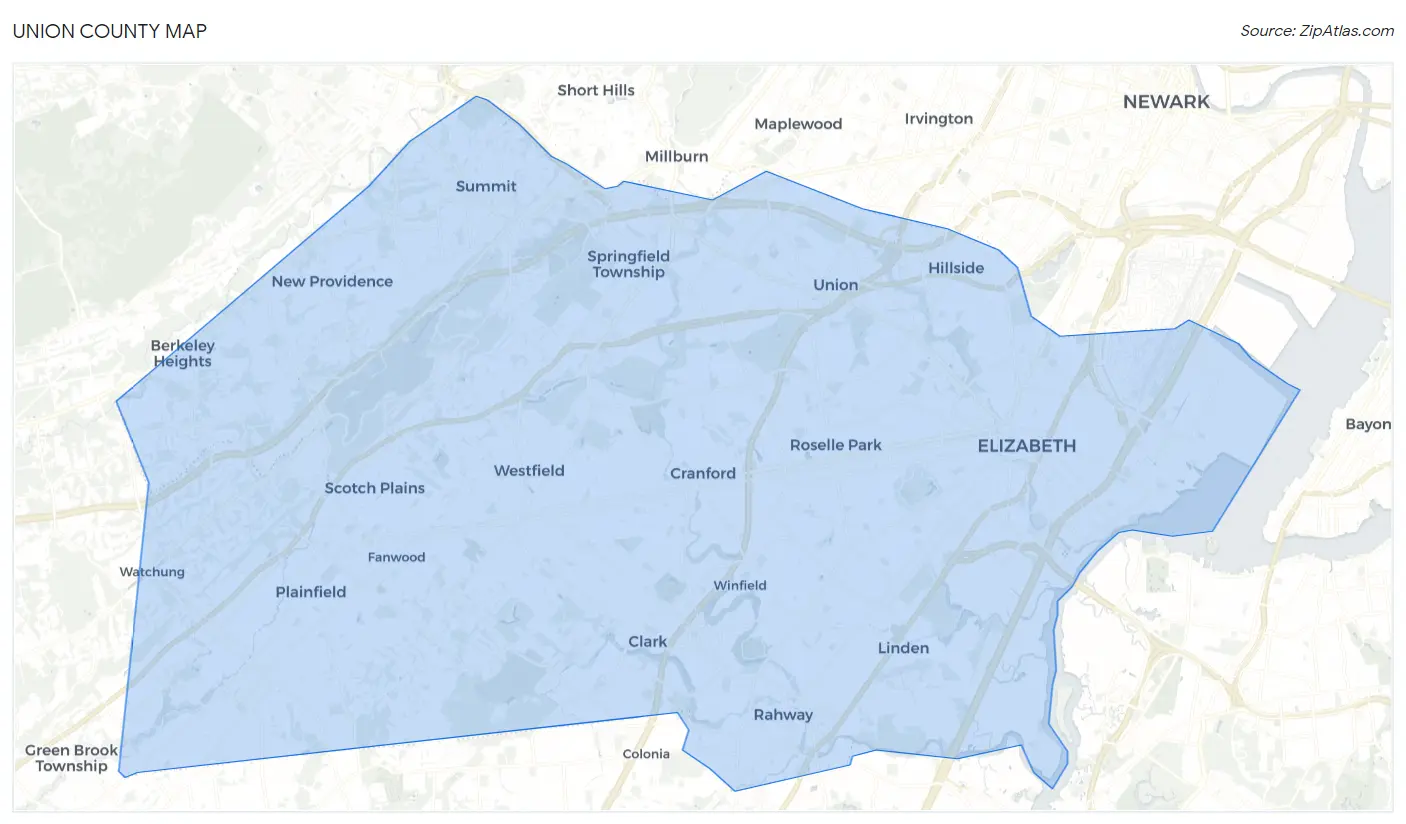
Union County Map
Union County Overview
572,079
TOTAL POPULATION
282,245
MALE POPULATION
289,834
FEMALE POPULATION
97.38
MALES / 100 FEMALES
102.69
FEMALES / 100 MALES
39.0
MEDIAN AGE
3.3
AVG FAMILY SIZE
2.8
AVG HOUSEHOLD SIZE
$49,666
PER CAPITA INCOME
$115,612
AVG FAMILY INCOME
$95,000
AVG HOUSEHOLD INCOME
24.1%
WAGE / INCOME GAP [ % ]
75.9¢/ $1
WAGE / INCOME GAP [ $ ]
$10,238
FAMILY INCOME DEFICIT
0.49
INEQUALITY / GINI INDEX
312,131
LABOR FORCE [ PEOPLE ]
68.8%
PERCENT IN LABOR FORCE
6.2%
UNEMPLOYMENT RATE
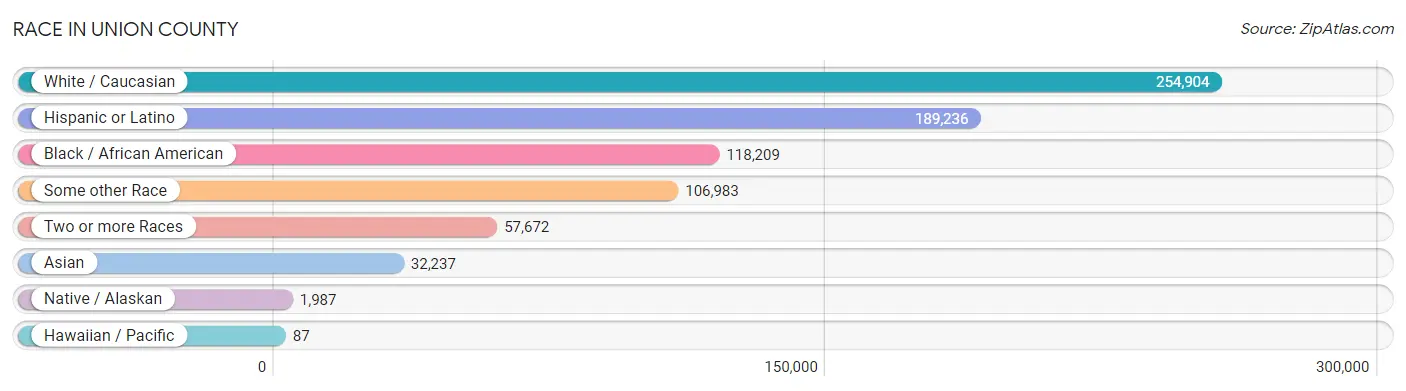
Race in Union County
The most populous races in Union County are White / Caucasian (254,904 | 44.6%), Hispanic or Latino (189,236 | 33.1%), and Black / African American (118,209 | 20.7%).
| Race | # Population | % Population |
| Asian | 32,237 | 5.6% |
| Black / African American | 118,209 | 20.7% |
| Hawaiian / Pacific | 87 | 0.0% |
| Hispanic or Latino | 189,236 | 33.1% |
| Native / Alaskan | 1,987 | 0.4% |
| White / Caucasian | 254,904 | 44.6% |
| Two or more Races | 57,672 | 10.1% |
| Some other Race | 106,983 | 18.7% |
| Total | 572,079 | 100.0% |
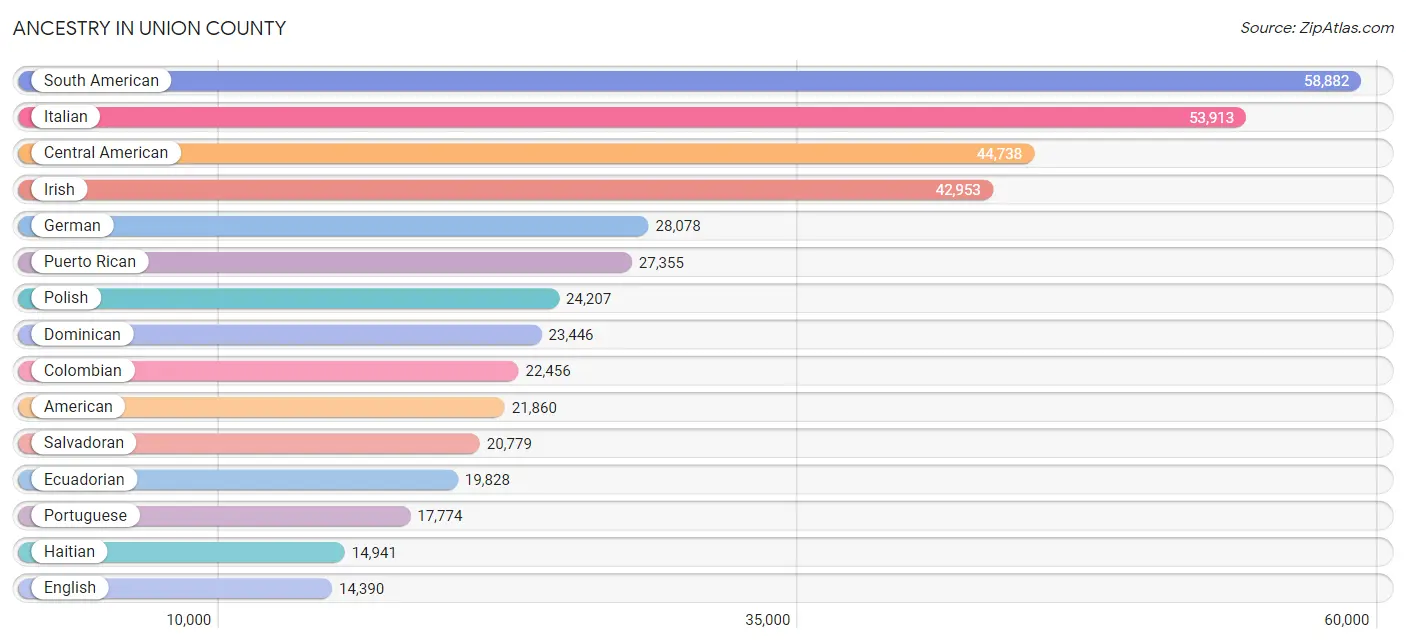
Ancestry in Union County
The most populous ancestries reported in Union County are South American (58,882 | 10.3%), Italian (53,913 | 9.4%), Central American (44,738 | 7.8%), Irish (42,953 | 7.5%), and German (28,078 | 4.9%), together accounting for 39.9% of all Union County residents.
| Ancestry | # Population | % Population |
| Afghan | 214 | 0.0% |
| African | 3,271 | 0.6% |
| Alaskan Athabascan | 20 | 0.0% |
| Albanian | 649 | 0.1% |
| American | 21,860 | 3.8% |
| Apache | 73 | 0.0% |
| Arab | 4,695 | 0.8% |
| Argentinean | 1,149 | 0.2% |
| Armenian | 453 | 0.1% |
| Assyrian / Chaldean / Syriac | 7 | 0.0% |
| Australian | 313 | 0.1% |
| Austrian | 1,521 | 0.3% |
| Bahamian | 41 | 0.0% |
| Barbadian | 714 | 0.1% |
| Basque | 26 | 0.0% |
| Belgian | 117 | 0.0% |
| Belizean | 95 | 0.0% |
| Bhutanese | 1,246 | 0.2% |
| Blackfeet | 80 | 0.0% |
| Bolivian | 368 | 0.1% |
| Brazilian | 6,985 | 1.2% |
| British | 899 | 0.2% |
| British West Indian | 674 | 0.1% |
| Bulgarian | 84 | 0.0% |
| Burmese | 2,084 | 0.4% |
| Cajun | 16 | 0.0% |
| Canadian | 293 | 0.1% |
| Cape Verdean | 21 | 0.0% |
| Carpatho Rusyn | 37 | 0.0% |
| Celtic | 27 | 0.0% |
| Central American | 44,738 | 7.8% |
| Central American Indian | 1,539 | 0.3% |
| Cherokee | 882 | 0.2% |
| Chickasaw | 36 | 0.0% |
| Chilean | 587 | 0.1% |
| Choctaw | 9 | 0.0% |
| Colombian | 22,456 | 3.9% |
| Costa Rican | 3,203 | 0.6% |
| Cree | 9 | 0.0% |
| Creek | 13 | 0.0% |
| Croatian | 439 | 0.1% |
| Cuban | 12,538 | 2.2% |
| Cypriot | 93 | 0.0% |
| Czech | 955 | 0.2% |
| Czechoslovakian | 396 | 0.1% |
| Danish | 564 | 0.1% |
| Delaware | 120 | 0.0% |
| Dominican | 23,446 | 4.1% |
| Dutch | 2,198 | 0.4% |
| Dutch West Indian | 8 | 0.0% |
| Eastern European | 3,175 | 0.5% |
| Ecuadorian | 19,828 | 3.5% |
| Egyptian | 2,272 | 0.4% |
| English | 14,390 | 2.5% |
| Estonian | 90 | 0.0% |
| Ethiopian | 14 | 0.0% |
| European | 4,074 | 0.7% |
| Filipino | 133 | 0.0% |
| Finnish | 115 | 0.0% |
| French | 2,824 | 0.5% |
| French Canadian | 657 | 0.1% |
| German | 28,078 | 4.9% |
| Ghanaian | 1,272 | 0.2% |
| Greek | 4,293 | 0.7% |
| Guamanian / Chamorro | 67 | 0.0% |
| Guatemalan | 10,523 | 1.8% |
| Guyanese | 1,674 | 0.3% |
| Haitian | 14,941 | 2.6% |
| Honduran | 7,795 | 1.4% |
| Hungarian | 3,122 | 0.5% |
| Indian (Asian) | 9,004 | 1.6% |
| Indonesian | 115 | 0.0% |
| Iranian | 336 | 0.1% |
| Iraqi | 15 | 0.0% |
| Irish | 42,953 | 7.5% |
| Iroquois | 95 | 0.0% |
| Israeli | 163 | 0.0% |
| Italian | 53,913 | 9.4% |
| Jamaican | 4,870 | 0.9% |
| Japanese | 373 | 0.1% |
| Jordanian | 464 | 0.1% |
| Kenyan | 117 | 0.0% |
| Korean | 8,780 | 1.5% |
| Laotian | 68 | 0.0% |
| Latvian | 225 | 0.0% |
| Lebanese | 626 | 0.1% |
| Liberian | 114 | 0.0% |
| Lithuanian | 1,761 | 0.3% |
| Luxembourger | 48 | 0.0% |
| Macedonian | 41 | 0.0% |
| Malaysian | 6 | 0.0% |
| Maltese | 92 | 0.0% |
| Menominee | 15 | 0.0% |
| Mexican | 11,274 | 2.0% |
| Mexican American Indian | 365 | 0.1% |
| Mongolian | 63 | 0.0% |
| Moroccan | 142 | 0.0% |
| Native Hawaiian | 61 | 0.0% |
| Navajo | 40 | 0.0% |
| New Zealander | 52 | 0.0% |
| Nicaraguan | 1,357 | 0.2% |
| Nigerian | 3,702 | 0.6% |
| Northern European | 331 | 0.1% |
| Norwegian | 1,543 | 0.3% |
| Pakistani | 39 | 0.0% |
| Palestinian | 187 | 0.0% |
| Panamanian | 1,081 | 0.2% |
| Paraguayan | 276 | 0.1% |
| Pennsylvania German | 187 | 0.0% |
| Peruvian | 9,472 | 1.7% |
| Polish | 24,207 | 4.2% |
| Portuguese | 17,774 | 3.1% |
| Puerto Rican | 27,355 | 4.8% |
| Romanian | 766 | 0.1% |
| Russian | 7,346 | 1.3% |
| Salvadoran | 20,779 | 3.6% |
| Samoan | 18 | 0.0% |
| Scandinavian | 276 | 0.1% |
| Scotch-Irish | 1,365 | 0.2% |
| Scottish | 2,416 | 0.4% |
| Seminole | 91 | 0.0% |
| Senegalese | 92 | 0.0% |
| Serbian | 385 | 0.1% |
| Sioux | 14 | 0.0% |
| Slavic | 294 | 0.1% |
| Slovak | 2,050 | 0.4% |
| Slovene | 73 | 0.0% |
| South African | 291 | 0.1% |
| South American | 58,882 | 10.3% |
| South American Indian | 252 | 0.0% |
| Soviet Union | 54 | 0.0% |
| Spaniard | 3,469 | 0.6% |
| Spanish | 1,204 | 0.2% |
| Spanish American Indian | 34 | 0.0% |
| Sri Lankan | 1,326 | 0.2% |
| Subsaharan African | 10,407 | 1.8% |
| Sudanese | 49 | 0.0% |
| Swedish | 1,285 | 0.2% |
| Swiss | 424 | 0.1% |
| Syrian | 719 | 0.1% |
| Thai | 12,079 | 2.1% |
| Tongan | 18 | 0.0% |
| Trinidadian and Tobagonian | 1,887 | 0.3% |
| Turkish | 556 | 0.1% |
| Ugandan | 2 | 0.0% |
| Ukrainian | 3,395 | 0.6% |
| Uruguayan | 2,718 | 0.5% |
| Venezuelan | 1,775 | 0.3% |
| Vietnamese | 321 | 0.1% |
| Welsh | 925 | 0.2% |
| West Indian | 1,243 | 0.2% |
| Yugoslavian | 101 | 0.0% | View All 152 Rows |
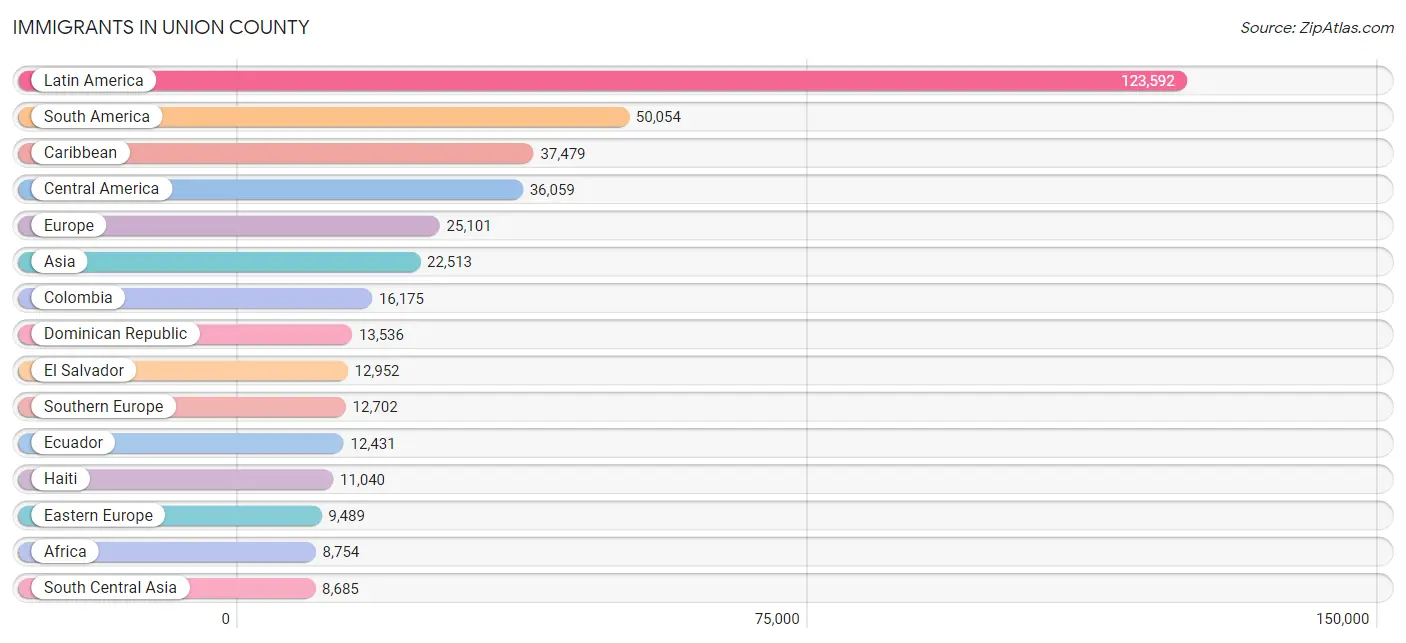
Immigrants in Union County
The most numerous immigrant groups reported in Union County came from Latin America (123,592 | 21.6%), South America (50,054 | 8.7%), Caribbean (37,479 | 6.6%), Central America (36,059 | 6.3%), and Europe (25,101 | 4.4%), together accounting for 47.6% of all Union County residents.
| Immigration Origin | # Population | % Population |
| Afghanistan | 202 | 0.0% |
| Africa | 8,754 | 1.5% |
| Albania | 338 | 0.1% |
| Argentina | 775 | 0.1% |
| Armenia | 54 | 0.0% |
| Asia | 22,513 | 3.9% |
| Australia | 113 | 0.0% |
| Austria | 95 | 0.0% |
| Azores | 149 | 0.0% |
| Bangladesh | 444 | 0.1% |
| Barbados | 452 | 0.1% |
| Belarus | 287 | 0.1% |
| Belgium | 67 | 0.0% |
| Bolivia | 216 | 0.0% |
| Bosnia and Herzegovina | 22 | 0.0% |
| Brazil | 6,698 | 1.2% |
| Bulgaria | 101 | 0.0% |
| Cameroon | 298 | 0.1% |
| Canada | 708 | 0.1% |
| Caribbean | 37,479 | 6.6% |
| Central America | 36,059 | 6.3% |
| Chile | 271 | 0.1% |
| China | 4,402 | 0.8% |
| Colombia | 16,175 | 2.8% |
| Congo | 6 | 0.0% |
| Costa Rica | 2,671 | 0.5% |
| Croatia | 66 | 0.0% |
| Cuba | 6,640 | 1.2% |
| Czechoslovakia | 607 | 0.1% |
| Denmark | 38 | 0.0% |
| Dominica | 53 | 0.0% |
| Dominican Republic | 13,536 | 2.4% |
| Eastern Africa | 383 | 0.1% |
| Eastern Asia | 5,817 | 1.0% |
| Eastern Europe | 9,489 | 1.7% |
| Ecuador | 12,431 | 2.2% |
| Egypt | 1,776 | 0.3% |
| El Salvador | 12,952 | 2.3% |
| England | 405 | 0.1% |
| Ethiopia | 14 | 0.0% |
| Europe | 25,101 | 4.4% |
| France | 336 | 0.1% |
| Germany | 686 | 0.1% |
| Ghana | 1,230 | 0.2% |
| Greece | 772 | 0.1% |
| Grenada | 180 | 0.0% |
| Guatemala | 7,605 | 1.3% |
| Guyana | 2,040 | 0.4% |
| Haiti | 11,040 | 1.9% |
| Honduras | 5,533 | 1.0% |
| Hong Kong | 455 | 0.1% |
| Hungary | 260 | 0.1% |
| India | 6,648 | 1.2% |
| Indonesia | 74 | 0.0% |
| Iran | 137 | 0.0% |
| Ireland | 370 | 0.1% |
| Israel | 176 | 0.0% |
| Italy | 2,447 | 0.4% |
| Jamaica | 3,393 | 0.6% |
| Japan | 245 | 0.0% |
| Jordan | 36 | 0.0% |
| Kazakhstan | 36 | 0.0% |
| Kenya | 92 | 0.0% |
| Korea | 1,170 | 0.2% |
| Kuwait | 8 | 0.0% |
| Laos | 6 | 0.0% |
| Latin America | 123,592 | 21.6% |
| Latvia | 180 | 0.0% |
| Lebanon | 127 | 0.0% |
| Liberia | 233 | 0.0% |
| Lithuania | 210 | 0.0% |
| Malaysia | 59 | 0.0% |
| Mexico | 5,525 | 1.0% |
| Middle Africa | 615 | 0.1% |
| Moldova | 99 | 0.0% |
| Morocco | 29 | 0.0% |
| Nepal | 57 | 0.0% |
| Netherlands | 146 | 0.0% |
| Nicaragua | 978 | 0.2% |
| Nigeria | 2,905 | 0.5% |
| Northern Africa | 2,027 | 0.4% |
| Northern Europe | 1,529 | 0.3% |
| Oceania | 148 | 0.0% |
| Pakistan | 647 | 0.1% |
| Panama | 776 | 0.1% |
| Peru | 7,857 | 1.4% |
| Philippines | 5,106 | 0.9% |
| Poland | 4,395 | 0.8% |
| Portugal | 8,115 | 1.4% |
| Romania | 210 | 0.0% |
| Russia | 1,010 | 0.2% |
| Saudi Arabia | 116 | 0.0% |
| Scotland | 23 | 0.0% |
| Senegal | 41 | 0.0% |
| Serbia | 128 | 0.0% |
| Sierra Leone | 19 | 0.0% |
| Singapore | 43 | 0.0% |
| South Africa | 338 | 0.1% |
| South America | 50,054 | 8.7% |
| South Central Asia | 8,685 | 1.5% |
| South Eastern Asia | 6,220 | 1.1% |
| Southern Europe | 12,702 | 2.2% |
| Spain | 1,337 | 0.2% |
| Sri Lanka | 231 | 0.0% |
| St. Vincent and the Grenadines | 58 | 0.0% |
| Sudan | 135 | 0.0% |
| Sweden | 25 | 0.0% |
| Switzerland | 20 | 0.0% |
| Syria | 381 | 0.1% |
| Taiwan | 589 | 0.1% |
| Thailand | 26 | 0.0% |
| Trinidad and Tobago | 1,407 | 0.3% |
| Turkey | 454 | 0.1% |
| Uganda | 2 | 0.0% |
| Ukraine | 1,154 | 0.2% |
| Uruguay | 1,774 | 0.3% |
| Uzbekistan | 226 | 0.0% |
| Venezuela | 1,490 | 0.3% |
| Vietnam | 883 | 0.2% |
| West Indies | 220 | 0.0% |
| Western Africa | 4,815 | 0.8% |
| Western Asia | 1,738 | 0.3% |
| Western Europe | 1,350 | 0.2% |
| Zaire | 187 | 0.0% |
| Zimbabwe | 124 | 0.0% | View All 125 Rows |
Sex and Age in Union County
Sex and Age in Union County
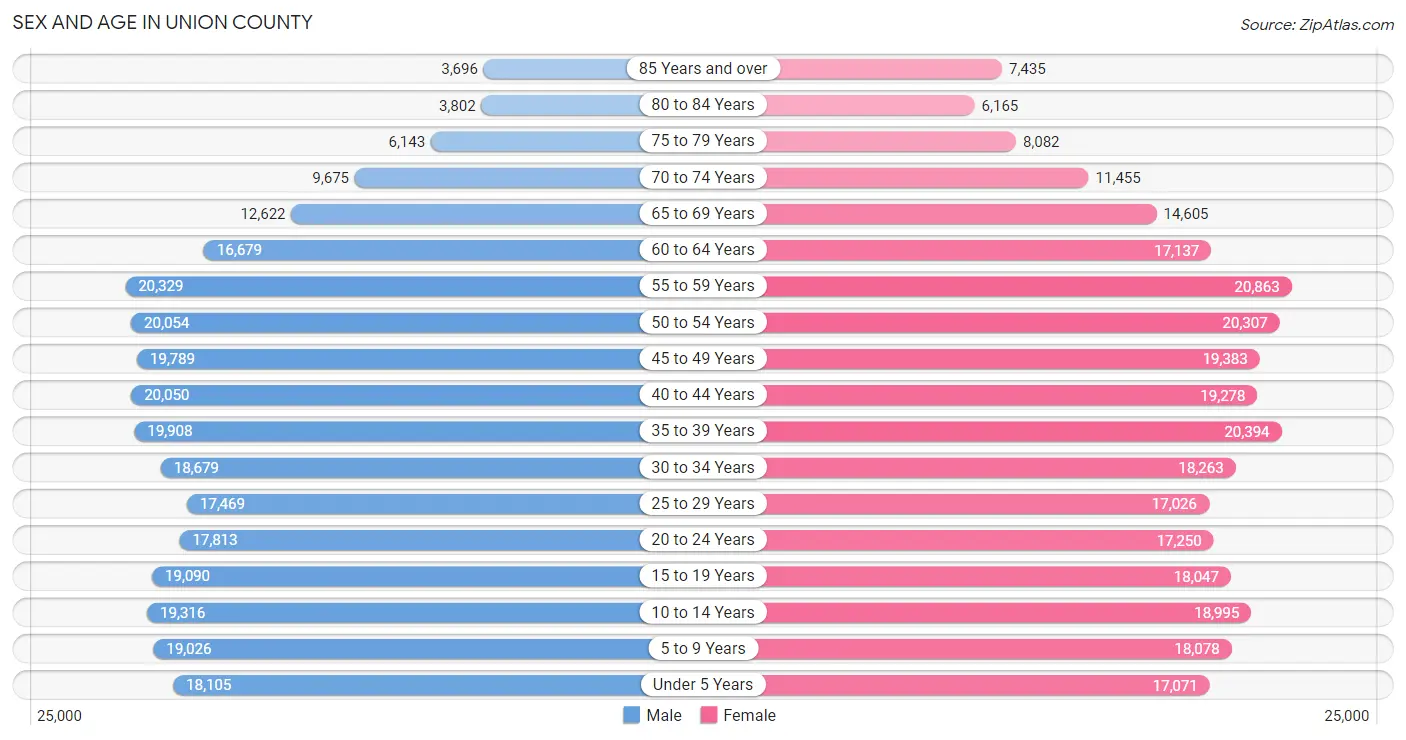
The most populous age groups in Union County are 55 to 59 Years (20,329 | 7.2%) for men and 55 to 59 Years (20,863 | 7.2%) for women.
| Age Bracket | Male | Female |
| Under 5 Years | 18,105 (6.4%) | 17,071 (5.9%) |
| 5 to 9 Years | 19,026 (6.7%) | 18,078 (6.2%) |
| 10 to 14 Years | 19,316 (6.8%) | 18,995 (6.6%) |
| 15 to 19 Years | 19,090 (6.8%) | 18,047 (6.2%) |
| 20 to 24 Years | 17,813 (6.3%) | 17,250 (5.9%) |
| 25 to 29 Years | 17,469 (6.2%) | 17,026 (5.9%) |
| 30 to 34 Years | 18,679 (6.6%) | 18,263 (6.3%) |
| 35 to 39 Years | 19,908 (7.0%) | 20,394 (7.0%) |
| 40 to 44 Years | 20,050 (7.1%) | 19,278 (6.7%) |
| 45 to 49 Years | 19,789 (7.0%) | 19,383 (6.7%) |
| 50 to 54 Years | 20,054 (7.1%) | 20,307 (7.0%) |
| 55 to 59 Years | 20,329 (7.2%) | 20,863 (7.2%) |
| 60 to 64 Years | 16,679 (5.9%) | 17,137 (5.9%) |
| 65 to 69 Years | 12,622 (4.5%) | 14,605 (5.0%) |
| 70 to 74 Years | 9,675 (3.4%) | 11,455 (4.0%) |
| 75 to 79 Years | 6,143 (2.2%) | 8,082 (2.8%) |
| 80 to 84 Years | 3,802 (1.3%) | 6,165 (2.1%) |
| 85 Years and over | 3,696 (1.3%) | 7,435 (2.6%) |
| Total | 282,245 (100.0%) | 289,834 (100.0%) |
Families and Households in Union County
Median Family Size in Union County
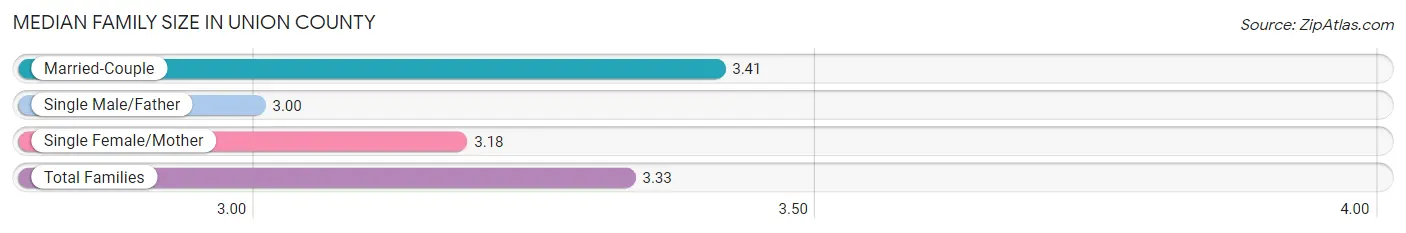
The median family size in Union County is 3.33 persons per family, with married-couple families (101,082 | 69.9%) accounting for the largest median family size of 3.41 persons per family. On the other hand, single male/father families (13,455 | 9.3%) represent the smallest median family size with 3.00 persons per family.
| Family Type | # Families | Family Size |
| Married-Couple | 101,082 (69.9%) | 3.41 |
| Single Male/Father | 13,455 (9.3%) | 3.00 |
| Single Female/Mother | 30,057 (20.8%) | 3.18 |
| Total Families | 144,594 (100.0%) | 3.33 |
Median Household Size in Union County
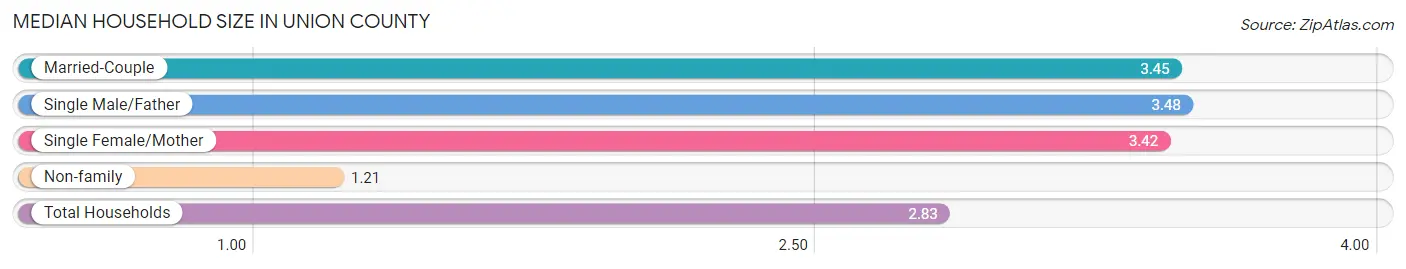
The median household size in Union County is 2.83 persons per household, with single male/father households (13,455 | 6.7%) accounting for the largest median household size of 3.48 persons per household. non-family households (55,402 | 27.7%) represent the smallest median household size with 1.21 persons per household.
| Household Type | # Households | Household Size |
| Married-Couple | 101,082 (50.5%) | 3.45 |
| Single Male/Father | 13,455 (6.7%) | 3.48 |
| Single Female/Mother | 30,057 (15.0%) | 3.42 |
| Non-family | 55,402 (27.7%) | 1.21 |
| Total Households | 199,996 (100.0%) | 2.83 |
Household Size by Marriage Status in Union County
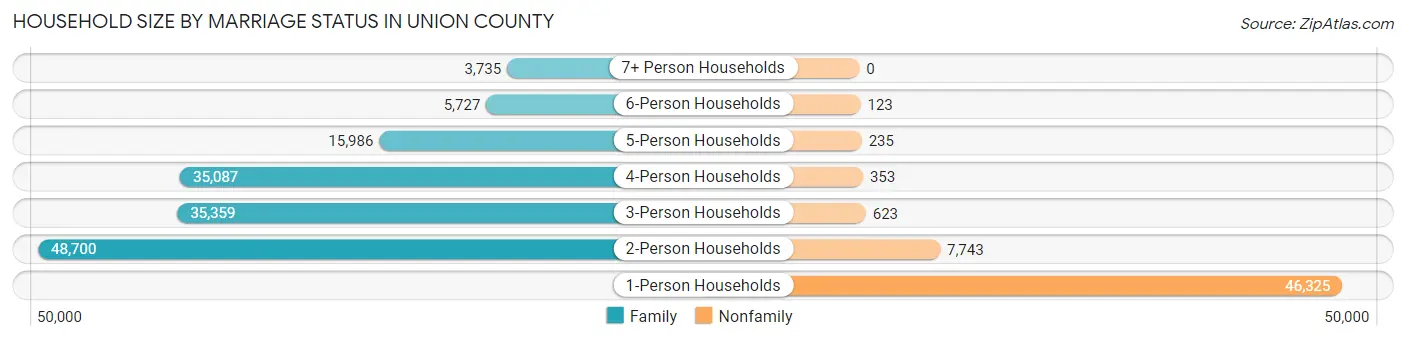
Out of a total of 199,996 households in Union County, 144,594 (72.3%) are family households, while 55,402 (27.7%) are nonfamily households. The most numerous type of family households are 2-person households, comprising 48,700, and the most common type of nonfamily households are 1-person households, comprising 46,325.
| Household Size | Family Households | Nonfamily Households |
| 1-Person Households | - | 46,325 (23.2%) |
| 2-Person Households | 48,700 (24.3%) | 7,743 (3.9%) |
| 3-Person Households | 35,359 (17.7%) | 623 (0.3%) |
| 4-Person Households | 35,087 (17.5%) | 353 (0.2%) |
| 5-Person Households | 15,986 (8.0%) | 235 (0.1%) |
| 6-Person Households | 5,727 (2.9%) | 123 (0.1%) |
| 7+ Person Households | 3,735 (1.9%) | 0 (0.0%) |
| Total | 144,594 (72.3%) | 55,402 (27.7%) |
Female Fertility in Union County
Fertility by Age in Union County
Average fertility rate in Union County is 55.0 births per 1,000 women. Women in the age bracket of 20 to 34 years have the highest fertility rate with 82.0 births per 1,000 women. Women in the age bracket of 20 to 34 years acount for 58.6% of all women with births.
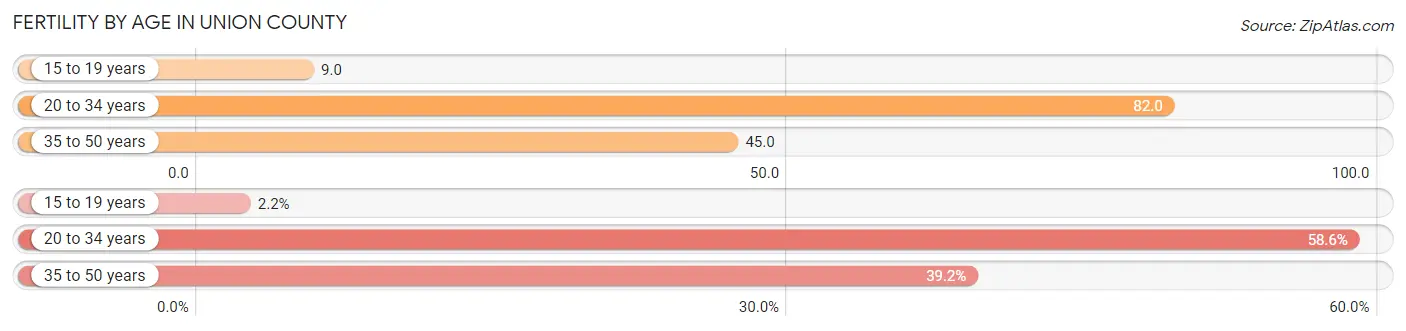
| Age Bracket | Women with Births | Births / 1,000 Women |
| 15 to 19 years | 159 (2.2%) | 9.0 |
| 20 to 34 years | 4,284 (58.6%) | 82.0 |
| 35 to 50 years | 2,865 (39.2%) | 45.0 |
| Total | 7,308 (100.0%) | 55.0 |
Fertility by Age by Marriage Status in Union County
66.9% of women with births (7,308) in Union County are married. The highest percentage of unmarried women with births falls into 15 to 19 years age bracket with 100.0% of them unmarried at the time of birth, while the lowest percentage of unmarried women with births belong to 35 to 50 years age bracket with 22.0% of them unmarried.
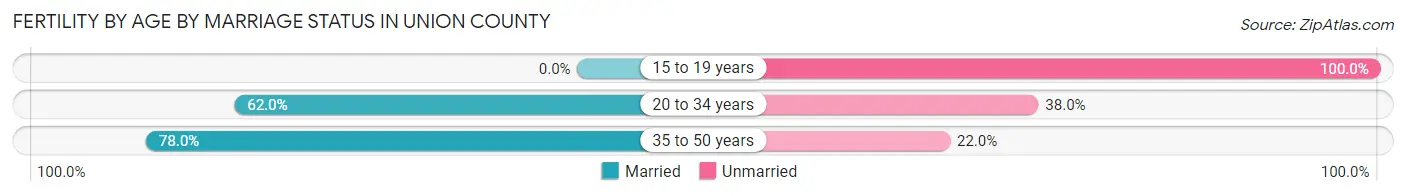
| Age Bracket | Married | Unmarried |
| 15 to 19 years | 0 (0.0%) | 159 (100.0%) |
| 20 to 34 years | 2,656 (62.0%) | 1,628 (38.0%) |
| 35 to 50 years | 2,235 (78.0%) | 630 (22.0%) |
| Total | 4,889 (66.9%) | 2,419 (33.1%) |
Fertility by Education in Union County
Average fertility rate in Union County is 55.0 births per 1,000 women. Women with the education attainment of high school diploma have the highest fertility rate of 68.0 births per 1,000 women, while women with the education attainment of college or associate's degree have the lowest fertility at 38.0 births per 1,000 women. Women with the education attainment of bachelor's degree represent 26.7% of all women with births.
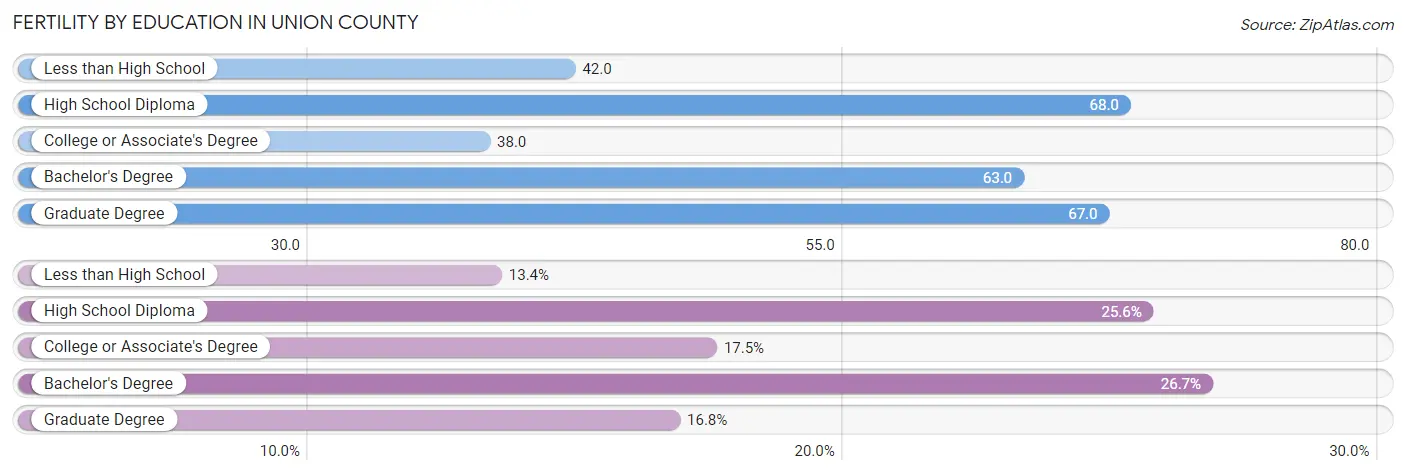
| Educational Attainment | Women with Births | Births / 1,000 Women |
| Less than High School | 981 (13.4%) | 42.0 |
| High School Diploma | 1,873 (25.6%) | 68.0 |
| College or Associate's Degree | 1,275 (17.4%) | 38.0 |
| Bachelor's Degree | 1,954 (26.7%) | 63.0 |
| Graduate Degree | 1,225 (16.8%) | 67.0 |
| Total | 7,308 (100.0%) | 55.0 |
Fertility by Education by Marriage Status in Union County
33.1% of women with births in Union County are unmarried. Women with the educational attainment of graduate degree are most likely to be married with 96.2% of them married at childbirth, while women with the educational attainment of less than high school are least likely to be married with 62.3% of them unmarried at childbirth.
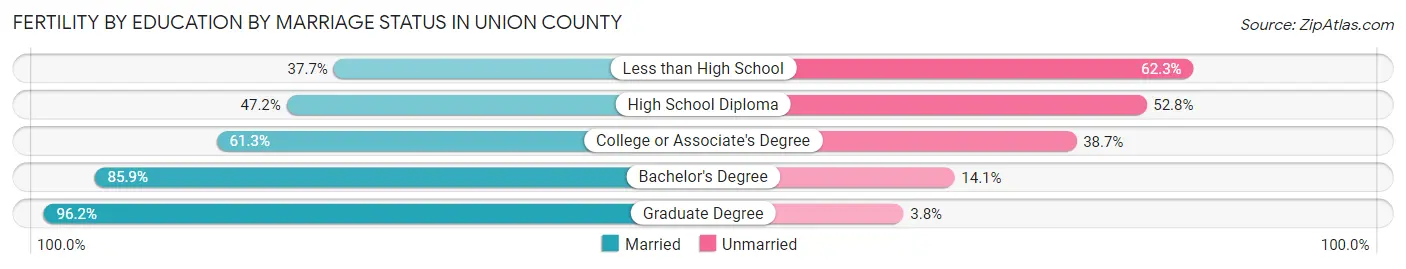
| Educational Attainment | Married | Unmarried |
| Less than High School | 370 (37.7%) | 611 (62.3%) |
| High School Diploma | 884 (47.2%) | 989 (52.8%) |
| College or Associate's Degree | 782 (61.3%) | 493 (38.7%) |
| Bachelor's Degree | 1,678 (85.9%) | 276 (14.1%) |
| Graduate Degree | 1,178 (96.2%) | 47 (3.8%) |
| Total | 4,889 (66.9%) | 2,419 (33.1%) |
Income in Union County
Income Overview in Union County
Per Capita Income in Union County is $49,666, while median incomes of families and households are $115,612 and $95,000 respectively.
| Characteristic | Number | Measure |
| Per Capita Income | 572,079 | $49,666 |
| Median Family Income | 144,594 | $115,612 |
| Mean Family Income | 144,594 | $160,551 |
| Median Household Income | 199,996 | $95,000 |
| Mean Household Income | 199,996 | $139,183 |
| Income Deficit | 144,594 | $10,238 |
| Wage / Income Gap (%) | 572,079 | 24.10% |
| Wage / Income Gap ($) | 572,079 | 75.90¢ per $1 |
| Gini / Inequality Index | 572,079 | 0.49 |
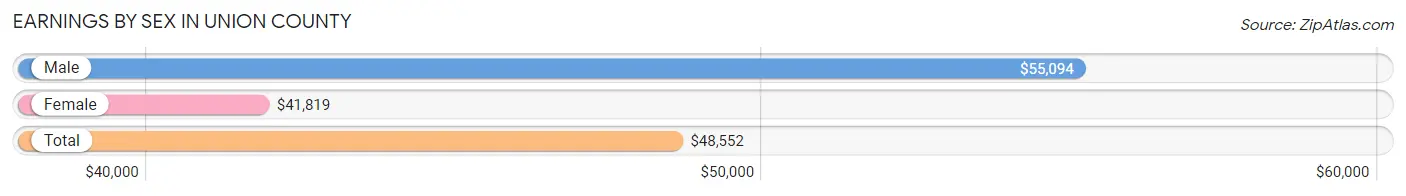
Earnings by Sex in Union County
Average Earnings in Union County are $48,552, $55,094 for men and $41,819 for women, a difference of 24.1%.
| Sex | Number | Average Earnings |
| Male | 167,628 (53.1%) | $55,094 |
| Female | 148,144 (46.9%) | $41,819 |
| Total | 315,772 (100.0%) | $48,552 |
Earnings by Sex by Income Bracket in Union County
The most common earnings brackets in Union County are $100,000+ for men (43,038 | 25.7%) and $100,000+ for women (23,646 | 16.0%).

| Income | Male | Female |
| $2,499 or less | 5,154 (3.1%) | 6,022 (4.1%) |
| $2,500 to $4,999 | 3,739 (2.2%) | 4,727 (3.2%) |
| $5,000 to $7,499 | 4,341 (2.6%) | 4,578 (3.1%) |
| $7,500 to $9,999 | 2,982 (1.8%) | 4,620 (3.1%) |
| $10,000 to $12,499 | 4,038 (2.4%) | 5,081 (3.4%) |
| $12,500 to $14,999 | 3,465 (2.1%) | 4,074 (2.8%) |
| $15,000 to $17,499 | 3,056 (1.8%) | 4,789 (3.2%) |
| $17,500 to $19,999 | 3,256 (1.9%) | 3,522 (2.4%) |
| $20,000 to $22,499 | 3,886 (2.3%) | 4,473 (3.0%) |
| $22,500 to $24,999 | 4,094 (2.4%) | 5,064 (3.4%) |
| $25,000 to $29,999 | 8,144 (4.9%) | 8,964 (6.0%) |
| $30,000 to $34,999 | 8,612 (5.1%) | 8,393 (5.7%) |
| $35,000 to $39,999 | 7,632 (4.5%) | 7,062 (4.8%) |
| $40,000 to $44,999 | 7,798 (4.6%) | 6,448 (4.3%) |
| $45,000 to $49,999 | 7,070 (4.2%) | 5,462 (3.7%) |
| $50,000 to $54,999 | 6,429 (3.8%) | 5,669 (3.8%) |
| $55,000 to $64,999 | 11,664 (7.0%) | 9,770 (6.6%) |
| $65,000 to $74,999 | 10,287 (6.1%) | 8,844 (6.0%) |
| $75,000 to $99,999 | 18,943 (11.3%) | 16,936 (11.4%) |
| $100,000+ | 43,038 (25.7%) | 23,646 (16.0%) |
| Total | 167,628 (100.0%) | 148,144 (100.0%) |
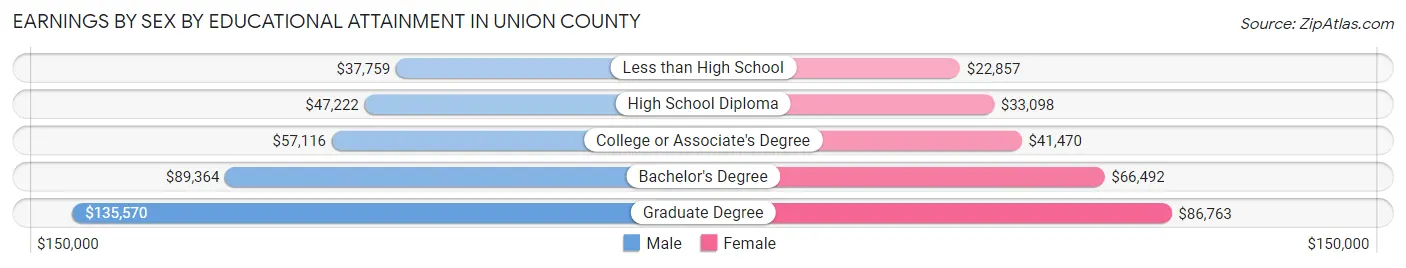
Earnings by Sex by Educational Attainment in Union County
Average earnings in Union County are $61,954 for men and $48,344 for women, a difference of 22.0%. Men with an educational attainment of graduate degree enjoy the highest average annual earnings of $135,570, while those with less than high school education earn the least with $37,759. Women with an educational attainment of graduate degree earn the most with the average annual earnings of $86,763, while those with less than high school education have the smallest earnings of $22,857.
| Educational Attainment | Male Income | Female Income |
| Less than High School | $37,759 | $22,857 |
| High School Diploma | $47,222 | $33,098 |
| College or Associate's Degree | $57,116 | $41,470 |
| Bachelor's Degree | $89,364 | $66,492 |
| Graduate Degree | $135,570 | $86,763 |
| Total | $61,954 | $48,344 |
Family Income in Union County
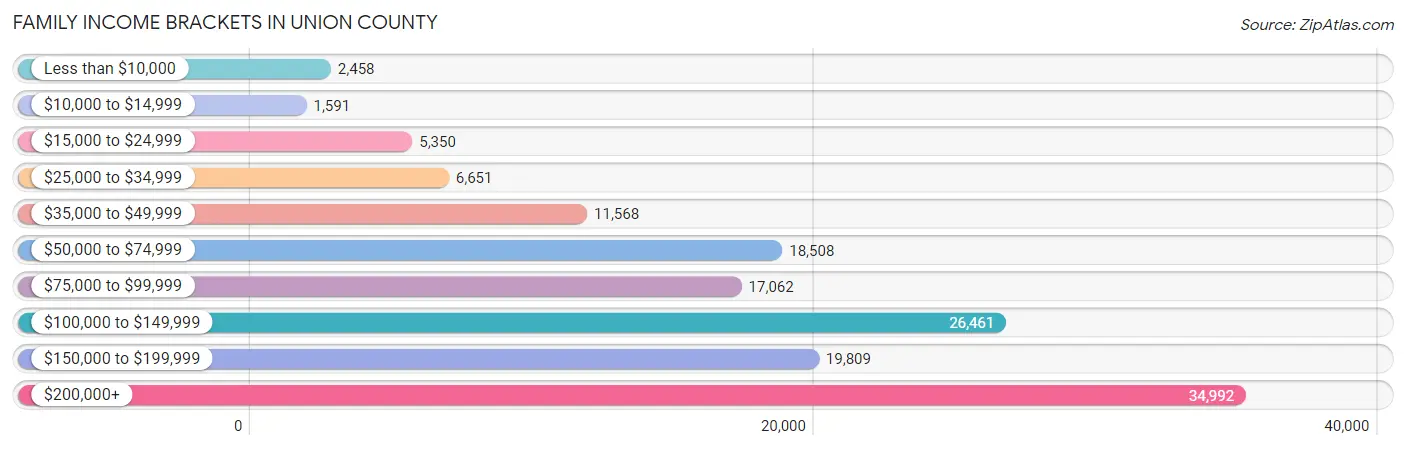
Family Income Brackets in Union County
According to the Union County family income data, there are 34,992 families falling into the $200,000+ income range, which is the most common income bracket and makes up 24.2% of all families. Conversely, the $10,000 to $14,999 income bracket is the least frequent group with only 1,591 families (1.1%) belonging to this category.
| Income Bracket | # Families | % Families |
| Less than $10,000 | 2,458 | 1.7% |
| $10,000 to $14,999 | 1,591 | 1.1% |
| $15,000 to $24,999 | 5,350 | 3.7% |
| $25,000 to $34,999 | 6,651 | 4.6% |
| $35,000 to $49,999 | 11,568 | 8.0% |
| $50,000 to $74,999 | 18,508 | 12.8% |
| $75,000 to $99,999 | 17,062 | 11.8% |
| $100,000 to $149,999 | 26,461 | 18.3% |
| $150,000 to $199,999 | 19,809 | 13.7% |
| $200,000+ | 34,992 | 24.2% |
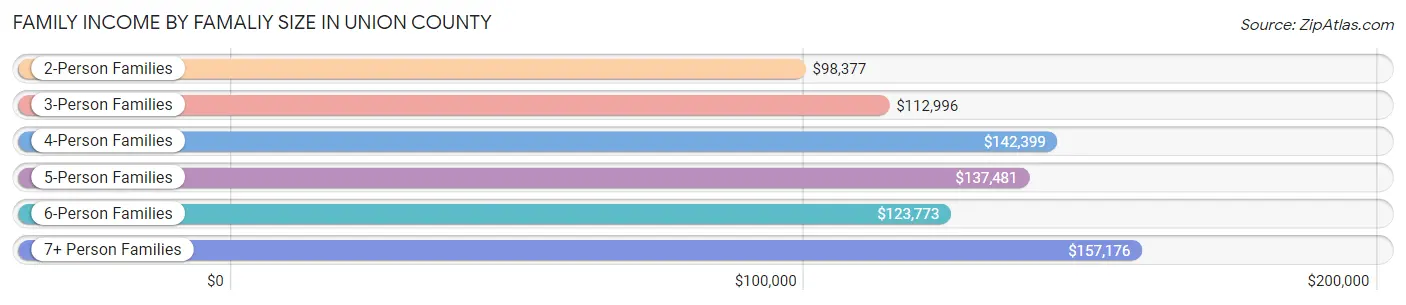
Family Income by Famaliy Size in Union County
7+ person families (2,685 | 1.9%) account for the highest median family income in Union County with $157,176 per family, while 2-person families (53,118 | 36.7%) have the highest median income of $49,188 per family member.
| Income Bracket | # Families | Median Income |
| 2-Person Families | 53,118 (36.7%) | $98,377 |
| 3-Person Families | 35,657 (24.7%) | $112,996 |
| 4-Person Families | 33,736 (23.3%) | $142,399 |
| 5-Person Families | 14,224 (9.8%) | $137,481 |
| 6-Person Families | 5,174 (3.6%) | $123,773 |
| 7+ Person Families | 2,685 (1.9%) | $157,176 |
| Total | 144,594 (100.0%) | $115,612 |
Family Income by Number of Earners in Union County
The median family income in Union County is $115,612, with families comprising 3+ earners (23,681) having the highest median family income of $169,609, while families with no earners (12,717) have the lowest median family income of $50,231, accounting for 16.4% and 8.8% of families, respectively.
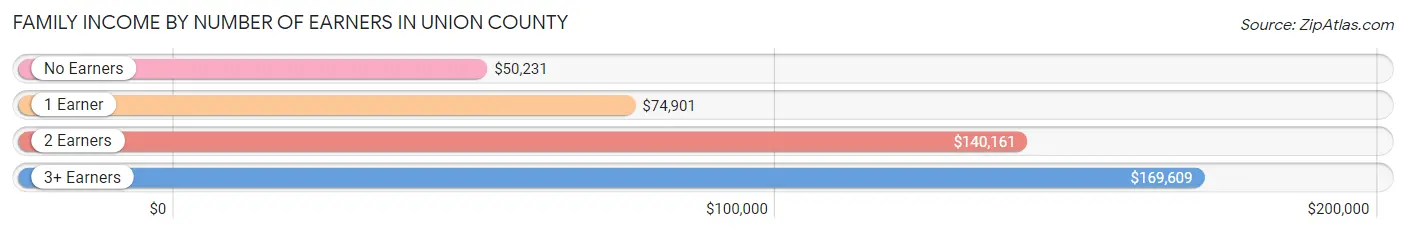
| Number of Earners | # Families | Median Income |
| No Earners | 12,717 (8.8%) | $50,231 |
| 1 Earner | 43,380 (30.0%) | $74,901 |
| 2 Earners | 64,816 (44.8%) | $140,161 |
| 3+ Earners | 23,681 (16.4%) | $169,609 |
| Total | 144,594 (100.0%) | $115,612 |
Household Income in Union County
Household Income Brackets in Union County
With 38,999 households falling in the category, the $200,000+ income range is the most frequent in Union County, accounting for 19.5% of all households. In contrast, only 5,200 households (2.6%) fall into the $10,000 to $14,999 income bracket, making it the least populous group.
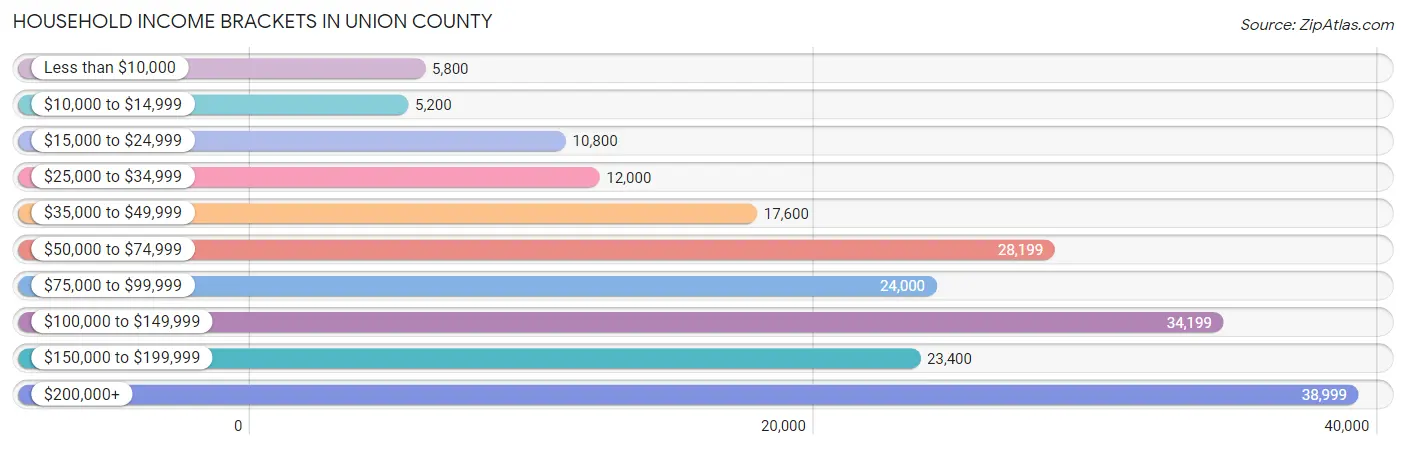
| Income Bracket | # Households | % Households |
| Less than $10,000 | 5,800 | 2.9% |
| $10,000 to $14,999 | 5,200 | 2.6% |
| $15,000 to $24,999 | 10,800 | 5.4% |
| $25,000 to $34,999 | 12,000 | 6.0% |
| $35,000 to $49,999 | 17,600 | 8.8% |
| $50,000 to $74,999 | 28,199 | 14.1% |
| $75,000 to $99,999 | 24,000 | 12.0% |
| $100,000 to $149,999 | 34,199 | 17.1% |
| $150,000 to $199,999 | 23,400 | 11.7% |
| $200,000+ | 38,999 | 19.5% |
Household Income by Householder Age in Union County
The median household income in Union County is $95,000, with the highest median household income of $115,645 found in the 45 to 64 years age bracket for the primary householder. A total of 83,470 households (41.7%) fall into this category. Meanwhile, the 15 to 24 years age bracket for the primary householder has the lowest median household income of $51,940, with 2,932 households (1.5%) in this group.
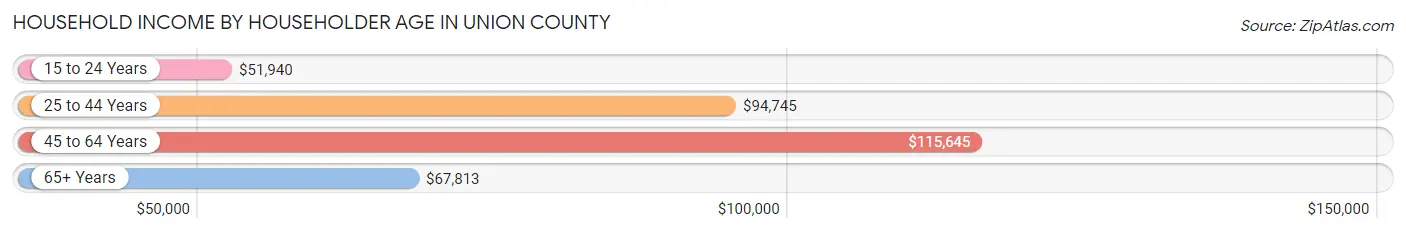
| Income Bracket | # Households | Median Income |
| 15 to 24 Years | 2,932 (1.5%) | $51,940 |
| 25 to 44 Years | 63,811 (31.9%) | $94,745 |
| 45 to 64 Years | 83,470 (41.7%) | $115,645 |
| 65+ Years | 49,783 (24.9%) | $67,813 |
| Total | 199,996 (100.0%) | $95,000 |
Poverty in Union County
Income Below Poverty by Sex and Age in Union County
With 8.1% poverty level for males and 9.6% for females among the residents of Union County, 5 year old males and 12 to 14 year old females are the most vulnerable to poverty, with 658 males (16.4%) and 1,485 females (13.0%) in their respective age groups living below the poverty level.
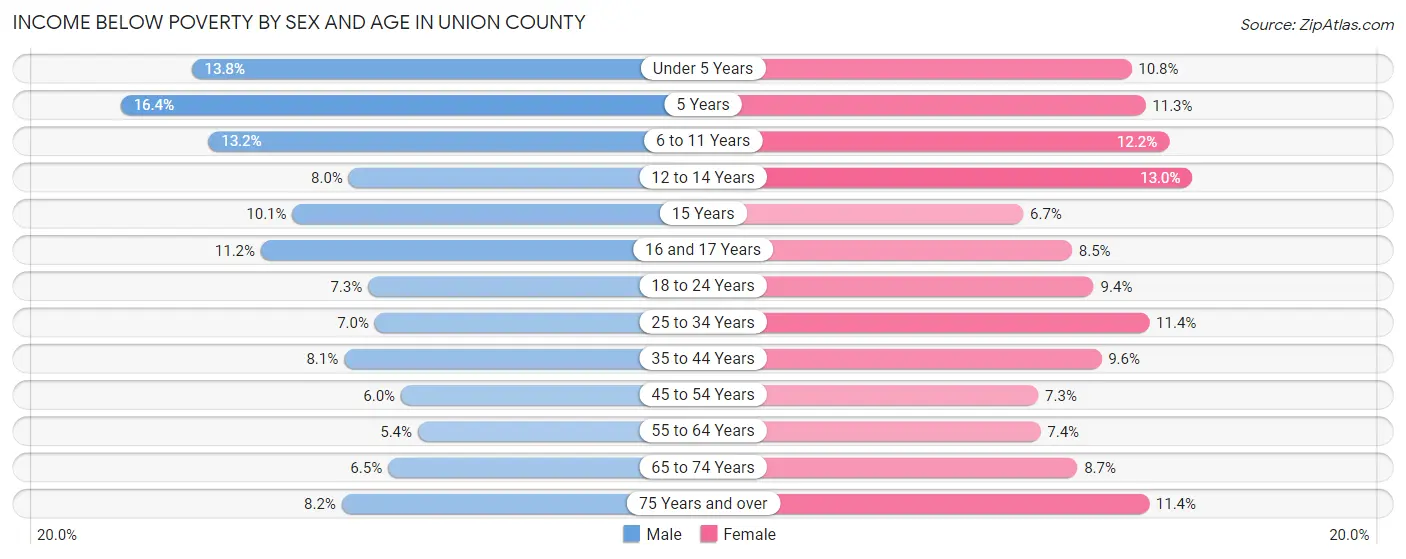
| Age Bracket | Male | Female |
| Under 5 Years | 2,441 (13.8%) | 1,810 (10.7%) |
| 5 Years | 658 (16.4%) | 367 (11.3%) |
| 6 to 11 Years | 2,850 (13.2%) | 2,667 (12.1%) |
| 12 to 14 Years | 957 (8.0%) | 1,485 (13.0%) |
| 15 Years | 377 (10.1%) | 273 (6.7%) |
| 16 and 17 Years | 906 (11.2%) | 613 (8.5%) |
| 18 to 24 Years | 1,770 (7.2%) | 2,178 (9.3%) |
| 25 to 34 Years | 2,518 (7.0%) | 4,020 (11.4%) |
| 35 to 44 Years | 3,242 (8.1%) | 3,816 (9.6%) |
| 45 to 54 Years | 2,389 (6.0%) | 2,890 (7.3%) |
| 55 to 64 Years | 1,983 (5.4%) | 2,788 (7.4%) |
| 65 to 74 Years | 1,437 (6.5%) | 2,248 (8.7%) |
| 75 Years and over | 1,095 (8.2%) | 2,352 (11.4%) |
| Total | 22,623 (8.1%) | 27,507 (9.6%) |
Income Above Poverty by Sex and Age in Union County
According to the poverty statistics in Union County, males aged 55 to 64 years and females aged 15 years are the age groups that are most secure financially, with 94.6% of males and 93.3% of females in these age groups living above the poverty line.
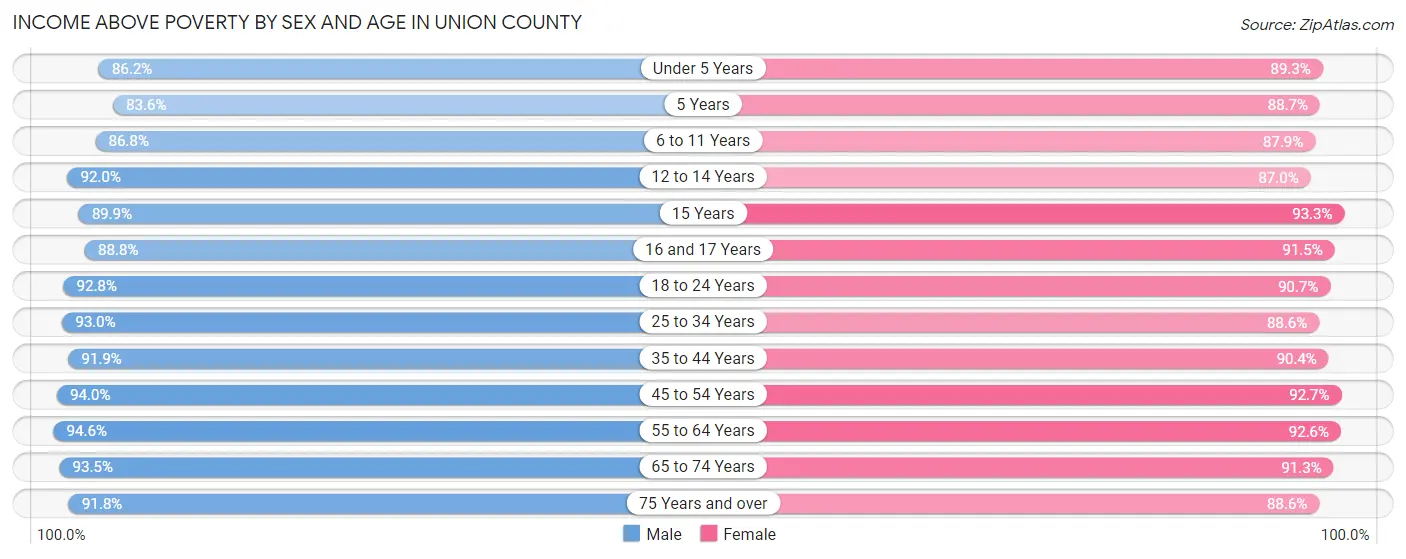
| Age Bracket | Male | Female |
| Under 5 Years | 15,253 (86.2%) | 15,029 (89.2%) |
| 5 Years | 3,347 (83.6%) | 2,888 (88.7%) |
| 6 to 11 Years | 18,766 (86.8%) | 19,280 (87.8%) |
| 12 to 14 Years | 11,053 (92.0%) | 9,925 (87.0%) |
| 15 Years | 3,372 (89.9%) | 3,781 (93.3%) |
| 16 and 17 Years | 7,159 (88.8%) | 6,565 (91.5%) |
| 18 to 24 Years | 22,649 (92.7%) | 21,117 (90.6%) |
| 25 to 34 Years | 33,465 (93.0%) | 31,211 (88.6%) |
| 35 to 44 Years | 36,587 (91.9%) | 35,812 (90.4%) |
| 45 to 54 Years | 37,233 (94.0%) | 36,742 (92.7%) |
| 55 to 64 Years | 34,709 (94.6%) | 35,020 (92.6%) |
| 65 to 74 Years | 20,620 (93.5%) | 23,470 (91.3%) |
| 75 Years and over | 12,209 (91.8%) | 18,287 (88.6%) |
| Total | 256,422 (91.9%) | 259,127 (90.4%) |
Income Below Poverty Among Married-Couple Families in Union County
The poverty statistics for married-couple families in Union County show that 3.3% or 3,306 of the total 101,082 families live below the poverty line. Families with 5 or more children have the highest poverty rate of 29.9%, comprising of 130 families. On the other hand, families with no children have the lowest poverty rate of 2.5%, which includes 1,285 families.
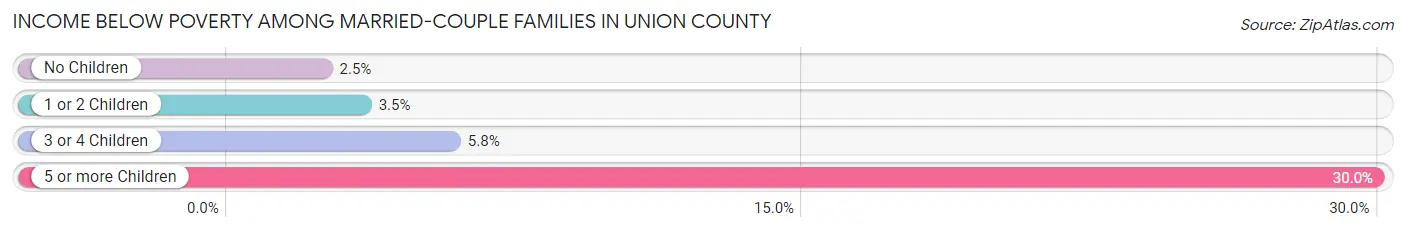
| Children | Above Poverty | Below Poverty |
| No Children | 50,751 (97.5%) | 1,285 (2.5%) |
| 1 or 2 Children | 38,895 (96.5%) | 1,407 (3.5%) |
| 3 or 4 Children | 7,826 (94.2%) | 484 (5.8%) |
| 5 or more Children | 304 (70.1%) | 130 (29.9%) |
| Total | 97,776 (96.7%) | 3,306 (3.3%) |
Income Below Poverty Among Single-Parent Households in Union County
According to the poverty data in Union County, 10.4% or 1,395 single-father households and 14.1% or 4,226 single-mother households are living below the poverty line. Among single-father households, those with 3 or 4 children have the highest poverty rate, with 539 households (42.6%) experiencing poverty. Likewise, among single-mother households, those with 5 or more children have the highest poverty rate, with 83 households (75.4%) falling below the poverty line.
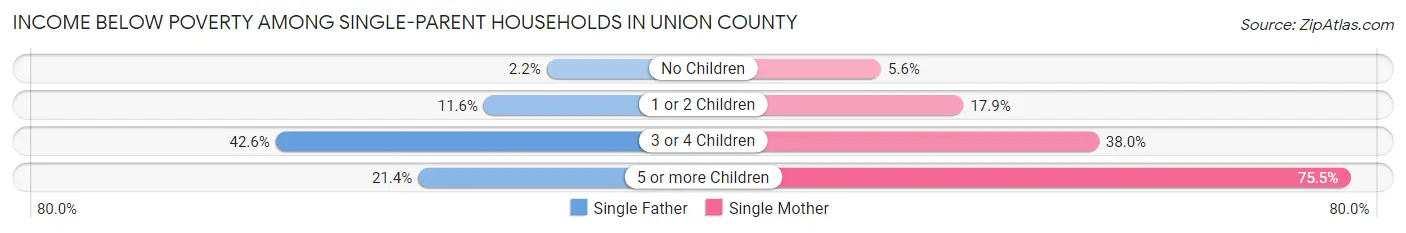
| Children | Single Father | Single Mother |
| No Children | 135 (2.2%) | 767 (5.6%) |
| 1 or 2 Children | 696 (11.6%) | 2,461 (17.8%) |
| 3 or 4 Children | 539 (42.6%) | 915 (38.0%) |
| 5 or more Children | 25 (21.4%) | 83 (75.4%) |
| Total | 1,395 (10.4%) | 4,226 (14.1%) |
Income Below Poverty Among Married-Couple vs Single-Parent Households in Union County
The poverty data for Union County shows that 3,306 of the married-couple family households (3.3%) and 5,621 of the single-parent households (12.9%) are living below the poverty level. Within the married-couple family households, those with 5 or more children have the highest poverty rate, with 130 households (29.9%) falling below the poverty line. Among the single-parent households, those with 5 or more children have the highest poverty rate, with 108 household (47.6%) living below poverty.

| Children | Married-Couple Families | Single-Parent Households |
| No Children | 1,285 (2.5%) | 902 (4.5%) |
| 1 or 2 Children | 1,407 (3.5%) | 3,157 (16.0%) |
| 3 or 4 Children | 484 (5.8%) | 1,454 (39.6%) |
| 5 or more Children | 130 (29.9%) | 108 (47.6%) |
| Total | 3,306 (3.3%) | 5,621 (12.9%) |
Employment Characteristics in Union County
Employment by Class of Employer in Union County
Among the 285,292 employed individuals in Union County, private company employees (205,458 | 72.0%), local government employees (21,952 | 7.7%), and not-for-profit organizations (17,700 | 6.2%) make up the most common classes of employment.
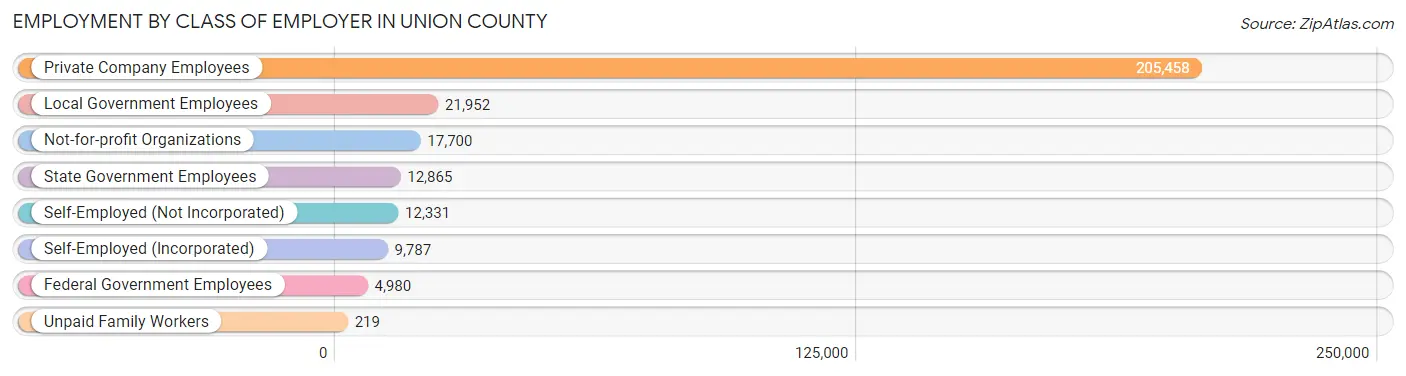
| Employer Class | # Employees | % Employees |
| Private Company Employees | 205,458 | 72.0% |
| Self-Employed (Incorporated) | 9,787 | 3.4% |
| Self-Employed (Not Incorporated) | 12,331 | 4.3% |
| Not-for-profit Organizations | 17,700 | 6.2% |
| Local Government Employees | 21,952 | 7.7% |
| State Government Employees | 12,865 | 4.5% |
| Federal Government Employees | 4,980 | 1.8% |
| Unpaid Family Workers | 219 | 0.1% |
| Total | 285,292 | 100.0% |
Employment Status by Age in Union County
According to the labor force statistics for Union County, out of the total population over 16 years of age (453,679), 68.8% or 312,131 individuals are in the labor force, with 6.2% or 19,352 of them unemployed. The age group with the highest labor force participation rate is 35 to 44 years, with 87.4% or 69,597 individuals in the labor force. Within the labor force, the 16 to 19 years age range has the highest percentage of unemployed individuals, with 21.0% or 1,872 of them being unemployed.
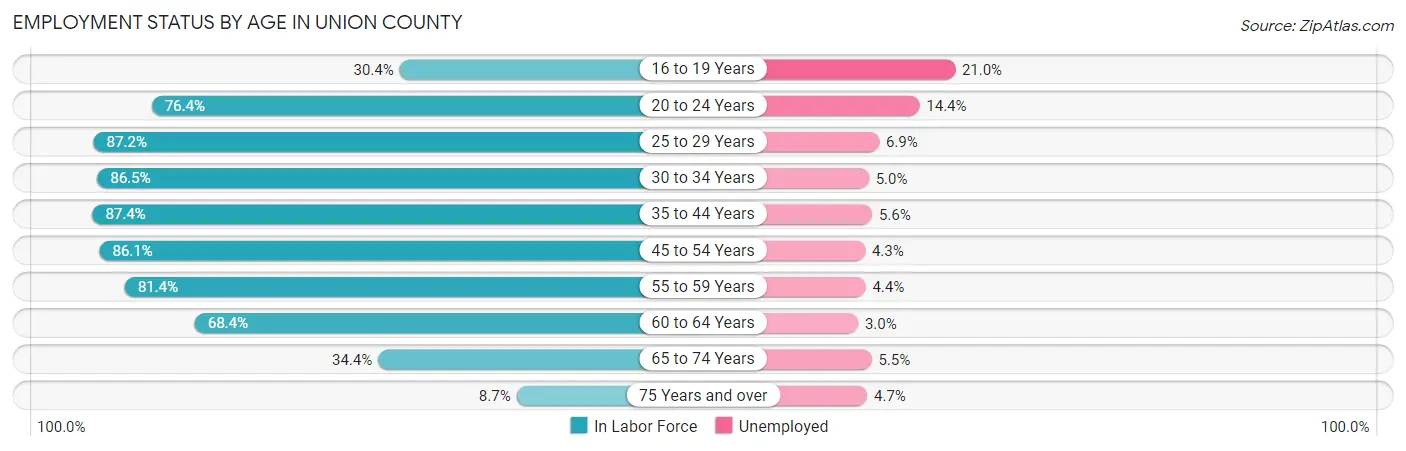
| Age Bracket | In Labor Force | Unemployed |
| 16 to 19 Years | 8,916 (30.4%) | 1,872 (21.0%) |
| 20 to 24 Years | 26,788 (76.4%) | 3,857 (14.4%) |
| 25 to 29 Years | 30,080 (87.2%) | 2,076 (6.9%) |
| 30 to 34 Years | 31,955 (86.5%) | 1,598 (5.0%) |
| 35 to 44 Years | 69,597 (87.4%) | 3,897 (5.6%) |
| 45 to 54 Years | 68,478 (86.1%) | 2,945 (4.3%) |
| 55 to 59 Years | 33,530 (81.4%) | 1,475 (4.4%) |
| 60 to 64 Years | 23,130 (68.4%) | 694 (3.0%) |
| 65 to 74 Years | 16,635 (34.4%) | 915 (5.5%) |
| 75 Years and over | 3,073 (8.7%) | 144 (4.7%) |
| Total | 312,131 (68.8%) | 19,352 (6.2%) |
Employment Status by Educational Attainment in Union County
According to labor force statistics for Union County, 84.0% of individuals (256,711) out of the total population between 25 and 64 years of age (305,608) are in the labor force, with 4.9% or 12,579 of them being unemployed. The group with the highest labor force participation rate are those with the educational attainment of bachelor's degree or higher, with 89.0% or 109,496 individuals in the labor force. Within the labor force, individuals with high school diploma education have the highest percentage of unemployment, with 6.4% or 3,955 of them being unemployed.
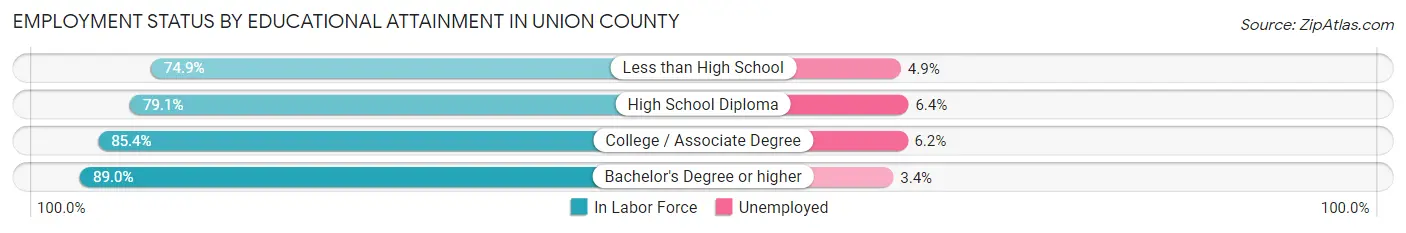
| Educational Attainment | In Labor Force | Unemployed |
| Less than High School | 26,971 (74.9%) | 1,764 (4.9%) |
| High School Diploma | 61,798 (79.1%) | 5,000 (6.4%) |
| College / Associate Degree | 58,451 (85.4%) | 4,244 (6.2%) |
| Bachelor's Degree or higher | 109,496 (89.0%) | 4,183 (3.4%) |
| Total | 256,711 (84.0%) | 14,975 (4.9%) |
Employment Occupations by Sex in Union County
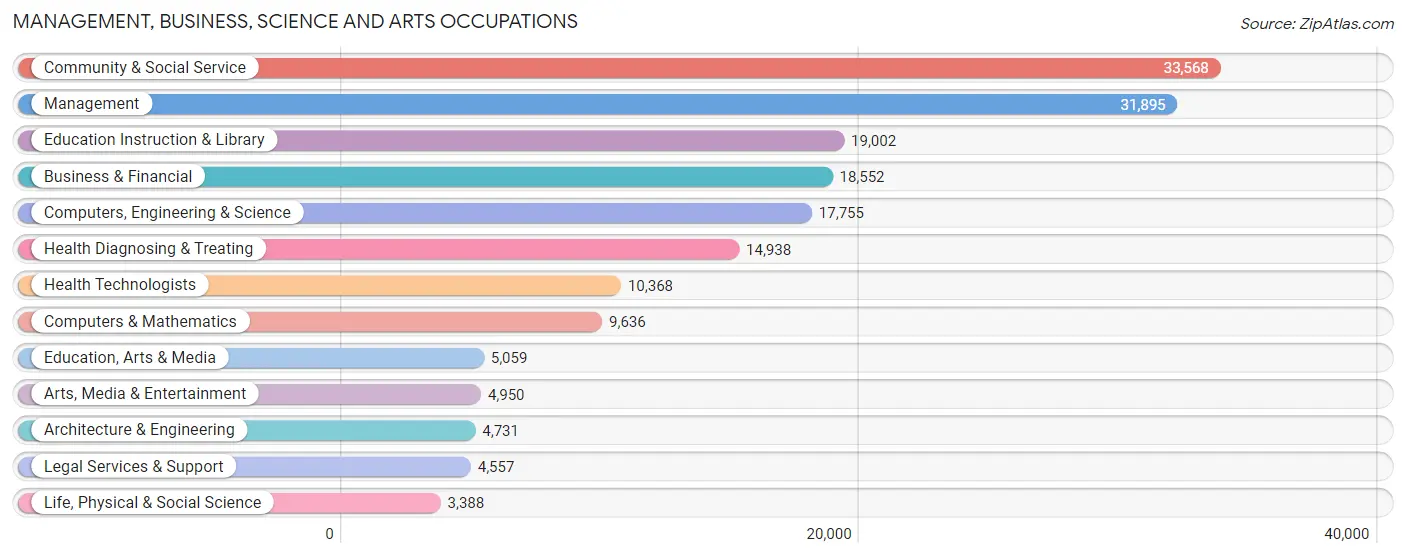
Management, Business, Science and Arts Occupations
The most common Management, Business, Science and Arts occupations in Union County are Community & Social Service (33,568 | 11.5%), Management (31,895 | 10.9%), Education Instruction & Library (19,002 | 6.5%), Business & Financial (18,552 | 6.3%), and Computers, Engineering & Science (17,755 | 6.1%).
Management, Business, Science and Arts Occupations by Sex
Within the Management, Business, Science and Arts occupations in Union County, the most male-oriented occupations are Architecture & Engineering (86.3%), Computers & Mathematics (72.1%), and Computers, Engineering & Science (70.3%), while the most female-oriented occupations are Health Technologists (77.2%), Education Instruction & Library (76.9%), and Health Diagnosing & Treating (76.6%).
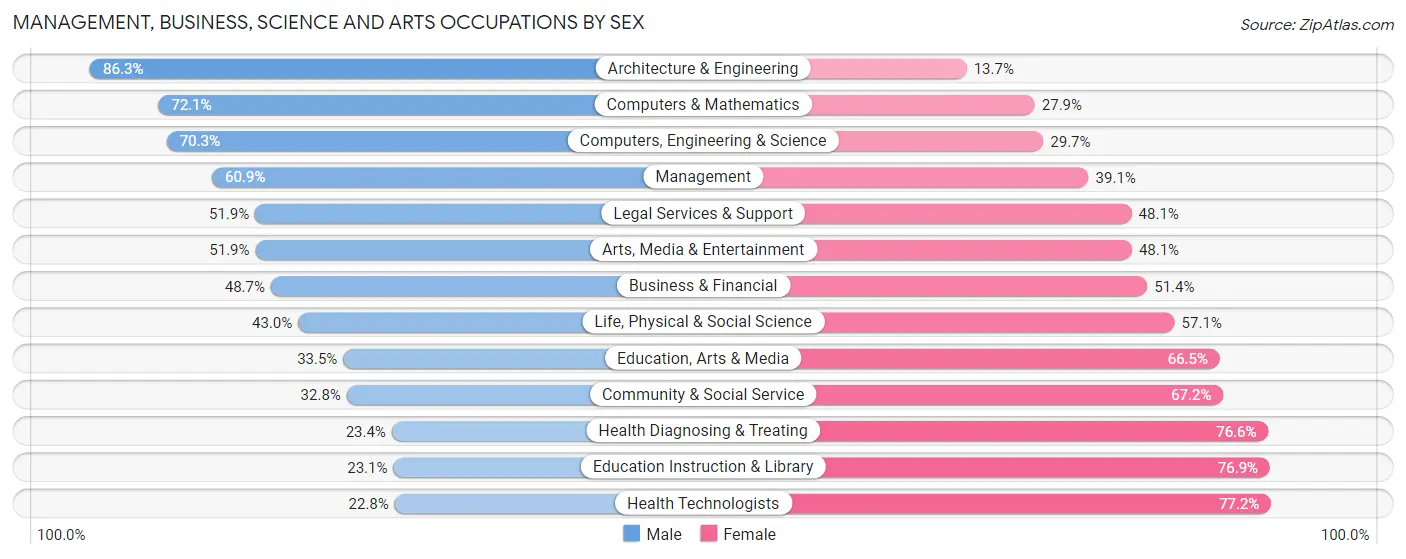
| Occupation | Male | Female |
| Management | 19,420 (60.9%) | 12,475 (39.1%) |
| Business & Financial | 9,025 (48.6%) | 9,527 (51.3%) |
| Computers, Engineering & Science | 12,488 (70.3%) | 5,267 (29.7%) |
| Computers & Mathematics | 6,949 (72.1%) | 2,687 (27.9%) |
| Architecture & Engineering | 4,084 (86.3%) | 647 (13.7%) |
| Life, Physical & Social Science | 1,455 (42.9%) | 1,933 (57.1%) |
| Community & Social Service | 11,017 (32.8%) | 22,551 (67.2%) |
| Education, Arts & Media | 1,697 (33.5%) | 3,362 (66.5%) |
| Legal Services & Support | 2,366 (51.9%) | 2,191 (48.1%) |
| Education Instruction & Library | 4,387 (23.1%) | 14,615 (76.9%) |
| Arts, Media & Entertainment | 2,567 (51.9%) | 2,383 (48.1%) |
| Health Diagnosing & Treating | 3,498 (23.4%) | 11,440 (76.6%) |
| Health Technologists | 2,366 (22.8%) | 8,002 (77.2%) |
| Total (Category) | 55,448 (47.5%) | 61,260 (52.5%) |
| Total (Overall) | 155,628 (53.2%) | 136,865 (46.8%) |
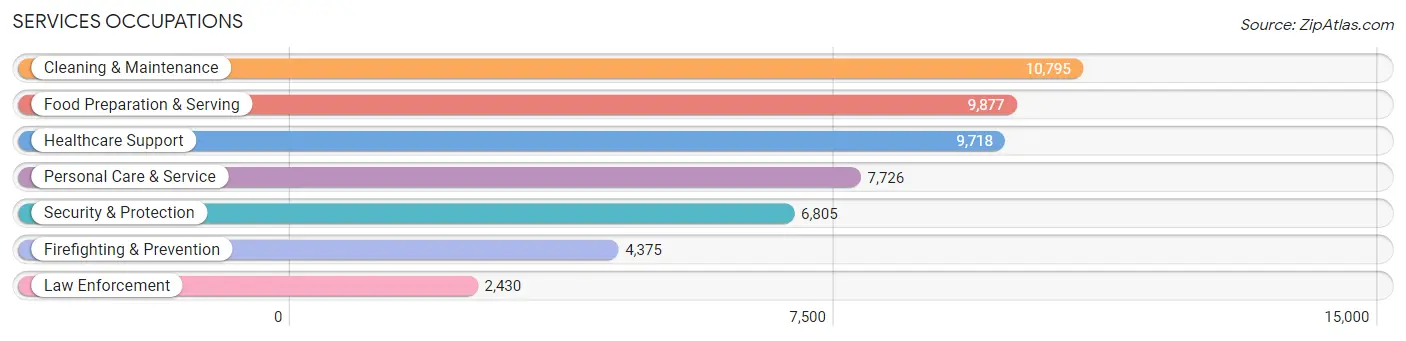
Services Occupations
The most common Services occupations in Union County are Cleaning & Maintenance (10,795 | 3.7%), Food Preparation & Serving (9,877 | 3.4%), Healthcare Support (9,718 | 3.3%), Personal Care & Service (7,726 | 2.6%), and Security & Protection (6,805 | 2.3%).
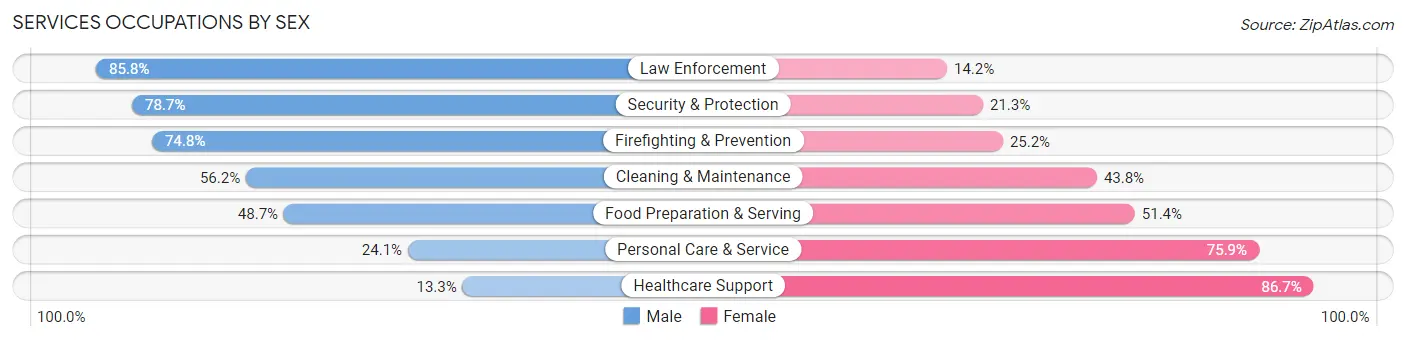
Services Occupations by Sex
Within the Services occupations in Union County, the most male-oriented occupations are Law Enforcement (85.8%), Security & Protection (78.7%), and Firefighting & Prevention (74.8%), while the most female-oriented occupations are Healthcare Support (86.7%), Personal Care & Service (75.9%), and Food Preparation & Serving (51.3%).
| Occupation | Male | Female |
| Healthcare Support | 1,290 (13.3%) | 8,428 (86.7%) |
| Security & Protection | 5,357 (78.7%) | 1,448 (21.3%) |
| Firefighting & Prevention | 3,271 (74.8%) | 1,104 (25.2%) |
| Law Enforcement | 2,086 (85.8%) | 344 (14.2%) |
| Food Preparation & Serving | 4,805 (48.6%) | 5,072 (51.3%) |
| Cleaning & Maintenance | 6,062 (56.2%) | 4,733 (43.8%) |
| Personal Care & Service | 1,862 (24.1%) | 5,864 (75.9%) |
| Total (Category) | 19,376 (43.1%) | 25,545 (56.9%) |
| Total (Overall) | 155,628 (53.2%) | 136,865 (46.8%) |
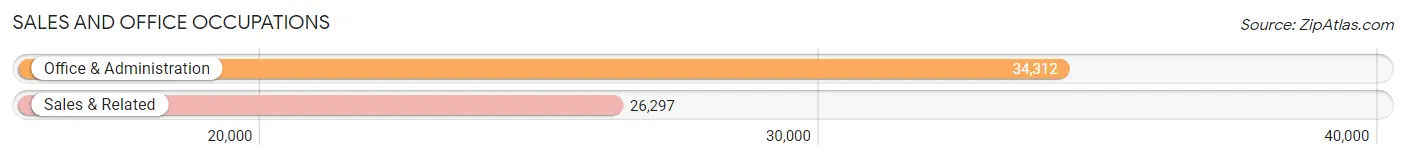
Sales and Office Occupations
The most common Sales and Office occupations in Union County are Office & Administration (34,312 | 11.7%), and Sales & Related (26,297 | 9.0%).
Sales and Office Occupations by Sex
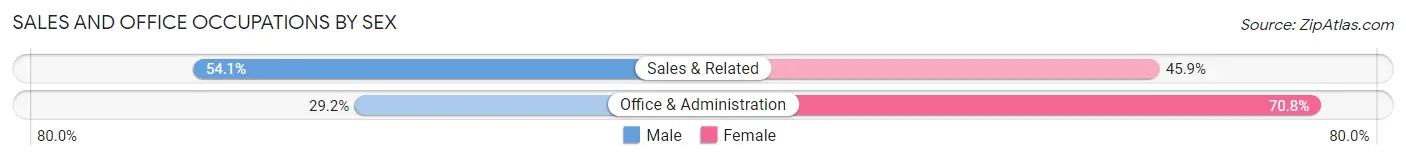
| Occupation | Male | Female |
| Sales & Related | 14,230 (54.1%) | 12,067 (45.9%) |
| Office & Administration | 10,007 (29.2%) | 24,305 (70.8%) |
| Total (Category) | 24,237 (40.0%) | 36,372 (60.0%) |
| Total (Overall) | 155,628 (53.2%) | 136,865 (46.8%) |
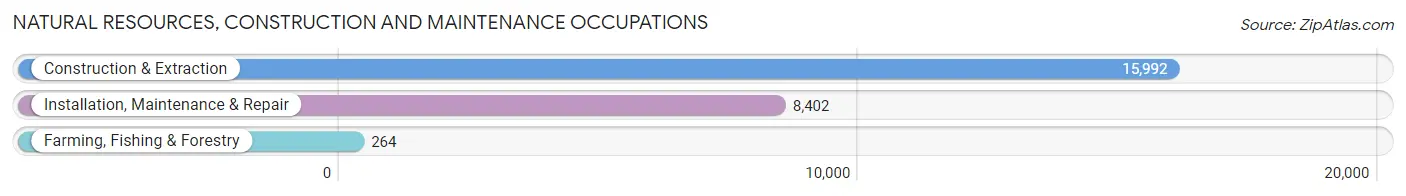
Natural Resources, Construction and Maintenance Occupations
The most common Natural Resources, Construction and Maintenance occupations in Union County are Construction & Extraction (15,992 | 5.5%), Installation, Maintenance & Repair (8,402 | 2.9%), and Farming, Fishing & Forestry (264 | 0.1%).
Natural Resources, Construction and Maintenance Occupations by Sex
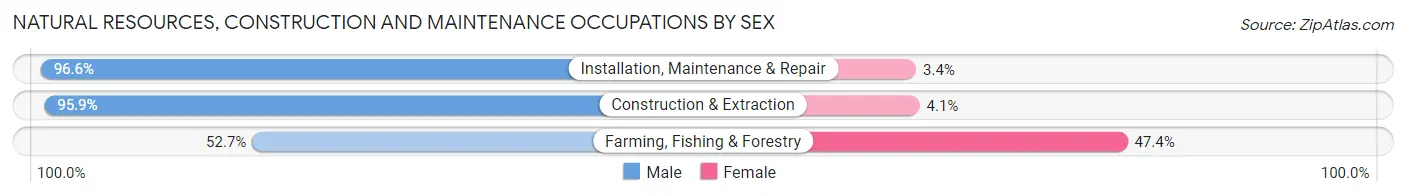
| Occupation | Male | Female |
| Farming, Fishing & Forestry | 139 (52.6%) | 125 (47.3%) |
| Construction & Extraction | 15,336 (95.9%) | 656 (4.1%) |
| Installation, Maintenance & Repair | 8,120 (96.6%) | 282 (3.4%) |
| Total (Category) | 23,595 (95.7%) | 1,063 (4.3%) |
| Total (Overall) | 155,628 (53.2%) | 136,865 (46.8%) |
Production, Transportation and Moving Occupations
The most common Production, Transportation and Moving occupations in Union County are Transportation (17,178 | 5.9%), Material Moving (14,447 | 4.9%), and Production (13,972 | 4.8%).

Production, Transportation and Moving Occupations by Sex

| Occupation | Male | Female |
| Production | 8,866 (63.5%) | 5,106 (36.5%) |
| Transportation | 14,718 (85.7%) | 2,460 (14.3%) |
| Material Moving | 9,388 (65.0%) | 5,059 (35.0%) |
| Total (Category) | 32,972 (72.3%) | 12,625 (27.7%) |
| Total (Overall) | 155,628 (53.2%) | 136,865 (46.8%) |
Employment Industries by Sex in Union County
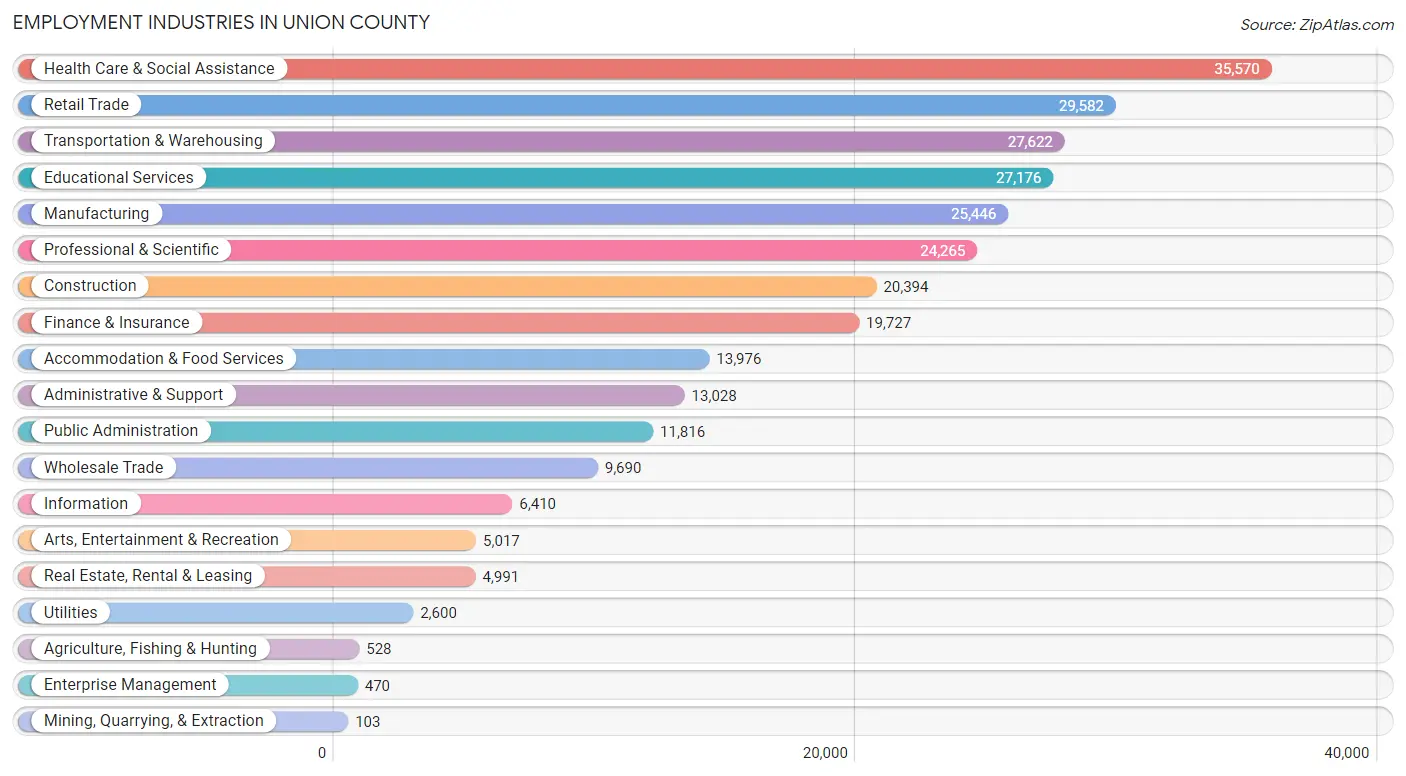
Employment Industries in Union County
The major employment industries in Union County include Health Care & Social Assistance (35,570 | 12.2%), Retail Trade (29,582 | 10.1%), Transportation & Warehousing (27,622 | 9.4%), Educational Services (27,176 | 9.3%), and Manufacturing (25,446 | 8.7%).
Employment Industries by Sex in Union County
The Union County industries that see more men than women are Construction (92.7%), Utilities (85.5%), and Mining, Quarrying, & Extraction (80.6%), whereas the industries that tend to have a higher number of women are Health Care & Social Assistance (79.6%), Educational Services (71.2%), and Agriculture, Fishing & Hunting (59.5%).
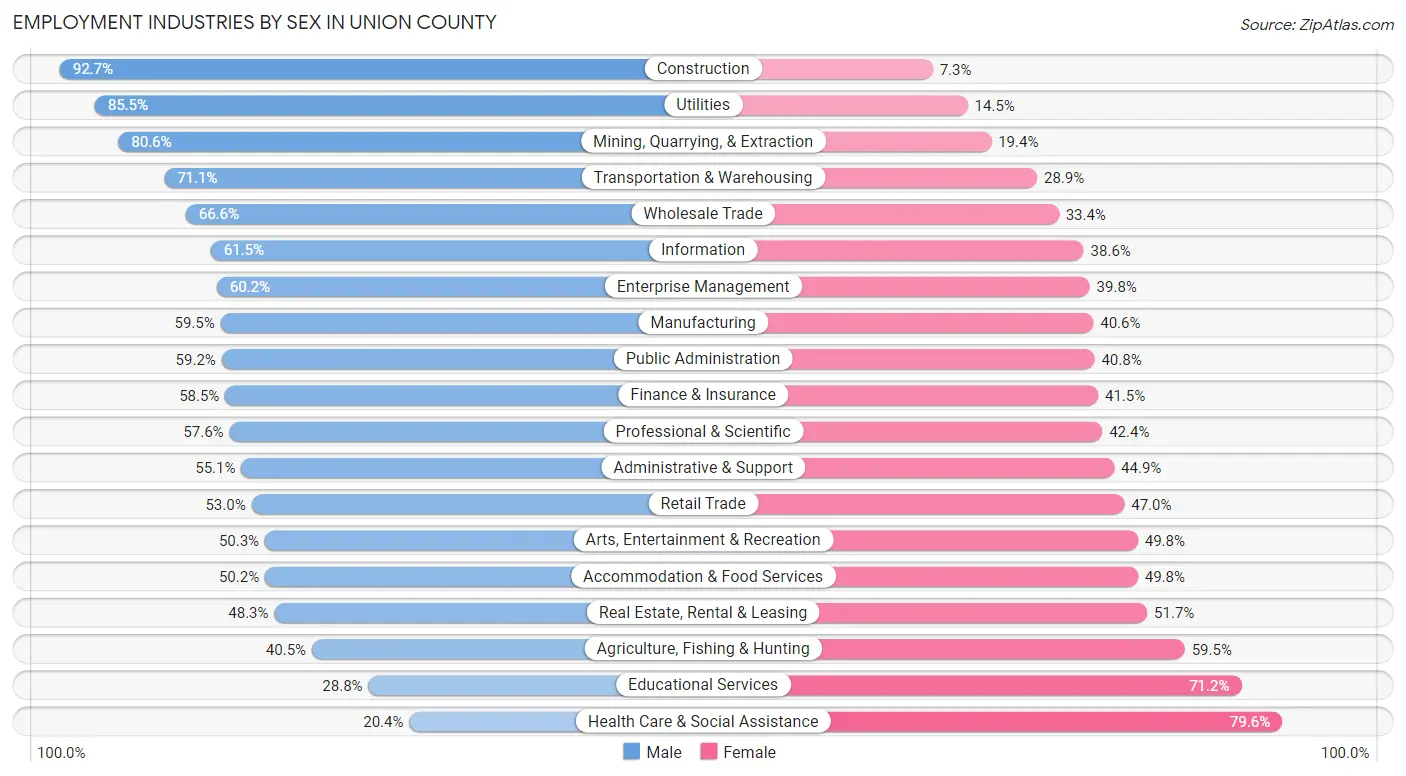
| Industry | Male | Female |
| Agriculture, Fishing & Hunting | 214 (40.5%) | 314 (59.5%) |
| Mining, Quarrying, & Extraction | 83 (80.6%) | 20 (19.4%) |
| Construction | 18,906 (92.7%) | 1,488 (7.3%) |
| Manufacturing | 15,127 (59.5%) | 10,319 (40.6%) |
| Wholesale Trade | 6,455 (66.6%) | 3,235 (33.4%) |
| Retail Trade | 15,690 (53.0%) | 13,892 (47.0%) |
| Transportation & Warehousing | 19,640 (71.1%) | 7,982 (28.9%) |
| Utilities | 2,222 (85.5%) | 378 (14.5%) |
| Information | 3,939 (61.5%) | 2,471 (38.6%) |
| Finance & Insurance | 11,537 (58.5%) | 8,190 (41.5%) |
| Real Estate, Rental & Leasing | 2,411 (48.3%) | 2,580 (51.7%) |
| Professional & Scientific | 13,979 (57.6%) | 10,286 (42.4%) |
| Enterprise Management | 283 (60.2%) | 187 (39.8%) |
| Administrative & Support | 7,184 (55.1%) | 5,844 (44.9%) |
| Educational Services | 7,837 (28.8%) | 19,339 (71.2%) |
| Health Care & Social Assistance | 7,249 (20.4%) | 28,321 (79.6%) |
| Arts, Entertainment & Recreation | 2,521 (50.2%) | 2,496 (49.7%) |
| Accommodation & Food Services | 7,022 (50.2%) | 6,954 (49.8%) |
| Public Administration | 6,996 (59.2%) | 4,820 (40.8%) |
| Total | 155,628 (53.2%) | 136,865 (46.8%) |
Education in Union County
School Enrollment in Union County
The most common levels of schooling among the 143,350 students in Union County are middle school (31,009 | 21.6%), high school (29,718 | 20.7%), and college / undergraduate (28,253 | 19.7%).
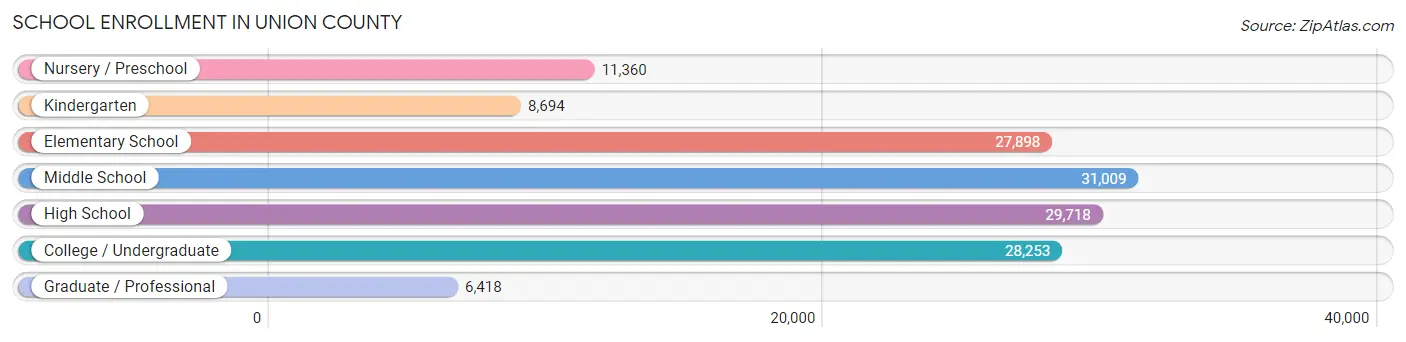
| School Level | # Students | % Students |
| Nursery / Preschool | 11,360 | 7.9% |
| Kindergarten | 8,694 | 6.1% |
| Elementary School | 27,898 | 19.5% |
| Middle School | 31,009 | 21.6% |
| High School | 29,718 | 20.7% |
| College / Undergraduate | 28,253 | 19.7% |
| Graduate / Professional | 6,418 | 4.5% |
| Total | 143,350 | 100.0% |
School Enrollment by Age by Funding Source in Union County
Out of a total of 143,350 students who are enrolled in schools in Union County, 22,076 (15.4%) attend a private institution, while the remaining 121,274 (84.6%) are enrolled in public schools. The age group of 35 years and over has the highest likelihood of being enrolled in private schools, with 2,500 (39.0% in the age bracket) enrolled. Conversely, the age group of 10 to 14 year olds has the lowest likelihood of being enrolled in a private school, with 35,012 (93.7% in the age bracket) attending a public institution.
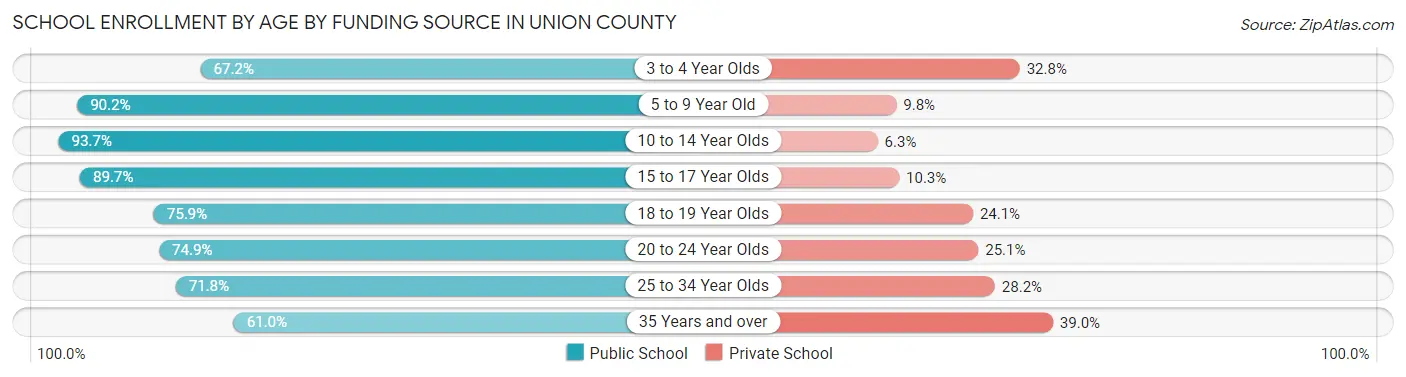
| Age Bracket | Public School | Private School |
| 3 to 4 Year Olds | 6,648 (67.2%) | 3,243 (32.8%) |
| 5 to 9 Year Old | 31,642 (90.2%) | 3,443 (9.8%) |
| 10 to 14 Year Olds | 35,012 (93.7%) | 2,367 (6.3%) |
| 15 to 17 Year Olds | 20,001 (89.7%) | 2,304 (10.3%) |
| 18 to 19 Year Olds | 8,202 (75.9%) | 2,601 (24.1%) |
| 20 to 24 Year Olds | 11,219 (74.9%) | 3,754 (25.1%) |
| 25 to 34 Year Olds | 4,668 (71.8%) | 1,831 (28.2%) |
| 35 Years and over | 3,915 (61.0%) | 2,500 (39.0%) |
| Total | 121,274 (84.6%) | 22,076 (15.4%) |
Educational Attainment by Field of Study in Union County
Business (36,351 | 22.8%), education (16,159 | 10.1%), social sciences (15,984 | 10.0%), science & technology (13,111 | 8.2%), and engineering (11,962 | 7.5%) are the most common fields of study among 159,671 individuals in Union County who have obtained a bachelor's degree or higher.
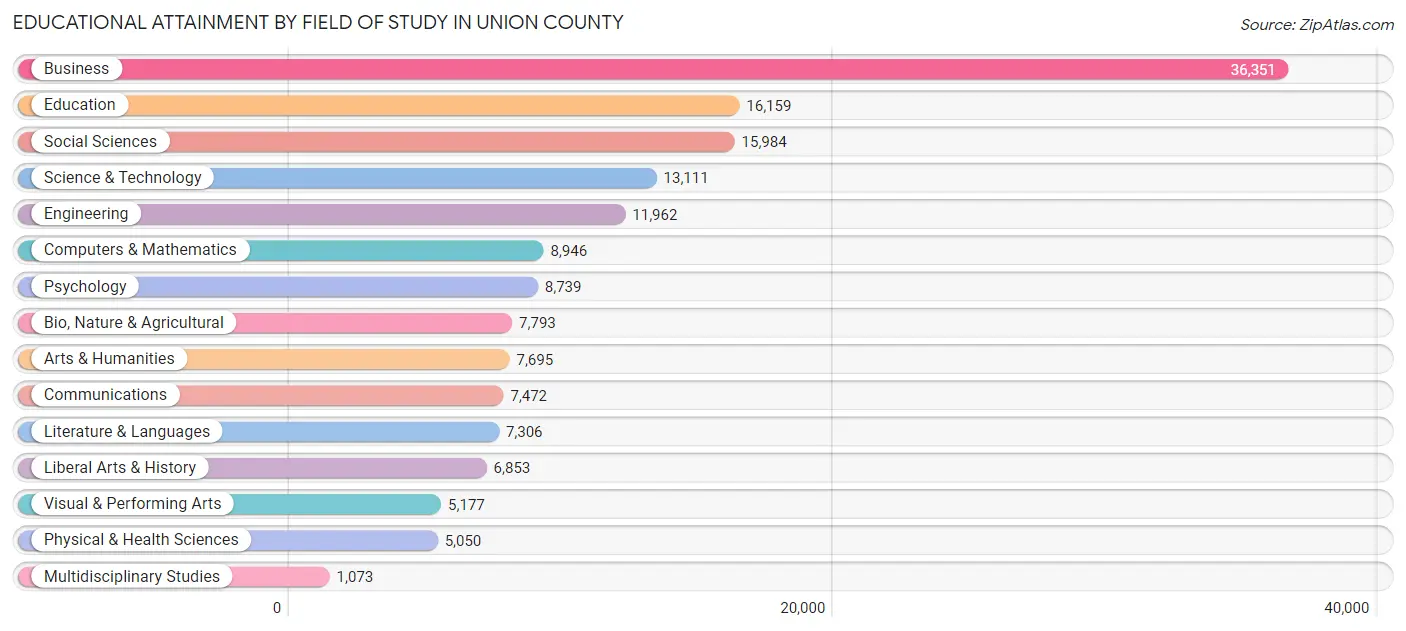
| Field of Study | # Graduates | % Graduates |
| Computers & Mathematics | 8,946 | 5.6% |
| Bio, Nature & Agricultural | 7,793 | 4.9% |
| Physical & Health Sciences | 5,050 | 3.2% |
| Psychology | 8,739 | 5.5% |
| Social Sciences | 15,984 | 10.0% |
| Engineering | 11,962 | 7.5% |
| Multidisciplinary Studies | 1,073 | 0.7% |
| Science & Technology | 13,111 | 8.2% |
| Business | 36,351 | 22.8% |
| Education | 16,159 | 10.1% |
| Literature & Languages | 7,306 | 4.6% |
| Liberal Arts & History | 6,853 | 4.3% |
| Visual & Performing Arts | 5,177 | 3.2% |
| Communications | 7,472 | 4.7% |
| Arts & Humanities | 7,695 | 4.8% |
| Total | 159,671 | 100.0% |
Transportation & Commute in Union County
Vehicle Availability by Sex in Union County
The most prevalent vehicle ownership categories in Union County are males with 2 vehicles (64,046, accounting for 41.9%) and females with 2 vehicles (52,692, making up 48.6%).
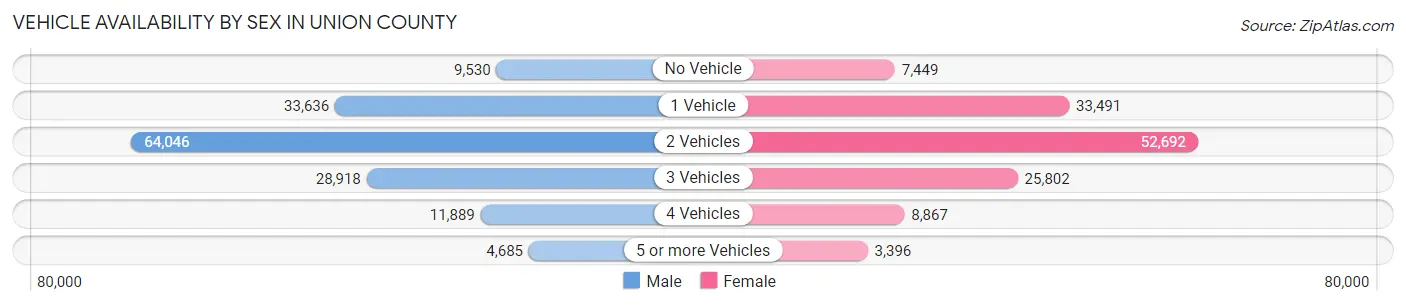
| Vehicles Available | Male | Female |
| No Vehicle | 9,530 (6.2%) | 7,449 (5.7%) |
| 1 Vehicle | 33,636 (22.0%) | 33,491 (25.4%) |
| 2 Vehicles | 64,046 (41.9%) | 52,692 (40.0%) |
| 3 Vehicles | 28,918 (18.9%) | 25,802 (19.6%) |
| 4 Vehicles | 11,889 (7.8%) | 8,867 (6.7%) |
| 5 or more Vehicles | 4,685 (3.1%) | 3,396 (2.6%) |
| Total | 152,704 (100.0%) | 131,697 (100.0%) |
Commute Time in Union County
The most frequently occuring commute durations in Union County are 30 to 34 minutes (34,612 commuters, 13.7%), 15 to 19 minutes (34,223 commuters, 13.6%), and 20 to 24 minutes (32,331 commuters, 12.8%).
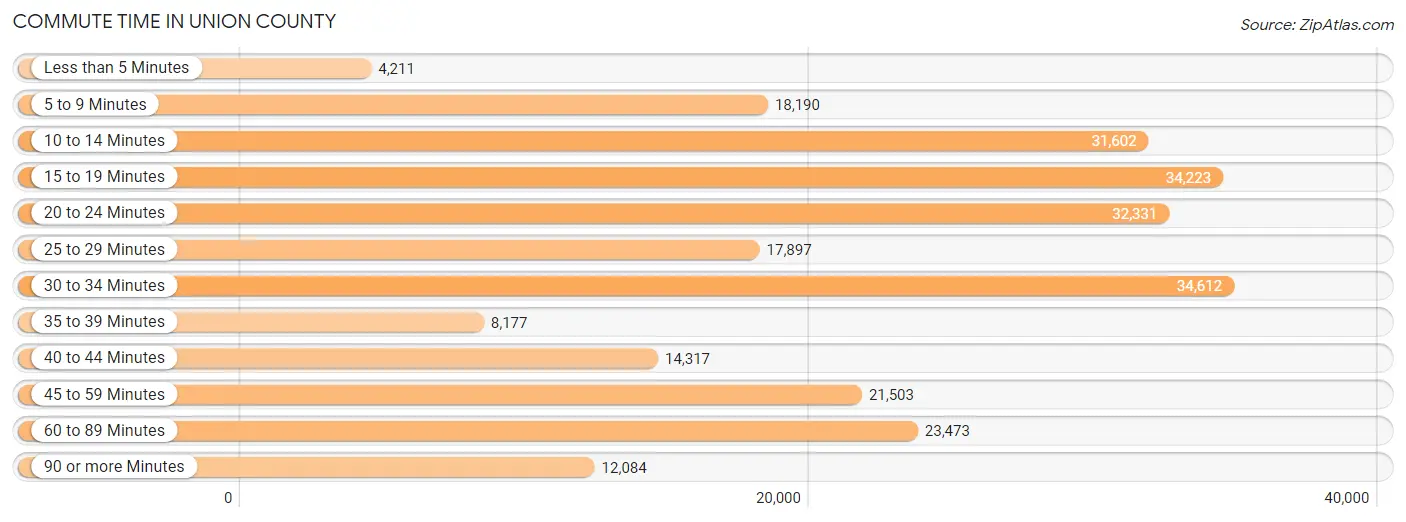
| Commute Time | # Commuters | % Commuters |
| Less than 5 Minutes | 4,211 | 1.7% |
| 5 to 9 Minutes | 18,190 | 7.2% |
| 10 to 14 Minutes | 31,602 | 12.5% |
| 15 to 19 Minutes | 34,223 | 13.6% |
| 20 to 24 Minutes | 32,331 | 12.8% |
| 25 to 29 Minutes | 17,897 | 7.1% |
| 30 to 34 Minutes | 34,612 | 13.7% |
| 35 to 39 Minutes | 8,177 | 3.2% |
| 40 to 44 Minutes | 14,317 | 5.7% |
| 45 to 59 Minutes | 21,503 | 8.5% |
| 60 to 89 Minutes | 23,473 | 9.3% |
| 90 or more Minutes | 12,084 | 4.8% |
Commute Time by Sex in Union County
The most common commute times in Union County are 30 to 34 minutes (18,766 commuters, 13.7%) for males and 15 to 19 minutes (16,054 commuters, 13.9%) for females.
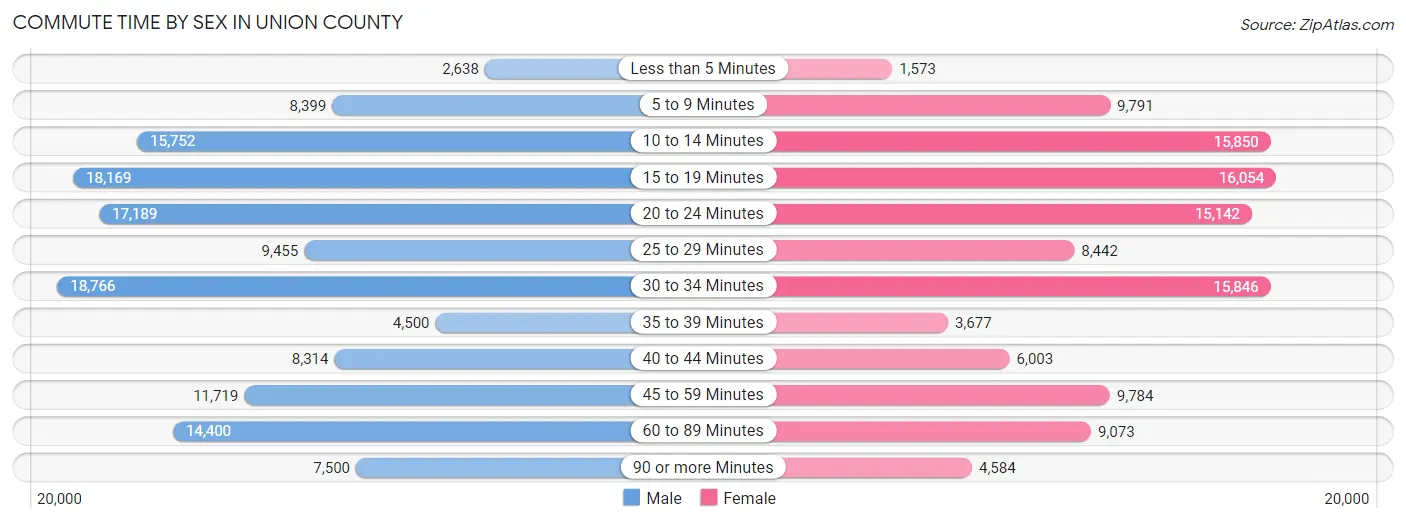
| Commute Time | Male | Female |
| Less than 5 Minutes | 2,638 (1.9%) | 1,573 (1.4%) |
| 5 to 9 Minutes | 8,399 (6.1%) | 9,791 (8.5%) |
| 10 to 14 Minutes | 15,752 (11.5%) | 15,850 (13.7%) |
| 15 to 19 Minutes | 18,169 (13.3%) | 16,054 (13.9%) |
| 20 to 24 Minutes | 17,189 (12.6%) | 15,142 (13.1%) |
| 25 to 29 Minutes | 9,455 (6.9%) | 8,442 (7.3%) |
| 30 to 34 Minutes | 18,766 (13.7%) | 15,846 (13.7%) |
| 35 to 39 Minutes | 4,500 (3.3%) | 3,677 (3.2%) |
| 40 to 44 Minutes | 8,314 (6.1%) | 6,003 (5.2%) |
| 45 to 59 Minutes | 11,719 (8.6%) | 9,784 (8.5%) |
| 60 to 89 Minutes | 14,400 (10.5%) | 9,073 (7.8%) |
| 90 or more Minutes | 7,500 (5.5%) | 4,584 (4.0%) |
Time of Departure to Work by Sex in Union County
The most frequent times of departure to work in Union County are 7:00 AM to 7:29 AM (21,264, 15.5%) for males and 7:00 AM to 7:29 AM (18,929, 16.3%) for females.
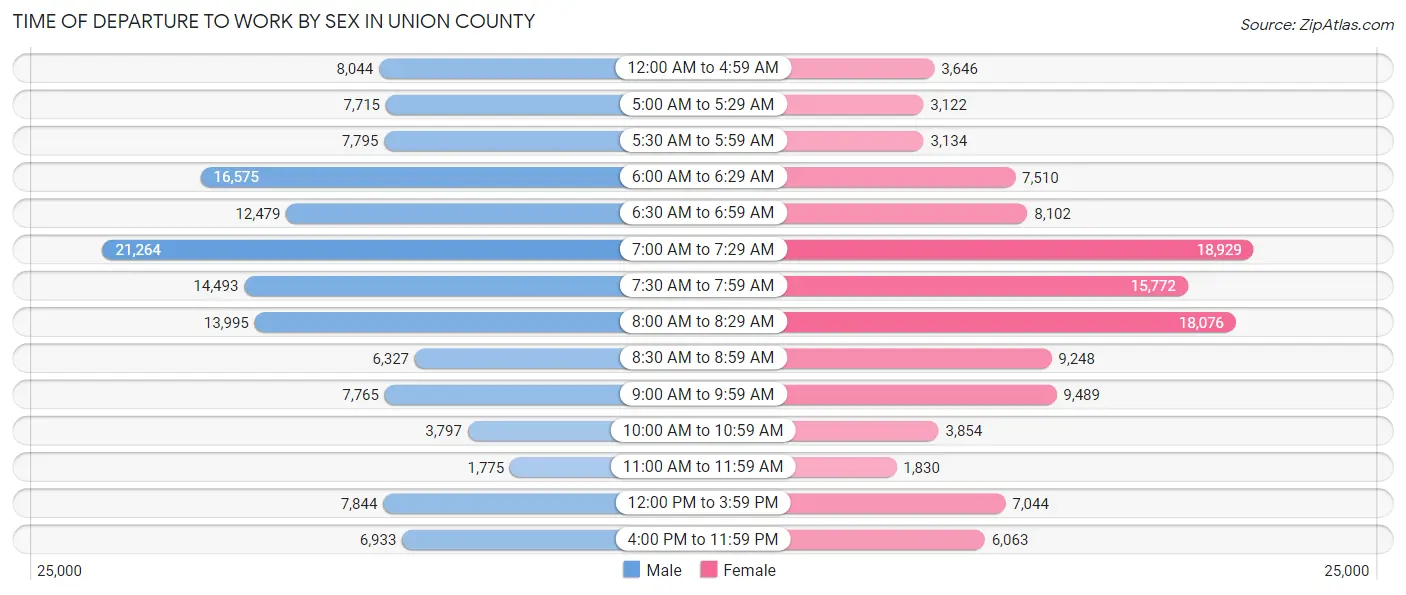
| Time of Departure | Male | Female |
| 12:00 AM to 4:59 AM | 8,044 (5.9%) | 3,646 (3.2%) |
| 5:00 AM to 5:29 AM | 7,715 (5.6%) | 3,122 (2.7%) |
| 5:30 AM to 5:59 AM | 7,795 (5.7%) | 3,134 (2.7%) |
| 6:00 AM to 6:29 AM | 16,575 (12.1%) | 7,510 (6.5%) |
| 6:30 AM to 6:59 AM | 12,479 (9.1%) | 8,102 (7.0%) |
| 7:00 AM to 7:29 AM | 21,264 (15.5%) | 18,929 (16.3%) |
| 7:30 AM to 7:59 AM | 14,493 (10.6%) | 15,772 (13.6%) |
| 8:00 AM to 8:29 AM | 13,995 (10.2%) | 18,076 (15.6%) |
| 8:30 AM to 8:59 AM | 6,327 (4.6%) | 9,248 (8.0%) |
| 9:00 AM to 9:59 AM | 7,765 (5.7%) | 9,489 (8.2%) |
| 10:00 AM to 10:59 AM | 3,797 (2.8%) | 3,854 (3.3%) |
| 11:00 AM to 11:59 AM | 1,775 (1.3%) | 1,830 (1.6%) |
| 12:00 PM to 3:59 PM | 7,844 (5.7%) | 7,044 (6.1%) |
| 4:00 PM to 11:59 PM | 6,933 (5.1%) | 6,063 (5.2%) |
| Total | 136,801 (100.0%) | 115,819 (100.0%) |
Housing Occupancy in Union County
Occupancy by Ownership in Union County
Of the total 199,996 dwellings in Union County, owner-occupied units account for 115,331 (57.7%), while renter-occupied units make up 84,665 (42.3%).
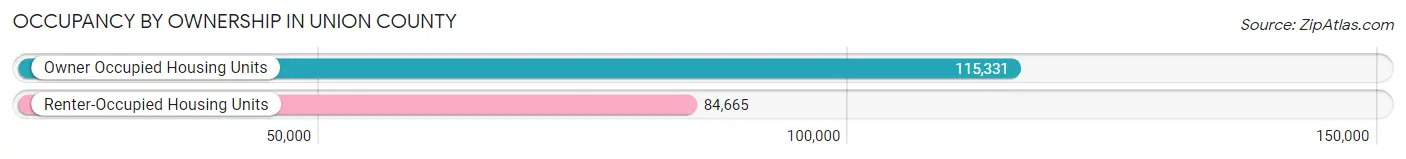
| Occupancy | # Housing Units | % Housing Units |
| Owner Occupied Housing Units | 115,331 | 57.7% |
| Renter-Occupied Housing Units | 84,665 | 42.3% |
| Total Occupied Housing Units | 199,996 | 100.0% |
Occupancy by Household Size in Union County

| Household Size | # Housing Units | % Housing Units |
| 1-Person Household | 46,325 | 23.2% |
| 2-Person Household | 56,443 | 28.2% |
| 3-Person Household | 35,982 | 18.0% |
| 4+ Person Household | 61,246 | 30.6% |
| Total Housing Units | 199,996 | 100.0% |
Occupancy by Ownership by Household Size in Union County
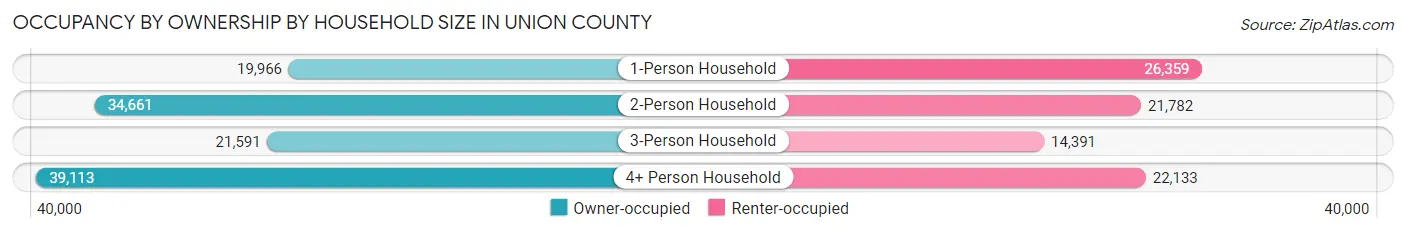
| Household Size | Owner-occupied | Renter-occupied |
| 1-Person Household | 19,966 (43.1%) | 26,359 (56.9%) |
| 2-Person Household | 34,661 (61.4%) | 21,782 (38.6%) |
| 3-Person Household | 21,591 (60.0%) | 14,391 (40.0%) |
| 4+ Person Household | 39,113 (63.9%) | 22,133 (36.1%) |
| Total Housing Units | 115,331 (57.7%) | 84,665 (42.3%) |
Occupancy by Educational Attainment in Union County
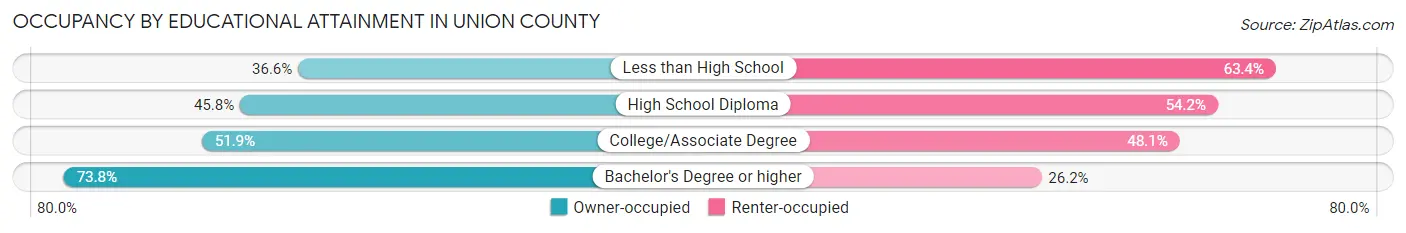
| Household Size | Owner-occupied | Renter-occupied |
| Less than High School | 8,334 (36.6%) | 14,421 (63.4%) |
| High School Diploma | 22,991 (45.8%) | 27,180 (54.2%) |
| College/Associate Degree | 23,121 (51.9%) | 21,441 (48.1%) |
| Bachelor's Degree or higher | 60,885 (73.8%) | 21,623 (26.2%) |
Occupancy by Age of Householder in Union County
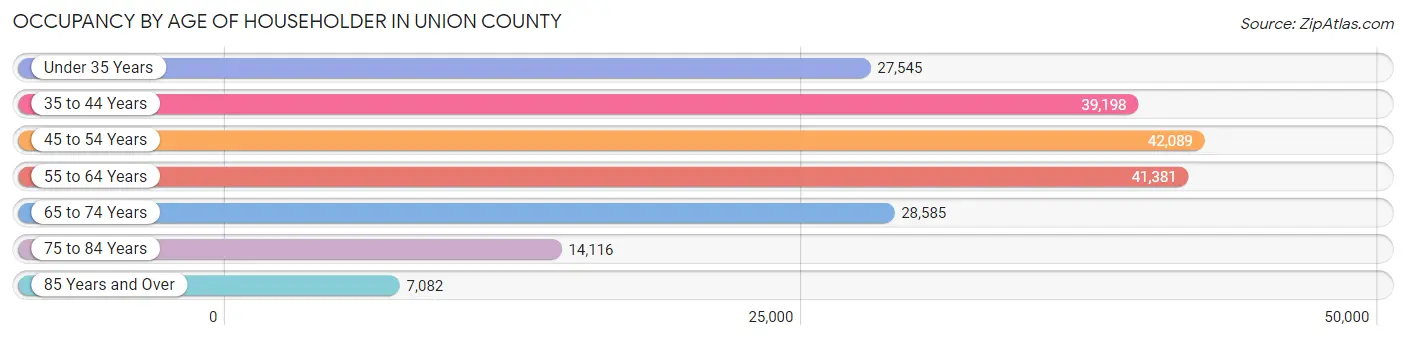
| Age Bracket | # Households | % Households |
| Under 35 Years | 27,545 | 13.8% |
| 35 to 44 Years | 39,198 | 19.6% |
| 45 to 54 Years | 42,089 | 21.0% |
| 55 to 64 Years | 41,381 | 20.7% |
| 65 to 74 Years | 28,585 | 14.3% |
| 75 to 84 Years | 14,116 | 7.1% |
| 85 Years and Over | 7,082 | 3.5% |
| Total | 199,996 | 100.0% |
Housing Finances in Union County
Median Income by Occupancy in Union County

| Occupancy Type | # Households | Median Income |
| Owner-Occupied | 115,331 (57.7%) | $139,229 |
| Renter-Occupied | 84,665 (42.3%) | $58,672 |
| Average | 199,996 (100.0%) | $95,000 |
Occupancy by Householder Income Bracket in Union County
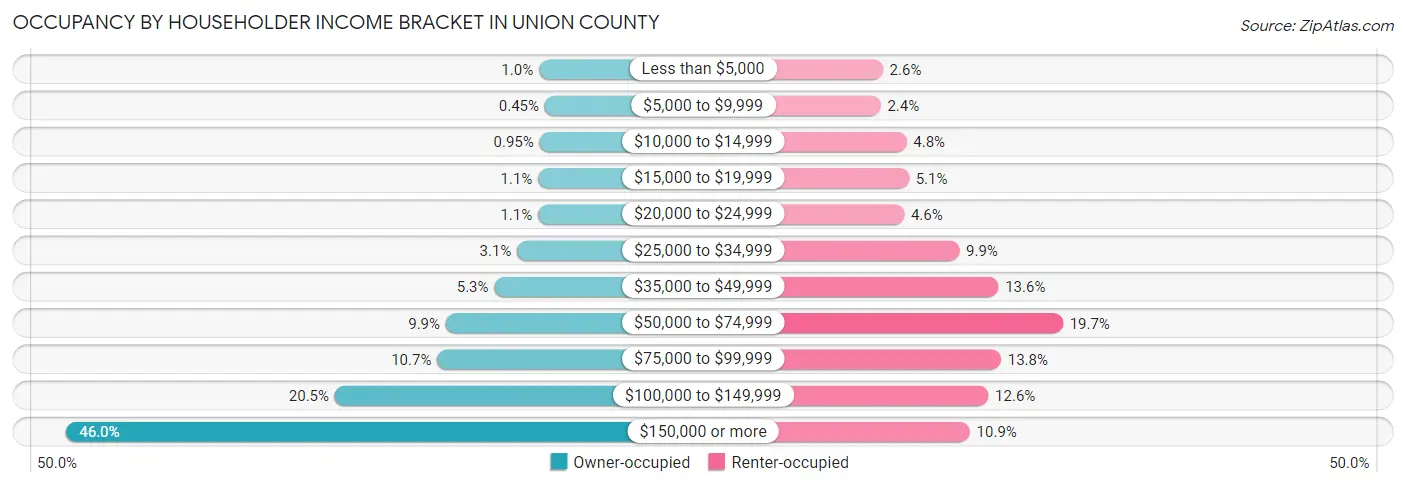
| Income Bracket | Owner-occupied | Renter-occupied |
| Less than $5,000 | 1,165 (1.0%) | 2,187 (2.6%) |
| $5,000 to $9,999 | 514 (0.4%) | 2,009 (2.4%) |
| $10,000 to $14,999 | 1,097 (0.9%) | 4,102 (4.8%) |
| $15,000 to $19,999 | 1,261 (1.1%) | 4,280 (5.1%) |
| $20,000 to $24,999 | 1,273 (1.1%) | 3,905 (4.6%) |
| $25,000 to $34,999 | 3,563 (3.1%) | 8,351 (9.9%) |
| $35,000 to $49,999 | 6,066 (5.3%) | 11,510 (13.6%) |
| $50,000 to $74,999 | 11,397 (9.9%) | 16,706 (19.7%) |
| $75,000 to $99,999 | 12,340 (10.7%) | 11,713 (13.8%) |
| $100,000 to $149,999 | 23,580 (20.4%) | 10,696 (12.6%) |
| $150,000 or more | 53,075 (46.0%) | 9,206 (10.9%) |
| Total | 115,331 (100.0%) | 84,665 (100.0%) |
Monthly Housing Cost Tiers in Union County
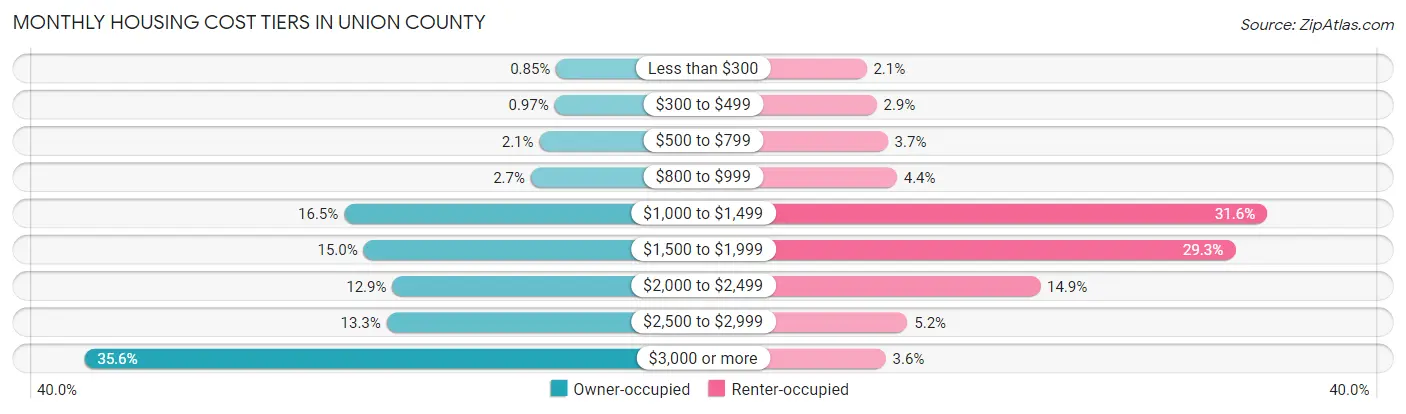
| Monthly Cost | Owner-occupied | Renter-occupied |
| Less than $300 | 978 (0.9%) | 1,814 (2.1%) |
| $300 to $499 | 1,113 (1.0%) | 2,442 (2.9%) |
| $500 to $799 | 2,416 (2.1%) | 3,130 (3.7%) |
| $800 to $999 | 3,132 (2.7%) | 3,702 (4.4%) |
| $1,000 to $1,499 | 18,999 (16.5%) | 26,790 (31.6%) |
| $1,500 to $1,999 | 17,347 (15.0%) | 24,791 (29.3%) |
| $2,000 to $2,499 | 14,901 (12.9%) | 12,634 (14.9%) |
| $2,500 to $2,999 | 15,386 (13.3%) | 4,357 (5.1%) |
| $3,000 or more | 41,059 (35.6%) | 3,002 (3.5%) |
| Total | 115,331 (100.0%) | 84,665 (100.0%) |
Physical Housing Characteristics in Union County
Housing Structures in Union County
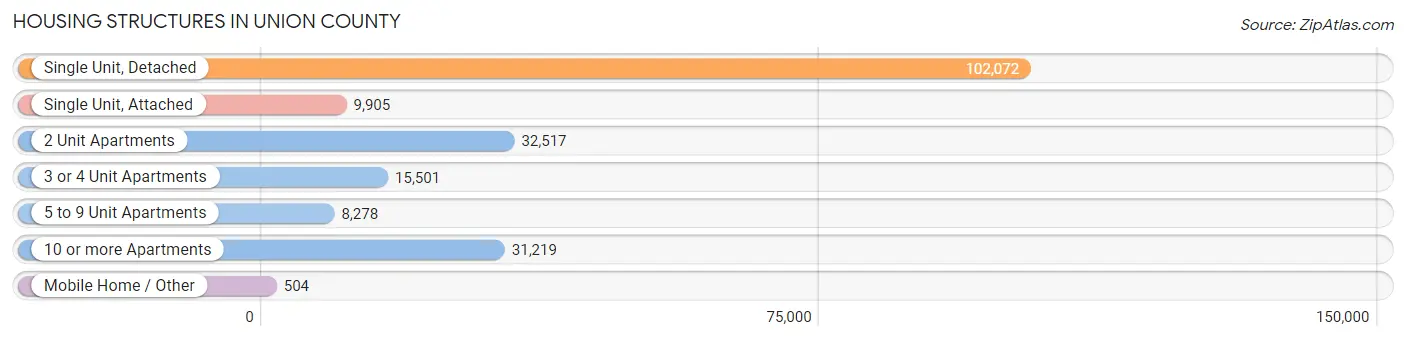
| Structure Type | # Housing Units | % Housing Units |
| Single Unit, Detached | 102,072 | 51.0% |
| Single Unit, Attached | 9,905 | 5.0% |
| 2 Unit Apartments | 32,517 | 16.3% |
| 3 or 4 Unit Apartments | 15,501 | 7.7% |
| 5 to 9 Unit Apartments | 8,278 | 4.1% |
| 10 or more Apartments | 31,219 | 15.6% |
| Mobile Home / Other | 504 | 0.3% |
| Total | 199,996 | 100.0% |
Housing Structures by Occupancy in Union County
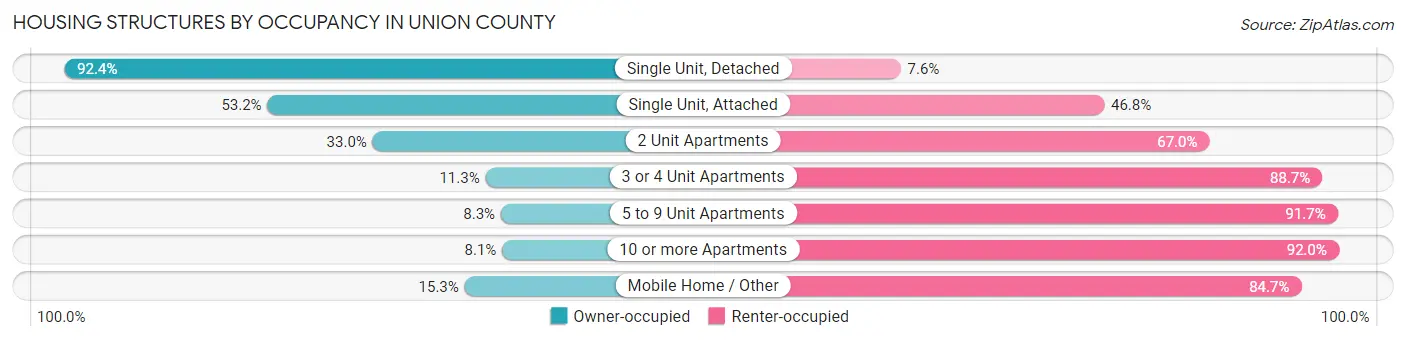
| Structure Type | Owner-occupied | Renter-occupied |
| Single Unit, Detached | 94,313 (92.4%) | 7,759 (7.6%) |
| Single Unit, Attached | 5,273 (53.2%) | 4,632 (46.8%) |
| 2 Unit Apartments | 10,724 (33.0%) | 21,793 (67.0%) |
| 3 or 4 Unit Apartments | 1,745 (11.3%) | 13,756 (88.7%) |
| 5 to 9 Unit Apartments | 686 (8.3%) | 7,592 (91.7%) |
| 10 or more Apartments | 2,513 (8.1%) | 28,706 (91.9%) |
| Mobile Home / Other | 77 (15.3%) | 427 (84.7%) |
| Total | 115,331 (57.7%) | 84,665 (42.3%) |
Housing Structures by Number of Rooms in Union County
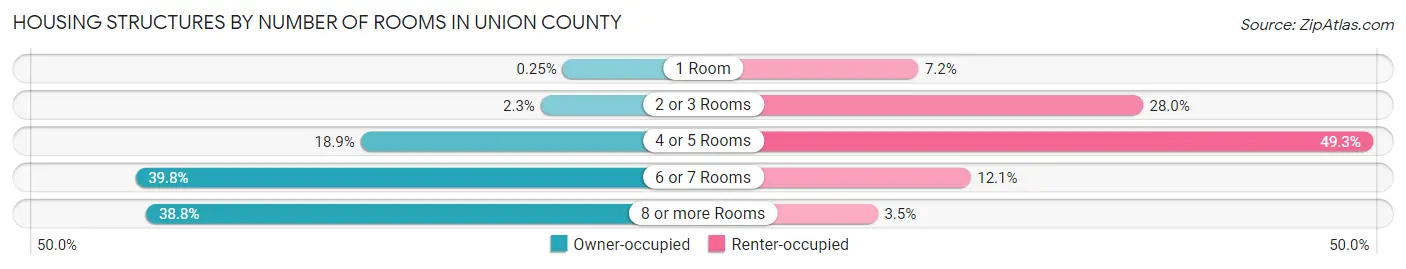
| Number of Rooms | Owner-occupied | Renter-occupied |
| 1 Room | 289 (0.3%) | 6,112 (7.2%) |
| 2 or 3 Rooms | 2,620 (2.3%) | 23,694 (28.0%) |
| 4 or 5 Rooms | 21,837 (18.9%) | 41,708 (49.3%) |
| 6 or 7 Rooms | 45,872 (39.8%) | 10,209 (12.1%) |
| 8 or more Rooms | 44,713 (38.8%) | 2,942 (3.5%) |
| Total | 115,331 (100.0%) | 84,665 (100.0%) |
Housing Structure by Heating Type in Union County
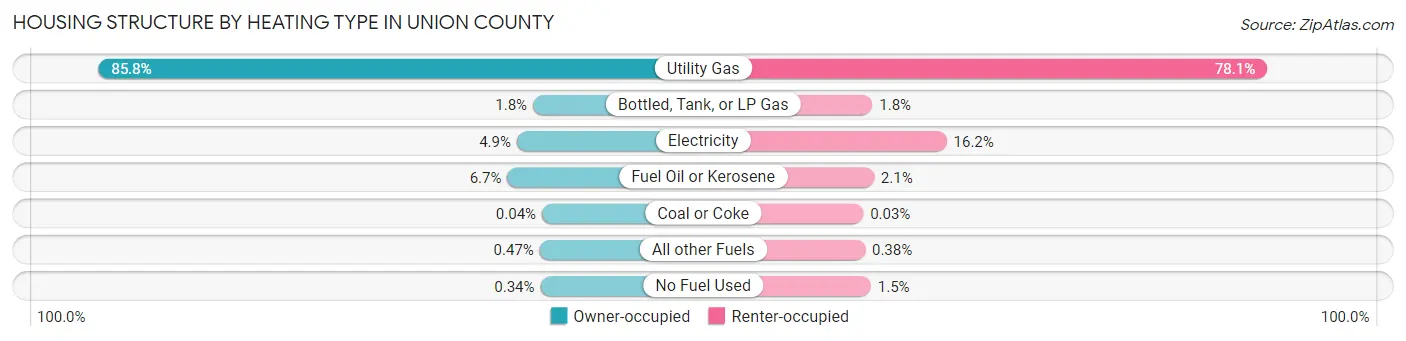
| Heating Type | Owner-occupied | Renter-occupied |
| Utility Gas | 98,913 (85.8%) | 66,079 (78.0%) |
| Bottled, Tank, or LP Gas | 2,047 (1.8%) | 1,521 (1.8%) |
| Electricity | 5,638 (4.9%) | 13,671 (16.2%) |
| Fuel Oil or Kerosene | 7,753 (6.7%) | 1,774 (2.1%) |
| Coal or Coke | 43 (0.0%) | 25 (0.0%) |
| All other Fuels | 546 (0.5%) | 320 (0.4%) |
| No Fuel Used | 391 (0.3%) | 1,275 (1.5%) |
| Total | 115,331 (100.0%) | 84,665 (100.0%) |
Household Vehicle Usage in Union County

| Vehicles per Household | Owner-occupied | Renter-occupied |
| No Vehicle | 3,917 (3.4%) | 17,322 (20.5%) |
| 1 Vehicle | 28,877 (25.0%) | 39,716 (46.9%) |
| 2 Vehicles | 51,241 (44.4%) | 22,444 (26.5%) |
| 3 or more Vehicles | 31,296 (27.1%) | 5,183 (6.1%) |
| Total | 115,331 (100.0%) | 84,665 (100.0%) |
Real Estate & Mortgages in Union County
Real Estate and Mortgage Overview in Union County
| Characteristic | Without Mortgage | With Mortgage |
| Housing Units | 38,198 | 77,133 |
| Median Property Value | $447,600 | $463,200 |
| Median Household Income | $105,333 | $40,127 |
| Monthly Housing Costs | $1,390 | $39,885 |
| Real Estate Taxes | $10,001 | $893 |
Property Value by Mortgage Status in Union County
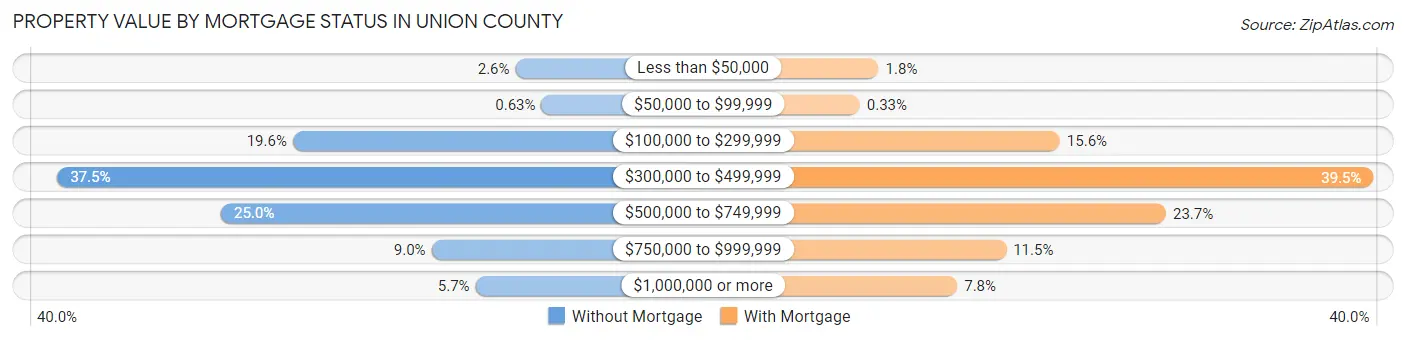
| Property Value | Without Mortgage | With Mortgage |
| Less than $50,000 | 996 (2.6%) | 1,354 (1.8%) |
| $50,000 to $99,999 | 239 (0.6%) | 258 (0.3%) |
| $100,000 to $299,999 | 7,477 (19.6%) | 12,009 (15.6%) |
| $300,000 to $499,999 | 14,328 (37.5%) | 30,427 (39.5%) |
| $500,000 to $749,999 | 9,562 (25.0%) | 18,248 (23.7%) |
| $750,000 to $999,999 | 3,436 (9.0%) | 8,856 (11.5%) |
| $1,000,000 or more | 2,160 (5.7%) | 5,981 (7.7%) |
| Total | 38,198 (100.0%) | 77,133 (100.0%) |
Household Income by Mortgage Status in Union County
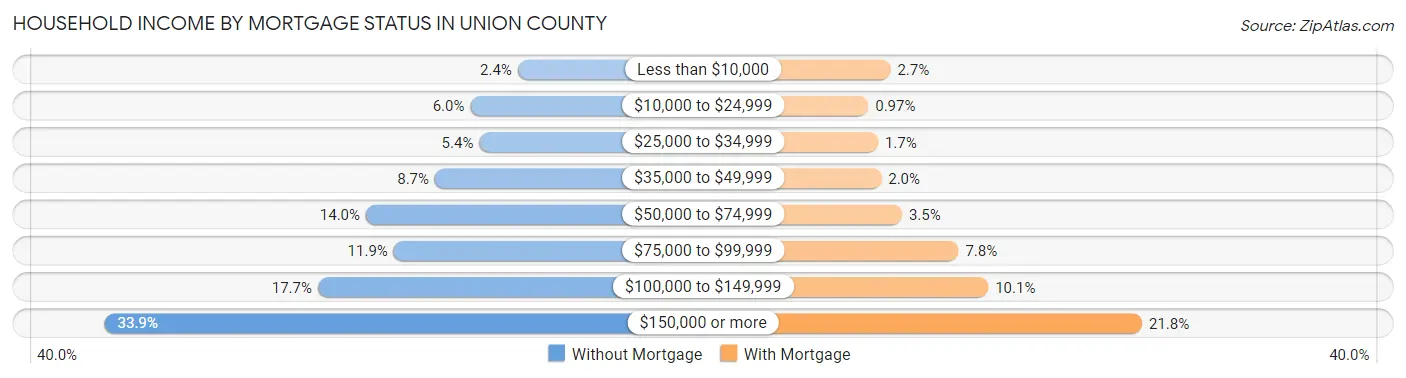
| Household Income | Without Mortgage | With Mortgage |
| Less than $10,000 | 927 (2.4%) | 2,053 (2.7%) |
| $10,000 to $24,999 | 2,309 (6.0%) | 752 (1.0%) |
| $25,000 to $34,999 | 2,048 (5.4%) | 1,322 (1.7%) |
| $35,000 to $49,999 | 3,337 (8.7%) | 1,515 (2.0%) |
| $50,000 to $74,999 | 5,347 (14.0%) | 2,729 (3.5%) |
| $75,000 to $99,999 | 4,538 (11.9%) | 6,050 (7.8%) |
| $100,000 to $149,999 | 6,744 (17.7%) | 7,802 (10.1%) |
| $150,000 or more | 12,948 (33.9%) | 16,836 (21.8%) |
| Total | 38,198 (100.0%) | 77,133 (100.0%) |
Property Value to Household Income Ratio in Union County
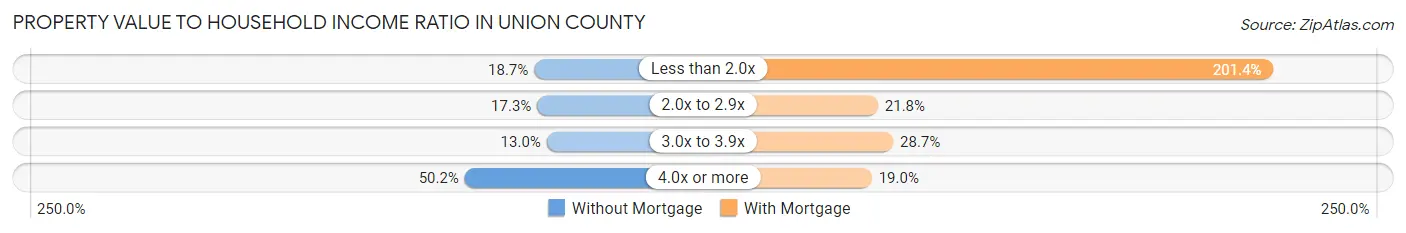
| Value-to-Income Ratio | Without Mortgage | With Mortgage |
| Less than 2.0x | 7,133 (18.7%) | 155,305 (201.4%) |
| 2.0x to 2.9x | 6,599 (17.3%) | 16,784 (21.8%) |
| 3.0x to 3.9x | 4,955 (13.0%) | 22,119 (28.7%) |
| 4.0x or more | 19,169 (50.2%) | 14,643 (19.0%) |
| Total | 38,198 (100.0%) | 77,133 (100.0%) |
Real Estate Taxes by Mortgage Status in Union County
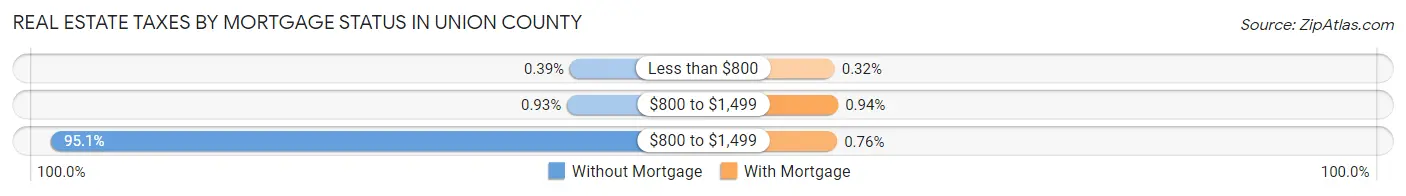
| Property Taxes | Without Mortgage | With Mortgage |
| Less than $800 | 148 (0.4%) | 245 (0.3%) |
| $800 to $1,499 | 354 (0.9%) | 728 (0.9%) |
| $800 to $1,499 | 36,342 (95.1%) | 584 (0.8%) |
| Total | 38,198 (100.0%) | 77,133 (100.0%) |
Health & Disability in Union County
Health Insurance Coverage by Age in Union County

| Age Bracket | With Coverage | Without Coverage |
| Under 6 Years | 40,128 (94.3%) | 2,428 (5.7%) |
| 6 to 18 Years | 90,495 (92.7%) | 7,166 (7.3%) |
| 19 to 25 Years | 39,943 (81.4%) | 9,127 (18.6%) |
| 26 to 34 Years | 50,261 (77.9%) | 14,245 (22.1%) |
| 35 to 44 Years | 63,029 (79.4%) | 16,391 (20.6%) |
| 45 to 54 Years | 68,171 (86.1%) | 11,039 (13.9%) |
| 55 to 64 Years | 67,497 (90.6%) | 7,003 (9.4%) |
| 65 to 74 Years | 46,529 (97.4%) | 1,246 (2.6%) |
| 75 Years and older | 33,530 (98.8%) | 413 (1.2%) |
| Total | 499,583 (87.9%) | 69,058 (12.1%) |
Health Insurance Coverage by Citizenship Status in Union County
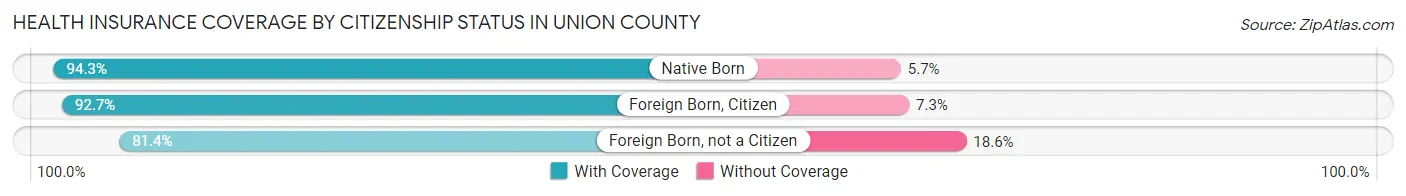
| Citizenship Status | With Coverage | Without Coverage |
| Native Born | 40,128 (94.3%) | 2,428 (5.7%) |
| Foreign Born, Citizen | 90,495 (92.7%) | 7,166 (7.3%) |
| Foreign Born, not a Citizen | 39,943 (81.4%) | 9,127 (18.6%) |
Health Insurance Coverage by Household Income in Union County
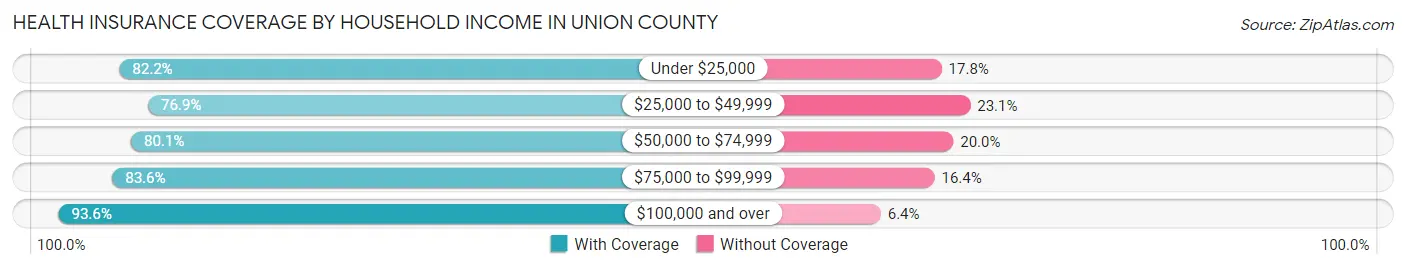
| Household Income | With Coverage | Without Coverage |
| Under $25,000 | 32,235 (82.2%) | 6,967 (17.8%) |
| $25,000 to $49,999 | 52,735 (76.9%) | 15,880 (23.1%) |
| $50,000 to $74,999 | 59,214 (80.0%) | 14,760 (20.0%) |
| $75,000 to $99,999 | 55,826 (83.6%) | 10,985 (16.4%) |
| $100,000 and over | 296,534 (93.6%) | 20,176 (6.4%) |
Public vs Private Health Insurance Coverage by Age in Union County
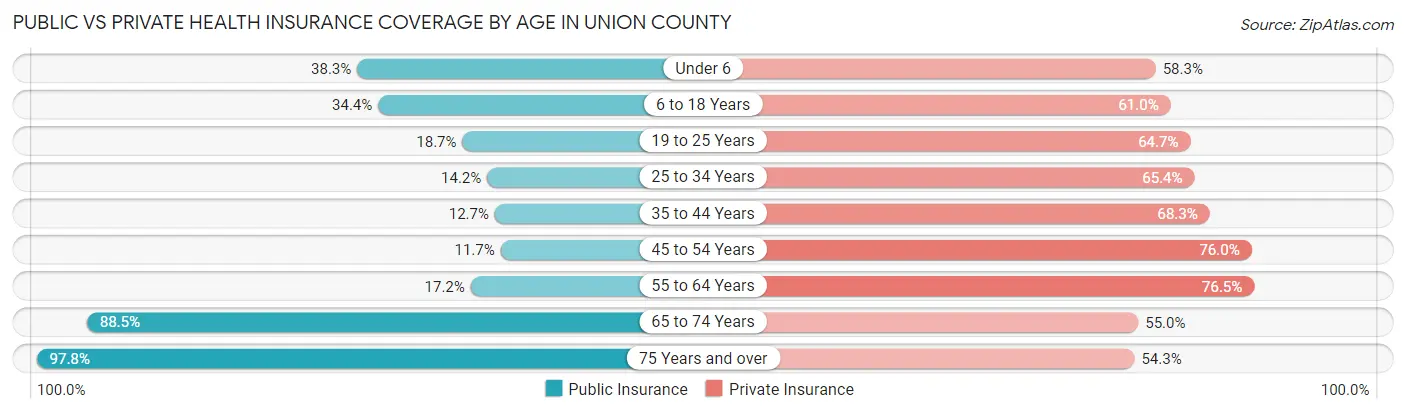
| Age Bracket | Public Insurance | Private Insurance |
| Under 6 | 16,291 (38.3%) | 24,796 (58.3%) |
| 6 to 18 Years | 33,578 (34.4%) | 59,572 (61.0%) |
| 19 to 25 Years | 9,198 (18.7%) | 31,733 (64.7%) |
| 25 to 34 Years | 9,129 (14.1%) | 42,212 (65.4%) |
| 35 to 44 Years | 10,100 (12.7%) | 54,211 (68.3%) |
| 45 to 54 Years | 9,238 (11.7%) | 60,235 (76.0%) |
| 55 to 64 Years | 12,819 (17.2%) | 57,009 (76.5%) |
| 65 to 74 Years | 42,258 (88.4%) | 26,296 (55.0%) |
| 75 Years and over | 33,184 (97.8%) | 18,441 (54.3%) |
| Total | 175,795 (30.9%) | 374,505 (65.9%) |
Disability Status by Sex by Age in Union County
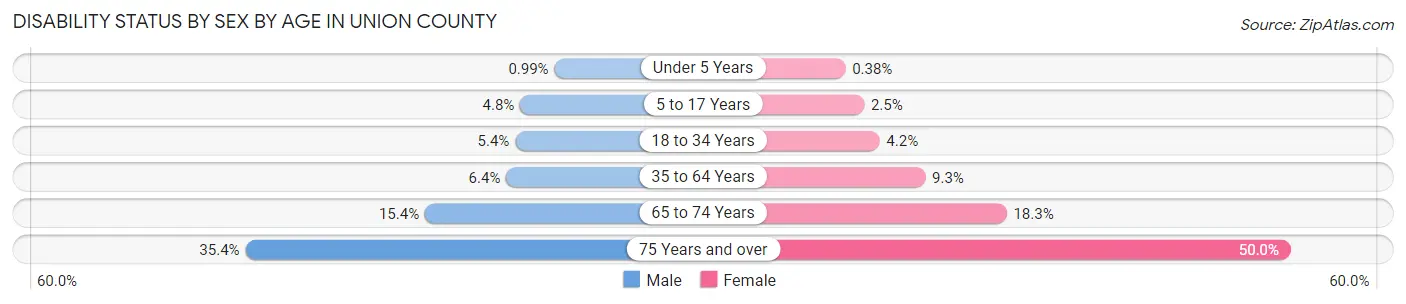
| Age Bracket | Male | Female |
| Under 5 Years | 179 (1.0%) | 65 (0.4%) |
| 5 to 17 Years | 2,411 (4.8%) | 1,194 (2.5%) |
| 18 to 34 Years | 3,266 (5.4%) | 2,485 (4.2%) |
| 35 to 64 Years | 7,376 (6.4%) | 10,867 (9.3%) |
| 65 to 74 Years | 3,398 (15.4%) | 4,716 (18.3%) |
| 75 Years and over | 4,711 (35.4%) | 10,322 (50.0%) |
Disability Class by Sex by Age in Union County
Disability Class: Hearing Difficulty
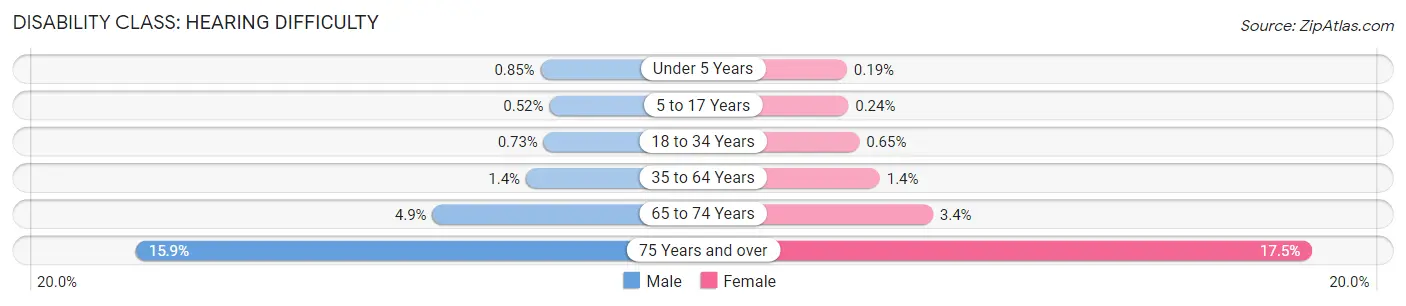
| Age Bracket | Male | Female |
| Under 5 Years | 153 (0.9%) | 32 (0.2%) |
| 5 to 17 Years | 263 (0.5%) | 118 (0.2%) |
| 18 to 34 Years | 445 (0.7%) | 383 (0.6%) |
| 35 to 64 Years | 1,613 (1.4%) | 1,651 (1.4%) |
| 65 to 74 Years | 1,071 (4.9%) | 869 (3.4%) |
| 75 Years and over | 2,112 (15.9%) | 3,604 (17.5%) |
Disability Class: Vision Difficulty
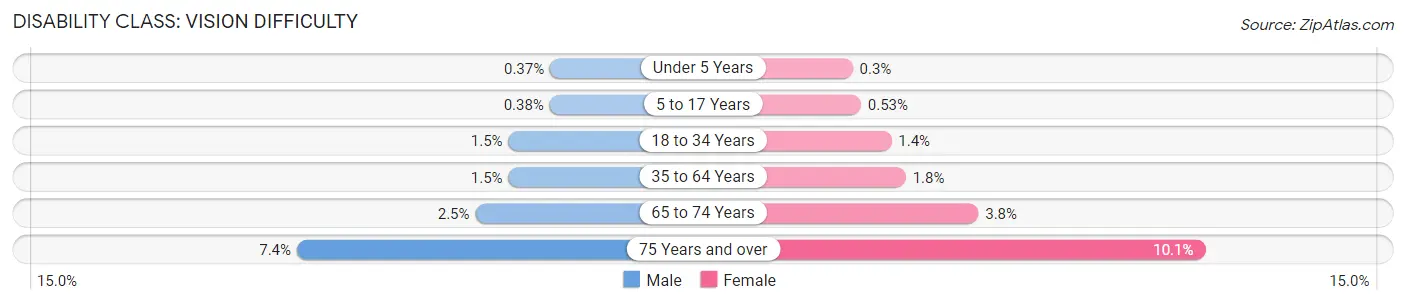
| Age Bracket | Male | Female |
| Under 5 Years | 67 (0.4%) | 51 (0.3%) |
| 5 to 17 Years | 193 (0.4%) | 254 (0.5%) |
| 18 to 34 Years | 931 (1.5%) | 817 (1.4%) |
| 35 to 64 Years | 1,772 (1.5%) | 2,082 (1.8%) |
| 65 to 74 Years | 541 (2.5%) | 976 (3.8%) |
| 75 Years and over | 987 (7.4%) | 2,089 (10.1%) |
Disability Class: Cognitive Difficulty
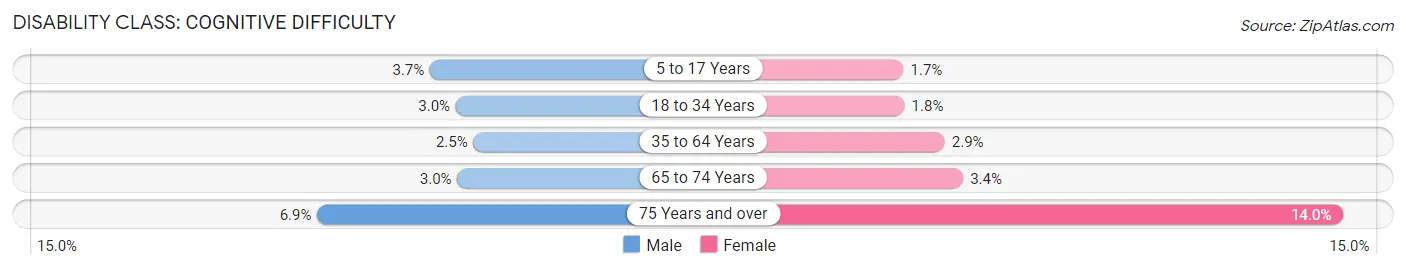
| Age Bracket | Male | Female |
| 5 to 17 Years | 1,860 (3.7%) | 833 (1.7%) |
| 18 to 34 Years | 1,824 (3.0%) | 1,037 (1.8%) |
| 35 to 64 Years | 2,905 (2.5%) | 3,358 (2.9%) |
| 65 to 74 Years | 650 (2.9%) | 870 (3.4%) |
| 75 Years and over | 911 (6.9%) | 2,882 (14.0%) |
Disability Class: Ambulatory Difficulty

| Age Bracket | Male | Female |
| 5 to 17 Years | 127 (0.3%) | 80 (0.2%) |
| 18 to 34 Years | 337 (0.5%) | 381 (0.6%) |
| 35 to 64 Years | 3,098 (2.7%) | 5,693 (4.9%) |
| 65 to 74 Years | 2,038 (9.2%) | 3,103 (12.1%) |
| 75 Years and over | 2,797 (21.0%) | 7,630 (37.0%) |
Disability Class: Self-Care Difficulty
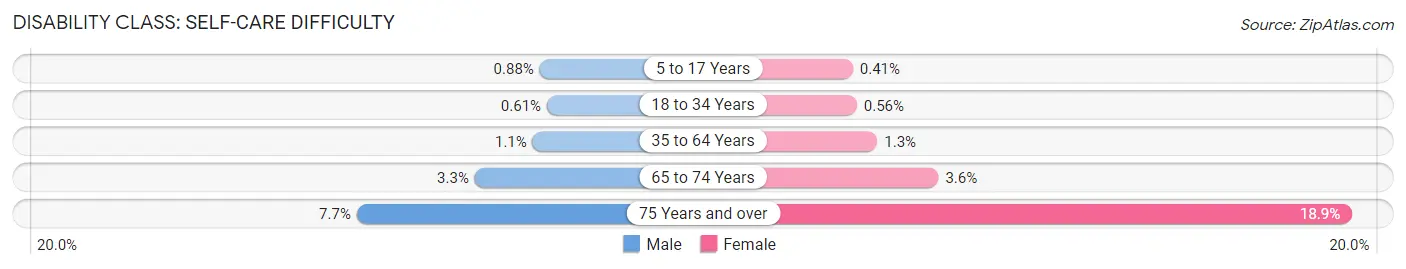
| Age Bracket | Male | Female |
| 5 to 17 Years | 442 (0.9%) | 199 (0.4%) |
| 18 to 34 Years | 370 (0.6%) | 330 (0.6%) |
| 35 to 64 Years | 1,325 (1.1%) | 1,550 (1.3%) |
| 65 to 74 Years | 725 (3.3%) | 923 (3.6%) |
| 75 Years and over | 1,020 (7.7%) | 3,908 (18.9%) |
Technology Access in Union County
Computing Device Access in Union County
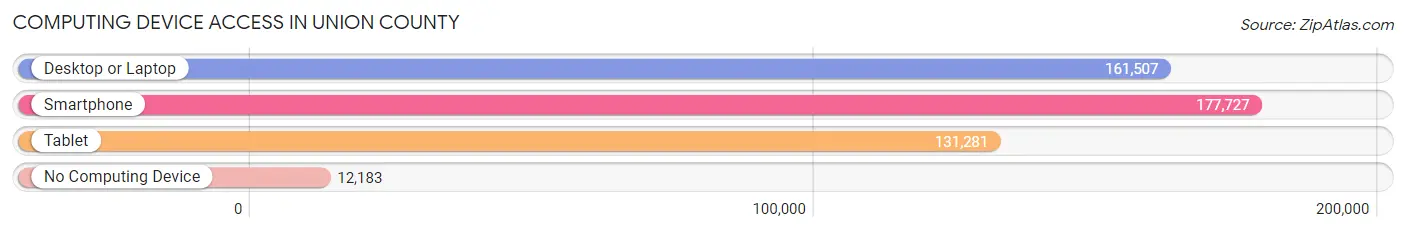
| Device Type | # Households | % Households |
| Desktop or Laptop | 161,507 | 80.8% |
| Smartphone | 177,727 | 88.9% |
| Tablet | 131,281 | 65.6% |
| No Computing Device | 12,183 | 6.1% |
| Total | 199,996 | 100.0% |
Internet Access in Union County
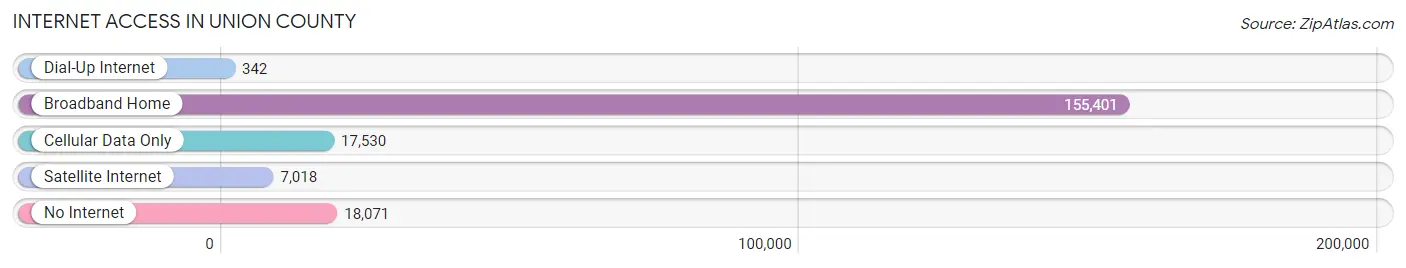
| Internet Type | # Households | % Households |
| Dial-Up Internet | 342 | 0.2% |
| Broadband Home | 155,401 | 77.7% |
| Cellular Data Only | 17,530 | 8.8% |
| Satellite Internet | 7,018 | 3.5% |
| No Internet | 18,071 | 9.0% |
| Total | 199,996 | 100.0% |
Union County Summary
Introduction
Union County, New Jersey is located in the northeastern part of the state and is part of the New York metropolitan area. It is the seventh most populous county in the state and is home to over 563,000 people. The county is known for its diverse population, vibrant economy, and rich history. This paper will explore the history, geography, economy, and demographics of Union County, New Jersey.
History
Union County was established in 1857 from portions of Essex, Middlesex, and Somerset counties. The county was named for the Union of the United States and was the first county in the state to be named for the Union. The county was originally home to the Lenape Native Americans, who were later displaced by Dutch and English settlers. The county was an important part of the Revolutionary War, as it was the site of the Battle of Short Hills in 1777.
Geography
Union County is located in the northeastern part of New Jersey and is part of the New York metropolitan area. It is bordered by Essex County to the north, Middlesex County to the south, and Somerset County to the west. The county is divided into 21 municipalities, including Elizabeth, Linden, Plainfield, Rahway, and Summit. The county covers an area of 105 square miles and is home to over 563,000 people.
Economy
Union County is home to a vibrant economy that is driven by a variety of industries. The county is home to several major corporations, including Merck & Co., PSE&G, and Wakefern Food Corporation. The county is also home to several major universities, including Kean University, Rutgers University, and Union County College. The county is also home to several major shopping centers, including The Mills at Jersey Gardens and The Mall at Short Hills.
Demographics
Union County is home to a diverse population of over 563,000 people. The county is home to a large Hispanic population, with over 30% of the population identifying as Hispanic or Latino. The county is also home to a large African American population, with over 20% of the population identifying as African American. The county is also home to a large Asian population, with over 10% of the population identifying as Asian. The county is also home to a large number of immigrants, with over 20% of the population being foreign-born.
Conclusion
Union County, New Jersey is a vibrant and diverse county located in the northeastern part of the state. The county is home to a rich history, diverse geography, vibrant economy, and diverse population. The county is home to several major corporations, universities, and shopping centers, and is home to a large Hispanic, African American, Asian, and immigrant population.
Common Questions
What is the Total Population of Union County?
Total Population of Union County is 572,079.
What is the Total Male Population of Union County?
Total Male Population of Union County is 282,245.
What is the Total Female Population of Union County?
Total Female Population of Union County is 289,834.
What is the Ratio of Males per 100 Females in Union County?
There are 97.38 Males per 100 Females in Union County.
What is the Ratio of Females per 100 Males in Union County?
There are 102.69 Females per 100 Males in Union County.
What is the Median Population Age in Union County?
Median Population Age in Union County is 39.0 Years.
What is the Average Family Size in Union County
Average Family Size in Union County is 3.3 People.
What is the Average Household Size in Union County
Average Household Size in Union County is 2.8 People.
What is Per Capita Income in Union County?
Per Capita income in Union County is $49,666.
What is the Median Family Income in Union County?
Median Family Income in Union County is $115,612.
What is the Median Household income in Union County?
Median Household Income in Union County is $95,000.
What is Income or Wage Gap in Union County?
Income or Wage Gap in Union County is 24.1%.
Women in Union County earn 75.9 cents for every dollar earned by a man.
What is Family Income Deficit in Union County?
Family Income Deficit in Union County is $10,238.
Families that are below poverty line in Union County earn $10,238 less on average than the poverty threshold level.
What is Inequality or Gini Index in Union County?
Inequality or Gini Index in Union County is 0.49.
How Large is the Labor Force in Union County?
There are 312,131 People in the Labor Forcein in Union County.
What is the Percentage of People in the Labor Force in Union County?
68.8% of People are in the Labor Force in Union County.
What is the Unemployment Rate in Union County?
Unemployment Rate in Union County is 6.2%.