Sussex County, NJ
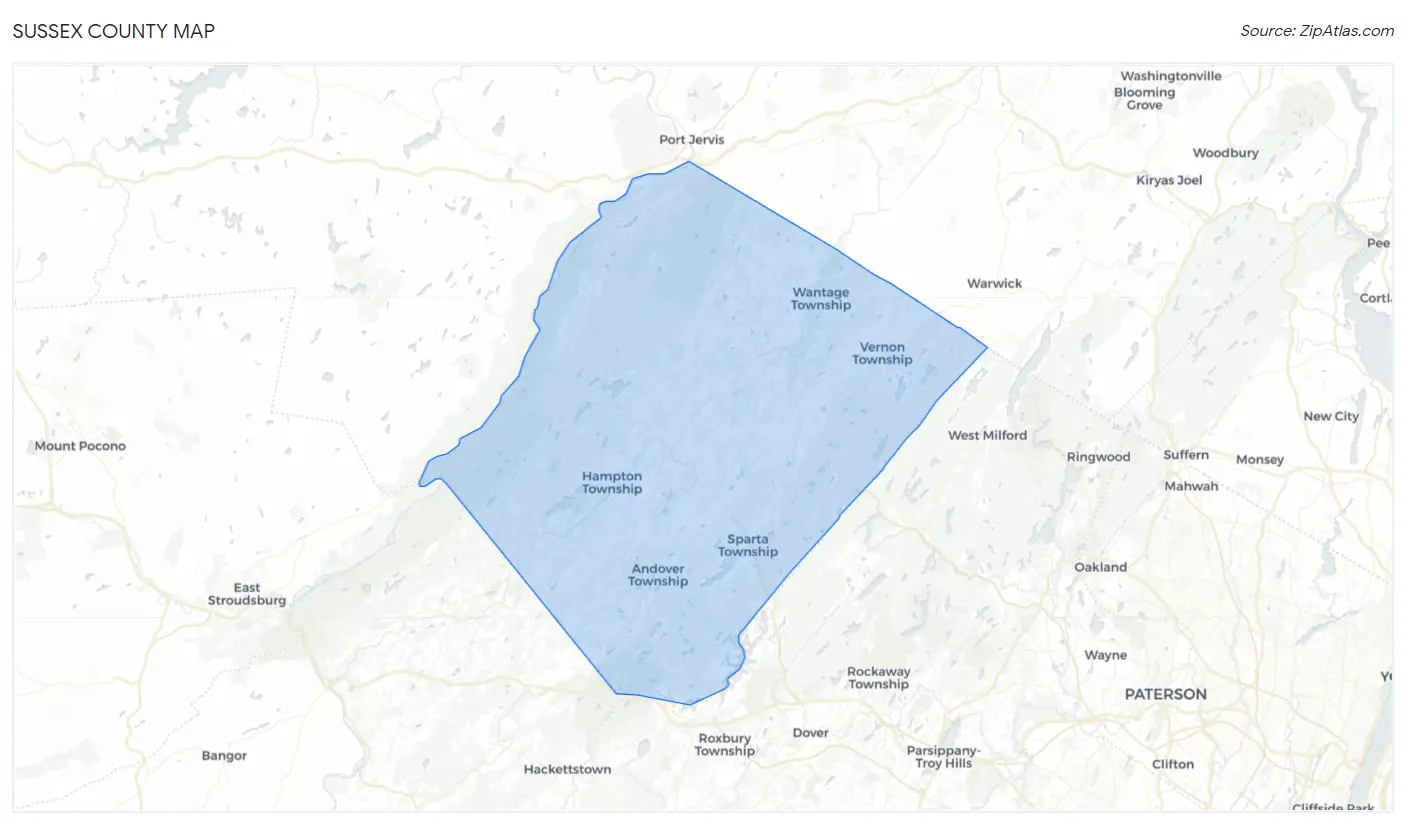
Sussex County Map
Sussex County Overview
144,808
TOTAL POPULATION
72,893
MALE POPULATION
71,915
FEMALE POPULATION
101.36
MALES / 100 FEMALES
98.66
FEMALES / 100 MALES
44.5
MEDIAN AGE
3.0
AVG FAMILY SIZE
2.5
AVG HOUSEHOLD SIZE
$54,124
PER CAPITA INCOME
$130,760
AVG FAMILY INCOME
$111,094
AVG HOUSEHOLD INCOME
31.1%
WAGE / INCOME GAP [ % ]
68.9¢/ $1
WAGE / INCOME GAP [ $ ]
$11,601
FAMILY INCOME DEFICIT
0.42
INEQUALITY / GINI INDEX
82,362
LABOR FORCE [ PEOPLE ]
68.4%
PERCENT IN LABOR FORCE
5.5%
UNEMPLOYMENT RATE
Race in Sussex County
The most populous races in Sussex County are White / Caucasian (126,564 | 87.4%), Hispanic or Latino (14,343 | 9.9%), and Two or more Races (8,932 | 6.2%).
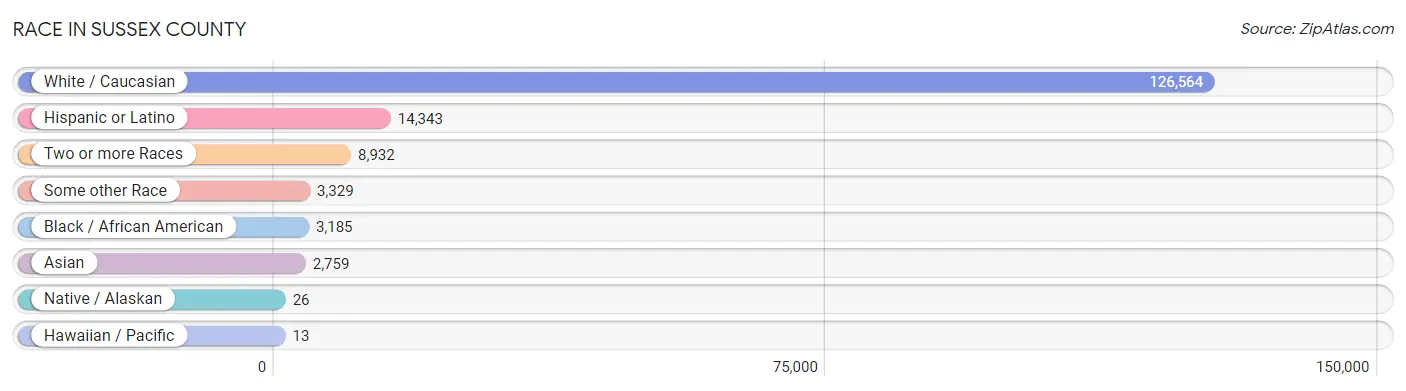
| Race | # Population | % Population |
| Asian | 2,759 | 1.9% |
| Black / African American | 3,185 | 2.2% |
| Hawaiian / Pacific | 13 | 0.0% |
| Hispanic or Latino | 14,343 | 9.9% |
| Native / Alaskan | 26 | 0.0% |
| White / Caucasian | 126,564 | 87.4% |
| Two or more Races | 8,932 | 6.2% |
| Some other Race | 3,329 | 2.3% |
| Total | 144,808 | 100.0% |
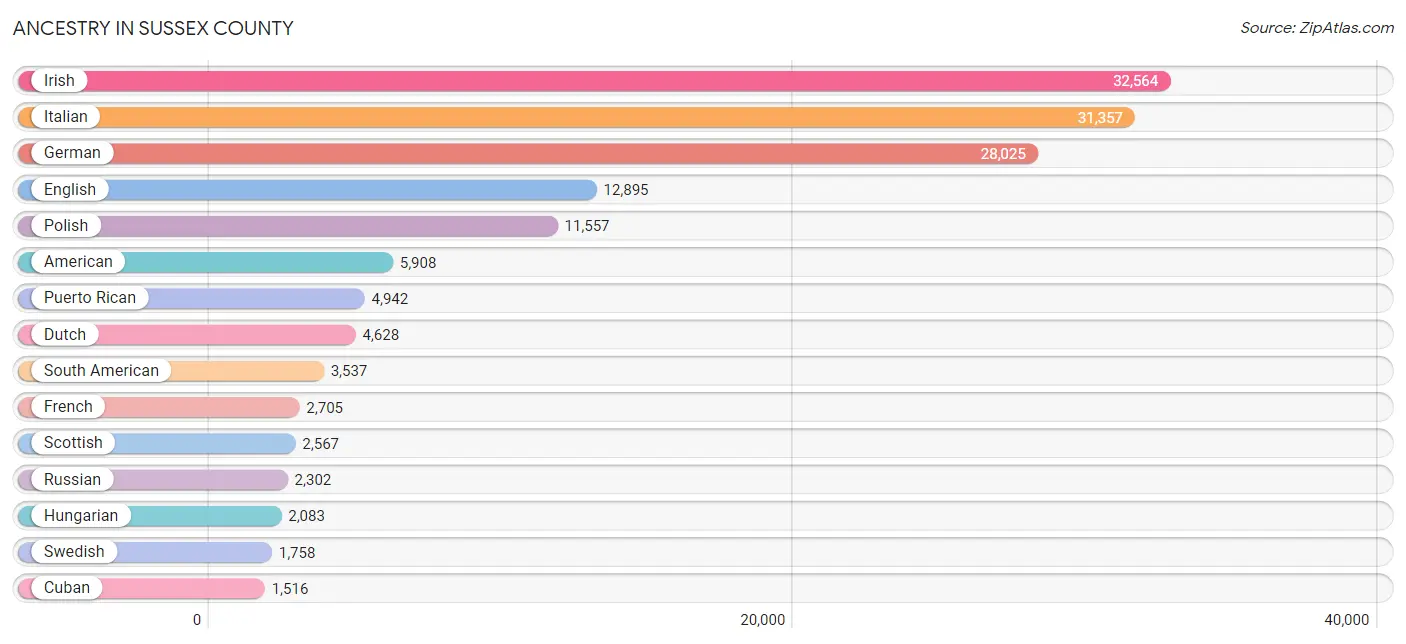
Ancestry in Sussex County
The most populous ancestries reported in Sussex County are Irish (32,564 | 22.5%), Italian (31,357 | 21.6%), German (28,025 | 19.4%), English (12,895 | 8.9%), and Polish (11,557 | 8.0%), together accounting for 80.4% of all Sussex County residents.
| Ancestry | # Population | % Population |
| African | 165 | 0.1% |
| Albanian | 310 | 0.2% |
| Alsatian | 12 | 0.0% |
| American | 5,908 | 4.1% |
| Apache | 3 | 0.0% |
| Arab | 397 | 0.3% |
| Argentinean | 449 | 0.3% |
| Armenian | 316 | 0.2% |
| Australian | 32 | 0.0% |
| Austrian | 580 | 0.4% |
| Barbadian | 39 | 0.0% |
| Basque | 27 | 0.0% |
| Belgian | 286 | 0.2% |
| Bhutanese | 229 | 0.2% |
| Blackfeet | 192 | 0.1% |
| Bolivian | 128 | 0.1% |
| Brazilian | 211 | 0.2% |
| British | 1,025 | 0.7% |
| Burmese | 345 | 0.2% |
| Cambodian | 28 | 0.0% |
| Canadian | 301 | 0.2% |
| Celtic | 17 | 0.0% |
| Central American | 987 | 0.7% |
| Central American Indian | 68 | 0.1% |
| Cherokee | 112 | 0.1% |
| Chilean | 154 | 0.1% |
| Choctaw | 9 | 0.0% |
| Colombian | 1,394 | 1.0% |
| Costa Rican | 84 | 0.1% |
| Croatian | 382 | 0.3% |
| Cuban | 1,516 | 1.1% |
| Cypriot | 41 | 0.0% |
| Czech | 555 | 0.4% |
| Czechoslovakian | 200 | 0.1% |
| Danish | 298 | 0.2% |
| Delaware | 64 | 0.0% |
| Dominican | 1,355 | 0.9% |
| Dutch | 4,628 | 3.2% |
| Eastern European | 702 | 0.5% |
| Ecuadorian | 713 | 0.5% |
| Egyptian | 113 | 0.1% |
| English | 12,895 | 8.9% |
| Estonian | 33 | 0.0% |
| Ethiopian | 18 | 0.0% |
| European | 1,365 | 0.9% |
| Filipino | 30 | 0.0% |
| Finnish | 168 | 0.1% |
| French | 2,705 | 1.9% |
| French American Indian | 10 | 0.0% |
| French Canadian | 553 | 0.4% |
| German | 28,025 | 19.4% |
| Ghanaian | 108 | 0.1% |
| Greek | 994 | 0.7% |
| Guatemalan | 147 | 0.1% |
| Guyanese | 137 | 0.1% |
| Haitian | 188 | 0.1% |
| Honduran | 183 | 0.1% |
| Hungarian | 2,083 | 1.4% |
| Icelander | 10 | 0.0% |
| Indian (Asian) | 627 | 0.4% |
| Indonesian | 11 | 0.0% |
| Iranian | 33 | 0.0% |
| Iraqi | 21 | 0.0% |
| Irish | 32,564 | 22.5% |
| Iroquois | 37 | 0.0% |
| Israeli | 44 | 0.0% |
| Italian | 31,357 | 21.6% |
| Jamaican | 218 | 0.2% |
| Japanese | 14 | 0.0% |
| Jordanian | 8 | 0.0% |
| Kenyan | 27 | 0.0% |
| Korean | 851 | 0.6% |
| Laotian | 25 | 0.0% |
| Latvian | 7 | 0.0% |
| Lebanese | 93 | 0.1% |
| Lithuanian | 987 | 0.7% |
| Luxembourger | 12 | 0.0% |
| Macedonian | 46 | 0.0% |
| Maltese | 31 | 0.0% |
| Mexican | 505 | 0.4% |
| Mongolian | 17 | 0.0% |
| Native Hawaiian | 3 | 0.0% |
| Nicaraguan | 40 | 0.0% |
| Nigerian | 91 | 0.1% |
| Northern European | 155 | 0.1% |
| Norwegian | 1,421 | 1.0% |
| Pakistani | 65 | 0.0% |
| Palestinian | 26 | 0.0% |
| Panamanian | 3 | 0.0% |
| Paraguayan | 4 | 0.0% |
| Pennsylvania German | 133 | 0.1% |
| Peruvian | 560 | 0.4% |
| Polish | 11,557 | 8.0% |
| Portuguese | 1,048 | 0.7% |
| Puerto Rican | 4,942 | 3.4% |
| Romanian | 275 | 0.2% |
| Russian | 2,302 | 1.6% |
| Salvadoran | 530 | 0.4% |
| Samoan | 13 | 0.0% |
| Scandinavian | 266 | 0.2% |
| Scotch-Irish | 967 | 0.7% |
| Scottish | 2,567 | 1.8% |
| Serbian | 23 | 0.0% |
| Sioux | 44 | 0.0% |
| Slavic | 293 | 0.2% |
| Slovak | 656 | 0.4% |
| Slovene | 38 | 0.0% |
| South African | 126 | 0.1% |
| South American | 3,537 | 2.4% |
| South American Indian | 13 | 0.0% |
| Spaniard | 794 | 0.5% |
| Spanish | 282 | 0.2% |
| Sri Lankan | 160 | 0.1% |
| Subsaharan African | 595 | 0.4% |
| Swedish | 1,758 | 1.2% |
| Swiss | 409 | 0.3% |
| Syrian | 72 | 0.1% |
| Thai | 956 | 0.7% |
| Turkish | 400 | 0.3% |
| Ukrainian | 1,468 | 1.0% |
| Uruguayan | 116 | 0.1% |
| Venezuelan | 11 | 0.0% |
| Welsh | 662 | 0.5% |
| West Indian | 298 | 0.2% |
| Yugoslavian | 68 | 0.1% | View All 125 Rows |
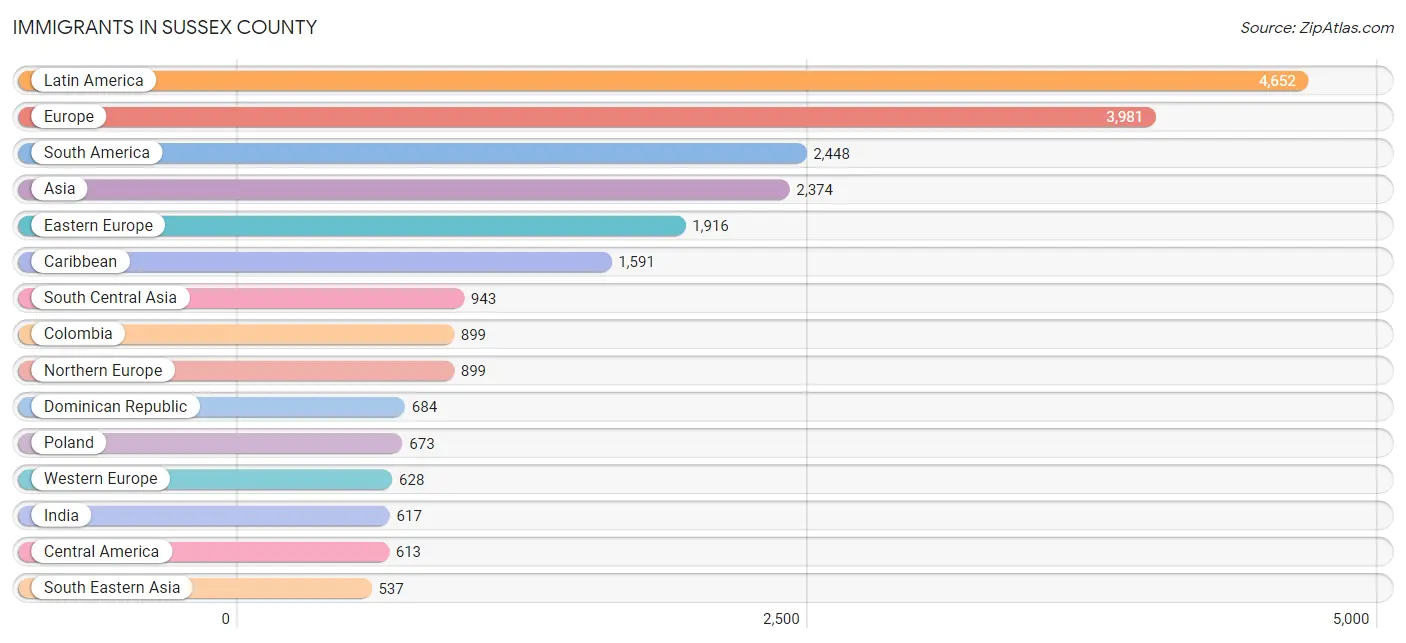
Immigrants in Sussex County
The most numerous immigrant groups reported in Sussex County came from Latin America (4,652 | 3.2%), Europe (3,981 | 2.8%), South America (2,448 | 1.7%), Asia (2,374 | 1.6%), and Eastern Europe (1,916 | 1.3%), together accounting for 10.6% of all Sussex County residents.
| Immigration Origin | # Population | % Population |
| Afghanistan | 114 | 0.1% |
| Africa | 441 | 0.3% |
| Albania | 46 | 0.0% |
| Argentina | 299 | 0.2% |
| Asia | 2,374 | 1.6% |
| Australia | 10 | 0.0% |
| Austria | 75 | 0.1% |
| Barbados | 23 | 0.0% |
| Belarus | 23 | 0.0% |
| Bolivia | 70 | 0.1% |
| Bosnia and Herzegovina | 15 | 0.0% |
| Brazil | 308 | 0.2% |
| Bulgaria | 32 | 0.0% |
| Cambodia | 14 | 0.0% |
| Cameroon | 22 | 0.0% |
| Canada | 285 | 0.2% |
| Caribbean | 1,591 | 1.1% |
| Central America | 613 | 0.4% |
| Chile | 84 | 0.1% |
| China | 262 | 0.2% |
| Colombia | 899 | 0.6% |
| Costa Rica | 83 | 0.1% |
| Croatia | 101 | 0.1% |
| Cuba | 534 | 0.4% |
| Czechoslovakia | 56 | 0.0% |
| Denmark | 17 | 0.0% |
| Dominica | 1 | 0.0% |
| Dominican Republic | 684 | 0.5% |
| Eastern Africa | 60 | 0.0% |
| Eastern Asia | 434 | 0.3% |
| Eastern Europe | 1,916 | 1.3% |
| Ecuador | 412 | 0.3% |
| Egypt | 66 | 0.1% |
| El Salvador | 262 | 0.2% |
| England | 267 | 0.2% |
| Ethiopia | 18 | 0.0% |
| Europe | 3,981 | 2.8% |
| France | 75 | 0.1% |
| Germany | 329 | 0.2% |
| Ghana | 128 | 0.1% |
| Greece | 111 | 0.1% |
| Grenada | 12 | 0.0% |
| Guatemala | 84 | 0.1% |
| Guyana | 65 | 0.0% |
| Haiti | 123 | 0.1% |
| Honduras | 93 | 0.1% |
| Hong Kong | 42 | 0.0% |
| Hungary | 56 | 0.0% |
| India | 617 | 0.4% |
| Iran | 76 | 0.1% |
| Iraq | 34 | 0.0% |
| Ireland | 252 | 0.2% |
| Israel | 45 | 0.0% |
| Italy | 265 | 0.2% |
| Jamaica | 151 | 0.1% |
| Japan | 55 | 0.0% |
| Jordan | 23 | 0.0% |
| Kazakhstan | 13 | 0.0% |
| Kenya | 42 | 0.0% |
| Korea | 111 | 0.1% |
| Latin America | 4,652 | 3.2% |
| Lebanon | 40 | 0.0% |
| Lithuania | 35 | 0.0% |
| Malaysia | 14 | 0.0% |
| Mexico | 36 | 0.0% |
| Middle Africa | 22 | 0.0% |
| Moldova | 12 | 0.0% |
| Nepal | 1 | 0.0% |
| Netherlands | 142 | 0.1% |
| Nicaragua | 52 | 0.0% |
| Nigeria | 41 | 0.0% |
| North Macedonia | 83 | 0.1% |
| Northern Africa | 66 | 0.1% |
| Northern Europe | 899 | 0.6% |
| Oceania | 10 | 0.0% |
| Pakistan | 84 | 0.1% |
| Panama | 3 | 0.0% |
| Peru | 201 | 0.1% |
| Philippines | 359 | 0.3% |
| Poland | 673 | 0.5% |
| Portugal | 107 | 0.1% |
| Romania | 114 | 0.1% |
| Russia | 173 | 0.1% |
| Scotland | 101 | 0.1% |
| Serbia | 7 | 0.0% |
| South Africa | 42 | 0.0% |
| South America | 2,448 | 1.7% |
| South Central Asia | 943 | 0.6% |
| South Eastern Asia | 537 | 0.4% |
| Southern Europe | 534 | 0.4% |
| Spain | 51 | 0.0% |
| Sri Lanka | 6 | 0.0% |
| Sweden | 46 | 0.0% |
| Switzerland | 7 | 0.0% |
| Syria | 14 | 0.0% |
| Taiwan | 49 | 0.0% |
| Thailand | 32 | 0.0% |
| Trinidad and Tobago | 63 | 0.0% |
| Turkey | 238 | 0.2% |
| Ukraine | 308 | 0.2% |
| Uruguay | 86 | 0.1% |
| Uzbekistan | 32 | 0.0% |
| Venezuela | 11 | 0.0% |
| Vietnam | 107 | 0.1% |
| Western Africa | 169 | 0.1% |
| Western Asia | 447 | 0.3% |
| Western Europe | 628 | 0.4% | View All 107 Rows |
Sex and Age in Sussex County
Sex and Age in Sussex County
The most populous age groups in Sussex County are 55 to 59 Years (6,351 | 8.7%) for men and 55 to 59 Years (6,635 | 9.2%) for women.
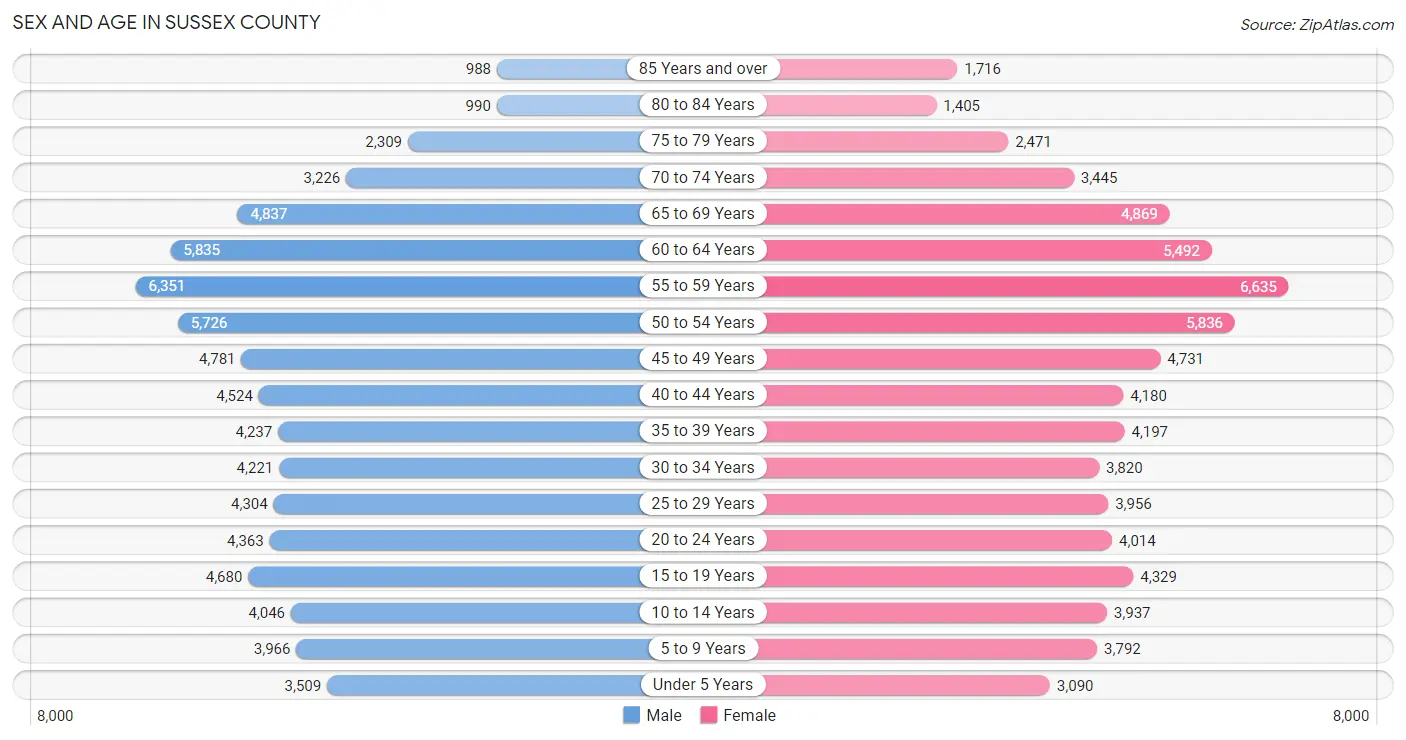
| Age Bracket | Male | Female |
| Under 5 Years | 3,509 (4.8%) | 3,090 (4.3%) |
| 5 to 9 Years | 3,966 (5.4%) | 3,792 (5.3%) |
| 10 to 14 Years | 4,046 (5.6%) | 3,937 (5.5%) |
| 15 to 19 Years | 4,680 (6.4%) | 4,329 (6.0%) |
| 20 to 24 Years | 4,363 (6.0%) | 4,014 (5.6%) |
| 25 to 29 Years | 4,304 (5.9%) | 3,956 (5.5%) |
| 30 to 34 Years | 4,221 (5.8%) | 3,820 (5.3%) |
| 35 to 39 Years | 4,237 (5.8%) | 4,197 (5.8%) |
| 40 to 44 Years | 4,524 (6.2%) | 4,180 (5.8%) |
| 45 to 49 Years | 4,781 (6.6%) | 4,731 (6.6%) |
| 50 to 54 Years | 5,726 (7.9%) | 5,836 (8.1%) |
| 55 to 59 Years | 6,351 (8.7%) | 6,635 (9.2%) |
| 60 to 64 Years | 5,835 (8.0%) | 5,492 (7.6%) |
| 65 to 69 Years | 4,837 (6.6%) | 4,869 (6.8%) |
| 70 to 74 Years | 3,226 (4.4%) | 3,445 (4.8%) |
| 75 to 79 Years | 2,309 (3.2%) | 2,471 (3.4%) |
| 80 to 84 Years | 990 (1.4%) | 1,405 (1.9%) |
| 85 Years and over | 988 (1.4%) | 1,716 (2.4%) |
| Total | 72,893 (100.0%) | 71,915 (100.0%) |
Families and Households in Sussex County
Median Family Size in Sussex County
The median family size in Sussex County is 3.01 persons per family, with married-couple families (32,220 | 80.5%) accounting for the largest median family size of 3.08 persons per family. On the other hand, single male/father families (2,539 | 6.3%) represent the smallest median family size with 2.52 persons per family.
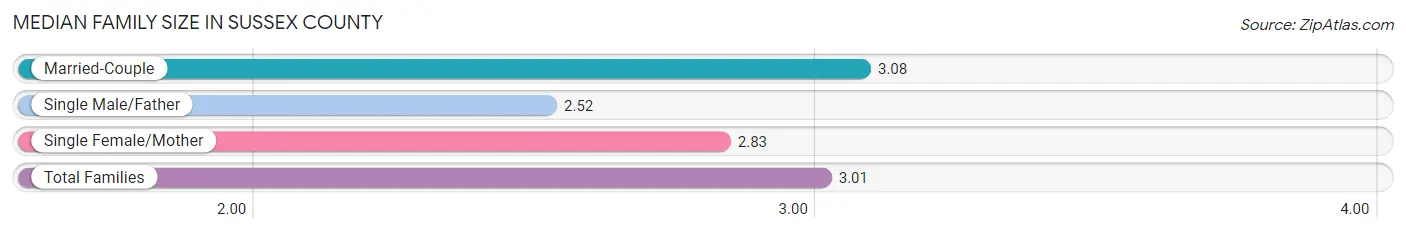
| Family Type | # Families | Family Size |
| Married-Couple | 32,220 (80.5%) | 3.08 |
| Single Male/Father | 2,539 (6.3%) | 2.52 |
| Single Female/Mother | 5,271 (13.2%) | 2.83 |
| Total Families | 40,030 (100.0%) | 3.01 |
Median Household Size in Sussex County
The median household size in Sussex County is 2.54 persons per household, with married-couple households (32,220 | 57.2%) accounting for the largest median household size of 3.09 persons per household. non-family households (16,318 | 29.0%) represent the smallest median household size with 1.23 persons per household.
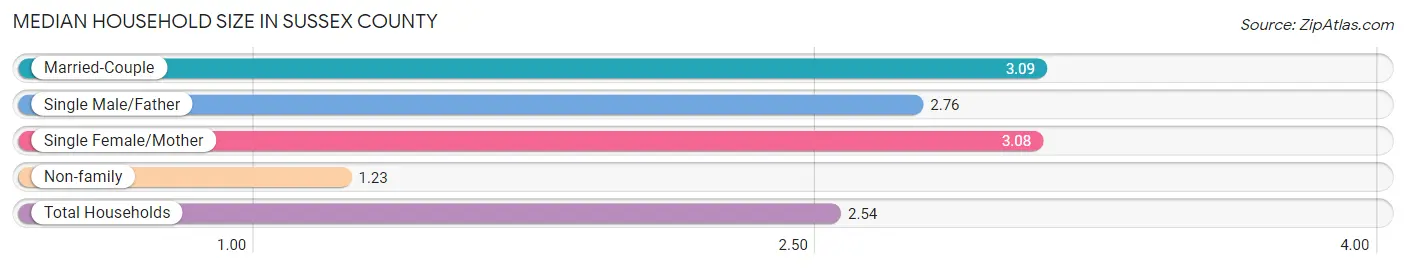
| Household Type | # Households | Household Size |
| Married-Couple | 32,220 (57.2%) | 3.09 |
| Single Male/Father | 2,539 (4.5%) | 2.76 |
| Single Female/Mother | 5,271 (9.3%) | 3.08 |
| Non-family | 16,318 (29.0%) | 1.23 |
| Total Households | 56,348 (100.0%) | 2.54 |
Household Size by Marriage Status in Sussex County
Out of a total of 56,348 households in Sussex County, 40,030 (71.0%) are family households, while 16,318 (29.0%) are nonfamily households. The most numerous type of family households are 2-person households, comprising 17,285, and the most common type of nonfamily households are 1-person households, comprising 12,909.

| Household Size | Family Households | Nonfamily Households |
| 1-Person Households | - | 12,909 (22.9%) |
| 2-Person Households | 17,285 (30.7%) | 3,065 (5.4%) |
| 3-Person Households | 9,627 (17.1%) | 254 (0.4%) |
| 4-Person Households | 8,554 (15.2%) | 58 (0.1%) |
| 5-Person Households | 3,062 (5.4%) | 24 (0.0%) |
| 6-Person Households | 1,054 (1.9%) | 8 (0.0%) |
| 7+ Person Households | 448 (0.8%) | 0 (0.0%) |
| Total | 40,030 (71.0%) | 16,318 (29.0%) |
Female Fertility in Sussex County
Fertility by Age in Sussex County
Average fertility rate in Sussex County is 45.0 births per 1,000 women. Women in the age bracket of 20 to 34 years have the highest fertility rate with 78.0 births per 1,000 women. Women in the age bracket of 20 to 34 years acount for 66.9% of all women with births.
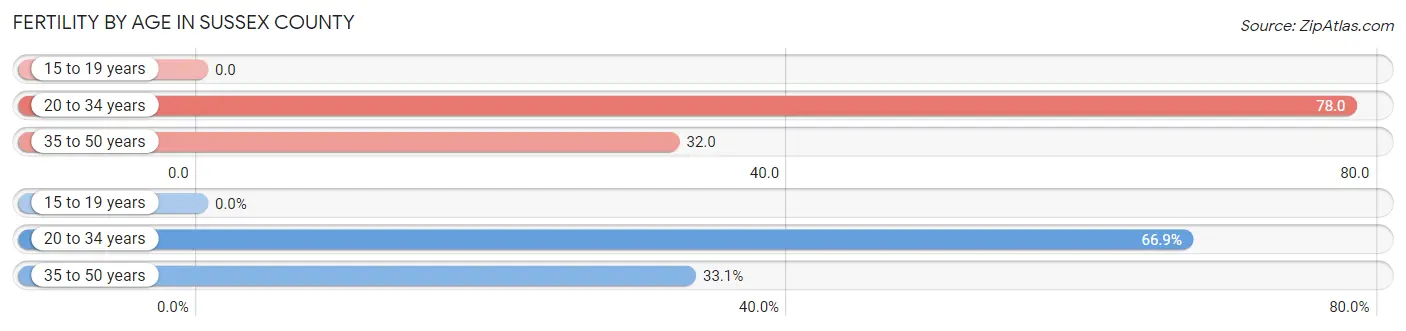
| Age Bracket | Women with Births | Births / 1,000 Women |
| 15 to 19 years | 0 (0.0%) | 0.0 |
| 20 to 34 years | 921 (66.9%) | 78.0 |
| 35 to 50 years | 456 (33.1%) | 32.0 |
| Total | 1,377 (100.0%) | 45.0 |
Fertility by Age by Marriage Status in Sussex County
82.6% of women with births (1,377) in Sussex County are married. The highest percentage of unmarried women with births falls into 20 to 34 years age bracket with 21.7% of them unmarried at the time of birth, while the lowest percentage of unmarried women with births belong to 35 to 50 years age bracket with 8.8% of them unmarried.
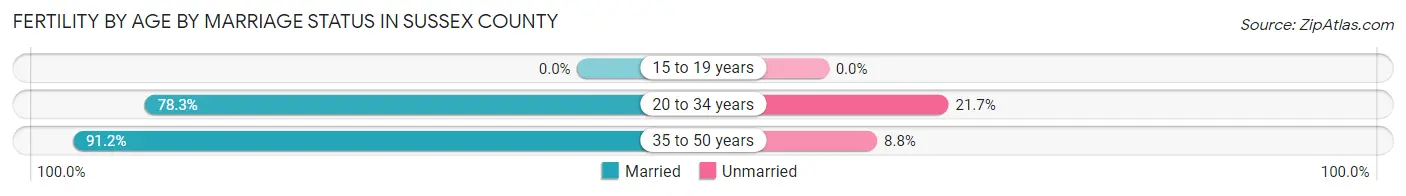
| Age Bracket | Married | Unmarried |
| 15 to 19 years | 0 (0.0%) | 0 (0.0%) |
| 20 to 34 years | 721 (78.3%) | 200 (21.7%) |
| 35 to 50 years | 416 (91.2%) | 40 (8.8%) |
| Total | 1,137 (82.6%) | 240 (17.4%) |
Fertility by Education in Sussex County
Average fertility rate in Sussex County is 45.0 births per 1,000 women. Women with the education attainment of bachelor's degree have the highest fertility rate of 54.0 births per 1,000 women, while women with the education attainment of less than high school have the lowest fertility at 15.0 births per 1,000 women. Women with the education attainment of bachelor's degree represent 33.8% of all women with births.
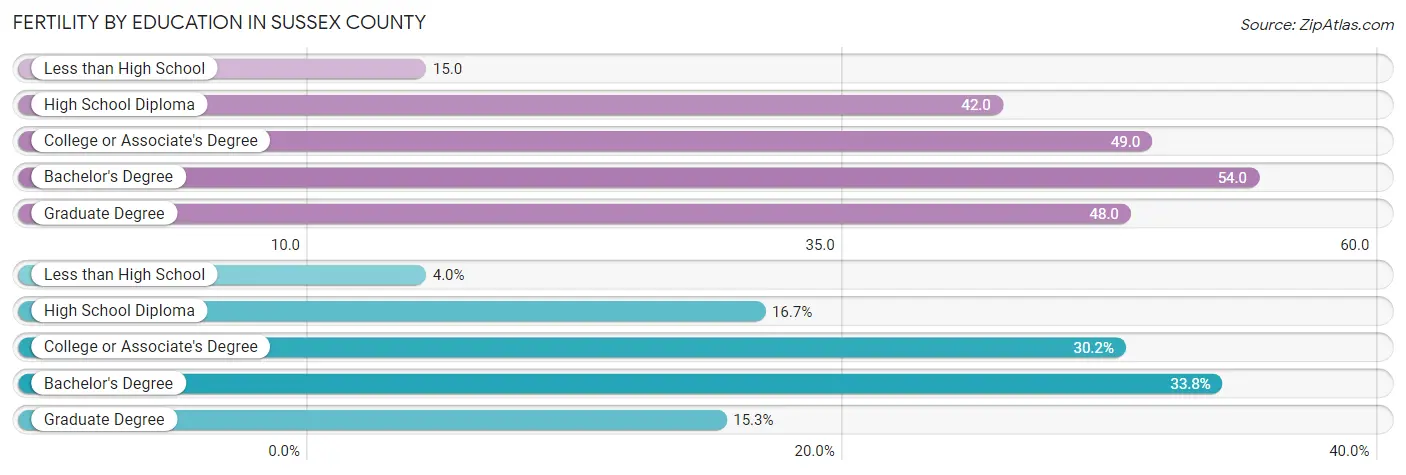
| Educational Attainment | Women with Births | Births / 1,000 Women |
| Less than High School | 55 (4.0%) | 15.0 |
| High School Diploma | 230 (16.7%) | 42.0 |
| College or Associate's Degree | 416 (30.2%) | 49.0 |
| Bachelor's Degree | 466 (33.8%) | 54.0 |
| Graduate Degree | 210 (15.2%) | 48.0 |
| Total | 1,377 (100.0%) | 45.0 |
Fertility by Education by Marriage Status in Sussex County
17.4% of women with births in Sussex County are unmarried. Women with the educational attainment of graduate degree are most likely to be married with 95.7% of them married at childbirth, while women with the educational attainment of less than high school are least likely to be married with 74.6% of them unmarried at childbirth.
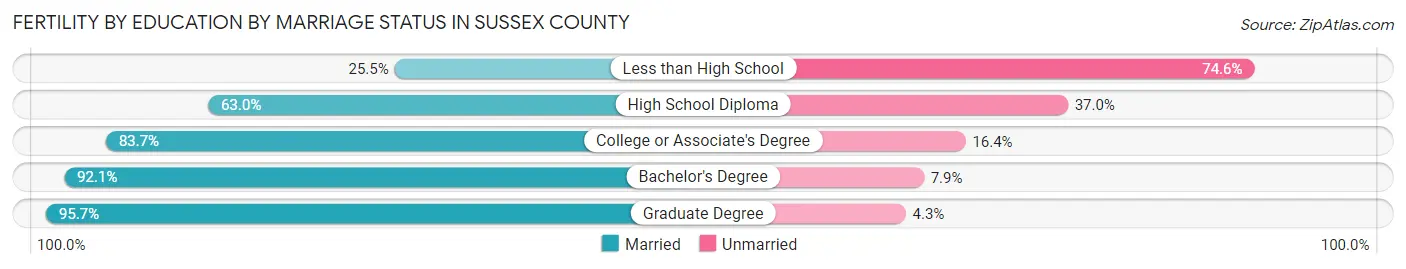
| Educational Attainment | Married | Unmarried |
| Less than High School | 14 (25.5%) | 41 (74.6%) |
| High School Diploma | 145 (63.0%) | 85 (37.0%) |
| College or Associate's Degree | 348 (83.7%) | 68 (16.4%) |
| Bachelor's Degree | 429 (92.1%) | 37 (7.9%) |
| Graduate Degree | 201 (95.7%) | 9 (4.3%) |
| Total | 1,137 (82.6%) | 240 (17.4%) |
Income in Sussex County
Income Overview in Sussex County
Per Capita Income in Sussex County is $54,124, while median incomes of families and households are $130,760 and $111,094 respectively.
| Characteristic | Number | Measure |
| Per Capita Income | 144,808 | $54,124 |
| Median Family Income | 40,030 | $130,760 |
| Mean Family Income | 40,030 | $159,547 |
| Median Household Income | 56,348 | $111,094 |
| Mean Household Income | 56,348 | $138,507 |
| Income Deficit | 40,030 | $11,601 |
| Wage / Income Gap (%) | 144,808 | 31.11% |
| Wage / Income Gap ($) | 144,808 | 68.89¢ per $1 |
| Gini / Inequality Index | 144,808 | 0.42 |
Earnings by Sex in Sussex County
Average Earnings in Sussex County are $57,282, $67,235 for men and $46,317 for women, a difference of 31.1%.
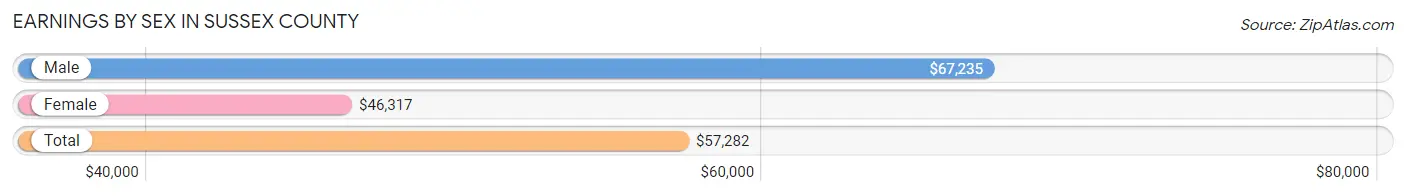
| Sex | Number | Average Earnings |
| Male | 44,906 (52.7%) | $67,235 |
| Female | 40,328 (47.3%) | $46,317 |
| Total | 85,234 (100.0%) | $57,282 |
Earnings by Sex by Income Bracket in Sussex County
The most common earnings brackets in Sussex County are $100,000+ for men (13,330 | 29.7%) and $100,000+ for women (6,681 | 16.6%).
| Income | Male | Female |
| $2,499 or less | 1,517 (3.4%) | 2,225 (5.5%) |
| $2,500 to $4,999 | 928 (2.1%) | 1,461 (3.6%) |
| $5,000 to $7,499 | 1,127 (2.5%) | 1,600 (4.0%) |
| $7,500 to $9,999 | 860 (1.9%) | 881 (2.2%) |
| $10,000 to $12,499 | 729 (1.6%) | 1,158 (2.9%) |
| $12,500 to $14,999 | 594 (1.3%) | 1,192 (3.0%) |
| $15,000 to $17,499 | 730 (1.6%) | 1,060 (2.6%) |
| $17,500 to $19,999 | 583 (1.3%) | 708 (1.8%) |
| $20,000 to $22,499 | 875 (1.9%) | 951 (2.4%) |
| $22,500 to $24,999 | 928 (2.1%) | 1,299 (3.2%) |
| $25,000 to $29,999 | 1,881 (4.2%) | 2,117 (5.2%) |
| $30,000 to $34,999 | 1,381 (3.1%) | 1,694 (4.2%) |
| $35,000 to $39,999 | 1,330 (3.0%) | 1,600 (4.0%) |
| $40,000 to $44,999 | 1,373 (3.1%) | 1,590 (3.9%) |
| $45,000 to $49,999 | 2,056 (4.6%) | 1,710 (4.2%) |
| $50,000 to $54,999 | 1,646 (3.7%) | 1,461 (3.6%) |
| $55,000 to $64,999 | 3,266 (7.3%) | 3,028 (7.5%) |
| $65,000 to $74,999 | 2,946 (6.6%) | 3,007 (7.5%) |
| $75,000 to $99,999 | 6,826 (15.2%) | 4,905 (12.2%) |
| $100,000+ | 13,330 (29.7%) | 6,681 (16.6%) |
| Total | 44,906 (100.0%) | 40,328 (100.0%) |
Earnings by Sex by Educational Attainment in Sussex County
Average earnings in Sussex County are $76,326 for men and $54,979 for women, a difference of 28.0%. Men with an educational attainment of graduate degree enjoy the highest average annual earnings of $124,464, while those with less than high school education earn the least with $50,370. Women with an educational attainment of graduate degree earn the most with the average annual earnings of $83,608, while those with less than high school education have the smallest earnings of $27,000.
| Educational Attainment | Male Income | Female Income |
| Less than High School | $50,370 | $27,000 |
| High School Diploma | $59,893 | $37,669 |
| College or Associate's Degree | $69,212 | $44,148 |
| Bachelor's Degree | $92,320 | $62,904 |
| Graduate Degree | $124,464 | $83,608 |
| Total | $76,326 | $54,979 |
Family Income in Sussex County
Family Income Brackets in Sussex County
According to the Sussex County family income data, there are 9,687 families falling into the $100,000 to $149,999 income range, which is the most common income bracket and makes up 24.2% of all families. Conversely, the $10,000 to $14,999 income bracket is the least frequent group with only 280 families (0.7%) belonging to this category.
| Income Bracket | # Families | % Families |
| Less than $10,000 | 681 | 1.7% |
| $10,000 to $14,999 | 280 | 0.7% |
| $15,000 to $24,999 | 801 | 2.0% |
| $25,000 to $34,999 | 801 | 2.0% |
| $35,000 to $49,999 | 1,961 | 4.9% |
| $50,000 to $74,999 | 4,443 | 11.1% |
| $75,000 to $99,999 | 4,764 | 11.9% |
| $100,000 to $149,999 | 9,687 | 24.2% |
| $150,000 to $199,999 | 7,085 | 17.7% |
| $200,000+ | 9,607 | 24.0% |
Family Income by Famaliy Size in Sussex County
6-person families (925 | 2.3%) account for the highest median family income in Sussex County with $186,875 per family, while 2-person families (18,223 | 45.5%) have the highest median income of $55,130 per family member.
| Income Bracket | # Families | Median Income |
| 2-Person Families | 18,223 (45.5%) | $110,261 |
| 3-Person Families | 9,318 (23.3%) | $135,204 |
| 4-Person Families | 8,399 (21.0%) | $156,987 |
| 5-Person Families | 2,763 (6.9%) | $167,788 |
| 6-Person Families | 925 (2.3%) | $186,875 |
| 7+ Person Families | 402 (1.0%) | $124,545 |
| Total | 40,030 (100.0%) | $130,760 |
Family Income by Number of Earners in Sussex County
The median family income in Sussex County is $130,760, with families comprising 3+ earners (6,158) having the highest median family income of $185,417, while families with no earners (4,722) have the lowest median family income of $73,906, accounting for 15.4% and 11.8% of families, respectively.
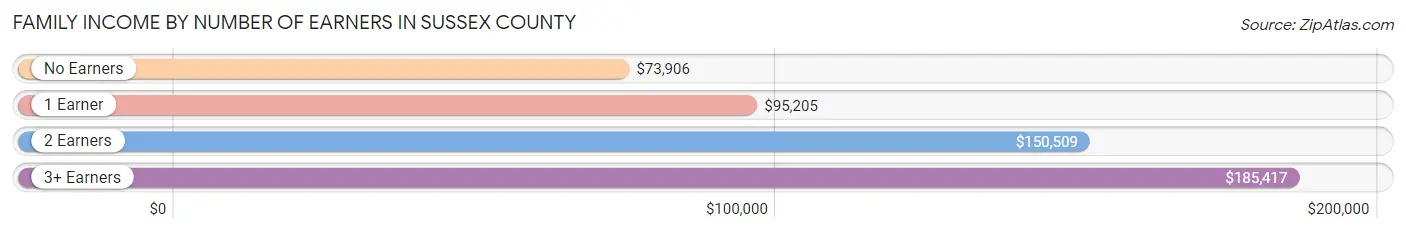
| Number of Earners | # Families | Median Income |
| No Earners | 4,722 (11.8%) | $73,906 |
| 1 Earner | 10,361 (25.9%) | $95,205 |
| 2 Earners | 18,789 (46.9%) | $150,509 |
| 3+ Earners | 6,158 (15.4%) | $185,417 |
| Total | 40,030 (100.0%) | $130,760 |
Household Income in Sussex County
Household Income Brackets in Sussex County
With 12,397 households falling in the category, the $100,000 to $149,999 income range is the most frequent in Sussex County, accounting for 22.0% of all households. In contrast, only 620 households (1.1%) fall into the $10,000 to $14,999 income bracket, making it the least populous group.
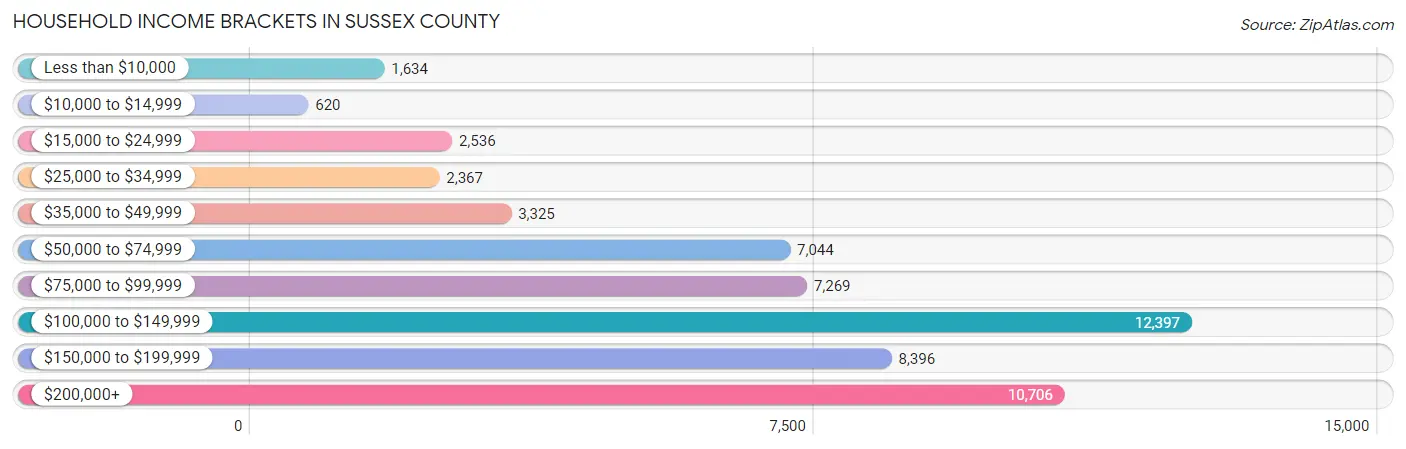
| Income Bracket | # Households | % Households |
| Less than $10,000 | 1,634 | 2.9% |
| $10,000 to $14,999 | 620 | 1.1% |
| $15,000 to $24,999 | 2,536 | 4.5% |
| $25,000 to $34,999 | 2,367 | 4.2% |
| $35,000 to $49,999 | 3,325 | 5.9% |
| $50,000 to $74,999 | 7,044 | 12.5% |
| $75,000 to $99,999 | 7,269 | 12.9% |
| $100,000 to $149,999 | 12,397 | 22.0% |
| $150,000 to $199,999 | 8,396 | 14.9% |
| $200,000+ | 10,706 | 19.0% |
Household Income by Householder Age in Sussex County
The median household income in Sussex County is $111,094, with the highest median household income of $132,941 found in the 45 to 64 years age bracket for the primary householder. A total of 25,474 households (45.2%) fall into this category. Meanwhile, the 15 to 24 years age bracket for the primary householder has the lowest median household income of $58,354, with 687 households (1.2%) in this group.
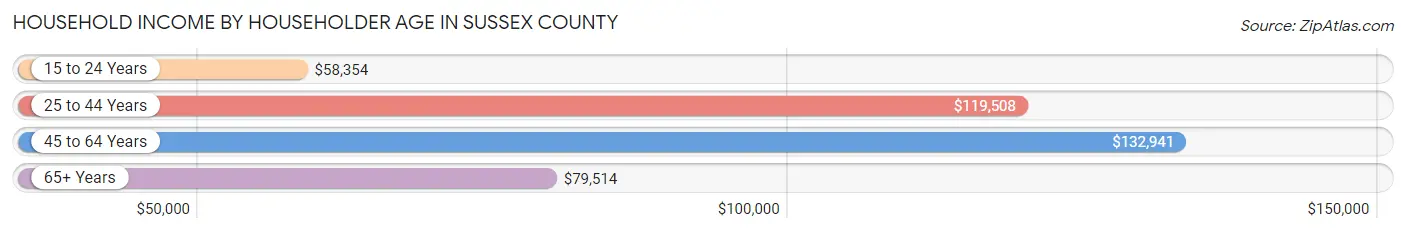
| Income Bracket | # Households | Median Income |
| 15 to 24 Years | 687 (1.2%) | $58,354 |
| 25 to 44 Years | 14,420 (25.6%) | $119,508 |
| 45 to 64 Years | 25,474 (45.2%) | $132,941 |
| 65+ Years | 15,767 (28.0%) | $79,514 |
| Total | 56,348 (100.0%) | $111,094 |
Poverty in Sussex County
Income Below Poverty by Sex and Age in Sussex County
With 5.0% poverty level for males and 6.1% for females among the residents of Sussex County, 6 to 11 year old males and 5 year old females are the most vulnerable to poverty, with 462 males (9.9%) and 146 females (17.6%) in their respective age groups living below the poverty level.
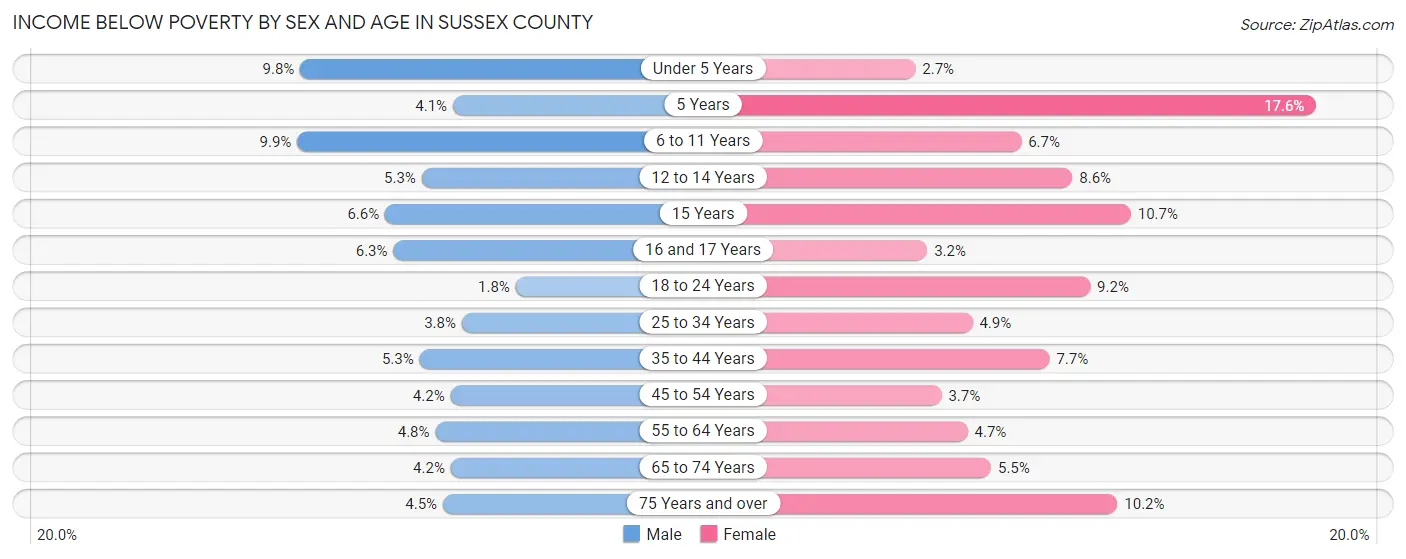
| Age Bracket | Male | Female |
| Under 5 Years | 337 (9.8%) | 84 (2.7%) |
| 5 Years | 33 (4.1%) | 146 (17.6%) |
| 6 to 11 Years | 462 (9.9%) | 297 (6.7%) |
| 12 to 14 Years | 127 (5.3%) | 201 (8.6%) |
| 15 Years | 66 (6.6%) | 113 (10.7%) |
| 16 and 17 Years | 124 (6.3%) | 55 (3.2%) |
| 18 to 24 Years | 107 (1.8%) | 511 (9.2%) |
| 25 to 34 Years | 320 (3.8%) | 377 (4.9%) |
| 35 to 44 Years | 465 (5.3%) | 646 (7.7%) |
| 45 to 54 Years | 437 (4.2%) | 391 (3.7%) |
| 55 to 64 Years | 576 (4.8%) | 562 (4.7%) |
| 65 to 74 Years | 332 (4.2%) | 448 (5.5%) |
| 75 Years and over | 188 (4.5%) | 543 (10.2%) |
| Total | 3,574 (5.0%) | 4,374 (6.1%) |
Income Above Poverty by Sex and Age in Sussex County
According to the poverty statistics in Sussex County, males aged 18 to 24 years and females aged under 5 years are the age groups that are most secure financially, with 98.2% of males and 97.3% of females in these age groups living above the poverty line.
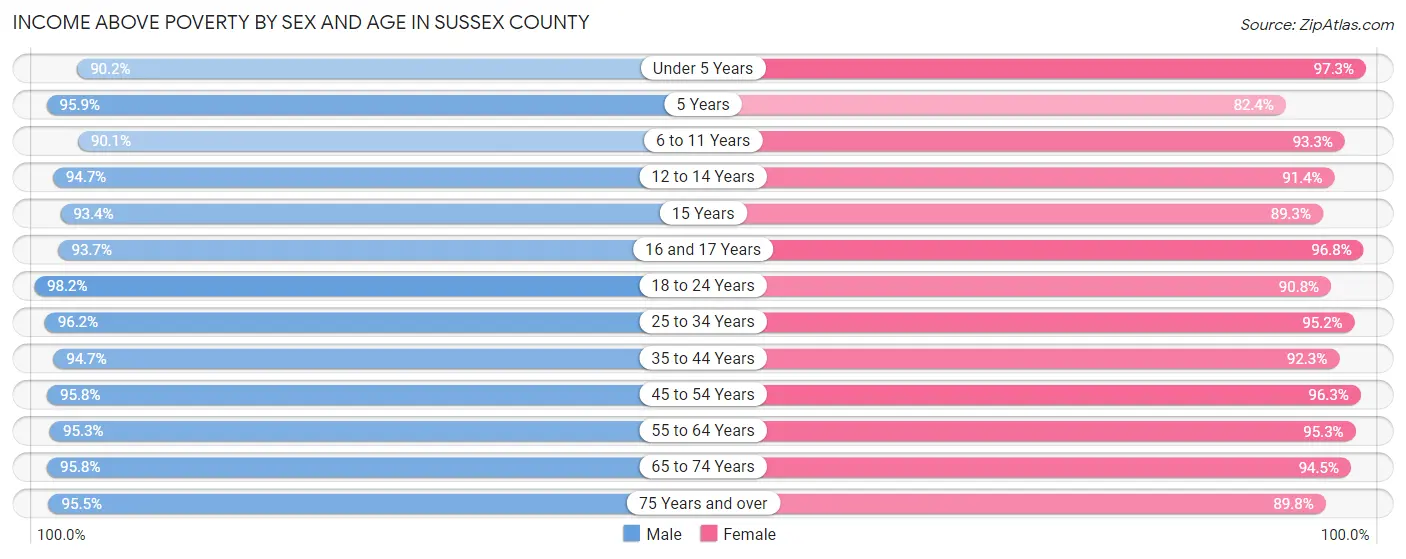
| Age Bracket | Male | Female |
| Under 5 Years | 3,111 (90.2%) | 2,990 (97.3%) |
| 5 Years | 771 (95.9%) | 683 (82.4%) |
| 6 to 11 Years | 4,215 (90.1%) | 4,163 (93.3%) |
| 12 to 14 Years | 2,287 (94.7%) | 2,148 (91.4%) |
| 15 Years | 931 (93.4%) | 940 (89.3%) |
| 16 and 17 Years | 1,842 (93.7%) | 1,679 (96.8%) |
| 18 to 24 Years | 5,930 (98.2%) | 5,030 (90.8%) |
| 25 to 34 Years | 8,179 (96.2%) | 7,394 (95.2%) |
| 35 to 44 Years | 8,250 (94.7%) | 7,731 (92.3%) |
| 45 to 54 Years | 9,996 (95.8%) | 10,172 (96.3%) |
| 55 to 64 Years | 11,539 (95.3%) | 11,479 (95.3%) |
| 65 to 74 Years | 7,607 (95.8%) | 7,640 (94.5%) |
| 75 Years and over | 4,014 (95.5%) | 4,765 (89.8%) |
| Total | 68,672 (95.1%) | 66,814 (93.9%) |
Income Below Poverty Among Married-Couple Families in Sussex County
The poverty statistics for married-couple families in Sussex County show that 2.1% or 661 of the total 32,220 families live below the poverty line. Families with 3 or 4 children have the highest poverty rate of 3.6%, comprising of 70 families. On the other hand, families with 5 or more children have the lowest poverty rate of 0.0%, which includes 0 families.
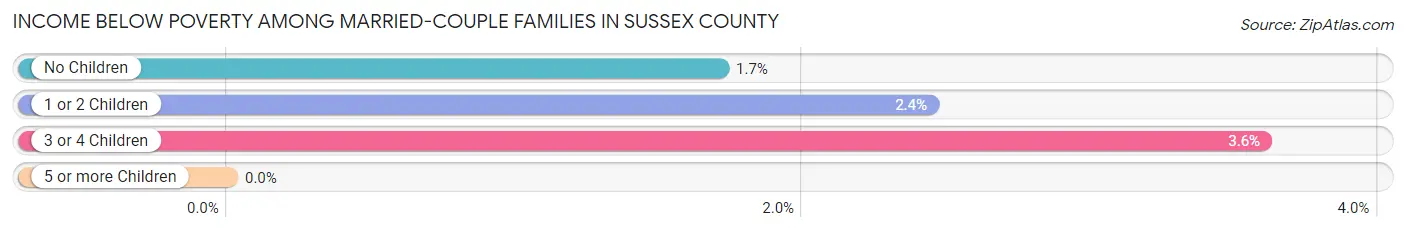
| Children | Above Poverty | Below Poverty |
| No Children | 19,568 (98.3%) | 341 (1.7%) |
| 1 or 2 Children | 9,993 (97.6%) | 250 (2.4%) |
| 3 or 4 Children | 1,872 (96.4%) | 70 (3.6%) |
| 5 or more Children | 126 (100.0%) | 0 (0.0%) |
| Total | 31,559 (98.0%) | 661 (2.1%) |
Income Below Poverty Among Single-Parent Households in Sussex County
According to the poverty data in Sussex County, 4.5% or 114 single-father households and 12.8% or 677 single-mother households are living below the poverty line. Among single-father households, those with 1 or 2 children have the highest poverty rate, with 65 households (5.7%) experiencing poverty. Likewise, among single-mother households, those with 5 or more children have the highest poverty rate, with 26 households (100.0%) falling below the poverty line.
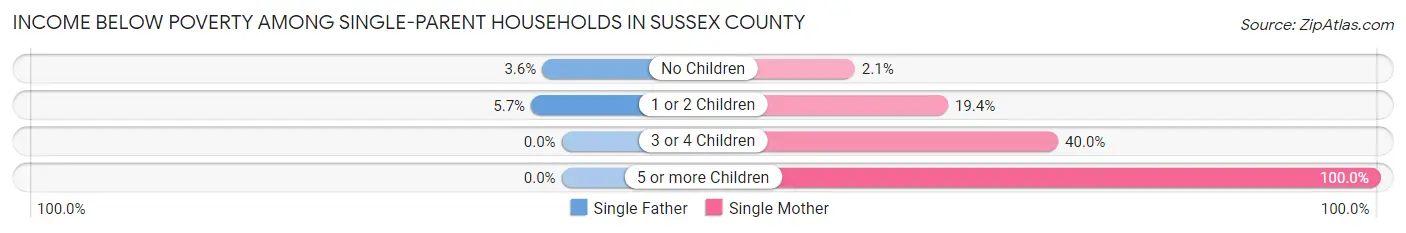
| Children | Single Father | Single Mother |
| No Children | 49 (3.6%) | 54 (2.1%) |
| 1 or 2 Children | 65 (5.7%) | 440 (19.4%) |
| 3 or 4 Children | 0 (0.0%) | 157 (40.0%) |
| 5 or more Children | 0 (0.0%) | 26 (100.0%) |
| Total | 114 (4.5%) | 677 (12.8%) |
Income Below Poverty Among Married-Couple vs Single-Parent Households in Sussex County
The poverty data for Sussex County shows that 661 of the married-couple family households (2.1%) and 791 of the single-parent households (10.1%) are living below the poverty level. Within the married-couple family households, those with 3 or 4 children have the highest poverty rate, with 70 households (3.6%) falling below the poverty line. Among the single-parent households, those with 5 or more children have the highest poverty rate, with 26 household (100.0%) living below poverty.
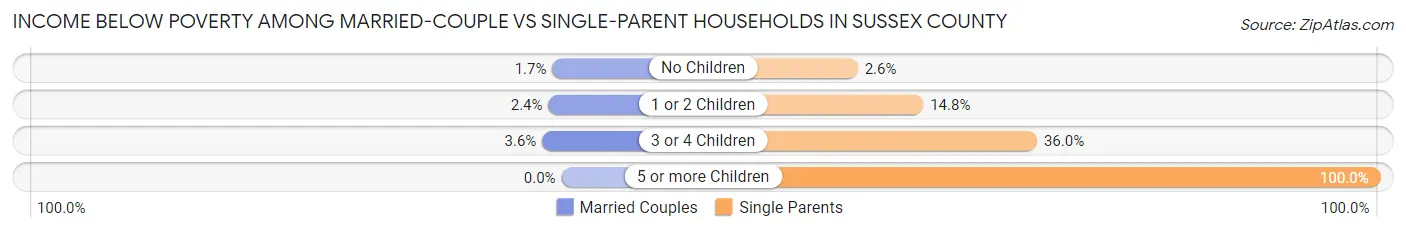
| Children | Married-Couple Families | Single-Parent Households |
| No Children | 341 (1.7%) | 103 (2.6%) |
| 1 or 2 Children | 250 (2.4%) | 505 (14.8%) |
| 3 or 4 Children | 70 (3.6%) | 157 (36.0%) |
| 5 or more Children | 0 (0.0%) | 26 (100.0%) |
| Total | 661 (2.1%) | 791 (10.1%) |
Employment Characteristics in Sussex County
Employment by Class of Employer in Sussex County
Among the 75,861 employed individuals in Sussex County, private company employees (51,756 | 68.2%), local government employees (8,085 | 10.7%), and not-for-profit organizations (5,069 | 6.7%) make up the most common classes of employment.
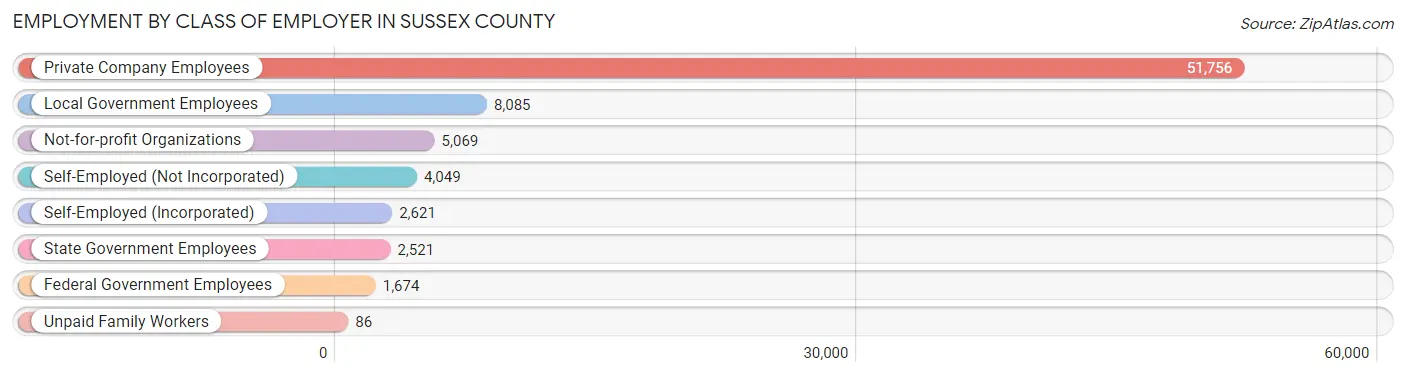
| Employer Class | # Employees | % Employees |
| Private Company Employees | 51,756 | 68.2% |
| Self-Employed (Incorporated) | 2,621 | 3.5% |
| Self-Employed (Not Incorporated) | 4,049 | 5.3% |
| Not-for-profit Organizations | 5,069 | 6.7% |
| Local Government Employees | 8,085 | 10.7% |
| State Government Employees | 2,521 | 3.3% |
| Federal Government Employees | 1,674 | 2.2% |
| Unpaid Family Workers | 86 | 0.1% |
| Total | 75,861 | 100.0% |
Employment Status by Age in Sussex County
According to the labor force statistics for Sussex County, out of the total population over 16 years of age (120,413), 68.4% or 82,362 individuals are in the labor force, with 5.5% or 4,530 of them unemployed. The age group with the highest labor force participation rate is 30 to 34 years, with 89.7% or 7,213 individuals in the labor force. Within the labor force, the 16 to 19 years age range has the highest percentage of unemployed individuals, with 13.1% or 375 of them being unemployed.
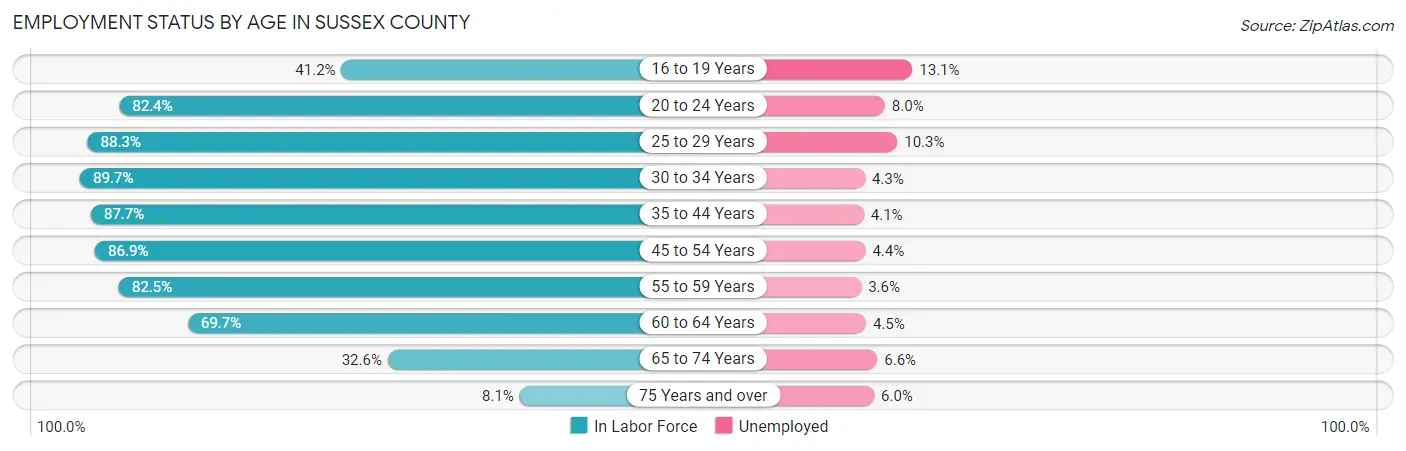
| Age Bracket | In Labor Force | Unemployed |
| 16 to 19 Years | 2,865 (41.2%) | 375 (13.1%) |
| 20 to 24 Years | 6,903 (82.4%) | 552 (8.0%) |
| 25 to 29 Years | 7,294 (88.3%) | 751 (10.3%) |
| 30 to 34 Years | 7,213 (89.7%) | 310 (4.3%) |
| 35 to 44 Years | 15,030 (87.7%) | 616 (4.1%) |
| 45 to 54 Years | 18,313 (86.9%) | 806 (4.4%) |
| 55 to 59 Years | 10,713 (82.5%) | 386 (3.6%) |
| 60 to 64 Years | 7,895 (69.7%) | 355 (4.5%) |
| 65 to 74 Years | 5,339 (32.6%) | 352 (6.6%) |
| 75 Years and over | 800 (8.1%) | 48 (6.0%) |
| Total | 82,362 (68.4%) | 4,530 (5.5%) |
Employment Status by Educational Attainment in Sussex County
According to labor force statistics for Sussex County, 84.3% of individuals (66,450) out of the total population between 25 and 64 years of age (78,826) are in the labor force, with 4.8% or 3,190 of them being unemployed. The group with the highest labor force participation rate are those with the educational attainment of bachelor's degree or higher, with 89.0% or 28,722 individuals in the labor force. Within the labor force, individuals with less than high school education have the highest percentage of unemployment, with 16.9% or 306 of them being unemployed.
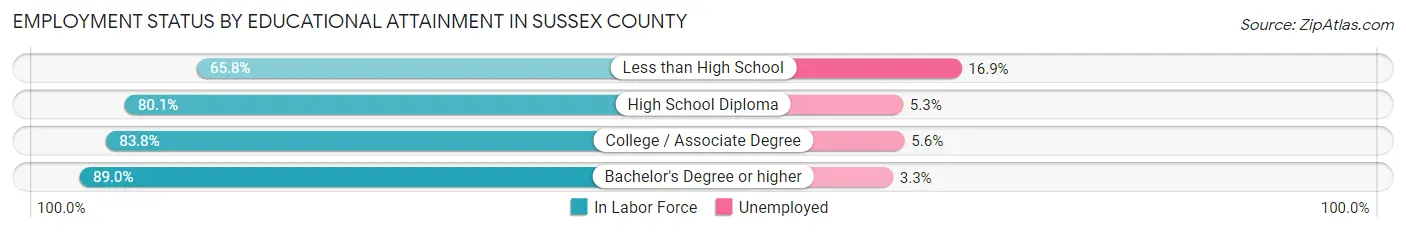
| Educational Attainment | In Labor Force | Unemployed |
| Less than High School | 1,813 (65.8%) | 466 (16.9%) |
| High School Diploma | 16,412 (80.1%) | 1,086 (5.3%) |
| College / Associate Degree | 19,534 (83.8%) | 1,305 (5.6%) |
| Bachelor's Degree or higher | 28,722 (89.0%) | 1,065 (3.3%) |
| Total | 66,450 (84.3%) | 3,784 (4.8%) |
Employment Occupations by Sex in Sussex County
Management, Business, Science and Arts Occupations
The most common Management, Business, Science and Arts occupations in Sussex County are Community & Social Service (10,282 | 13.2%), Management (9,461 | 12.2%), Education Instruction & Library (6,551 | 8.4%), Computers, Engineering & Science (5,336 | 6.9%), and Health Diagnosing & Treating (4,824 | 6.2%).

Management, Business, Science and Arts Occupations by Sex
Within the Management, Business, Science and Arts occupations in Sussex County, the most male-oriented occupations are Architecture & Engineering (89.3%), Computers, Engineering & Science (72.6%), and Computers & Mathematics (71.9%), while the most female-oriented occupations are Health Technologists (82.9%), Health Diagnosing & Treating (80.7%), and Education Instruction & Library (77.8%).
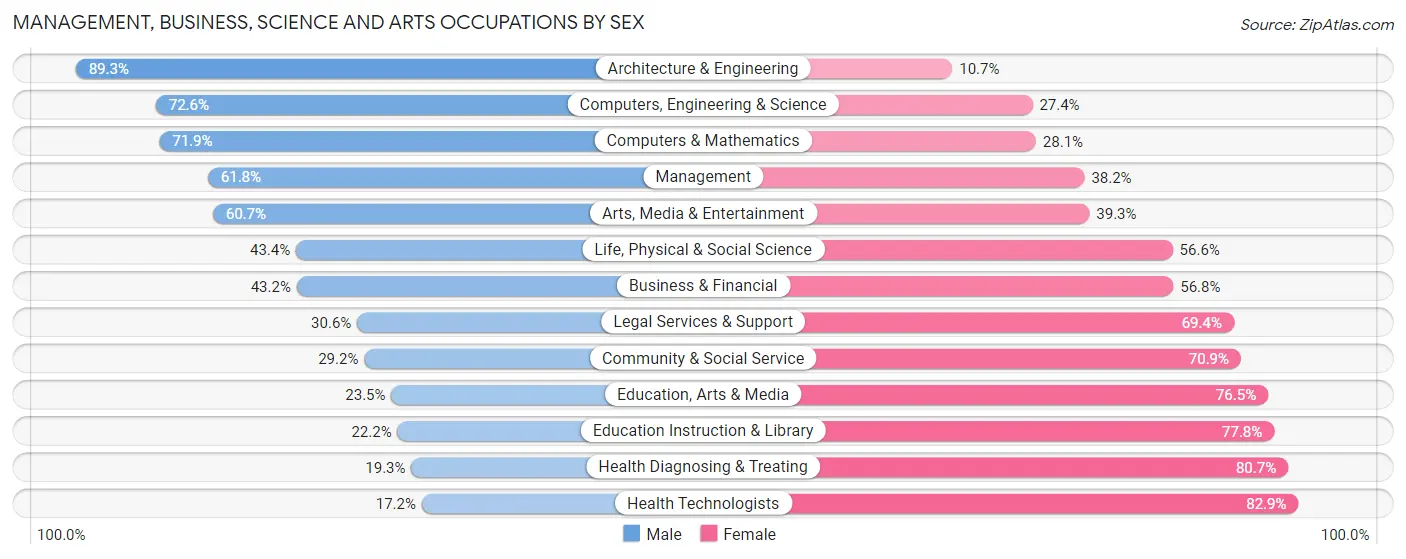
| Occupation | Male | Female |
| Management | 5,844 (61.8%) | 3,617 (38.2%) |
| Business & Financial | 1,859 (43.2%) | 2,441 (56.8%) |
| Computers, Engineering & Science | 3,875 (72.6%) | 1,461 (27.4%) |
| Computers & Mathematics | 1,731 (71.9%) | 677 (28.1%) |
| Architecture & Engineering | 1,699 (89.3%) | 203 (10.7%) |
| Life, Physical & Social Science | 445 (43.4%) | 581 (56.6%) |
| Community & Social Service | 2,997 (29.1%) | 7,285 (70.9%) |
| Education, Arts & Media | 241 (23.5%) | 785 (76.5%) |
| Legal Services & Support | 348 (30.6%) | 788 (69.4%) |
| Education Instruction & Library | 1,455 (22.2%) | 5,096 (77.8%) |
| Arts, Media & Entertainment | 953 (60.7%) | 616 (39.3%) |
| Health Diagnosing & Treating | 932 (19.3%) | 3,892 (80.7%) |
| Health Technologists | 547 (17.2%) | 2,643 (82.9%) |
| Total (Category) | 15,507 (45.3%) | 18,696 (54.7%) |
| Total (Overall) | 41,263 (53.0%) | 36,547 (47.0%) |
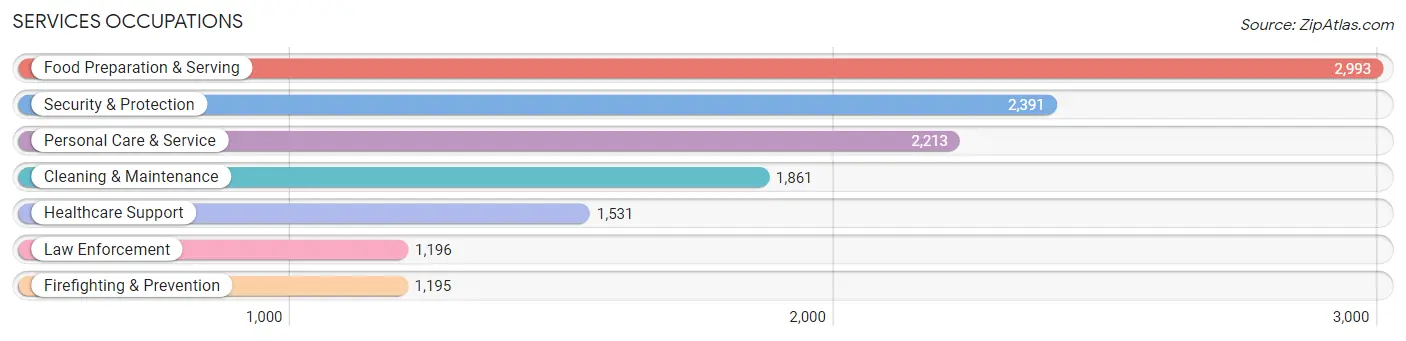
Services Occupations
The most common Services occupations in Sussex County are Food Preparation & Serving (2,993 | 3.8%), Security & Protection (2,391 | 3.1%), Personal Care & Service (2,213 | 2.8%), Cleaning & Maintenance (1,861 | 2.4%), and Healthcare Support (1,531 | 2.0%).
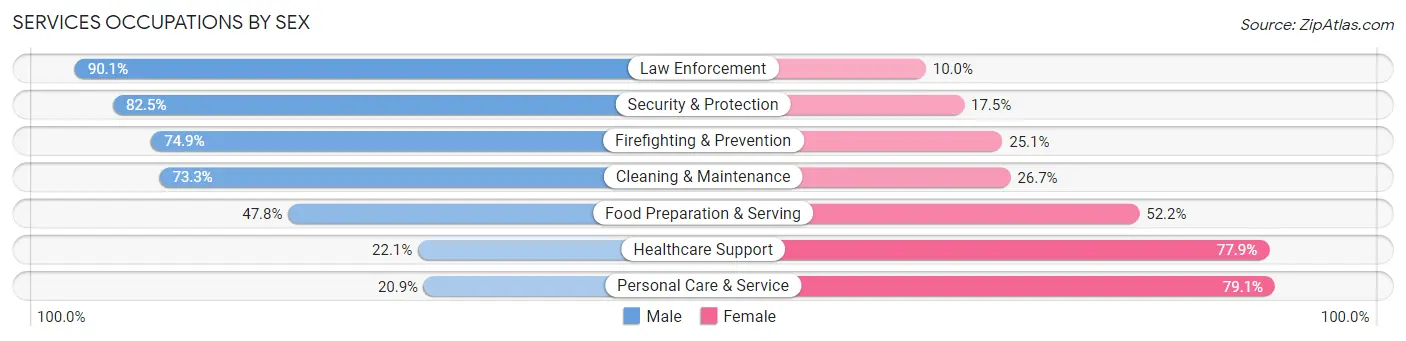
Services Occupations by Sex
Within the Services occupations in Sussex County, the most male-oriented occupations are Law Enforcement (90.0%), Security & Protection (82.5%), and Firefighting & Prevention (74.9%), while the most female-oriented occupations are Personal Care & Service (79.1%), Healthcare Support (77.9%), and Food Preparation & Serving (52.2%).
| Occupation | Male | Female |
| Healthcare Support | 338 (22.1%) | 1,193 (77.9%) |
| Security & Protection | 1,972 (82.5%) | 419 (17.5%) |
| Firefighting & Prevention | 895 (74.9%) | 300 (25.1%) |
| Law Enforcement | 1,077 (90.0%) | 119 (10.0%) |
| Food Preparation & Serving | 1,430 (47.8%) | 1,563 (52.2%) |
| Cleaning & Maintenance | 1,364 (73.3%) | 497 (26.7%) |
| Personal Care & Service | 463 (20.9%) | 1,750 (79.1%) |
| Total (Category) | 5,567 (50.7%) | 5,422 (49.3%) |
| Total (Overall) | 41,263 (53.0%) | 36,547 (47.0%) |
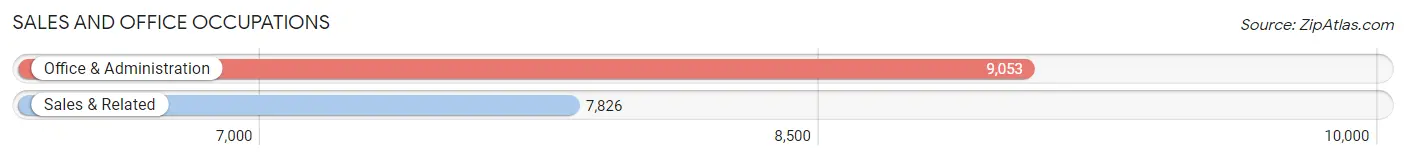
Sales and Office Occupations
The most common Sales and Office occupations in Sussex County are Office & Administration (9,053 | 11.6%), and Sales & Related (7,826 | 10.1%).
Sales and Office Occupations by Sex
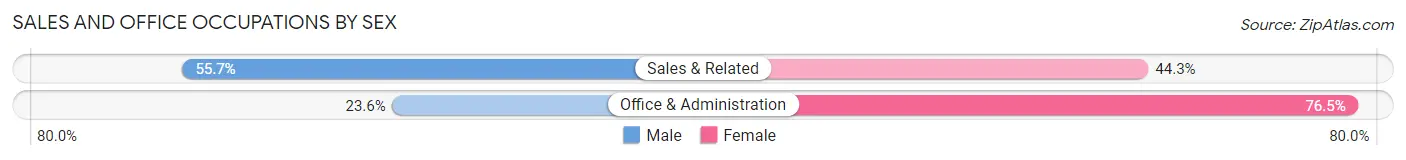
| Occupation | Male | Female |
| Sales & Related | 4,360 (55.7%) | 3,466 (44.3%) |
| Office & Administration | 2,132 (23.5%) | 6,921 (76.4%) |
| Total (Category) | 6,492 (38.5%) | 10,387 (61.5%) |
| Total (Overall) | 41,263 (53.0%) | 36,547 (47.0%) |
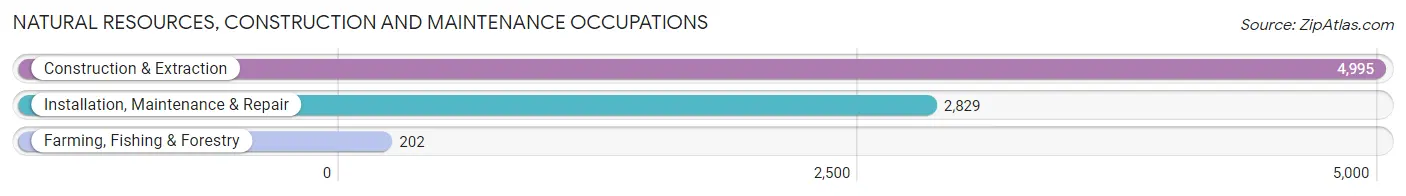
Natural Resources, Construction and Maintenance Occupations
The most common Natural Resources, Construction and Maintenance occupations in Sussex County are Construction & Extraction (4,995 | 6.4%), Installation, Maintenance & Repair (2,829 | 3.6%), and Farming, Fishing & Forestry (202 | 0.3%).
Natural Resources, Construction and Maintenance Occupations by Sex
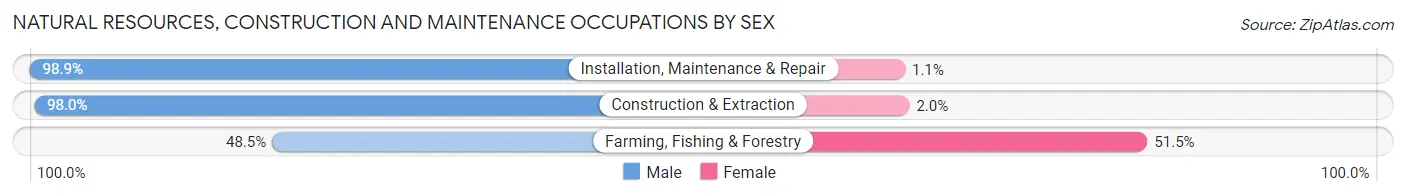
| Occupation | Male | Female |
| Farming, Fishing & Forestry | 98 (48.5%) | 104 (51.5%) |
| Construction & Extraction | 4,896 (98.0%) | 99 (2.0%) |
| Installation, Maintenance & Repair | 2,799 (98.9%) | 30 (1.1%) |
| Total (Category) | 7,793 (97.1%) | 233 (2.9%) |
| Total (Overall) | 41,263 (53.0%) | 36,547 (47.0%) |
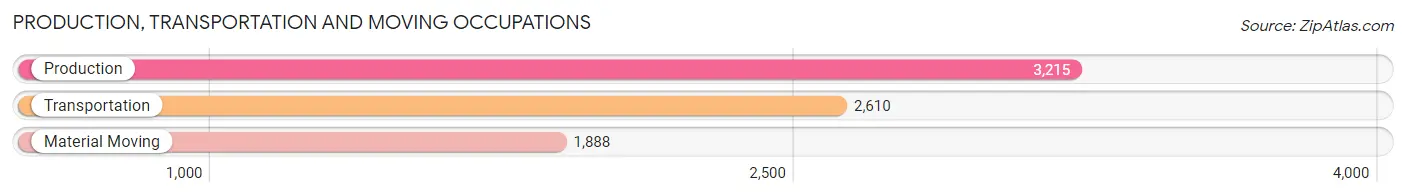
Production, Transportation and Moving Occupations
The most common Production, Transportation and Moving occupations in Sussex County are Production (3,215 | 4.1%), Transportation (2,610 | 3.4%), and Material Moving (1,888 | 2.4%).
Production, Transportation and Moving Occupations by Sex
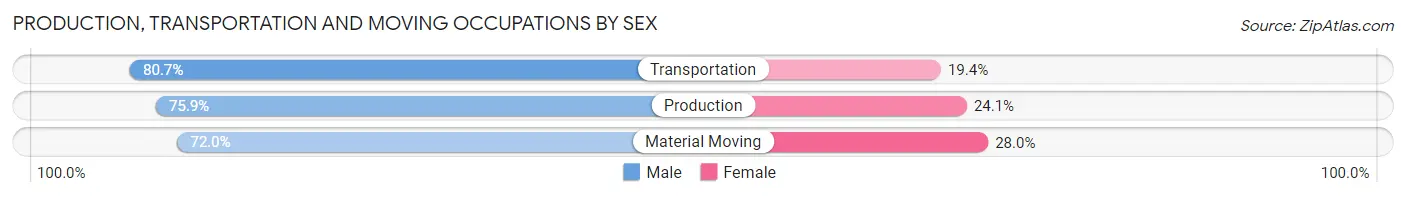
| Occupation | Male | Female |
| Production | 2,440 (75.9%) | 775 (24.1%) |
| Transportation | 2,105 (80.6%) | 505 (19.4%) |
| Material Moving | 1,359 (72.0%) | 529 (28.0%) |
| Total (Category) | 5,904 (76.5%) | 1,809 (23.4%) |
| Total (Overall) | 41,263 (53.0%) | 36,547 (47.0%) |
Employment Industries by Sex in Sussex County
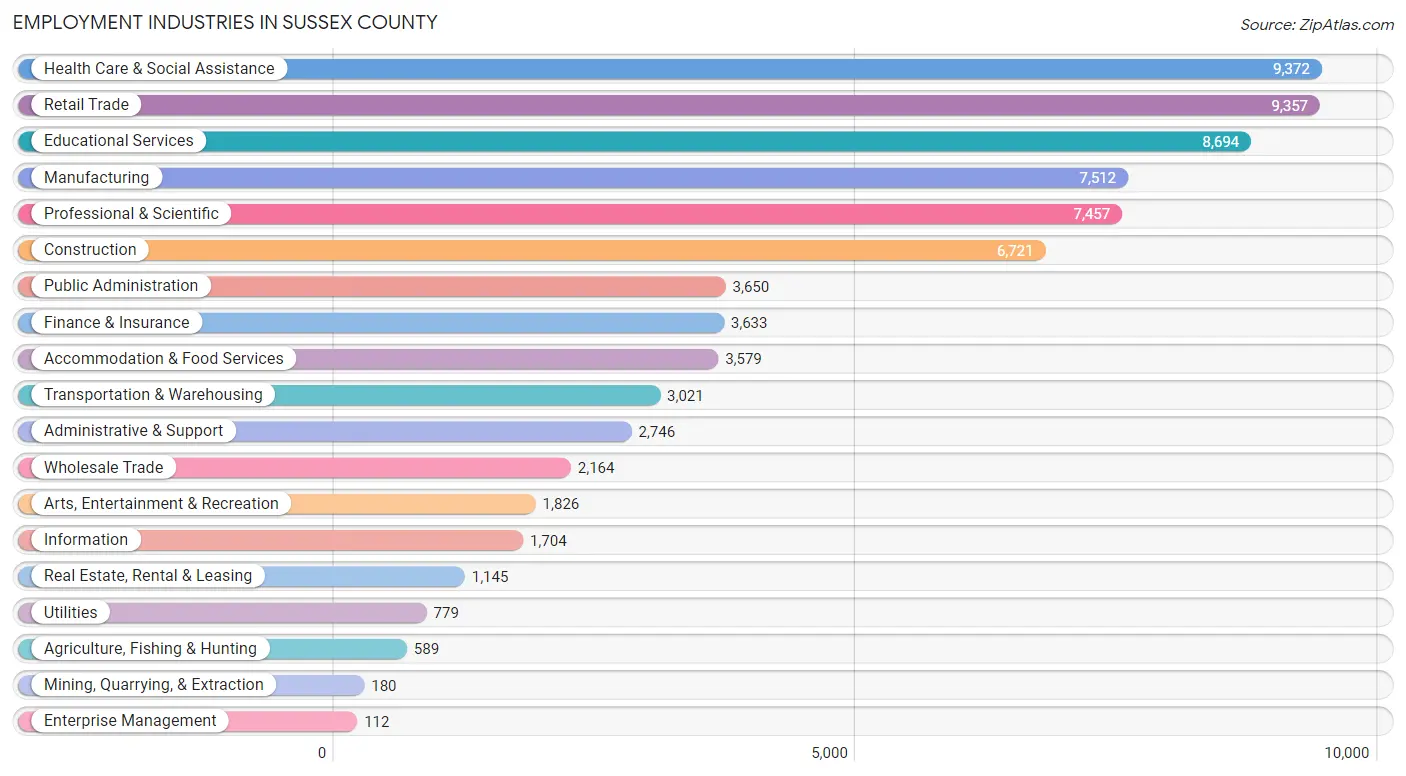
Employment Industries in Sussex County
The major employment industries in Sussex County include Health Care & Social Assistance (9,372 | 12.0%), Retail Trade (9,357 | 12.0%), Educational Services (8,694 | 11.2%), Manufacturing (7,512 | 9.7%), and Professional & Scientific (7,457 | 9.6%).
Employment Industries by Sex in Sussex County
The Sussex County industries that see more men than women are Mining, Quarrying, & Extraction (100.0%), Utilities (95.4%), and Construction (88.8%), whereas the industries that tend to have a higher number of women are Enterprise Management (84.8%), Health Care & Social Assistance (80.0%), and Educational Services (71.0%).
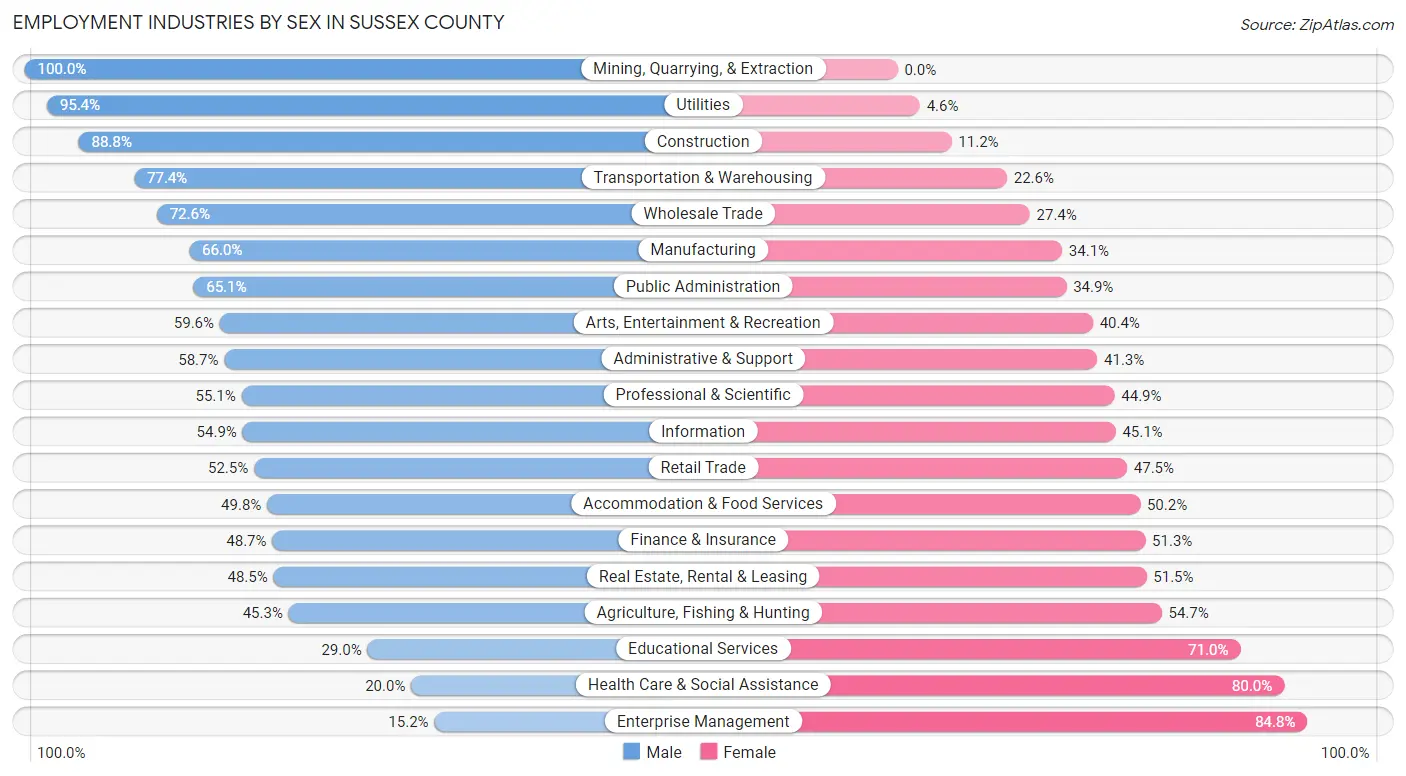
| Industry | Male | Female |
| Agriculture, Fishing & Hunting | 267 (45.3%) | 322 (54.7%) |
| Mining, Quarrying, & Extraction | 180 (100.0%) | 0 (0.0%) |
| Construction | 5,970 (88.8%) | 751 (11.2%) |
| Manufacturing | 4,954 (65.9%) | 2,558 (34.1%) |
| Wholesale Trade | 1,572 (72.6%) | 592 (27.4%) |
| Retail Trade | 4,913 (52.5%) | 4,444 (47.5%) |
| Transportation & Warehousing | 2,337 (77.4%) | 684 (22.6%) |
| Utilities | 743 (95.4%) | 36 (4.6%) |
| Information | 935 (54.9%) | 769 (45.1%) |
| Finance & Insurance | 1,770 (48.7%) | 1,863 (51.3%) |
| Real Estate, Rental & Leasing | 555 (48.5%) | 590 (51.5%) |
| Professional & Scientific | 4,109 (55.1%) | 3,348 (44.9%) |
| Enterprise Management | 17 (15.2%) | 95 (84.8%) |
| Administrative & Support | 1,611 (58.7%) | 1,135 (41.3%) |
| Educational Services | 2,524 (29.0%) | 6,170 (71.0%) |
| Health Care & Social Assistance | 1,872 (20.0%) | 7,500 (80.0%) |
| Arts, Entertainment & Recreation | 1,088 (59.6%) | 738 (40.4%) |
| Accommodation & Food Services | 1,782 (49.8%) | 1,797 (50.2%) |
| Public Administration | 2,375 (65.1%) | 1,275 (34.9%) |
| Total | 41,263 (53.0%) | 36,547 (47.0%) |
Education in Sussex County
School Enrollment in Sussex County
The most common levels of schooling among the 31,634 students in Sussex County are high school (7,519 | 23.8%), middle school (6,492 | 20.5%), and college / undergraduate (6,389 | 20.2%).
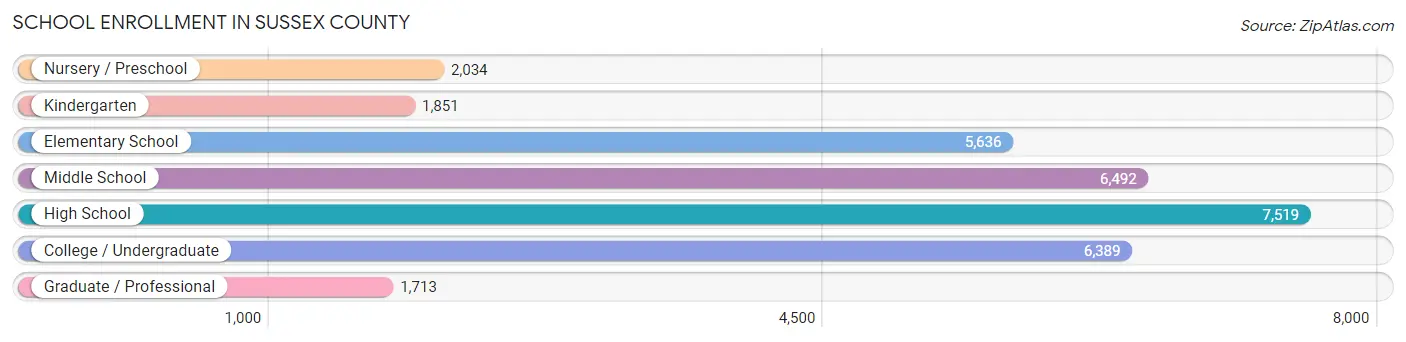
| School Level | # Students | % Students |
| Nursery / Preschool | 2,034 | 6.4% |
| Kindergarten | 1,851 | 5.9% |
| Elementary School | 5,636 | 17.8% |
| Middle School | 6,492 | 20.5% |
| High School | 7,519 | 23.8% |
| College / Undergraduate | 6,389 | 20.2% |
| Graduate / Professional | 1,713 | 5.4% |
| Total | 31,634 | 100.0% |
School Enrollment by Age by Funding Source in Sussex County
Out of a total of 31,634 students who are enrolled in schools in Sussex County, 5,757 (18.2%) attend a private institution, while the remaining 25,877 (81.8%) are enrolled in public schools. The age group of 3 to 4 year olds has the highest likelihood of being enrolled in private schools, with 770 (52.6% in the age bracket) enrolled. Conversely, the age group of 15 to 17 year olds has the lowest likelihood of being enrolled in a private school, with 5,310 (94.2% in the age bracket) attending a public institution.
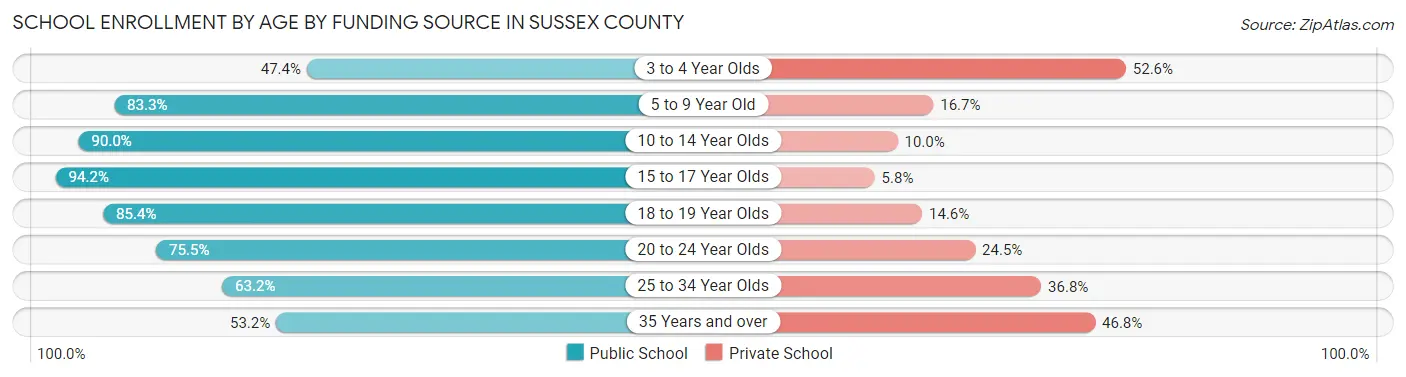
| Age Bracket | Public School | Private School |
| 3 to 4 Year Olds | 695 (47.4%) | 770 (52.6%) |
| 5 to 9 Year Old | 6,036 (83.3%) | 1,209 (16.7%) |
| 10 to 14 Year Olds | 7,138 (90.0%) | 796 (10.0%) |
| 15 to 17 Year Olds | 5,310 (94.2%) | 325 (5.8%) |
| 18 to 19 Year Olds | 2,104 (85.4%) | 360 (14.6%) |
| 20 to 24 Year Olds | 2,559 (75.5%) | 830 (24.5%) |
| 25 to 34 Year Olds | 1,076 (63.2%) | 626 (36.8%) |
| 35 Years and over | 957 (53.2%) | 843 (46.8%) |
| Total | 25,877 (81.8%) | 5,757 (18.2%) |
Educational Attainment by Field of Study in Sussex County
Business (9,009 | 20.4%), education (6,098 | 13.8%), science & technology (3,799 | 8.6%), social sciences (3,294 | 7.4%), and psychology (2,830 | 6.4%) are the most common fields of study among 44,256 individuals in Sussex County who have obtained a bachelor's degree or higher.
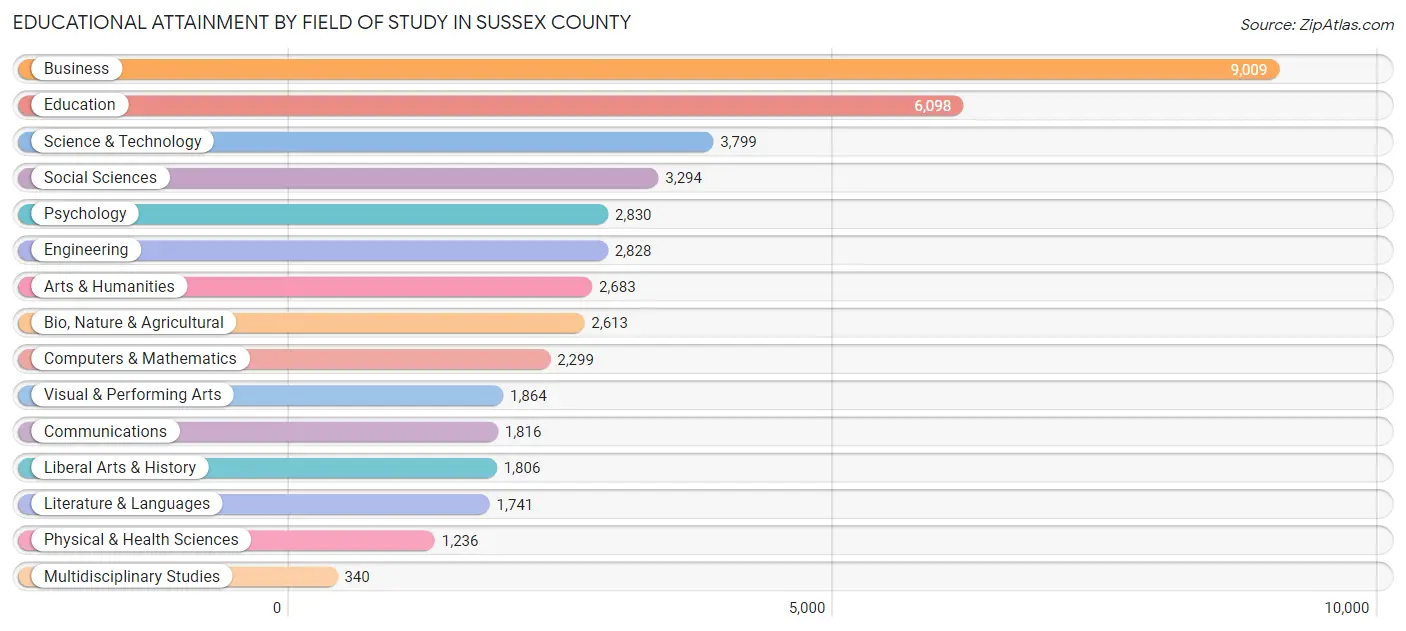
| Field of Study | # Graduates | % Graduates |
| Computers & Mathematics | 2,299 | 5.2% |
| Bio, Nature & Agricultural | 2,613 | 5.9% |
| Physical & Health Sciences | 1,236 | 2.8% |
| Psychology | 2,830 | 6.4% |
| Social Sciences | 3,294 | 7.4% |
| Engineering | 2,828 | 6.4% |
| Multidisciplinary Studies | 340 | 0.8% |
| Science & Technology | 3,799 | 8.6% |
| Business | 9,009 | 20.4% |
| Education | 6,098 | 13.8% |
| Literature & Languages | 1,741 | 3.9% |
| Liberal Arts & History | 1,806 | 4.1% |
| Visual & Performing Arts | 1,864 | 4.2% |
| Communications | 1,816 | 4.1% |
| Arts & Humanities | 2,683 | 6.1% |
| Total | 44,256 | 100.0% |
Transportation & Commute in Sussex County
Vehicle Availability by Sex in Sussex County
The most prevalent vehicle ownership categories in Sussex County are males with 2 vehicles (17,280, accounting for 42.8%) and females with 2 vehicles (14,000, making up 48.7%).
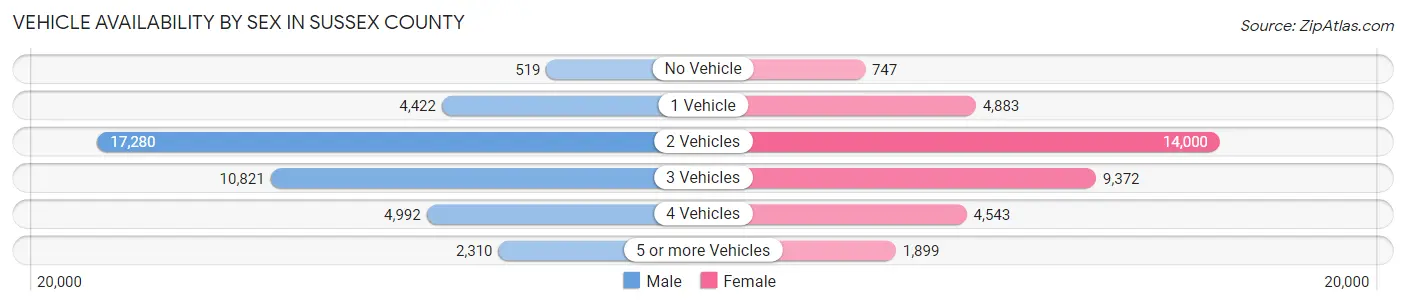
| Vehicles Available | Male | Female |
| No Vehicle | 519 (1.3%) | 747 (2.1%) |
| 1 Vehicle | 4,422 (11.0%) | 4,883 (13.8%) |
| 2 Vehicles | 17,280 (42.8%) | 14,000 (39.5%) |
| 3 Vehicles | 10,821 (26.8%) | 9,372 (26.4%) |
| 4 Vehicles | 4,992 (12.4%) | 4,543 (12.8%) |
| 5 or more Vehicles | 2,310 (5.7%) | 1,899 (5.4%) |
| Total | 40,344 (100.0%) | 35,444 (100.0%) |
Commute Time in Sussex County
The most frequently occuring commute durations in Sussex County are 60 to 89 minutes (10,709 commuters, 16.1%), 45 to 59 minutes (10,559 commuters, 15.8%), and 30 to 34 minutes (7,141 commuters, 10.7%).
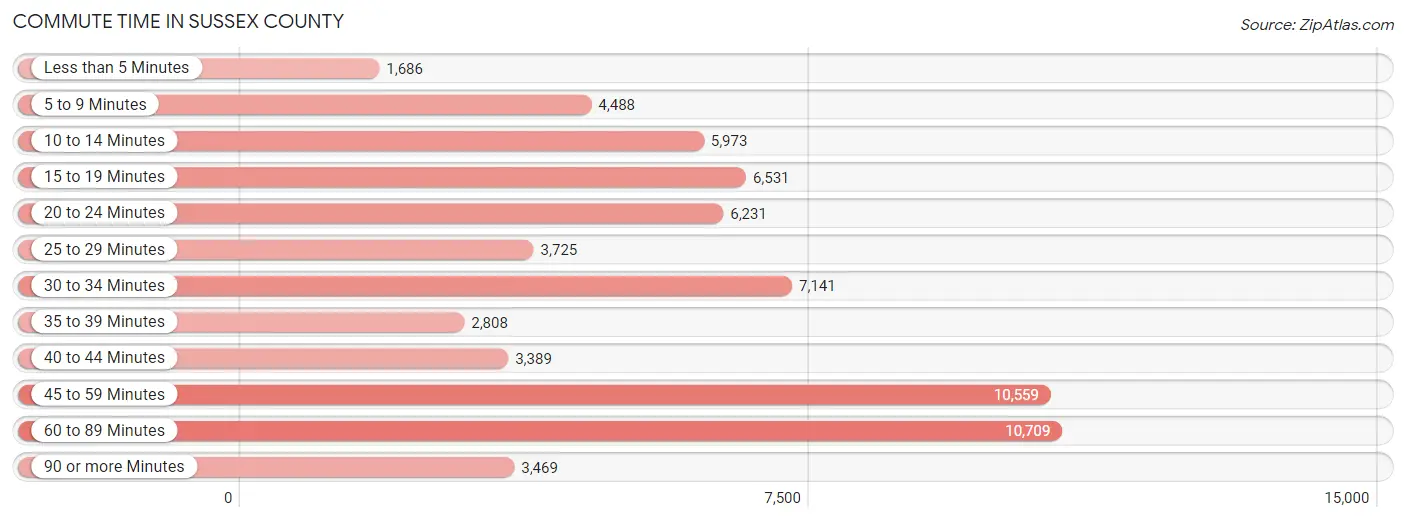
| Commute Time | # Commuters | % Commuters |
| Less than 5 Minutes | 1,686 | 2.5% |
| 5 to 9 Minutes | 4,488 | 6.7% |
| 10 to 14 Minutes | 5,973 | 8.9% |
| 15 to 19 Minutes | 6,531 | 9.8% |
| 20 to 24 Minutes | 6,231 | 9.3% |
| 25 to 29 Minutes | 3,725 | 5.6% |
| 30 to 34 Minutes | 7,141 | 10.7% |
| 35 to 39 Minutes | 2,808 | 4.2% |
| 40 to 44 Minutes | 3,389 | 5.1% |
| 45 to 59 Minutes | 10,559 | 15.8% |
| 60 to 89 Minutes | 10,709 | 16.1% |
| 90 or more Minutes | 3,469 | 5.2% |
Commute Time by Sex in Sussex County
The most common commute times in Sussex County are 60 to 89 minutes (6,639 commuters, 18.3%) for males and 45 to 59 minutes (4,365 commuters, 14.3%) for females.
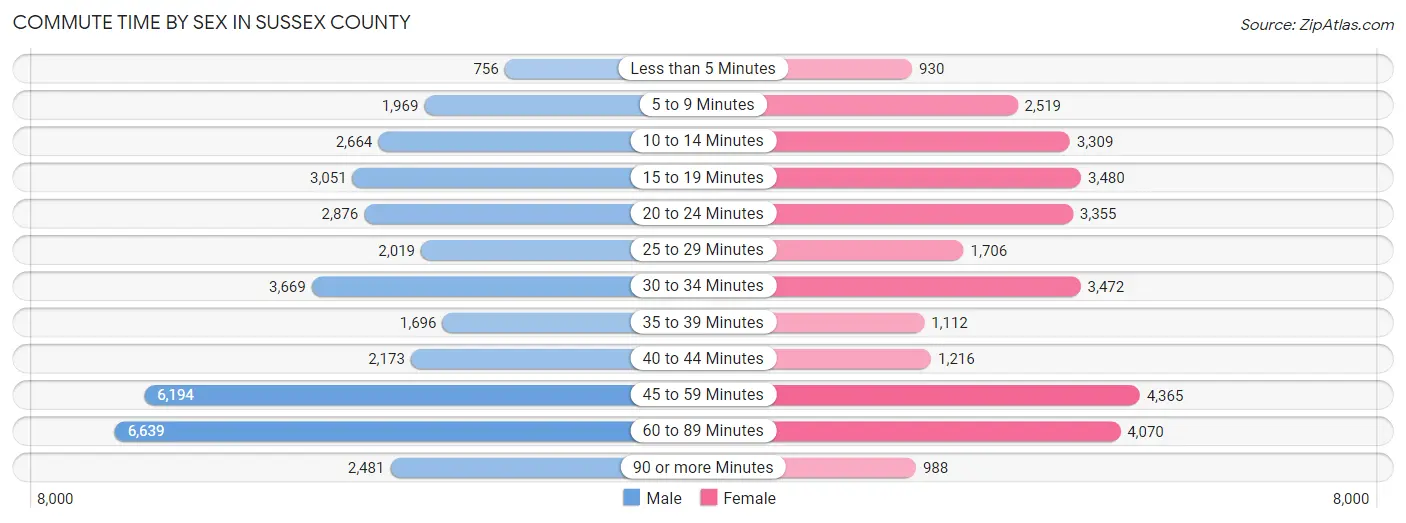
| Commute Time | Male | Female |
| Less than 5 Minutes | 756 (2.1%) | 930 (3.0%) |
| 5 to 9 Minutes | 1,969 (5.4%) | 2,519 (8.3%) |
| 10 to 14 Minutes | 2,664 (7.4%) | 3,309 (10.8%) |
| 15 to 19 Minutes | 3,051 (8.4%) | 3,480 (11.4%) |
| 20 to 24 Minutes | 2,876 (8.0%) | 3,355 (11.0%) |
| 25 to 29 Minutes | 2,019 (5.6%) | 1,706 (5.6%) |
| 30 to 34 Minutes | 3,669 (10.1%) | 3,472 (11.4%) |
| 35 to 39 Minutes | 1,696 (4.7%) | 1,112 (3.6%) |
| 40 to 44 Minutes | 2,173 (6.0%) | 1,216 (4.0%) |
| 45 to 59 Minutes | 6,194 (17.1%) | 4,365 (14.3%) |
| 60 to 89 Minutes | 6,639 (18.3%) | 4,070 (13.3%) |
| 90 or more Minutes | 2,481 (6.9%) | 988 (3.2%) |
Time of Departure to Work by Sex in Sussex County
The most frequent times of departure to work in Sussex County are 6:00 AM to 6:29 AM (4,709, 13.0%) for males and 7:30 AM to 7:59 AM (4,842, 15.9%) for females.
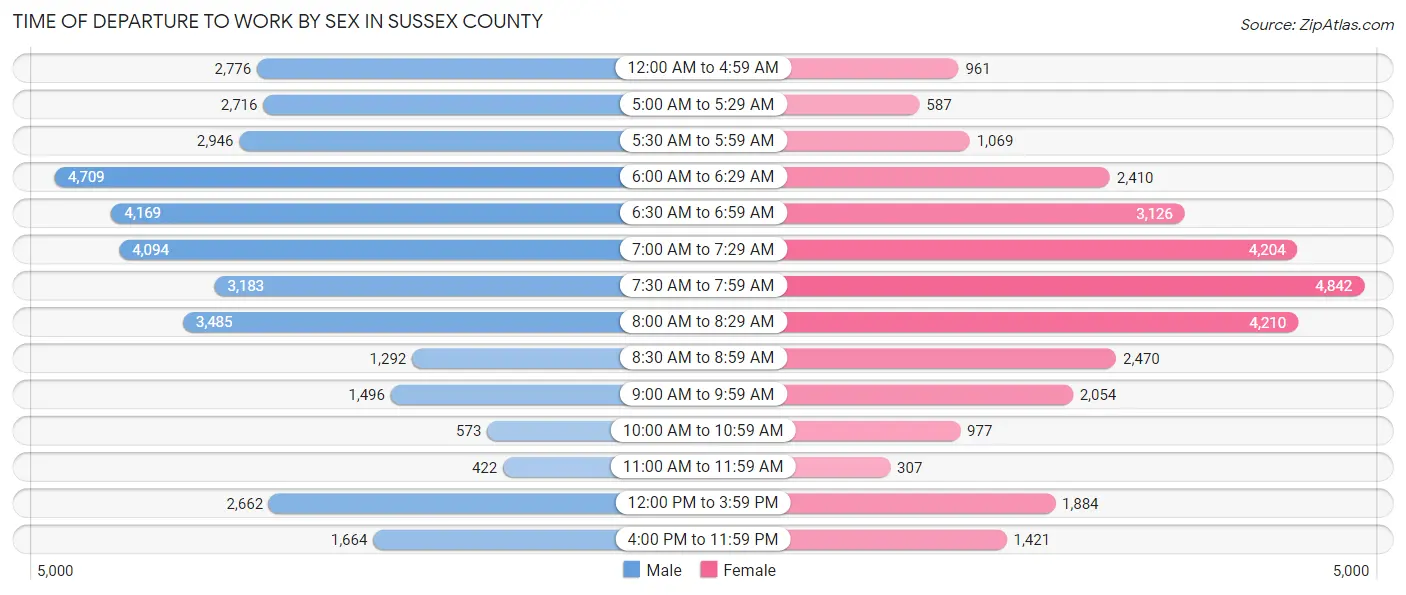
| Time of Departure | Male | Female |
| 12:00 AM to 4:59 AM | 2,776 (7.7%) | 961 (3.2%) |
| 5:00 AM to 5:29 AM | 2,716 (7.5%) | 587 (1.9%) |
| 5:30 AM to 5:59 AM | 2,946 (8.1%) | 1,069 (3.5%) |
| 6:00 AM to 6:29 AM | 4,709 (13.0%) | 2,410 (7.9%) |
| 6:30 AM to 6:59 AM | 4,169 (11.5%) | 3,126 (10.2%) |
| 7:00 AM to 7:29 AM | 4,094 (11.3%) | 4,204 (13.8%) |
| 7:30 AM to 7:59 AM | 3,183 (8.8%) | 4,842 (15.9%) |
| 8:00 AM to 8:29 AM | 3,485 (9.6%) | 4,210 (13.8%) |
| 8:30 AM to 8:59 AM | 1,292 (3.6%) | 2,470 (8.1%) |
| 9:00 AM to 9:59 AM | 1,496 (4.1%) | 2,054 (6.7%) |
| 10:00 AM to 10:59 AM | 573 (1.6%) | 977 (3.2%) |
| 11:00 AM to 11:59 AM | 422 (1.2%) | 307 (1.0%) |
| 12:00 PM to 3:59 PM | 2,662 (7.4%) | 1,884 (6.2%) |
| 4:00 PM to 11:59 PM | 1,664 (4.6%) | 1,421 (4.7%) |
| Total | 36,187 (100.0%) | 30,522 (100.0%) |
Housing Occupancy in Sussex County
Occupancy by Ownership in Sussex County
Of the total 56,348 dwellings in Sussex County, owner-occupied units account for 47,761 (84.8%), while renter-occupied units make up 8,587 (15.2%).
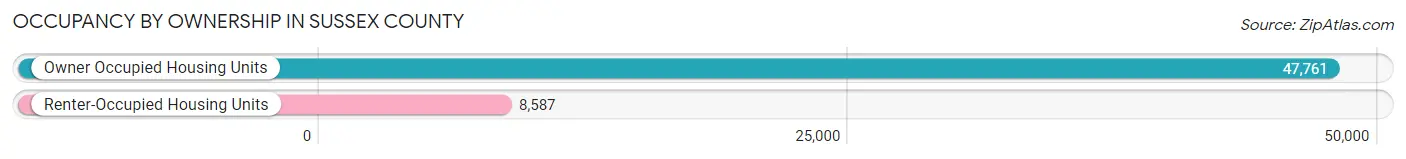
| Occupancy | # Housing Units | % Housing Units |
| Owner Occupied Housing Units | 47,761 | 84.8% |
| Renter-Occupied Housing Units | 8,587 | 15.2% |
| Total Occupied Housing Units | 56,348 | 100.0% |
Occupancy by Household Size in Sussex County

| Household Size | # Housing Units | % Housing Units |
| 1-Person Household | 12,909 | 22.9% |
| 2-Person Household | 20,350 | 36.1% |
| 3-Person Household | 9,881 | 17.5% |
| 4+ Person Household | 13,208 | 23.4% |
| Total Housing Units | 56,348 | 100.0% |
Occupancy by Ownership by Household Size in Sussex County
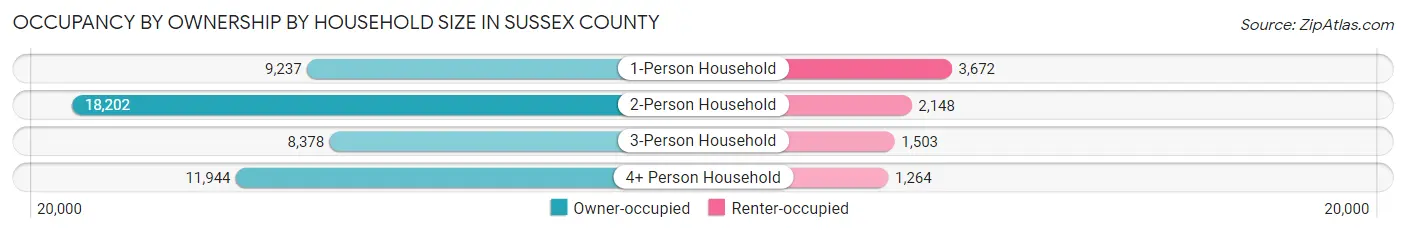
| Household Size | Owner-occupied | Renter-occupied |
| 1-Person Household | 9,237 (71.6%) | 3,672 (28.4%) |
| 2-Person Household | 18,202 (89.4%) | 2,148 (10.6%) |
| 3-Person Household | 8,378 (84.8%) | 1,503 (15.2%) |
| 4+ Person Household | 11,944 (90.4%) | 1,264 (9.6%) |
| Total Housing Units | 47,761 (84.8%) | 8,587 (15.2%) |
Occupancy by Educational Attainment in Sussex County
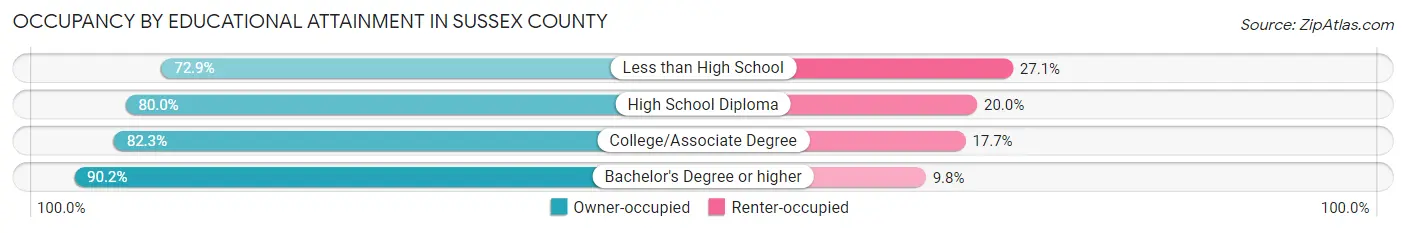
| Household Size | Owner-occupied | Renter-occupied |
| Less than High School | 1,444 (72.9%) | 537 (27.1%) |
| High School Diploma | 11,346 (80.0%) | 2,836 (20.0%) |
| College/Associate Degree | 13,239 (82.3%) | 2,847 (17.7%) |
| Bachelor's Degree or higher | 21,732 (90.2%) | 2,367 (9.8%) |
Occupancy by Age of Householder in Sussex County
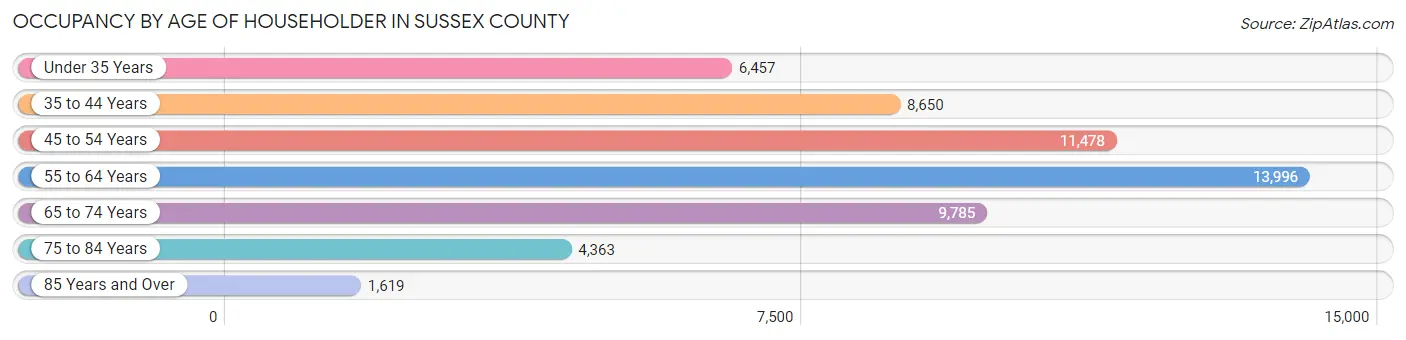
| Age Bracket | # Households | % Households |
| Under 35 Years | 6,457 | 11.5% |
| 35 to 44 Years | 8,650 | 15.3% |
| 45 to 54 Years | 11,478 | 20.4% |
| 55 to 64 Years | 13,996 | 24.8% |
| 65 to 74 Years | 9,785 | 17.4% |
| 75 to 84 Years | 4,363 | 7.7% |
| 85 Years and Over | 1,619 | 2.9% |
| Total | 56,348 | 100.0% |
Housing Finances in Sussex County
Median Income by Occupancy in Sussex County
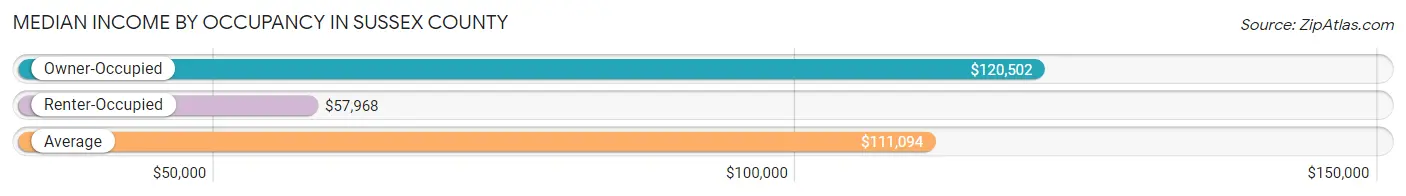
| Occupancy Type | # Households | Median Income |
| Owner-Occupied | 47,761 (84.8%) | $120,502 |
| Renter-Occupied | 8,587 (15.2%) | $57,968 |
| Average | 56,348 (100.0%) | $111,094 |
Occupancy by Householder Income Bracket in Sussex County
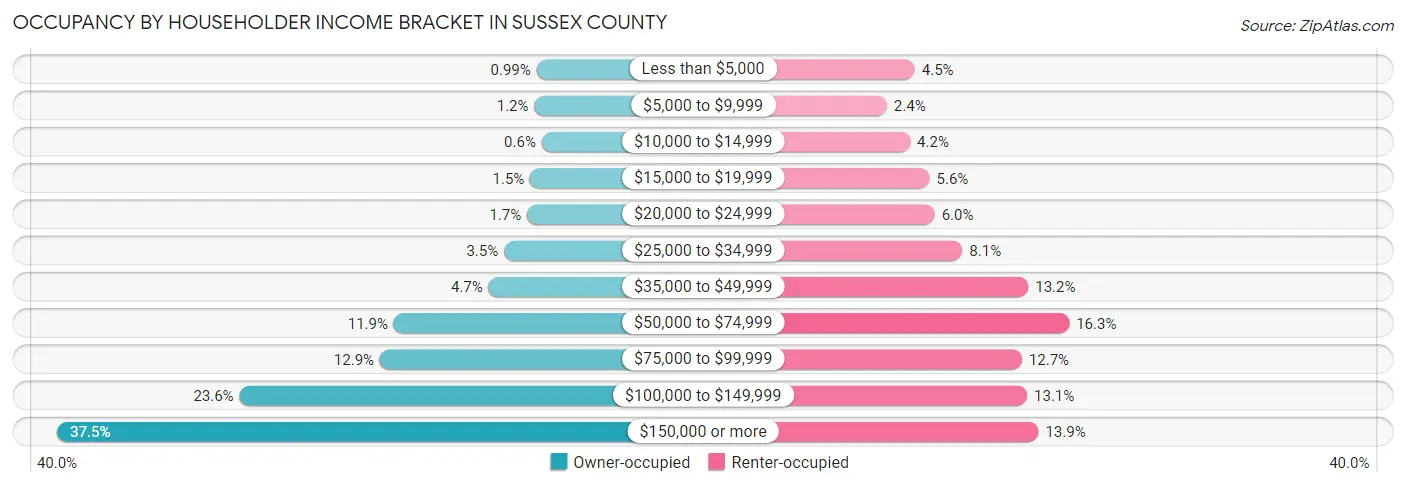
| Income Bracket | Owner-occupied | Renter-occupied |
| Less than $5,000 | 475 (1.0%) | 388 (4.5%) |
| $5,000 to $9,999 | 552 (1.2%) | 205 (2.4%) |
| $10,000 to $14,999 | 285 (0.6%) | 357 (4.2%) |
| $15,000 to $19,999 | 706 (1.5%) | 484 (5.6%) |
| $20,000 to $24,999 | 820 (1.7%) | 518 (6.0%) |
| $25,000 to $34,999 | 1,655 (3.5%) | 699 (8.1%) |
| $35,000 to $49,999 | 2,220 (4.6%) | 1,130 (13.2%) |
| $50,000 to $74,999 | 5,668 (11.9%) | 1,398 (16.3%) |
| $75,000 to $99,999 | 6,175 (12.9%) | 1,089 (12.7%) |
| $100,000 to $149,999 | 11,287 (23.6%) | 1,122 (13.1%) |
| $150,000 or more | 17,918 (37.5%) | 1,197 (13.9%) |
| Total | 47,761 (100.0%) | 8,587 (100.0%) |
Monthly Housing Cost Tiers in Sussex County
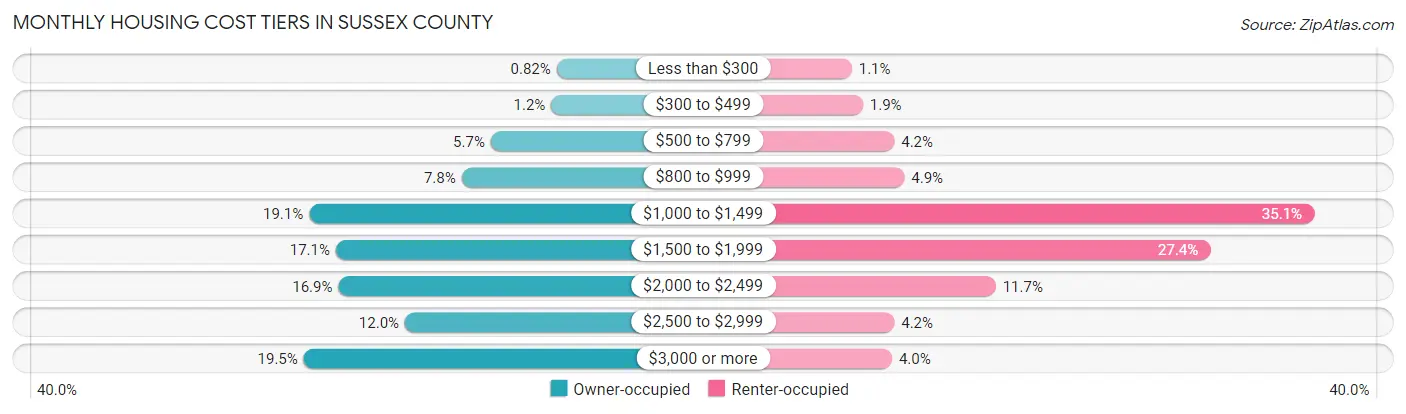
| Monthly Cost | Owner-occupied | Renter-occupied |
| Less than $300 | 390 (0.8%) | 91 (1.1%) |
| $300 to $499 | 582 (1.2%) | 161 (1.9%) |
| $500 to $799 | 2,708 (5.7%) | 360 (4.2%) |
| $800 to $999 | 3,735 (7.8%) | 423 (4.9%) |
| $1,000 to $1,499 | 9,098 (19.1%) | 3,013 (35.1%) |
| $1,500 to $1,999 | 8,159 (17.1%) | 2,356 (27.4%) |
| $2,000 to $2,499 | 8,073 (16.9%) | 1,001 (11.7%) |
| $2,500 to $2,999 | 5,725 (12.0%) | 360 (4.2%) |
| $3,000 or more | 9,291 (19.5%) | 345 (4.0%) |
| Total | 47,761 (100.0%) | 8,587 (100.0%) |
Physical Housing Characteristics in Sussex County
Housing Structures in Sussex County
| Structure Type | # Housing Units | % Housing Units |
| Single Unit, Detached | 45,620 | 81.0% |
| Single Unit, Attached | 3,848 | 6.8% |
| 2 Unit Apartments | 1,025 | 1.8% |
| 3 or 4 Unit Apartments | 1,487 | 2.6% |
| 5 to 9 Unit Apartments | 1,610 | 2.9% |
| 10 or more Apartments | 2,357 | 4.2% |
| Mobile Home / Other | 401 | 0.7% |
| Total | 56,348 | 100.0% |
Housing Structures by Occupancy in Sussex County
| Structure Type | Owner-occupied | Renter-occupied |
| Single Unit, Detached | 42,495 (93.1%) | 3,125 (6.9%) |
| Single Unit, Attached | 3,209 (83.4%) | 639 (16.6%) |
| 2 Unit Apartments | 299 (29.2%) | 726 (70.8%) |
| 3 or 4 Unit Apartments | 362 (24.3%) | 1,125 (75.7%) |
| 5 to 9 Unit Apartments | 660 (41.0%) | 950 (59.0%) |
| 10 or more Apartments | 382 (16.2%) | 1,975 (83.8%) |
| Mobile Home / Other | 354 (88.3%) | 47 (11.7%) |
| Total | 47,761 (84.8%) | 8,587 (15.2%) |
Housing Structures by Number of Rooms in Sussex County
| Number of Rooms | Owner-occupied | Renter-occupied |
| 1 Room | 162 (0.3%) | 298 (3.5%) |
| 2 or 3 Rooms | 1,185 (2.5%) | 2,350 (27.4%) |
| 4 or 5 Rooms | 9,635 (20.2%) | 3,461 (40.3%) |
| 6 or 7 Rooms | 18,020 (37.7%) | 1,706 (19.9%) |
| 8 or more Rooms | 18,759 (39.3%) | 772 (9.0%) |
| Total | 47,761 (100.0%) | 8,587 (100.0%) |
Housing Structure by Heating Type in Sussex County
| Heating Type | Owner-occupied | Renter-occupied |
| Utility Gas | 8,677 (18.2%) | 1,991 (23.2%) |
| Bottled, Tank, or LP Gas | 5,527 (11.6%) | 615 (7.2%) |
| Electricity | 5,280 (11.1%) | 2,814 (32.8%) |
| Fuel Oil or Kerosene | 25,665 (53.7%) | 2,927 (34.1%) |
| Coal or Coke | 122 (0.3%) | 0 (0.0%) |
| All other Fuels | 2,412 (5.1%) | 185 (2.1%) |
| No Fuel Used | 78 (0.2%) | 55 (0.6%) |
| Total | 47,761 (100.0%) | 8,587 (100.0%) |
Household Vehicle Usage in Sussex County
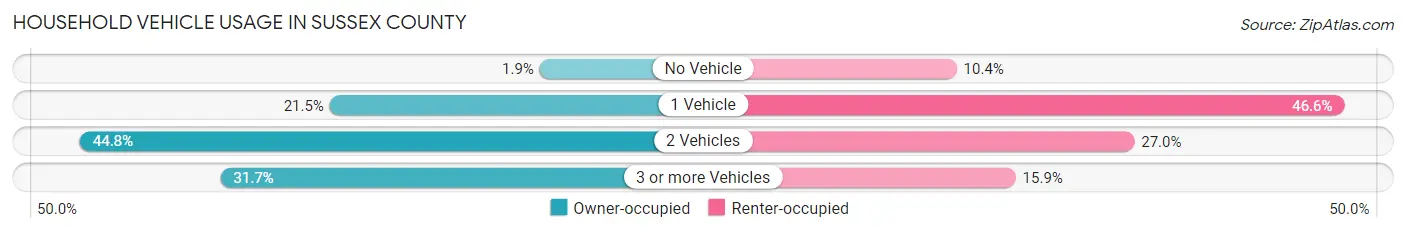
| Vehicles per Household | Owner-occupied | Renter-occupied |
| No Vehicle | 916 (1.9%) | 896 (10.4%) |
| 1 Vehicle | 10,279 (21.5%) | 4,003 (46.6%) |
| 2 Vehicles | 21,415 (44.8%) | 2,319 (27.0%) |
| 3 or more Vehicles | 15,151 (31.7%) | 1,369 (15.9%) |
| Total | 47,761 (100.0%) | 8,587 (100.0%) |
Real Estate & Mortgages in Sussex County
Real Estate and Mortgage Overview in Sussex County
| Characteristic | Without Mortgage | With Mortgage |
| Housing Units | 14,795 | 32,966 |
| Median Property Value | $311,200 | $327,000 |
| Median Household Income | $94,993 | $14,050 |
| Monthly Housing Costs | $1,057 | $9,190 |
| Real Estate Taxes | $8,107 | $569 |
Property Value by Mortgage Status in Sussex County
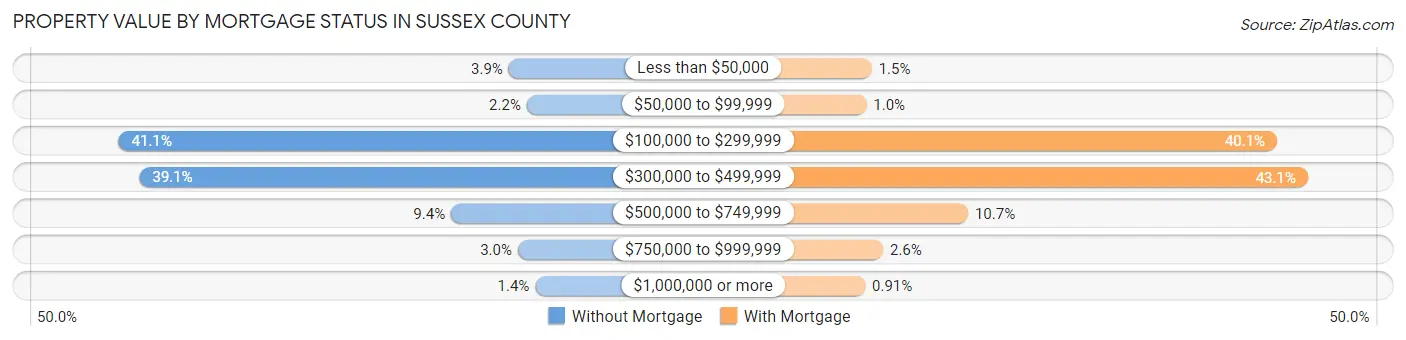
| Property Value | Without Mortgage | With Mortgage |
| Less than $50,000 | 577 (3.9%) | 508 (1.5%) |
| $50,000 to $99,999 | 323 (2.2%) | 339 (1.0%) |
| $100,000 to $299,999 | 6,074 (41.0%) | 13,230 (40.1%) |
| $300,000 to $499,999 | 5,780 (39.1%) | 14,194 (43.1%) |
| $500,000 to $749,999 | 1,389 (9.4%) | 3,532 (10.7%) |
| $750,000 to $999,999 | 449 (3.0%) | 864 (2.6%) |
| $1,000,000 or more | 203 (1.4%) | 299 (0.9%) |
| Total | 14,795 (100.0%) | 32,966 (100.0%) |
Household Income by Mortgage Status in Sussex County
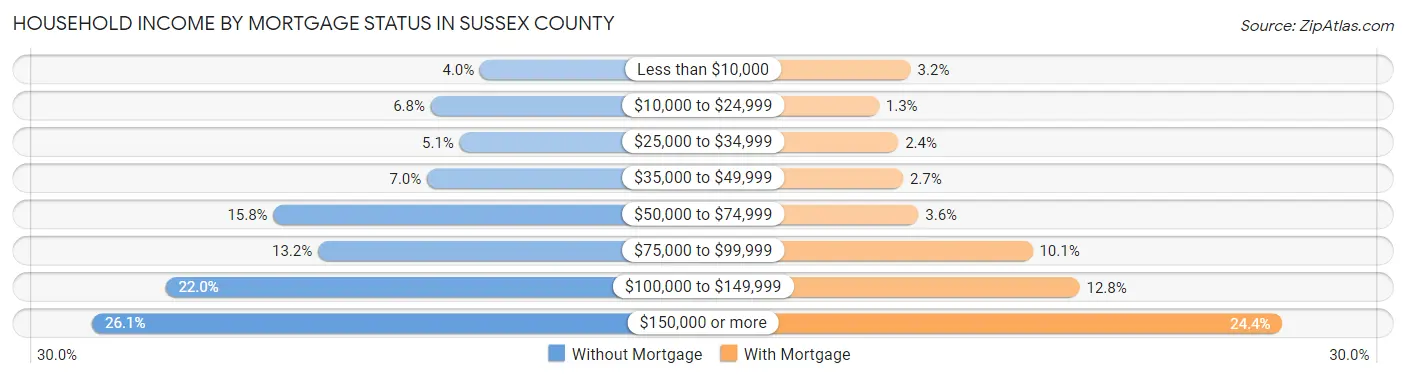
| Household Income | Without Mortgage | With Mortgage |
| Less than $10,000 | 588 (4.0%) | 1,040 (3.2%) |
| $10,000 to $24,999 | 1,005 (6.8%) | 439 (1.3%) |
| $25,000 to $34,999 | 761 (5.1%) | 806 (2.4%) |
| $35,000 to $49,999 | 1,035 (7.0%) | 894 (2.7%) |
| $50,000 to $74,999 | 2,334 (15.8%) | 1,185 (3.6%) |
| $75,000 to $99,999 | 1,957 (13.2%) | 3,334 (10.1%) |
| $100,000 to $149,999 | 3,247 (22.0%) | 4,218 (12.8%) |
| $150,000 or more | 3,868 (26.1%) | 8,040 (24.4%) |
| Total | 14,795 (100.0%) | 32,966 (100.0%) |
Property Value to Household Income Ratio in Sussex County
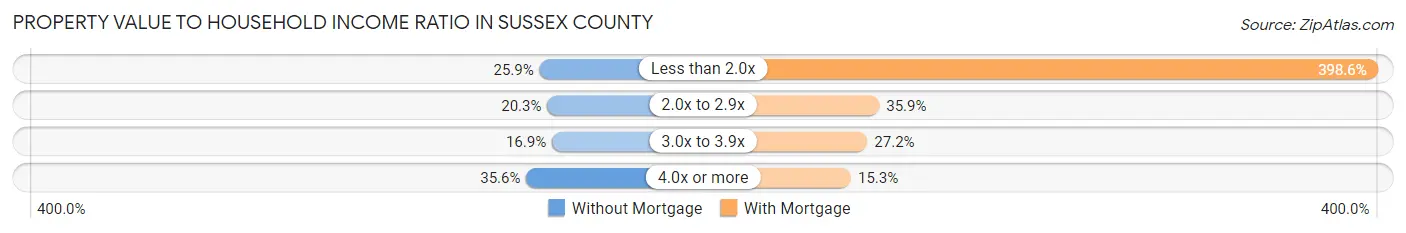
| Value-to-Income Ratio | Without Mortgage | With Mortgage |
| Less than 2.0x | 3,835 (25.9%) | 131,397 (398.6%) |
| 2.0x to 2.9x | 3,001 (20.3%) | 11,830 (35.9%) |
| 3.0x to 3.9x | 2,499 (16.9%) | 8,973 (27.2%) |
| 4.0x or more | 5,261 (35.6%) | 5,057 (15.3%) |
| Total | 14,795 (100.0%) | 32,966 (100.0%) |
Real Estate Taxes by Mortgage Status in Sussex County
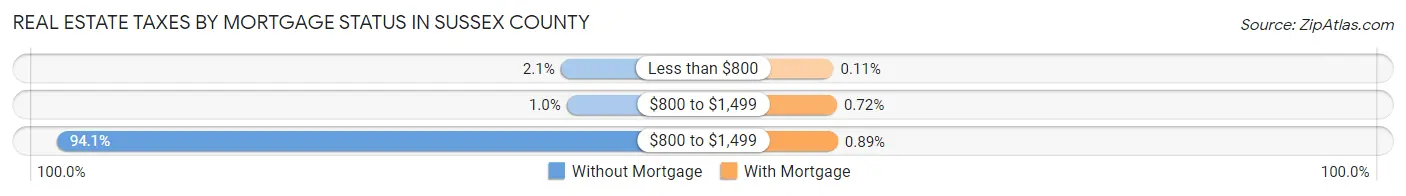
| Property Taxes | Without Mortgage | With Mortgage |
| Less than $800 | 314 (2.1%) | 35 (0.1%) |
| $800 to $1,499 | 150 (1.0%) | 236 (0.7%) |
| $800 to $1,499 | 13,925 (94.1%) | 294 (0.9%) |
| Total | 14,795 (100.0%) | 32,966 (100.0%) |
Health & Disability in Sussex County
Health Insurance Coverage by Age in Sussex County
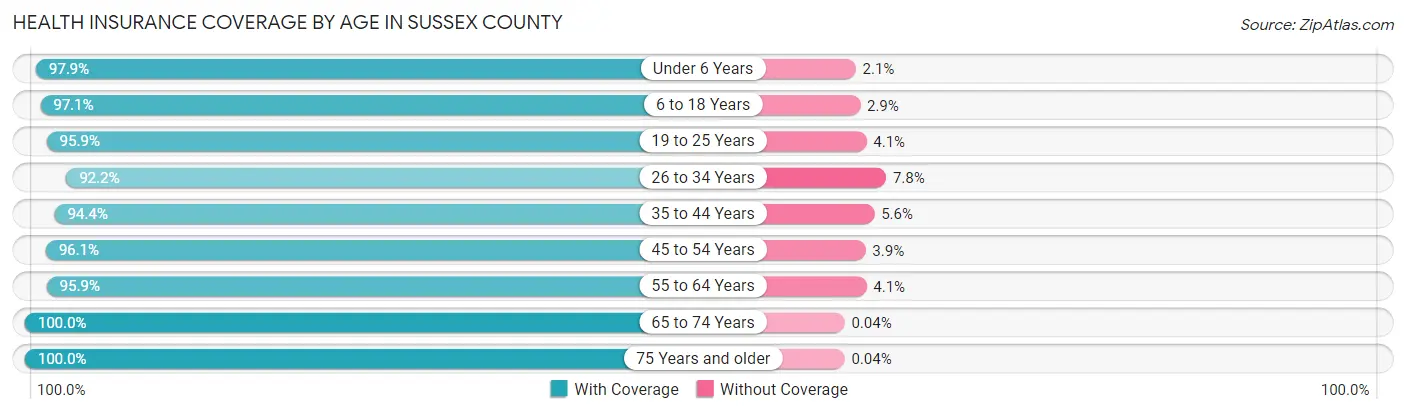
| Age Bracket | With Coverage | Without Coverage |
| Under 6 Years | 8,064 (97.9%) | 174 (2.1%) |
| 6 to 18 Years | 21,034 (97.1%) | 636 (2.9%) |
| 19 to 25 Years | 10,927 (95.9%) | 468 (4.1%) |
| 26 to 34 Years | 13,492 (92.2%) | 1,136 (7.8%) |
| 35 to 44 Years | 16,139 (94.4%) | 953 (5.6%) |
| 45 to 54 Years | 20,157 (96.1%) | 827 (3.9%) |
| 55 to 64 Years | 23,164 (95.9%) | 992 (4.1%) |
| 65 to 74 Years | 16,021 (100.0%) | 6 (0.0%) |
| 75 Years and older | 9,506 (100.0%) | 4 (0.0%) |
| Total | 138,504 (96.4%) | 5,196 (3.6%) |
Health Insurance Coverage by Citizenship Status in Sussex County
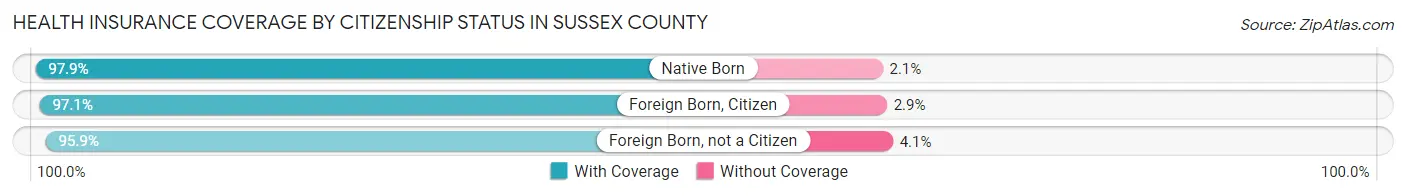
| Citizenship Status | With Coverage | Without Coverage |
| Native Born | 8,064 (97.9%) | 174 (2.1%) |
| Foreign Born, Citizen | 21,034 (97.1%) | 636 (2.9%) |
| Foreign Born, not a Citizen | 10,927 (95.9%) | 468 (4.1%) |
Health Insurance Coverage by Household Income in Sussex County
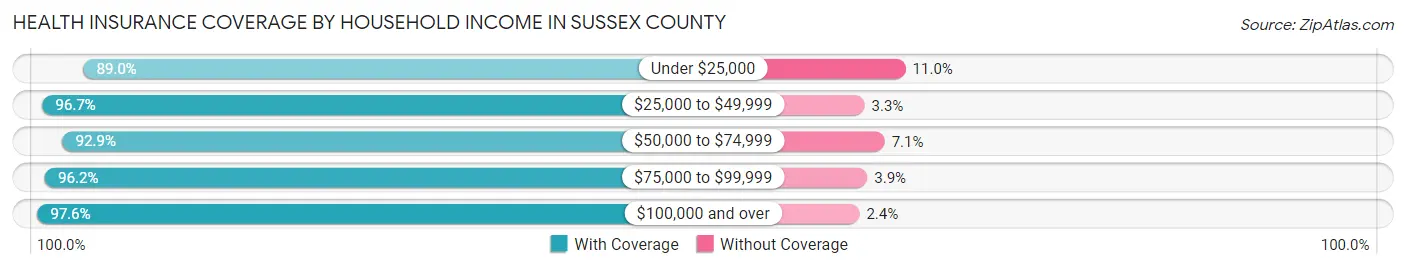
| Household Income | With Coverage | Without Coverage |
| Under $25,000 | 7,209 (89.0%) | 894 (11.0%) |
| $25,000 to $49,999 | 9,472 (96.7%) | 327 (3.3%) |
| $50,000 to $74,999 | 13,476 (92.9%) | 1,032 (7.1%) |
| $75,000 to $99,999 | 16,588 (96.2%) | 664 (3.8%) |
| $100,000 and over | 91,074 (97.6%) | 2,220 (2.4%) |
Public vs Private Health Insurance Coverage by Age in Sussex County

| Age Bracket | Public Insurance | Private Insurance |
| Under 6 | 1,657 (20.1%) | 6,745 (81.9%) |
| 6 to 18 Years | 4,038 (18.6%) | 18,092 (83.5%) |
| 19 to 25 Years | 1,332 (11.7%) | 9,837 (86.3%) |
| 25 to 34 Years | 1,905 (13.0%) | 12,048 (82.4%) |
| 35 to 44 Years | 1,965 (11.5%) | 14,752 (86.3%) |
| 45 to 54 Years | 2,010 (9.6%) | 18,717 (89.2%) |
| 55 to 64 Years | 2,989 (12.4%) | 21,251 (88.0%) |
| 65 to 74 Years | 15,155 (94.6%) | 10,702 (66.8%) |
| 75 Years and over | 9,426 (99.1%) | 6,202 (65.2%) |
| Total | 40,477 (28.2%) | 118,346 (82.4%) |
Disability Status by Sex by Age in Sussex County
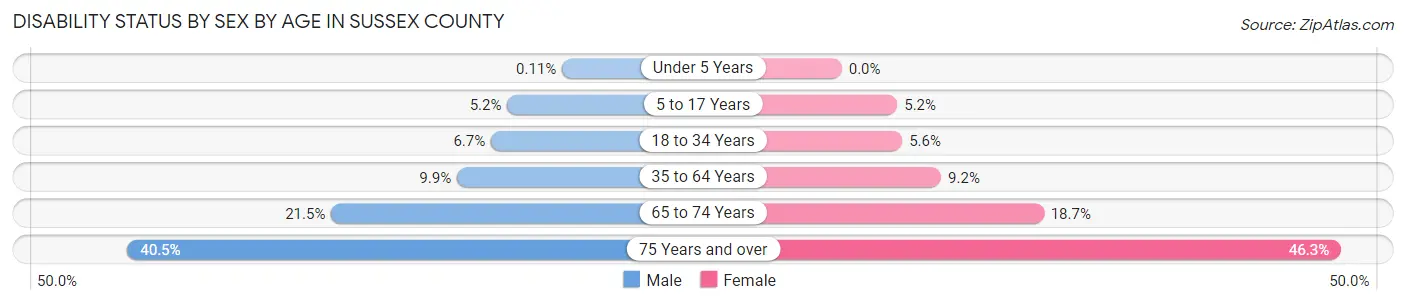
| Age Bracket | Male | Female |
| Under 5 Years | 4 (0.1%) | 0 (0.0%) |
| 5 to 17 Years | 570 (5.2%) | 541 (5.1%) |
| 18 to 34 Years | 975 (6.7%) | 746 (5.6%) |
| 35 to 64 Years | 3,086 (9.9%) | 2,856 (9.2%) |
| 65 to 74 Years | 1,710 (21.5%) | 1,516 (18.7%) |
| 75 Years and over | 1,700 (40.5%) | 2,459 (46.3%) |
Disability Class by Sex by Age in Sussex County
Disability Class: Hearing Difficulty
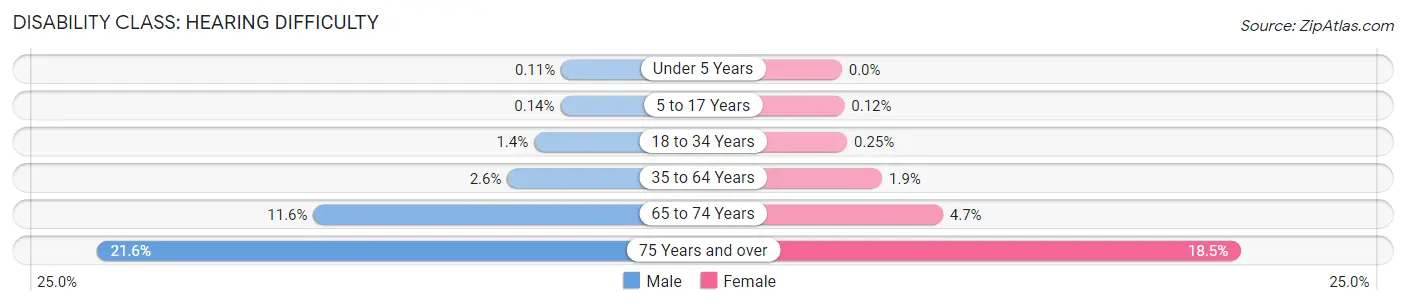
| Age Bracket | Male | Female |
| Under 5 Years | 4 (0.1%) | 0 (0.0%) |
| 5 to 17 Years | 15 (0.1%) | 13 (0.1%) |
| 18 to 34 Years | 198 (1.4%) | 33 (0.3%) |
| 35 to 64 Years | 811 (2.6%) | 578 (1.9%) |
| 65 to 74 Years | 921 (11.6%) | 379 (4.7%) |
| 75 Years and over | 908 (21.6%) | 981 (18.5%) |
Disability Class: Vision Difficulty
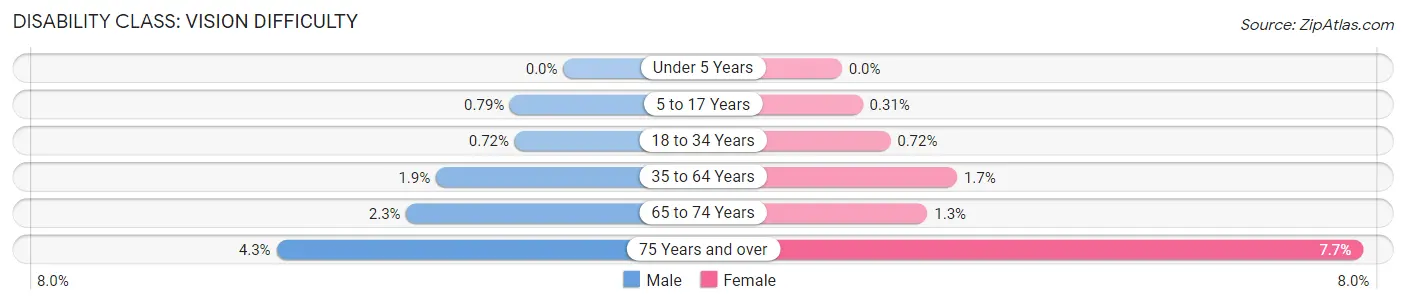
| Age Bracket | Male | Female |
| Under 5 Years | 0 (0.0%) | 0 (0.0%) |
| 5 to 17 Years | 87 (0.8%) | 33 (0.3%) |
| 18 to 34 Years | 104 (0.7%) | 96 (0.7%) |
| 35 to 64 Years | 591 (1.9%) | 529 (1.7%) |
| 65 to 74 Years | 185 (2.3%) | 103 (1.3%) |
| 75 Years and over | 179 (4.3%) | 411 (7.7%) |
Disability Class: Cognitive Difficulty
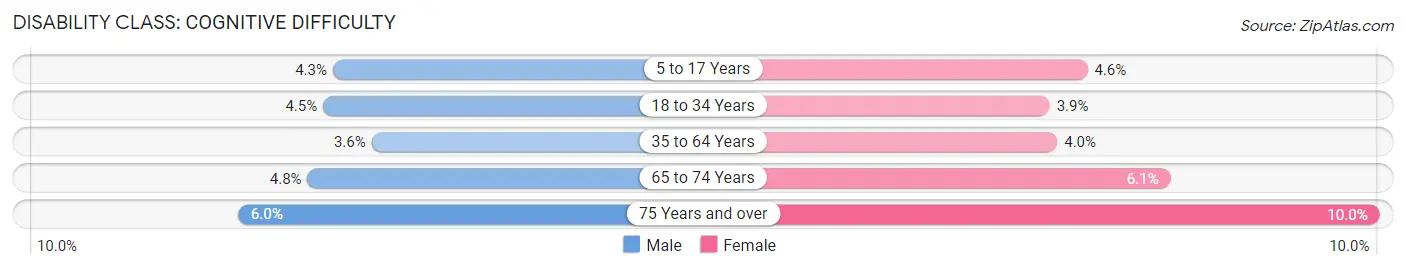
| Age Bracket | Male | Female |
| 5 to 17 Years | 470 (4.3%) | 480 (4.6%) |
| 18 to 34 Years | 649 (4.5%) | 514 (3.9%) |
| 35 to 64 Years | 1,112 (3.6%) | 1,239 (4.0%) |
| 65 to 74 Years | 377 (4.8%) | 493 (6.1%) |
| 75 Years and over | 254 (6.0%) | 530 (10.0%) |
Disability Class: Ambulatory Difficulty
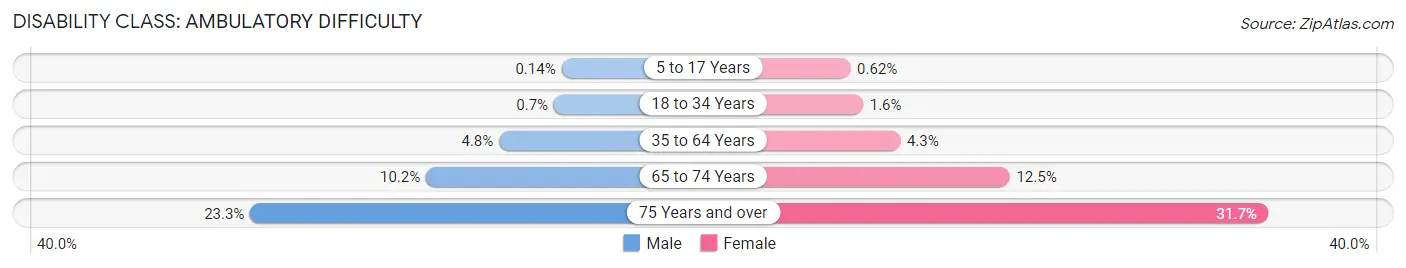
| Age Bracket | Male | Female |
| 5 to 17 Years | 15 (0.1%) | 65 (0.6%) |
| 18 to 34 Years | 102 (0.7%) | 208 (1.6%) |
| 35 to 64 Years | 1,490 (4.8%) | 1,337 (4.3%) |
| 65 to 74 Years | 809 (10.2%) | 1,007 (12.4%) |
| 75 Years and over | 977 (23.3%) | 1,682 (31.7%) |
Disability Class: Self-Care Difficulty
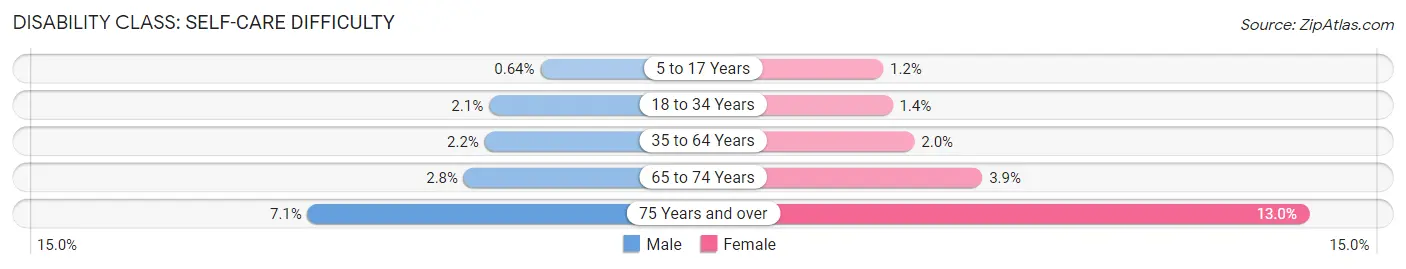
| Age Bracket | Male | Female |
| 5 to 17 Years | 70 (0.6%) | 121 (1.1%) |
| 18 to 34 Years | 301 (2.1%) | 187 (1.4%) |
| 35 to 64 Years | 684 (2.2%) | 625 (2.0%) |
| 65 to 74 Years | 220 (2.8%) | 316 (3.9%) |
| 75 Years and over | 299 (7.1%) | 690 (13.0%) |
Technology Access in Sussex County
Computing Device Access in Sussex County
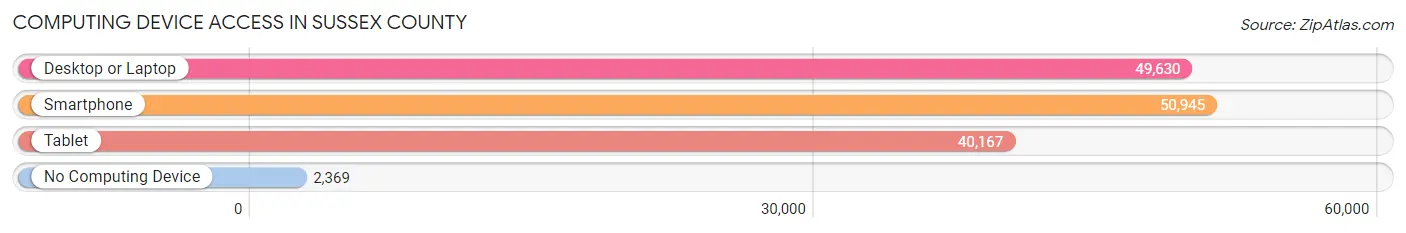
| Device Type | # Households | % Households |
| Desktop or Laptop | 49,630 | 88.1% |
| Smartphone | 50,945 | 90.4% |
| Tablet | 40,167 | 71.3% |
| No Computing Device | 2,369 | 4.2% |
| Total | 56,348 | 100.0% |
Internet Access in Sussex County

| Internet Type | # Households | % Households |
| Dial-Up Internet | 144 | 0.3% |
| Broadband Home | 46,656 | 82.8% |
| Cellular Data Only | 4,036 | 7.2% |
| Satellite Internet | 4,098 | 7.3% |
| No Internet | 3,783 | 6.7% |
| Total | 56,348 | 100.0% |
Sussex County Summary
Sussex County, New Jersey is located in the northern part of the state and is part of the New York metropolitan area. It is the 14th most populous county in the state, with a population of 149,265 as of the 2010 census. The county seat is Newton.
Geography
Sussex County is located in the northern part of New Jersey, bordered by Warren County to the north, Morris County to the east, Passaic County to the south, and Warren County, New York to the west. The county covers an area of 517 square miles, making it the second largest county in the state. The terrain is mostly hilly, with the Kittatinny Mountains running through the center of the county. The highest point in the county is High Point, located at 1,803 feet above sea level. The county is home to several rivers, including the Wallkill River, the Pequest River, and the Paulinskill River.
Demographics
As of the 2010 census, Sussex County had a population of 149,265. The racial makeup of the county was 90.3% White, 4.2% Hispanic or Latino, 2.7% Black or African American, 1.3% Asian, 0.3% Native American, and 1.4% from two or more races. The median household income was $71,917, and the median family income was $86,824.
Economy
Sussex County has a diverse economy, with a mix of manufacturing, retail, and service industries. The county is home to several large employers, including the pharmaceutical company Merck & Co., the food manufacturer Mars, Inc., and the telecommunications company Verizon. The county is also home to several smaller businesses, including several wineries, breweries, and distilleries.
Agriculture is also an important part of the county's economy. The county is home to several farms, including dairy farms, vegetable farms, and fruit farms. The county is also home to several farmers' markets, where local farmers sell their produce.
History
Sussex County was established in 1753, when it was separated from Morris County. The county was named after the county of Sussex in England. The county was originally home to the Lenape Native Americans, who were displaced by European settlers in the 17th and 18th centuries.
During the American Revolution, Sussex County was a hotbed of activity. The county was home to several battles, including the Battle of Minisink and the Battle of Newton. After the war, the county continued to grow, with the development of several industries, including iron mining, lumbering, and farming.
In the late 19th and early 20th centuries, Sussex County became a popular tourist destination, with the development of several resorts and hotels. The county also became a popular destination for outdoor recreation, with the development of several state parks, including High Point State Park and Stokes State Forest.
Today, Sussex County is a popular destination for outdoor recreation, with several state parks, forests, and lakes. The county is also home to several wineries, breweries, and distilleries, as well as several historic sites.
Common Questions
What is the Total Population of Sussex County?
Total Population of Sussex County is 144,808.
What is the Total Male Population of Sussex County?
Total Male Population of Sussex County is 72,893.
What is the Total Female Population of Sussex County?
Total Female Population of Sussex County is 71,915.
What is the Ratio of Males per 100 Females in Sussex County?
There are 101.36 Males per 100 Females in Sussex County.
What is the Ratio of Females per 100 Males in Sussex County?
There are 98.66 Females per 100 Males in Sussex County.
What is the Median Population Age in Sussex County?
Median Population Age in Sussex County is 44.5 Years.
What is the Average Family Size in Sussex County
Average Family Size in Sussex County is 3.0 People.
What is the Average Household Size in Sussex County
Average Household Size in Sussex County is 2.5 People.
What is Per Capita Income in Sussex County?
Per Capita income in Sussex County is $54,124.
What is the Median Family Income in Sussex County?
Median Family Income in Sussex County is $130,760.
What is the Median Household income in Sussex County?
Median Household Income in Sussex County is $111,094.
What is Income or Wage Gap in Sussex County?
Income or Wage Gap in Sussex County is 31.1%.
Women in Sussex County earn 68.9 cents for every dollar earned by a man.
What is Family Income Deficit in Sussex County?
Family Income Deficit in Sussex County is $11,601.
Families that are below poverty line in Sussex County earn $11,601 less on average than the poverty threshold level.
What is Inequality or Gini Index in Sussex County?
Inequality or Gini Index in Sussex County is 0.42.
How Large is the Labor Force in Sussex County?
There are 82,362 People in the Labor Forcein in Sussex County.
What is the Percentage of People in the Labor Force in Sussex County?
68.4% of People are in the Labor Force in Sussex County.
What is the Unemployment Rate in Sussex County?
Unemployment Rate in Sussex County is 5.5%.