Somerset County, NJ
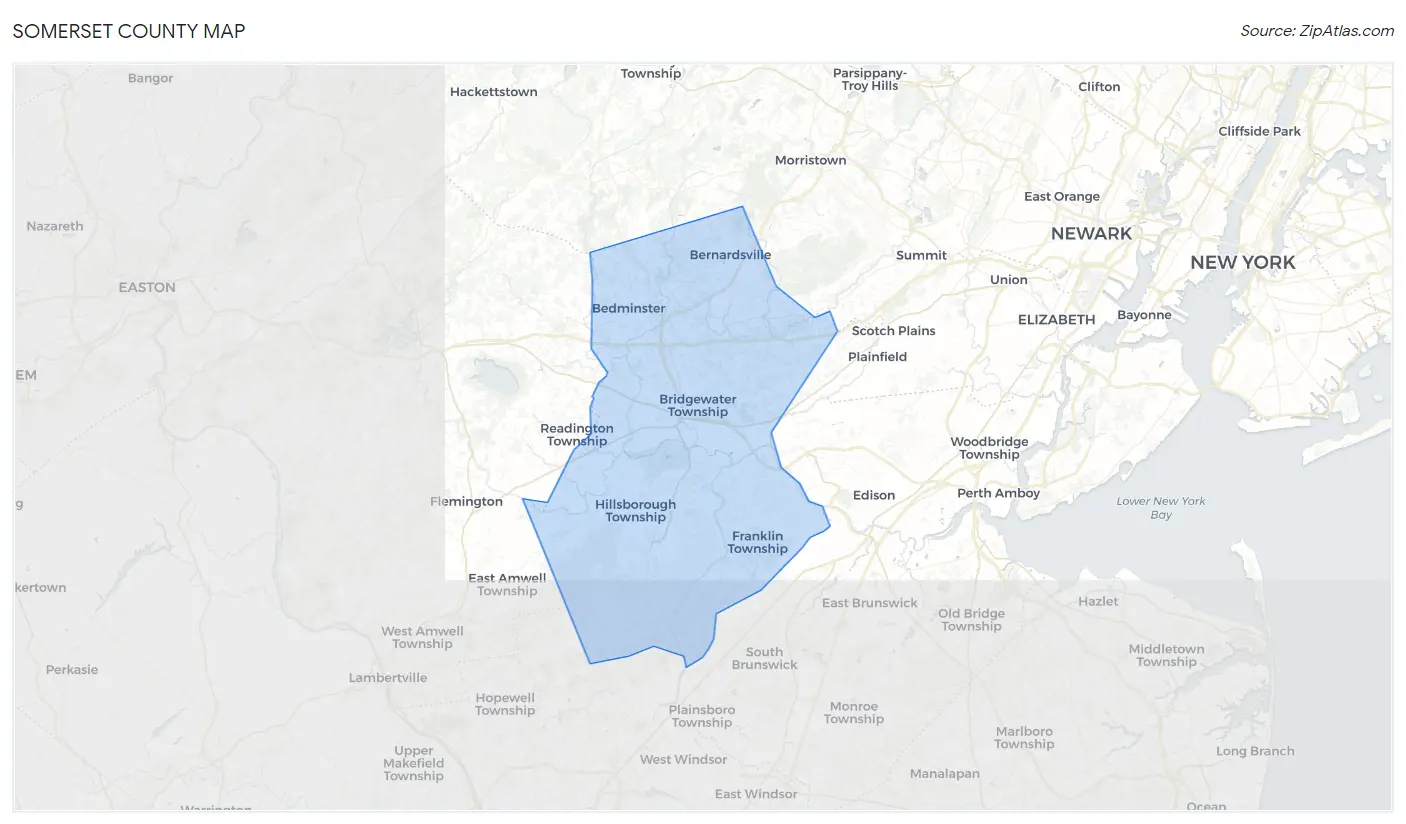
Somerset County Map
Somerset County Overview
344,978
TOTAL POPULATION
170,153
MALE POPULATION
174,825
FEMALE POPULATION
97.33
MALES / 100 FEMALES
102.75
FEMALES / 100 MALES
42.0
MEDIAN AGE
3.2
AVG FAMILY SIZE
2.7
AVG HOUSEHOLD SIZE
$67,554
PER CAPITA INCOME
$161,223
AVG FAMILY INCOME
$131,948
AVG HOUSEHOLD INCOME
31.1%
WAGE / INCOME GAP [ % ]
68.9¢/ $1
WAGE / INCOME GAP [ $ ]
$10,515
FAMILY INCOME DEFICIT
0.46
INEQUALITY / GINI INDEX
194,680
LABOR FORCE [ PEOPLE ]
69.3%
PERCENT IN LABOR FORCE
5.0%
UNEMPLOYMENT RATE
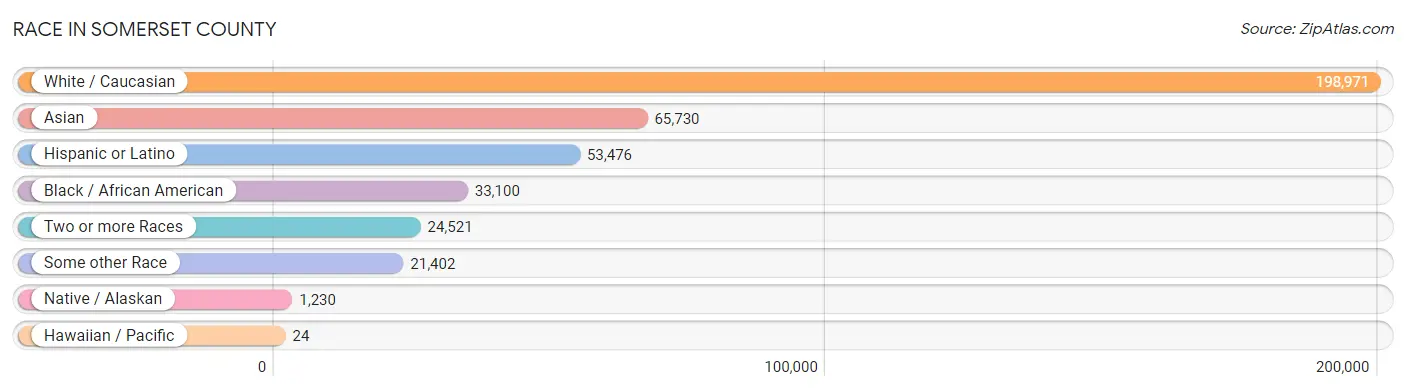
Race in Somerset County
The most populous races in Somerset County are White / Caucasian (198,971 | 57.7%), Asian (65,730 | 19.1%), and Hispanic or Latino (53,476 | 15.5%).
| Race | # Population | % Population |
| Asian | 65,730 | 19.1% |
| Black / African American | 33,100 | 9.6% |
| Hawaiian / Pacific | 24 | 0.0% |
| Hispanic or Latino | 53,476 | 15.5% |
| Native / Alaskan | 1,230 | 0.4% |
| White / Caucasian | 198,971 | 57.7% |
| Two or more Races | 24,521 | 7.1% |
| Some other Race | 21,402 | 6.2% |
| Total | 344,978 | 100.0% |
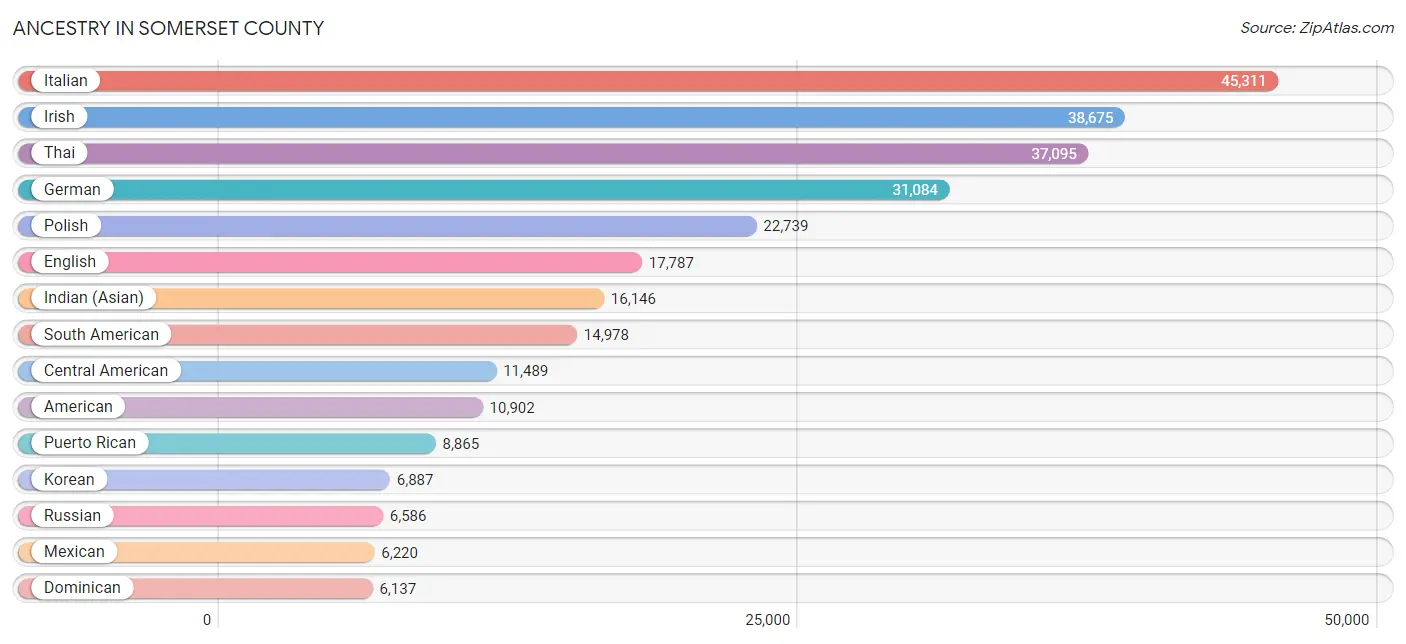
Ancestry in Somerset County
The most populous ancestries reported in Somerset County are Italian (45,311 | 13.1%), Irish (38,675 | 11.2%), Thai (37,095 | 10.7%), German (31,084 | 9.0%), and Polish (22,739 | 6.6%), together accounting for 50.7% of all Somerset County residents.
| Ancestry | # Population | % Population |
| Afghan | 171 | 0.1% |
| African | 1,666 | 0.5% |
| Albanian | 327 | 0.1% |
| Alsatian | 11 | 0.0% |
| American | 10,902 | 3.2% |
| Apache | 6 | 0.0% |
| Arab | 3,670 | 1.1% |
| Argentinean | 668 | 0.2% |
| Armenian | 348 | 0.1% |
| Assyrian / Chaldean / Syriac | 53 | 0.0% |
| Austrian | 1,244 | 0.4% |
| Bahamian | 72 | 0.0% |
| Barbadian | 91 | 0.0% |
| Basque | 21 | 0.0% |
| Belgian | 260 | 0.1% |
| Belizean | 17 | 0.0% |
| Bhutanese | 1,182 | 0.3% |
| Blackfeet | 71 | 0.0% |
| Bolivian | 48 | 0.0% |
| Brazilian | 648 | 0.2% |
| British | 1,728 | 0.5% |
| British West Indian | 424 | 0.1% |
| Bulgarian | 27 | 0.0% |
| Burmese | 2,232 | 0.6% |
| Cajun | 10 | 0.0% |
| Cambodian | 111 | 0.0% |
| Canadian | 593 | 0.2% |
| Carpatho Rusyn | 145 | 0.0% |
| Central American | 11,489 | 3.3% |
| Central American Indian | 1,468 | 0.4% |
| Cherokee | 131 | 0.0% |
| Chickasaw | 7 | 0.0% |
| Chilean | 217 | 0.1% |
| Choctaw | 29 | 0.0% |
| Colombian | 5,822 | 1.7% |
| Costa Rican | 3,625 | 1.1% |
| Creek | 25 | 0.0% |
| Croatian | 292 | 0.1% |
| Cuban | 2,137 | 0.6% |
| Cypriot | 13 | 0.0% |
| Czech | 1,149 | 0.3% |
| Czechoslovakian | 741 | 0.2% |
| Danish | 692 | 0.2% |
| Delaware | 274 | 0.1% |
| Dominican | 6,137 | 1.8% |
| Dutch | 3,339 | 1.0% |
| Eastern European | 2,698 | 0.8% |
| Ecuadorian | 3,528 | 1.0% |
| Egyptian | 1,634 | 0.5% |
| English | 17,787 | 5.2% |
| Estonian | 111 | 0.0% |
| Ethiopian | 79 | 0.0% |
| European | 2,723 | 0.8% |
| Filipino | 1,484 | 0.4% |
| Finnish | 142 | 0.0% |
| French | 3,820 | 1.1% |
| French Canadian | 978 | 0.3% |
| German | 31,084 | 9.0% |
| German Russian | 26 | 0.0% |
| Ghanaian | 650 | 0.2% |
| Greek | 1,922 | 0.6% |
| Guatemalan | 3,381 | 1.0% |
| Guyanese | 635 | 0.2% |
| Haitian | 1,414 | 0.4% |
| Honduran | 1,798 | 0.5% |
| Hungarian | 4,589 | 1.3% |
| Icelander | 3 | 0.0% |
| Indian (Asian) | 16,146 | 4.7% |
| Iranian | 724 | 0.2% |
| Iraqi | 74 | 0.0% |
| Irish | 38,675 | 11.2% |
| Iroquois | 69 | 0.0% |
| Israeli | 206 | 0.1% |
| Italian | 45,311 | 13.1% |
| Jamaican | 2,635 | 0.8% |
| Jordanian | 37 | 0.0% |
| Kenyan | 26 | 0.0% |
| Korean | 6,887 | 2.0% |
| Laotian | 69 | 0.0% |
| Latvian | 237 | 0.1% |
| Lebanese | 619 | 0.2% |
| Liberian | 60 | 0.0% |
| Lithuanian | 1,295 | 0.4% |
| Lumbee | 70 | 0.0% |
| Macedonian | 72 | 0.0% |
| Malaysian | 11 | 0.0% |
| Maltese | 113 | 0.0% |
| Mexican | 6,220 | 1.8% |
| Mexican American Indian | 86 | 0.0% |
| Mongolian | 75 | 0.0% |
| Moroccan | 62 | 0.0% |
| Native Hawaiian | 88 | 0.0% |
| Navajo | 27 | 0.0% |
| New Zealander | 45 | 0.0% |
| Nicaraguan | 83 | 0.0% |
| Nigerian | 431 | 0.1% |
| Northern European | 172 | 0.1% |
| Norwegian | 2,534 | 0.7% |
| Okinawan | 6 | 0.0% |
| Pakistani | 148 | 0.0% |
| Palestinian | 539 | 0.2% |
| Panamanian | 223 | 0.1% |
| Paraguayan | 1,405 | 0.4% |
| Pennsylvania German | 114 | 0.0% |
| Peruvian | 2,727 | 0.8% |
| Polish | 22,739 | 6.6% |
| Portuguese | 3,315 | 1.0% |
| Puerto Rican | 8,865 | 2.6% |
| Romanian | 717 | 0.2% |
| Russian | 6,586 | 1.9% |
| Salvadoran | 2,379 | 0.7% |
| Samoan | 26 | 0.0% |
| Scandinavian | 227 | 0.1% |
| Scotch-Irish | 845 | 0.2% |
| Scottish | 4,193 | 1.2% |
| Seminole | 13 | 0.0% |
| Serbian | 114 | 0.0% |
| Sierra Leonean | 295 | 0.1% |
| Sioux | 7 | 0.0% |
| Slavic | 186 | 0.1% |
| Slovak | 2,116 | 0.6% |
| Slovene | 136 | 0.0% |
| South African | 107 | 0.0% |
| South American | 14,978 | 4.3% |
| South American Indian | 378 | 0.1% |
| Spaniard | 997 | 0.3% |
| Spanish | 1,107 | 0.3% |
| Spanish American | 2 | 0.0% |
| Sri Lankan | 1,277 | 0.4% |
| Subsaharan African | 3,881 | 1.1% |
| Sudanese | 94 | 0.0% |
| Swedish | 2,316 | 0.7% |
| Swiss | 971 | 0.3% |
| Syrian | 474 | 0.1% |
| Thai | 37,095 | 10.7% |
| Trinidadian and Tobagonian | 498 | 0.1% |
| Turkish | 538 | 0.2% |
| U.S. Virgin Islander | 221 | 0.1% |
| Ukrainian | 3,026 | 0.9% |
| Uruguayan | 191 | 0.1% |
| Venezuelan | 372 | 0.1% |
| Vietnamese | 159 | 0.1% |
| Welsh | 894 | 0.3% |
| West Indian | 242 | 0.1% |
| Yugoslavian | 210 | 0.1% |
| Zimbabwean | 15 | 0.0% | View All 146 Rows |
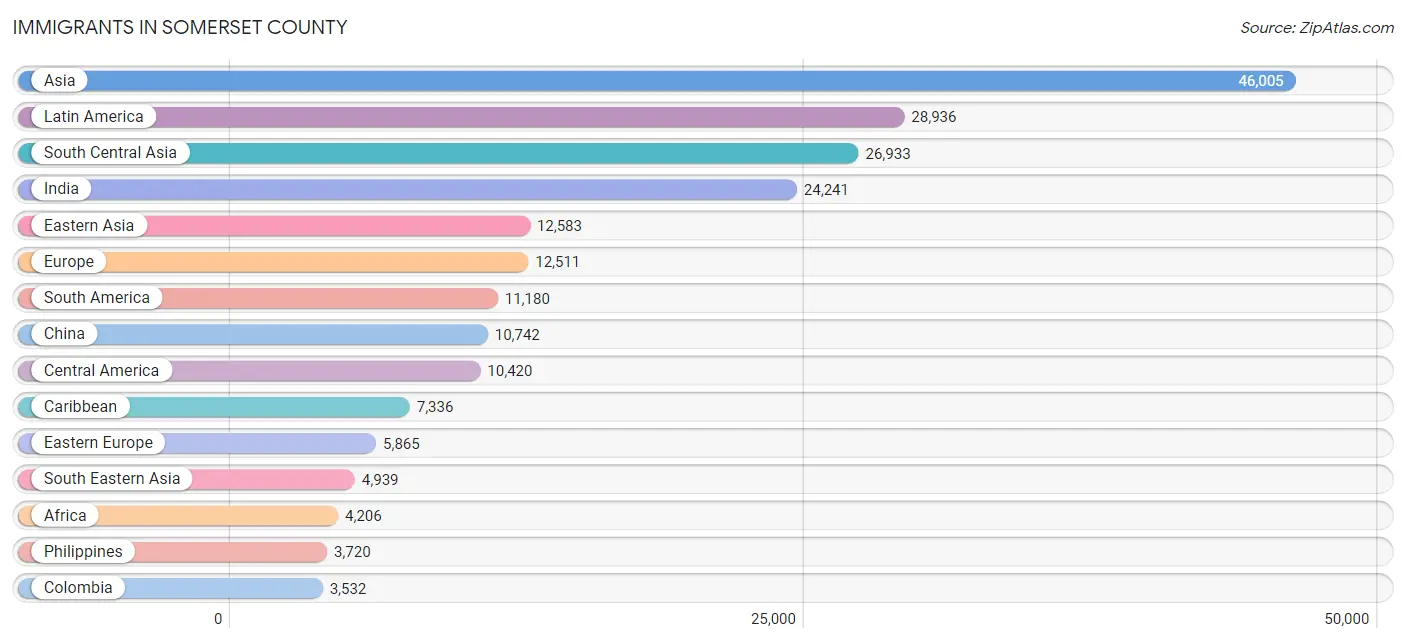
Immigrants in Somerset County
The most numerous immigrant groups reported in Somerset County came from Asia (46,005 | 13.3%), Latin America (28,936 | 8.4%), South Central Asia (26,933 | 7.8%), India (24,241 | 7.0%), and Eastern Asia (12,583 | 3.6%), together accounting for 40.2% of all Somerset County residents.
| Immigration Origin | # Population | % Population |
| Afghanistan | 56 | 0.0% |
| Africa | 4,206 | 1.2% |
| Albania | 75 | 0.0% |
| Argentina | 415 | 0.1% |
| Armenia | 34 | 0.0% |
| Asia | 46,005 | 13.3% |
| Australia | 93 | 0.0% |
| Austria | 46 | 0.0% |
| Bahamas | 42 | 0.0% |
| Bangladesh | 237 | 0.1% |
| Barbados | 75 | 0.0% |
| Belarus | 324 | 0.1% |
| Belgium | 88 | 0.0% |
| Bolivia | 48 | 0.0% |
| Bosnia and Herzegovina | 29 | 0.0% |
| Brazil | 1,033 | 0.3% |
| Bulgaria | 6 | 0.0% |
| Cambodia | 26 | 0.0% |
| Cameroon | 583 | 0.2% |
| Canada | 830 | 0.2% |
| Caribbean | 7,336 | 2.1% |
| Central America | 10,420 | 3.0% |
| Chile | 189 | 0.1% |
| China | 10,742 | 3.1% |
| Colombia | 3,532 | 1.0% |
| Costa Rica | 2,459 | 0.7% |
| Croatia | 60 | 0.0% |
| Cuba | 564 | 0.2% |
| Czechoslovakia | 121 | 0.0% |
| Denmark | 43 | 0.0% |
| Dominica | 243 | 0.1% |
| Dominican Republic | 3,491 | 1.0% |
| Eastern Africa | 479 | 0.1% |
| Eastern Asia | 12,583 | 3.6% |
| Eastern Europe | 5,865 | 1.7% |
| Ecuador | 2,063 | 0.6% |
| Egypt | 1,134 | 0.3% |
| El Salvador | 1,743 | 0.5% |
| England | 697 | 0.2% |
| Ethiopia | 52 | 0.0% |
| Europe | 12,511 | 3.6% |
| France | 305 | 0.1% |
| Germany | 778 | 0.2% |
| Ghana | 730 | 0.2% |
| Greece | 185 | 0.1% |
| Guatemala | 2,342 | 0.7% |
| Guyana | 876 | 0.3% |
| Haiti | 823 | 0.2% |
| Honduras | 1,195 | 0.4% |
| Hong Kong | 686 | 0.2% |
| Hungary | 294 | 0.1% |
| India | 24,241 | 7.0% |
| Indonesia | 118 | 0.0% |
| Iran | 559 | 0.2% |
| Iraq | 60 | 0.0% |
| Ireland | 300 | 0.1% |
| Israel | 97 | 0.0% |
| Italy | 1,260 | 0.4% |
| Jamaica | 1,516 | 0.4% |
| Japan | 353 | 0.1% |
| Jordan | 54 | 0.0% |
| Kazakhstan | 39 | 0.0% |
| Kenya | 169 | 0.1% |
| Korea | 1,488 | 0.4% |
| Kuwait | 77 | 0.0% |
| Laos | 11 | 0.0% |
| Latin America | 28,936 | 8.4% |
| Lebanon | 154 | 0.0% |
| Liberia | 69 | 0.0% |
| Lithuania | 61 | 0.0% |
| Malaysia | 143 | 0.0% |
| Mexico | 2,497 | 0.7% |
| Middle Africa | 606 | 0.2% |
| Moldova | 113 | 0.0% |
| Morocco | 31 | 0.0% |
| Netherlands | 281 | 0.1% |
| Nicaragua | 115 | 0.0% |
| Nigeria | 245 | 0.1% |
| North Macedonia | 47 | 0.0% |
| Northern Africa | 1,285 | 0.4% |
| Northern Europe | 2,096 | 0.6% |
| Norway | 105 | 0.0% |
| Oceania | 143 | 0.0% |
| Pakistan | 1,243 | 0.4% |
| Panama | 69 | 0.0% |
| Peru | 1,753 | 0.5% |
| Philippines | 3,720 | 1.1% |
| Poland | 2,338 | 0.7% |
| Portugal | 1,082 | 0.3% |
| Romania | 278 | 0.1% |
| Russia | 1,001 | 0.3% |
| Saudi Arabia | 112 | 0.0% |
| Scotland | 152 | 0.0% |
| Senegal | 66 | 0.0% |
| Serbia | 23 | 0.0% |
| Sierra Leone | 261 | 0.1% |
| Singapore | 81 | 0.0% |
| South Africa | 170 | 0.1% |
| South America | 11,180 | 3.2% |
| South Central Asia | 26,933 | 7.8% |
| South Eastern Asia | 4,939 | 1.4% |
| Southern Europe | 2,993 | 0.9% |
| Spain | 449 | 0.1% |
| Sri Lanka | 516 | 0.2% |
| St. Vincent and the Grenadines | 30 | 0.0% |
| Sudan | 103 | 0.0% |
| Sweden | 27 | 0.0% |
| Switzerland | 59 | 0.0% |
| Syria | 223 | 0.1% |
| Taiwan | 2,001 | 0.6% |
| Thailand | 111 | 0.0% |
| Trinidad and Tobago | 263 | 0.1% |
| Turkey | 365 | 0.1% |
| Uganda | 118 | 0.0% |
| Ukraine | 882 | 0.3% |
| Uruguay | 81 | 0.0% |
| Uzbekistan | 31 | 0.0% |
| Venezuela | 328 | 0.1% |
| Vietnam | 729 | 0.2% |
| West Indies | 43 | 0.0% |
| Western Africa | 1,487 | 0.4% |
| Western Asia | 1,464 | 0.4% |
| Western Europe | 1,557 | 0.4% |
| Zimbabwe | 22 | 0.0% | View All 124 Rows |
Sex and Age in Somerset County
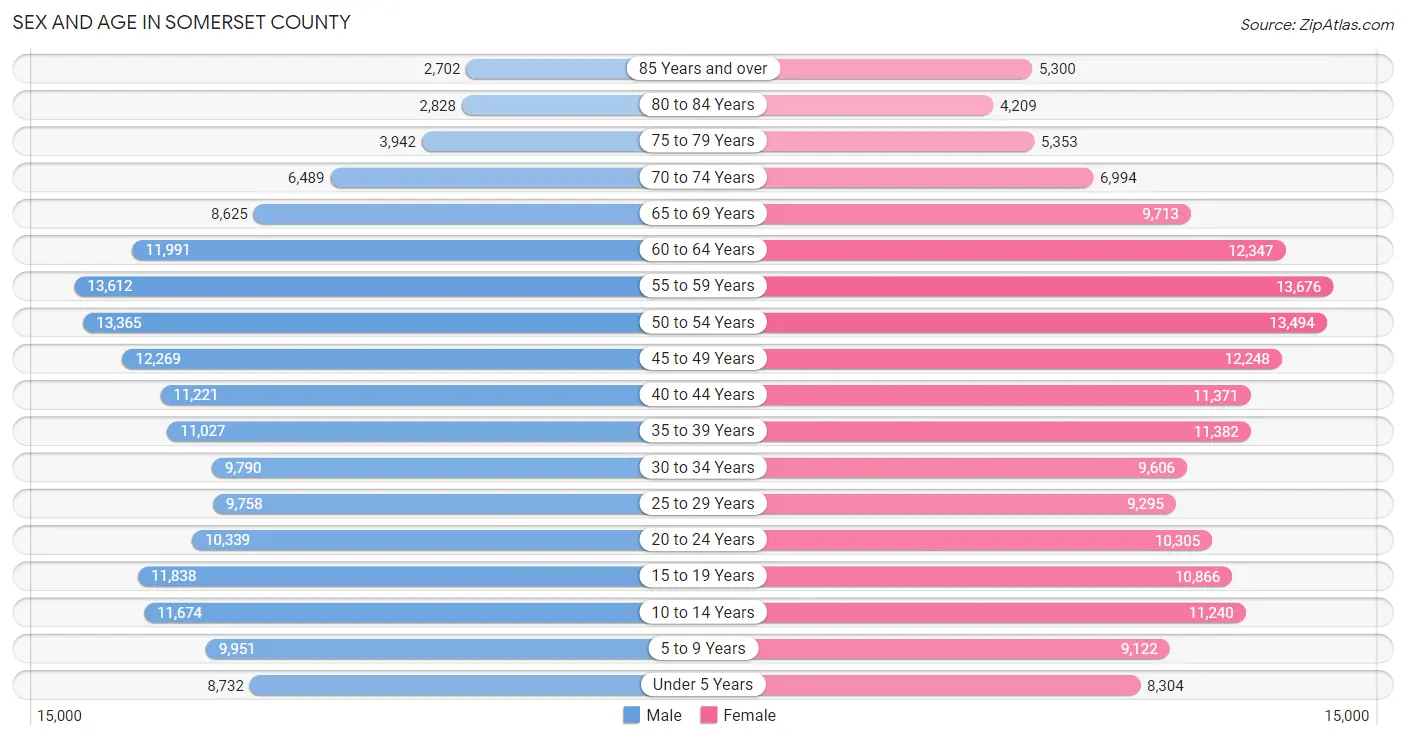
Sex and Age in Somerset County
The most populous age groups in Somerset County are 55 to 59 Years (13,612 | 8.0%) for men and 55 to 59 Years (13,676 | 7.8%) for women.
| Age Bracket | Male | Female |
| Under 5 Years | 8,732 (5.1%) | 8,304 (4.8%) |
| 5 to 9 Years | 9,951 (5.9%) | 9,122 (5.2%) |
| 10 to 14 Years | 11,674 (6.9%) | 11,240 (6.4%) |
| 15 to 19 Years | 11,838 (7.0%) | 10,866 (6.2%) |
| 20 to 24 Years | 10,339 (6.1%) | 10,305 (5.9%) |
| 25 to 29 Years | 9,758 (5.7%) | 9,295 (5.3%) |
| 30 to 34 Years | 9,790 (5.8%) | 9,606 (5.5%) |
| 35 to 39 Years | 11,027 (6.5%) | 11,382 (6.5%) |
| 40 to 44 Years | 11,221 (6.6%) | 11,371 (6.5%) |
| 45 to 49 Years | 12,269 (7.2%) | 12,248 (7.0%) |
| 50 to 54 Years | 13,365 (7.9%) | 13,494 (7.7%) |
| 55 to 59 Years | 13,612 (8.0%) | 13,676 (7.8%) |
| 60 to 64 Years | 11,991 (7.0%) | 12,347 (7.1%) |
| 65 to 69 Years | 8,625 (5.1%) | 9,713 (5.6%) |
| 70 to 74 Years | 6,489 (3.8%) | 6,994 (4.0%) |
| 75 to 79 Years | 3,942 (2.3%) | 5,353 (3.1%) |
| 80 to 84 Years | 2,828 (1.7%) | 4,209 (2.4%) |
| 85 Years and over | 2,702 (1.6%) | 5,300 (3.0%) |
| Total | 170,153 (100.0%) | 174,825 (100.0%) |
Families and Households in Somerset County
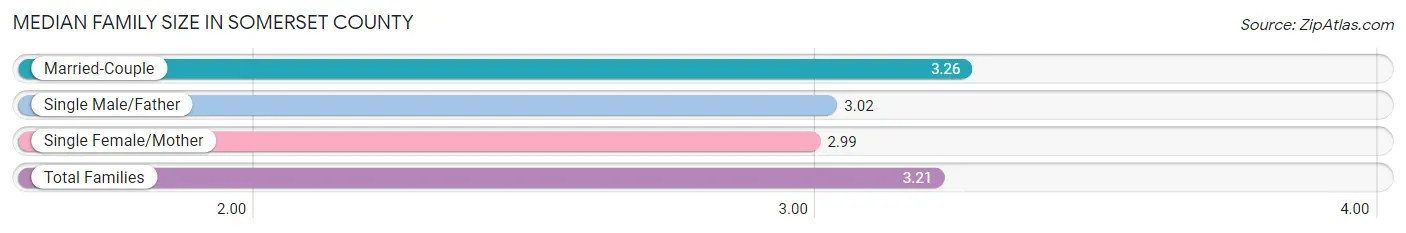
Median Family Size in Somerset County
The median family size in Somerset County is 3.21 persons per family, with married-couple families (74,514 | 81.8%) accounting for the largest median family size of 3.26 persons per family. On the other hand, single female/mother families (12,181 | 13.4%) represent the smallest median family size with 2.99 persons per family.
| Family Type | # Families | Family Size |
| Married-Couple | 74,514 (81.8%) | 3.26 |
| Single Male/Father | 4,371 (4.8%) | 3.02 |
| Single Female/Mother | 12,181 (13.4%) | 2.99 |
| Total Families | 91,066 (100.0%) | 3.21 |
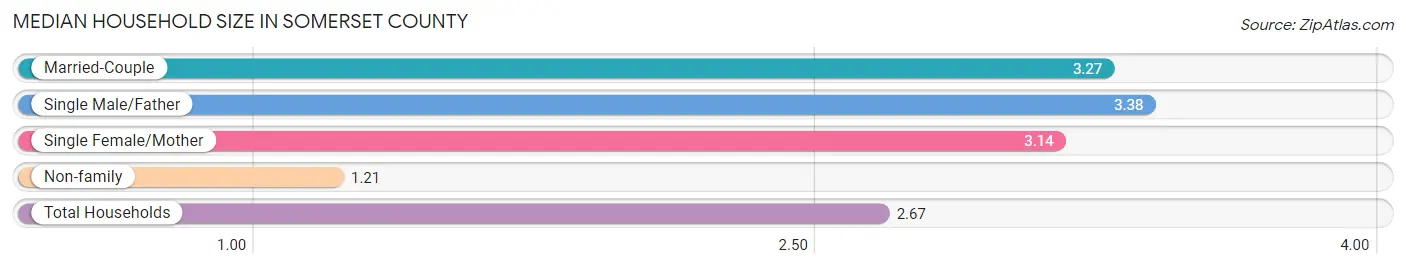
Median Household Size in Somerset County
The median household size in Somerset County is 2.67 persons per household, with single male/father households (4,371 | 3.4%) accounting for the largest median household size of 3.38 persons per household. non-family households (36,500 | 28.6%) represent the smallest median household size with 1.21 persons per household.
| Household Type | # Households | Household Size |
| Married-Couple | 74,514 (58.4%) | 3.27 |
| Single Male/Father | 4,371 (3.4%) | 3.38 |
| Single Female/Mother | 12,181 (9.6%) | 3.14 |
| Non-family | 36,500 (28.6%) | 1.21 |
| Total Households | 127,566 (100.0%) | 2.67 |
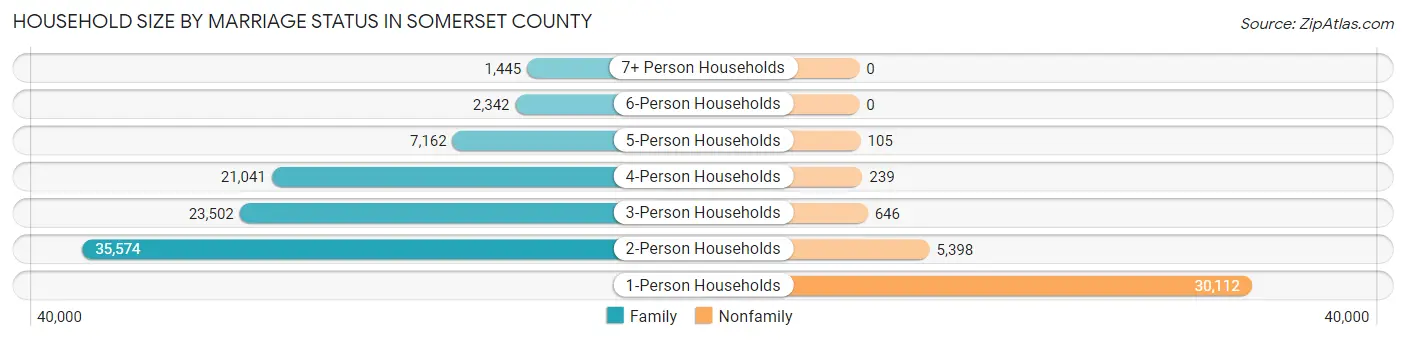
Household Size by Marriage Status in Somerset County
Out of a total of 127,566 households in Somerset County, 91,066 (71.4%) are family households, while 36,500 (28.6%) are nonfamily households. The most numerous type of family households are 2-person households, comprising 35,574, and the most common type of nonfamily households are 1-person households, comprising 30,112.
| Household Size | Family Households | Nonfamily Households |
| 1-Person Households | - | 30,112 (23.6%) |
| 2-Person Households | 35,574 (27.9%) | 5,398 (4.2%) |
| 3-Person Households | 23,502 (18.4%) | 646 (0.5%) |
| 4-Person Households | 21,041 (16.5%) | 239 (0.2%) |
| 5-Person Households | 7,162 (5.6%) | 105 (0.1%) |
| 6-Person Households | 2,342 (1.8%) | 0 (0.0%) |
| 7+ Person Households | 1,445 (1.1%) | 0 (0.0%) |
| Total | 91,066 (71.4%) | 36,500 (28.6%) |
Female Fertility in Somerset County
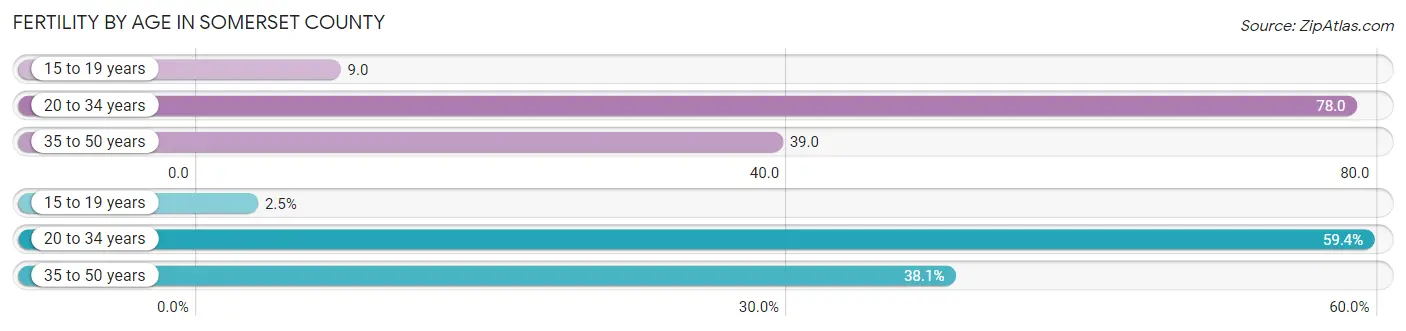
Fertility by Age in Somerset County
Average fertility rate in Somerset County is 50.0 births per 1,000 women. Women in the age bracket of 20 to 34 years have the highest fertility rate with 78.0 births per 1,000 women. Women in the age bracket of 20 to 34 years acount for 59.4% of all women with births.
| Age Bracket | Women with Births | Births / 1,000 Women |
| 15 to 19 years | 98 (2.5%) | 9.0 |
| 20 to 34 years | 2,292 (59.4%) | 78.0 |
| 35 to 50 years | 1,469 (38.1%) | 39.0 |
| Total | 3,859 (100.0%) | 50.0 |
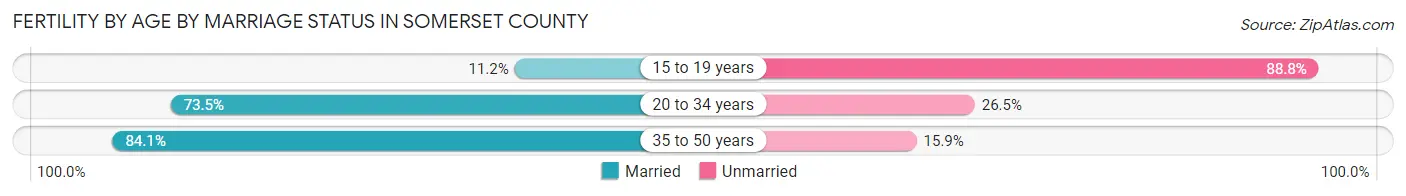
Fertility by Age by Marriage Status in Somerset County
75.9% of women with births (3,859) in Somerset County are married. The highest percentage of unmarried women with births falls into 15 to 19 years age bracket with 88.8% of them unmarried at the time of birth, while the lowest percentage of unmarried women with births belong to 35 to 50 years age bracket with 15.9% of them unmarried.
| Age Bracket | Married | Unmarried |
| 15 to 19 years | 11 (11.2%) | 87 (88.8%) |
| 20 to 34 years | 1,685 (73.5%) | 607 (26.5%) |
| 35 to 50 years | 1,235 (84.1%) | 234 (15.9%) |
| Total | 2,929 (75.9%) | 930 (24.1%) |
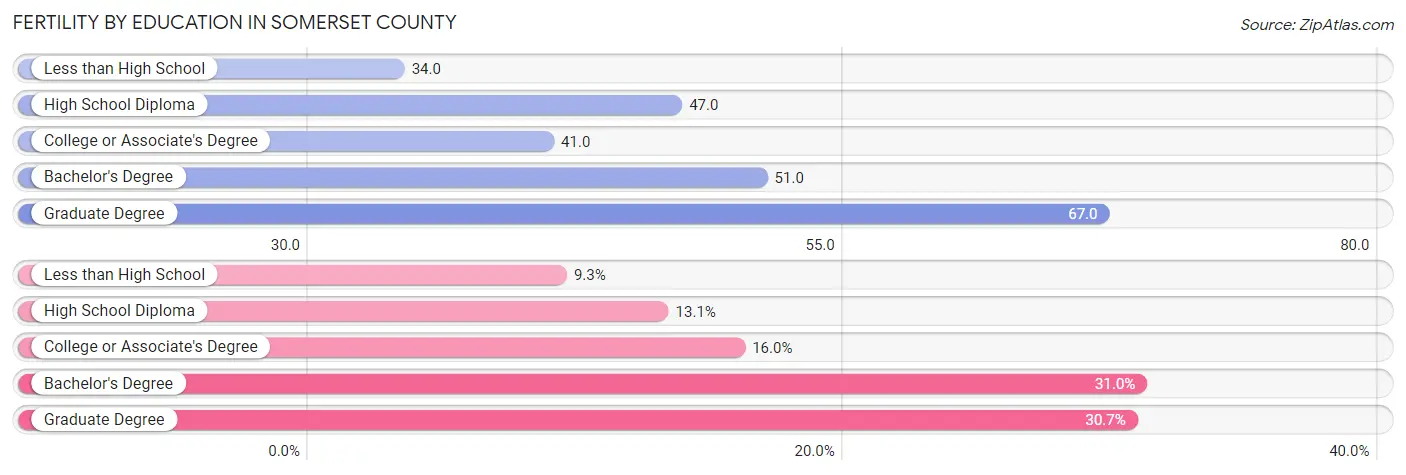
Fertility by Education in Somerset County
Average fertility rate in Somerset County is 50.0 births per 1,000 women. Women with the education attainment of graduate degree have the highest fertility rate of 67.0 births per 1,000 women, while women with the education attainment of less than high school have the lowest fertility at 34.0 births per 1,000 women. Women with the education attainment of bachelor's degree represent 31.0% of all women with births.
| Educational Attainment | Women with Births | Births / 1,000 Women |
| Less than High School | 358 (9.3%) | 34.0 |
| High School Diploma | 505 (13.1%) | 47.0 |
| College or Associate's Degree | 616 (16.0%) | 41.0 |
| Bachelor's Degree | 1,197 (31.0%) | 51.0 |
| Graduate Degree | 1,183 (30.7%) | 67.0 |
| Total | 3,859 (100.0%) | 50.0 |
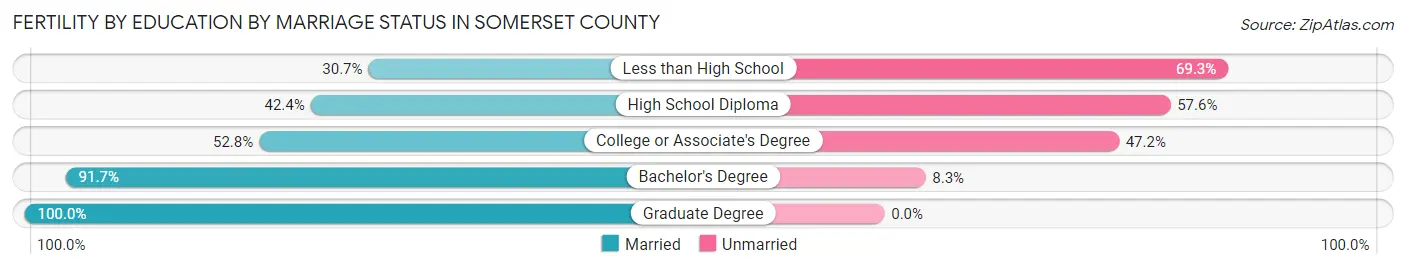
Fertility by Education by Marriage Status in Somerset County
24.1% of women with births in Somerset County are unmarried. Women with the educational attainment of graduate degree are most likely to be married with 100.0% of them married at childbirth, while women with the educational attainment of less than high school are least likely to be married with 69.3% of them unmarried at childbirth.
| Educational Attainment | Married | Unmarried |
| Less than High School | 110 (30.7%) | 248 (69.3%) |
| High School Diploma | 214 (42.4%) | 291 (57.6%) |
| College or Associate's Degree | 325 (52.8%) | 291 (47.2%) |
| Bachelor's Degree | 1,098 (91.7%) | 99 (8.3%) |
| Graduate Degree | 1,183 (100.0%) | 0 (0.0%) |
| Total | 2,929 (75.9%) | 930 (24.1%) |
Income in Somerset County
Income Overview in Somerset County
Per Capita Income in Somerset County is $67,554, while median incomes of families and households are $161,223 and $131,948 respectively.
| Characteristic | Number | Measure |
| Per Capita Income | 344,978 | $67,554 |
| Median Family Income | 91,066 | $161,223 |
| Mean Family Income | 91,066 | $210,038 |
| Median Household Income | 127,566 | $131,948 |
| Mean Household Income | 127,566 | $180,078 |
| Income Deficit | 91,066 | $10,515 |
| Wage / Income Gap (%) | 344,978 | 31.10% |
| Wage / Income Gap ($) | 344,978 | 68.90¢ per $1 |
| Gini / Inequality Index | 344,978 | 0.46 |
Earnings by Sex in Somerset County
Average Earnings in Somerset County are $67,021, $79,682 for men and $54,900 for women, a difference of 31.1%.
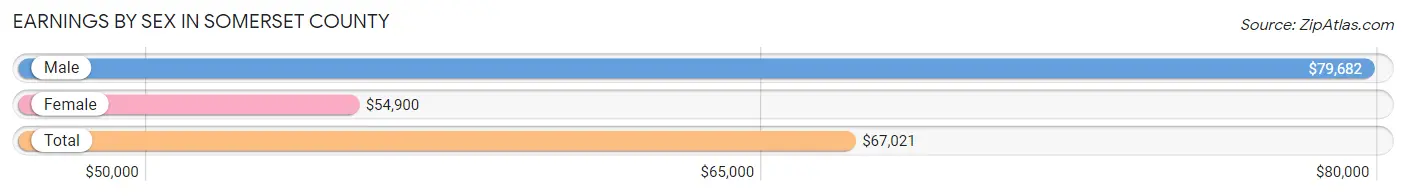
| Sex | Number | Average Earnings |
| Male | 106,192 (53.0%) | $79,682 |
| Female | 94,019 (47.0%) | $54,900 |
| Total | 200,211 (100.0%) | $67,021 |
Earnings by Sex by Income Bracket in Somerset County
The most common earnings brackets in Somerset County are $100,000+ for men (42,987 | 40.5%) and $100,000+ for women (22,733 | 24.2%).
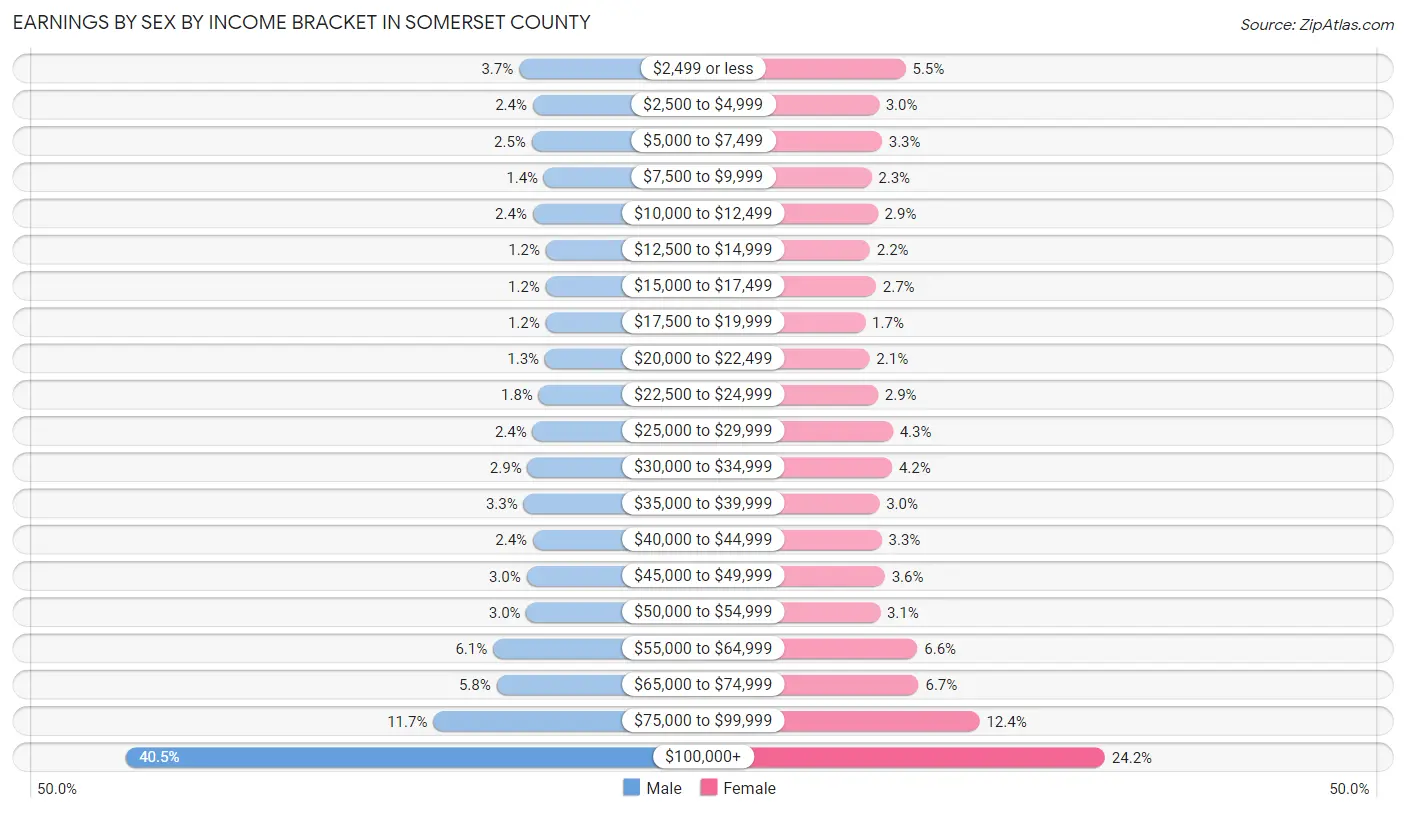
| Income | Male | Female |
| $2,499 or less | 3,903 (3.7%) | 5,174 (5.5%) |
| $2,500 to $4,999 | 2,541 (2.4%) | 2,807 (3.0%) |
| $5,000 to $7,499 | 2,650 (2.5%) | 3,081 (3.3%) |
| $7,500 to $9,999 | 1,436 (1.3%) | 2,158 (2.3%) |
| $10,000 to $12,499 | 2,550 (2.4%) | 2,718 (2.9%) |
| $12,500 to $14,999 | 1,240 (1.2%) | 2,032 (2.2%) |
| $15,000 to $17,499 | 1,261 (1.2%) | 2,558 (2.7%) |
| $17,500 to $19,999 | 1,276 (1.2%) | 1,620 (1.7%) |
| $20,000 to $22,499 | 1,341 (1.3%) | 1,989 (2.1%) |
| $22,500 to $24,999 | 1,953 (1.8%) | 2,738 (2.9%) |
| $25,000 to $29,999 | 2,556 (2.4%) | 4,045 (4.3%) |
| $30,000 to $34,999 | 3,068 (2.9%) | 3,980 (4.2%) |
| $35,000 to $39,999 | 3,466 (3.3%) | 2,856 (3.0%) |
| $40,000 to $44,999 | 2,532 (2.4%) | 3,061 (3.3%) |
| $45,000 to $49,999 | 3,165 (3.0%) | 3,334 (3.5%) |
| $50,000 to $54,999 | 3,175 (3.0%) | 2,920 (3.1%) |
| $55,000 to $64,999 | 6,499 (6.1%) | 6,214 (6.6%) |
| $65,000 to $74,999 | 6,144 (5.8%) | 6,315 (6.7%) |
| $75,000 to $99,999 | 12,449 (11.7%) | 11,686 (12.4%) |
| $100,000+ | 42,987 (40.5%) | 22,733 (24.2%) |
| Total | 106,192 (100.0%) | 94,019 (100.0%) |
Earnings by Sex by Educational Attainment in Somerset County
Average earnings in Somerset County are $90,968 for men and $63,543 for women, a difference of 30.1%. Men with an educational attainment of graduate degree enjoy the highest average annual earnings of $148,375, while those with less than high school education earn the least with $32,241. Women with an educational attainment of graduate degree earn the most with the average annual earnings of $96,445, while those with less than high school education have the smallest earnings of $24,847.
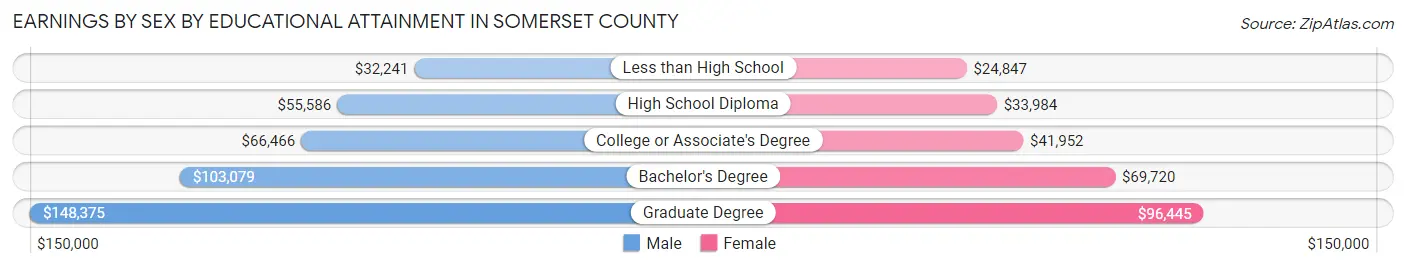
| Educational Attainment | Male Income | Female Income |
| Less than High School | $32,241 | $24,847 |
| High School Diploma | $55,586 | $33,984 |
| College or Associate's Degree | $66,466 | $41,952 |
| Bachelor's Degree | $103,079 | $69,720 |
| Graduate Degree | $148,375 | $96,445 |
| Total | $90,968 | $63,543 |
Family Income in Somerset County
Family Income Brackets in Somerset County
According to the Somerset County family income data, there are 35,516 families falling into the $200,000+ income range, which is the most common income bracket and makes up 39.0% of all families. Conversely, the $10,000 to $14,999 income bracket is the least frequent group with only 637 families (0.7%) belonging to this category.
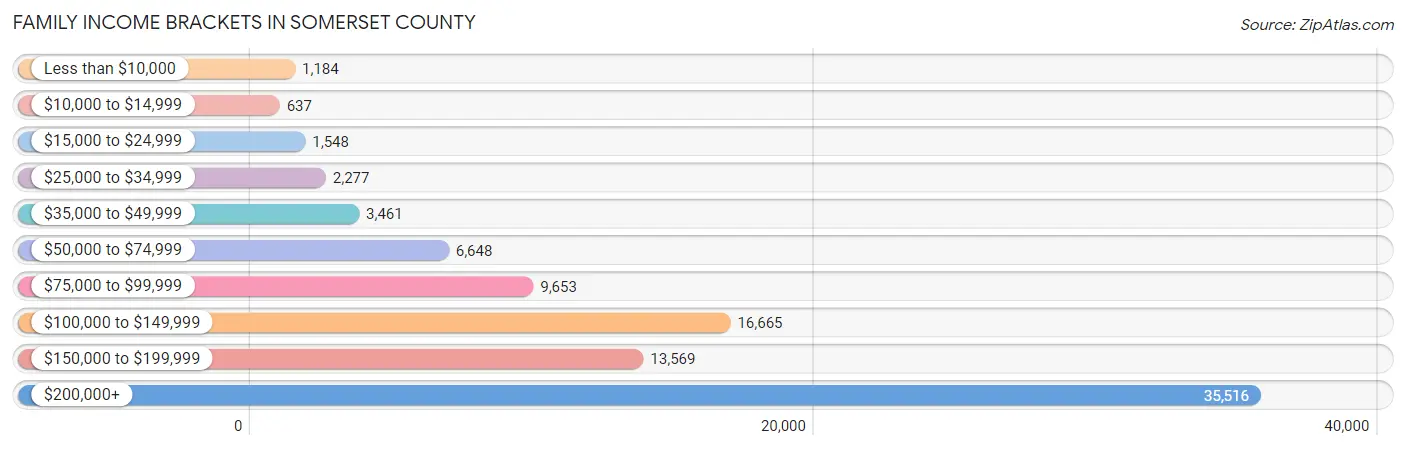
| Income Bracket | # Families | % Families |
| Less than $10,000 | 1,184 | 1.3% |
| $10,000 to $14,999 | 637 | 0.7% |
| $15,000 to $24,999 | 1,548 | 1.7% |
| $25,000 to $34,999 | 2,277 | 2.5% |
| $35,000 to $49,999 | 3,461 | 3.8% |
| $50,000 to $74,999 | 6,648 | 7.3% |
| $75,000 to $99,999 | 9,653 | 10.6% |
| $100,000 to $149,999 | 16,665 | 18.3% |
| $150,000 to $199,999 | 13,569 | 14.9% |
| $200,000+ | 35,516 | 39.0% |
Family Income by Famaliy Size in Somerset County
4-person families (20,465 | 22.5%) account for the highest median family income in Somerset County with $214,691 per family, while 2-person families (37,295 | 40.9%) have the highest median income of $62,776 per family member.
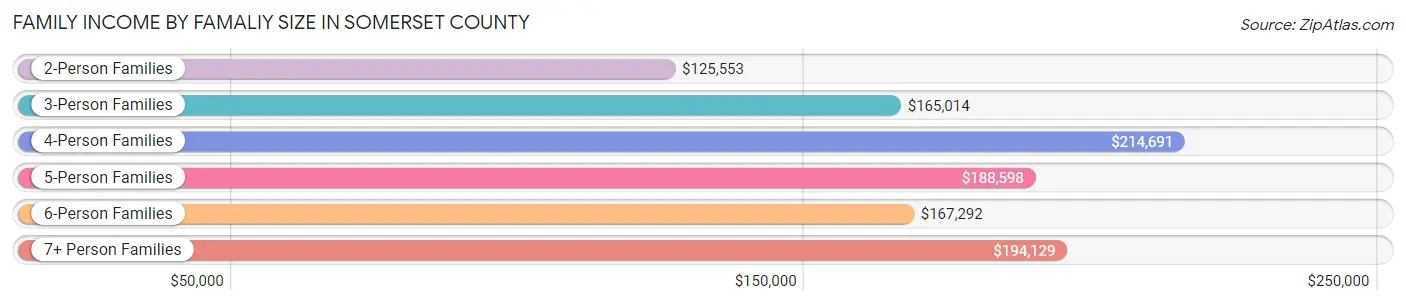
| Income Bracket | # Families | Median Income |
| 2-Person Families | 37,295 (40.9%) | $125,553 |
| 3-Person Families | 22,999 (25.3%) | $165,014 |
| 4-Person Families | 20,465 (22.5%) | $214,691 |
| 5-Person Families | 6,741 (7.4%) | $188,598 |
| 6-Person Families | 2,435 (2.7%) | $167,292 |
| 7+ Person Families | 1,131 (1.2%) | $194,129 |
| Total | 91,066 (100.0%) | $161,223 |
Family Income by Number of Earners in Somerset County
The median family income in Somerset County is $161,223, with families comprising 3+ earners (14,956) having the highest median family income of $220,453, while families with no earners (9,110) have the lowest median family income of $81,268, accounting for 16.4% and 10.0% of families, respectively.
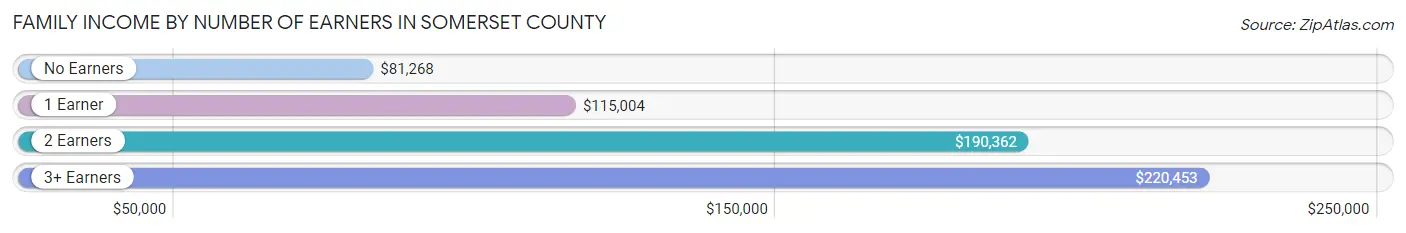
| Number of Earners | # Families | Median Income |
| No Earners | 9,110 (10.0%) | $81,268 |
| 1 Earner | 23,783 (26.1%) | $115,004 |
| 2 Earners | 43,217 (47.5%) | $190,362 |
| 3+ Earners | 14,956 (16.4%) | $220,453 |
| Total | 91,066 (100.0%) | $161,223 |
Household Income in Somerset County
Household Income Brackets in Somerset County
With 39,418 households falling in the category, the $200,000+ income range is the most frequent in Somerset County, accounting for 30.9% of all households. In contrast, only 2,041 households (1.6%) fall into the $10,000 to $14,999 income bracket, making it the least populous group.
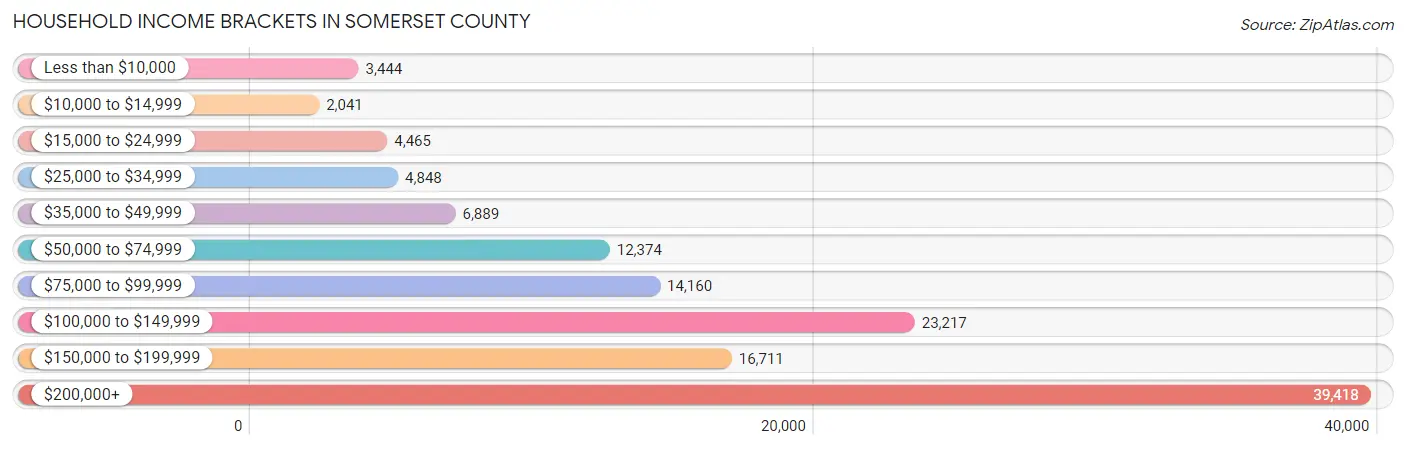
| Income Bracket | # Households | % Households |
| Less than $10,000 | 3,444 | 2.7% |
| $10,000 to $14,999 | 2,041 | 1.6% |
| $15,000 to $24,999 | 4,465 | 3.5% |
| $25,000 to $34,999 | 4,848 | 3.8% |
| $35,000 to $49,999 | 6,889 | 5.4% |
| $50,000 to $74,999 | 12,374 | 9.7% |
| $75,000 to $99,999 | 14,160 | 11.1% |
| $100,000 to $149,999 | 23,217 | 18.2% |
| $150,000 to $199,999 | 16,711 | 13.1% |
| $200,000+ | 39,418 | 30.9% |
Household Income by Householder Age in Somerset County
The median household income in Somerset County is $131,948, with the highest median household income of $167,637 found in the 45 to 64 years age bracket for the primary householder. A total of 57,573 households (45.1%) fall into this category. Meanwhile, the 15 to 24 years age bracket for the primary householder has the lowest median household income of $52,882, with 1,533 households (1.2%) in this group.
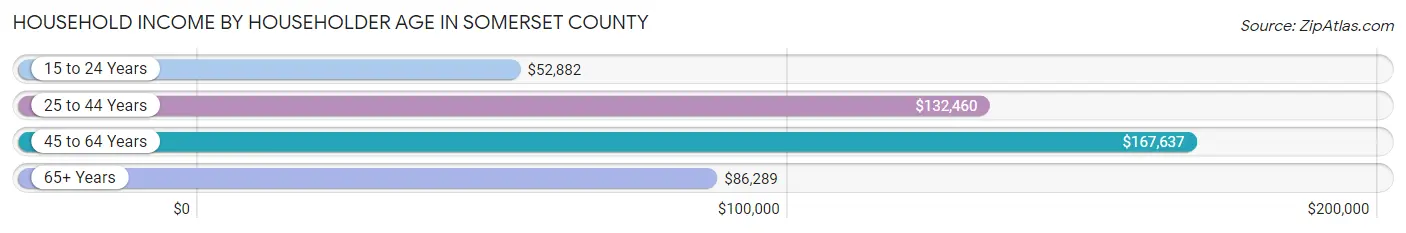
| Income Bracket | # Households | Median Income |
| 15 to 24 Years | 1,533 (1.2%) | $52,882 |
| 25 to 44 Years | 36,753 (28.8%) | $132,460 |
| 45 to 64 Years | 57,573 (45.1%) | $167,637 |
| 65+ Years | 31,707 (24.9%) | $86,289 |
| Total | 127,566 (100.0%) | $131,948 |
Poverty in Somerset County
Income Below Poverty by Sex and Age in Somerset County
With 4.4% poverty level for males and 6.1% for females among the residents of Somerset County, 16 and 17 year old males and 15 year old females are the most vulnerable to poverty, with 436 males (8.8%) and 274 females (11.6%) in their respective age groups living below the poverty level.
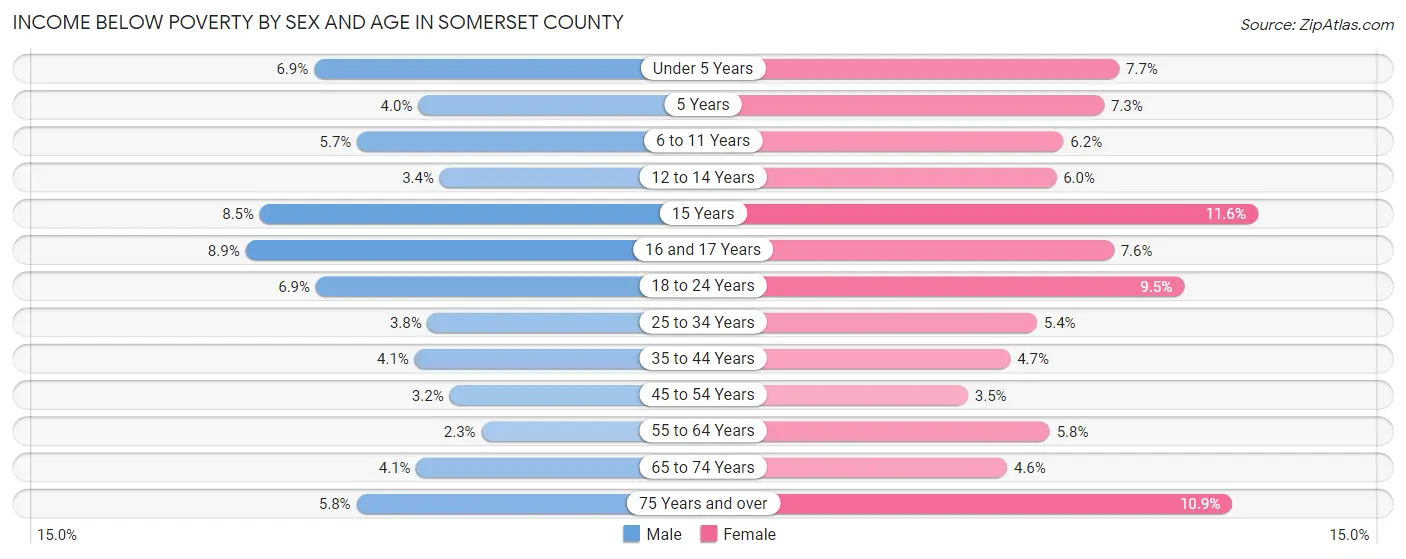
| Age Bracket | Male | Female |
| Under 5 Years | 600 (6.9%) | 633 (7.7%) |
| 5 Years | 66 (4.0%) | 118 (7.3%) |
| 6 to 11 Years | 734 (5.7%) | 718 (6.2%) |
| 12 to 14 Years | 241 (3.4%) | 413 (6.0%) |
| 15 Years | 223 (8.5%) | 274 (11.6%) |
| 16 and 17 Years | 436 (8.8%) | 352 (7.6%) |
| 18 to 24 Years | 993 (6.9%) | 1,330 (9.5%) |
| 25 to 34 Years | 734 (3.8%) | 1,026 (5.4%) |
| 35 to 44 Years | 919 (4.1%) | 1,067 (4.7%) |
| 45 to 54 Years | 812 (3.2%) | 902 (3.5%) |
| 55 to 64 Years | 580 (2.3%) | 1,501 (5.8%) |
| 65 to 74 Years | 611 (4.1%) | 763 (4.6%) |
| 75 Years and over | 523 (5.8%) | 1,528 (10.9%) |
| Total | 7,472 (4.4%) | 10,625 (6.1%) |
Income Above Poverty by Sex and Age in Somerset County
According to the poverty statistics in Somerset County, males aged 55 to 64 years and females aged 45 to 54 years are the age groups that are most secure financially, with 97.7% of males and 96.5% of females in these age groups living above the poverty line.
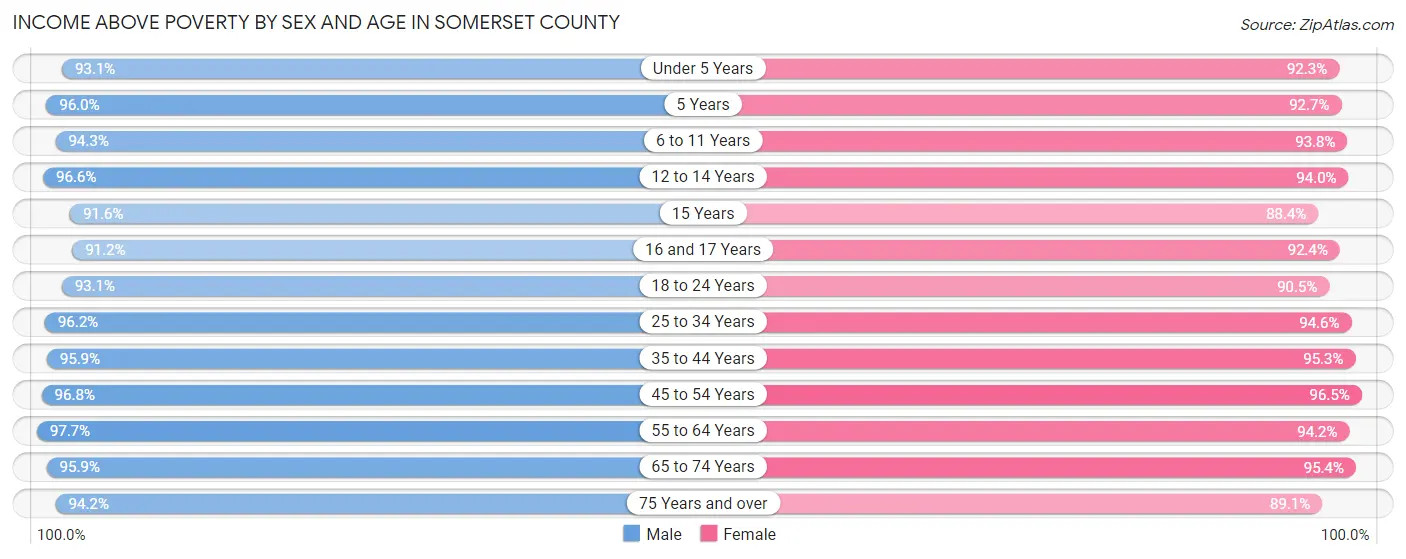
| Age Bracket | Male | Female |
| Under 5 Years | 8,048 (93.1%) | 7,567 (92.3%) |
| 5 Years | 1,566 (96.0%) | 1,499 (92.7%) |
| 6 to 11 Years | 12,047 (94.3%) | 10,921 (93.8%) |
| 12 to 14 Years | 6,761 (96.6%) | 6,506 (94.0%) |
| 15 Years | 2,415 (91.5%) | 2,092 (88.4%) |
| 16 and 17 Years | 4,492 (91.1%) | 4,298 (92.4%) |
| 18 to 24 Years | 13,415 (93.1%) | 12,632 (90.5%) |
| 25 to 34 Years | 18,699 (96.2%) | 17,865 (94.6%) |
| 35 to 44 Years | 21,254 (95.9%) | 21,678 (95.3%) |
| 45 to 54 Years | 24,779 (96.8%) | 24,791 (96.5%) |
| 55 to 64 Years | 24,879 (97.7%) | 24,430 (94.2%) |
| 65 to 74 Years | 14,332 (95.9%) | 15,824 (95.4%) |
| 75 Years and over | 8,553 (94.2%) | 12,525 (89.1%) |
| Total | 161,240 (95.6%) | 162,628 (93.9%) |
Income Below Poverty Among Married-Couple Families in Somerset County
The poverty statistics for married-couple families in Somerset County show that 1.7% or 1,283 of the total 74,514 families live below the poverty line. Families with 5 or more children have the highest poverty rate of 38.8%, comprising of 112 families. On the other hand, families with 1 or 2 children have the lowest poverty rate of 1.1%, which includes 318 families.
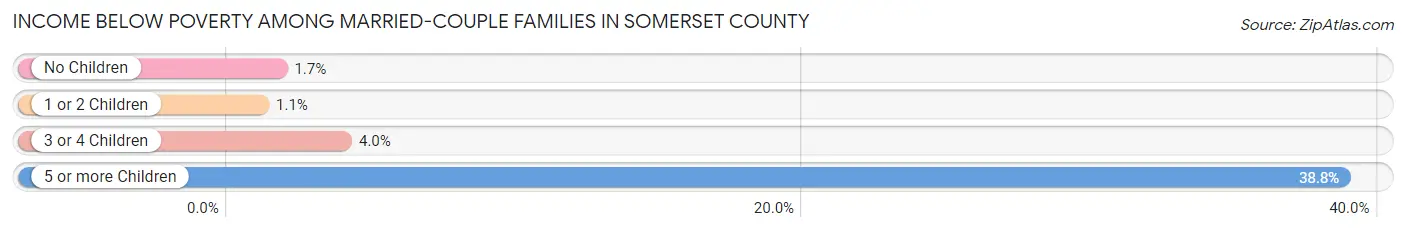
| Children | Above Poverty | Below Poverty |
| No Children | 40,287 (98.3%) | 704 (1.7%) |
| 1 or 2 Children | 29,159 (98.9%) | 318 (1.1%) |
| 3 or 4 Children | 3,608 (96.0%) | 149 (4.0%) |
| 5 or more Children | 177 (61.3%) | 112 (38.8%) |
| Total | 73,231 (98.3%) | 1,283 (1.7%) |
Income Below Poverty Among Single-Parent Households in Somerset County
According to the poverty data in Somerset County, 9.4% or 409 single-father households and 11.7% or 1,431 single-mother households are living below the poverty line. Among single-father households, those with 5 or more children have the highest poverty rate, with 20 households (100.0%) experiencing poverty. Likewise, among single-mother households, those with 5 or more children have the highest poverty rate, with 47 households (72.3%) falling below the poverty line.
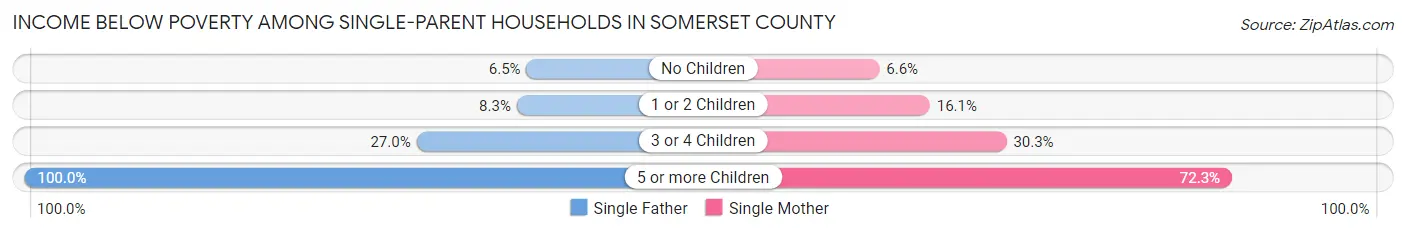
| Children | Single Father | Single Mother |
| No Children | 139 (6.5%) | 440 (6.6%) |
| 1 or 2 Children | 156 (8.3%) | 810 (16.1%) |
| 3 or 4 Children | 94 (27.0%) | 134 (30.3%) |
| 5 or more Children | 20 (100.0%) | 47 (72.3%) |
| Total | 409 (9.4%) | 1,431 (11.7%) |
Income Below Poverty Among Married-Couple vs Single-Parent Households in Somerset County
The poverty data for Somerset County shows that 1,283 of the married-couple family households (1.7%) and 1,840 of the single-parent households (11.1%) are living below the poverty level. Within the married-couple family households, those with 5 or more children have the highest poverty rate, with 112 households (38.8%) falling below the poverty line. Among the single-parent households, those with 5 or more children have the highest poverty rate, with 67 household (78.8%) living below poverty.
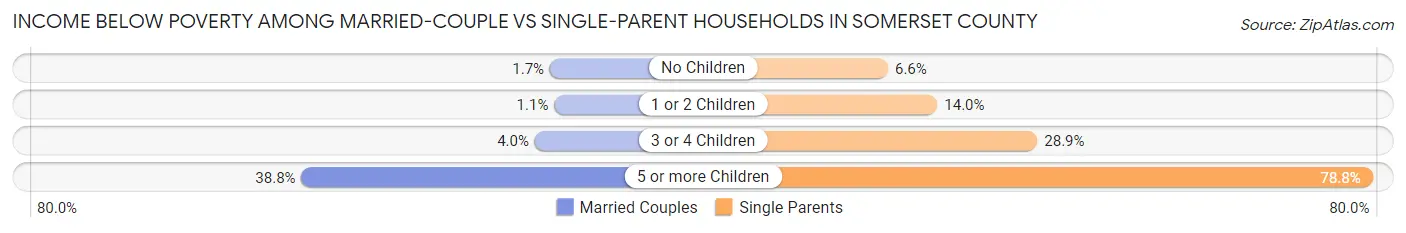
| Children | Married-Couple Families | Single-Parent Households |
| No Children | 704 (1.7%) | 579 (6.6%) |
| 1 or 2 Children | 318 (1.1%) | 966 (14.0%) |
| 3 or 4 Children | 149 (4.0%) | 228 (28.9%) |
| 5 or more Children | 112 (38.8%) | 67 (78.8%) |
| Total | 1,283 (1.7%) | 1,840 (11.1%) |
Employment Characteristics in Somerset County
Employment by Class of Employer in Somerset County
Among the 180,486 employed individuals in Somerset County, private company employees (131,266 | 72.7%), not-for-profit organizations (13,176 | 7.3%), and local government employees (11,554 | 6.4%) make up the most common classes of employment.
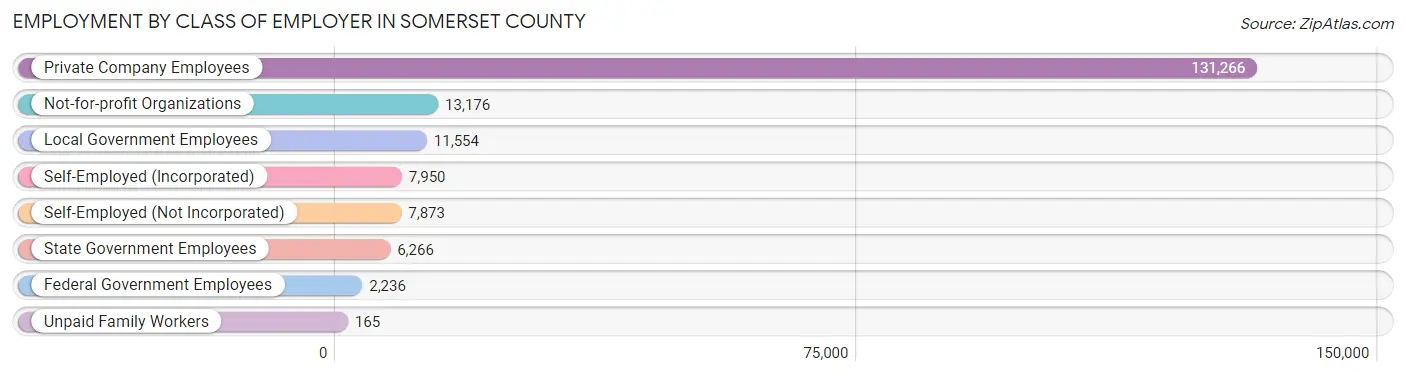
| Employer Class | # Employees | % Employees |
| Private Company Employees | 131,266 | 72.7% |
| Self-Employed (Incorporated) | 7,950 | 4.4% |
| Self-Employed (Not Incorporated) | 7,873 | 4.4% |
| Not-for-profit Organizations | 13,176 | 7.3% |
| Local Government Employees | 11,554 | 6.4% |
| State Government Employees | 6,266 | 3.5% |
| Federal Government Employees | 2,236 | 1.2% |
| Unpaid Family Workers | 165 | 0.1% |
| Total | 180,486 | 100.0% |
Employment Status by Age in Somerset County
According to the labor force statistics for Somerset County, out of the total population over 16 years of age (280,924), 69.3% or 194,680 individuals are in the labor force, with 5.0% or 9,734 of them unemployed. The age group with the highest labor force participation rate is 25 to 29 years, with 90.4% or 17,224 individuals in the labor force. Within the labor force, the 16 to 19 years age range has the highest percentage of unemployed individuals, with 10.6% or 637 of them being unemployed.
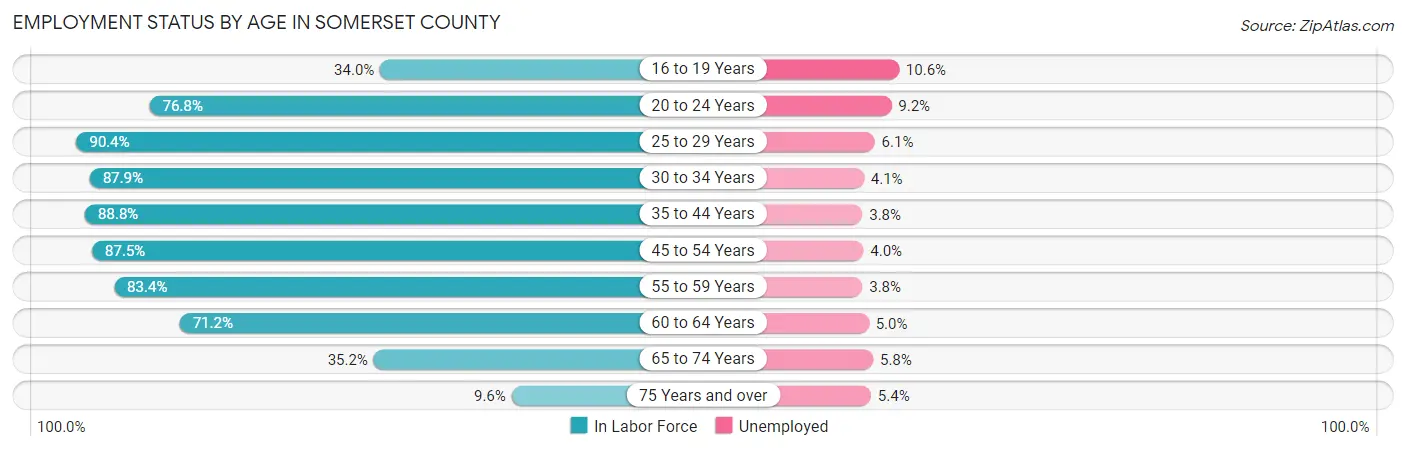
| Age Bracket | In Labor Force | Unemployed |
| 16 to 19 Years | 6,009 (34.0%) | 637 (10.6%) |
| 20 to 24 Years | 15,855 (76.8%) | 1,459 (9.2%) |
| 25 to 29 Years | 17,224 (90.4%) | 1,051 (6.1%) |
| 30 to 34 Years | 17,049 (87.9%) | 699 (4.1%) |
| 35 to 44 Years | 39,961 (88.8%) | 1,519 (3.8%) |
| 45 to 54 Years | 44,954 (87.5%) | 1,798 (4.0%) |
| 55 to 59 Years | 22,758 (83.4%) | 865 (3.8%) |
| 60 to 64 Years | 17,329 (71.2%) | 866 (5.0%) |
| 65 to 74 Years | 11,201 (35.2%) | 650 (5.8%) |
| 75 Years and over | 2,336 (9.6%) | 126 (5.4%) |
| Total | 194,680 (69.3%) | 9,734 (5.0%) |
Employment Status by Educational Attainment in Somerset County
According to labor force statistics for Somerset County, 85.4% of individuals (159,230) out of the total population between 25 and 64 years of age (186,452) are in the labor force, with 4.3% or 6,847 of them being unemployed. The group with the highest labor force participation rate are those with the educational attainment of bachelor's degree or higher, with 88.0% or 100,466 individuals in the labor force. Within the labor force, individuals with less than high school education have the highest percentage of unemployment, with 7.4% or 490 of them being unemployed.
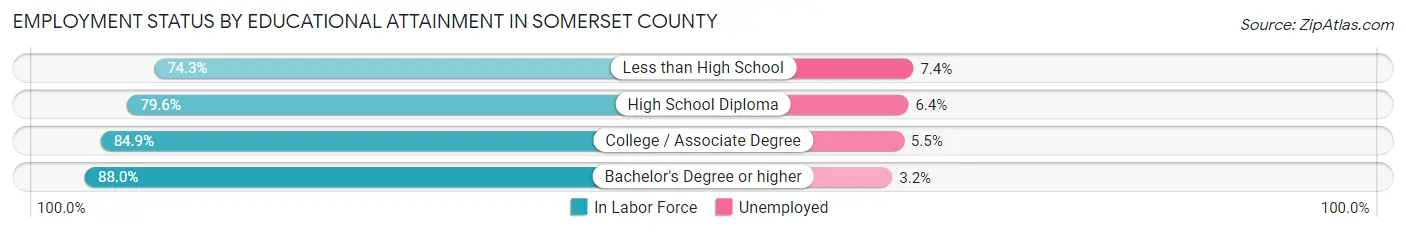
| Educational Attainment | In Labor Force | Unemployed |
| Less than High School | 6,620 (74.3%) | 659 (7.4%) |
| High School Diploma | 22,785 (79.6%) | 1,832 (6.4%) |
| College / Associate Degree | 29,504 (84.9%) | 1,911 (5.5%) |
| Bachelor's Degree or higher | 100,466 (88.0%) | 3,653 (3.2%) |
| Total | 159,230 (85.4%) | 8,017 (4.3%) |
Employment Occupations by Sex in Somerset County
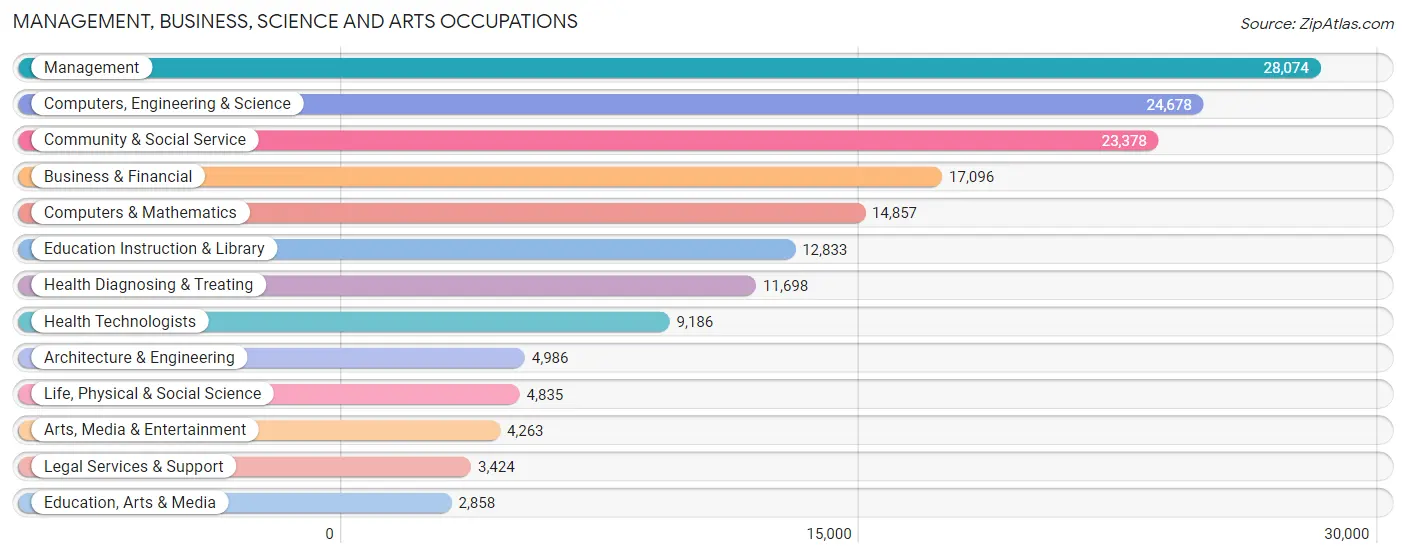
Management, Business, Science and Arts Occupations
The most common Management, Business, Science and Arts occupations in Somerset County are Management (28,074 | 15.2%), Computers, Engineering & Science (24,678 | 13.4%), Community & Social Service (23,378 | 12.6%), Business & Financial (17,096 | 9.2%), and Computers & Mathematics (14,857 | 8.0%).
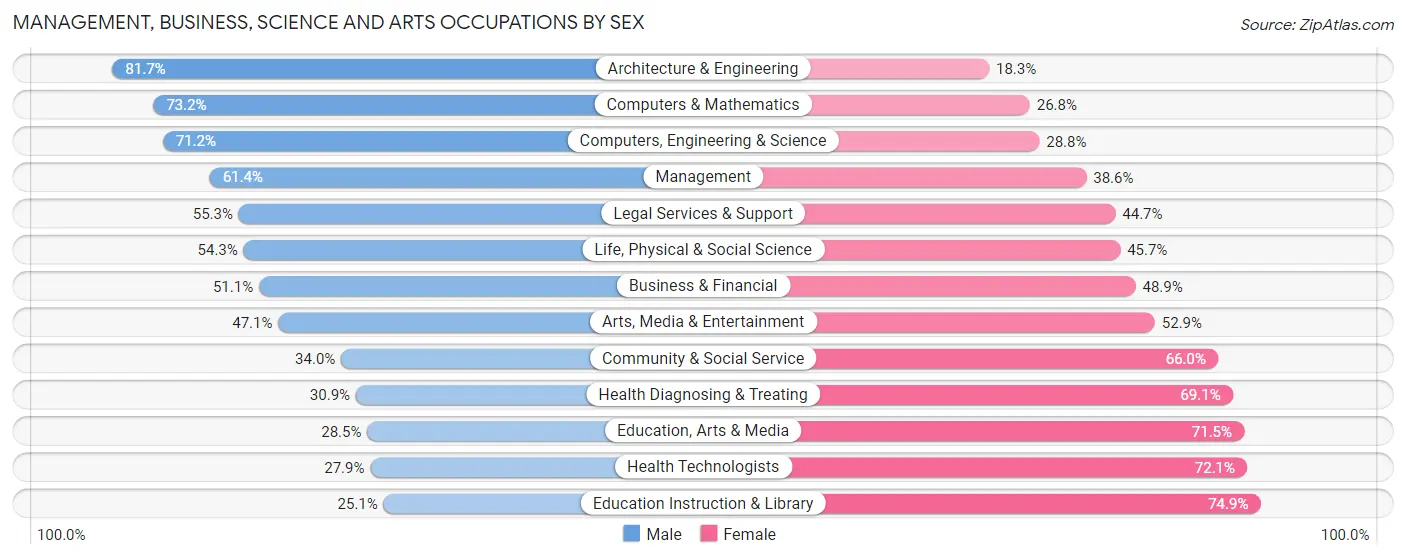
Management, Business, Science and Arts Occupations by Sex
Within the Management, Business, Science and Arts occupations in Somerset County, the most male-oriented occupations are Architecture & Engineering (81.7%), Computers & Mathematics (73.2%), and Computers, Engineering & Science (71.2%), while the most female-oriented occupations are Education Instruction & Library (74.9%), Health Technologists (72.1%), and Education, Arts & Media (71.5%).
| Occupation | Male | Female |
| Management | 17,232 (61.4%) | 10,842 (38.6%) |
| Business & Financial | 8,738 (51.1%) | 8,358 (48.9%) |
| Computers, Engineering & Science | 17,568 (71.2%) | 7,110 (28.8%) |
| Computers & Mathematics | 10,870 (73.2%) | 3,987 (26.8%) |
| Architecture & Engineering | 4,072 (81.7%) | 914 (18.3%) |
| Life, Physical & Social Science | 2,626 (54.3%) | 2,209 (45.7%) |
| Community & Social Service | 7,939 (34.0%) | 15,439 (66.0%) |
| Education, Arts & Media | 815 (28.5%) | 2,043 (71.5%) |
| Legal Services & Support | 1,894 (55.3%) | 1,530 (44.7%) |
| Education Instruction & Library | 3,223 (25.1%) | 9,610 (74.9%) |
| Arts, Media & Entertainment | 2,007 (47.1%) | 2,256 (52.9%) |
| Health Diagnosing & Treating | 3,613 (30.9%) | 8,085 (69.1%) |
| Health Technologists | 2,562 (27.9%) | 6,624 (72.1%) |
| Total (Category) | 55,090 (52.5%) | 49,834 (47.5%) |
| Total (Overall) | 98,726 (53.4%) | 86,160 (46.6%) |
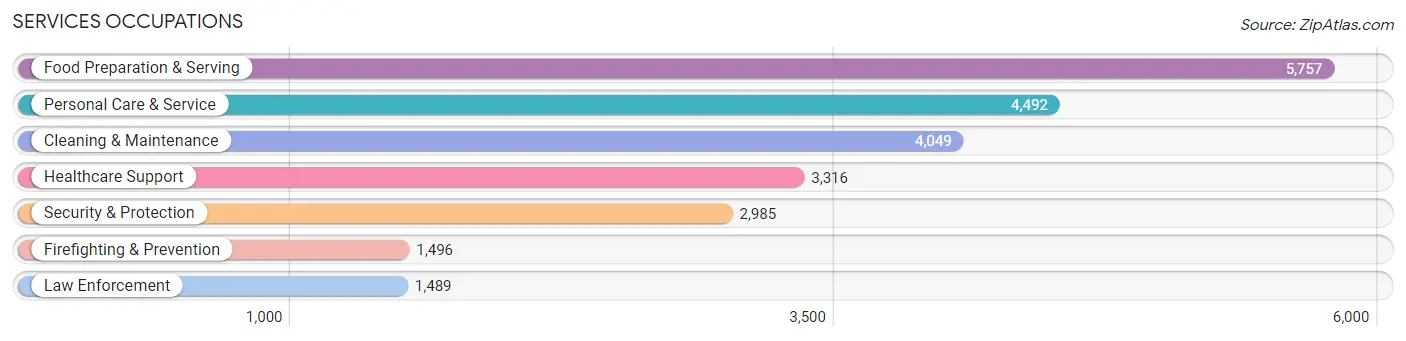
Services Occupations
The most common Services occupations in Somerset County are Food Preparation & Serving (5,757 | 3.1%), Personal Care & Service (4,492 | 2.4%), Cleaning & Maintenance (4,049 | 2.2%), Healthcare Support (3,316 | 1.8%), and Security & Protection (2,985 | 1.6%).
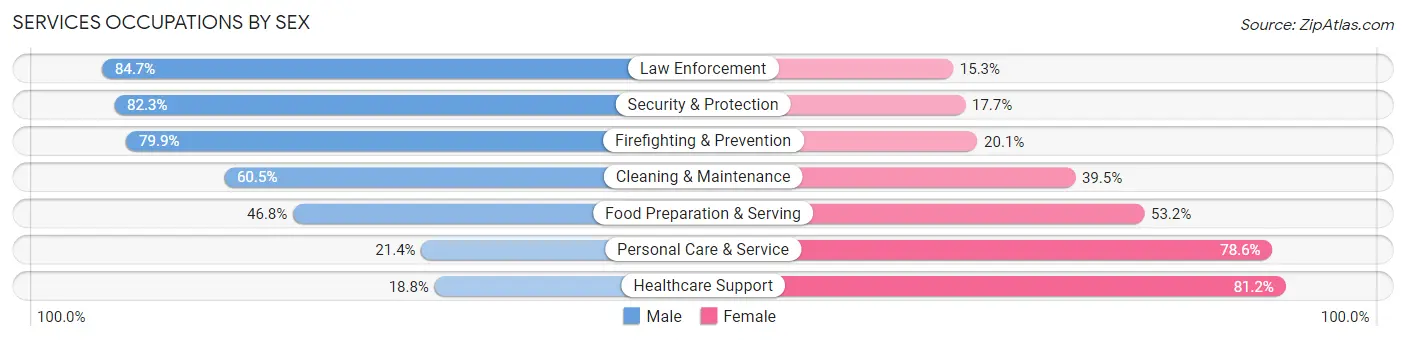
Services Occupations by Sex
Within the Services occupations in Somerset County, the most male-oriented occupations are Law Enforcement (84.7%), Security & Protection (82.3%), and Firefighting & Prevention (79.9%), while the most female-oriented occupations are Healthcare Support (81.2%), Personal Care & Service (78.6%), and Food Preparation & Serving (53.2%).
| Occupation | Male | Female |
| Healthcare Support | 623 (18.8%) | 2,693 (81.2%) |
| Security & Protection | 2,456 (82.3%) | 529 (17.7%) |
| Firefighting & Prevention | 1,195 (79.9%) | 301 (20.1%) |
| Law Enforcement | 1,261 (84.7%) | 228 (15.3%) |
| Food Preparation & Serving | 2,696 (46.8%) | 3,061 (53.2%) |
| Cleaning & Maintenance | 2,450 (60.5%) | 1,599 (39.5%) |
| Personal Care & Service | 962 (21.4%) | 3,530 (78.6%) |
| Total (Category) | 9,187 (44.6%) | 11,412 (55.4%) |
| Total (Overall) | 98,726 (53.4%) | 86,160 (46.6%) |
Sales and Office Occupations
The most common Sales and Office occupations in Somerset County are Sales & Related (17,366 | 9.4%), and Office & Administration (16,603 | 9.0%).

Sales and Office Occupations by Sex
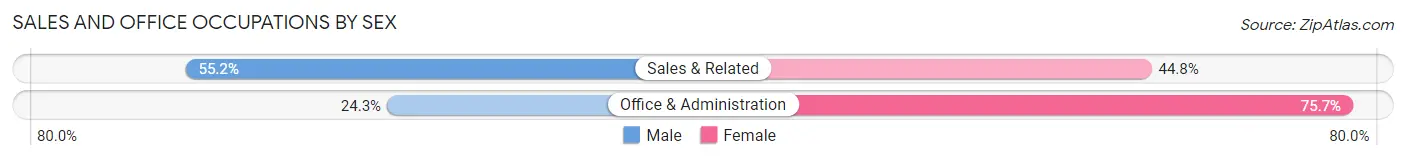
| Occupation | Male | Female |
| Sales & Related | 9,591 (55.2%) | 7,775 (44.8%) |
| Office & Administration | 4,028 (24.3%) | 12,575 (75.7%) |
| Total (Category) | 13,619 (40.1%) | 20,350 (59.9%) |
| Total (Overall) | 98,726 (53.4%) | 86,160 (46.6%) |
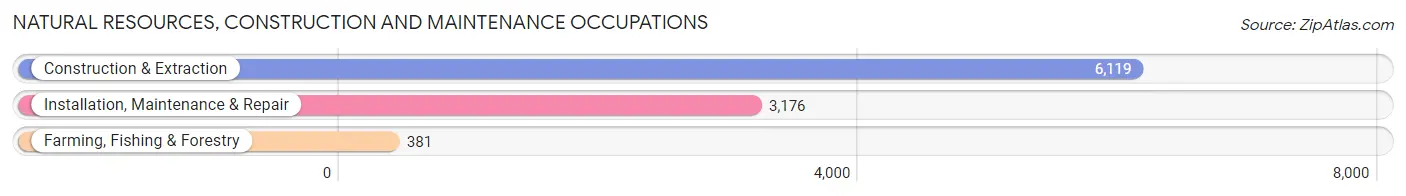
Natural Resources, Construction and Maintenance Occupations
The most common Natural Resources, Construction and Maintenance occupations in Somerset County are Construction & Extraction (6,119 | 3.3%), Installation, Maintenance & Repair (3,176 | 1.7%), and Farming, Fishing & Forestry (381 | 0.2%).
Natural Resources, Construction and Maintenance Occupations by Sex
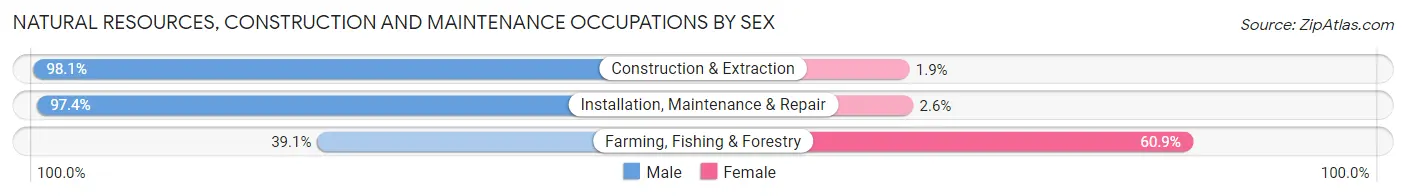
| Occupation | Male | Female |
| Farming, Fishing & Forestry | 149 (39.1%) | 232 (60.9%) |
| Construction & Extraction | 6,005 (98.1%) | 114 (1.9%) |
| Installation, Maintenance & Repair | 3,092 (97.4%) | 84 (2.6%) |
| Total (Category) | 9,246 (95.6%) | 430 (4.4%) |
| Total (Overall) | 98,726 (53.4%) | 86,160 (46.6%) |
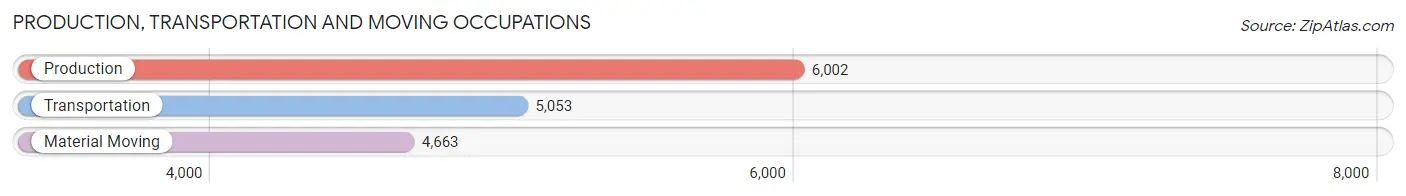
Production, Transportation and Moving Occupations
The most common Production, Transportation and Moving occupations in Somerset County are Production (6,002 | 3.3%), Transportation (5,053 | 2.7%), and Material Moving (4,663 | 2.5%).
Production, Transportation and Moving Occupations by Sex
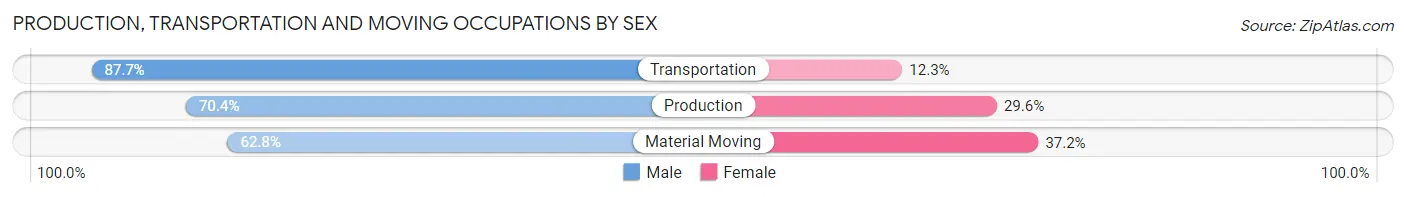
| Occupation | Male | Female |
| Production | 4,224 (70.4%) | 1,778 (29.6%) |
| Transportation | 4,433 (87.7%) | 620 (12.3%) |
| Material Moving | 2,927 (62.8%) | 1,736 (37.2%) |
| Total (Category) | 11,584 (73.7%) | 4,134 (26.3%) |
| Total (Overall) | 98,726 (53.4%) | 86,160 (46.6%) |
Employment Industries by Sex in Somerset County
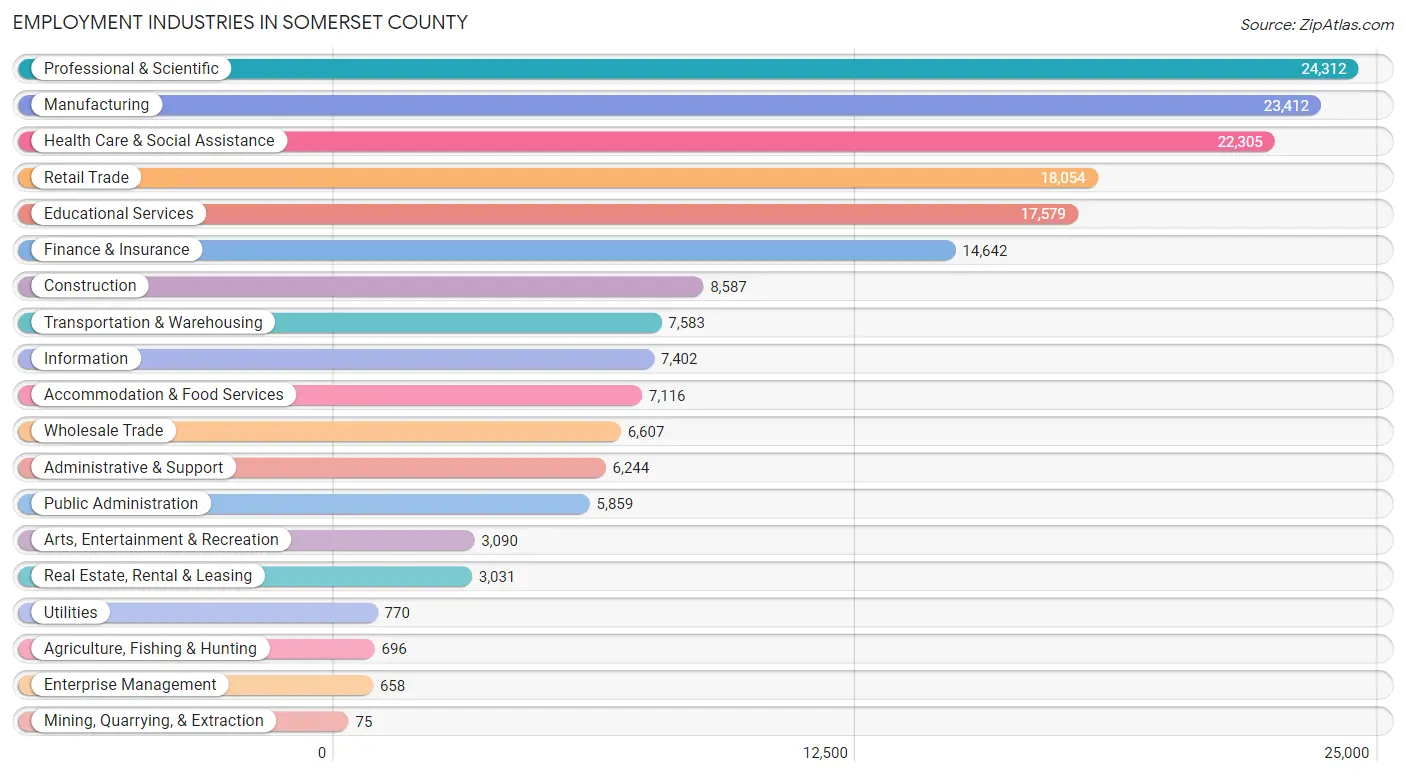
Employment Industries in Somerset County
The major employment industries in Somerset County include Professional & Scientific (24,312 | 13.2%), Manufacturing (23,412 | 12.7%), Health Care & Social Assistance (22,305 | 12.1%), Retail Trade (18,054 | 9.8%), and Educational Services (17,579 | 9.5%).
Employment Industries by Sex in Somerset County
The Somerset County industries that see more men than women are Construction (89.8%), Mining, Quarrying, & Extraction (81.3%), and Utilities (78.6%), whereas the industries that tend to have a higher number of women are Health Care & Social Assistance (74.8%), Educational Services (68.3%), and Enterprise Management (54.6%).
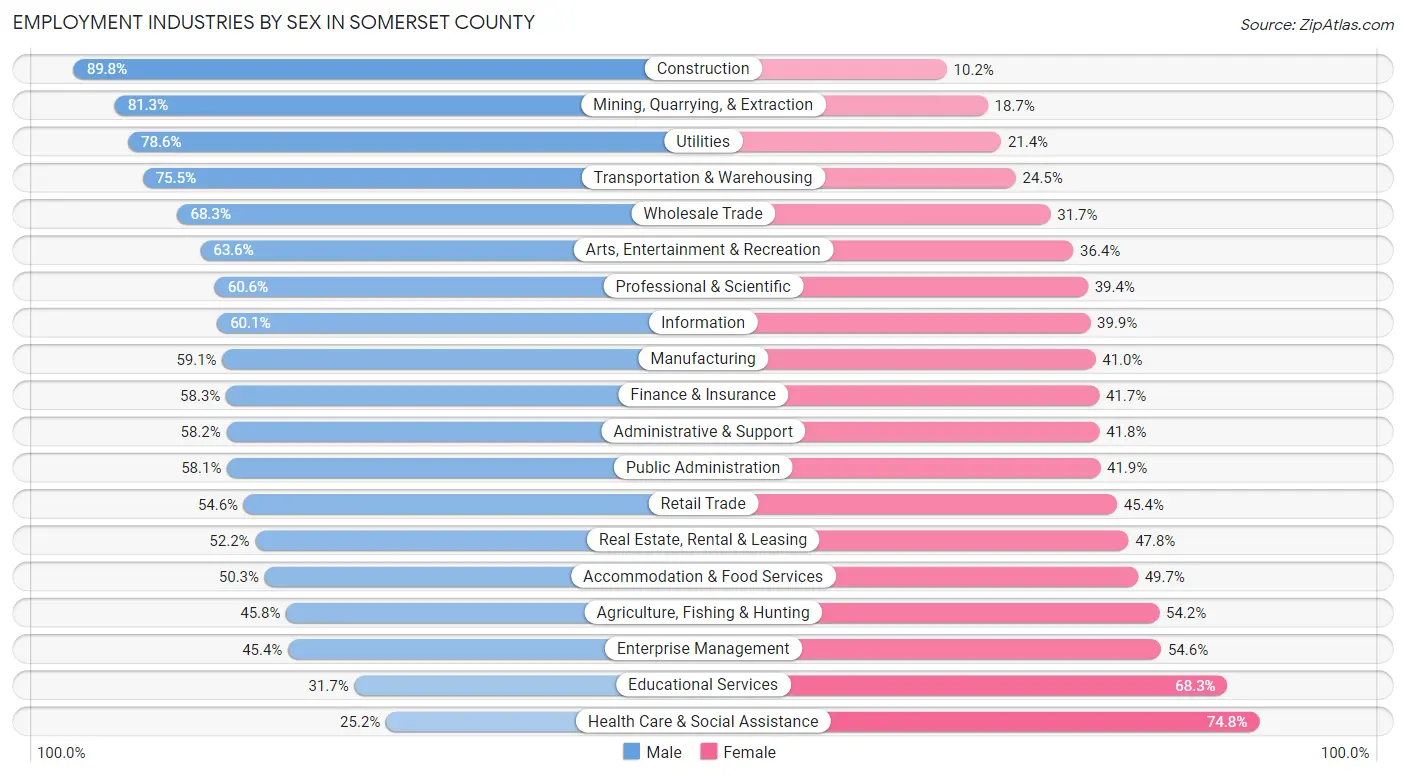
| Industry | Male | Female |
| Agriculture, Fishing & Hunting | 319 (45.8%) | 377 (54.2%) |
| Mining, Quarrying, & Extraction | 61 (81.3%) | 14 (18.7%) |
| Construction | 7,712 (89.8%) | 875 (10.2%) |
| Manufacturing | 13,825 (59.1%) | 9,587 (40.9%) |
| Wholesale Trade | 4,515 (68.3%) | 2,092 (31.7%) |
| Retail Trade | 9,857 (54.6%) | 8,197 (45.4%) |
| Transportation & Warehousing | 5,728 (75.5%) | 1,855 (24.5%) |
| Utilities | 605 (78.6%) | 165 (21.4%) |
| Information | 4,450 (60.1%) | 2,952 (39.9%) |
| Finance & Insurance | 8,533 (58.3%) | 6,109 (41.7%) |
| Real Estate, Rental & Leasing | 1,583 (52.2%) | 1,448 (47.8%) |
| Professional & Scientific | 14,738 (60.6%) | 9,574 (39.4%) |
| Enterprise Management | 299 (45.4%) | 359 (54.6%) |
| Administrative & Support | 3,634 (58.2%) | 2,610 (41.8%) |
| Educational Services | 5,573 (31.7%) | 12,006 (68.3%) |
| Health Care & Social Assistance | 5,612 (25.2%) | 16,693 (74.8%) |
| Arts, Entertainment & Recreation | 1,966 (63.6%) | 1,124 (36.4%) |
| Accommodation & Food Services | 3,577 (50.3%) | 3,539 (49.7%) |
| Public Administration | 3,402 (58.1%) | 2,457 (41.9%) |
| Total | 98,726 (53.4%) | 86,160 (46.6%) |
Education in Somerset County
School Enrollment in Somerset County
The most common levels of schooling among the 83,757 students in Somerset County are high school (20,486 | 24.5%), middle school (17,601 | 21.0%), and elementary school (15,767 | 18.8%).
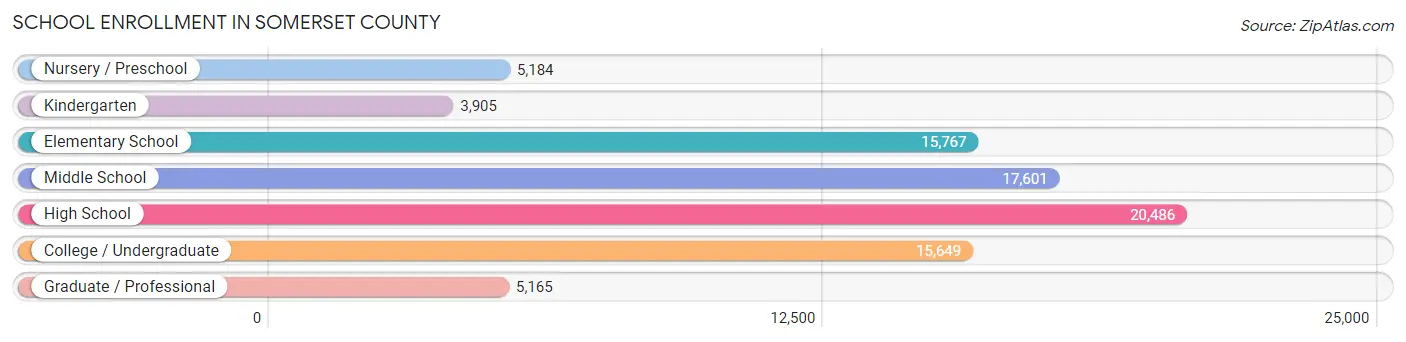
| School Level | # Students | % Students |
| Nursery / Preschool | 5,184 | 6.2% |
| Kindergarten | 3,905 | 4.7% |
| Elementary School | 15,767 | 18.8% |
| Middle School | 17,601 | 21.0% |
| High School | 20,486 | 24.5% |
| College / Undergraduate | 15,649 | 18.7% |
| Graduate / Professional | 5,165 | 6.2% |
| Total | 83,757 | 100.0% |
School Enrollment by Age by Funding Source in Somerset County
Out of a total of 83,757 students who are enrolled in schools in Somerset County, 15,830 (18.9%) attend a private institution, while the remaining 67,927 (81.1%) are enrolled in public schools. The age group of 3 to 4 year olds has the highest likelihood of being enrolled in private schools, with 2,257 (52.3% in the age bracket) enrolled. Conversely, the age group of 10 to 14 year olds has the lowest likelihood of being enrolled in a private school, with 20,369 (90.8% in the age bracket) attending a public institution.
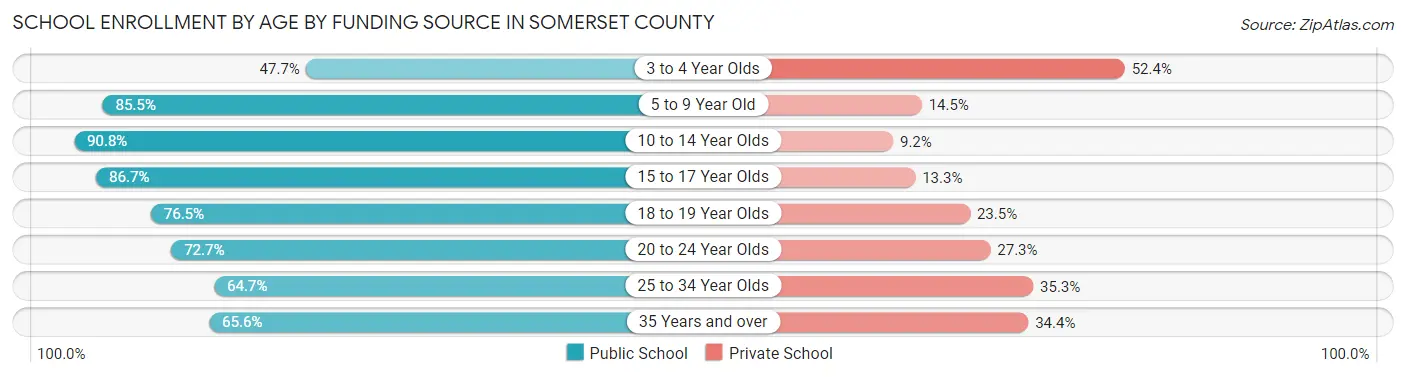
| Age Bracket | Public School | Private School |
| 3 to 4 Year Olds | 2,054 (47.6%) | 2,257 (52.3%) |
| 5 to 9 Year Old | 15,727 (85.5%) | 2,674 (14.5%) |
| 10 to 14 Year Olds | 20,369 (90.8%) | 2,065 (9.2%) |
| 15 to 17 Year Olds | 12,485 (86.7%) | 1,921 (13.3%) |
| 18 to 19 Year Olds | 5,146 (76.5%) | 1,583 (23.5%) |
| 20 to 24 Year Olds | 7,104 (72.7%) | 2,670 (27.3%) |
| 25 to 34 Year Olds | 2,778 (64.7%) | 1,515 (35.3%) |
| 35 Years and over | 2,237 (65.6%) | 1,172 (34.4%) |
| Total | 67,927 (81.1%) | 15,830 (18.9%) |
Educational Attainment by Field of Study in Somerset County
Business (30,205 | 20.3%), engineering (17,382 | 11.7%), computers & mathematics (12,688 | 8.5%), science & technology (12,678 | 8.5%), and social sciences (12,130 | 8.1%) are the most common fields of study among 148,955 individuals in Somerset County who have obtained a bachelor's degree or higher.
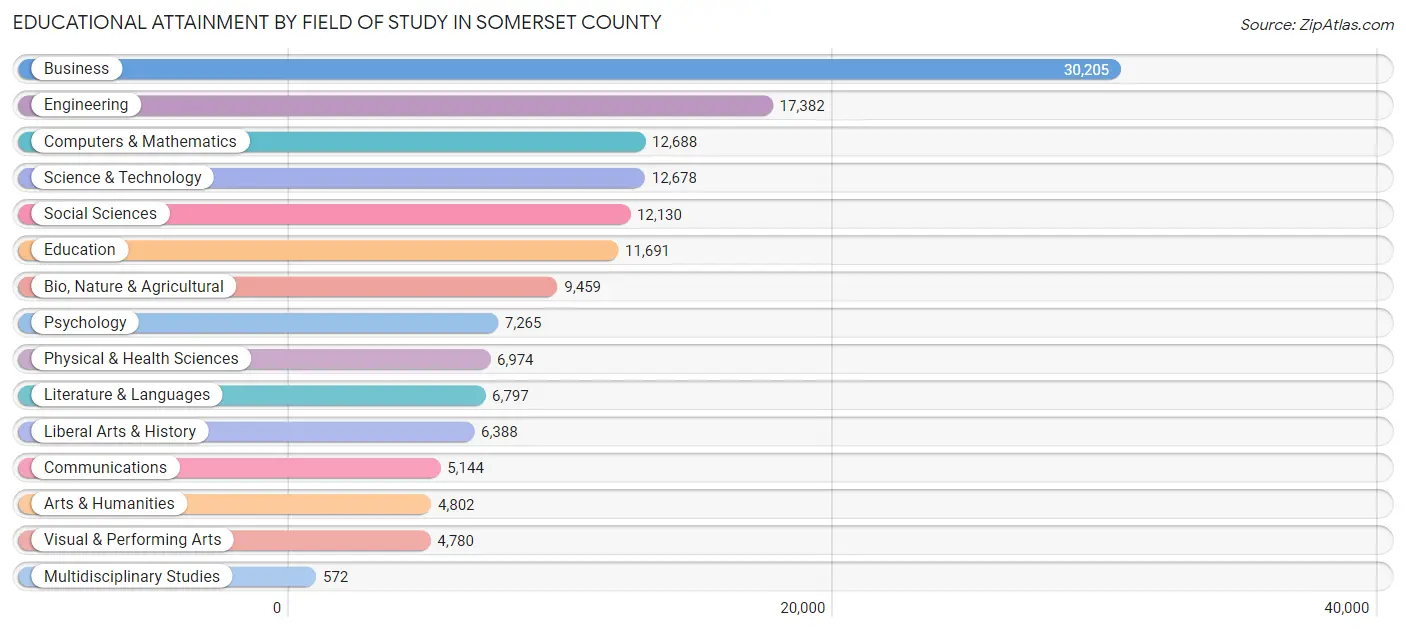
| Field of Study | # Graduates | % Graduates |
| Computers & Mathematics | 12,688 | 8.5% |
| Bio, Nature & Agricultural | 9,459 | 6.4% |
| Physical & Health Sciences | 6,974 | 4.7% |
| Psychology | 7,265 | 4.9% |
| Social Sciences | 12,130 | 8.1% |
| Engineering | 17,382 | 11.7% |
| Multidisciplinary Studies | 572 | 0.4% |
| Science & Technology | 12,678 | 8.5% |
| Business | 30,205 | 20.3% |
| Education | 11,691 | 7.9% |
| Literature & Languages | 6,797 | 4.6% |
| Liberal Arts & History | 6,388 | 4.3% |
| Visual & Performing Arts | 4,780 | 3.2% |
| Communications | 5,144 | 3.5% |
| Arts & Humanities | 4,802 | 3.2% |
| Total | 148,955 | 100.0% |
Transportation & Commute in Somerset County
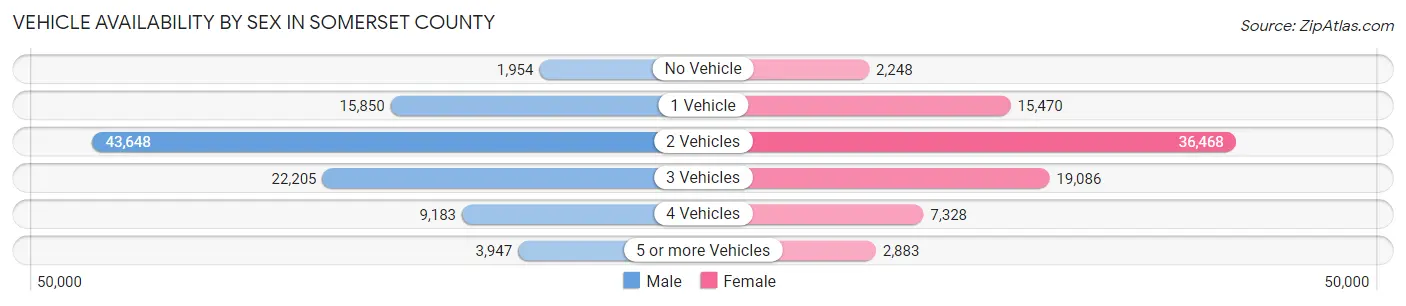
Vehicle Availability by Sex in Somerset County
The most prevalent vehicle ownership categories in Somerset County are males with 2 vehicles (43,648, accounting for 45.1%) and females with 2 vehicles (36,468, making up 52.3%).
| Vehicles Available | Male | Female |
| No Vehicle | 1,954 (2.0%) | 2,248 (2.7%) |
| 1 Vehicle | 15,850 (16.4%) | 15,470 (18.5%) |
| 2 Vehicles | 43,648 (45.1%) | 36,468 (43.7%) |
| 3 Vehicles | 22,205 (22.9%) | 19,086 (22.9%) |
| 4 Vehicles | 9,183 (9.5%) | 7,328 (8.8%) |
| 5 or more Vehicles | 3,947 (4.1%) | 2,883 (3.5%) |
| Total | 96,787 (100.0%) | 83,483 (100.0%) |
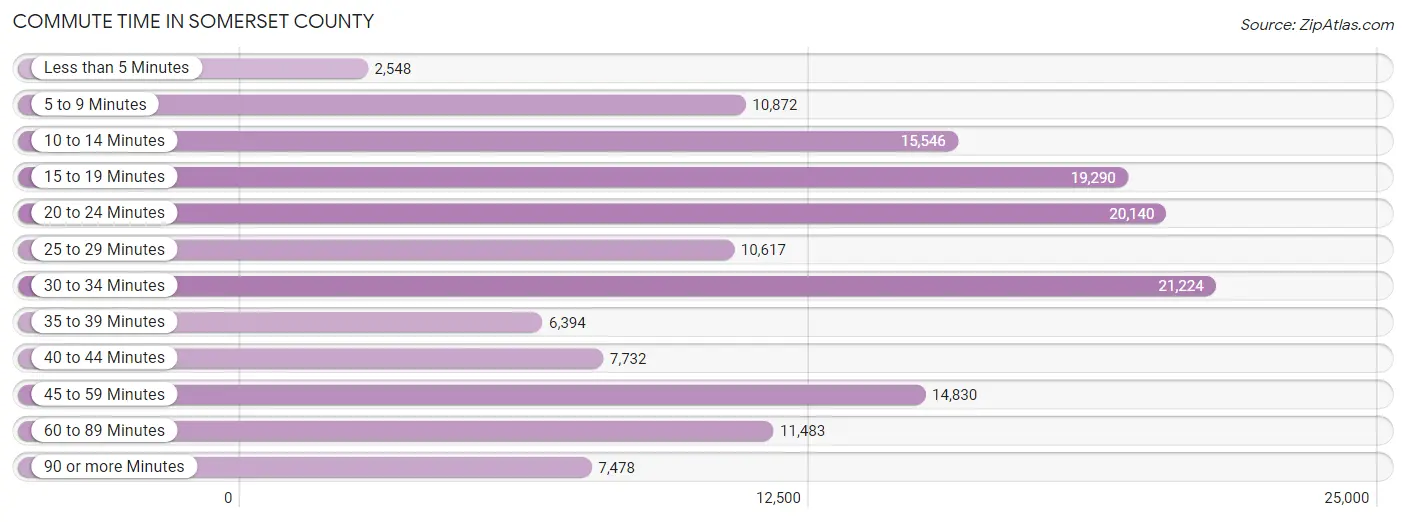
Commute Time in Somerset County
The most frequently occuring commute durations in Somerset County are 30 to 34 minutes (21,224 commuters, 14.3%), 20 to 24 minutes (20,140 commuters, 13.6%), and 15 to 19 minutes (19,290 commuters, 13.0%).
| Commute Time | # Commuters | % Commuters |
| Less than 5 Minutes | 2,548 | 1.7% |
| 5 to 9 Minutes | 10,872 | 7.3% |
| 10 to 14 Minutes | 15,546 | 10.5% |
| 15 to 19 Minutes | 19,290 | 13.0% |
| 20 to 24 Minutes | 20,140 | 13.6% |
| 25 to 29 Minutes | 10,617 | 7.2% |
| 30 to 34 Minutes | 21,224 | 14.3% |
| 35 to 39 Minutes | 6,394 | 4.3% |
| 40 to 44 Minutes | 7,732 | 5.2% |
| 45 to 59 Minutes | 14,830 | 10.0% |
| 60 to 89 Minutes | 11,483 | 7.7% |
| 90 or more Minutes | 7,478 | 5.1% |
Commute Time by Sex in Somerset County
The most common commute times in Somerset County are 30 to 34 minutes (12,114 commuters, 15.2%) for males and 20 to 24 minutes (10,081 commuters, 14.8%) for females.
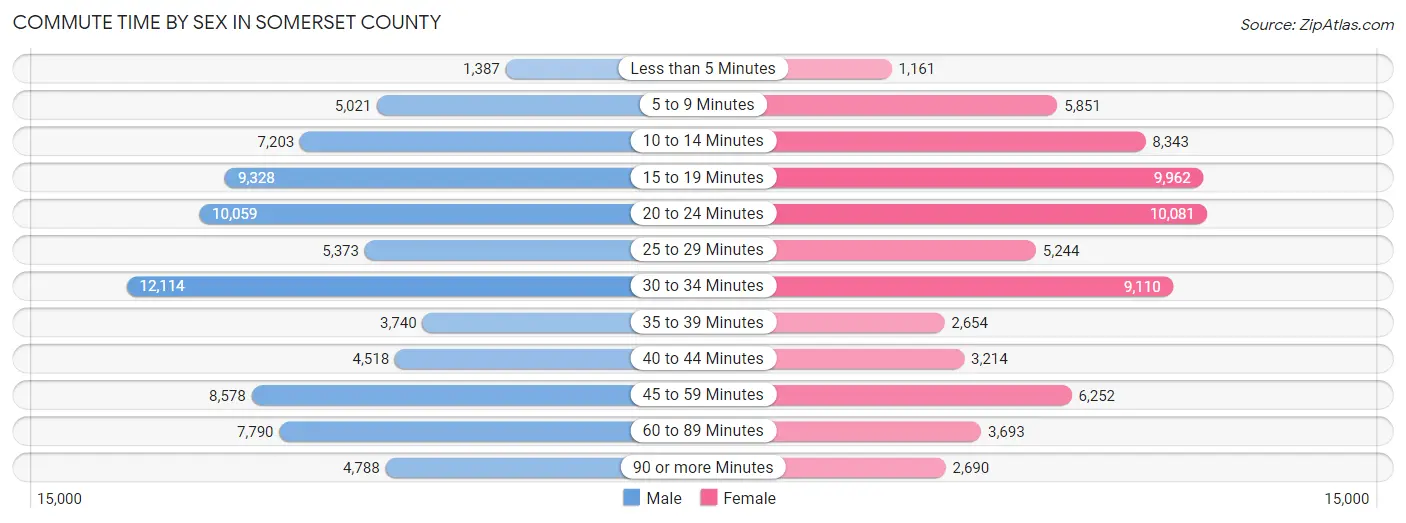
| Commute Time | Male | Female |
| Less than 5 Minutes | 1,387 (1.7%) | 1,161 (1.7%) |
| 5 to 9 Minutes | 5,021 (6.3%) | 5,851 (8.6%) |
| 10 to 14 Minutes | 7,203 (9.0%) | 8,343 (12.2%) |
| 15 to 19 Minutes | 9,328 (11.7%) | 9,962 (14.6%) |
| 20 to 24 Minutes | 10,059 (12.6%) | 10,081 (14.8%) |
| 25 to 29 Minutes | 5,373 (6.7%) | 5,244 (7.7%) |
| 30 to 34 Minutes | 12,114 (15.2%) | 9,110 (13.4%) |
| 35 to 39 Minutes | 3,740 (4.7%) | 2,654 (3.9%) |
| 40 to 44 Minutes | 4,518 (5.7%) | 3,214 (4.7%) |
| 45 to 59 Minutes | 8,578 (10.7%) | 6,252 (9.2%) |
| 60 to 89 Minutes | 7,790 (9.8%) | 3,693 (5.4%) |
| 90 or more Minutes | 4,788 (6.0%) | 2,690 (3.9%) |
Time of Departure to Work by Sex in Somerset County
The most frequent times of departure to work in Somerset County are 7:00 AM to 7:29 AM (12,142, 15.2%) for males and 8:00 AM to 8:29 AM (11,671, 17.1%) for females.
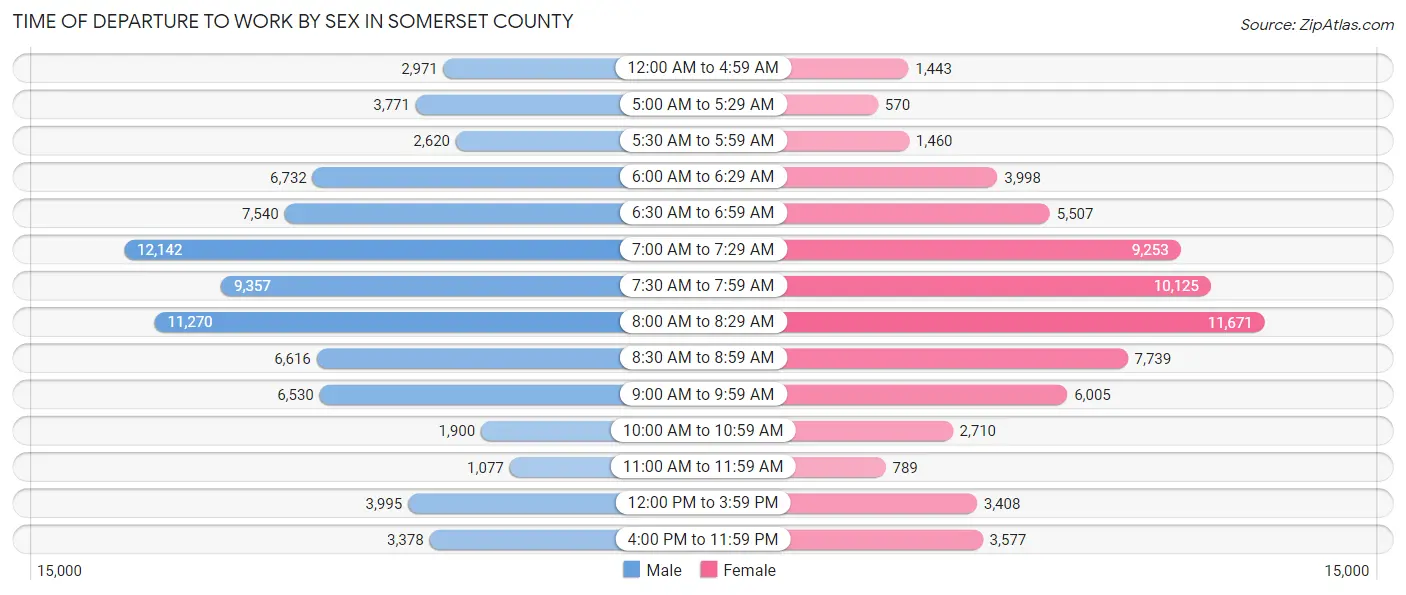
| Time of Departure | Male | Female |
| 12:00 AM to 4:59 AM | 2,971 (3.7%) | 1,443 (2.1%) |
| 5:00 AM to 5:29 AM | 3,771 (4.7%) | 570 (0.8%) |
| 5:30 AM to 5:59 AM | 2,620 (3.3%) | 1,460 (2.1%) |
| 6:00 AM to 6:29 AM | 6,732 (8.4%) | 3,998 (5.9%) |
| 6:30 AM to 6:59 AM | 7,540 (9.4%) | 5,507 (8.1%) |
| 7:00 AM to 7:29 AM | 12,142 (15.2%) | 9,253 (13.6%) |
| 7:30 AM to 7:59 AM | 9,357 (11.7%) | 10,125 (14.8%) |
| 8:00 AM to 8:29 AM | 11,270 (14.1%) | 11,671 (17.1%) |
| 8:30 AM to 8:59 AM | 6,616 (8.3%) | 7,739 (11.3%) |
| 9:00 AM to 9:59 AM | 6,530 (8.2%) | 6,005 (8.8%) |
| 10:00 AM to 10:59 AM | 1,900 (2.4%) | 2,710 (4.0%) |
| 11:00 AM to 11:59 AM | 1,077 (1.3%) | 789 (1.2%) |
| 12:00 PM to 3:59 PM | 3,995 (5.0%) | 3,408 (5.0%) |
| 4:00 PM to 11:59 PM | 3,378 (4.2%) | 3,577 (5.2%) |
| Total | 79,899 (100.0%) | 68,255 (100.0%) |
Housing Occupancy in Somerset County
Occupancy by Ownership in Somerset County
Of the total 127,566 dwellings in Somerset County, owner-occupied units account for 96,103 (75.3%), while renter-occupied units make up 31,463 (24.7%).
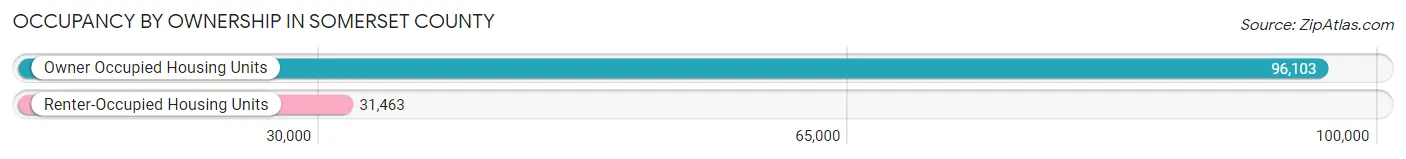
| Occupancy | # Housing Units | % Housing Units |
| Owner Occupied Housing Units | 96,103 | 75.3% |
| Renter-Occupied Housing Units | 31,463 | 24.7% |
| Total Occupied Housing Units | 127,566 | 100.0% |
Occupancy by Household Size in Somerset County
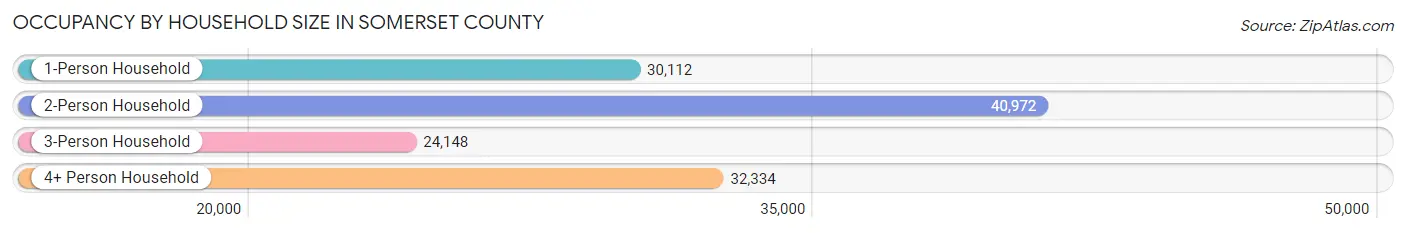
| Household Size | # Housing Units | % Housing Units |
| 1-Person Household | 30,112 | 23.6% |
| 2-Person Household | 40,972 | 32.1% |
| 3-Person Household | 24,148 | 18.9% |
| 4+ Person Household | 32,334 | 25.4% |
| Total Housing Units | 127,566 | 100.0% |
Occupancy by Ownership by Household Size in Somerset County
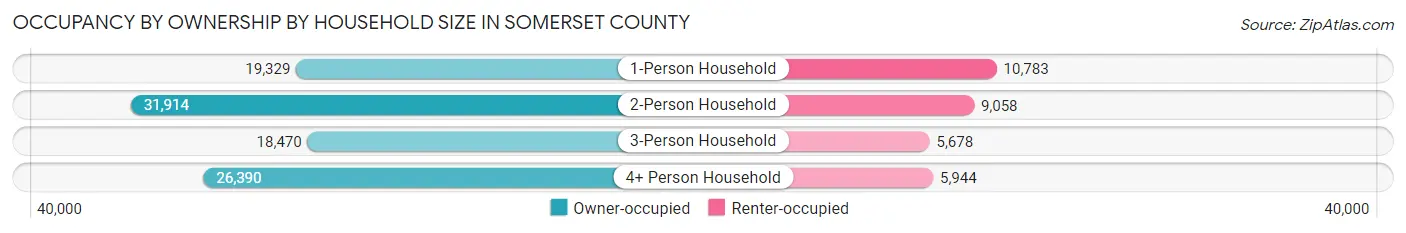
| Household Size | Owner-occupied | Renter-occupied |
| 1-Person Household | 19,329 (64.2%) | 10,783 (35.8%) |
| 2-Person Household | 31,914 (77.9%) | 9,058 (22.1%) |
| 3-Person Household | 18,470 (76.5%) | 5,678 (23.5%) |
| 4+ Person Household | 26,390 (81.6%) | 5,944 (18.4%) |
| Total Housing Units | 96,103 (75.3%) | 31,463 (24.7%) |
Occupancy by Educational Attainment in Somerset County
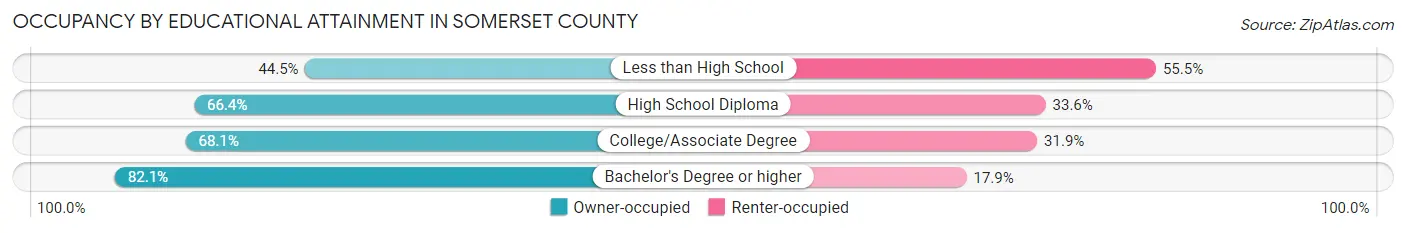
| Household Size | Owner-occupied | Renter-occupied |
| Less than High School | 2,591 (44.5%) | 3,229 (55.5%) |
| High School Diploma | 12,999 (66.4%) | 6,578 (33.6%) |
| College/Associate Degree | 16,306 (68.1%) | 7,644 (31.9%) |
| Bachelor's Degree or higher | 64,207 (82.1%) | 14,012 (17.9%) |
Occupancy by Age of Householder in Somerset County
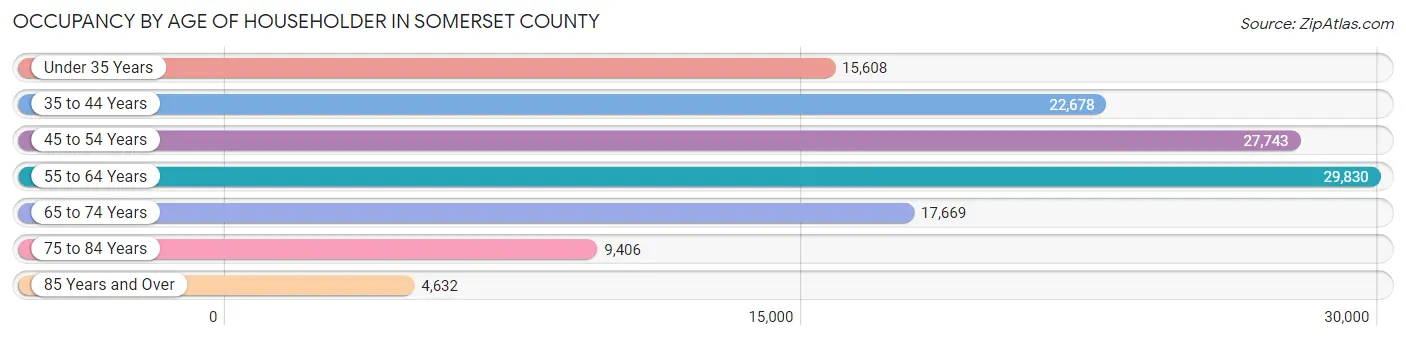
| Age Bracket | # Households | % Households |
| Under 35 Years | 15,608 | 12.2% |
| 35 to 44 Years | 22,678 | 17.8% |
| 45 to 54 Years | 27,743 | 21.7% |
| 55 to 64 Years | 29,830 | 23.4% |
| 65 to 74 Years | 17,669 | 13.9% |
| 75 to 84 Years | 9,406 | 7.4% |
| 85 Years and Over | 4,632 | 3.6% |
| Total | 127,566 | 100.0% |
Housing Finances in Somerset County
Median Income by Occupancy in Somerset County
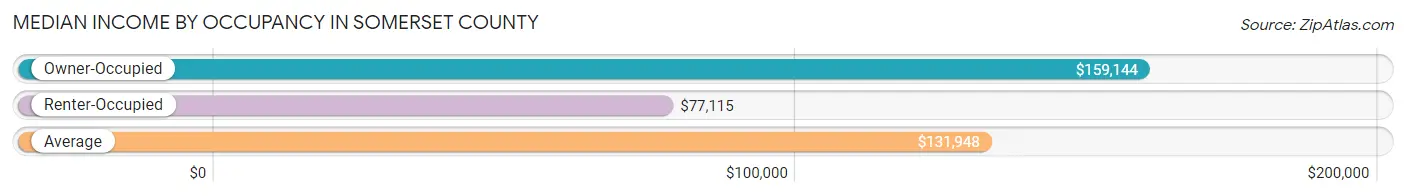
| Occupancy Type | # Households | Median Income |
| Owner-Occupied | 96,103 (75.3%) | $159,144 |
| Renter-Occupied | 31,463 (24.7%) | $77,115 |
| Average | 127,566 (100.0%) | $131,948 |
Occupancy by Householder Income Bracket in Somerset County
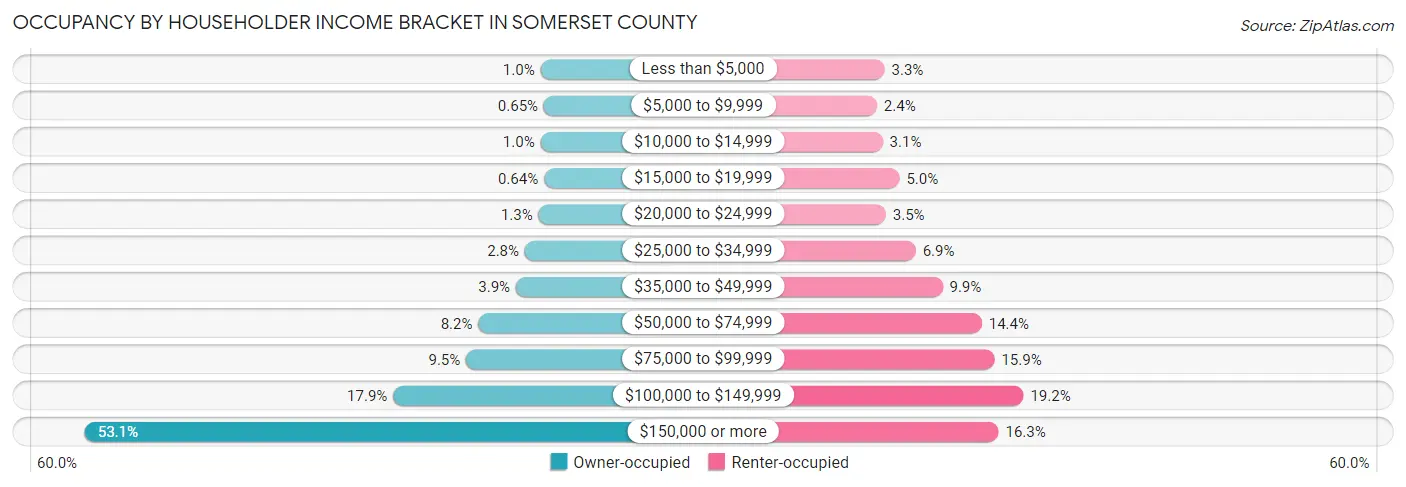
| Income Bracket | Owner-occupied | Renter-occupied |
| Less than $5,000 | 996 (1.0%) | 1,046 (3.3%) |
| $5,000 to $9,999 | 626 (0.6%) | 767 (2.4%) |
| $10,000 to $14,999 | 1,004 (1.0%) | 975 (3.1%) |
| $15,000 to $19,999 | 619 (0.6%) | 1,580 (5.0%) |
| $20,000 to $24,999 | 1,207 (1.3%) | 1,089 (3.5%) |
| $25,000 to $34,999 | 2,719 (2.8%) | 2,165 (6.9%) |
| $35,000 to $49,999 | 3,702 (3.8%) | 3,127 (9.9%) |
| $50,000 to $74,999 | 7,829 (8.2%) | 4,540 (14.4%) |
| $75,000 to $99,999 | 9,169 (9.5%) | 4,996 (15.9%) |
| $100,000 to $149,999 | 17,186 (17.9%) | 6,038 (19.2%) |
| $150,000 or more | 51,046 (53.1%) | 5,140 (16.3%) |
| Total | 96,103 (100.0%) | 31,463 (100.0%) |
Monthly Housing Cost Tiers in Somerset County
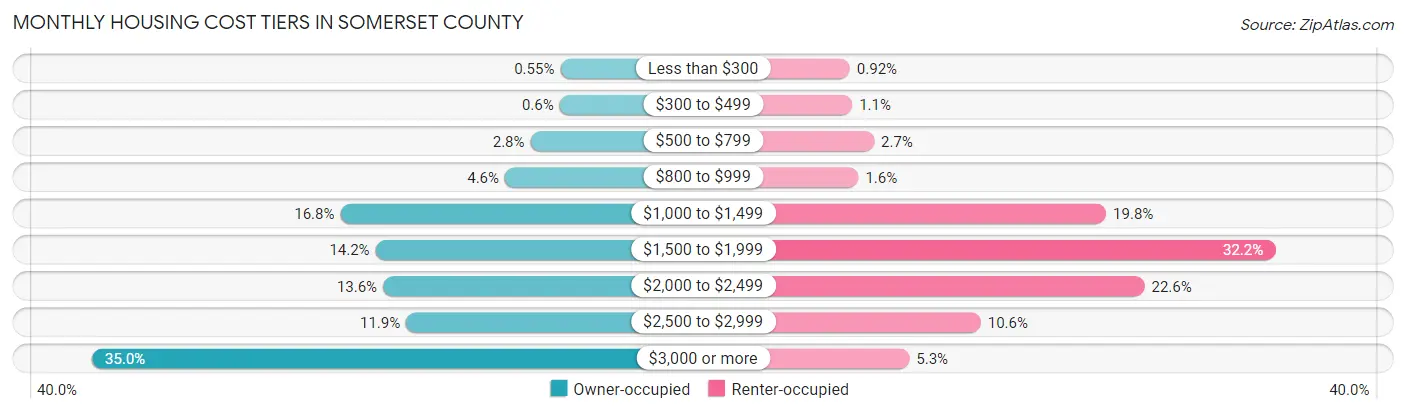
| Monthly Cost | Owner-occupied | Renter-occupied |
| Less than $300 | 531 (0.5%) | 289 (0.9%) |
| $300 to $499 | 572 (0.6%) | 344 (1.1%) |
| $500 to $799 | 2,643 (2.8%) | 848 (2.7%) |
| $800 to $999 | 4,447 (4.6%) | 489 (1.5%) |
| $1,000 to $1,499 | 16,101 (16.8%) | 6,225 (19.8%) |
| $1,500 to $1,999 | 13,607 (14.2%) | 10,140 (32.2%) |
| $2,000 to $2,499 | 13,083 (13.6%) | 7,116 (22.6%) |
| $2,500 to $2,999 | 11,449 (11.9%) | 3,323 (10.6%) |
| $3,000 or more | 33,670 (35.0%) | 1,669 (5.3%) |
| Total | 96,103 (100.0%) | 31,463 (100.0%) |
Physical Housing Characteristics in Somerset County
Housing Structures in Somerset County
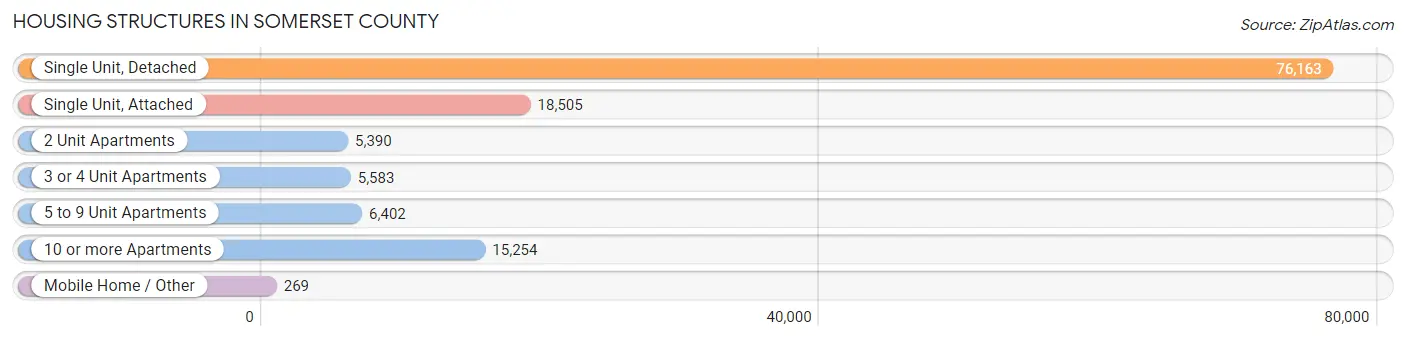
| Structure Type | # Housing Units | % Housing Units |
| Single Unit, Detached | 76,163 | 59.7% |
| Single Unit, Attached | 18,505 | 14.5% |
| 2 Unit Apartments | 5,390 | 4.2% |
| 3 or 4 Unit Apartments | 5,583 | 4.4% |
| 5 to 9 Unit Apartments | 6,402 | 5.0% |
| 10 or more Apartments | 15,254 | 12.0% |
| Mobile Home / Other | 269 | 0.2% |
| Total | 127,566 | 100.0% |
Housing Structures by Occupancy in Somerset County
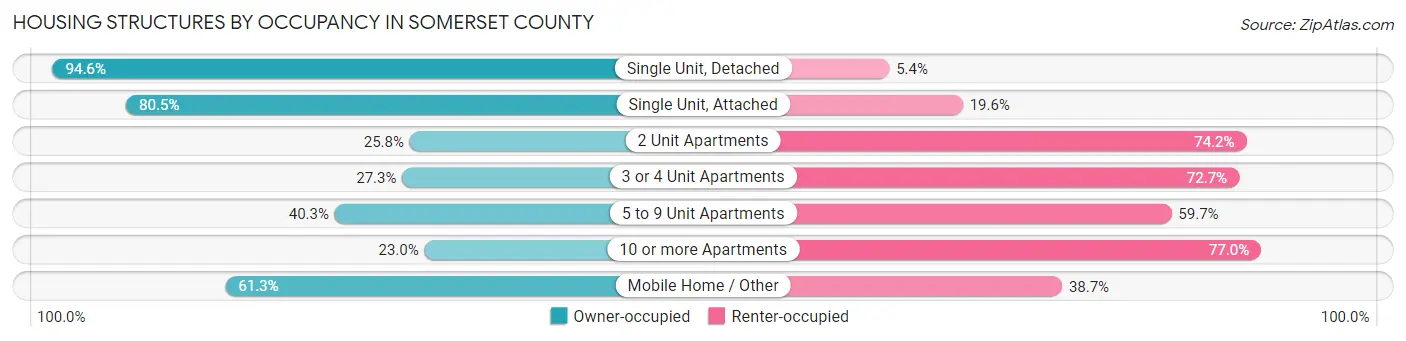
| Structure Type | Owner-occupied | Renter-occupied |
| Single Unit, Detached | 72,048 (94.6%) | 4,115 (5.4%) |
| Single Unit, Attached | 14,887 (80.4%) | 3,618 (19.6%) |
| 2 Unit Apartments | 1,393 (25.8%) | 3,997 (74.2%) |
| 3 or 4 Unit Apartments | 1,523 (27.3%) | 4,060 (72.7%) |
| 5 to 9 Unit Apartments | 2,578 (40.3%) | 3,824 (59.7%) |
| 10 or more Apartments | 3,509 (23.0%) | 11,745 (77.0%) |
| Mobile Home / Other | 165 (61.3%) | 104 (38.7%) |
| Total | 96,103 (75.3%) | 31,463 (24.7%) |
Housing Structures by Number of Rooms in Somerset County
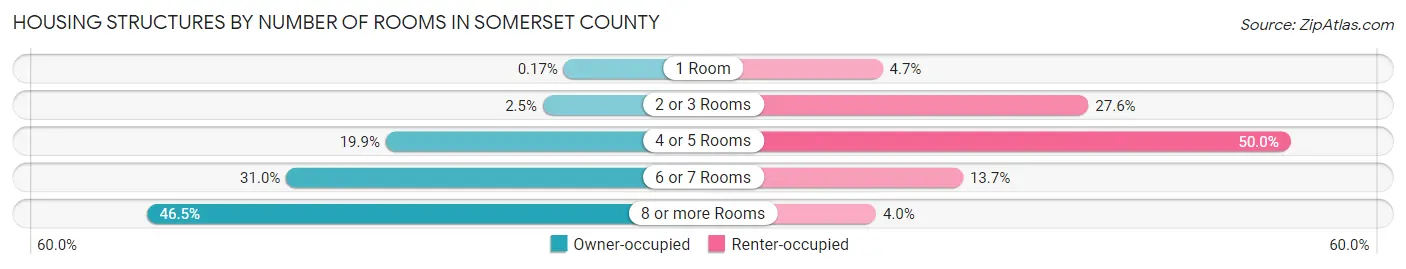
| Number of Rooms | Owner-occupied | Renter-occupied |
| 1 Room | 165 (0.2%) | 1,490 (4.7%) |
| 2 or 3 Rooms | 2,395 (2.5%) | 8,679 (27.6%) |
| 4 or 5 Rooms | 19,143 (19.9%) | 15,735 (50.0%) |
| 6 or 7 Rooms | 29,761 (31.0%) | 4,298 (13.7%) |
| 8 or more Rooms | 44,639 (46.5%) | 1,261 (4.0%) |
| Total | 96,103 (100.0%) | 31,463 (100.0%) |
Housing Structure by Heating Type in Somerset County
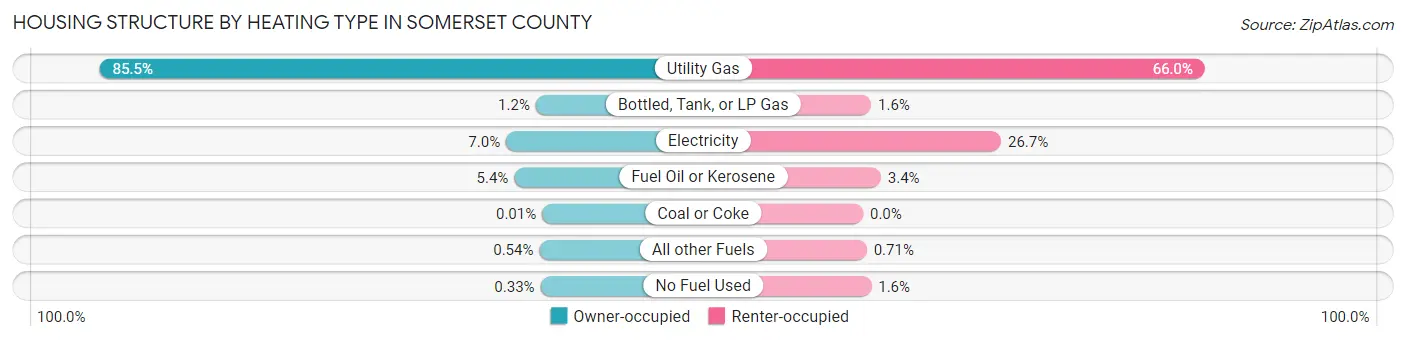
| Heating Type | Owner-occupied | Renter-occupied |
| Utility Gas | 82,182 (85.5%) | 20,777 (66.0%) |
| Bottled, Tank, or LP Gas | 1,184 (1.2%) | 489 (1.5%) |
| Electricity | 6,704 (7.0%) | 8,390 (26.7%) |
| Fuel Oil or Kerosene | 5,187 (5.4%) | 1,082 (3.4%) |
| Coal or Coke | 11 (0.0%) | 0 (0.0%) |
| All other Fuels | 518 (0.5%) | 224 (0.7%) |
| No Fuel Used | 317 (0.3%) | 501 (1.6%) |
| Total | 96,103 (100.0%) | 31,463 (100.0%) |
Household Vehicle Usage in Somerset County
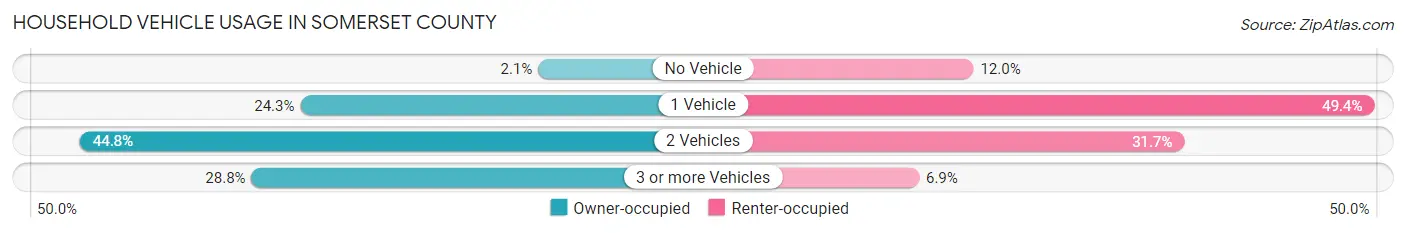
| Vehicles per Household | Owner-occupied | Renter-occupied |
| No Vehicle | 1,984 (2.1%) | 3,775 (12.0%) |
| 1 Vehicle | 23,314 (24.3%) | 15,546 (49.4%) |
| 2 Vehicles | 43,094 (44.8%) | 9,964 (31.7%) |
| 3 or more Vehicles | 27,711 (28.8%) | 2,178 (6.9%) |
| Total | 96,103 (100.0%) | 31,463 (100.0%) |
Real Estate & Mortgages in Somerset County
Real Estate and Mortgage Overview in Somerset County
| Characteristic | Without Mortgage | With Mortgage |
| Housing Units | 33,436 | 62,667 |
| Median Property Value | $481,200 | $493,800 |
| Median Household Income | $119,797 | $37,588 |
| Monthly Housing Costs | $1,323 | $32,497 |
| Real Estate Taxes | $10,001 | $434 |
Property Value by Mortgage Status in Somerset County
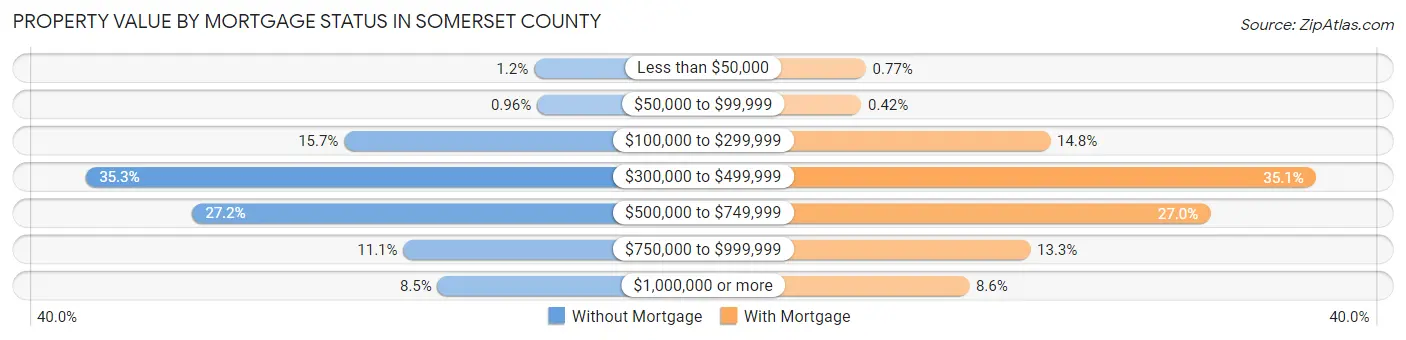
| Property Value | Without Mortgage | With Mortgage |
| Less than $50,000 | 399 (1.2%) | 485 (0.8%) |
| $50,000 to $99,999 | 321 (1.0%) | 261 (0.4%) |
| $100,000 to $299,999 | 5,233 (15.7%) | 9,287 (14.8%) |
| $300,000 to $499,999 | 11,804 (35.3%) | 21,963 (35.0%) |
| $500,000 to $749,999 | 9,100 (27.2%) | 16,925 (27.0%) |
| $750,000 to $999,999 | 3,726 (11.1%) | 8,333 (13.3%) |
| $1,000,000 or more | 2,853 (8.5%) | 5,413 (8.6%) |
| Total | 33,436 (100.0%) | 62,667 (100.0%) |
Household Income by Mortgage Status in Somerset County
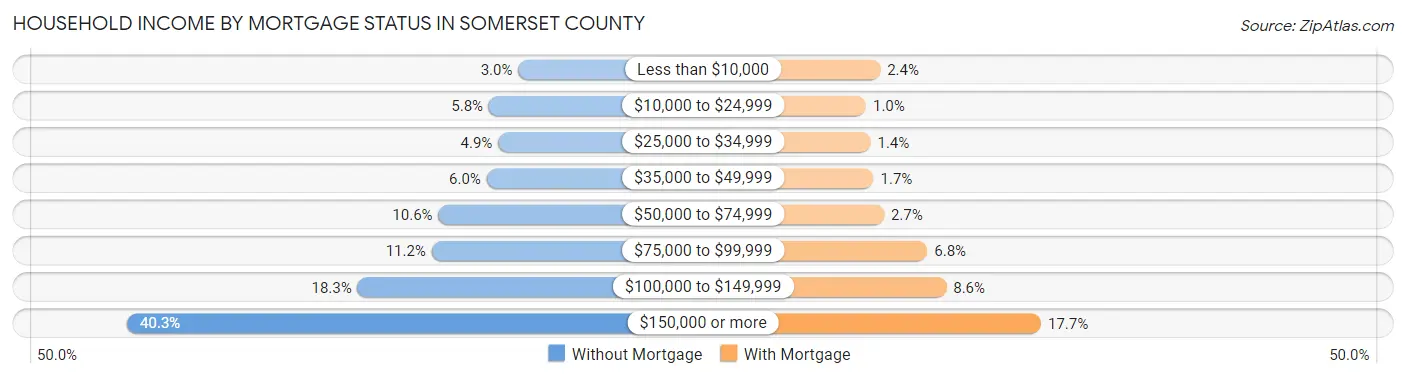
| Household Income | Without Mortgage | With Mortgage |
| Less than $10,000 | 995 (3.0%) | 1,470 (2.4%) |
| $10,000 to $24,999 | 1,931 (5.8%) | 627 (1.0%) |
| $25,000 to $34,999 | 1,639 (4.9%) | 899 (1.4%) |
| $35,000 to $49,999 | 2,003 (6.0%) | 1,080 (1.7%) |
| $50,000 to $74,999 | 3,542 (10.6%) | 1,699 (2.7%) |
| $75,000 to $99,999 | 3,754 (11.2%) | 4,287 (6.8%) |
| $100,000 to $149,999 | 6,114 (18.3%) | 5,415 (8.6%) |
| $150,000 or more | 13,458 (40.3%) | 11,072 (17.7%) |
| Total | 33,436 (100.0%) | 62,667 (100.0%) |
Property Value to Household Income Ratio in Somerset County
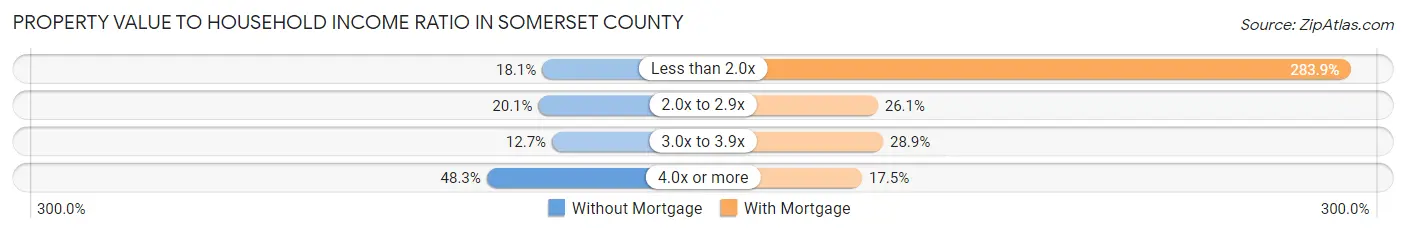
| Value-to-Income Ratio | Without Mortgage | With Mortgage |
| Less than 2.0x | 6,039 (18.1%) | 177,884 (283.9%) |
| 2.0x to 2.9x | 6,719 (20.1%) | 16,358 (26.1%) |
| 3.0x to 3.9x | 4,245 (12.7%) | 18,127 (28.9%) |
| 4.0x or more | 16,147 (48.3%) | 10,960 (17.5%) |
| Total | 33,436 (100.0%) | 62,667 (100.0%) |
Real Estate Taxes by Mortgage Status in Somerset County
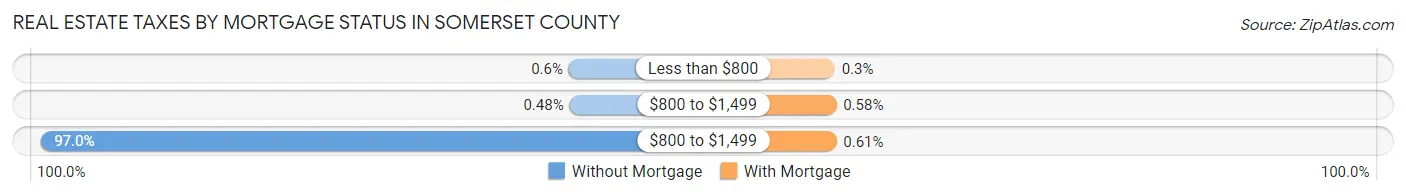
| Property Taxes | Without Mortgage | With Mortgage |
| Less than $800 | 200 (0.6%) | 186 (0.3%) |
| $800 to $1,499 | 160 (0.5%) | 361 (0.6%) |
| $800 to $1,499 | 32,419 (97.0%) | 384 (0.6%) |
| Total | 33,436 (100.0%) | 62,667 (100.0%) |
Health & Disability in Somerset County
Health Insurance Coverage by Age in Somerset County
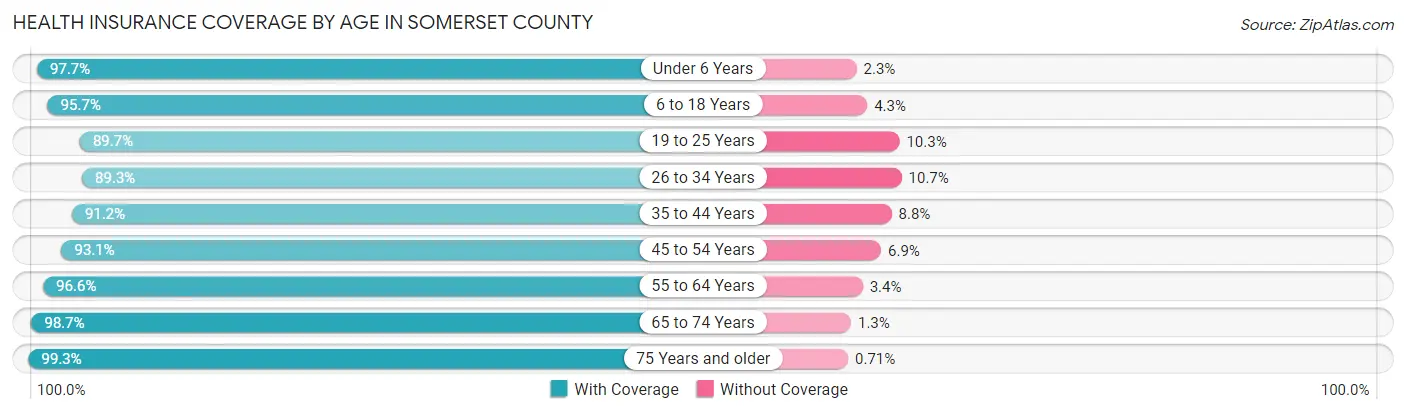
| Age Bracket | With Coverage | Without Coverage |
| Under 6 Years | 19,824 (97.7%) | 464 (2.3%) |
| 6 to 18 Years | 55,622 (95.7%) | 2,481 (4.3%) |
| 19 to 25 Years | 24,413 (89.7%) | 2,800 (10.3%) |
| 26 to 34 Years | 31,016 (89.3%) | 3,711 (10.7%) |
| 35 to 44 Years | 40,893 (91.2%) | 3,955 (8.8%) |
| 45 to 54 Years | 47,755 (93.1%) | 3,519 (6.9%) |
| 55 to 64 Years | 49,622 (96.6%) | 1,768 (3.4%) |
| 65 to 74 Years | 31,134 (98.7%) | 396 (1.3%) |
| 75 Years and older | 22,964 (99.3%) | 165 (0.7%) |
| Total | 323,243 (94.4%) | 19,259 (5.6%) |
Health Insurance Coverage by Citizenship Status in Somerset County
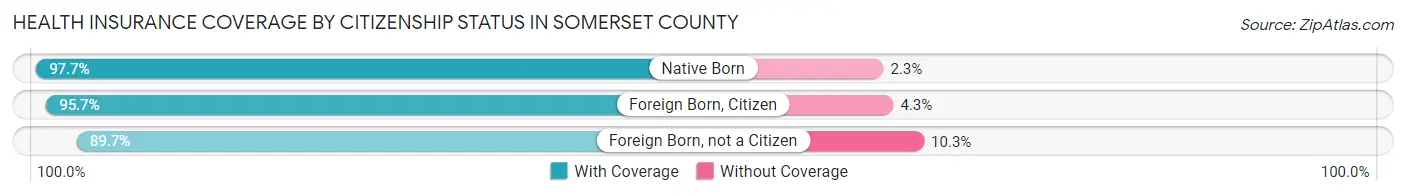
| Citizenship Status | With Coverage | Without Coverage |
| Native Born | 19,824 (97.7%) | 464 (2.3%) |
| Foreign Born, Citizen | 55,622 (95.7%) | 2,481 (4.3%) |
| Foreign Born, not a Citizen | 24,413 (89.7%) | 2,800 (10.3%) |
Health Insurance Coverage by Household Income in Somerset County
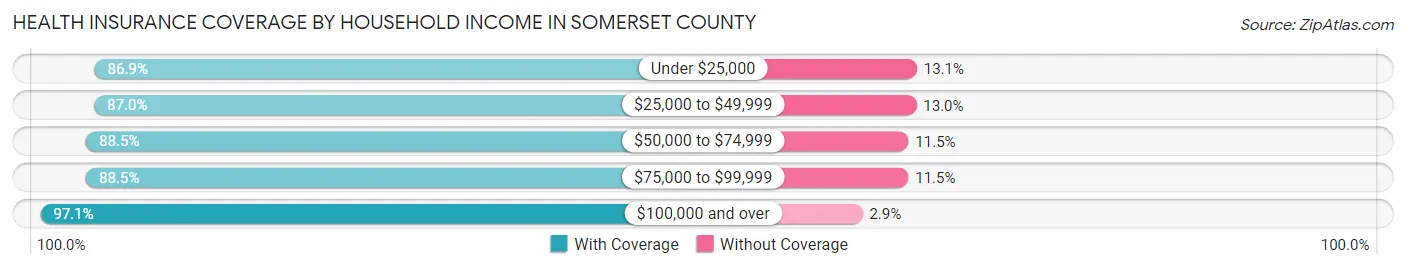
| Household Income | With Coverage | Without Coverage |
| Under $25,000 | 13,704 (86.9%) | 2,070 (13.1%) |
| $25,000 to $49,999 | 19,908 (87.0%) | 2,983 (13.0%) |
| $50,000 to $74,999 | 22,976 (88.5%) | 2,998 (11.5%) |
| $75,000 to $99,999 | 30,589 (88.5%) | 3,981 (11.5%) |
| $100,000 and over | 234,641 (97.1%) | 7,100 (2.9%) |
Public vs Private Health Insurance Coverage by Age in Somerset County
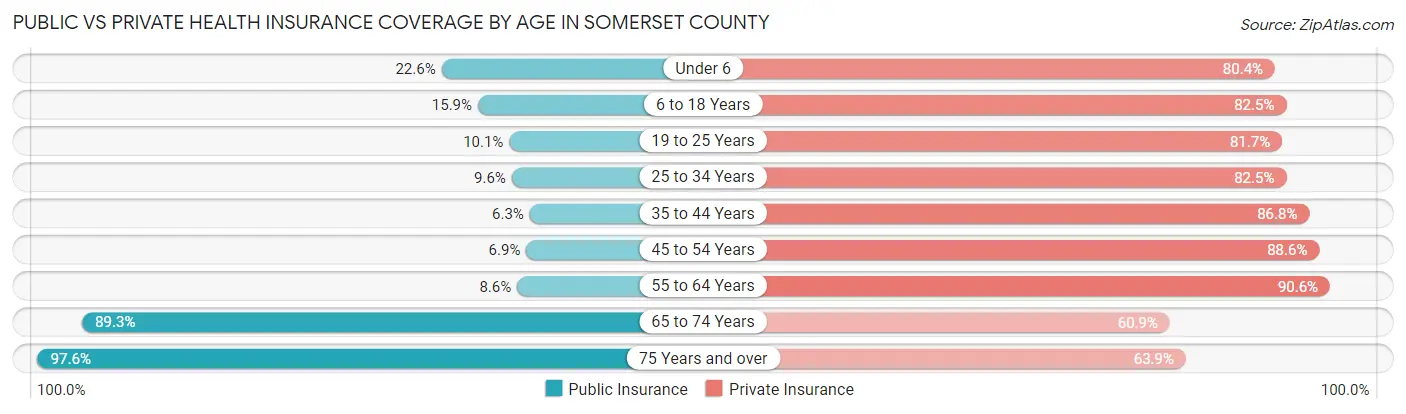
| Age Bracket | Public Insurance | Private Insurance |
| Under 6 | 4,590 (22.6%) | 16,309 (80.4%) |
| 6 to 18 Years | 9,220 (15.9%) | 47,932 (82.5%) |
| 19 to 25 Years | 2,735 (10.1%) | 22,234 (81.7%) |
| 25 to 34 Years | 3,332 (9.6%) | 28,645 (82.5%) |
| 35 to 44 Years | 2,804 (6.2%) | 38,909 (86.8%) |
| 45 to 54 Years | 3,532 (6.9%) | 45,436 (88.6%) |
| 55 to 64 Years | 4,419 (8.6%) | 46,561 (90.6%) |
| 65 to 74 Years | 28,168 (89.3%) | 19,200 (60.9%) |
| 75 Years and over | 22,567 (97.6%) | 14,767 (63.8%) |
| Total | 81,367 (23.8%) | 279,993 (81.8%) |
Disability Status by Sex by Age in Somerset County
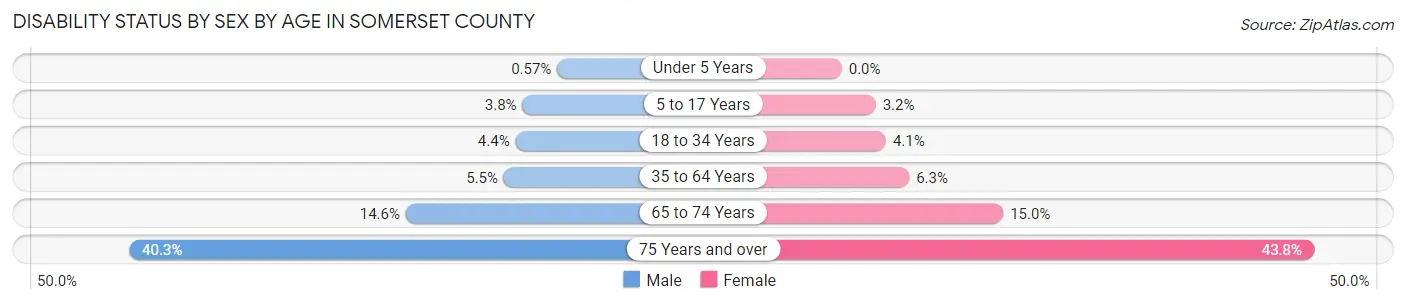
| Age Bracket | Male | Female |
| Under 5 Years | 50 (0.6%) | 0 (0.0%) |
| 5 to 17 Years | 1,106 (3.8%) | 862 (3.2%) |
| 18 to 34 Years | 1,505 (4.4%) | 1,347 (4.1%) |
| 35 to 64 Years | 4,038 (5.5%) | 4,653 (6.3%) |
| 65 to 74 Years | 2,185 (14.6%) | 2,485 (15.0%) |
| 75 Years and over | 3,658 (40.3%) | 6,155 (43.8%) |
Disability Class by Sex by Age in Somerset County
Disability Class: Hearing Difficulty
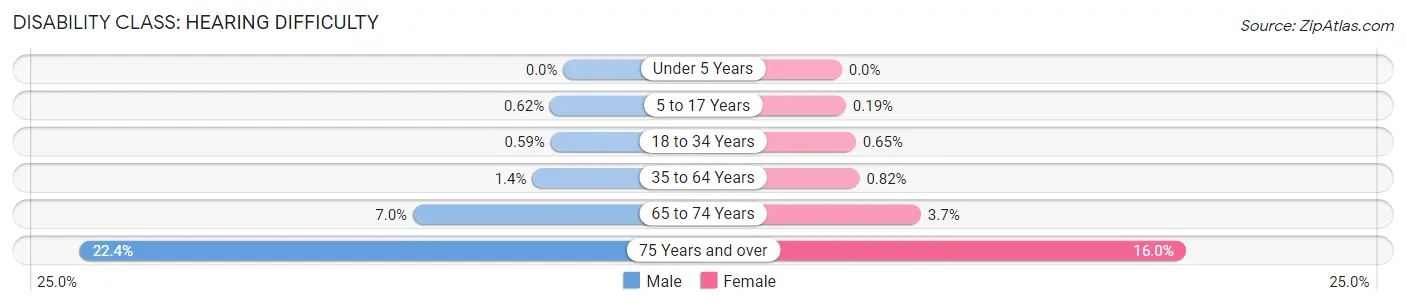
| Age Bracket | Male | Female |
| Under 5 Years | 0 (0.0%) | 0 (0.0%) |
| 5 to 17 Years | 182 (0.6%) | 53 (0.2%) |
| 18 to 34 Years | 199 (0.6%) | 214 (0.6%) |
| 35 to 64 Years | 1,050 (1.4%) | 609 (0.8%) |
| 65 to 74 Years | 1,043 (7.0%) | 608 (3.7%) |
| 75 Years and over | 2,037 (22.4%) | 2,242 (16.0%) |
Disability Class: Vision Difficulty
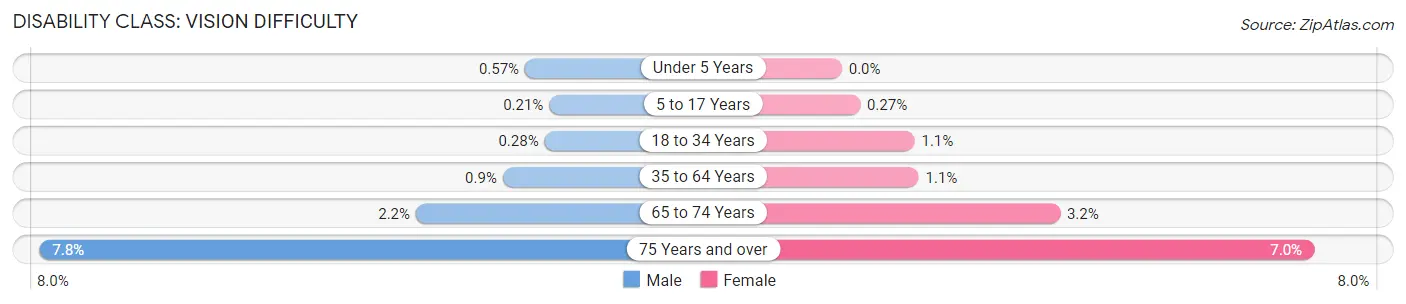
| Age Bracket | Male | Female |
| Under 5 Years | 50 (0.6%) | 0 (0.0%) |
| 5 to 17 Years | 62 (0.2%) | 75 (0.3%) |
| 18 to 34 Years | 94 (0.3%) | 354 (1.1%) |
| 35 to 64 Years | 660 (0.9%) | 847 (1.1%) |
| 65 to 74 Years | 327 (2.2%) | 538 (3.2%) |
| 75 Years and over | 706 (7.8%) | 985 (7.0%) |
Disability Class: Cognitive Difficulty
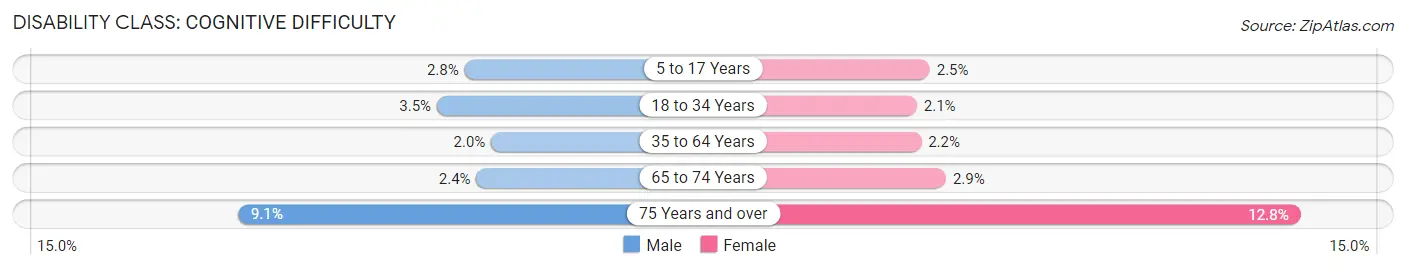
| Age Bracket | Male | Female |
| 5 to 17 Years | 801 (2.8%) | 672 (2.5%) |
| 18 to 34 Years | 1,193 (3.5%) | 688 (2.1%) |
| 35 to 64 Years | 1,468 (2.0%) | 1,647 (2.2%) |
| 65 to 74 Years | 361 (2.4%) | 481 (2.9%) |
| 75 Years and over | 822 (9.1%) | 1,795 (12.8%) |
Disability Class: Ambulatory Difficulty
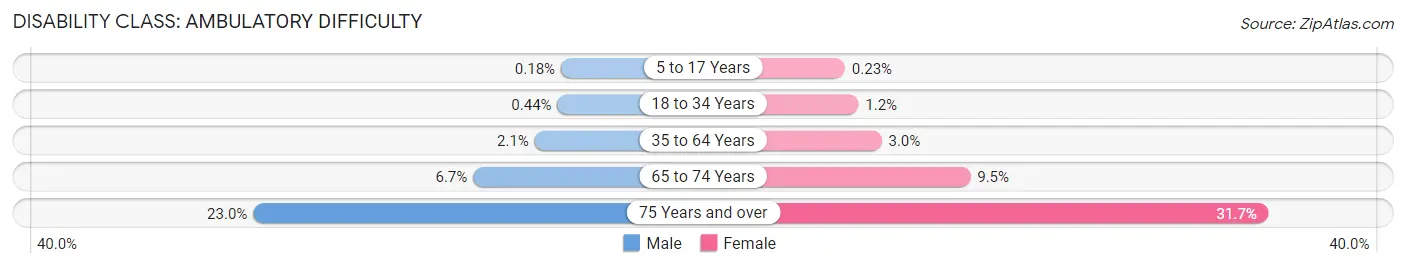
| Age Bracket | Male | Female |
| 5 to 17 Years | 52 (0.2%) | 63 (0.2%) |
| 18 to 34 Years | 148 (0.4%) | 405 (1.2%) |
| 35 to 64 Years | 1,561 (2.1%) | 2,195 (2.9%) |
| 65 to 74 Years | 1,001 (6.7%) | 1,582 (9.5%) |
| 75 Years and over | 2,090 (23.0%) | 4,453 (31.7%) |
Disability Class: Self-Care Difficulty
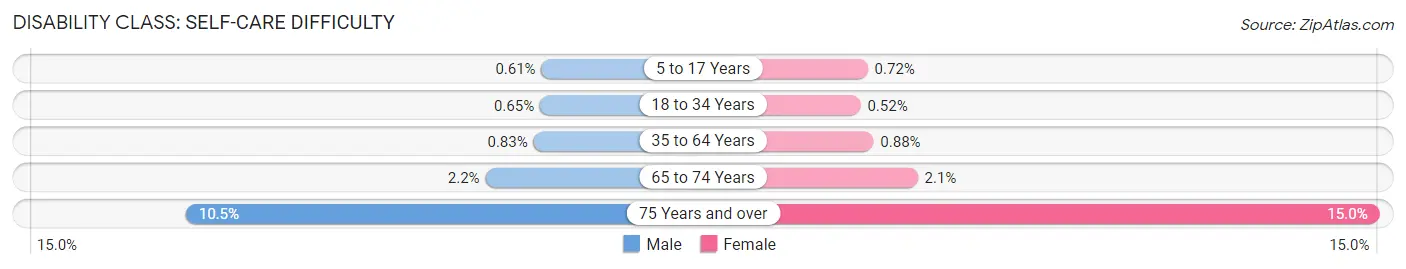
| Age Bracket | Male | Female |
| 5 to 17 Years | 177 (0.6%) | 197 (0.7%) |
| 18 to 34 Years | 222 (0.6%) | 171 (0.5%) |
| 35 to 64 Years | 609 (0.8%) | 655 (0.9%) |
| 65 to 74 Years | 325 (2.2%) | 350 (2.1%) |
| 75 Years and over | 954 (10.5%) | 2,104 (15.0%) |
Technology Access in Somerset County
Computing Device Access in Somerset County
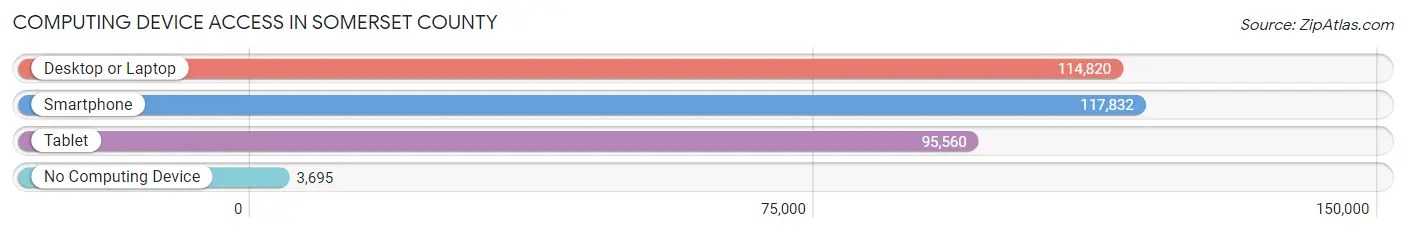
| Device Type | # Households | % Households |
| Desktop or Laptop | 114,820 | 90.0% |
| Smartphone | 117,832 | 92.4% |
| Tablet | 95,560 | 74.9% |
| No Computing Device | 3,695 | 2.9% |
| Total | 127,566 | 100.0% |
Internet Access in Somerset County
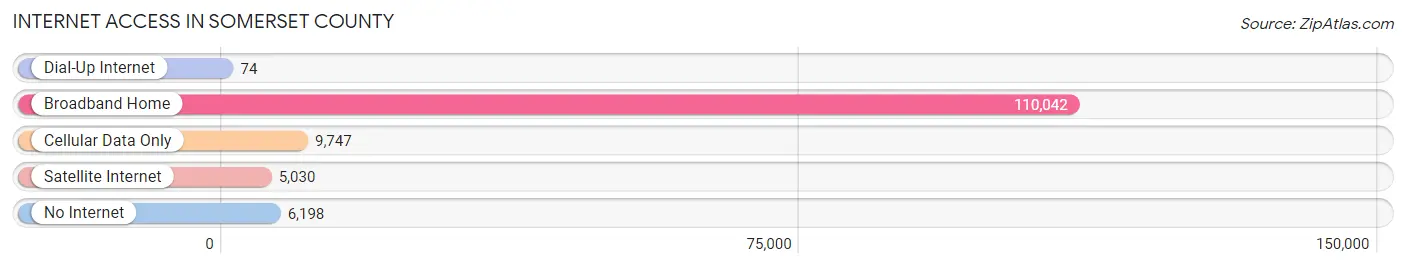
| Internet Type | # Households | % Households |
| Dial-Up Internet | 74 | 0.1% |
| Broadband Home | 110,042 | 86.3% |
| Cellular Data Only | 9,747 | 7.6% |
| Satellite Internet | 5,030 | 3.9% |
| No Internet | 6,198 | 4.9% |
| Total | 127,566 | 100.0% |
Somerset County Summary
Somerset County, New Jersey is located in the central part of the state and is part of the New York metropolitan area. It is bordered by Hunterdon County to the west, Mercer County to the south, Middlesex County to the east, and Morris County to the north. The county seat is Somerville. As of the 2010 census, the population of Somerset County was 323,444, making it the 13th most populous county in New Jersey.
History
Somerset County was created in 1688, when it was separated from Middlesex County. It was named after the English county of Somerset. The county was originally part of the Province of East Jersey, which was one of the two divisions of the Province of New Jersey. In 1709, Somerset County was divided into two townships, Somerset and Bedminster. In 1798, the townships were divided into seven districts: Bedminster, Bernards, Bridgewater, Franklin, Hillsborough, Montgomery, and Somerville.
In 1838, Somerset County was divided into the townships of Bernards, Bridgewater, Franklin, Hillsborough, Montgomery, and Somerville. In 1857, the townships of Bedminster and Warren were added to the county. In 1878, the townships of Bernardsville and Peapack-Gladstone were added to the county.
Geography
Somerset County is located in the central part of New Jersey. It is bordered by Hunterdon County to the west, Mercer County to the south, Middlesex County to the east, and Morris County to the north. The county has a total area of 304 square miles, of which 302 square miles is land and 2 square miles is water. The highest point in the county is the summit of Raritan Mountain, which has an elevation of 1,067 feet.
The county is home to several rivers, including the Raritan River, the Millstone River, and the Passaic River. The Raritan River is the longest river in the county, flowing for approximately 70 miles. The Millstone River is the second longest river in the county, flowing for approximately 40 miles. The Passaic River is the third longest river in the county, flowing for approximately 30 miles.
Economy
Somerset County has a diverse economy, with a variety of industries represented. The county is home to several large corporations, including Johnson & Johnson, Merck & Co., and AT&T. The county is also home to several smaller businesses, including software companies, medical device manufacturers, and pharmaceutical companies.
The county is home to several major shopping malls, including Bridgewater Commons, The Mall at Short Hills, and The Quaker Bridge Mall. The county is also home to several smaller shopping centers, including the Somerville Circle Shopping Center and the Somerville Towne Center.
Demographics
As of the 2010 census, the population of Somerset County was 323,444, making it the 13th most populous county in New Jersey. The population density was 1,072 people per square mile. The racial makeup of the county was 79.2% White, 8.3% African American, 0.3% Native American, 8.2% Asian, 0.1% Pacific Islander, 1.7% from other races, and 2.4% from two or more races. Hispanic or Latino of any race were 6.7% of the population.
The median income for a household in the county was $90,837, and the median income for a family was $105,844. The per capita income for the county was $41,845. About 4.2% of families and 5.7% of the population were below the poverty line, including 6.7% of those under age 18 and 5.2% of those age 65 or over.
Common Questions
What is the Total Population of Somerset County?
Total Population of Somerset County is 344,978.
What is the Total Male Population of Somerset County?
Total Male Population of Somerset County is 170,153.
What is the Total Female Population of Somerset County?
Total Female Population of Somerset County is 174,825.
What is the Ratio of Males per 100 Females in Somerset County?
There are 97.33 Males per 100 Females in Somerset County.
What is the Ratio of Females per 100 Males in Somerset County?
There are 102.75 Females per 100 Males in Somerset County.
What is the Median Population Age in Somerset County?
Median Population Age in Somerset County is 42.0 Years.
What is the Average Family Size in Somerset County
Average Family Size in Somerset County is 3.2 People.
What is the Average Household Size in Somerset County
Average Household Size in Somerset County is 2.7 People.
What is Per Capita Income in Somerset County?
Per Capita income in Somerset County is $67,554.
What is the Median Family Income in Somerset County?
Median Family Income in Somerset County is $161,223.
What is the Median Household income in Somerset County?
Median Household Income in Somerset County is $131,948.
What is Income or Wage Gap in Somerset County?
Income or Wage Gap in Somerset County is 31.1%.
Women in Somerset County earn 68.9 cents for every dollar earned by a man.
What is Family Income Deficit in Somerset County?
Family Income Deficit in Somerset County is $10,515.
Families that are below poverty line in Somerset County earn $10,515 less on average than the poverty threshold level.
What is Inequality or Gini Index in Somerset County?
Inequality or Gini Index in Somerset County is 0.46.
How Large is the Labor Force in Somerset County?
There are 194,680 People in the Labor Forcein in Somerset County.
What is the Percentage of People in the Labor Force in Somerset County?
69.3% of People are in the Labor Force in Somerset County.
What is the Unemployment Rate in Somerset County?
Unemployment Rate in Somerset County is 5.0%.