Salem County, NJ
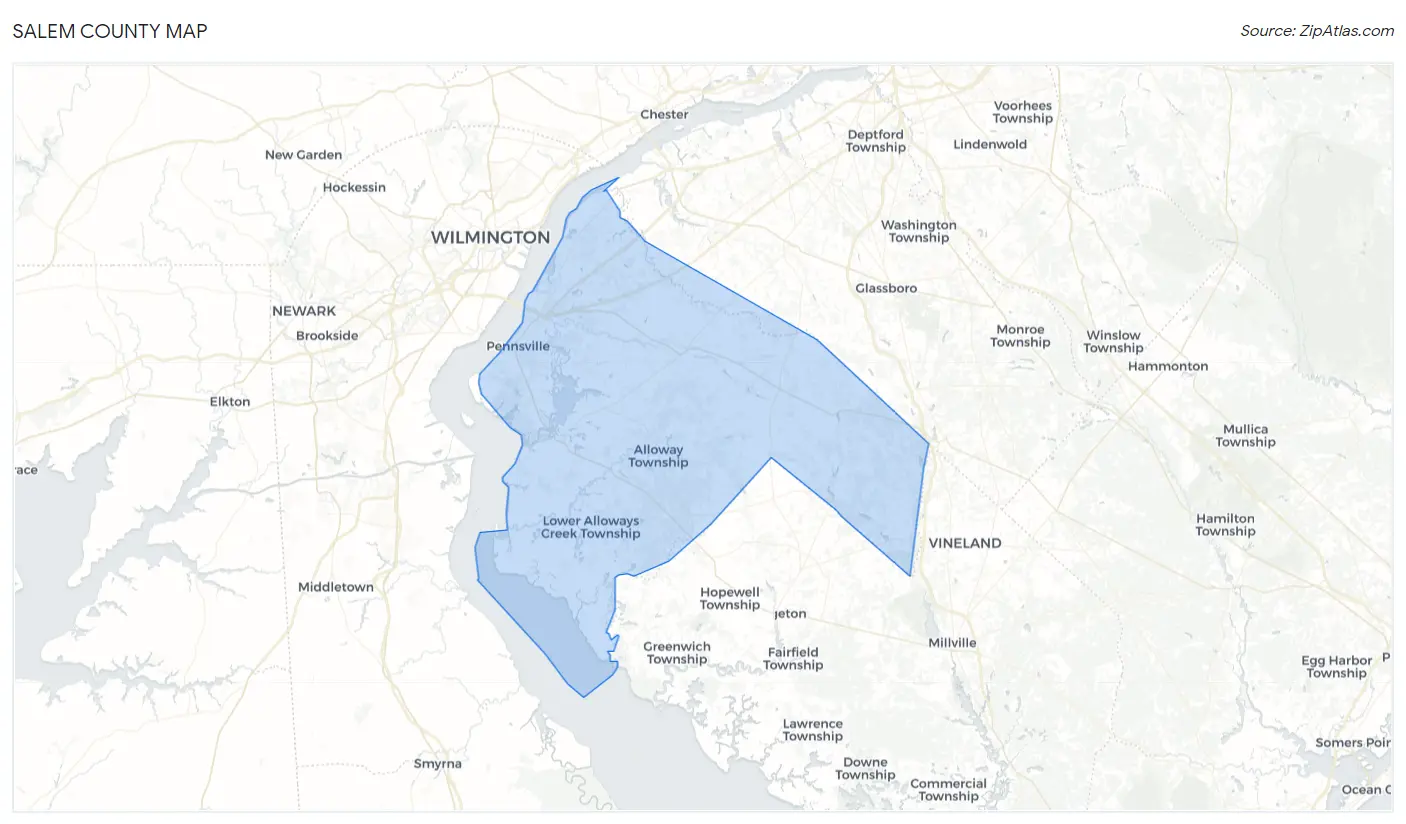
Salem County Map
Salem County Overview
64,840
TOTAL POPULATION
32,077
MALE POPULATION
32,763
FEMALE POPULATION
97.91
MALES / 100 FEMALES
102.14
FEMALES / 100 MALES
41.8
MEDIAN AGE
3.2
AVG FAMILY SIZE
2.6
AVG HOUSEHOLD SIZE
$37,904
PER CAPITA INCOME
$92,541
AVG FAMILY INCOME
$73,378
AVG HOUSEHOLD INCOME
31.4%
WAGE / INCOME GAP [ % ]
68.6¢/ $1
WAGE / INCOME GAP [ $ ]
$10,121
FAMILY INCOME DEFICIT
0.44
INEQUALITY / GINI INDEX
31,834
LABOR FORCE [ PEOPLE ]
60.5%
PERCENT IN LABOR FORCE
8.0%
UNEMPLOYMENT RATE
Race in Salem County
The most populous races in Salem County are White / Caucasian (48,862 | 75.4%), Black / African American (9,492 | 14.6%), and Hispanic or Latino (6,698 | 10.3%).
| Race | # Population | % Population |
| Asian | 583 | 0.9% |
| Black / African American | 9,492 | 14.6% |
| Hawaiian / Pacific | 12 | 0.0% |
| Hispanic or Latino | 6,698 | 10.3% |
| Native / Alaskan | 208 | 0.3% |
| White / Caucasian | 48,862 | 75.4% |
| Two or more Races | 3,184 | 4.9% |
| Some other Race | 2,499 | 3.8% |
| Total | 64,840 | 100.0% |
Ancestry in Salem County
The most populous ancestries reported in Salem County are Irish (12,246 | 18.9%), German (11,402 | 17.6%), Italian (8,325 | 12.8%), English (7,706 | 11.9%), and Puerto Rican (3,971 | 6.1%), together accounting for 67.3% of all Salem County residents.
| Ancestry | # Population | % Population |
| African | 125 | 0.2% |
| Albanian | 5 | 0.0% |
| American | 2,461 | 3.8% |
| Arab | 165 | 0.3% |
| Argentinean | 32 | 0.1% |
| Armenian | 22 | 0.0% |
| Australian | 34 | 0.1% |
| Austrian | 88 | 0.1% |
| Bahamian | 9 | 0.0% |
| Barbadian | 13 | 0.0% |
| Belgian | 77 | 0.1% |
| Bhutanese | 125 | 0.2% |
| Blackfeet | 62 | 0.1% |
| Brazilian | 18 | 0.0% |
| British | 159 | 0.3% |
| British West Indian | 16 | 0.0% |
| Bulgarian | 2 | 0.0% |
| Burmese | 139 | 0.2% |
| Canadian | 53 | 0.1% |
| Central American | 286 | 0.4% |
| Central American Indian | 48 | 0.1% |
| Cherokee | 122 | 0.2% |
| Chippewa | 7 | 0.0% |
| Choctaw | 6 | 0.0% |
| Colombian | 54 | 0.1% |
| Creek | 5 | 0.0% |
| Croatian | 62 | 0.1% |
| Cuban | 86 | 0.1% |
| Czech | 45 | 0.1% |
| Czechoslovakian | 8 | 0.0% |
| Danish | 82 | 0.1% |
| Delaware | 60 | 0.1% |
| Dominican | 223 | 0.3% |
| Dutch | 656 | 1.0% |
| Eastern European | 203 | 0.3% |
| Ecuadorian | 18 | 0.0% |
| Egyptian | 39 | 0.1% |
| English | 7,706 | 11.9% |
| Estonian | 11 | 0.0% |
| European | 461 | 0.7% |
| Filipino | 42 | 0.1% |
| Finnish | 156 | 0.2% |
| French | 1,084 | 1.7% |
| French American Indian | 12 | 0.0% |
| French Canadian | 143 | 0.2% |
| German | 11,402 | 17.6% |
| Greek | 407 | 0.6% |
| Guatemalan | 112 | 0.2% |
| Haitian | 4 | 0.0% |
| Honduran | 36 | 0.1% |
| Hungarian | 244 | 0.4% |
| Icelander | 9 | 0.0% |
| Indian (Asian) | 45 | 0.1% |
| Irish | 12,246 | 18.9% |
| Iroquois | 5 | 0.0% |
| Israeli | 14 | 0.0% |
| Italian | 8,325 | 12.8% |
| Jamaican | 17 | 0.0% |
| Korean | 382 | 0.6% |
| Latvian | 20 | 0.0% |
| Lebanese | 89 | 0.1% |
| Lithuanian | 313 | 0.5% |
| Mexican | 1,658 | 2.6% |
| Mexican American Indian | 38 | 0.1% |
| Moroccan | 37 | 0.1% |
| Nicaraguan | 51 | 0.1% |
| Northern European | 34 | 0.1% |
| Norwegian | 196 | 0.3% |
| Panamanian | 17 | 0.0% |
| Paraguayan | 16 | 0.0% |
| Pennsylvania German | 223 | 0.3% |
| Peruvian | 60 | 0.1% |
| Polish | 2,544 | 3.9% |
| Portuguese | 24 | 0.0% |
| Puerto Rican | 3,971 | 6.1% |
| Romanian | 27 | 0.0% |
| Russian | 246 | 0.4% |
| Salvadoran | 70 | 0.1% |
| Samoan | 12 | 0.0% |
| Scandinavian | 33 | 0.1% |
| Scotch-Irish | 481 | 0.7% |
| Scottish | 822 | 1.3% |
| Seminole | 1 | 0.0% |
| Slavic | 2 | 0.0% |
| Slovak | 75 | 0.1% |
| South American | 180 | 0.3% |
| South American Indian | 40 | 0.1% |
| Spaniard | 125 | 0.2% |
| Spanish | 12 | 0.0% |
| Sri Lankan | 95 | 0.2% |
| Subsaharan African | 137 | 0.2% |
| Swedish | 582 | 0.9% |
| Swiss | 95 | 0.2% |
| Thai | 155 | 0.2% |
| Trinidadian and Tobagonian | 10 | 0.0% |
| Turkish | 27 | 0.0% |
| Ukrainian | 387 | 0.6% |
| Welsh | 664 | 1.0% |
| West Indian | 40 | 0.1% |
| Yugoslavian | 22 | 0.0% | View All 100 Rows |
Immigrants in Salem County
The most numerous immigrant groups reported in Salem County came from Latin America (1,104 | 1.7%), Central America (757 | 1.2%), Mexico (605 | 0.9%), Europe (513 | 0.8%), and Asia (334 | 0.5%), together accounting for 5.1% of all Salem County residents.
| Immigration Origin | # Population | % Population |
| Africa | 52 | 0.1% |
| Argentina | 33 | 0.1% |
| Asia | 334 | 0.5% |
| Australia | 43 | 0.1% |
| Brazil | 18 | 0.0% |
| Canada | 72 | 0.1% |
| Caribbean | 173 | 0.3% |
| Central America | 757 | 1.2% |
| China | 47 | 0.1% |
| Colombia | 21 | 0.0% |
| Cuba | 104 | 0.2% |
| Dominican Republic | 41 | 0.1% |
| Eastern Asia | 114 | 0.2% |
| Eastern Europe | 108 | 0.2% |
| Ecuador | 18 | 0.0% |
| Egypt | 18 | 0.0% |
| El Salvador | 2 | 0.0% |
| England | 42 | 0.1% |
| Europe | 513 | 0.8% |
| Germany | 29 | 0.0% |
| Ghana | 24 | 0.0% |
| Greece | 92 | 0.1% |
| Guatemala | 68 | 0.1% |
| Haiti | 1 | 0.0% |
| India | 63 | 0.1% |
| Ireland | 27 | 0.0% |
| Israel | 3 | 0.0% |
| Italy | 115 | 0.2% |
| Jamaica | 17 | 0.0% |
| Jordan | 2 | 0.0% |
| Korea | 67 | 0.1% |
| Latin America | 1,104 | 1.7% |
| Latvia | 14 | 0.0% |
| Mexico | 605 | 0.9% |
| Netherlands | 5 | 0.0% |
| Nicaragua | 51 | 0.1% |
| Northern Africa | 18 | 0.0% |
| Northern Europe | 117 | 0.2% |
| Oceania | 43 | 0.1% |
| Panama | 31 | 0.1% |
| Peru | 68 | 0.1% |
| Philippines | 123 | 0.2% |
| Poland | 36 | 0.1% |
| Romania | 12 | 0.0% |
| Russia | 35 | 0.1% |
| Scotland | 13 | 0.0% |
| South Africa | 10 | 0.0% |
| South America | 174 | 0.3% |
| South Central Asia | 63 | 0.1% |
| South Eastern Asia | 146 | 0.2% |
| Southern Europe | 251 | 0.4% |
| Spain | 44 | 0.1% |
| Switzerland | 3 | 0.0% |
| Taiwan | 31 | 0.1% |
| Trinidad and Tobago | 10 | 0.0% |
| Vietnam | 23 | 0.0% |
| Western Africa | 24 | 0.0% |
| Western Asia | 11 | 0.0% |
| Western Europe | 37 | 0.1% | View All 59 Rows |
Sex and Age in Salem County
Sex and Age in Salem County
The most populous age groups in Salem County are 10 to 14 Years (2,439 | 7.6%) for men and 60 to 64 Years (2,516 | 7.7%) for women.
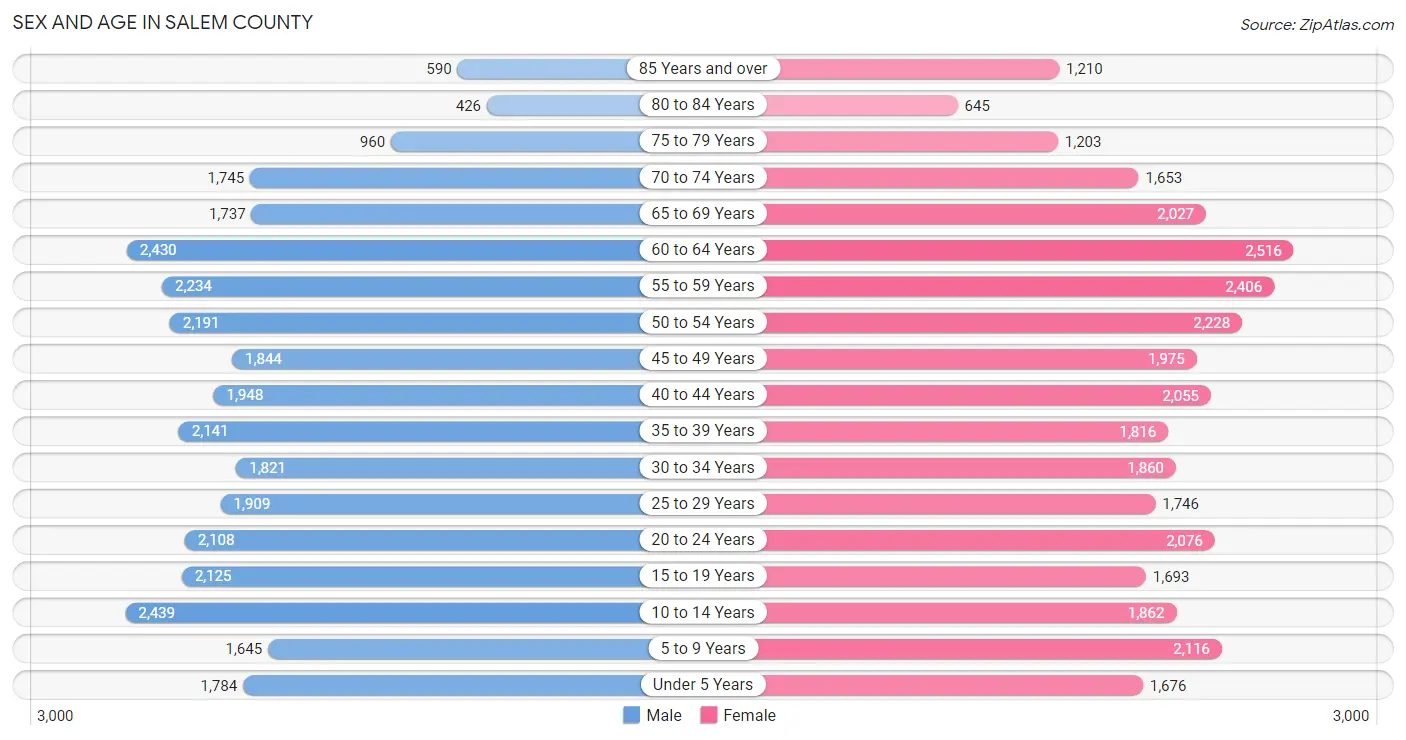
| Age Bracket | Male | Female |
| Under 5 Years | 1,784 (5.6%) | 1,676 (5.1%) |
| 5 to 9 Years | 1,645 (5.1%) | 2,116 (6.5%) |
| 10 to 14 Years | 2,439 (7.6%) | 1,862 (5.7%) |
| 15 to 19 Years | 2,125 (6.6%) | 1,693 (5.2%) |
| 20 to 24 Years | 2,108 (6.6%) | 2,076 (6.3%) |
| 25 to 29 Years | 1,909 (5.9%) | 1,746 (5.3%) |
| 30 to 34 Years | 1,821 (5.7%) | 1,860 (5.7%) |
| 35 to 39 Years | 2,141 (6.7%) | 1,816 (5.5%) |
| 40 to 44 Years | 1,948 (6.1%) | 2,055 (6.3%) |
| 45 to 49 Years | 1,844 (5.8%) | 1,975 (6.0%) |
| 50 to 54 Years | 2,191 (6.8%) | 2,228 (6.8%) |
| 55 to 59 Years | 2,234 (7.0%) | 2,406 (7.3%) |
| 60 to 64 Years | 2,430 (7.6%) | 2,516 (7.7%) |
| 65 to 69 Years | 1,737 (5.4%) | 2,027 (6.2%) |
| 70 to 74 Years | 1,745 (5.4%) | 1,653 (5.1%) |
| 75 to 79 Years | 960 (3.0%) | 1,203 (3.7%) |
| 80 to 84 Years | 426 (1.3%) | 645 (2.0%) |
| 85 Years and over | 590 (1.8%) | 1,210 (3.7%) |
| Total | 32,077 (100.0%) | 32,763 (100.0%) |
Families and Households in Salem County
Median Family Size in Salem County
The median family size in Salem County is 3.21 persons per family, with single female/mother families (3,523 | 22.2%) accounting for the largest median family size of 3.36 persons per family. On the other hand, single male/father families (1,297 | 8.2%) represent the smallest median family size with 2.87 persons per family.
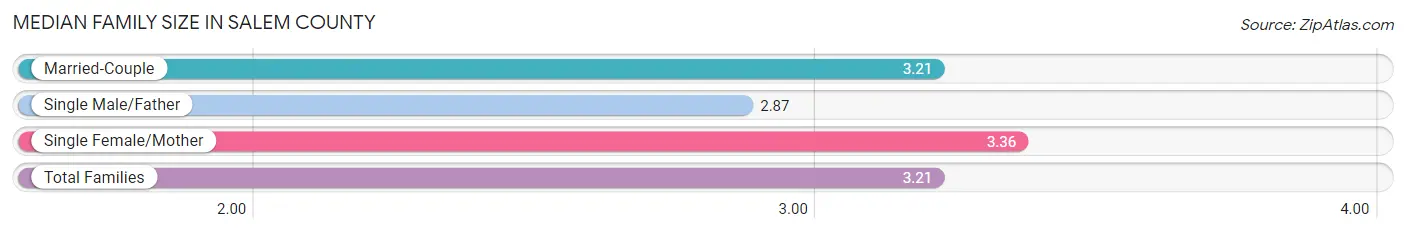
| Family Type | # Families | Family Size |
| Married-Couple | 11,033 (69.6%) | 3.21 |
| Single Male/Father | 1,297 (8.2%) | 2.87 |
| Single Female/Mother | 3,523 (22.2%) | 3.36 |
| Total Families | 15,853 (100.0%) | 3.21 |
Median Household Size in Salem County
The median household size in Salem County is 2.56 persons per household, with single female/mother households (3,523 | 14.2%) accounting for the largest median household size of 3.6 persons per household. non-family households (8,891 | 35.9%) represent the smallest median household size with 1.21 persons per household.
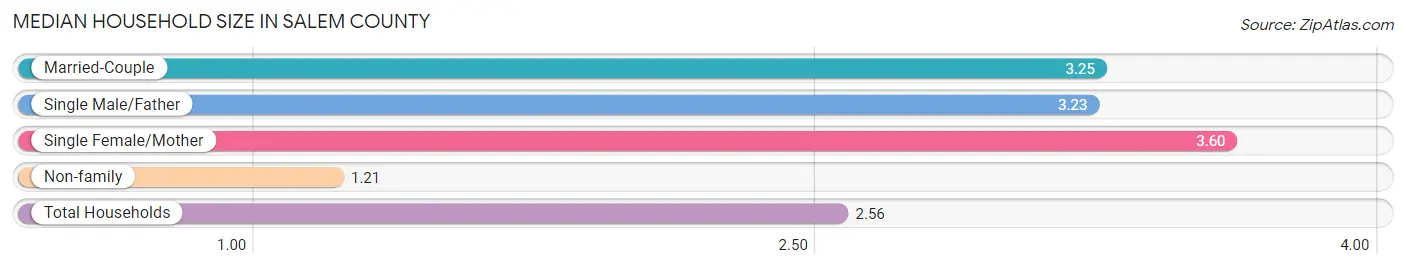
| Household Type | # Households | Household Size |
| Married-Couple | 11,033 (44.6%) | 3.25 |
| Single Male/Father | 1,297 (5.2%) | 3.23 |
| Single Female/Mother | 3,523 (14.2%) | 3.60 |
| Non-family | 8,891 (35.9%) | 1.21 |
| Total Households | 24,744 (100.0%) | 2.56 |
Household Size by Marriage Status in Salem County
Out of a total of 24,744 households in Salem County, 15,853 (64.1%) are family households, while 8,891 (35.9%) are nonfamily households. The most numerous type of family households are 2-person households, comprising 7,449, and the most common type of nonfamily households are 1-person households, comprising 7,587.
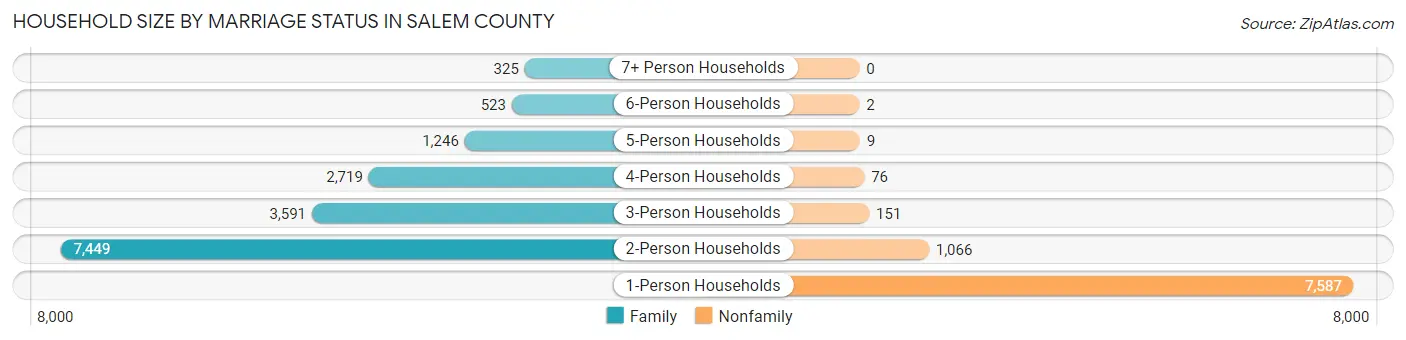
| Household Size | Family Households | Nonfamily Households |
| 1-Person Households | - | 7,587 (30.7%) |
| 2-Person Households | 7,449 (30.1%) | 1,066 (4.3%) |
| 3-Person Households | 3,591 (14.5%) | 151 (0.6%) |
| 4-Person Households | 2,719 (11.0%) | 76 (0.3%) |
| 5-Person Households | 1,246 (5.0%) | 9 (0.0%) |
| 6-Person Households | 523 (2.1%) | 2 (0.0%) |
| 7+ Person Households | 325 (1.3%) | 0 (0.0%) |
| Total | 15,853 (64.1%) | 8,891 (35.9%) |
Female Fertility in Salem County
Fertility by Age in Salem County
Average fertility rate in Salem County is 54.0 births per 1,000 women. Women in the age bracket of 20 to 34 years have the highest fertility rate with 94.0 births per 1,000 women. Women in the age bracket of 20 to 34 years acount for 72.8% of all women with births.
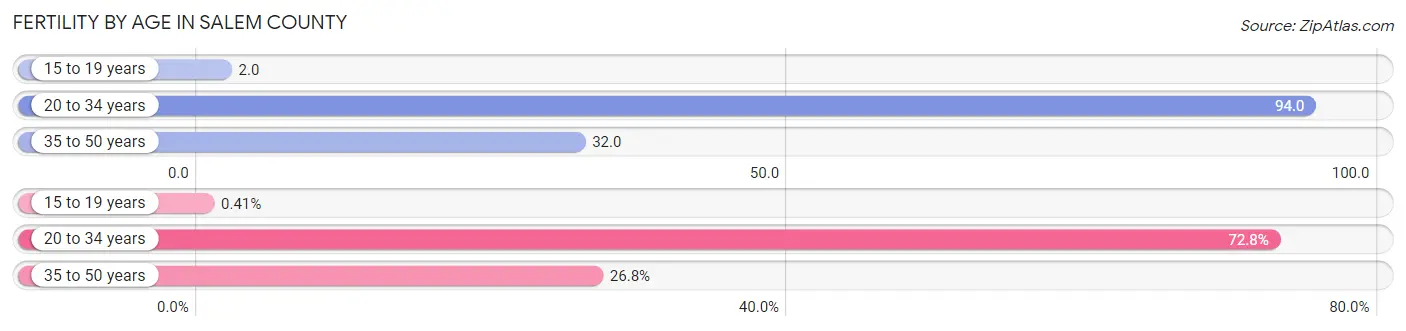
| Age Bracket | Women with Births | Births / 1,000 Women |
| 15 to 19 years | 3 (0.4%) | 2.0 |
| 20 to 34 years | 535 (72.8%) | 94.0 |
| 35 to 50 years | 197 (26.8%) | 32.0 |
| Total | 735 (100.0%) | 54.0 |
Fertility by Age by Marriage Status in Salem County
40.8% of women with births (735) in Salem County are married. The highest percentage of unmarried women with births falls into 15 to 19 years age bracket with 100.0% of them unmarried at the time of birth, while the lowest percentage of unmarried women with births belong to 35 to 50 years age bracket with 46.2% of them unmarried.
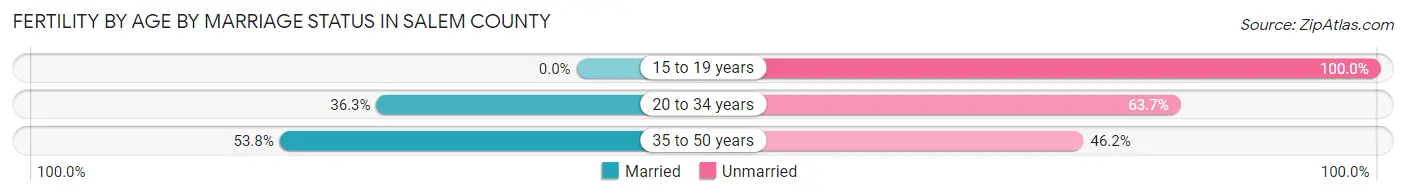
| Age Bracket | Married | Unmarried |
| 15 to 19 years | 0 (0.0%) | 3 (100.0%) |
| 20 to 34 years | 194 (36.3%) | 341 (63.7%) |
| 35 to 50 years | 106 (53.8%) | 91 (46.2%) |
| Total | 300 (40.8%) | 435 (59.2%) |
Fertility by Education in Salem County
Average fertility rate in Salem County is 54.0 births per 1,000 women. Women with the education attainment of college or associate's degree have the highest fertility rate of 83.0 births per 1,000 women, while women with the education attainment of less than high school have the lowest fertility at 2.0 births per 1,000 women. Women with the education attainment of college or associate's degree represent 49.5% of all women with births.
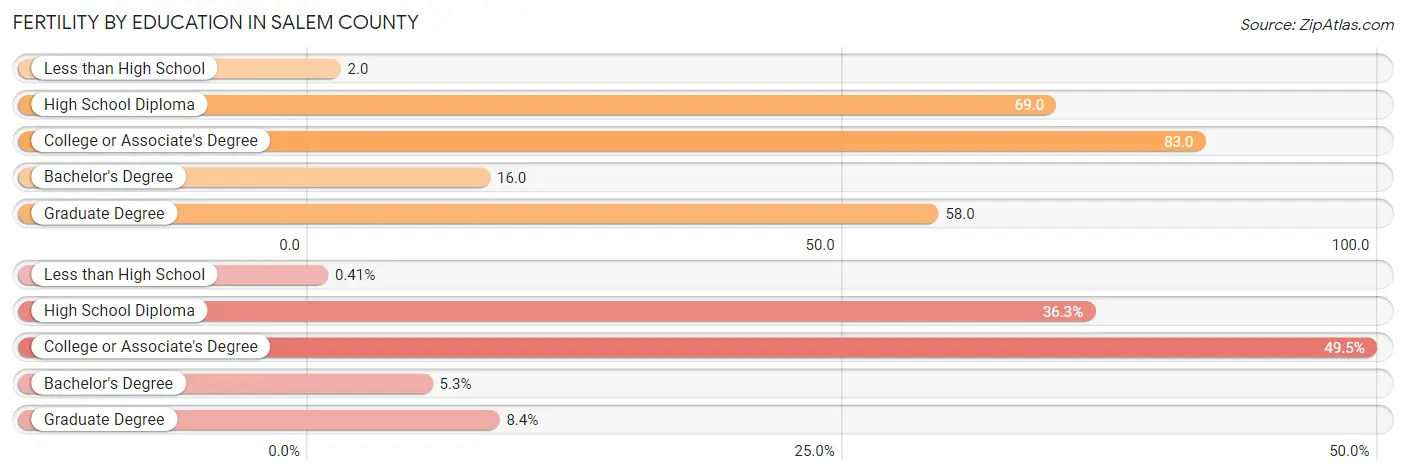
| Educational Attainment | Women with Births | Births / 1,000 Women |
| Less than High School | 3 (0.4%) | 2.0 |
| High School Diploma | 267 (36.3%) | 69.0 |
| College or Associate's Degree | 364 (49.5%) | 83.0 |
| Bachelor's Degree | 39 (5.3%) | 16.0 |
| Graduate Degree | 62 (8.4%) | 58.0 |
| Total | 735 (100.0%) | 54.0 |
Fertility by Education by Marriage Status in Salem County
59.2% of women with births in Salem County are unmarried. Women with the educational attainment of graduate degree are most likely to be married with 100.0% of them married at childbirth, while women with the educational attainment of less than high school are least likely to be married with 100.0% of them unmarried at childbirth.
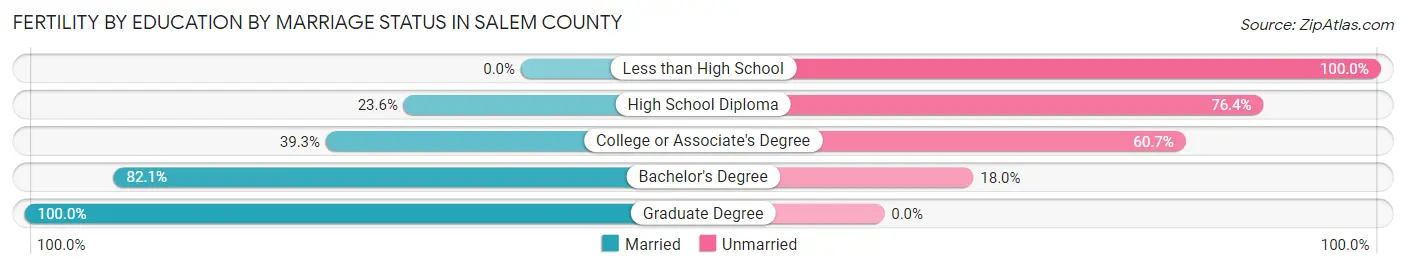
| Educational Attainment | Married | Unmarried |
| Less than High School | 0 (0.0%) | 3 (100.0%) |
| High School Diploma | 63 (23.6%) | 204 (76.4%) |
| College or Associate's Degree | 143 (39.3%) | 221 (60.7%) |
| Bachelor's Degree | 32 (82.1%) | 7 (17.9%) |
| Graduate Degree | 62 (100.0%) | 0 (0.0%) |
| Total | 300 (40.8%) | 435 (59.2%) |
Income in Salem County
Income Overview in Salem County
Per Capita Income in Salem County is $37,904, while median incomes of families and households are $92,541 and $73,378 respectively.
| Characteristic | Number | Measure |
| Per Capita Income | 64,840 | $37,904 |
| Median Family Income | 15,853 | $92,541 |
| Mean Family Income | 15,853 | $114,306 |
| Median Household Income | 24,744 | $73,378 |
| Mean Household Income | 24,744 | $94,893 |
| Income Deficit | 15,853 | $10,121 |
| Wage / Income Gap (%) | 64,840 | 31.37% |
| Wage / Income Gap ($) | 64,840 | 68.63¢ per $1 |
| Gini / Inequality Index | 64,840 | 0.44 |
Earnings by Sex in Salem County
Average Earnings in Salem County are $44,361, $52,615 for men and $36,112 for women, a difference of 31.4%.
| Sex | Number | Average Earnings |
| Male | 16,558 (51.1%) | $52,615 |
| Female | 15,842 (48.9%) | $36,112 |
| Total | 32,400 (100.0%) | $44,361 |
Earnings by Sex by Income Bracket in Salem County
The most common earnings brackets in Salem County are $100,000+ for men (3,298 | 19.9%) and $75,000 to $99,999 for women (1,727 | 10.9%).
| Income | Male | Female |
| $2,499 or less | 629 (3.8%) | 704 (4.4%) |
| $2,500 to $4,999 | 360 (2.2%) | 875 (5.5%) |
| $5,000 to $7,499 | 316 (1.9%) | 533 (3.4%) |
| $7,500 to $9,999 | 462 (2.8%) | 367 (2.3%) |
| $10,000 to $12,499 | 347 (2.1%) | 583 (3.7%) |
| $12,500 to $14,999 | 300 (1.8%) | 412 (2.6%) |
| $15,000 to $17,499 | 356 (2.1%) | 439 (2.8%) |
| $17,500 to $19,999 | 399 (2.4%) | 343 (2.2%) |
| $20,000 to $22,499 | 407 (2.5%) | 539 (3.4%) |
| $22,500 to $24,999 | 435 (2.6%) | 909 (5.7%) |
| $25,000 to $29,999 | 635 (3.8%) | 1,028 (6.5%) |
| $30,000 to $34,999 | 934 (5.6%) | 988 (6.2%) |
| $35,000 to $39,999 | 642 (3.9%) | 928 (5.9%) |
| $40,000 to $44,999 | 756 (4.6%) | 767 (4.8%) |
| $45,000 to $49,999 | 844 (5.1%) | 881 (5.6%) |
| $50,000 to $54,999 | 727 (4.4%) | 649 (4.1%) |
| $55,000 to $64,999 | 1,380 (8.3%) | 1,117 (7.0%) |
| $65,000 to $74,999 | 1,292 (7.8%) | 920 (5.8%) |
| $75,000 to $99,999 | 2,039 (12.3%) | 1,727 (10.9%) |
| $100,000+ | 3,298 (19.9%) | 1,133 (7.1%) |
| Total | 16,558 (100.0%) | 15,842 (100.0%) |
Earnings by Sex by Educational Attainment in Salem County
Average earnings in Salem County are $59,337 for men and $41,234 for women, a difference of 30.5%. Men with an educational attainment of graduate degree enjoy the highest average annual earnings of $103,958, while those with less than high school education earn the least with $34,458. Women with an educational attainment of graduate degree earn the most with the average annual earnings of $76,944, while those with less than high school education have the smallest earnings of $30,912.
| Educational Attainment | Male Income | Female Income |
| Less than High School | $34,458 | $30,912 |
| High School Diploma | $51,907 | $31,621 |
| College or Associate's Degree | $67,636 | $39,355 |
| Bachelor's Degree | $69,095 | $62,390 |
| Graduate Degree | $103,958 | $76,944 |
| Total | $59,337 | $41,234 |
Family Income in Salem County
Family Income Brackets in Salem County
According to the Salem County family income data, there are 3,313 families falling into the $100,000 to $149,999 income range, which is the most common income bracket and makes up 20.9% of all families. Conversely, the $10,000 to $14,999 income bracket is the least frequent group with only 333 families (2.1%) belonging to this category.
| Income Bracket | # Families | % Families |
| Less than $10,000 | 491 | 3.1% |
| $10,000 to $14,999 | 333 | 2.1% |
| $15,000 to $24,999 | 666 | 4.2% |
| $25,000 to $34,999 | 951 | 6.0% |
| $35,000 to $49,999 | 1,411 | 8.9% |
| $50,000 to $74,999 | 2,235 | 14.1% |
| $75,000 to $99,999 | 2,394 | 15.1% |
| $100,000 to $149,999 | 3,313 | 20.9% |
| $150,000 to $199,999 | 2,108 | 13.3% |
| $200,000+ | 1,934 | 12.2% |
Family Income by Famaliy Size in Salem County
7+ person families (281 | 1.8%) account for the highest median family income in Salem County with $157,795 per family, while 2-person families (7,995 | 50.4%) have the highest median income of $40,614 per family member.
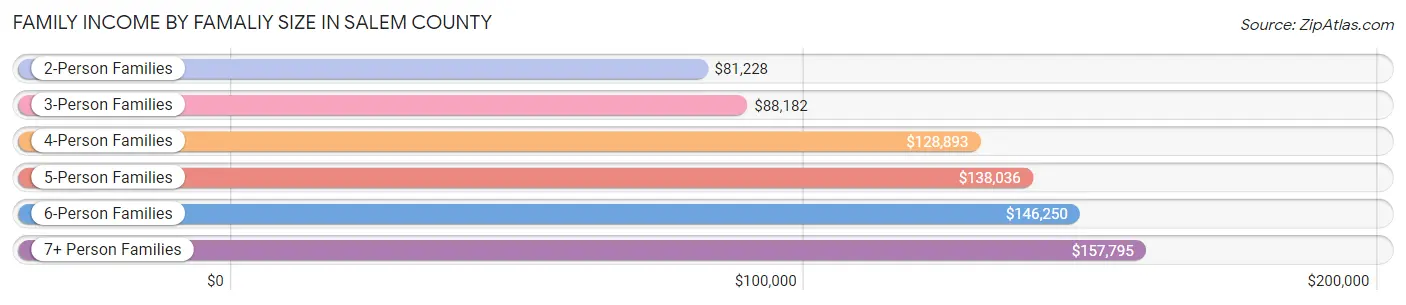
| Income Bracket | # Families | Median Income |
| 2-Person Families | 7,995 (50.4%) | $81,228 |
| 3-Person Families | 3,424 (21.6%) | $88,182 |
| 4-Person Families | 2,635 (16.6%) | $128,893 |
| 5-Person Families | 1,082 (6.8%) | $138,036 |
| 6-Person Families | 436 (2.8%) | $146,250 |
| 7+ Person Families | 281 (1.8%) | $157,795 |
| Total | 15,853 (100.0%) | $92,541 |
Family Income by Number of Earners in Salem County
The median family income in Salem County is $92,541, with families comprising 3+ earners (1,802) having the highest median family income of $181,731, while families with no earners (2,568) have the lowest median family income of $53,319, accounting for 11.4% and 16.2% of families, respectively.
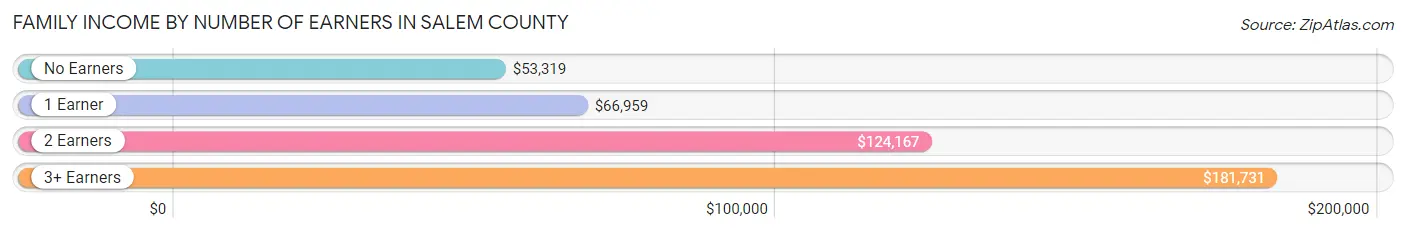
| Number of Earners | # Families | Median Income |
| No Earners | 2,568 (16.2%) | $53,319 |
| 1 Earner | 5,575 (35.2%) | $66,959 |
| 2 Earners | 5,908 (37.3%) | $124,167 |
| 3+ Earners | 1,802 (11.4%) | $181,731 |
| Total | 15,853 (100.0%) | $92,541 |
Household Income in Salem County
Household Income Brackets in Salem County
With 4,132 households falling in the category, the $100,000 to $149,999 income range is the most frequent in Salem County, accounting for 16.7% of all households. In contrast, only 990 households (4.0%) fall into the less than $10,000 income bracket, making it the least populous group.
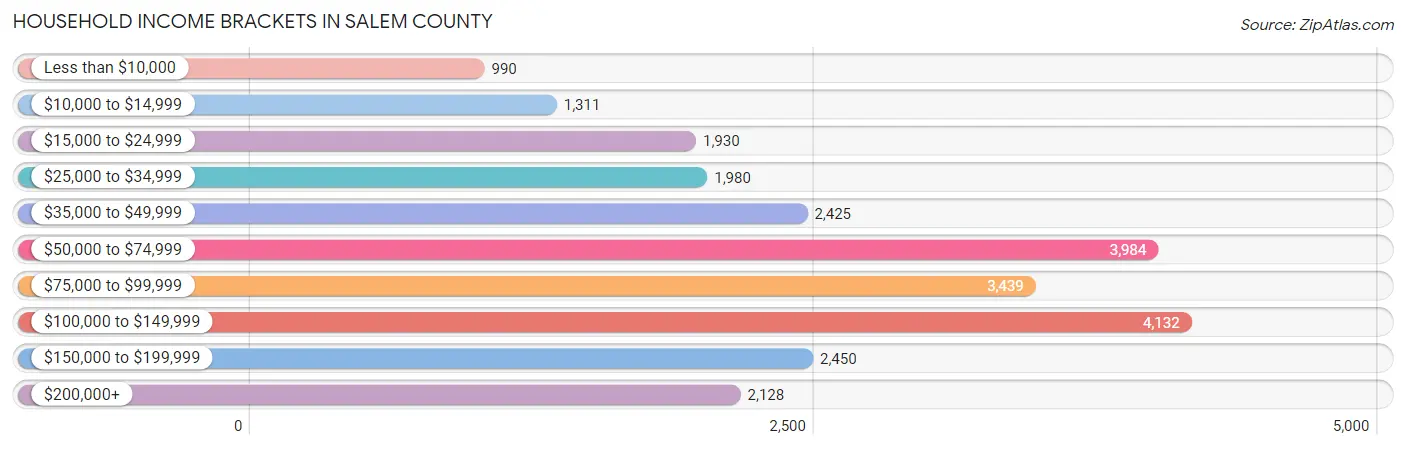
| Income Bracket | # Households | % Households |
| Less than $10,000 | 990 | 4.0% |
| $10,000 to $14,999 | 1,311 | 5.3% |
| $15,000 to $24,999 | 1,930 | 7.8% |
| $25,000 to $34,999 | 1,980 | 8.0% |
| $35,000 to $49,999 | 2,425 | 9.8% |
| $50,000 to $74,999 | 3,984 | 16.1% |
| $75,000 to $99,999 | 3,439 | 13.9% |
| $100,000 to $149,999 | 4,132 | 16.7% |
| $150,000 to $199,999 | 2,450 | 9.9% |
| $200,000+ | 2,128 | 8.6% |
Household Income by Householder Age in Salem County
The median household income in Salem County is $73,378, with the highest median household income of $90,650 found in the 45 to 64 years age bracket for the primary householder. A total of 9,704 households (39.2%) fall into this category. Meanwhile, the 15 to 24 years age bracket for the primary householder has the lowest median household income of $0, with 570 households (2.3%) in this group.
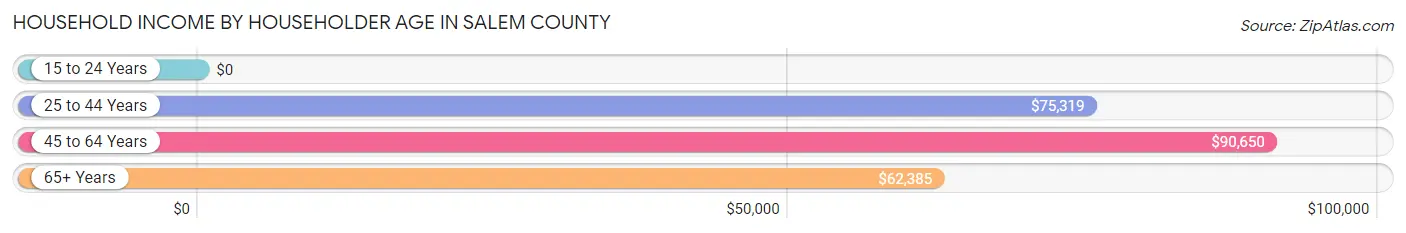
| Income Bracket | # Households | Median Income |
| 15 to 24 Years | 570 (2.3%) | $0 |
| 25 to 44 Years | 6,865 (27.7%) | $75,319 |
| 45 to 64 Years | 9,704 (39.2%) | $90,650 |
| 65+ Years | 7,605 (30.7%) | $62,385 |
| Total | 24,744 (100.0%) | $73,378 |
Poverty in Salem County
Income Below Poverty by Sex and Age in Salem County
With 11.8% poverty level for males and 14.2% for females among the residents of Salem County, under 5 year old males and 12 to 14 year old females are the most vulnerable to poverty, with 425 males (24.3%) and 326 females (28.7%) in their respective age groups living below the poverty level.
| Age Bracket | Male | Female |
| Under 5 Years | 425 (24.3%) | 395 (24.2%) |
| 5 Years | 38 (9.3%) | 75 (18.3%) |
| 6 to 11 Years | 466 (21.6%) | 626 (26.4%) |
| 12 to 14 Years | 275 (20.1%) | 326 (28.7%) |
| 15 Years | 5 (1.4%) | 53 (15.7%) |
| 16 and 17 Years | 159 (15.4%) | 129 (17.5%) |
| 18 to 24 Years | 500 (18.3%) | 235 (8.7%) |
| 25 to 34 Years | 516 (14.5%) | 455 (12.7%) |
| 35 to 44 Years | 242 (6.0%) | 635 (16.4%) |
| 45 to 54 Years | 225 (5.6%) | 544 (13.0%) |
| 55 to 64 Years | 598 (13.0%) | 500 (10.2%) |
| 65 to 74 Years | 96 (2.8%) | 277 (7.6%) |
| 75 Years and over | 143 (7.8%) | 333 (12.1%) |
| Total | 3,688 (11.8%) | 4,583 (14.2%) |
Income Above Poverty by Sex and Age in Salem County
According to the poverty statistics in Salem County, males aged 15 years and females aged 65 to 74 years are the age groups that are most secure financially, with 98.6% of males and 92.4% of females in these age groups living above the poverty line.
| Age Bracket | Male | Female |
| Under 5 Years | 1,323 (75.7%) | 1,234 (75.7%) |
| 5 Years | 370 (90.7%) | 335 (81.7%) |
| 6 to 11 Years | 1,695 (78.4%) | 1,745 (73.6%) |
| 12 to 14 Years | 1,096 (79.9%) | 808 (71.3%) |
| 15 Years | 357 (98.6%) | 285 (84.3%) |
| 16 and 17 Years | 872 (84.6%) | 606 (82.5%) |
| 18 to 24 Years | 2,237 (81.7%) | 2,453 (91.3%) |
| 25 to 34 Years | 3,030 (85.5%) | 3,117 (87.3%) |
| 35 to 44 Years | 3,776 (94.0%) | 3,236 (83.6%) |
| 45 to 54 Years | 3,761 (94.4%) | 3,657 (87.1%) |
| 55 to 64 Years | 4,017 (87.0%) | 4,379 (89.7%) |
| 65 to 74 Years | 3,297 (97.2%) | 3,388 (92.4%) |
| 75 Years and over | 1,700 (92.2%) | 2,417 (87.9%) |
| Total | 27,531 (88.2%) | 27,660 (85.8%) |
Income Below Poverty Among Married-Couple Families in Salem County
The poverty statistics for married-couple families in Salem County show that 3.9% or 432 of the total 11,033 families live below the poverty line. Families with 3 or 4 children have the highest poverty rate of 16.7%, comprising of 131 families. On the other hand, families with 5 or more children have the lowest poverty rate of 0.0%, which includes 0 families.
| Children | Above Poverty | Below Poverty |
| No Children | 6,888 (96.6%) | 243 (3.4%) |
| 1 or 2 Children | 2,990 (98.1%) | 58 (1.9%) |
| 3 or 4 Children | 654 (83.3%) | 131 (16.7%) |
| 5 or more Children | 69 (100.0%) | 0 (0.0%) |
| Total | 10,601 (96.1%) | 432 (3.9%) |
Income Below Poverty Among Single-Parent Households in Salem County
According to the poverty data in Salem County, 5.9% or 76 single-father households and 26.0% or 916 single-mother households are living below the poverty line. Among single-father households, those with 3 or 4 children have the highest poverty rate, with 51 households (63.0%) experiencing poverty. Likewise, among single-mother households, those with 3 or 4 children have the highest poverty rate, with 162 households (54.5%) falling below the poverty line.
| Children | Single Father | Single Mother |
| No Children | 22 (4.1%) | 145 (9.8%) |
| 1 or 2 Children | 3 (0.4%) | 609 (35.0%) |
| 3 or 4 Children | 51 (63.0%) | 162 (54.5%) |
| 5 or more Children | 0 (0.0%) | 0 (0.0%) |
| Total | 76 (5.9%) | 916 (26.0%) |
Income Below Poverty Among Married-Couple vs Single-Parent Households in Salem County
The poverty data for Salem County shows that 432 of the married-couple family households (3.9%) and 992 of the single-parent households (20.6%) are living below the poverty level. Within the married-couple family households, those with 3 or 4 children have the highest poverty rate, with 131 households (16.7%) falling below the poverty line. Among the single-parent households, those with 3 or 4 children have the highest poverty rate, with 213 household (56.4%) living below poverty.
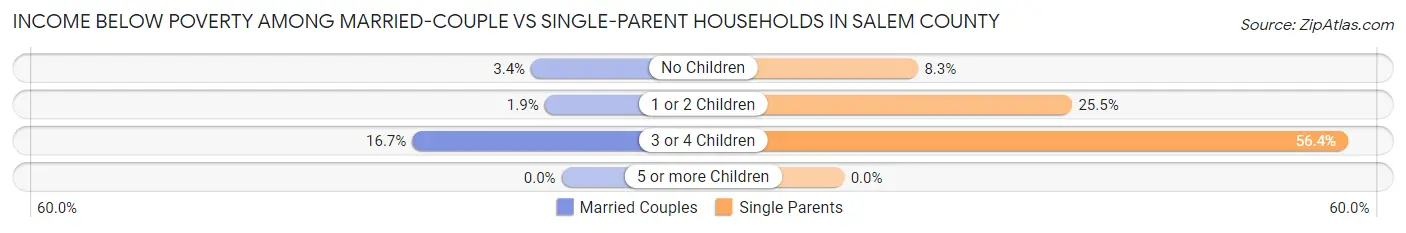
| Children | Married-Couple Families | Single-Parent Households |
| No Children | 243 (3.4%) | 167 (8.3%) |
| 1 or 2 Children | 58 (1.9%) | 612 (25.5%) |
| 3 or 4 Children | 131 (16.7%) | 213 (56.4%) |
| 5 or more Children | 0 (0.0%) | 0 (0.0%) |
| Total | 432 (3.9%) | 992 (20.6%) |
Employment Characteristics in Salem County
Employment by Class of Employer in Salem County
Among the 28,330 employed individuals in Salem County, private company employees (19,486 | 68.8%), local government employees (2,890 | 10.2%), and not-for-profit organizations (2,303 | 8.1%) make up the most common classes of employment.
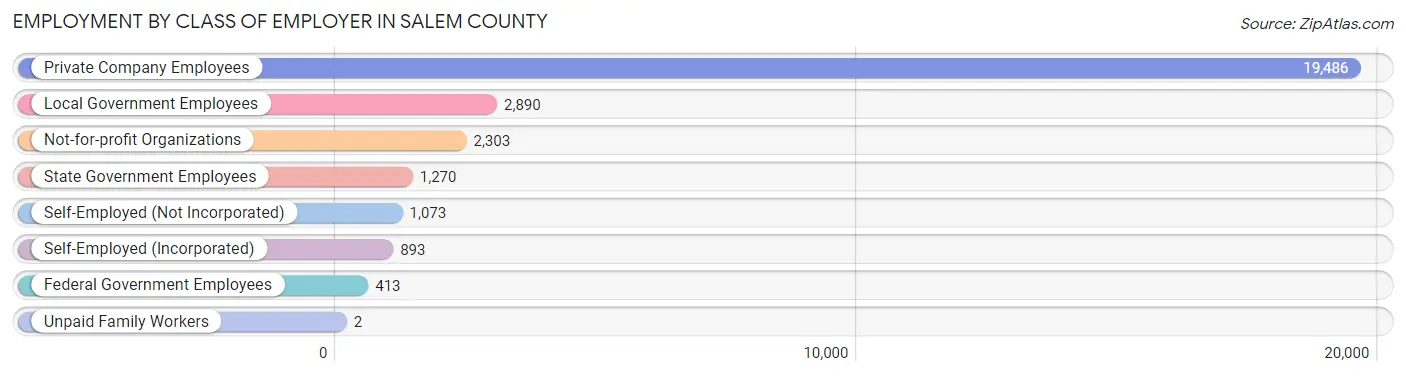
| Employer Class | # Employees | % Employees |
| Private Company Employees | 19,486 | 68.8% |
| Self-Employed (Incorporated) | 893 | 3.2% |
| Self-Employed (Not Incorporated) | 1,073 | 3.8% |
| Not-for-profit Organizations | 2,303 | 8.1% |
| Local Government Employees | 2,890 | 10.2% |
| State Government Employees | 1,270 | 4.5% |
| Federal Government Employees | 413 | 1.5% |
| Unpaid Family Workers | 2 | 0.0% |
| Total | 28,330 | 100.0% |
Employment Status by Age in Salem County
According to the labor force statistics for Salem County, out of the total population over 16 years of age (52,618), 60.5% or 31,834 individuals are in the labor force, with 8.0% or 2,547 of them unemployed. The age group with the highest labor force participation rate is 45 to 54 years, with 83.2% or 6,854 individuals in the labor force. Within the labor force, the 16 to 19 years age range has the highest percentage of unemployed individuals, with 20.9% or 222 of them being unemployed.
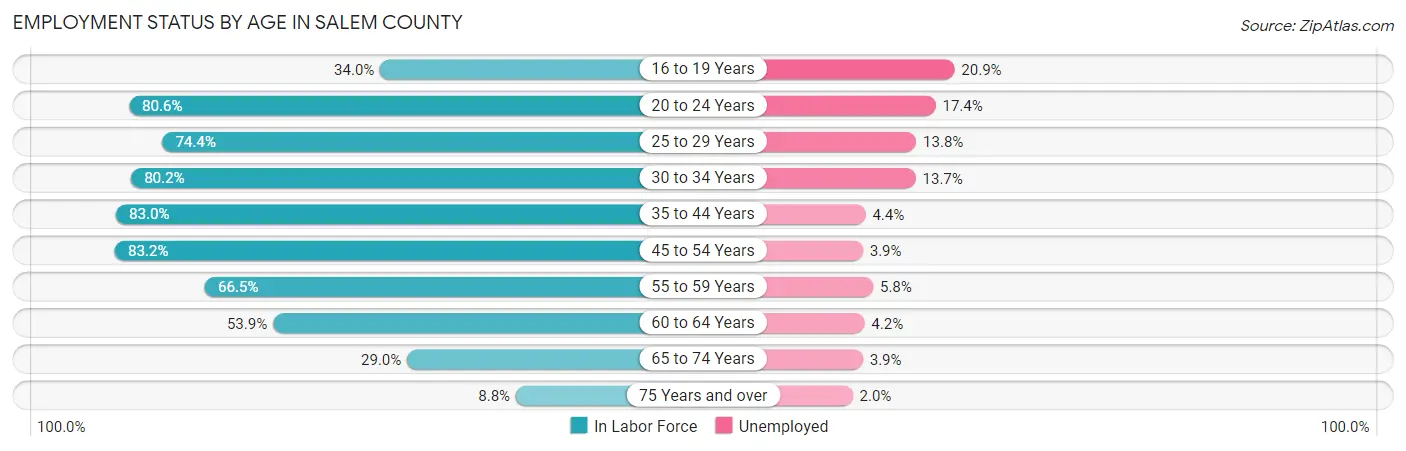
| Age Bracket | In Labor Force | Unemployed |
| 16 to 19 Years | 1,060 (34.0%) | 222 (20.9%) |
| 20 to 24 Years | 3,372 (80.6%) | 587 (17.4%) |
| 25 to 29 Years | 2,719 (74.4%) | 375 (13.8%) |
| 30 to 34 Years | 2,952 (80.2%) | 404 (13.7%) |
| 35 to 44 Years | 6,607 (83.0%) | 291 (4.4%) |
| 45 to 54 Years | 6,854 (83.2%) | 267 (3.9%) |
| 55 to 59 Years | 3,086 (66.5%) | 179 (5.8%) |
| 60 to 64 Years | 2,666 (53.9%) | 112 (4.2%) |
| 65 to 74 Years | 2,077 (29.0%) | 81 (3.9%) |
| 75 Years and over | 443 (8.8%) | 9 (2.0%) |
| Total | 31,834 (60.5%) | 2,547 (8.0%) |
Employment Status by Educational Attainment in Salem County
According to labor force statistics for Salem County, 75.1% of individuals (24,873) out of the total population between 25 and 64 years of age (33,120) are in the labor force, with 6.6% or 1,642 of them being unemployed. The group with the highest labor force participation rate are those with the educational attainment of bachelor's degree or higher, with 87.3% or 6,901 individuals in the labor force. Within the labor force, individuals with less than high school education have the highest percentage of unemployment, with 8.7% or 136 of them being unemployed.
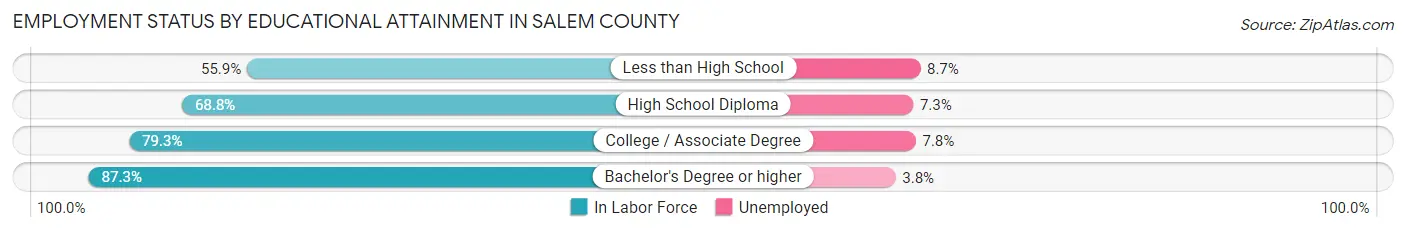
| Educational Attainment | In Labor Force | Unemployed |
| Less than High School | 1,565 (55.9%) | 244 (8.7%) |
| High School Diploma | 8,923 (68.8%) | 947 (7.3%) |
| College / Associate Degree | 7,491 (79.3%) | 737 (7.8%) |
| Bachelor's Degree or higher | 6,901 (87.3%) | 300 (3.8%) |
| Total | 24,873 (75.1%) | 2,186 (6.6%) |
Employment Occupations by Sex in Salem County
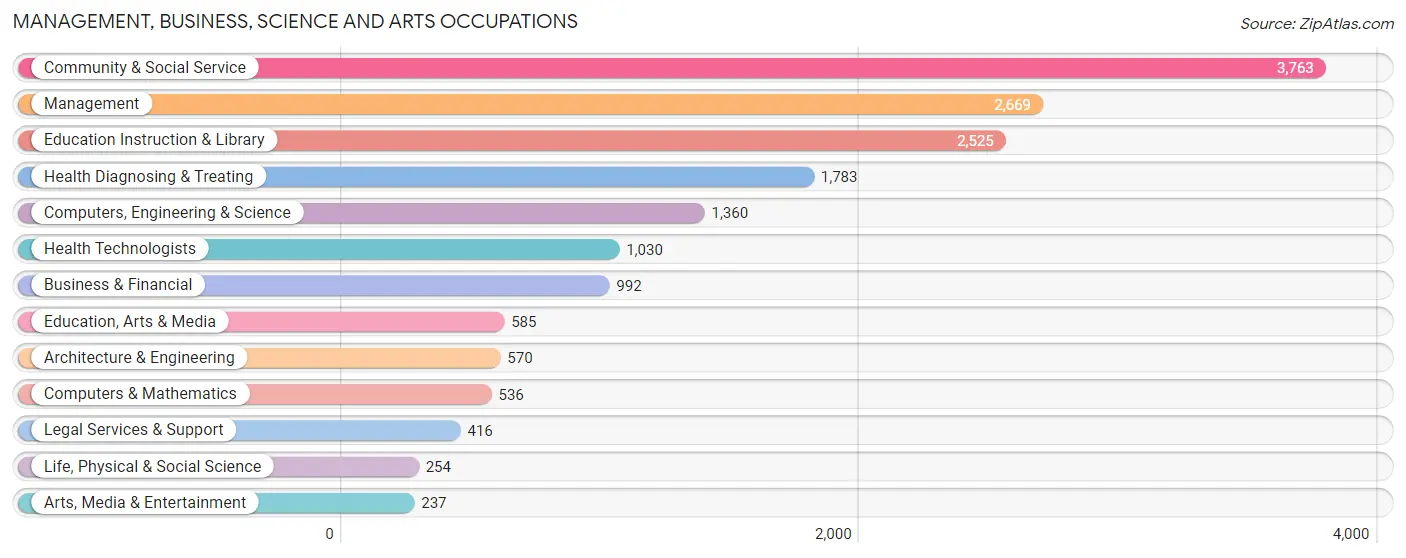
Management, Business, Science and Arts Occupations
The most common Management, Business, Science and Arts occupations in Salem County are Community & Social Service (3,763 | 12.9%), Management (2,669 | 9.1%), Education Instruction & Library (2,525 | 8.6%), Health Diagnosing & Treating (1,783 | 6.1%), and Computers, Engineering & Science (1,360 | 4.6%).
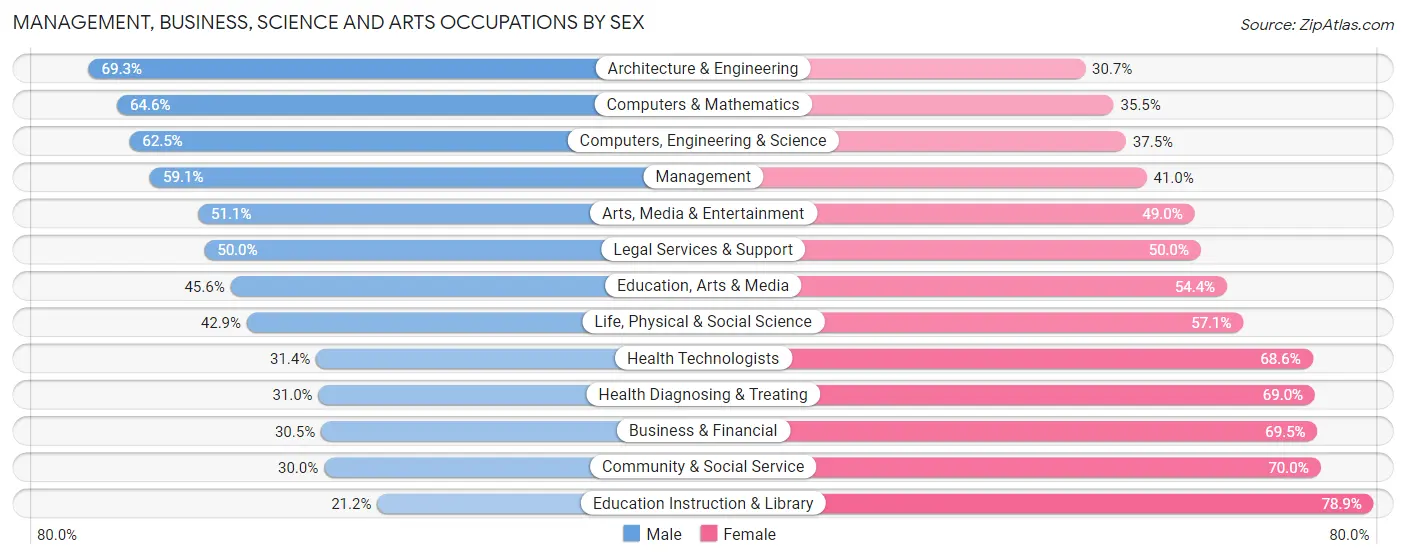
Management, Business, Science and Arts Occupations by Sex
Within the Management, Business, Science and Arts occupations in Salem County, the most male-oriented occupations are Architecture & Engineering (69.3%), Computers & Mathematics (64.5%), and Computers, Engineering & Science (62.5%), while the most female-oriented occupations are Education Instruction & Library (78.8%), Community & Social Service (70.0%), and Business & Financial (69.5%).
| Occupation | Male | Female |
| Management | 1,576 (59.1%) | 1,093 (40.9%) |
| Business & Financial | 303 (30.5%) | 689 (69.5%) |
| Computers, Engineering & Science | 850 (62.5%) | 510 (37.5%) |
| Computers & Mathematics | 346 (64.5%) | 190 (35.4%) |
| Architecture & Engineering | 395 (69.3%) | 175 (30.7%) |
| Life, Physical & Social Science | 109 (42.9%) | 145 (57.1%) |
| Community & Social Service | 1,130 (30.0%) | 2,633 (70.0%) |
| Education, Arts & Media | 267 (45.6%) | 318 (54.4%) |
| Legal Services & Support | 208 (50.0%) | 208 (50.0%) |
| Education Instruction & Library | 534 (21.1%) | 1,991 (78.8%) |
| Arts, Media & Entertainment | 121 (51.0%) | 116 (48.9%) |
| Health Diagnosing & Treating | 552 (31.0%) | 1,231 (69.0%) |
| Health Technologists | 323 (31.4%) | 707 (68.6%) |
| Total (Category) | 4,411 (41.7%) | 6,156 (58.3%) |
| Total (Overall) | 14,732 (50.3%) | 14,560 (49.7%) |
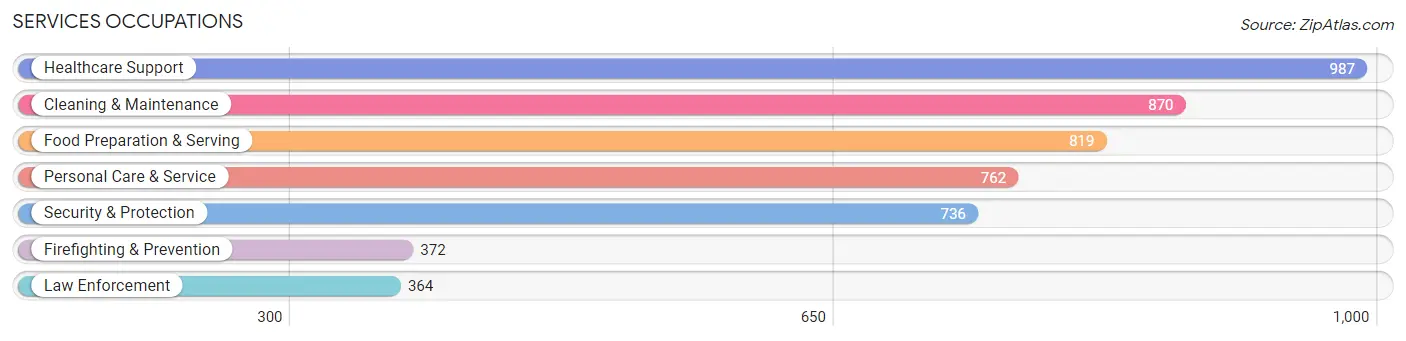
Services Occupations
The most common Services occupations in Salem County are Healthcare Support (987 | 3.4%), Cleaning & Maintenance (870 | 3.0%), Food Preparation & Serving (819 | 2.8%), Personal Care & Service (762 | 2.6%), and Security & Protection (736 | 2.5%).
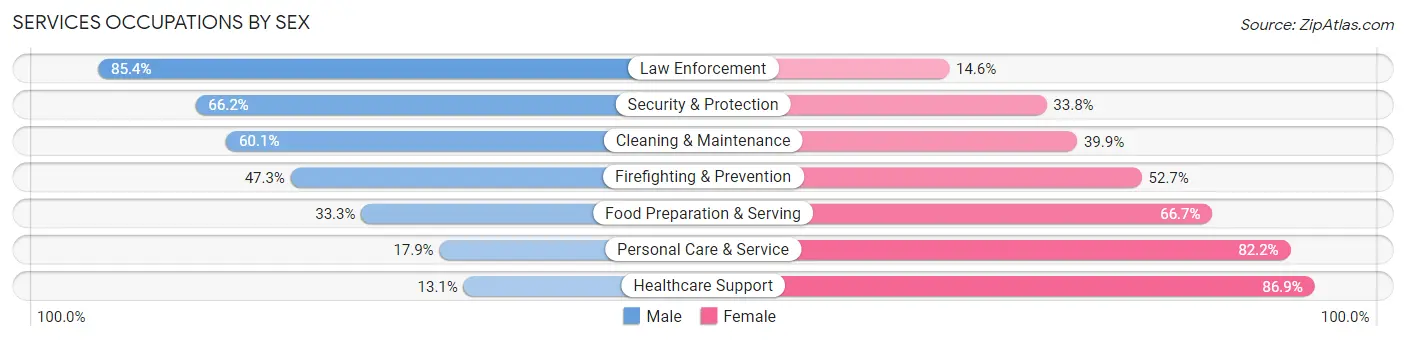
Services Occupations by Sex
Within the Services occupations in Salem County, the most male-oriented occupations are Law Enforcement (85.4%), Security & Protection (66.2%), and Cleaning & Maintenance (60.1%), while the most female-oriented occupations are Healthcare Support (86.9%), Personal Care & Service (82.2%), and Food Preparation & Serving (66.7%).
| Occupation | Male | Female |
| Healthcare Support | 129 (13.1%) | 858 (86.9%) |
| Security & Protection | 487 (66.2%) | 249 (33.8%) |
| Firefighting & Prevention | 176 (47.3%) | 196 (52.7%) |
| Law Enforcement | 311 (85.4%) | 53 (14.6%) |
| Food Preparation & Serving | 273 (33.3%) | 546 (66.7%) |
| Cleaning & Maintenance | 523 (60.1%) | 347 (39.9%) |
| Personal Care & Service | 136 (17.8%) | 626 (82.2%) |
| Total (Category) | 1,548 (37.1%) | 2,626 (62.9%) |
| Total (Overall) | 14,732 (50.3%) | 14,560 (49.7%) |
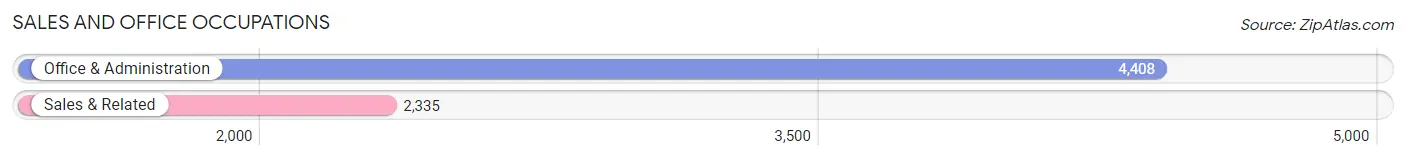
Sales and Office Occupations
The most common Sales and Office occupations in Salem County are Office & Administration (4,408 | 15.0%), and Sales & Related (2,335 | 8.0%).
Sales and Office Occupations by Sex
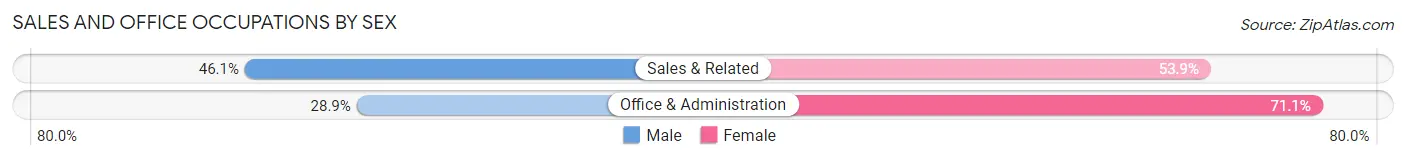
| Occupation | Male | Female |
| Sales & Related | 1,077 (46.1%) | 1,258 (53.9%) |
| Office & Administration | 1,275 (28.9%) | 3,133 (71.1%) |
| Total (Category) | 2,352 (34.9%) | 4,391 (65.1%) |
| Total (Overall) | 14,732 (50.3%) | 14,560 (49.7%) |
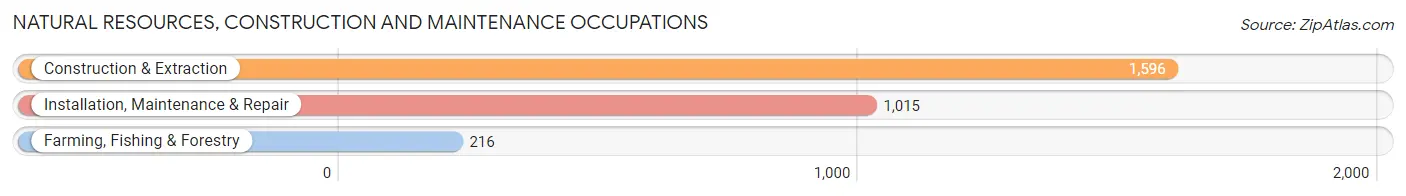
Natural Resources, Construction and Maintenance Occupations
The most common Natural Resources, Construction and Maintenance occupations in Salem County are Construction & Extraction (1,596 | 5.4%), Installation, Maintenance & Repair (1,015 | 3.5%), and Farming, Fishing & Forestry (216 | 0.7%).
Natural Resources, Construction and Maintenance Occupations by Sex
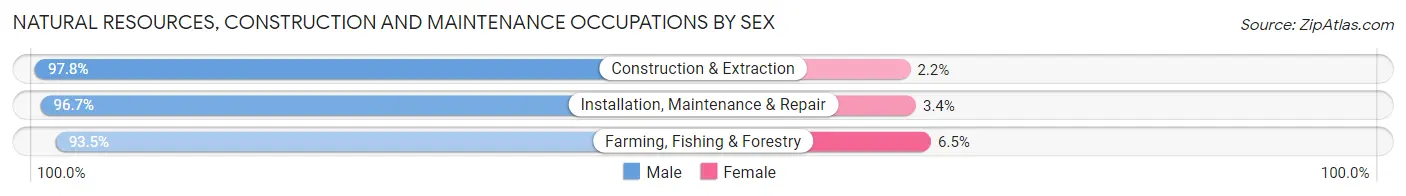
| Occupation | Male | Female |
| Farming, Fishing & Forestry | 202 (93.5%) | 14 (6.5%) |
| Construction & Extraction | 1,561 (97.8%) | 35 (2.2%) |
| Installation, Maintenance & Repair | 981 (96.7%) | 34 (3.4%) |
| Total (Category) | 2,744 (97.1%) | 83 (2.9%) |
| Total (Overall) | 14,732 (50.3%) | 14,560 (49.7%) |
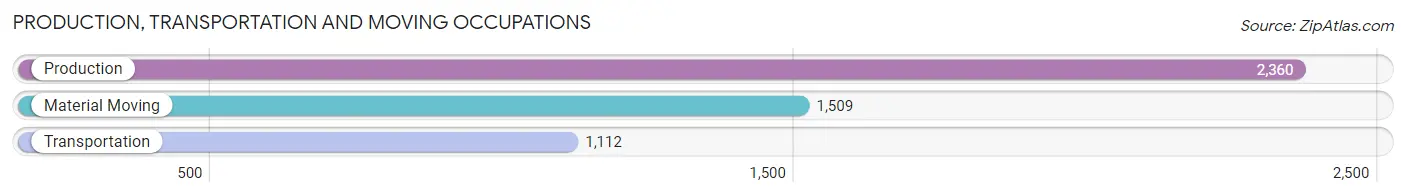
Production, Transportation and Moving Occupations
The most common Production, Transportation and Moving occupations in Salem County are Production (2,360 | 8.1%), Material Moving (1,509 | 5.1%), and Transportation (1,112 | 3.8%).
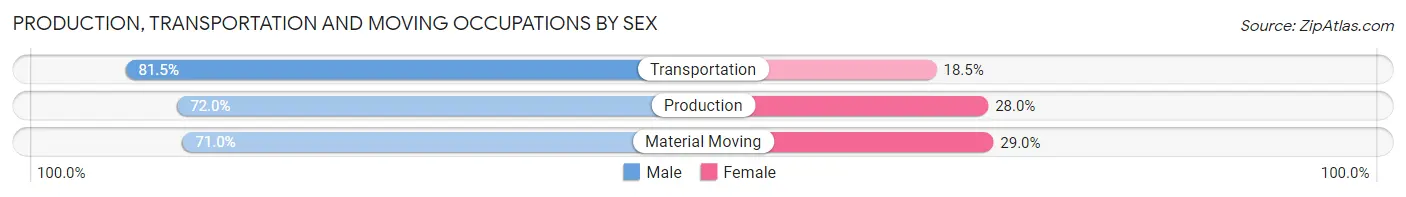
Production, Transportation and Moving Occupations by Sex
| Occupation | Male | Female |
| Production | 1,699 (72.0%) | 661 (28.0%) |
| Transportation | 906 (81.5%) | 206 (18.5%) |
| Material Moving | 1,072 (71.0%) | 437 (29.0%) |
| Total (Category) | 3,677 (73.8%) | 1,304 (26.2%) |
| Total (Overall) | 14,732 (50.3%) | 14,560 (49.7%) |
Employment Industries by Sex in Salem County
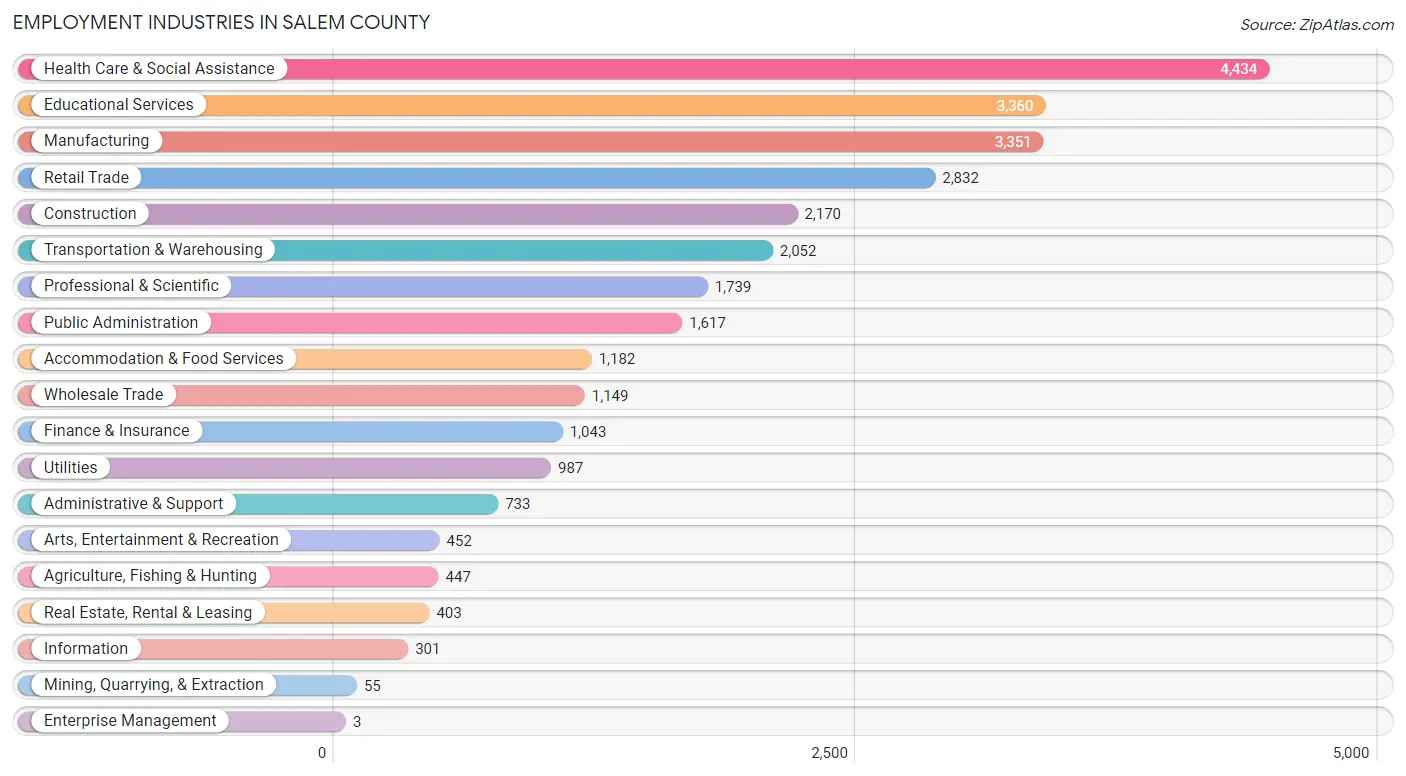
Employment Industries in Salem County
The major employment industries in Salem County include Health Care & Social Assistance (4,434 | 15.1%), Educational Services (3,360 | 11.5%), Manufacturing (3,351 | 11.4%), Retail Trade (2,832 | 9.7%), and Construction (2,170 | 7.4%).
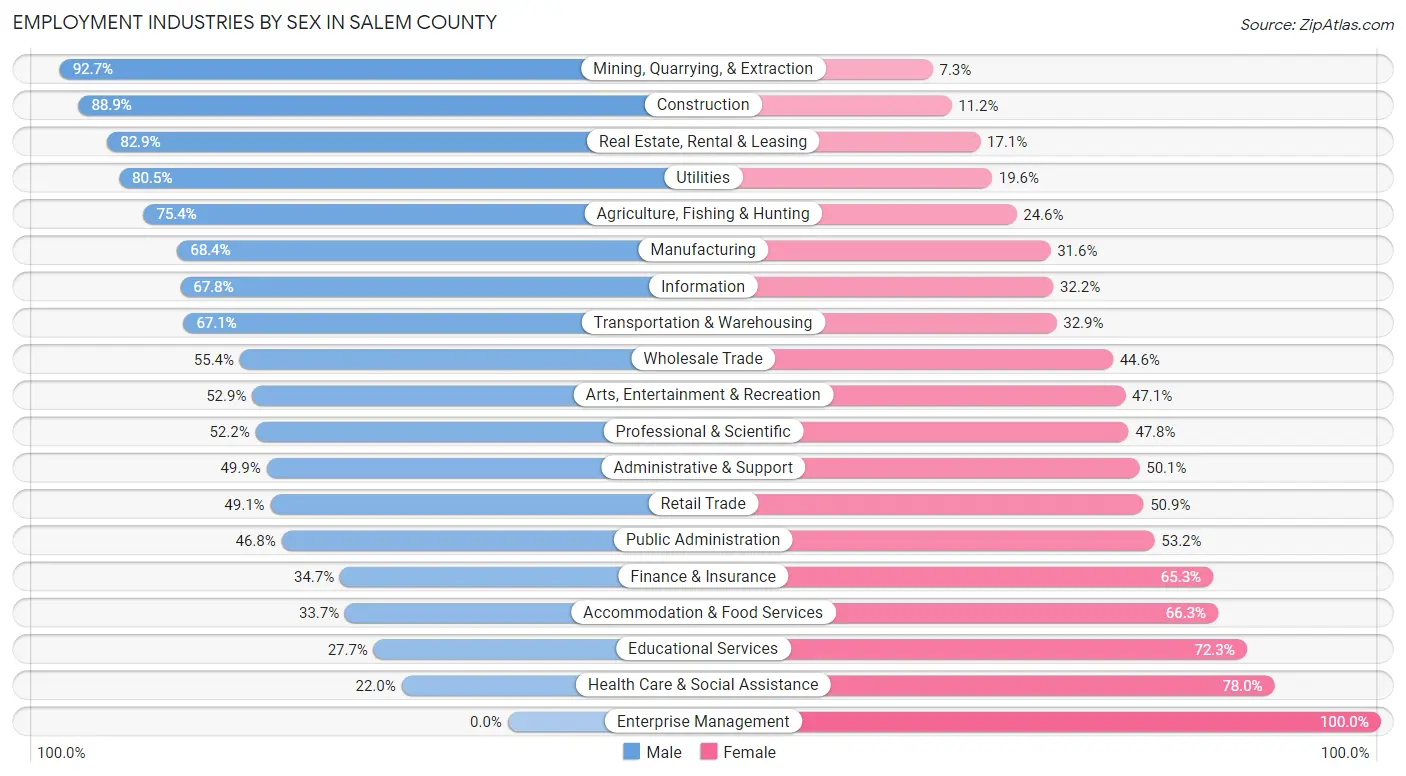
Employment Industries by Sex in Salem County
The Salem County industries that see more men than women are Mining, Quarrying, & Extraction (92.7%), Construction (88.8%), and Real Estate, Rental & Leasing (82.9%), whereas the industries that tend to have a higher number of women are Enterprise Management (100.0%), Health Care & Social Assistance (78.0%), and Educational Services (72.3%).
| Industry | Male | Female |
| Agriculture, Fishing & Hunting | 337 (75.4%) | 110 (24.6%) |
| Mining, Quarrying, & Extraction | 51 (92.7%) | 4 (7.3%) |
| Construction | 1,928 (88.8%) | 242 (11.2%) |
| Manufacturing | 2,291 (68.4%) | 1,060 (31.6%) |
| Wholesale Trade | 637 (55.4%) | 512 (44.6%) |
| Retail Trade | 1,391 (49.1%) | 1,441 (50.9%) |
| Transportation & Warehousing | 1,377 (67.1%) | 675 (32.9%) |
| Utilities | 794 (80.4%) | 193 (19.6%) |
| Information | 204 (67.8%) | 97 (32.2%) |
| Finance & Insurance | 362 (34.7%) | 681 (65.3%) |
| Real Estate, Rental & Leasing | 334 (82.9%) | 69 (17.1%) |
| Professional & Scientific | 908 (52.2%) | 831 (47.8%) |
| Enterprise Management | 0 (0.0%) | 3 (100.0%) |
| Administrative & Support | 366 (49.9%) | 367 (50.1%) |
| Educational Services | 932 (27.7%) | 2,428 (72.3%) |
| Health Care & Social Assistance | 974 (22.0%) | 3,460 (78.0%) |
| Arts, Entertainment & Recreation | 239 (52.9%) | 213 (47.1%) |
| Accommodation & Food Services | 398 (33.7%) | 784 (66.3%) |
| Public Administration | 757 (46.8%) | 860 (53.2%) |
| Total | 14,732 (50.3%) | 14,560 (49.7%) |
Education in Salem County
School Enrollment in Salem County
The most common levels of schooling among the 14,662 students in Salem County are middle school (3,553 | 24.2%), high school (3,253 | 22.2%), and college / undergraduate (2,965 | 20.2%).
| School Level | # Students | % Students |
| Nursery / Preschool | 804 | 5.5% |
| Kindergarten | 827 | 5.6% |
| Elementary School | 2,805 | 19.1% |
| Middle School | 3,553 | 24.2% |
| High School | 3,253 | 22.2% |
| College / Undergraduate | 2,965 | 20.2% |
| Graduate / Professional | 455 | 3.1% |
| Total | 14,662 | 100.0% |
School Enrollment by Age by Funding Source in Salem County
Out of a total of 14,662 students who are enrolled in schools in Salem County, 1,965 (13.4%) attend a private institution, while the remaining 12,697 (86.6%) are enrolled in public schools. The age group of 25 to 34 year olds has the highest likelihood of being enrolled in private schools, with 217 (34.1% in the age bracket) enrolled. Conversely, the age group of 15 to 17 year olds has the lowest likelihood of being enrolled in a private school, with 2,270 (92.6% in the age bracket) attending a public institution.
| Age Bracket | Public School | Private School |
| 3 to 4 Year Olds | 532 (74.9%) | 178 (25.1%) |
| 5 to 9 Year Old | 3,117 (91.6%) | 287 (8.4%) |
| 10 to 14 Year Olds | 3,874 (91.0%) | 383 (9.0%) |
| 15 to 17 Year Olds | 2,270 (92.6%) | 180 (7.3%) |
| 18 to 19 Year Olds | 790 (80.0%) | 197 (20.0%) |
| 20 to 24 Year Olds | 1,393 (79.4%) | 361 (20.6%) |
| 25 to 34 Year Olds | 420 (65.9%) | 217 (34.1%) |
| 35 Years and over | 307 (66.3%) | 156 (33.7%) |
| Total | 12,697 (86.6%) | 1,965 (13.4%) |
Educational Attainment by Field of Study in Salem County
Education (1,914 | 17.0%), business (1,732 | 15.4%), science & technology (1,233 | 10.9%), arts & humanities (754 | 6.7%), and psychology (741 | 6.6%) are the most common fields of study among 11,271 individuals in Salem County who have obtained a bachelor's degree or higher.
| Field of Study | # Graduates | % Graduates |
| Computers & Mathematics | 457 | 4.1% |
| Bio, Nature & Agricultural | 665 | 5.9% |
| Physical & Health Sciences | 409 | 3.6% |
| Psychology | 741 | 6.6% |
| Social Sciences | 726 | 6.4% |
| Engineering | 606 | 5.4% |
| Multidisciplinary Studies | 165 | 1.5% |
| Science & Technology | 1,233 | 10.9% |
| Business | 1,732 | 15.4% |
| Education | 1,914 | 17.0% |
| Literature & Languages | 377 | 3.3% |
| Liberal Arts & History | 546 | 4.8% |
| Visual & Performing Arts | 401 | 3.6% |
| Communications | 545 | 4.8% |
| Arts & Humanities | 754 | 6.7% |
| Total | 11,271 | 100.0% |
Transportation & Commute in Salem County
Vehicle Availability by Sex in Salem County
The most prevalent vehicle ownership categories in Salem County are males with 2 vehicles (5,294, accounting for 37.2%) and females with 2 vehicles (5,281, making up 37.9%).
| Vehicles Available | Male | Female |
| No Vehicle | 608 (4.3%) | 553 (4.0%) |
| 1 Vehicle | 1,797 (12.6%) | 2,662 (19.0%) |
| 2 Vehicles | 5,294 (37.2%) | 5,281 (37.8%) |
| 3 Vehicles | 3,851 (27.1%) | 3,367 (24.1%) |
| 4 Vehicles | 1,893 (13.3%) | 1,611 (11.5%) |
| 5 or more Vehicles | 793 (5.6%) | 506 (3.6%) |
| Total | 14,236 (100.0%) | 13,980 (100.0%) |
Commute Time in Salem County
The most frequently occuring commute durations in Salem County are 20 to 24 minutes (3,648 commuters, 13.9%), 30 to 34 minutes (3,639 commuters, 13.9%), and 15 to 19 minutes (3,517 commuters, 13.4%).
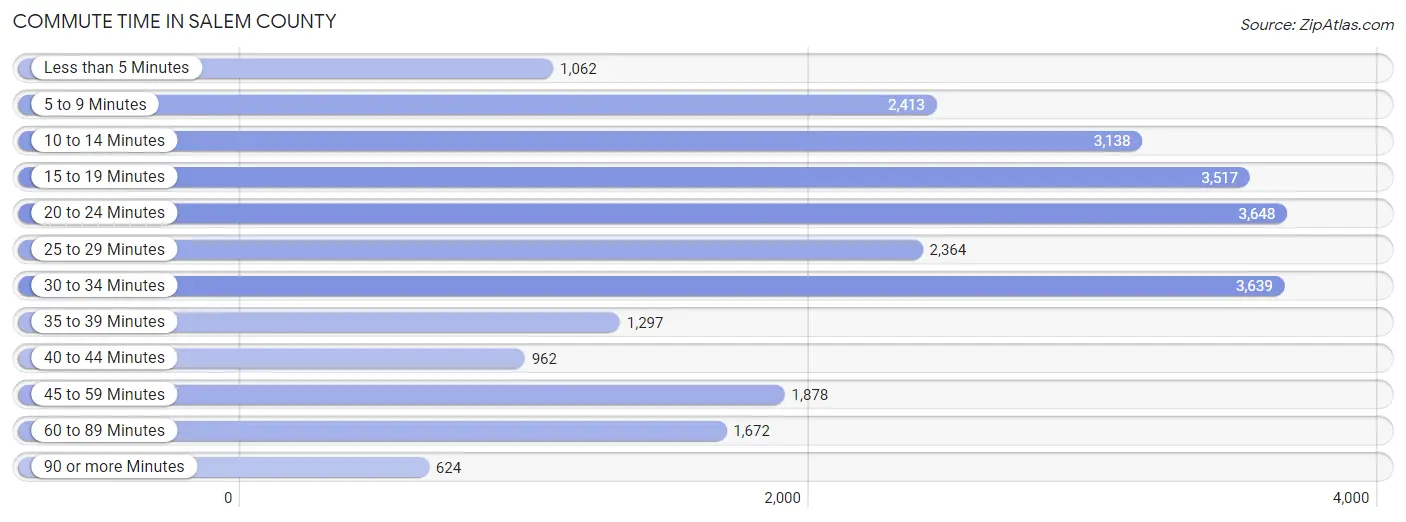
| Commute Time | # Commuters | % Commuters |
| Less than 5 Minutes | 1,062 | 4.1% |
| 5 to 9 Minutes | 2,413 | 9.2% |
| 10 to 14 Minutes | 3,138 | 12.0% |
| 15 to 19 Minutes | 3,517 | 13.4% |
| 20 to 24 Minutes | 3,648 | 13.9% |
| 25 to 29 Minutes | 2,364 | 9.0% |
| 30 to 34 Minutes | 3,639 | 13.9% |
| 35 to 39 Minutes | 1,297 | 5.0% |
| 40 to 44 Minutes | 962 | 3.7% |
| 45 to 59 Minutes | 1,878 | 7.2% |
| 60 to 89 Minutes | 1,672 | 6.4% |
| 90 or more Minutes | 624 | 2.4% |
Commute Time by Sex in Salem County
The most common commute times in Salem County are 30 to 34 minutes (1,861 commuters, 13.9%) for males and 20 to 24 minutes (1,835 commuters, 14.3%) for females.
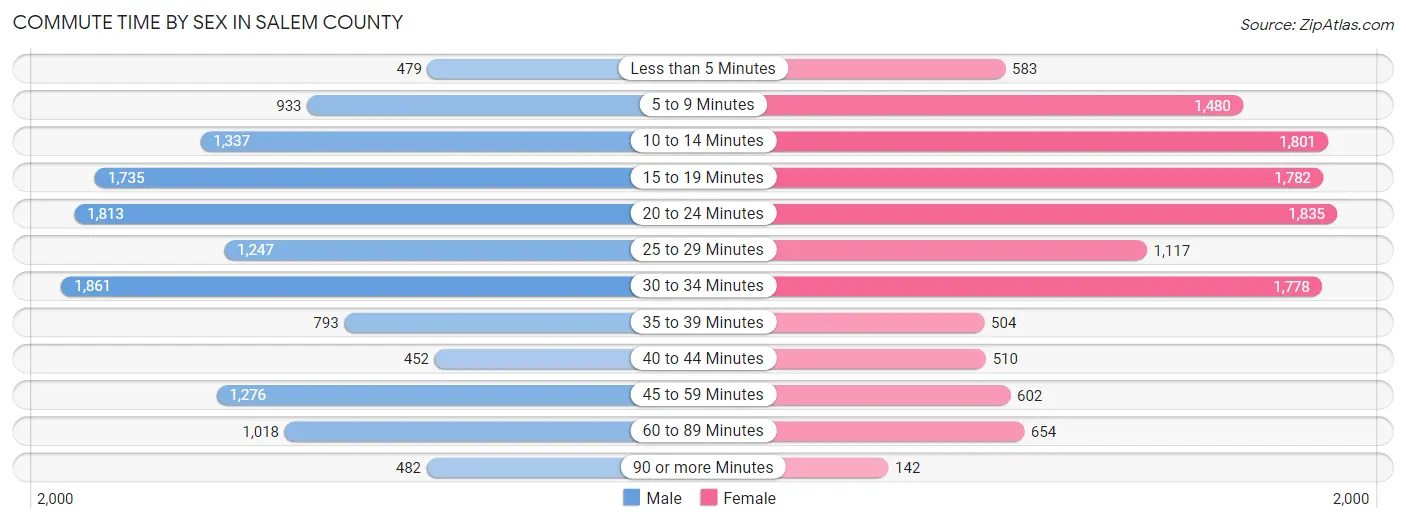
| Commute Time | Male | Female |
| Less than 5 Minutes | 479 (3.6%) | 583 (4.6%) |
| 5 to 9 Minutes | 933 (7.0%) | 1,480 (11.6%) |
| 10 to 14 Minutes | 1,337 (10.0%) | 1,801 (14.1%) |
| 15 to 19 Minutes | 1,735 (12.9%) | 1,782 (13.9%) |
| 20 to 24 Minutes | 1,813 (13.5%) | 1,835 (14.3%) |
| 25 to 29 Minutes | 1,247 (9.3%) | 1,117 (8.7%) |
| 30 to 34 Minutes | 1,861 (13.9%) | 1,778 (13.9%) |
| 35 to 39 Minutes | 793 (5.9%) | 504 (3.9%) |
| 40 to 44 Minutes | 452 (3.4%) | 510 (4.0%) |
| 45 to 59 Minutes | 1,276 (9.5%) | 602 (4.7%) |
| 60 to 89 Minutes | 1,018 (7.6%) | 654 (5.1%) |
| 90 or more Minutes | 482 (3.6%) | 142 (1.1%) |
Time of Departure to Work by Sex in Salem County
The most frequent times of departure to work in Salem County are 6:30 AM to 6:59 AM (1,839, 13.7%) for males and 7:30 AM to 7:59 AM (2,247, 17.6%) for females.
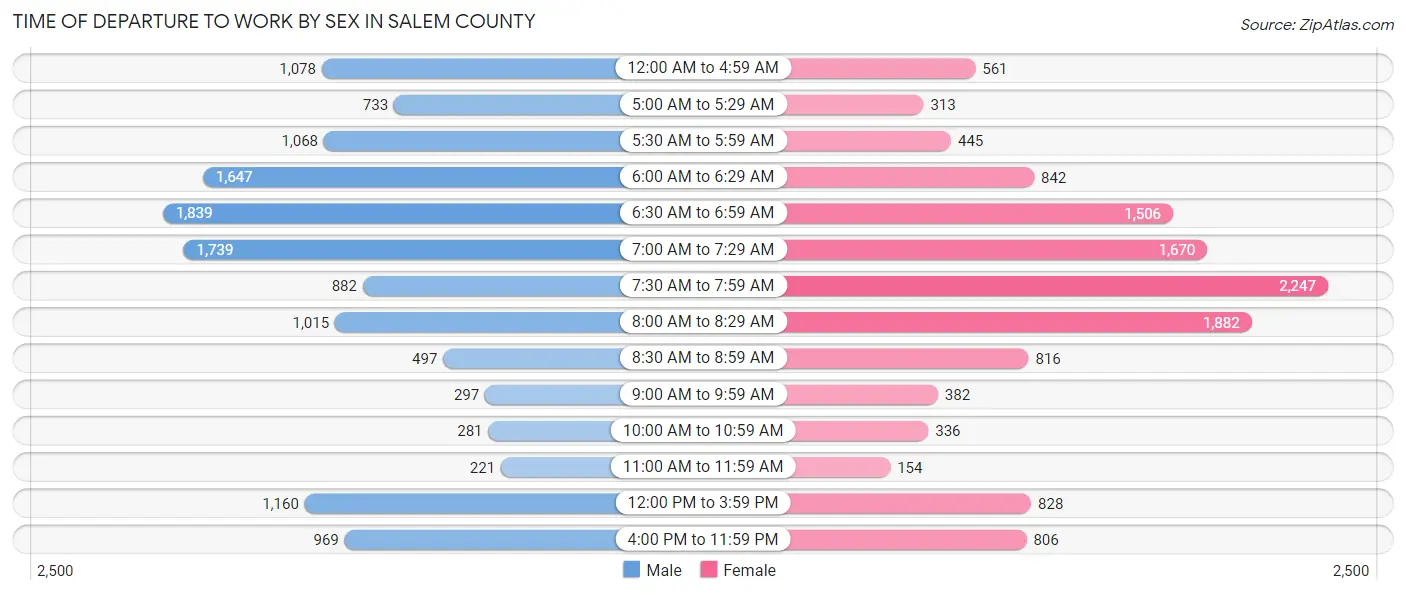
| Time of Departure | Male | Female |
| 12:00 AM to 4:59 AM | 1,078 (8.0%) | 561 (4.4%) |
| 5:00 AM to 5:29 AM | 733 (5.5%) | 313 (2.5%) |
| 5:30 AM to 5:59 AM | 1,068 (8.0%) | 445 (3.5%) |
| 6:00 AM to 6:29 AM | 1,647 (12.3%) | 842 (6.6%) |
| 6:30 AM to 6:59 AM | 1,839 (13.7%) | 1,506 (11.8%) |
| 7:00 AM to 7:29 AM | 1,739 (13.0%) | 1,670 (13.1%) |
| 7:30 AM to 7:59 AM | 882 (6.6%) | 2,247 (17.6%) |
| 8:00 AM to 8:29 AM | 1,015 (7.6%) | 1,882 (14.7%) |
| 8:30 AM to 8:59 AM | 497 (3.7%) | 816 (6.4%) |
| 9:00 AM to 9:59 AM | 297 (2.2%) | 382 (3.0%) |
| 10:00 AM to 10:59 AM | 281 (2.1%) | 336 (2.6%) |
| 11:00 AM to 11:59 AM | 221 (1.7%) | 154 (1.2%) |
| 12:00 PM to 3:59 PM | 1,160 (8.6%) | 828 (6.5%) |
| 4:00 PM to 11:59 PM | 969 (7.2%) | 806 (6.3%) |
| Total | 13,426 (100.0%) | 12,788 (100.0%) |
Housing Occupancy in Salem County
Occupancy by Ownership in Salem County
Of the total 24,744 dwellings in Salem County, owner-occupied units account for 17,474 (70.6%), while renter-occupied units make up 7,270 (29.4%).
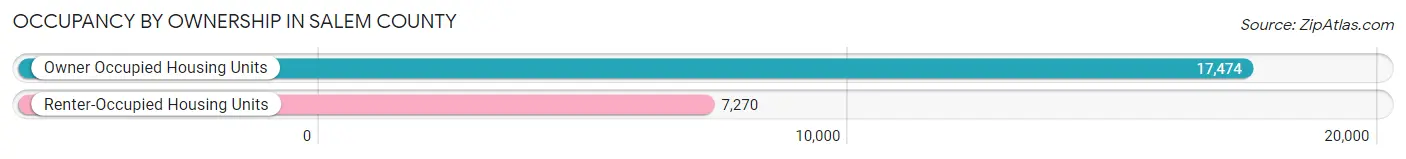
| Occupancy | # Housing Units | % Housing Units |
| Owner Occupied Housing Units | 17,474 | 70.6% |
| Renter-Occupied Housing Units | 7,270 | 29.4% |
| Total Occupied Housing Units | 24,744 | 100.0% |
Occupancy by Household Size in Salem County
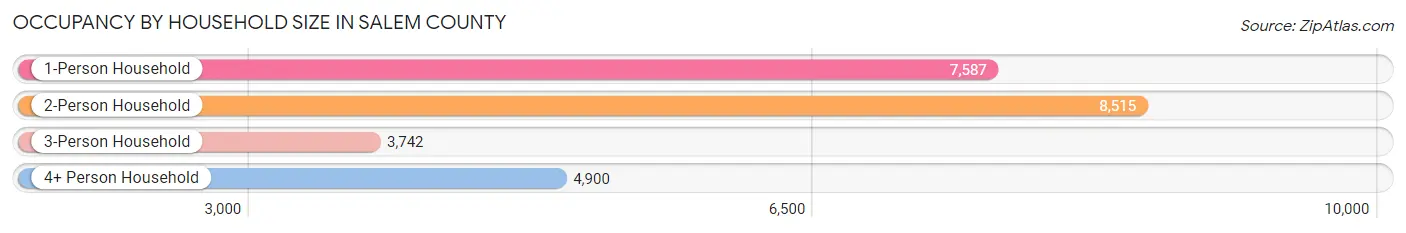
| Household Size | # Housing Units | % Housing Units |
| 1-Person Household | 7,587 | 30.7% |
| 2-Person Household | 8,515 | 34.4% |
| 3-Person Household | 3,742 | 15.1% |
| 4+ Person Household | 4,900 | 19.8% |
| Total Housing Units | 24,744 | 100.0% |
Occupancy by Ownership by Household Size in Salem County
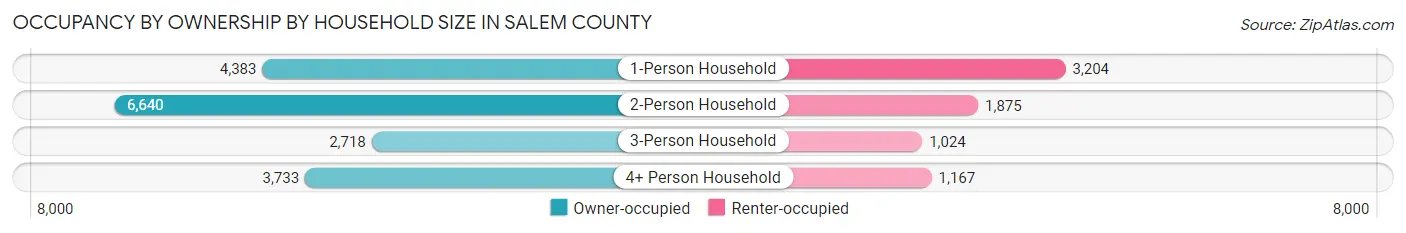
| Household Size | Owner-occupied | Renter-occupied |
| 1-Person Household | 4,383 (57.8%) | 3,204 (42.2%) |
| 2-Person Household | 6,640 (78.0%) | 1,875 (22.0%) |
| 3-Person Household | 2,718 (72.6%) | 1,024 (27.4%) |
| 4+ Person Household | 3,733 (76.2%) | 1,167 (23.8%) |
| Total Housing Units | 17,474 (70.6%) | 7,270 (29.4%) |
Occupancy by Educational Attainment in Salem County
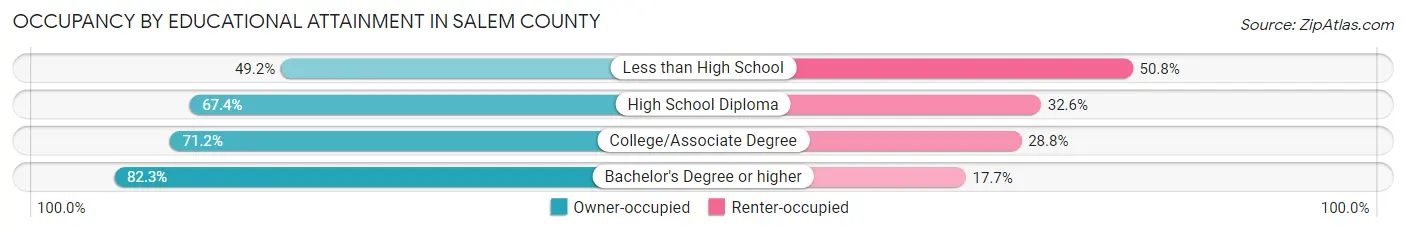
| Household Size | Owner-occupied | Renter-occupied |
| Less than High School | 1,185 (49.2%) | 1,225 (50.8%) |
| High School Diploma | 5,690 (67.4%) | 2,757 (32.6%) |
| College/Associate Degree | 5,337 (71.2%) | 2,155 (28.8%) |
| Bachelor's Degree or higher | 5,262 (82.3%) | 1,133 (17.7%) |
Occupancy by Age of Householder in Salem County
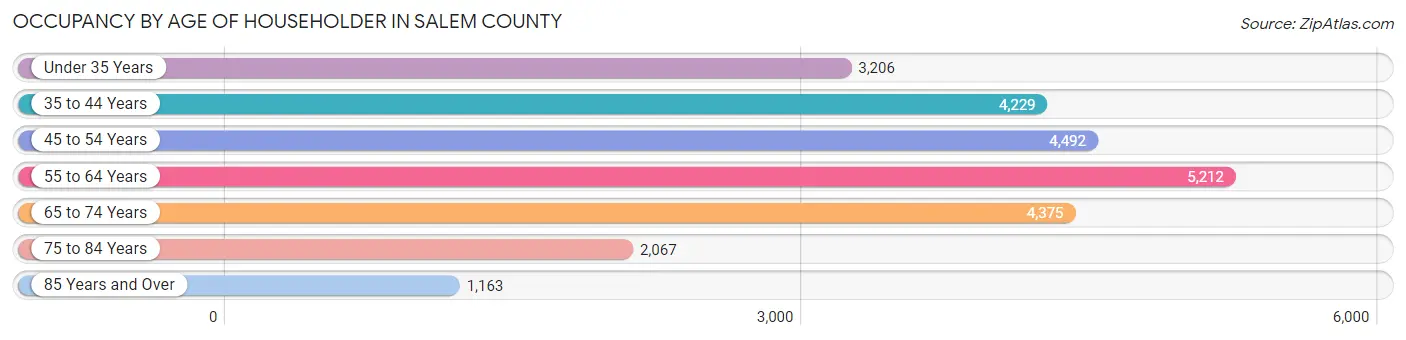
| Age Bracket | # Households | % Households |
| Under 35 Years | 3,206 | 13.0% |
| 35 to 44 Years | 4,229 | 17.1% |
| 45 to 54 Years | 4,492 | 18.1% |
| 55 to 64 Years | 5,212 | 21.1% |
| 65 to 74 Years | 4,375 | 17.7% |
| 75 to 84 Years | 2,067 | 8.4% |
| 85 Years and Over | 1,163 | 4.7% |
| Total | 24,744 | 100.0% |
Housing Finances in Salem County
Median Income by Occupancy in Salem County
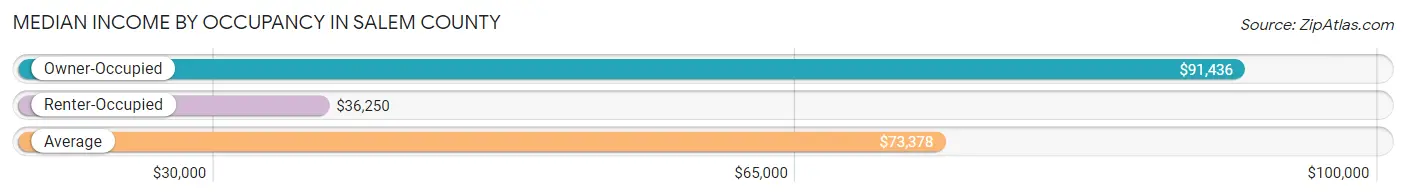
| Occupancy Type | # Households | Median Income |
| Owner-Occupied | 17,474 (70.6%) | $91,436 |
| Renter-Occupied | 7,270 (29.4%) | $36,250 |
| Average | 24,744 (100.0%) | $73,378 |
Occupancy by Householder Income Bracket in Salem County
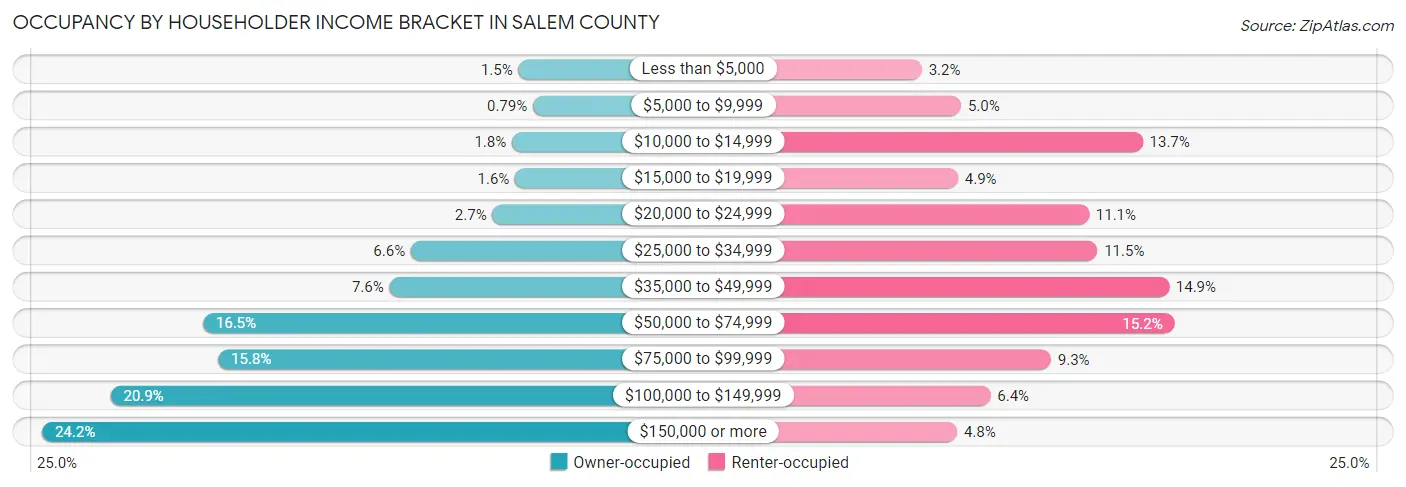
| Income Bracket | Owner-occupied | Renter-occupied |
| Less than $5,000 | 258 (1.5%) | 229 (3.2%) |
| $5,000 to $9,999 | 138 (0.8%) | 365 (5.0%) |
| $10,000 to $14,999 | 312 (1.8%) | 994 (13.7%) |
| $15,000 to $19,999 | 286 (1.6%) | 354 (4.9%) |
| $20,000 to $24,999 | 475 (2.7%) | 808 (11.1%) |
| $25,000 to $34,999 | 1,153 (6.6%) | 837 (11.5%) |
| $35,000 to $49,999 | 1,331 (7.6%) | 1,085 (14.9%) |
| $50,000 to $74,999 | 2,885 (16.5%) | 1,104 (15.2%) |
| $75,000 to $99,999 | 2,759 (15.8%) | 676 (9.3%) |
| $100,000 to $149,999 | 3,653 (20.9%) | 467 (6.4%) |
| $150,000 or more | 4,224 (24.2%) | 351 (4.8%) |
| Total | 17,474 (100.0%) | 7,270 (100.0%) |
Monthly Housing Cost Tiers in Salem County
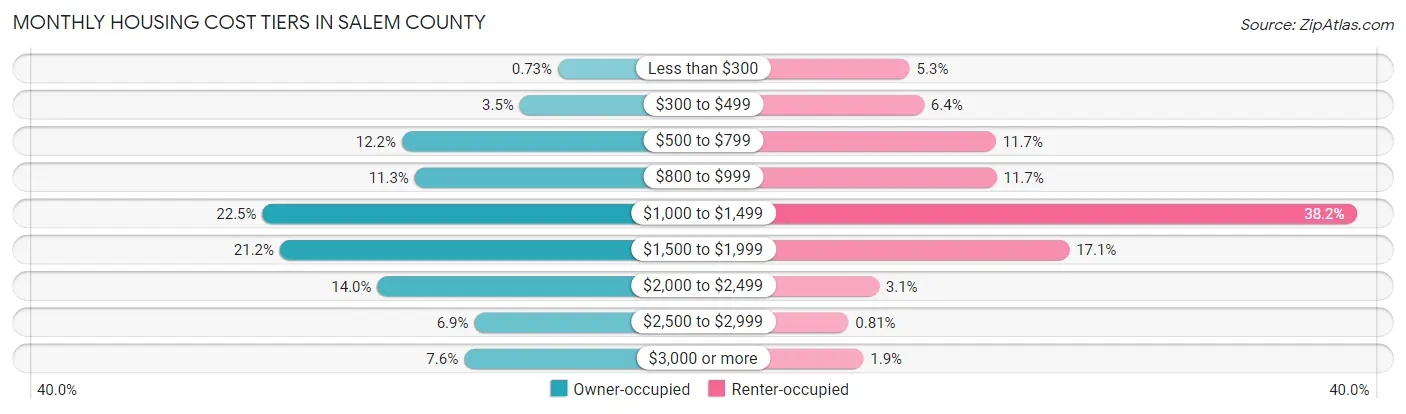
| Monthly Cost | Owner-occupied | Renter-occupied |
| Less than $300 | 128 (0.7%) | 387 (5.3%) |
| $300 to $499 | 619 (3.5%) | 463 (6.4%) |
| $500 to $799 | 2,135 (12.2%) | 848 (11.7%) |
| $800 to $999 | 1,970 (11.3%) | 852 (11.7%) |
| $1,000 to $1,499 | 3,930 (22.5%) | 2,778 (38.2%) |
| $1,500 to $1,999 | 3,705 (21.2%) | 1,241 (17.1%) |
| $2,000 to $2,499 | 2,449 (14.0%) | 222 (3.0%) |
| $2,500 to $2,999 | 1,203 (6.9%) | 59 (0.8%) |
| $3,000 or more | 1,335 (7.6%) | 139 (1.9%) |
| Total | 17,474 (100.0%) | 7,270 (100.0%) |
Physical Housing Characteristics in Salem County
Housing Structures in Salem County
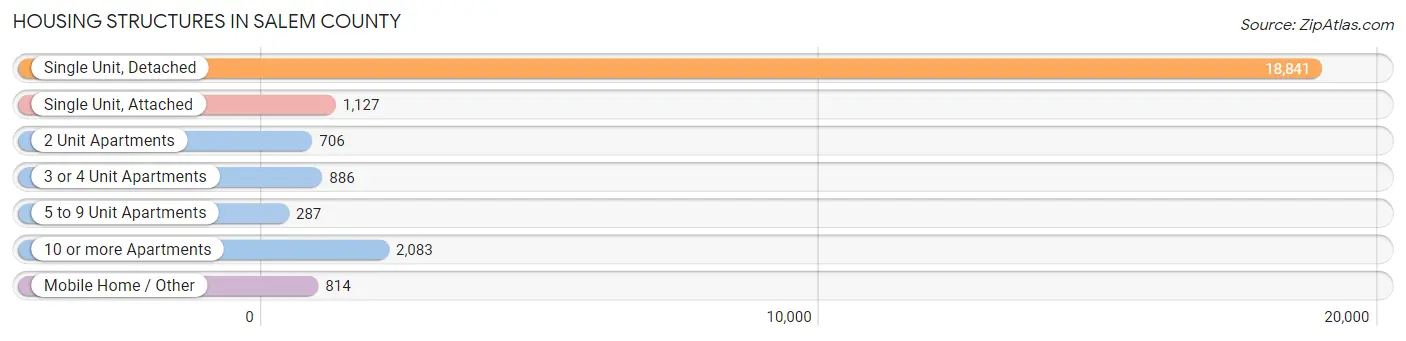
| Structure Type | # Housing Units | % Housing Units |
| Single Unit, Detached | 18,841 | 76.1% |
| Single Unit, Attached | 1,127 | 4.5% |
| 2 Unit Apartments | 706 | 2.9% |
| 3 or 4 Unit Apartments | 886 | 3.6% |
| 5 to 9 Unit Apartments | 287 | 1.2% |
| 10 or more Apartments | 2,083 | 8.4% |
| Mobile Home / Other | 814 | 3.3% |
| Total | 24,744 | 100.0% |
Housing Structures by Occupancy in Salem County
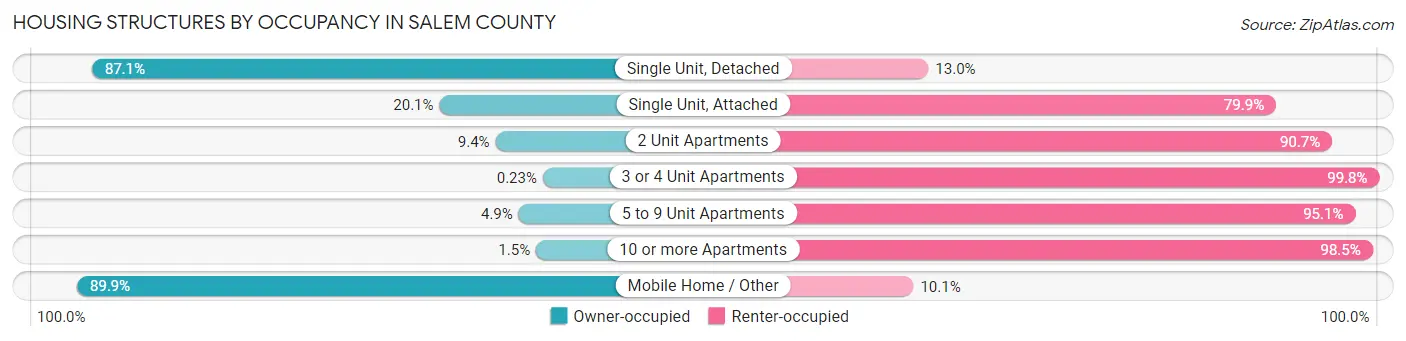
| Structure Type | Owner-occupied | Renter-occupied |
| Single Unit, Detached | 16,401 (87.1%) | 2,440 (13.0%) |
| Single Unit, Attached | 227 (20.1%) | 900 (79.9%) |
| 2 Unit Apartments | 66 (9.3%) | 640 (90.6%) |
| 3 or 4 Unit Apartments | 2 (0.2%) | 884 (99.8%) |
| 5 to 9 Unit Apartments | 14 (4.9%) | 273 (95.1%) |
| 10 or more Apartments | 32 (1.5%) | 2,051 (98.5%) |
| Mobile Home / Other | 732 (89.9%) | 82 (10.1%) |
| Total | 17,474 (70.6%) | 7,270 (29.4%) |
Housing Structures by Number of Rooms in Salem County
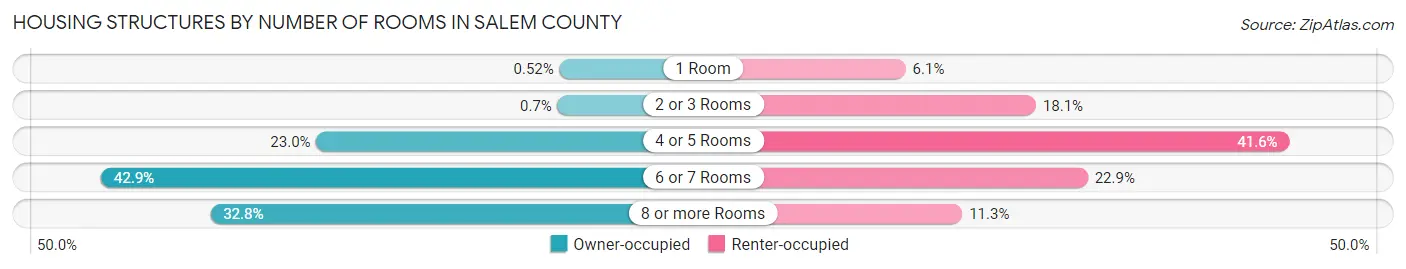
| Number of Rooms | Owner-occupied | Renter-occupied |
| 1 Room | 90 (0.5%) | 442 (6.1%) |
| 2 or 3 Rooms | 123 (0.7%) | 1,318 (18.1%) |
| 4 or 5 Rooms | 4,020 (23.0%) | 3,022 (41.6%) |
| 6 or 7 Rooms | 7,504 (42.9%) | 1,666 (22.9%) |
| 8 or more Rooms | 5,737 (32.8%) | 822 (11.3%) |
| Total | 17,474 (100.0%) | 7,270 (100.0%) |
Housing Structure by Heating Type in Salem County
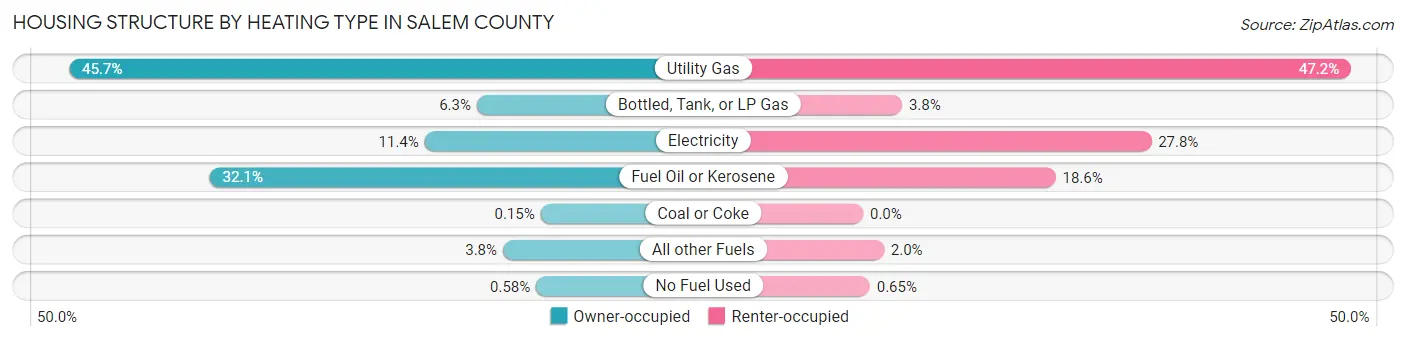
| Heating Type | Owner-occupied | Renter-occupied |
| Utility Gas | 7,986 (45.7%) | 3,428 (47.1%) |
| Bottled, Tank, or LP Gas | 1,102 (6.3%) | 273 (3.8%) |
| Electricity | 1,983 (11.4%) | 2,024 (27.8%) |
| Fuel Oil or Kerosene | 5,612 (32.1%) | 1,352 (18.6%) |
| Coal or Coke | 26 (0.2%) | 0 (0.0%) |
| All other Fuels | 663 (3.8%) | 146 (2.0%) |
| No Fuel Used | 102 (0.6%) | 47 (0.6%) |
| Total | 17,474 (100.0%) | 7,270 (100.0%) |
Household Vehicle Usage in Salem County
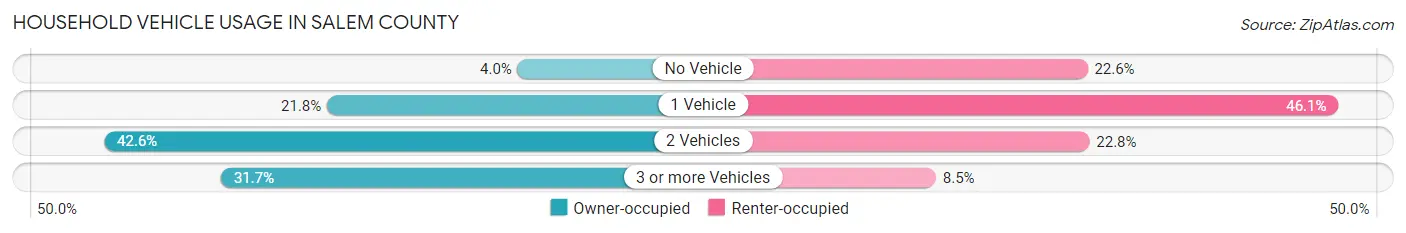
| Vehicles per Household | Owner-occupied | Renter-occupied |
| No Vehicle | 693 (4.0%) | 1,646 (22.6%) |
| 1 Vehicle | 3,803 (21.8%) | 3,348 (46.1%) |
| 2 Vehicles | 7,442 (42.6%) | 1,659 (22.8%) |
| 3 or more Vehicles | 5,536 (31.7%) | 617 (8.5%) |
| Total | 17,474 (100.0%) | 7,270 (100.0%) |
Real Estate & Mortgages in Salem County
Real Estate and Mortgage Overview in Salem County
| Characteristic | Without Mortgage | With Mortgage |
| Housing Units | 7,440 | 10,034 |
| Median Property Value | $193,900 | $217,500 |
| Median Household Income | $72,196 | $3,180 |
| Monthly Housing Costs | $917 | $1,335 |
| Real Estate Taxes | $6,356 | $320 |
Property Value by Mortgage Status in Salem County
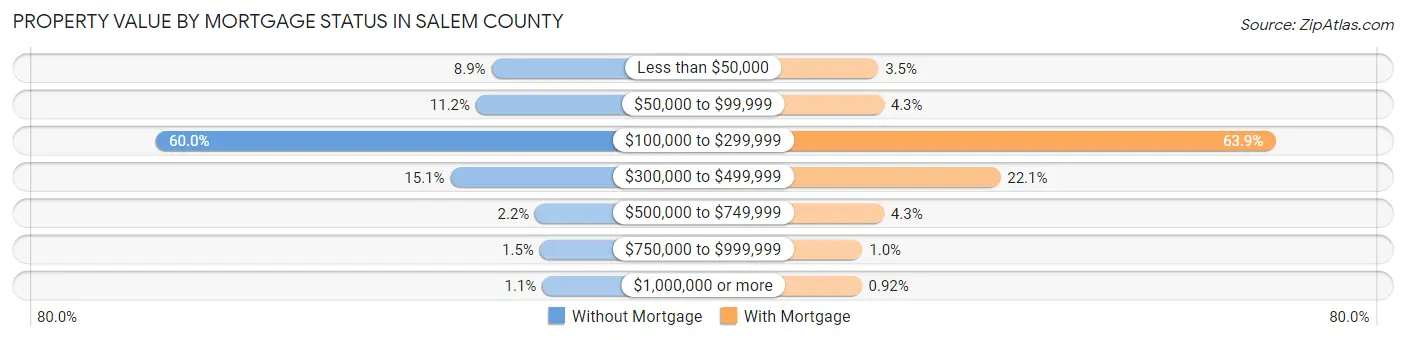
| Property Value | Without Mortgage | With Mortgage |
| Less than $50,000 | 659 (8.9%) | 346 (3.5%) |
| $50,000 to $99,999 | 836 (11.2%) | 431 (4.3%) |
| $100,000 to $299,999 | 4,460 (60.0%) | 6,416 (63.9%) |
| $300,000 to $499,999 | 1,125 (15.1%) | 2,213 (22.1%) |
| $500,000 to $749,999 | 164 (2.2%) | 433 (4.3%) |
| $750,000 to $999,999 | 112 (1.5%) | 103 (1.0%) |
| $1,000,000 or more | 84 (1.1%) | 92 (0.9%) |
| Total | 7,440 (100.0%) | 10,034 (100.0%) |
Household Income by Mortgage Status in Salem County
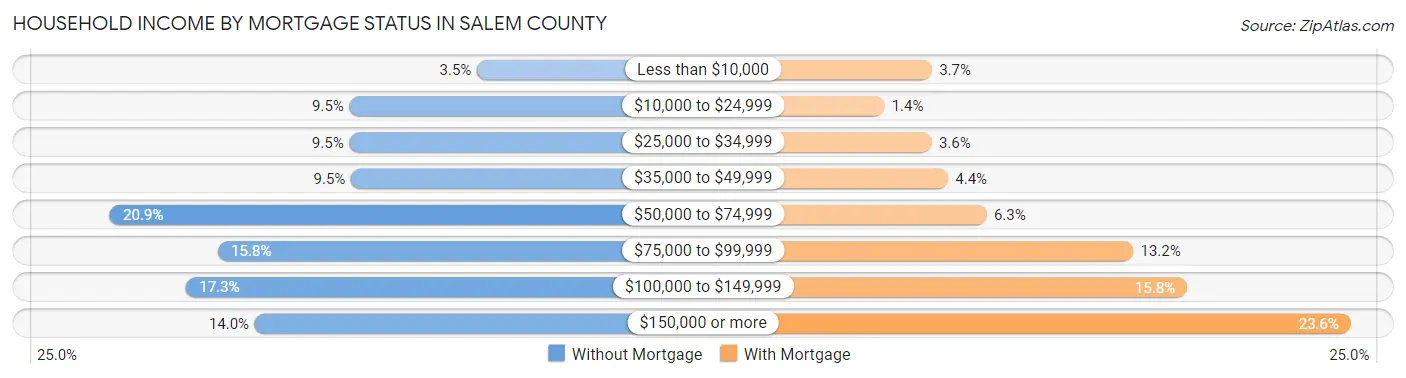
| Household Income | Without Mortgage | With Mortgage |
| Less than $10,000 | 257 (3.5%) | 366 (3.6%) |
| $10,000 to $24,999 | 708 (9.5%) | 139 (1.4%) |
| $25,000 to $34,999 | 709 (9.5%) | 365 (3.6%) |
| $35,000 to $49,999 | 703 (9.5%) | 444 (4.4%) |
| $50,000 to $74,999 | 1,557 (20.9%) | 628 (6.3%) |
| $75,000 to $99,999 | 1,175 (15.8%) | 1,328 (13.2%) |
| $100,000 to $149,999 | 1,287 (17.3%) | 1,584 (15.8%) |
| $150,000 or more | 1,044 (14.0%) | 2,366 (23.6%) |
| Total | 7,440 (100.0%) | 10,034 (100.0%) |
Property Value to Household Income Ratio in Salem County
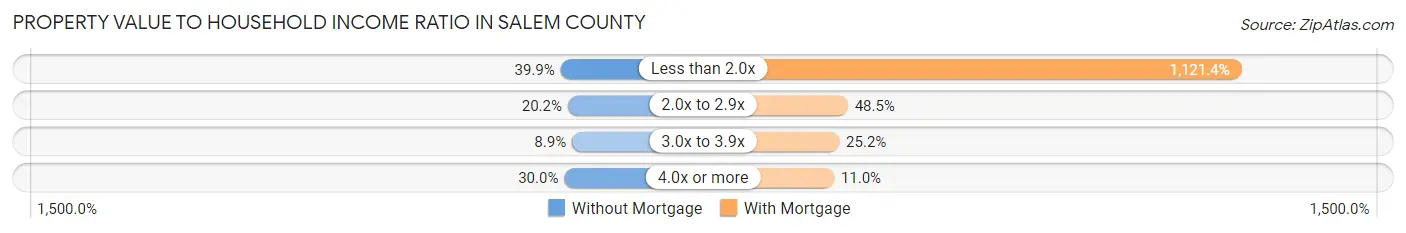
| Value-to-Income Ratio | Without Mortgage | With Mortgage |
| Less than 2.0x | 2,971 (39.9%) | 112,522 (1,121.4%) |
| 2.0x to 2.9x | 1,504 (20.2%) | 4,862 (48.5%) |
| 3.0x to 3.9x | 659 (8.9%) | 2,526 (25.2%) |
| 4.0x or more | 2,232 (30.0%) | 1,104 (11.0%) |
| Total | 7,440 (100.0%) | 10,034 (100.0%) |
Real Estate Taxes by Mortgage Status in Salem County
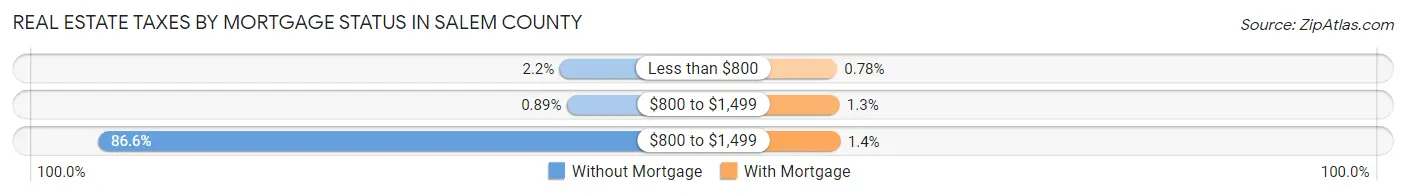
| Property Taxes | Without Mortgage | With Mortgage |
| Less than $800 | 163 (2.2%) | 78 (0.8%) |
| $800 to $1,499 | 66 (0.9%) | 125 (1.3%) |
| $800 to $1,499 | 6,441 (86.6%) | 142 (1.4%) |
| Total | 7,440 (100.0%) | 10,034 (100.0%) |
Health & Disability in Salem County
Health Insurance Coverage by Age in Salem County
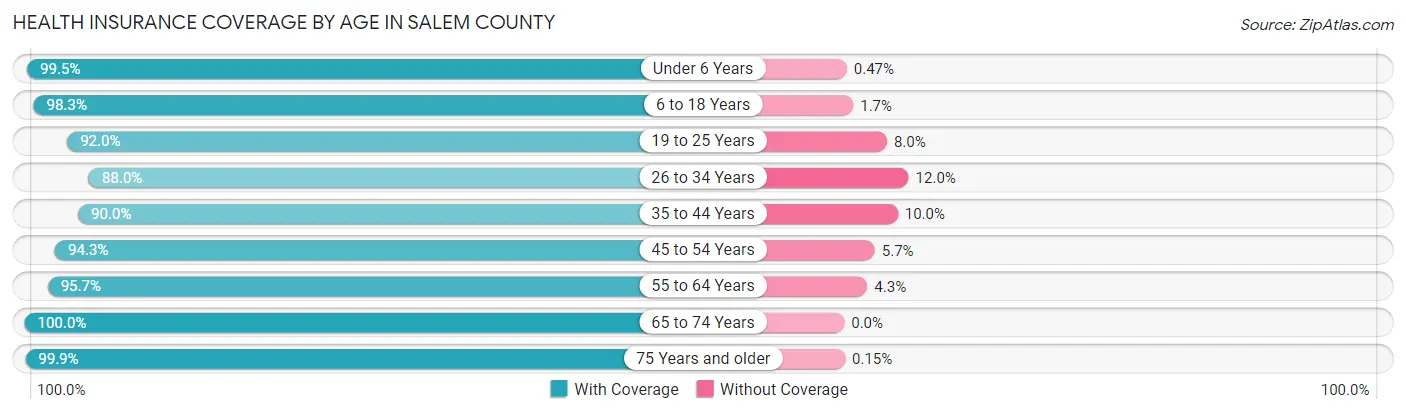
| Age Bracket | With Coverage | Without Coverage |
| Under 6 Years | 4,258 (99.5%) | 20 (0.5%) |
| 6 to 18 Years | 10,261 (98.3%) | 175 (1.7%) |
| 19 to 25 Years | 4,995 (92.0%) | 432 (8.0%) |
| 26 to 34 Years | 5,615 (88.0%) | 766 (12.0%) |
| 35 to 44 Years | 7,102 (90.0%) | 787 (10.0%) |
| 45 to 54 Years | 7,706 (94.3%) | 466 (5.7%) |
| 55 to 64 Years | 9,085 (95.7%) | 409 (4.3%) |
| 65 to 74 Years | 7,058 (100.0%) | 0 (0.0%) |
| 75 Years and older | 4,586 (99.9%) | 7 (0.2%) |
| Total | 60,666 (95.2%) | 3,062 (4.8%) |
Health Insurance Coverage by Citizenship Status in Salem County
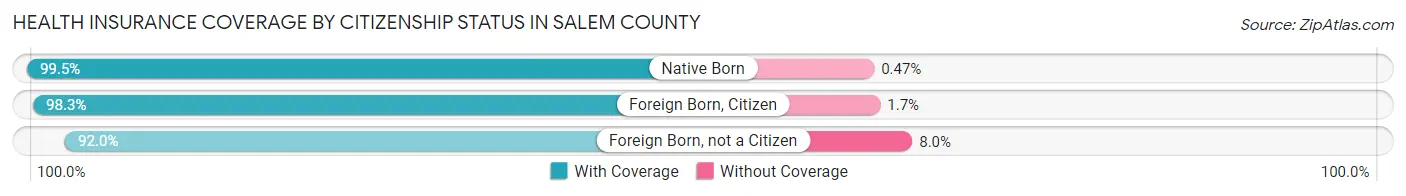
| Citizenship Status | With Coverage | Without Coverage |
| Native Born | 4,258 (99.5%) | 20 (0.5%) |
| Foreign Born, Citizen | 10,261 (98.3%) | 175 (1.7%) |
| Foreign Born, not a Citizen | 4,995 (92.0%) | 432 (8.0%) |
Health Insurance Coverage by Household Income in Salem County
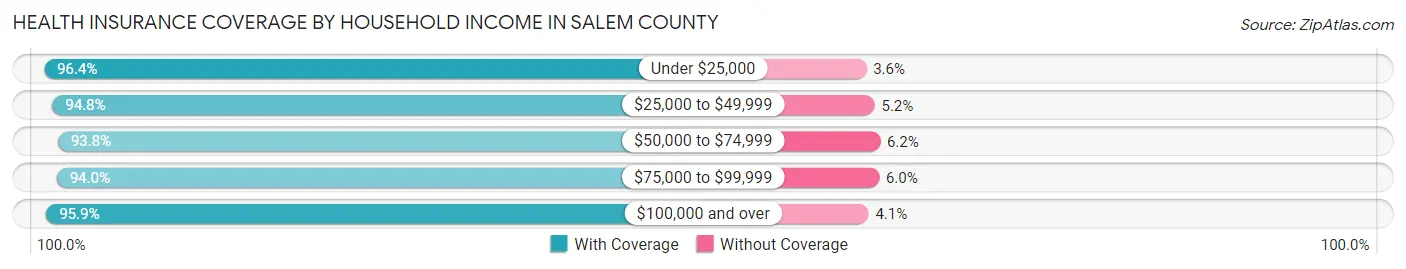
| Household Income | With Coverage | Without Coverage |
| Under $25,000 | 7,280 (96.4%) | 275 (3.6%) |
| $25,000 to $49,999 | 8,747 (94.8%) | 480 (5.2%) |
| $50,000 to $74,999 | 8,927 (93.8%) | 591 (6.2%) |
| $75,000 to $99,999 | 8,271 (94.0%) | 531 (6.0%) |
| $100,000 and over | 27,106 (95.9%) | 1,146 (4.1%) |
Public vs Private Health Insurance Coverage by Age in Salem County
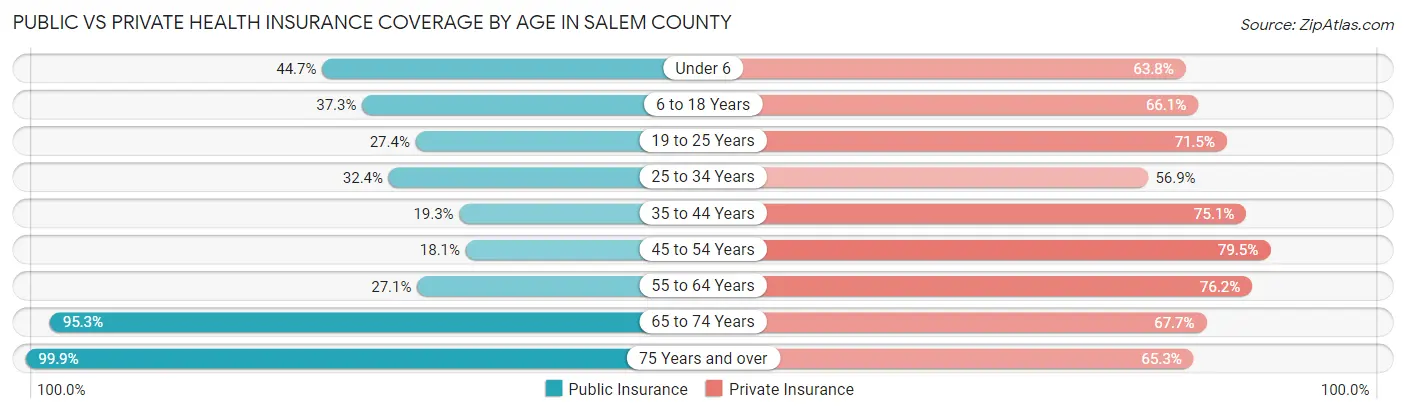
| Age Bracket | Public Insurance | Private Insurance |
| Under 6 | 1,914 (44.7%) | 2,730 (63.8%) |
| 6 to 18 Years | 3,895 (37.3%) | 6,900 (66.1%) |
| 19 to 25 Years | 1,487 (27.4%) | 3,878 (71.5%) |
| 25 to 34 Years | 2,067 (32.4%) | 3,632 (56.9%) |
| 35 to 44 Years | 1,522 (19.3%) | 5,921 (75.0%) |
| 45 to 54 Years | 1,479 (18.1%) | 6,495 (79.5%) |
| 55 to 64 Years | 2,574 (27.1%) | 7,230 (76.1%) |
| 65 to 74 Years | 6,727 (95.3%) | 4,775 (67.6%) |
| 75 Years and over | 4,586 (99.9%) | 2,999 (65.3%) |
| Total | 26,251 (41.2%) | 44,560 (69.9%) |
Disability Status by Sex by Age in Salem County
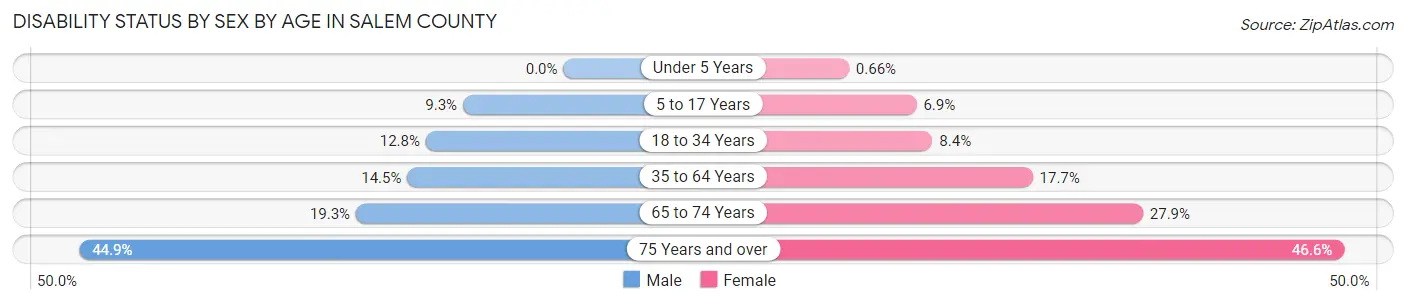
| Age Bracket | Male | Female |
| Under 5 Years | 0 (0.0%) | 11 (0.7%) |
| 5 to 17 Years | 510 (9.3%) | 350 (6.9%) |
| 18 to 34 Years | 801 (12.8%) | 527 (8.4%) |
| 35 to 64 Years | 1,825 (14.5%) | 2,294 (17.7%) |
| 65 to 74 Years | 653 (19.3%) | 1,024 (27.9%) |
| 75 Years and over | 828 (44.9%) | 1,282 (46.6%) |
Disability Class by Sex by Age in Salem County
Disability Class: Hearing Difficulty
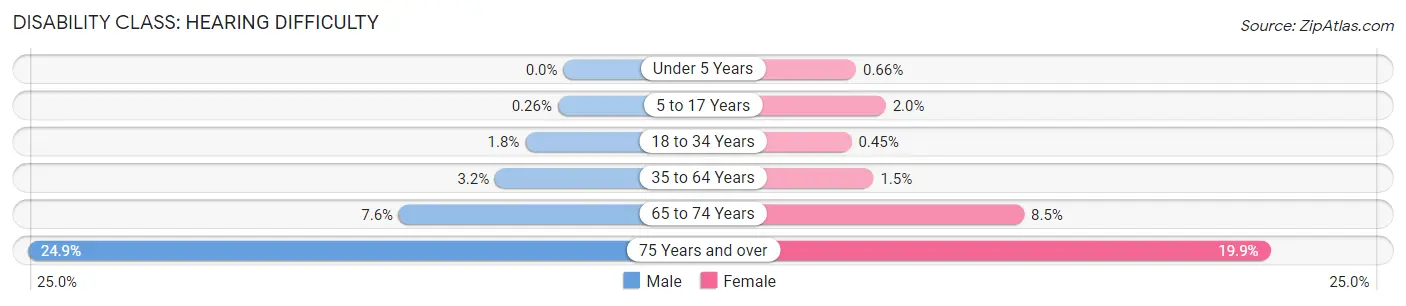
| Age Bracket | Male | Female |
| Under 5 Years | 0 (0.0%) | 11 (0.7%) |
| 5 to 17 Years | 14 (0.3%) | 103 (2.0%) |
| 18 to 34 Years | 111 (1.8%) | 28 (0.4%) |
| 35 to 64 Years | 399 (3.2%) | 191 (1.5%) |
| 65 to 74 Years | 259 (7.6%) | 310 (8.5%) |
| 75 Years and over | 458 (24.8%) | 547 (19.9%) |
Disability Class: Vision Difficulty
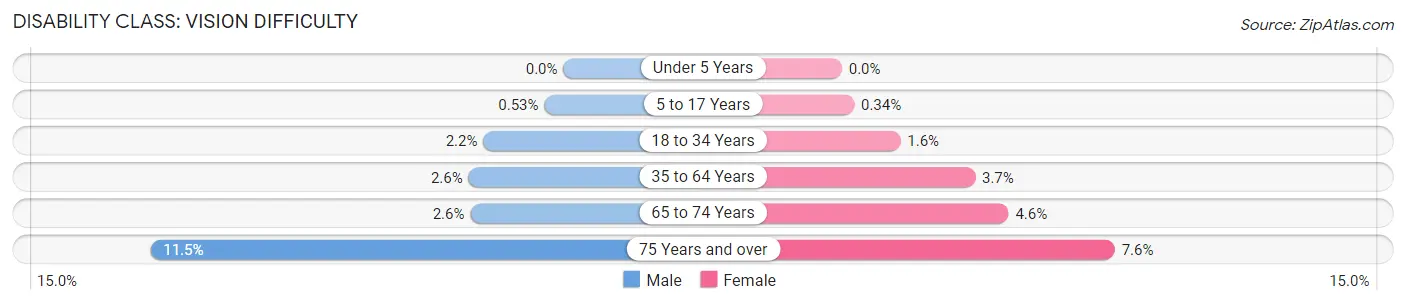
| Age Bracket | Male | Female |
| Under 5 Years | 0 (0.0%) | 0 (0.0%) |
| 5 to 17 Years | 29 (0.5%) | 17 (0.3%) |
| 18 to 34 Years | 140 (2.2%) | 102 (1.6%) |
| 35 to 64 Years | 333 (2.6%) | 481 (3.7%) |
| 65 to 74 Years | 88 (2.6%) | 170 (4.6%) |
| 75 Years and over | 212 (11.5%) | 209 (7.6%) |
Disability Class: Cognitive Difficulty
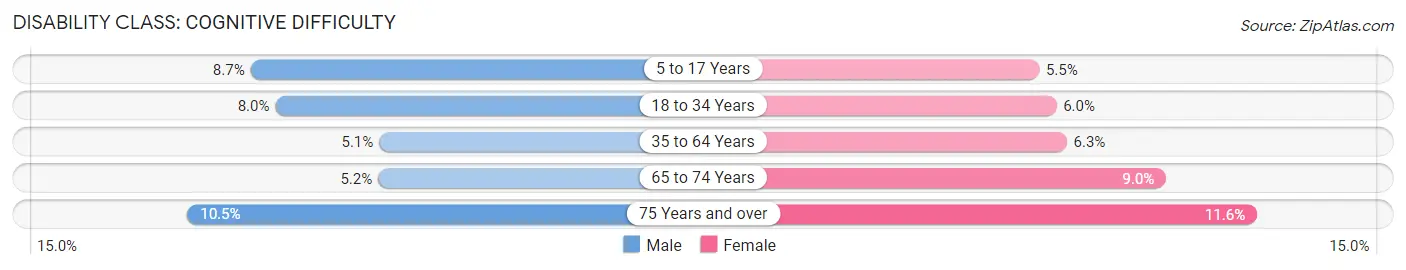
| Age Bracket | Male | Female |
| 5 to 17 Years | 477 (8.7%) | 277 (5.5%) |
| 18 to 34 Years | 503 (8.0%) | 374 (6.0%) |
| 35 to 64 Years | 647 (5.1%) | 811 (6.3%) |
| 65 to 74 Years | 175 (5.2%) | 331 (9.0%) |
| 75 Years and over | 193 (10.5%) | 318 (11.6%) |
Disability Class: Ambulatory Difficulty
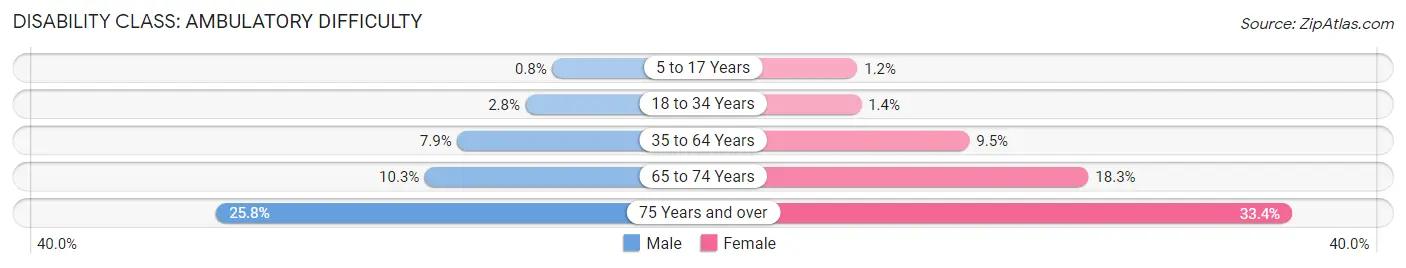
| Age Bracket | Male | Female |
| 5 to 17 Years | 44 (0.8%) | 58 (1.1%) |
| 18 to 34 Years | 175 (2.8%) | 90 (1.4%) |
| 35 to 64 Years | 991 (7.9%) | 1,226 (9.5%) |
| 65 to 74 Years | 348 (10.3%) | 671 (18.3%) |
| 75 Years and over | 475 (25.8%) | 919 (33.4%) |
Disability Class: Self-Care Difficulty
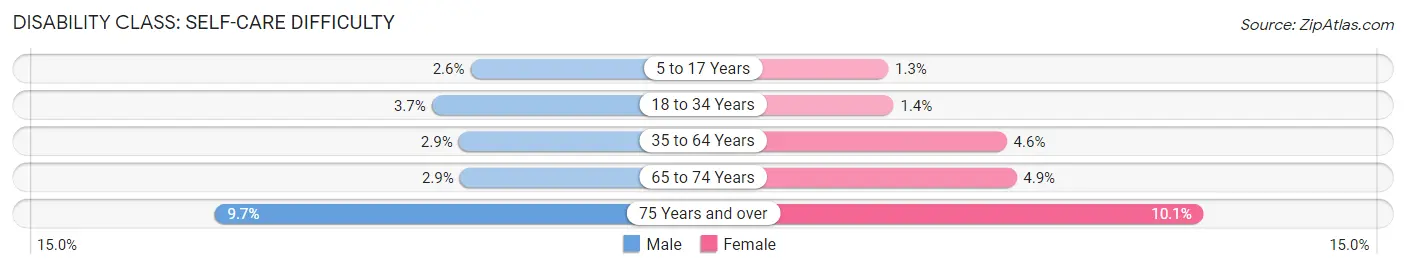
| Age Bracket | Male | Female |
| 5 to 17 Years | 142 (2.6%) | 65 (1.3%) |
| 18 to 34 Years | 230 (3.7%) | 90 (1.4%) |
| 35 to 64 Years | 368 (2.9%) | 595 (4.6%) |
| 65 to 74 Years | 98 (2.9%) | 178 (4.9%) |
| 75 Years and over | 179 (9.7%) | 277 (10.1%) |
Technology Access in Salem County
Computing Device Access in Salem County
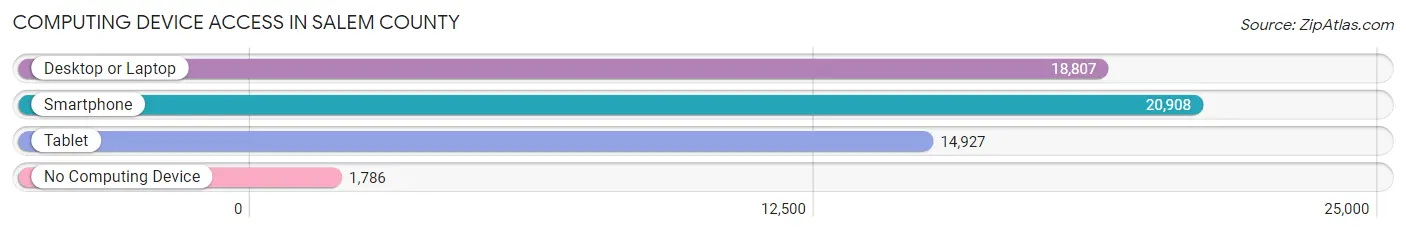
| Device Type | # Households | % Households |
| Desktop or Laptop | 18,807 | 76.0% |
| Smartphone | 20,908 | 84.5% |
| Tablet | 14,927 | 60.3% |
| No Computing Device | 1,786 | 7.2% |
| Total | 24,744 | 100.0% |
Internet Access in Salem County
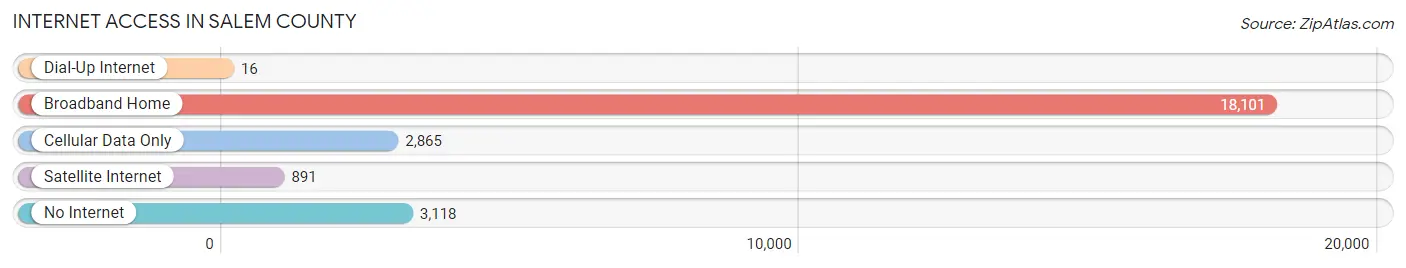
| Internet Type | # Households | % Households |
| Dial-Up Internet | 16 | 0.1% |
| Broadband Home | 18,101 | 73.2% |
| Cellular Data Only | 2,865 | 11.6% |
| Satellite Internet | 891 | 3.6% |
| No Internet | 3,118 | 12.6% |
| Total | 24,744 | 100.0% |
Salem County Summary
Salem County, New Jersey is located in the southwestern corner of the state, and is bordered by Delaware to the south and Pennsylvania to the west. It is part of the Delaware Valley region and is part of the Philadelphia metropolitan area. The county is home to a population of 63,917 people, according to the 2010 census.
Geography
Salem County is located in the southwestern corner of New Jersey, and is bordered by Delaware to the south and Pennsylvania to the west. It is part of the Delaware Valley region and is part of the Philadelphia metropolitan area. The county is home to a population of 63,917 people, according to the 2010 census. The county is divided into three distinct regions: the Upper County, the Lower County, and the Coastal Plain. The Upper County is located in the northern part of the county and is characterized by rolling hills and valleys. The Lower County is located in the southern part of the county and is characterized by flat, marshy land. The Coastal Plain is located along the Delaware River and is characterized by flat, sandy land.
History
Salem County was first settled by Europeans in the early 1600s. The area was originally inhabited by the Lenape Native Americans, who were displaced by the Europeans. The first European settlers were Dutch, who established a trading post in the area in 1626. The area was then settled by the English in 1675, and the county was officially established in 1694. The county was named after the city of Salem, which was the county seat until 1778.
During the American Revolution, Salem County was a major center of activity. The county was the site of several battles, including the Battle of Quinton's Bridge and the Battle of Hancock's Bridge. After the war, the county experienced a period of growth and prosperity. The county was home to several industries, including shipbuilding, glassmaking, and agriculture.
Economy
Salem County has a diverse economy, with a mix of manufacturing, agriculture, and services. The county is home to several large employers, including DuPont, PSEG Nuclear, and the Salem County Correctional Facility. The county is also home to several smaller businesses, including farms, wineries, and small manufacturing companies.
Agriculture is a major part of the county's economy. The county is home to several large farms, which produce a variety of crops, including corn, soybeans, wheat, and hay. The county is also home to several wineries, which produce a variety of wines.
Demographics
According to the 2010 census, Salem County has a population of 63,917 people. The population is spread out across the county, with the largest population centers being Salem City, Pennsville Township, and Mannington Township. The population is predominantly white (87.3%), with smaller percentages of African American (7.2%), Hispanic (3.2%), and Asian (1.3%) residents. The median household income in the county is $54,945, and the median home value is $164,400.
Conclusion
Salem County, New Jersey is a diverse and vibrant county located in the southwestern corner of the state. The county is home to a population of 63,917 people, and has a diverse economy that includes manufacturing, agriculture, and services. The county is predominantly white, with smaller percentages of African American, Hispanic, and Asian residents. The median household income in the county is $54,945, and the median home value is $164,400. Salem County is a great place to live, work, and play, and is a great example of the diversity and vibrancy of New Jersey.
Common Questions
What is the Total Population of Salem County?
Total Population of Salem County is 64,840.
What is the Total Male Population of Salem County?
Total Male Population of Salem County is 32,077.
What is the Total Female Population of Salem County?
Total Female Population of Salem County is 32,763.
What is the Ratio of Males per 100 Females in Salem County?
There are 97.91 Males per 100 Females in Salem County.
What is the Ratio of Females per 100 Males in Salem County?
There are 102.14 Females per 100 Males in Salem County.
What is the Median Population Age in Salem County?
Median Population Age in Salem County is 41.8 Years.
What is the Average Family Size in Salem County
Average Family Size in Salem County is 3.2 People.
What is the Average Household Size in Salem County
Average Household Size in Salem County is 2.6 People.
What is Per Capita Income in Salem County?
Per Capita income in Salem County is $37,904.
What is the Median Family Income in Salem County?
Median Family Income in Salem County is $92,541.
What is the Median Household income in Salem County?
Median Household Income in Salem County is $73,378.
What is Income or Wage Gap in Salem County?
Income or Wage Gap in Salem County is 31.4%.
Women in Salem County earn 68.6 cents for every dollar earned by a man.
What is Family Income Deficit in Salem County?
Family Income Deficit in Salem County is $10,121.
Families that are below poverty line in Salem County earn $10,121 less on average than the poverty threshold level.
What is Inequality or Gini Index in Salem County?
Inequality or Gini Index in Salem County is 0.44.
How Large is the Labor Force in Salem County?
There are 31,834 People in the Labor Forcein in Salem County.
What is the Percentage of People in the Labor Force in Salem County?
60.5% of People are in the Labor Force in Salem County.
What is the Unemployment Rate in Salem County?
Unemployment Rate in Salem County is 8.0%.