Passaic County, NJ
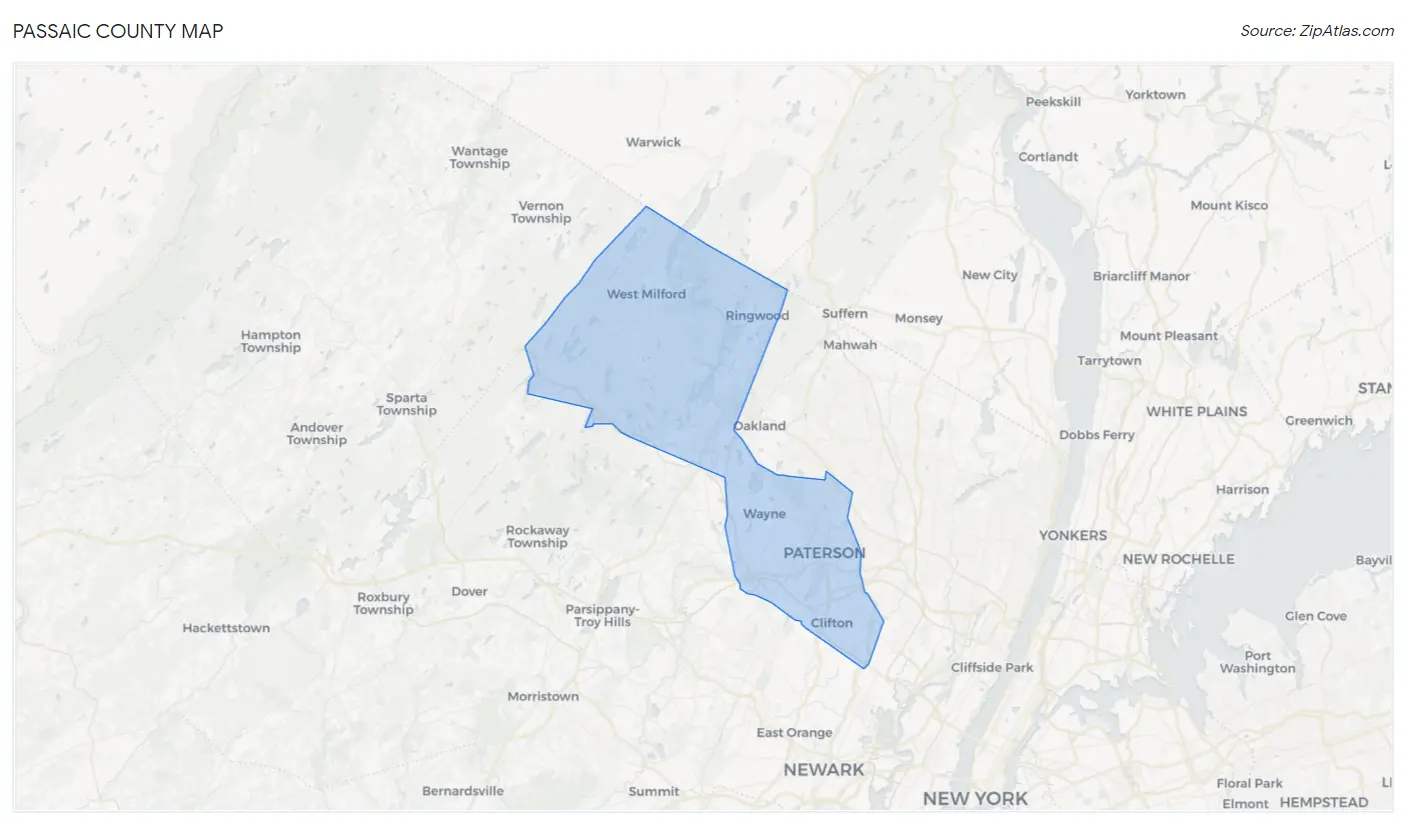
Passaic County Map
Passaic County Overview
519,986
TOTAL POPULATION
255,780
MALE POPULATION
264,206
FEMALE POPULATION
96.81
MALES / 100 FEMALES
103.29
FEMALES / 100 MALES
37.8
MEDIAN AGE
3.4
AVG FAMILY SIZE
2.9
AVG HOUSEHOLD SIZE
$38,932
PER CAPITA INCOME
$97,267
AVG FAMILY INCOME
$84,465
AVG HOUSEHOLD INCOME
24.7%
WAGE / INCOME GAP [ % ]
75.3¢/ $1
WAGE / INCOME GAP [ $ ]
$11,323
FAMILY INCOME DEFICIT
0.46
INEQUALITY / GINI INDEX
273,466
LABOR FORCE [ PEOPLE ]
66.6%
PERCENT IN LABOR FORCE
7.8%
UNEMPLOYMENT RATE
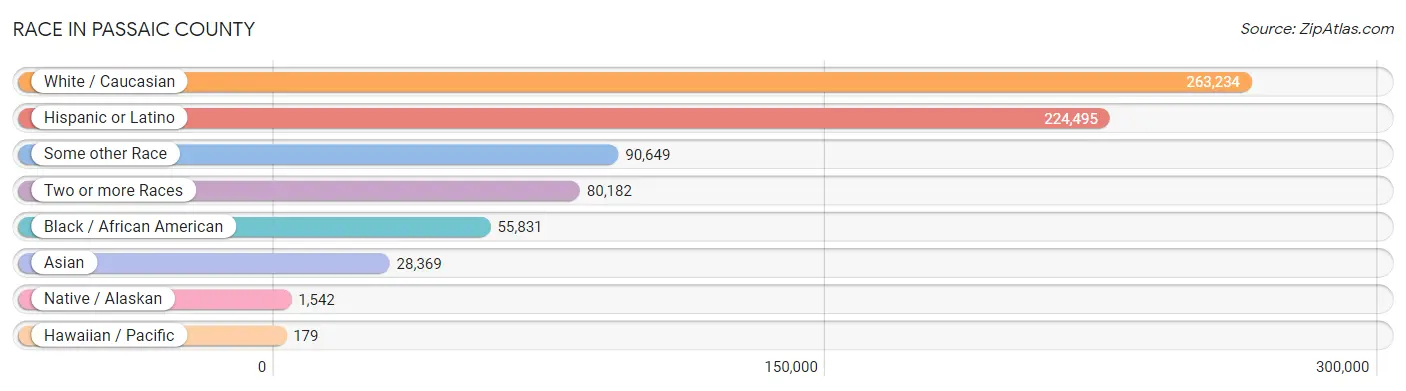
Race in Passaic County
The most populous races in Passaic County are White / Caucasian (263,234 | 50.6%), Hispanic or Latino (224,495 | 43.2%), and Some other Race (90,649 | 17.4%).
| Race | # Population | % Population |
| Asian | 28,369 | 5.5% |
| Black / African American | 55,831 | 10.7% |
| Hawaiian / Pacific | 179 | 0.0% |
| Hispanic or Latino | 224,495 | 43.2% |
| Native / Alaskan | 1,542 | 0.3% |
| White / Caucasian | 263,234 | 50.6% |
| Two or more Races | 80,182 | 15.4% |
| Some other Race | 90,649 | 17.4% |
| Total | 519,986 | 100.0% |
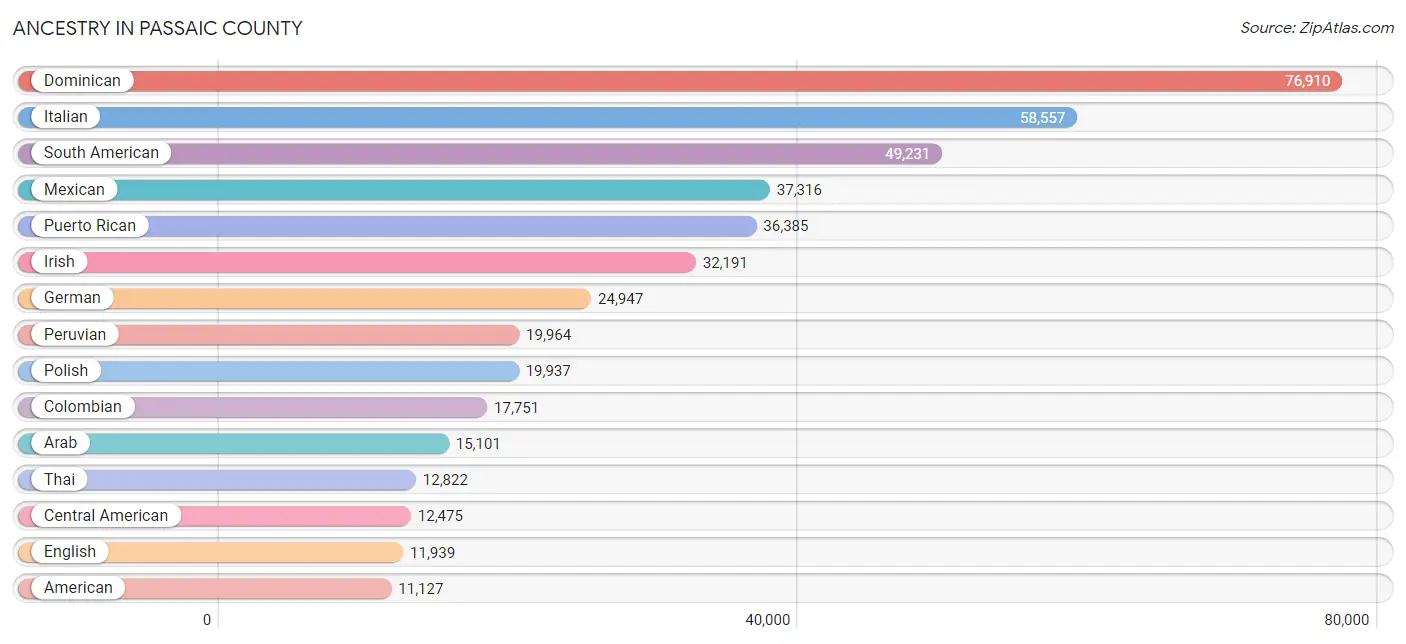
Ancestry in Passaic County
The most populous ancestries reported in Passaic County are Dominican (76,910 | 14.8%), Italian (58,557 | 11.3%), South American (49,231 | 9.5%), Mexican (37,316 | 7.2%), and Puerto Rican (36,385 | 7.0%), together accounting for 49.7% of all Passaic County residents.
| Ancestry | # Population | % Population |
| Afghan | 288 | 0.1% |
| African | 6,248 | 1.2% |
| Albanian | 2,694 | 0.5% |
| American | 11,127 | 2.1% |
| Arab | 15,101 | 2.9% |
| Argentinean | 967 | 0.2% |
| Armenian | 647 | 0.1% |
| Assyrian / Chaldean / Syriac | 19 | 0.0% |
| Australian | 2 | 0.0% |
| Austrian | 1,341 | 0.3% |
| Bangladeshi | 20 | 0.0% |
| Barbadian | 3 | 0.0% |
| Basque | 8 | 0.0% |
| Belgian | 457 | 0.1% |
| Bhutanese | 681 | 0.1% |
| Blackfeet | 65 | 0.0% |
| Bolivian | 363 | 0.1% |
| Brazilian | 1,349 | 0.3% |
| British | 1,204 | 0.2% |
| British West Indian | 154 | 0.0% |
| Bulgarian | 99 | 0.0% |
| Burmese | 2,162 | 0.4% |
| Canadian | 359 | 0.1% |
| Cape Verdean | 26 | 0.0% |
| Celtic | 10 | 0.0% |
| Central American | 12,475 | 2.4% |
| Central American Indian | 765 | 0.2% |
| Cherokee | 368 | 0.1% |
| Chilean | 829 | 0.2% |
| Chippewa | 1 | 0.0% |
| Colombian | 17,751 | 3.4% |
| Costa Rican | 2,096 | 0.4% |
| Croatian | 495 | 0.1% |
| Cuban | 4,617 | 0.9% |
| Czech | 810 | 0.2% |
| Czechoslovakian | 268 | 0.1% |
| Danish | 321 | 0.1% |
| Delaware | 283 | 0.1% |
| Dominican | 76,910 | 14.8% |
| Dutch | 6,739 | 1.3% |
| Dutch West Indian | 9 | 0.0% |
| Eastern European | 2,633 | 0.5% |
| Ecuadorian | 7,819 | 1.5% |
| Egyptian | 2,699 | 0.5% |
| English | 11,939 | 2.3% |
| Estonian | 7 | 0.0% |
| Ethiopian | 77 | 0.0% |
| European | 3,196 | 0.6% |
| Filipino | 95 | 0.0% |
| Finnish | 212 | 0.0% |
| French | 3,085 | 0.6% |
| French Canadian | 791 | 0.2% |
| German | 24,947 | 4.8% |
| Ghanaian | 353 | 0.1% |
| Greek | 2,035 | 0.4% |
| Guamanian / Chamorro | 21 | 0.0% |
| Guatemalan | 3,383 | 0.6% |
| Guyanese | 596 | 0.1% |
| Haitian | 1,429 | 0.3% |
| Honduran | 2,062 | 0.4% |
| Hungarian | 3,720 | 0.7% |
| Indian (Asian) | 2,954 | 0.6% |
| Indonesian | 46 | 0.0% |
| Inupiat | 30 | 0.0% |
| Iranian | 241 | 0.1% |
| Iraqi | 269 | 0.1% |
| Irish | 32,191 | 6.2% |
| Iroquois | 124 | 0.0% |
| Israeli | 1,422 | 0.3% |
| Italian | 58,557 | 11.3% |
| Jamaican | 6,367 | 1.2% |
| Japanese | 10 | 0.0% |
| Jordanian | 2,238 | 0.4% |
| Korean | 6,012 | 1.2% |
| Laotian | 453 | 0.1% |
| Latvian | 130 | 0.0% |
| Lebanese | 1,160 | 0.2% |
| Liberian | 17 | 0.0% |
| Lithuanian | 892 | 0.2% |
| Macedonian | 929 | 0.2% |
| Maltese | 24 | 0.0% |
| Menominee | 60 | 0.0% |
| Mexican | 37,316 | 7.2% |
| Mexican American Indian | 461 | 0.1% |
| Moroccan | 933 | 0.2% |
| Native Hawaiian | 253 | 0.1% |
| Navajo | 11 | 0.0% |
| New Zealander | 15 | 0.0% |
| Nicaraguan | 406 | 0.1% |
| Nigerian | 297 | 0.1% |
| Northern European | 282 | 0.1% |
| Norwegian | 849 | 0.2% |
| Pakistani | 153 | 0.0% |
| Palestinian | 2,342 | 0.4% |
| Panamanian | 197 | 0.0% |
| Paraguayan | 70 | 0.0% |
| Pennsylvania German | 21 | 0.0% |
| Peruvian | 19,964 | 3.8% |
| Polish | 19,937 | 3.8% |
| Portuguese | 1,543 | 0.3% |
| Pueblo | 10 | 0.0% |
| Puerto Rican | 36,385 | 7.0% |
| Romanian | 636 | 0.1% |
| Russian | 5,084 | 1.0% |
| Salvadoran | 4,331 | 0.8% |
| Samoan | 6 | 0.0% |
| Scandinavian | 156 | 0.0% |
| Scotch-Irish | 1,134 | 0.2% |
| Scottish | 1,996 | 0.4% |
| Senegalese | 8 | 0.0% |
| Serbian | 375 | 0.1% |
| Sierra Leonean | 174 | 0.0% |
| Sioux | 46 | 0.0% |
| Slavic | 342 | 0.1% |
| Slovak | 1,129 | 0.2% |
| Slovene | 12 | 0.0% |
| South African | 170 | 0.0% |
| South American | 49,231 | 9.5% |
| South American Indian | 420 | 0.1% |
| Spaniard | 1,197 | 0.2% |
| Spanish | 770 | 0.2% |
| Spanish American Indian | 9 | 0.0% |
| Sri Lankan | 204 | 0.0% |
| Subsaharan African | 7,778 | 1.5% |
| Sudanese | 372 | 0.1% |
| Swedish | 1,357 | 0.3% |
| Swiss | 559 | 0.1% |
| Syrian | 2,719 | 0.5% |
| Thai | 12,822 | 2.5% |
| Trinidadian and Tobagonian | 432 | 0.1% |
| Turkish | 4,145 | 0.8% |
| Ugandan | 13 | 0.0% |
| Ukrainian | 2,978 | 0.6% |
| Uruguayan | 203 | 0.0% |
| Venezuelan | 1,186 | 0.2% |
| Vietnamese | 3,988 | 0.8% |
| Welsh | 685 | 0.1% |
| West Indian | 368 | 0.1% |
| Yugoslavian | 319 | 0.1% |
| Zimbabwean | 9 | 0.0% | View All 140 Rows |
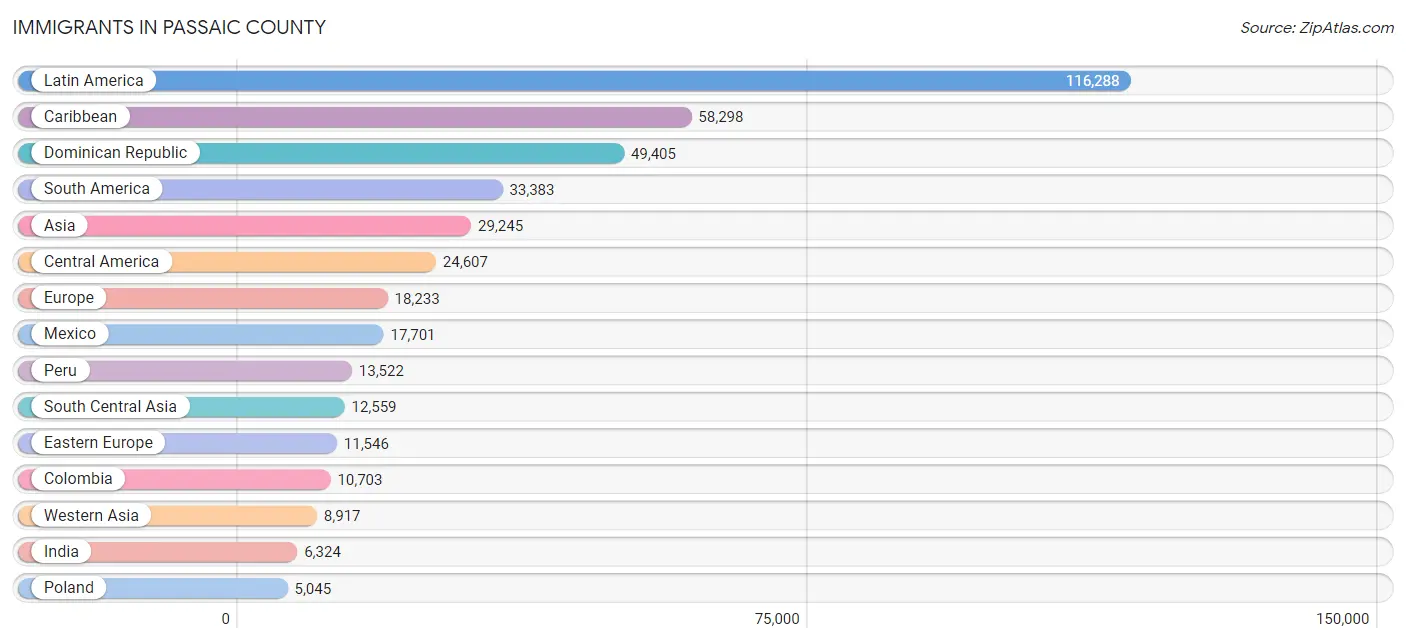
Immigrants in Passaic County
The most numerous immigrant groups reported in Passaic County came from Latin America (116,288 | 22.4%), Caribbean (58,298 | 11.2%), Dominican Republic (49,405 | 9.5%), South America (33,383 | 6.4%), and Asia (29,245 | 5.6%), together accounting for 55.1% of all Passaic County residents.
| Immigration Origin | # Population | % Population |
| Afghanistan | 189 | 0.0% |
| Africa | 4,538 | 0.9% |
| Albania | 1,318 | 0.3% |
| Argentina | 660 | 0.1% |
| Armenia | 35 | 0.0% |
| Asia | 29,245 | 5.6% |
| Australia | 18 | 0.0% |
| Austria | 107 | 0.0% |
| Bahamas | 55 | 0.0% |
| Bangladesh | 4,671 | 0.9% |
| Belarus | 179 | 0.0% |
| Belgium | 39 | 0.0% |
| Belize | 24 | 0.0% |
| Bolivia | 330 | 0.1% |
| Bosnia and Herzegovina | 195 | 0.0% |
| Brazil | 1,199 | 0.2% |
| Bulgaria | 80 | 0.0% |
| Cambodia | 15 | 0.0% |
| Cameroon | 5 | 0.0% |
| Canada | 461 | 0.1% |
| Caribbean | 58,298 | 11.2% |
| Central America | 24,607 | 4.7% |
| Chile | 531 | 0.1% |
| China | 1,487 | 0.3% |
| Colombia | 10,703 | 2.1% |
| Costa Rica | 1,200 | 0.2% |
| Croatia | 184 | 0.0% |
| Cuba | 2,353 | 0.4% |
| Czechoslovakia | 163 | 0.0% |
| Denmark | 12 | 0.0% |
| Dominica | 324 | 0.1% |
| Dominican Republic | 49,405 | 9.5% |
| Eastern Africa | 259 | 0.1% |
| Eastern Asia | 3,223 | 0.6% |
| Eastern Europe | 11,546 | 2.2% |
| Ecuador | 4,877 | 0.9% |
| Egypt | 1,778 | 0.3% |
| El Salvador | 2,134 | 0.4% |
| England | 460 | 0.1% |
| Europe | 18,233 | 3.5% |
| France | 189 | 0.0% |
| Germany | 776 | 0.2% |
| Ghana | 672 | 0.1% |
| Greece | 268 | 0.1% |
| Guatemala | 1,761 | 0.3% |
| Guyana | 745 | 0.1% |
| Haiti | 708 | 0.1% |
| Honduras | 1,431 | 0.3% |
| Hong Kong | 103 | 0.0% |
| Hungary | 205 | 0.0% |
| India | 6,324 | 1.2% |
| Indonesia | 276 | 0.1% |
| Iran | 184 | 0.0% |
| Iraq | 390 | 0.1% |
| Ireland | 589 | 0.1% |
| Israel | 698 | 0.1% |
| Italy | 3,045 | 0.6% |
| Jamaica | 4,825 | 0.9% |
| Japan | 234 | 0.1% |
| Jordan | 2,235 | 0.4% |
| Kenya | 147 | 0.0% |
| Korea | 1,502 | 0.3% |
| Kuwait | 64 | 0.0% |
| Latin America | 116,288 | 22.4% |
| Latvia | 62 | 0.0% |
| Lebanon | 911 | 0.2% |
| Liberia | 26 | 0.0% |
| Lithuania | 28 | 0.0% |
| Malaysia | 10 | 0.0% |
| Mexico | 17,701 | 3.4% |
| Middle Africa | 56 | 0.0% |
| Moldova | 115 | 0.0% |
| Morocco | 796 | 0.2% |
| Nepal | 37 | 0.0% |
| Netherlands | 142 | 0.0% |
| Nicaragua | 261 | 0.1% |
| Nigeria | 102 | 0.0% |
| North Macedonia | 979 | 0.2% |
| Northern Africa | 2,922 | 0.6% |
| Northern Europe | 1,492 | 0.3% |
| Norway | 29 | 0.0% |
| Oceania | 44 | 0.0% |
| Pakistan | 788 | 0.2% |
| Panama | 95 | 0.0% |
| Peru | 13,522 | 2.6% |
| Philippines | 3,252 | 0.6% |
| Poland | 5,045 | 1.0% |
| Portugal | 175 | 0.0% |
| Romania | 318 | 0.1% |
| Russia | 1,104 | 0.2% |
| Saudi Arabia | 131 | 0.0% |
| Scotland | 29 | 0.0% |
| Senegal | 13 | 0.0% |
| Serbia | 219 | 0.0% |
| Sierra Leone | 87 | 0.0% |
| South Africa | 151 | 0.0% |
| South America | 33,383 | 6.4% |
| South Central Asia | 12,559 | 2.4% |
| South Eastern Asia | 3,856 | 0.7% |
| Southern Europe | 3,929 | 0.8% |
| Spain | 403 | 0.1% |
| Sri Lanka | 48 | 0.0% |
| St. Vincent and the Grenadines | 53 | 0.0% |
| Sudan | 282 | 0.1% |
| Sweden | 66 | 0.0% |
| Switzerland | 13 | 0.0% |
| Syria | 1,621 | 0.3% |
| Taiwan | 172 | 0.0% |
| Thailand | 159 | 0.0% |
| Trinidad and Tobago | 564 | 0.1% |
| Turkey | 2,385 | 0.5% |
| Uganda | 44 | 0.0% |
| Ukraine | 1,100 | 0.2% |
| Uruguay | 141 | 0.0% |
| Uzbekistan | 268 | 0.1% |
| Venezuela | 639 | 0.1% |
| Vietnam | 92 | 0.0% |
| Western Africa | 943 | 0.2% |
| Western Asia | 8,917 | 1.7% |
| Western Europe | 1,266 | 0.2% |
| Yemen | 152 | 0.0% | View All 121 Rows |
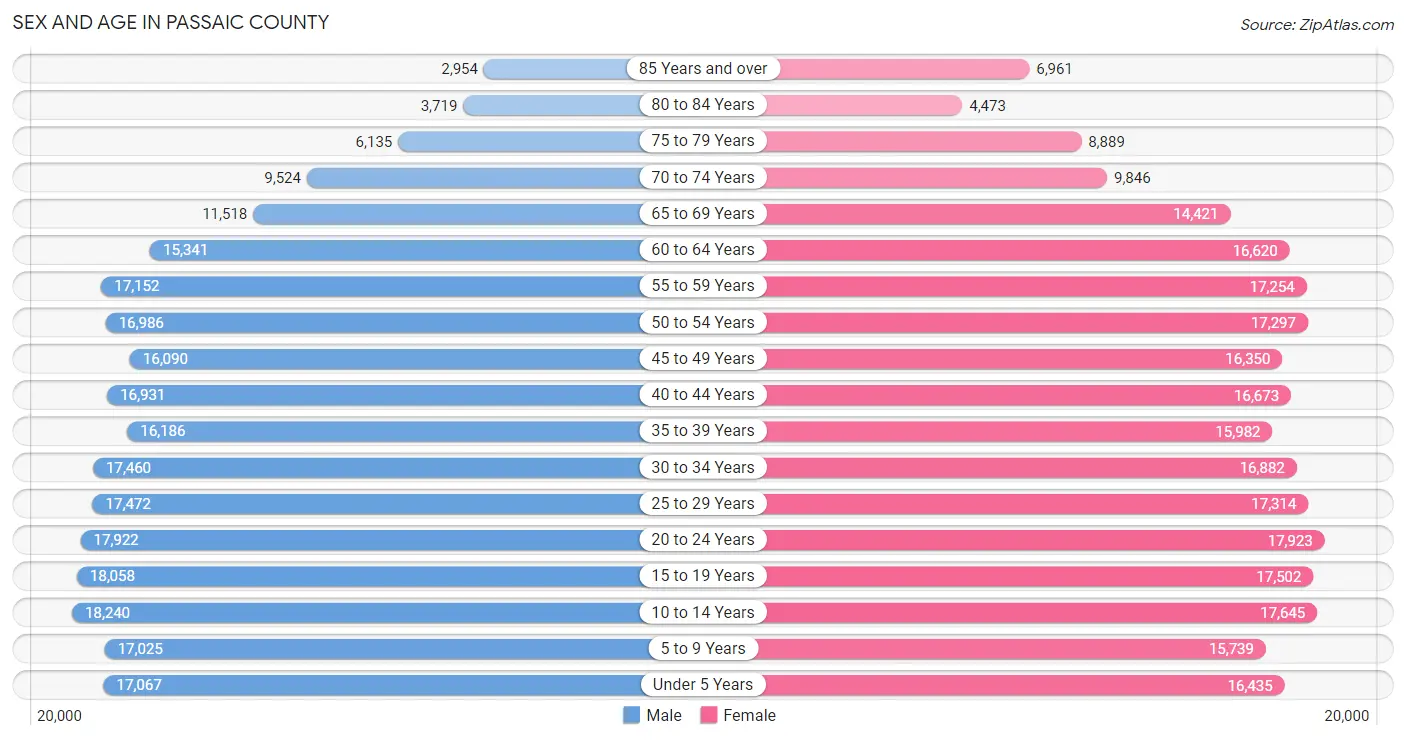
Sex and Age in Passaic County
Sex and Age in Passaic County
The most populous age groups in Passaic County are 10 to 14 Years (18,240 | 7.1%) for men and 20 to 24 Years (17,923 | 6.8%) for women.
| Age Bracket | Male | Female |
| Under 5 Years | 17,067 (6.7%) | 16,435 (6.2%) |
| 5 to 9 Years | 17,025 (6.7%) | 15,739 (6.0%) |
| 10 to 14 Years | 18,240 (7.1%) | 17,645 (6.7%) |
| 15 to 19 Years | 18,058 (7.1%) | 17,502 (6.6%) |
| 20 to 24 Years | 17,922 (7.0%) | 17,923 (6.8%) |
| 25 to 29 Years | 17,472 (6.8%) | 17,314 (6.6%) |
| 30 to 34 Years | 17,460 (6.8%) | 16,882 (6.4%) |
| 35 to 39 Years | 16,186 (6.3%) | 15,982 (6.0%) |
| 40 to 44 Years | 16,931 (6.6%) | 16,673 (6.3%) |
| 45 to 49 Years | 16,090 (6.3%) | 16,350 (6.2%) |
| 50 to 54 Years | 16,986 (6.6%) | 17,297 (6.6%) |
| 55 to 59 Years | 17,152 (6.7%) | 17,254 (6.5%) |
| 60 to 64 Years | 15,341 (6.0%) | 16,620 (6.3%) |
| 65 to 69 Years | 11,518 (4.5%) | 14,421 (5.5%) |
| 70 to 74 Years | 9,524 (3.7%) | 9,846 (3.7%) |
| 75 to 79 Years | 6,135 (2.4%) | 8,889 (3.4%) |
| 80 to 84 Years | 3,719 (1.5%) | 4,473 (1.7%) |
| 85 Years and over | 2,954 (1.1%) | 6,961 (2.6%) |
| Total | 255,780 (100.0%) | 264,206 (100.0%) |
Families and Households in Passaic County
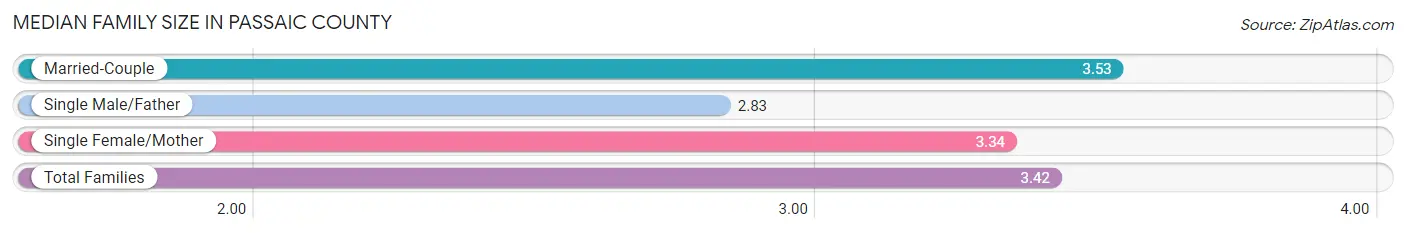
Median Family Size in Passaic County
The median family size in Passaic County is 3.42 persons per family, with married-couple families (83,411 | 65.3%) accounting for the largest median family size of 3.53 persons per family. On the other hand, single male/father families (11,679 | 9.1%) represent the smallest median family size with 2.83 persons per family.
| Family Type | # Families | Family Size |
| Married-Couple | 83,411 (65.3%) | 3.53 |
| Single Male/Father | 11,679 (9.1%) | 2.83 |
| Single Female/Mother | 32,705 (25.6%) | 3.34 |
| Total Families | 127,795 (100.0%) | 3.42 |
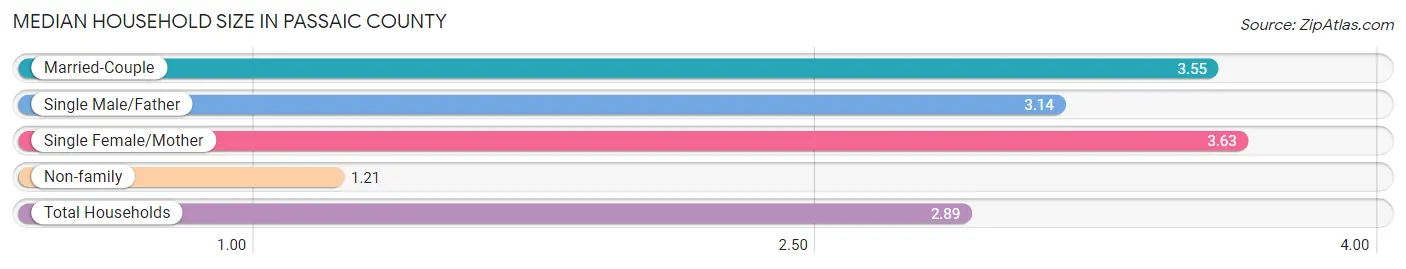
Median Household Size in Passaic County
The median household size in Passaic County is 2.89 persons per household, with single female/mother households (32,705 | 18.5%) accounting for the largest median household size of 3.63 persons per household. non-family households (49,414 | 27.9%) represent the smallest median household size with 1.21 persons per household.
| Household Type | # Households | Household Size |
| Married-Couple | 83,411 (47.1%) | 3.55 |
| Single Male/Father | 11,679 (6.6%) | 3.14 |
| Single Female/Mother | 32,705 (18.5%) | 3.63 |
| Non-family | 49,414 (27.9%) | 1.21 |
| Total Households | 177,209 (100.0%) | 2.89 |
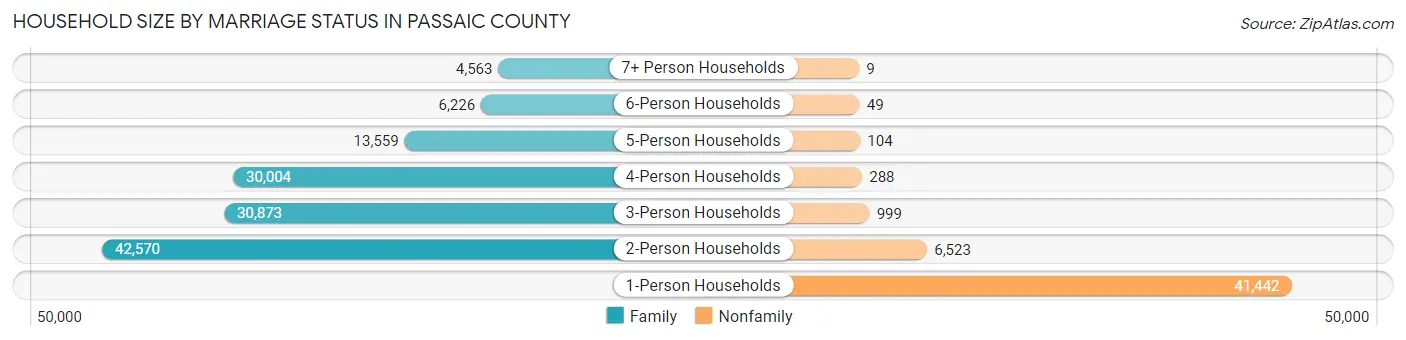
Household Size by Marriage Status in Passaic County
Out of a total of 177,209 households in Passaic County, 127,795 (72.1%) are family households, while 49,414 (27.9%) are nonfamily households. The most numerous type of family households are 2-person households, comprising 42,570, and the most common type of nonfamily households are 1-person households, comprising 41,442.
| Household Size | Family Households | Nonfamily Households |
| 1-Person Households | - | 41,442 (23.4%) |
| 2-Person Households | 42,570 (24.0%) | 6,523 (3.7%) |
| 3-Person Households | 30,873 (17.4%) | 999 (0.6%) |
| 4-Person Households | 30,004 (16.9%) | 288 (0.2%) |
| 5-Person Households | 13,559 (7.6%) | 104 (0.1%) |
| 6-Person Households | 6,226 (3.5%) | 49 (0.0%) |
| 7+ Person Households | 4,563 (2.6%) | 9 (0.0%) |
| Total | 127,795 (72.1%) | 49,414 (27.9%) |
Female Fertility in Passaic County
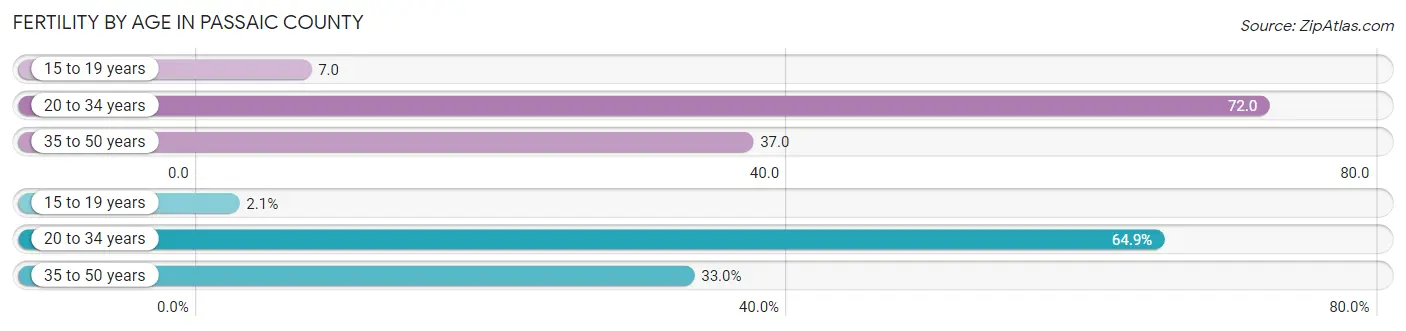
Fertility by Age in Passaic County
Average fertility rate in Passaic County is 48.0 births per 1,000 women. Women in the age bracket of 20 to 34 years have the highest fertility rate with 72.0 births per 1,000 women. Women in the age bracket of 20 to 34 years acount for 64.9% of all women with births.
| Age Bracket | Women with Births | Births / 1,000 Women |
| 15 to 19 years | 124 (2.1%) | 7.0 |
| 20 to 34 years | 3,776 (64.9%) | 72.0 |
| 35 to 50 years | 1,921 (33.0%) | 37.0 |
| Total | 5,821 (100.0%) | 48.0 |
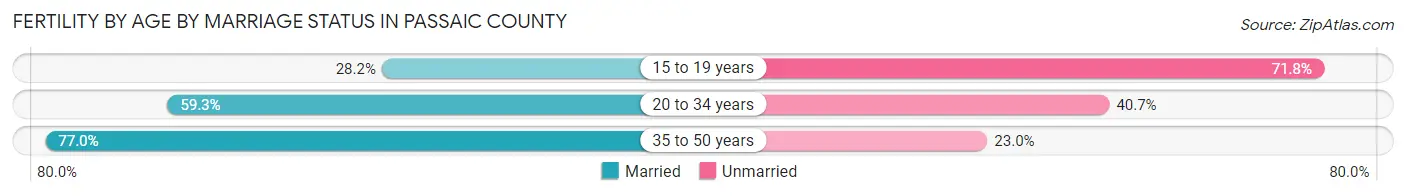
Fertility by Age by Marriage Status in Passaic County
64.5% of women with births (5,821) in Passaic County are married. The highest percentage of unmarried women with births falls into 15 to 19 years age bracket with 71.8% of them unmarried at the time of birth, while the lowest percentage of unmarried women with births belong to 35 to 50 years age bracket with 23.0% of them unmarried.
| Age Bracket | Married | Unmarried |
| 15 to 19 years | 35 (28.2%) | 89 (71.8%) |
| 20 to 34 years | 2,239 (59.3%) | 1,537 (40.7%) |
| 35 to 50 years | 1,479 (77.0%) | 442 (23.0%) |
| Total | 3,755 (64.5%) | 2,066 (35.5%) |
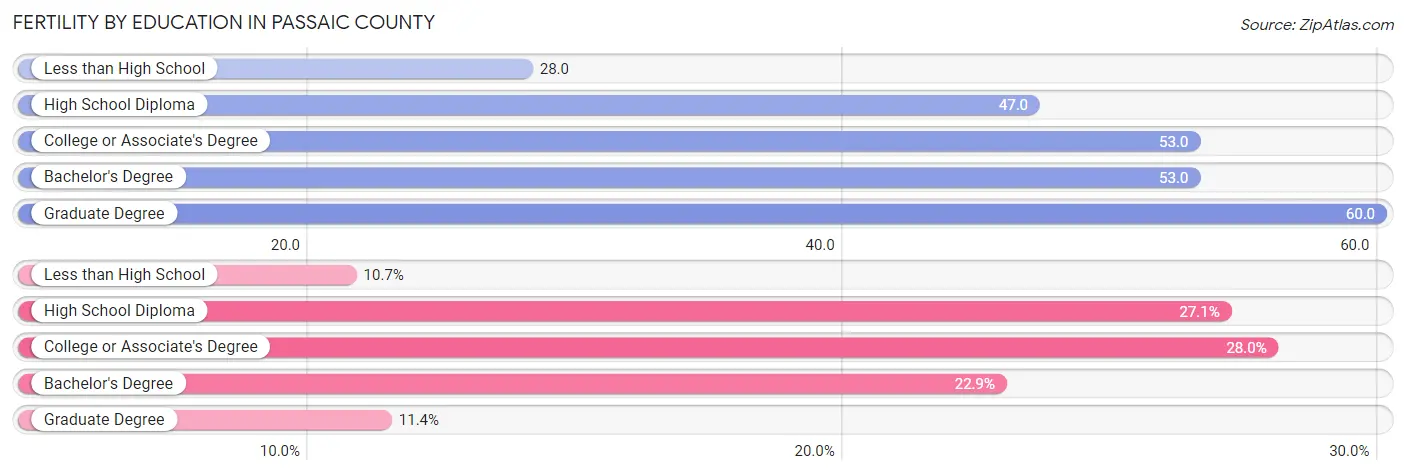
Fertility by Education in Passaic County
Average fertility rate in Passaic County is 48.0 births per 1,000 women. Women with the education attainment of graduate degree have the highest fertility rate of 60.0 births per 1,000 women, while women with the education attainment of less than high school have the lowest fertility at 28.0 births per 1,000 women. Women with the education attainment of college or associate's degree represent 28.0% of all women with births.
| Educational Attainment | Women with Births | Births / 1,000 Women |
| Less than High School | 623 (10.7%) | 28.0 |
| High School Diploma | 1,577 (27.1%) | 47.0 |
| College or Associate's Degree | 1,628 (28.0%) | 53.0 |
| Bachelor's Degree | 1,332 (22.9%) | 53.0 |
| Graduate Degree | 661 (11.4%) | 60.0 |
| Total | 5,821 (100.0%) | 48.0 |
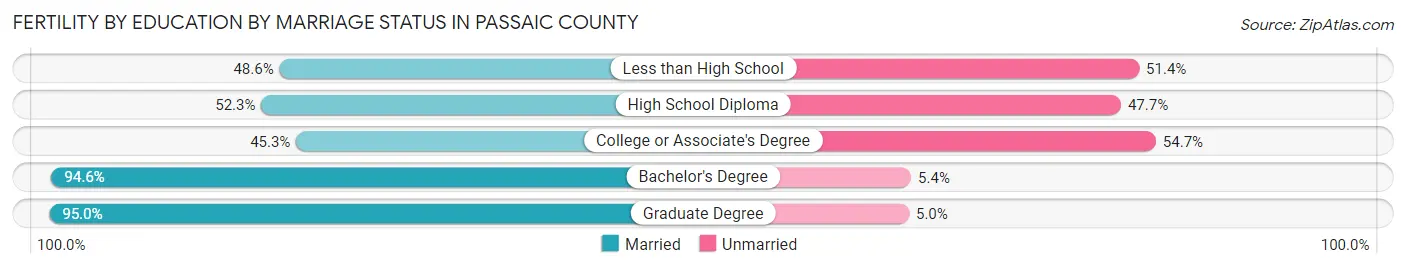
Fertility by Education by Marriage Status in Passaic County
35.5% of women with births in Passaic County are unmarried. Women with the educational attainment of graduate degree are most likely to be married with 95.0% of them married at childbirth, while women with the educational attainment of college or associate's degree are least likely to be married with 54.7% of them unmarried at childbirth.
| Educational Attainment | Married | Unmarried |
| Less than High School | 303 (48.6%) | 320 (51.4%) |
| High School Diploma | 825 (52.3%) | 752 (47.7%) |
| College or Associate's Degree | 737 (45.3%) | 891 (54.7%) |
| Bachelor's Degree | 1,260 (94.6%) | 72 (5.4%) |
| Graduate Degree | 628 (95.0%) | 33 (5.0%) |
| Total | 3,755 (64.5%) | 2,066 (35.5%) |
Income in Passaic County
Income Overview in Passaic County
Per Capita Income in Passaic County is $38,932, while median incomes of families and households are $97,267 and $84,465 respectively.
| Characteristic | Number | Measure |
| Per Capita Income | 519,986 | $38,932 |
| Median Family Income | 127,795 | $97,267 |
| Mean Family Income | 127,795 | $124,975 |
| Median Household Income | 177,209 | $84,465 |
| Mean Household Income | 177,209 | $112,562 |
| Income Deficit | 127,795 | $11,323 |
| Wage / Income Gap (%) | 519,986 | 24.71% |
| Wage / Income Gap ($) | 519,986 | 75.29¢ per $1 |
| Gini / Inequality Index | 519,986 | 0.46 |
Earnings by Sex in Passaic County
Average Earnings in Passaic County are $42,609, $48,262 for men and $36,338 for women, a difference of 24.7%.
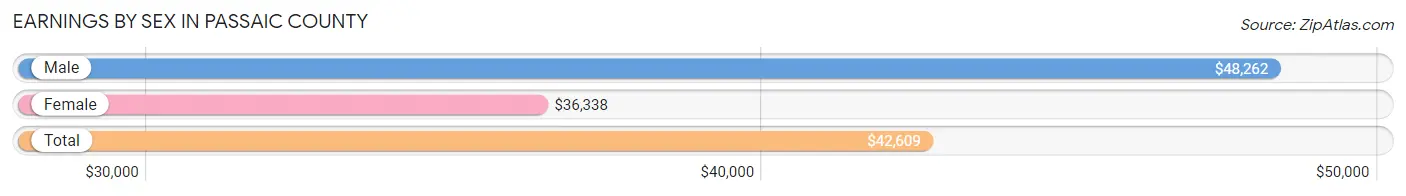
| Sex | Number | Average Earnings |
| Male | 147,310 (52.9%) | $48,262 |
| Female | 131,260 (47.1%) | $36,338 |
| Total | 278,570 (100.0%) | $42,609 |
Earnings by Sex by Income Bracket in Passaic County
The most common earnings brackets in Passaic County are $100,000+ for men (28,885 | 19.6%) and $100,000+ for women (15,938 | 12.1%).
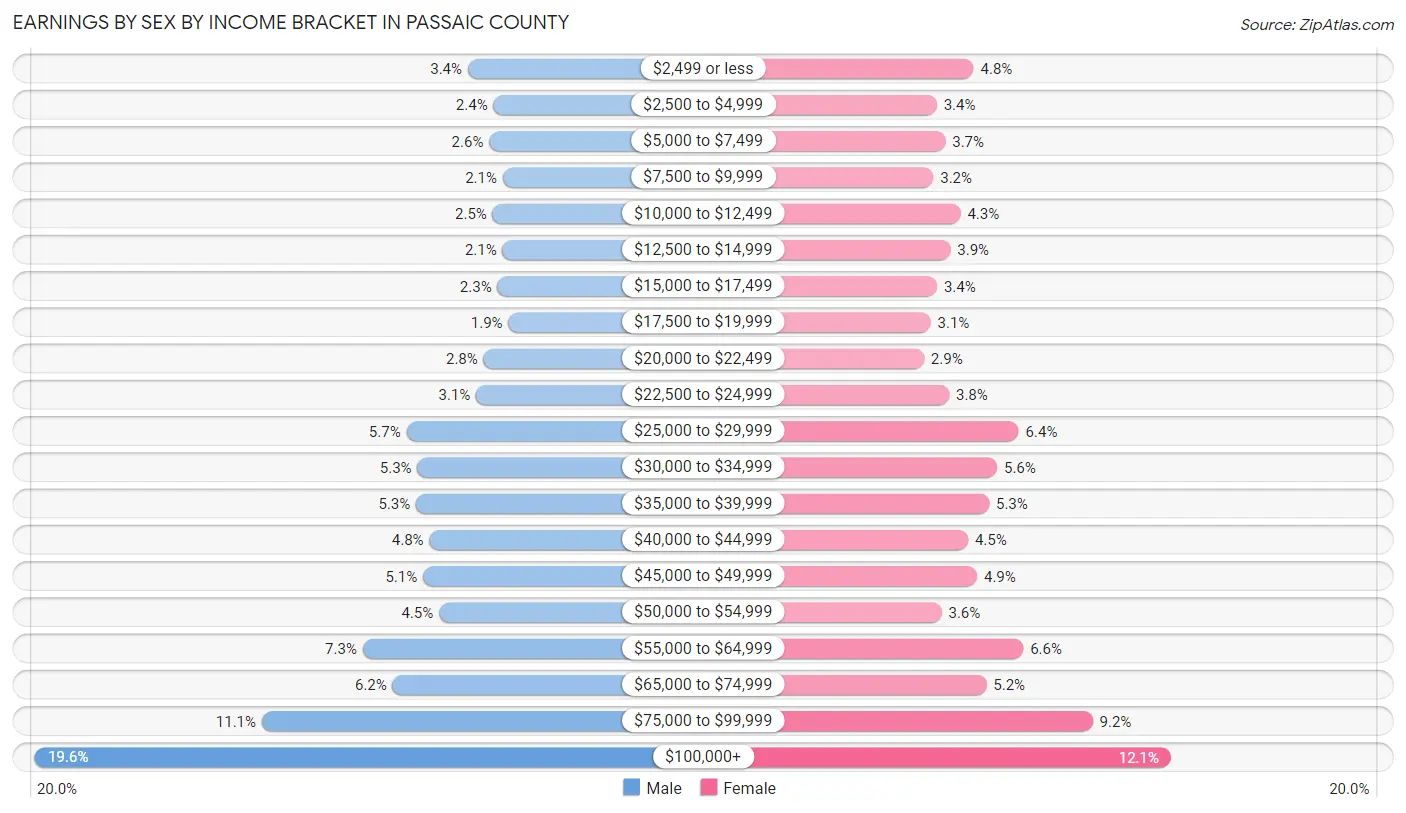
| Income | Male | Female |
| $2,499 or less | 5,001 (3.4%) | 6,233 (4.8%) |
| $2,500 to $4,999 | 3,578 (2.4%) | 4,421 (3.4%) |
| $5,000 to $7,499 | 3,820 (2.6%) | 4,849 (3.7%) |
| $7,500 to $9,999 | 3,065 (2.1%) | 4,249 (3.2%) |
| $10,000 to $12,499 | 3,624 (2.5%) | 5,594 (4.3%) |
| $12,500 to $14,999 | 3,076 (2.1%) | 5,094 (3.9%) |
| $15,000 to $17,499 | 3,352 (2.3%) | 4,440 (3.4%) |
| $17,500 to $19,999 | 2,755 (1.9%) | 4,117 (3.1%) |
| $20,000 to $22,499 | 4,125 (2.8%) | 3,797 (2.9%) |
| $22,500 to $24,999 | 4,542 (3.1%) | 5,021 (3.8%) |
| $25,000 to $29,999 | 8,385 (5.7%) | 8,452 (6.4%) |
| $30,000 to $34,999 | 7,771 (5.3%) | 7,396 (5.6%) |
| $35,000 to $39,999 | 7,845 (5.3%) | 7,000 (5.3%) |
| $40,000 to $44,999 | 7,108 (4.8%) | 5,957 (4.5%) |
| $45,000 to $49,999 | 7,473 (5.1%) | 6,406 (4.9%) |
| $50,000 to $54,999 | 6,585 (4.5%) | 4,661 (3.5%) |
| $55,000 to $64,999 | 10,804 (7.3%) | 8,674 (6.6%) |
| $65,000 to $74,999 | 9,153 (6.2%) | 6,869 (5.2%) |
| $75,000 to $99,999 | 16,363 (11.1%) | 12,092 (9.2%) |
| $100,000+ | 28,885 (19.6%) | 15,938 (12.1%) |
| Total | 147,310 (100.0%) | 131,260 (100.0%) |
Earnings by Sex by Educational Attainment in Passaic County
Average earnings in Passaic County are $54,956 for men and $42,326 for women, a difference of 23.0%. Men with an educational attainment of graduate degree enjoy the highest average annual earnings of $106,332, while those with less than high school education earn the least with $38,275. Women with an educational attainment of graduate degree earn the most with the average annual earnings of $83,554, while those with less than high school education have the smallest earnings of $23,515.
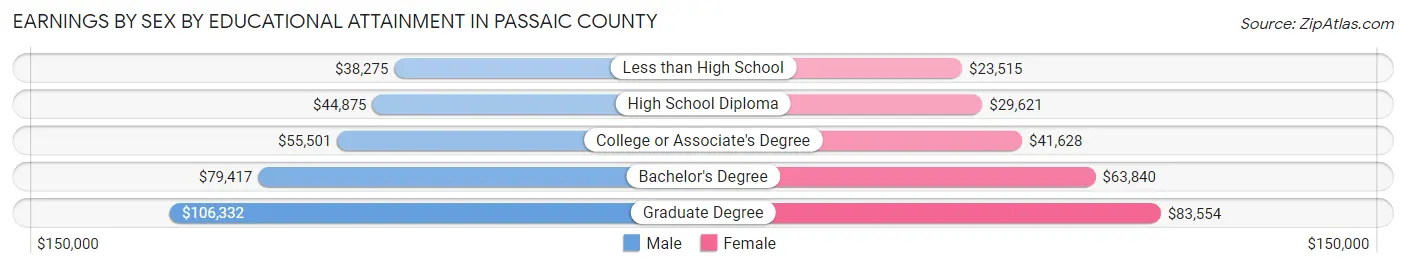
| Educational Attainment | Male Income | Female Income |
| Less than High School | $38,275 | $23,515 |
| High School Diploma | $44,875 | $29,621 |
| College or Associate's Degree | $55,501 | $41,628 |
| Bachelor's Degree | $79,417 | $63,840 |
| Graduate Degree | $106,332 | $83,554 |
| Total | $54,956 | $42,326 |
Family Income in Passaic County
Family Income Brackets in Passaic County
According to the Passaic County family income data, there are 24,537 families falling into the $100,000 to $149,999 income range, which is the most common income bracket and makes up 19.2% of all families. Conversely, the $10,000 to $14,999 income bracket is the least frequent group with only 3,195 families (2.5%) belonging to this category.
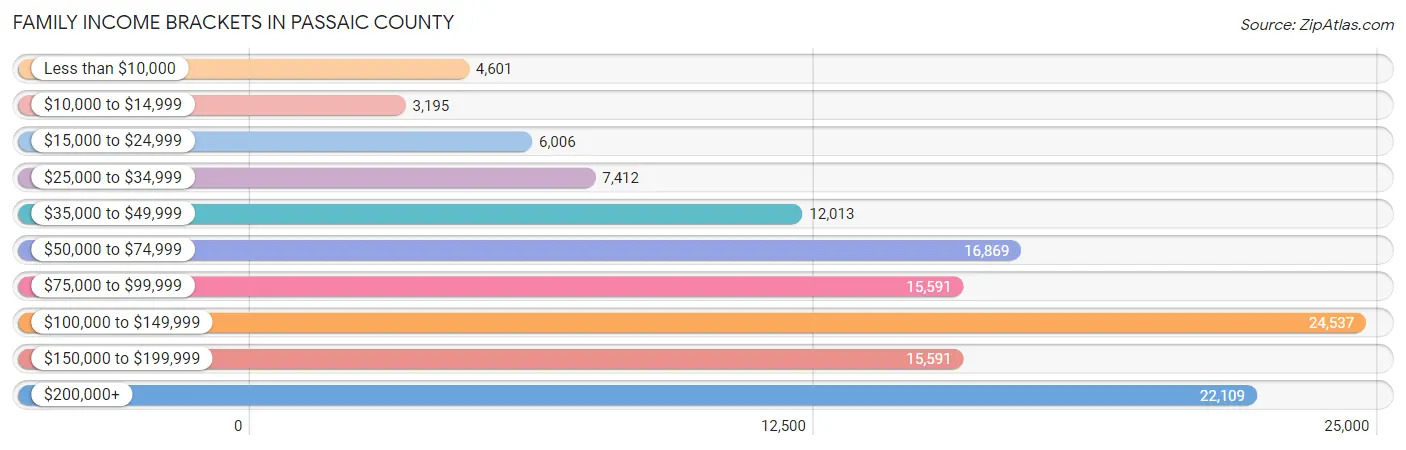
| Income Bracket | # Families | % Families |
| Less than $10,000 | 4,601 | 3.6% |
| $10,000 to $14,999 | 3,195 | 2.5% |
| $15,000 to $24,999 | 6,006 | 4.7% |
| $25,000 to $34,999 | 7,412 | 5.8% |
| $35,000 to $49,999 | 12,013 | 9.4% |
| $50,000 to $74,999 | 16,869 | 13.2% |
| $75,000 to $99,999 | 15,591 | 12.2% |
| $100,000 to $149,999 | 24,537 | 19.2% |
| $150,000 to $199,999 | 15,591 | 12.2% |
| $200,000+ | 22,109 | 17.3% |
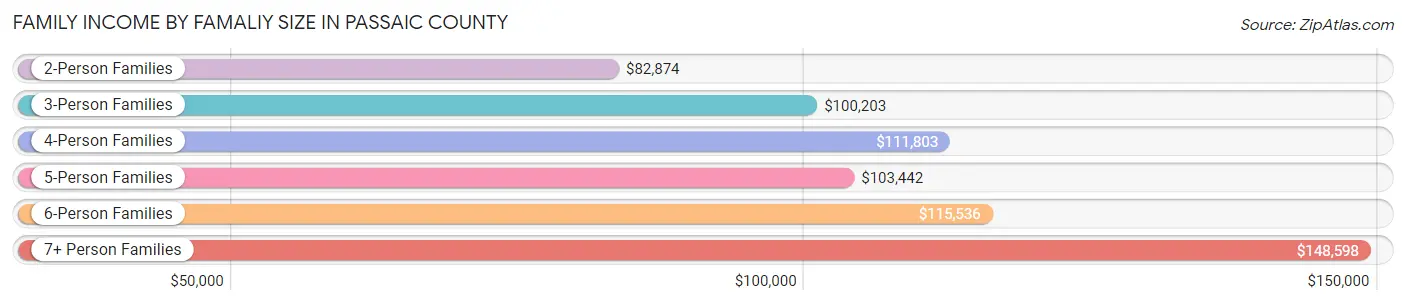
Family Income by Famaliy Size in Passaic County
7+ person families (4,082 | 3.2%) account for the highest median family income in Passaic County with $148,598 per family, while 2-person families (46,230 | 36.2%) have the highest median income of $41,437 per family member.
| Income Bracket | # Families | Median Income |
| 2-Person Families | 46,230 (36.2%) | $82,874 |
| 3-Person Families | 31,341 (24.5%) | $100,203 |
| 4-Person Families | 28,603 (22.4%) | $111,803 |
| 5-Person Families | 12,683 (9.9%) | $103,442 |
| 6-Person Families | 4,856 (3.8%) | $115,536 |
| 7+ Person Families | 4,082 (3.2%) | $148,598 |
| Total | 127,795 (100.0%) | $97,267 |
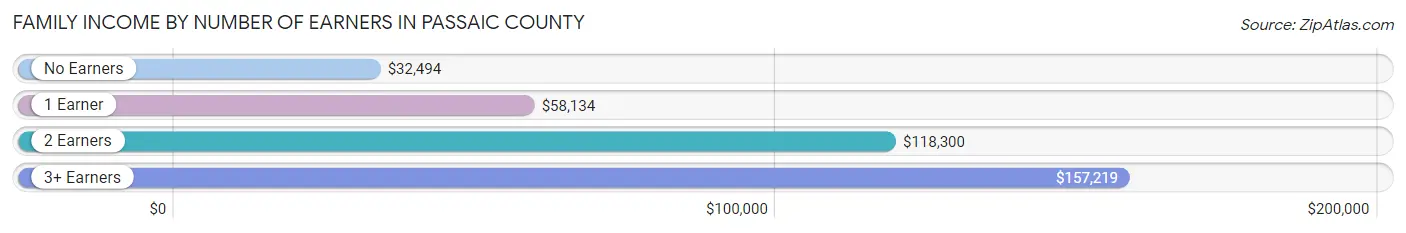
Family Income by Number of Earners in Passaic County
The median family income in Passaic County is $97,267, with families comprising 3+ earners (24,089) having the highest median family income of $157,219, while families with no earners (15,137) have the lowest median family income of $32,494, accounting for 18.9% and 11.8% of families, respectively.
| Number of Earners | # Families | Median Income |
| No Earners | 15,137 (11.8%) | $32,494 |
| 1 Earner | 36,469 (28.5%) | $58,134 |
| 2 Earners | 52,100 (40.8%) | $118,300 |
| 3+ Earners | 24,089 (18.9%) | $157,219 |
| Total | 127,795 (100.0%) | $97,267 |
Household Income in Passaic County
Household Income Brackets in Passaic County
With 31,189 households falling in the category, the $100,000 to $149,999 income range is the most frequent in Passaic County, accounting for 17.6% of all households. In contrast, only 7,266 households (4.1%) fall into the $10,000 to $14,999 income bracket, making it the least populous group.

| Income Bracket | # Households | % Households |
| Less than $10,000 | 7,974 | 4.5% |
| $10,000 to $14,999 | 7,266 | 4.1% |
| $15,000 to $24,999 | 11,164 | 6.3% |
| $25,000 to $34,999 | 12,227 | 6.9% |
| $35,000 to $49,999 | 17,189 | 9.7% |
| $50,000 to $74,999 | 24,809 | 14.0% |
| $75,000 to $99,999 | 20,911 | 11.8% |
| $100,000 to $149,999 | 31,189 | 17.6% |
| $150,000 to $199,999 | 18,607 | 10.5% |
| $200,000+ | 26,050 | 14.7% |
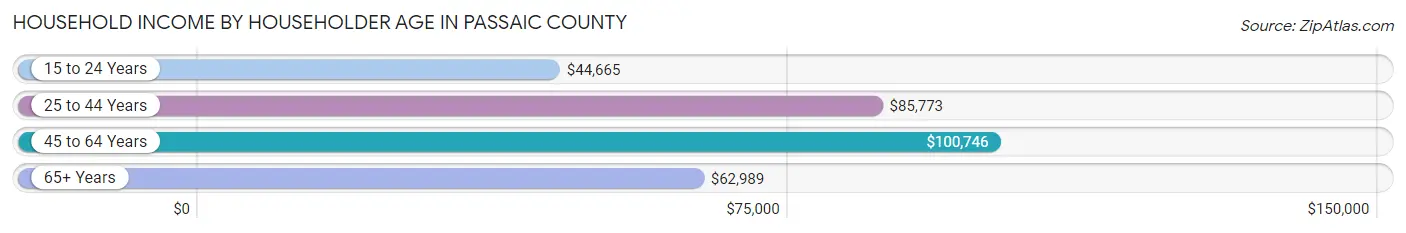
Household Income by Householder Age in Passaic County
The median household income in Passaic County is $84,465, with the highest median household income of $100,746 found in the 45 to 64 years age bracket for the primary householder. A total of 73,728 households (41.6%) fall into this category. Meanwhile, the 15 to 24 years age bracket for the primary householder has the lowest median household income of $44,665, with 2,712 households (1.5%) in this group.
| Income Bracket | # Households | Median Income |
| 15 to 24 Years | 2,712 (1.5%) | $44,665 |
| 25 to 44 Years | 55,178 (31.1%) | $85,773 |
| 45 to 64 Years | 73,728 (41.6%) | $100,746 |
| 65+ Years | 45,591 (25.7%) | $62,989 |
| Total | 177,209 (100.0%) | $84,465 |
Poverty in Passaic County
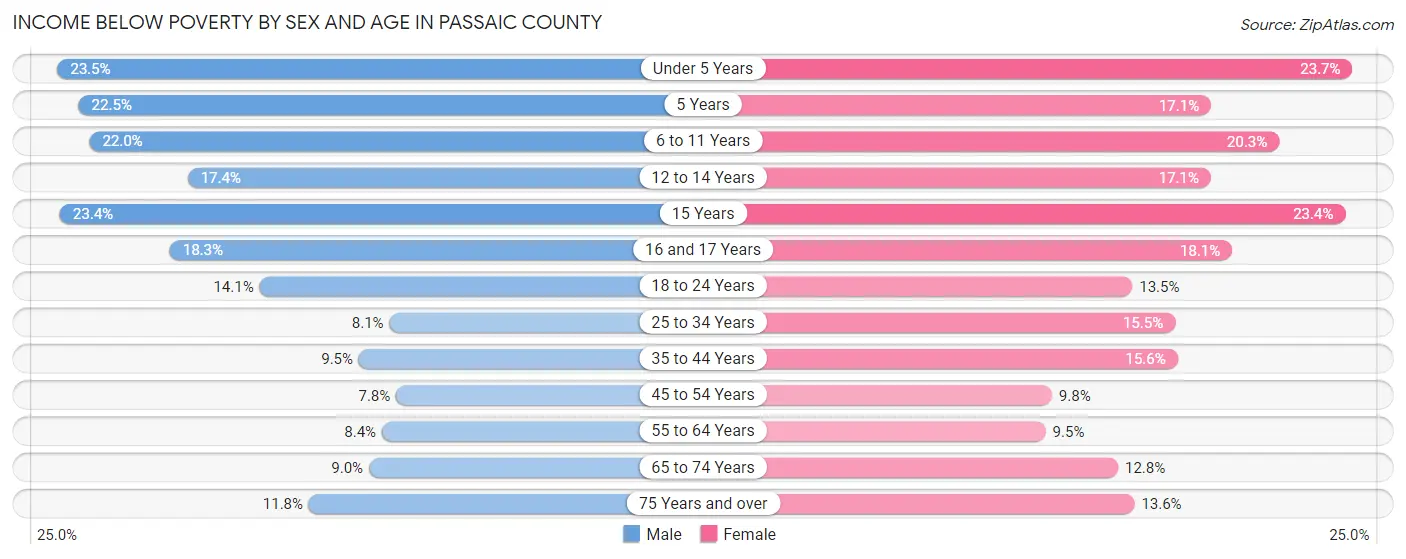
Income Below Poverty by Sex and Age in Passaic County
With 12.4% poverty level for males and 14.5% for females among the residents of Passaic County, under 5 year old males and under 5 year old females are the most vulnerable to poverty, with 3,985 males (23.5%) and 3,851 females (23.7%) in their respective age groups living below the poverty level.
| Age Bracket | Male | Female |
| Under 5 Years | 3,985 (23.5%) | 3,851 (23.7%) |
| 5 Years | 870 (22.5%) | 588 (17.1%) |
| 6 to 11 Years | 4,486 (22.0%) | 3,809 (20.3%) |
| 12 to 14 Years | 1,881 (17.4%) | 1,843 (17.1%) |
| 15 Years | 860 (23.4%) | 825 (23.4%) |
| 16 and 17 Years | 1,277 (18.3%) | 1,191 (18.1%) |
| 18 to 24 Years | 3,323 (14.1%) | 3,127 (13.5%) |
| 25 to 34 Years | 2,801 (8.1%) | 5,275 (15.5%) |
| 35 to 44 Years | 3,125 (9.5%) | 5,086 (15.6%) |
| 45 to 54 Years | 2,557 (7.8%) | 3,278 (9.8%) |
| 55 to 64 Years | 2,726 (8.4%) | 3,202 (9.5%) |
| 65 to 74 Years | 1,875 (9.0%) | 3,094 (12.8%) |
| 75 Years and over | 1,473 (11.8%) | 2,587 (13.6%) |
| Total | 31,239 (12.4%) | 37,756 (14.5%) |
Income Above Poverty by Sex and Age in Passaic County
According to the poverty statistics in Passaic County, males aged 45 to 54 years and females aged 55 to 64 years are the age groups that are most secure financially, with 92.2% of males and 90.5% of females in these age groups living above the poverty line.
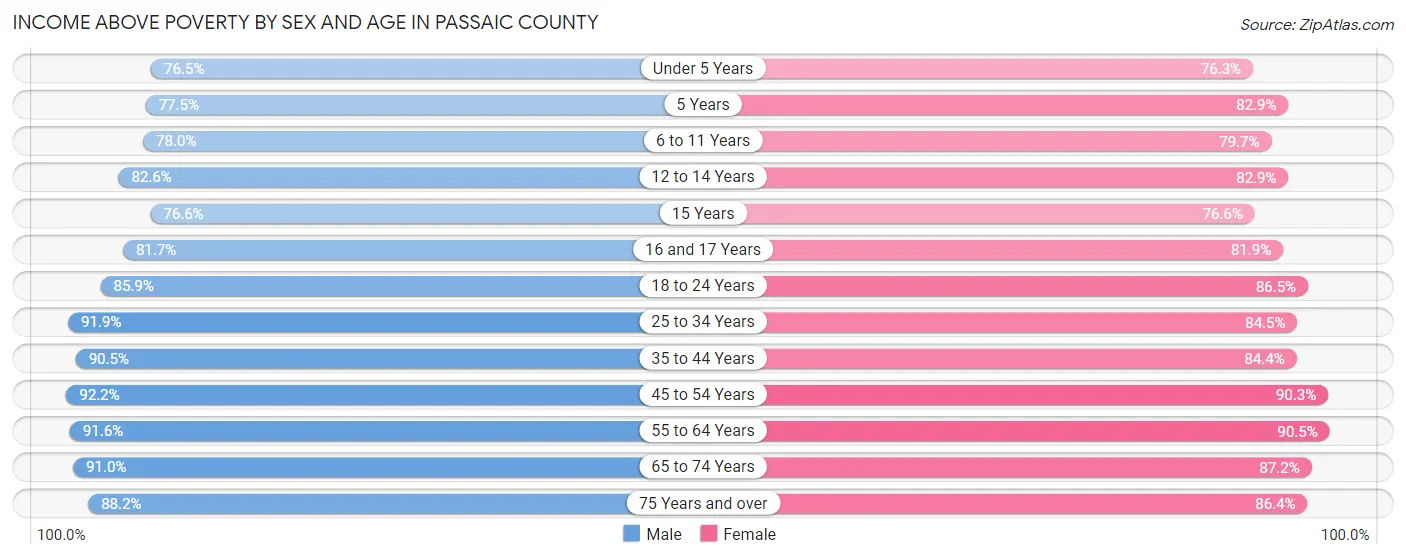
| Age Bracket | Male | Female |
| Under 5 Years | 12,989 (76.5%) | 12,408 (76.3%) |
| 5 Years | 2,998 (77.5%) | 2,845 (82.9%) |
| 6 to 11 Years | 15,918 (78.0%) | 14,965 (79.7%) |
| 12 to 14 Years | 8,911 (82.6%) | 8,923 (82.9%) |
| 15 Years | 2,822 (76.6%) | 2,706 (76.6%) |
| 16 and 17 Years | 5,715 (81.7%) | 5,384 (81.9%) |
| 18 to 24 Years | 20,238 (85.9%) | 20,070 (86.5%) |
| 25 to 34 Years | 31,913 (91.9%) | 28,850 (84.5%) |
| 35 to 44 Years | 29,810 (90.5%) | 27,548 (84.4%) |
| 45 to 54 Years | 30,405 (92.2%) | 30,346 (90.2%) |
| 55 to 64 Years | 29,666 (91.6%) | 30,649 (90.5%) |
| 65 to 74 Years | 18,907 (91.0%) | 21,042 (87.2%) |
| 75 Years and over | 11,000 (88.2%) | 16,463 (86.4%) |
| Total | 221,292 (87.6%) | 222,199 (85.5%) |
Income Below Poverty Among Married-Couple Families in Passaic County
The poverty statistics for married-couple families in Passaic County show that 4.9% or 4,099 of the total 83,411 families live below the poverty line. Families with 3 or 4 children have the highest poverty rate of 18.1%, comprising of 1,082 families. On the other hand, families with no children have the lowest poverty rate of 3.6%, which includes 1,650 families.
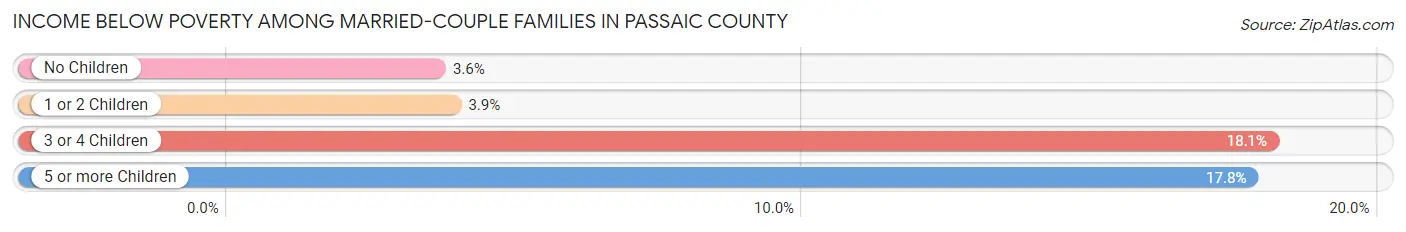
| Children | Above Poverty | Below Poverty |
| No Children | 43,908 (96.4%) | 1,650 (3.6%) |
| 1 or 2 Children | 29,759 (96.1%) | 1,204 (3.9%) |
| 3 or 4 Children | 4,890 (81.9%) | 1,082 (18.1%) |
| 5 or more Children | 755 (82.2%) | 163 (17.8%) |
| Total | 79,312 (95.1%) | 4,099 (4.9%) |
Income Below Poverty Among Single-Parent Households in Passaic County
According to the poverty data in Passaic County, 12.4% or 1,451 single-father households and 25.5% or 8,338 single-mother households are living below the poverty line. Among single-father households, those with 5 or more children have the highest poverty rate, with 19 households (38.0%) experiencing poverty. Likewise, among single-mother households, those with 5 or more children have the highest poverty rate, with 212 households (61.8%) falling below the poverty line.
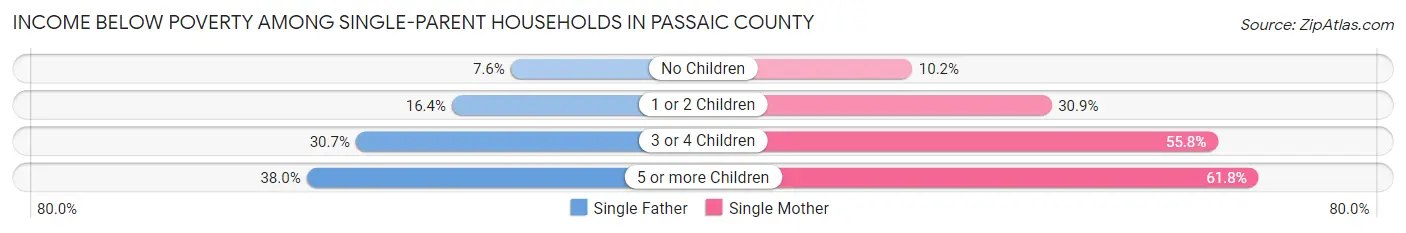
| Children | Single Father | Single Mother |
| No Children | 518 (7.6%) | 1,340 (10.2%) |
| 1 or 2 Children | 635 (16.4%) | 4,866 (30.9%) |
| 3 or 4 Children | 279 (30.7%) | 1,920 (55.8%) |
| 5 or more Children | 19 (38.0%) | 212 (61.8%) |
| Total | 1,451 (12.4%) | 8,338 (25.5%) |
Income Below Poverty Among Married-Couple vs Single-Parent Households in Passaic County
The poverty data for Passaic County shows that 4,099 of the married-couple family households (4.9%) and 9,789 of the single-parent households (22.1%) are living below the poverty level. Within the married-couple family households, those with 3 or 4 children have the highest poverty rate, with 1,082 households (18.1%) falling below the poverty line. Among the single-parent households, those with 5 or more children have the highest poverty rate, with 231 household (58.8%) living below poverty.
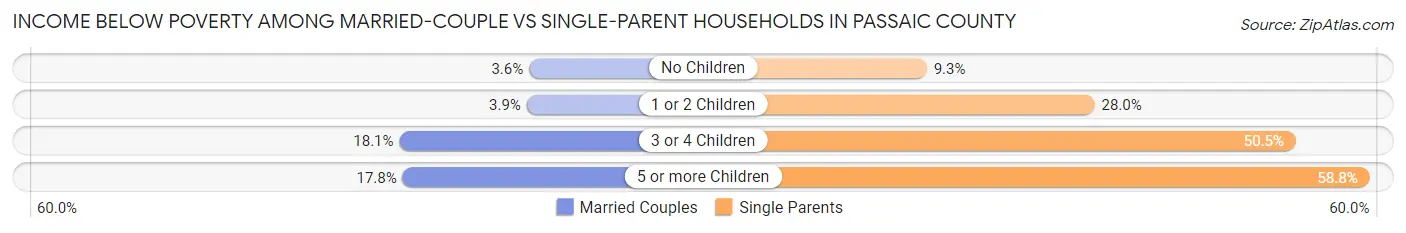
| Children | Married-Couple Families | Single-Parent Households |
| No Children | 1,650 (3.6%) | 1,858 (9.3%) |
| 1 or 2 Children | 1,204 (3.9%) | 5,501 (28.0%) |
| 3 or 4 Children | 1,082 (18.1%) | 2,199 (50.5%) |
| 5 or more Children | 163 (17.8%) | 231 (58.8%) |
| Total | 4,099 (4.9%) | 9,789 (22.1%) |
Employment Characteristics in Passaic County
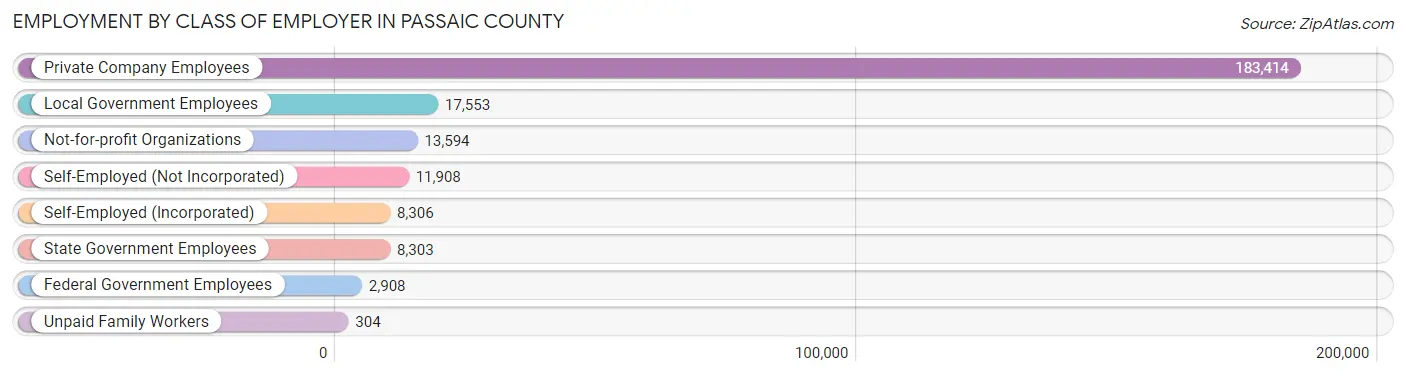
Employment by Class of Employer in Passaic County
Among the 246,290 employed individuals in Passaic County, private company employees (183,414 | 74.5%), local government employees (17,553 | 7.1%), and not-for-profit organizations (13,594 | 5.5%) make up the most common classes of employment.
| Employer Class | # Employees | % Employees |
| Private Company Employees | 183,414 | 74.5% |
| Self-Employed (Incorporated) | 8,306 | 3.4% |
| Self-Employed (Not Incorporated) | 11,908 | 4.8% |
| Not-for-profit Organizations | 13,594 | 5.5% |
| Local Government Employees | 17,553 | 7.1% |
| State Government Employees | 8,303 | 3.4% |
| Federal Government Employees | 2,908 | 1.2% |
| Unpaid Family Workers | 304 | 0.1% |
| Total | 246,290 | 100.0% |
Employment Status by Age in Passaic County
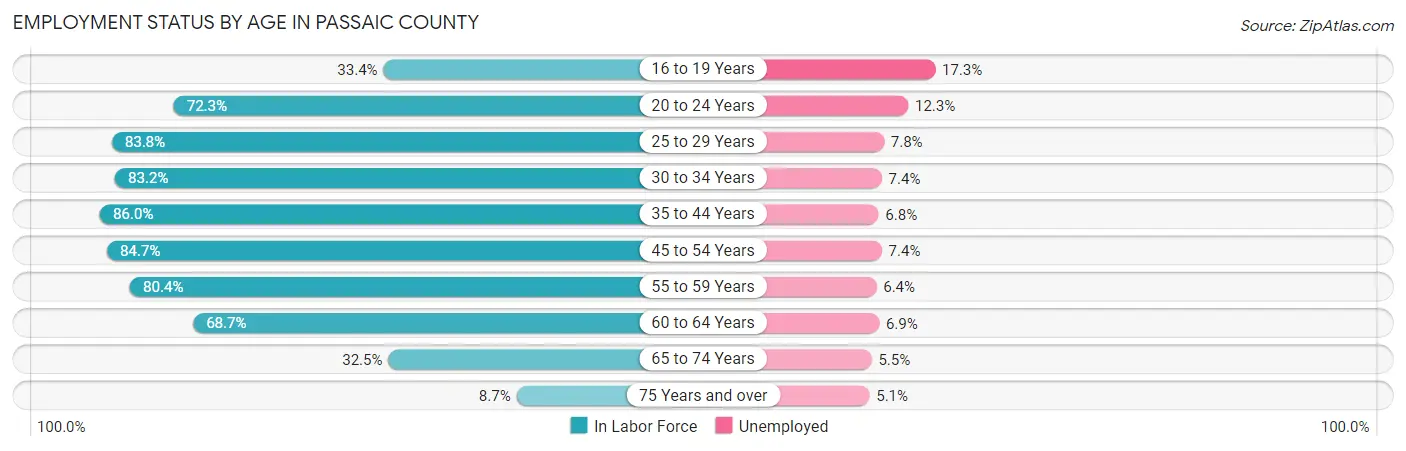
According to the labor force statistics for Passaic County, out of the total population over 16 years of age (410,610), 66.6% or 273,466 individuals are in the labor force, with 7.8% or 21,330 of them unemployed. The age group with the highest labor force participation rate is 35 to 44 years, with 86.0% or 56,564 individuals in the labor force. Within the labor force, the 16 to 19 years age range has the highest percentage of unemployed individuals, with 17.3% or 1,637 of them being unemployed.
| Age Bracket | In Labor Force | Unemployed |
| 16 to 19 Years | 9,464 (33.4%) | 1,637 (17.3%) |
| 20 to 24 Years | 25,916 (72.3%) | 3,188 (12.3%) |
| 25 to 29 Years | 29,151 (83.8%) | 2,274 (7.8%) |
| 30 to 34 Years | 28,573 (83.2%) | 2,114 (7.4%) |
| 35 to 44 Years | 56,564 (86.0%) | 3,846 (6.8%) |
| 45 to 54 Years | 56,514 (84.7%) | 4,182 (7.4%) |
| 55 to 59 Years | 27,662 (80.4%) | 1,770 (6.4%) |
| 60 to 64 Years | 21,957 (68.7%) | 1,515 (6.9%) |
| 65 to 74 Years | 14,725 (32.5%) | 810 (5.5%) |
| 75 Years and over | 2,882 (8.7%) | 147 (5.1%) |
| Total | 273,466 (66.6%) | 21,330 (7.8%) |
Employment Status by Educational Attainment in Passaic County
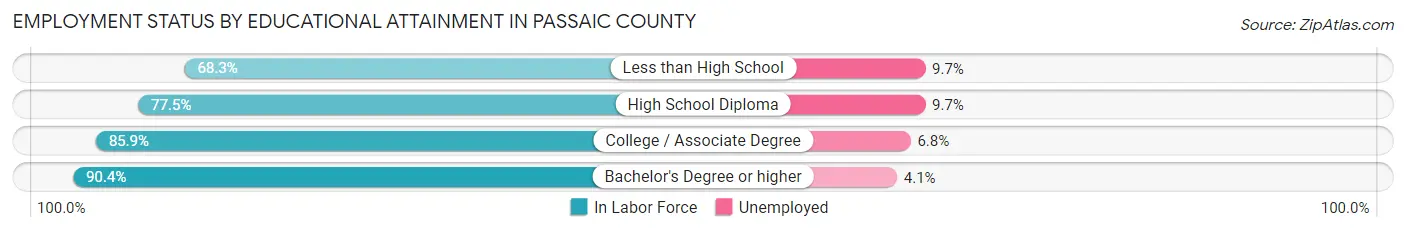
According to labor force statistics for Passaic County, 82.2% of individuals (220,288) out of the total population between 25 and 64 years of age (267,990) are in the labor force, with 7.1% or 15,640 of them being unemployed. The group with the highest labor force participation rate are those with the educational attainment of bachelor's degree or higher, with 90.4% or 75,535 individuals in the labor force. Within the labor force, individuals with less than high school education have the highest percentage of unemployment, with 9.7% or 2,290 of them being unemployed.
| Educational Attainment | In Labor Force | Unemployed |
| Less than High School | 23,609 (68.3%) | 3,353 (9.7%) |
| High School Diploma | 69,389 (77.5%) | 8,685 (9.7%) |
| College / Associate Degree | 51,827 (85.9%) | 4,103 (6.8%) |
| Bachelor's Degree or higher | 75,535 (90.4%) | 3,426 (4.1%) |
| Total | 220,288 (82.2%) | 19,027 (7.1%) |
Employment Occupations by Sex in Passaic County
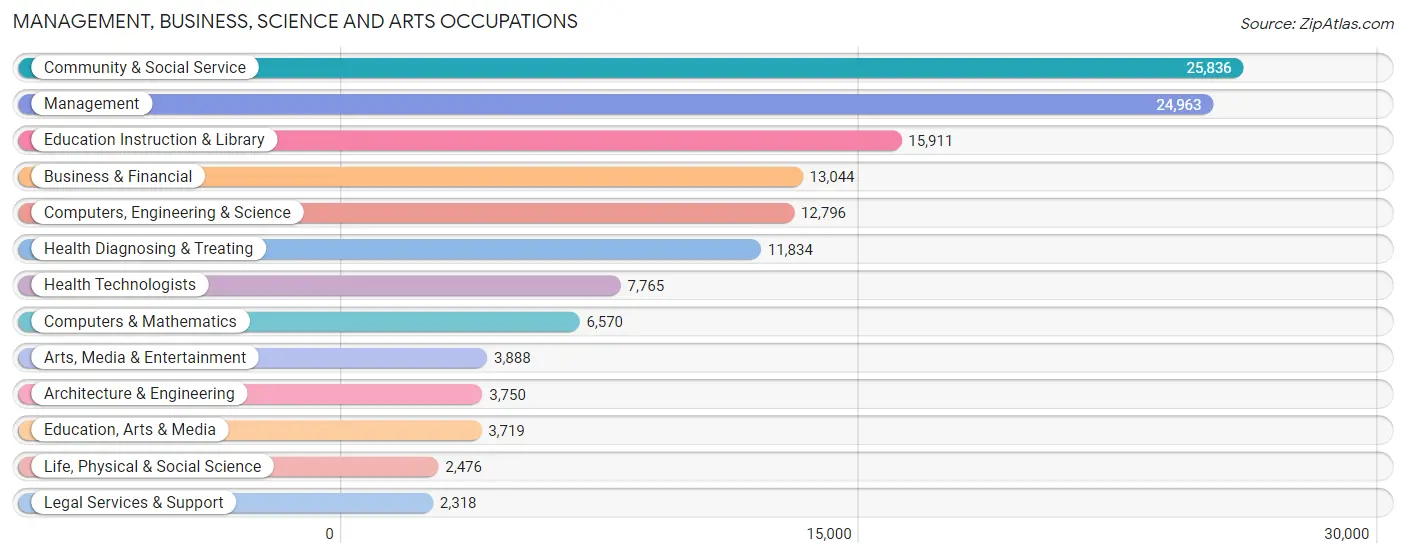
Management, Business, Science and Arts Occupations
The most common Management, Business, Science and Arts occupations in Passaic County are Community & Social Service (25,836 | 10.3%), Management (24,963 | 9.9%), Education Instruction & Library (15,911 | 6.3%), Business & Financial (13,044 | 5.2%), and Computers, Engineering & Science (12,796 | 5.1%).
Management, Business, Science and Arts Occupations by Sex
Within the Management, Business, Science and Arts occupations in Passaic County, the most male-oriented occupations are Architecture & Engineering (84.4%), Computers & Mathematics (76.6%), and Computers, Engineering & Science (72.7%), while the most female-oriented occupations are Education Instruction & Library (75.9%), Health Diagnosing & Treating (75.3%), and Health Technologists (74.3%).
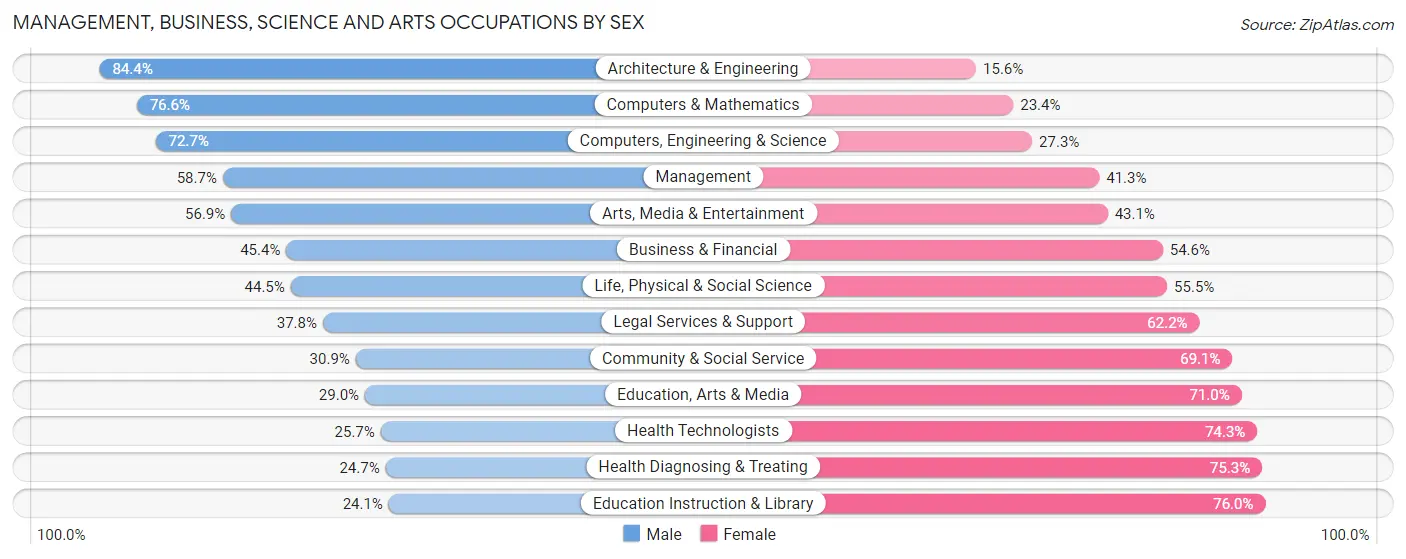
| Occupation | Male | Female |
| Management | 14,646 (58.7%) | 10,317 (41.3%) |
| Business & Financial | 5,925 (45.4%) | 7,119 (54.6%) |
| Computers, Engineering & Science | 9,299 (72.7%) | 3,497 (27.3%) |
| Computers & Mathematics | 5,033 (76.6%) | 1,537 (23.4%) |
| Architecture & Engineering | 3,164 (84.4%) | 586 (15.6%) |
| Life, Physical & Social Science | 1,102 (44.5%) | 1,374 (55.5%) |
| Community & Social Service | 7,994 (30.9%) | 17,842 (69.1%) |
| Education, Arts & Media | 1,079 (29.0%) | 2,640 (71.0%) |
| Legal Services & Support | 876 (37.8%) | 1,442 (62.2%) |
| Education Instruction & Library | 3,826 (24.0%) | 12,085 (75.9%) |
| Arts, Media & Entertainment | 2,213 (56.9%) | 1,675 (43.1%) |
| Health Diagnosing & Treating | 2,925 (24.7%) | 8,909 (75.3%) |
| Health Technologists | 1,999 (25.7%) | 5,766 (74.3%) |
| Total (Category) | 40,789 (46.1%) | 47,684 (53.9%) |
| Total (Overall) | 133,387 (53.0%) | 118,434 (47.0%) |
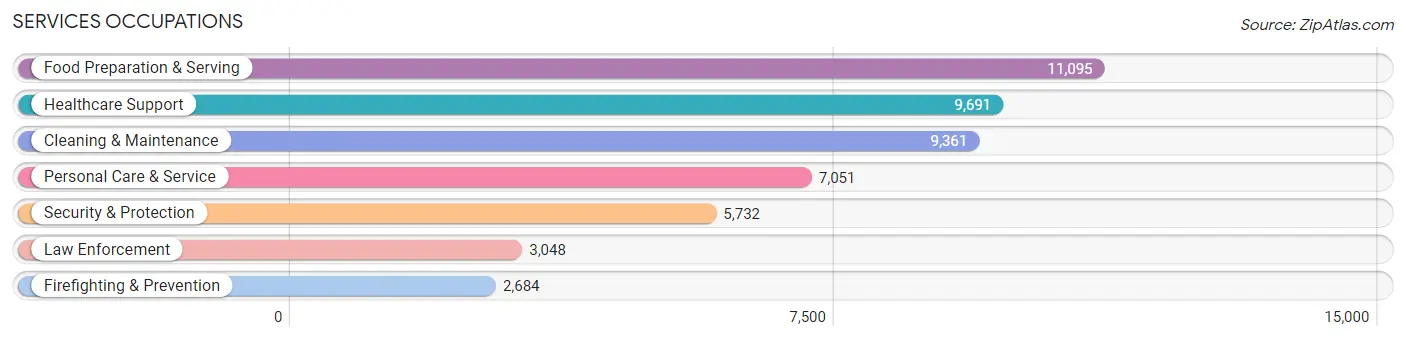
Services Occupations
The most common Services occupations in Passaic County are Food Preparation & Serving (11,095 | 4.4%), Healthcare Support (9,691 | 3.8%), Cleaning & Maintenance (9,361 | 3.7%), Personal Care & Service (7,051 | 2.8%), and Security & Protection (5,732 | 2.3%).
Services Occupations by Sex
Within the Services occupations in Passaic County, the most male-oriented occupations are Law Enforcement (83.9%), Security & Protection (80.2%), and Firefighting & Prevention (76.1%), while the most female-oriented occupations are Healthcare Support (86.8%), Personal Care & Service (75.8%), and Food Preparation & Serving (51.0%).
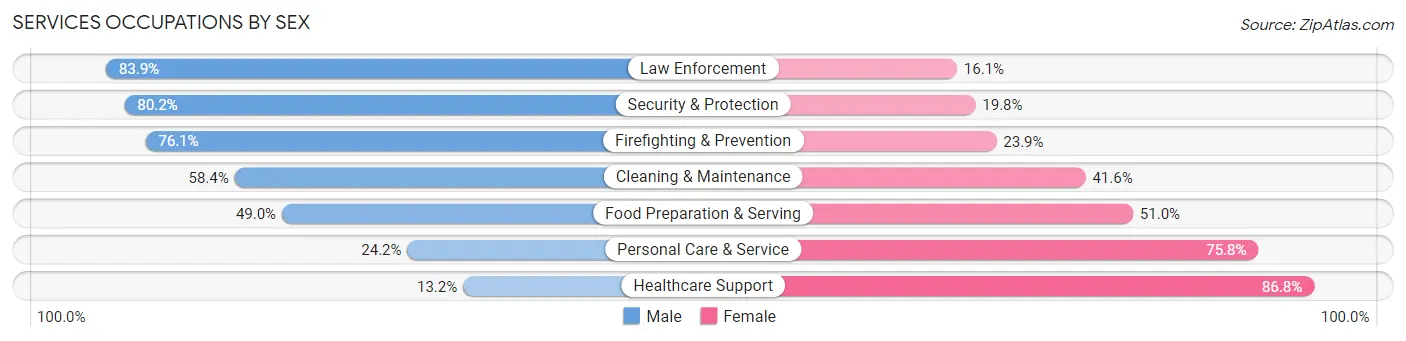
| Occupation | Male | Female |
| Healthcare Support | 1,277 (13.2%) | 8,414 (86.8%) |
| Security & Protection | 4,599 (80.2%) | 1,133 (19.8%) |
| Firefighting & Prevention | 2,042 (76.1%) | 642 (23.9%) |
| Law Enforcement | 2,557 (83.9%) | 491 (16.1%) |
| Food Preparation & Serving | 5,441 (49.0%) | 5,654 (51.0%) |
| Cleaning & Maintenance | 5,470 (58.4%) | 3,891 (41.6%) |
| Personal Care & Service | 1,706 (24.2%) | 5,345 (75.8%) |
| Total (Category) | 18,493 (43.1%) | 24,437 (56.9%) |
| Total (Overall) | 133,387 (53.0%) | 118,434 (47.0%) |
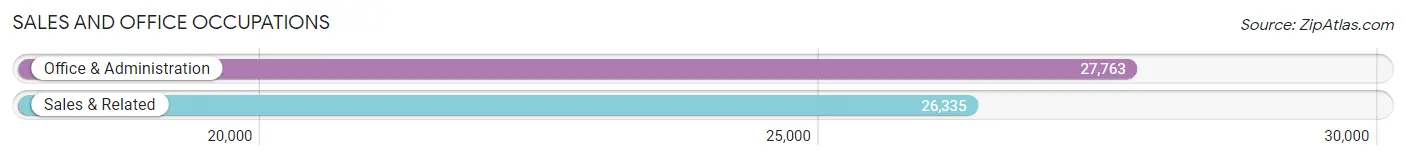
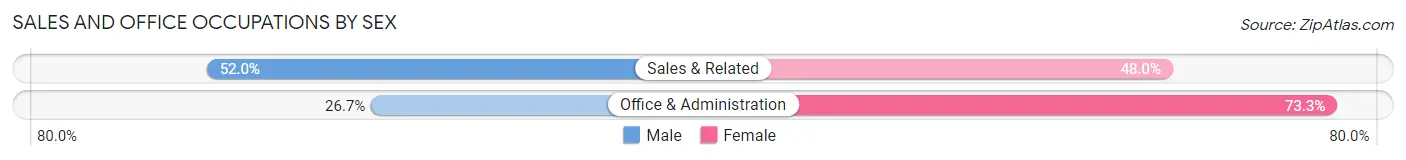
Sales and Office Occupations
The most common Sales and Office occupations in Passaic County are Office & Administration (27,763 | 11.0%), and Sales & Related (26,335 | 10.5%).
Sales and Office Occupations by Sex
| Occupation | Male | Female |
| Sales & Related | 13,690 (52.0%) | 12,645 (48.0%) |
| Office & Administration | 7,406 (26.7%) | 20,357 (73.3%) |
| Total (Category) | 21,096 (39.0%) | 33,002 (61.0%) |
| Total (Overall) | 133,387 (53.0%) | 118,434 (47.0%) |
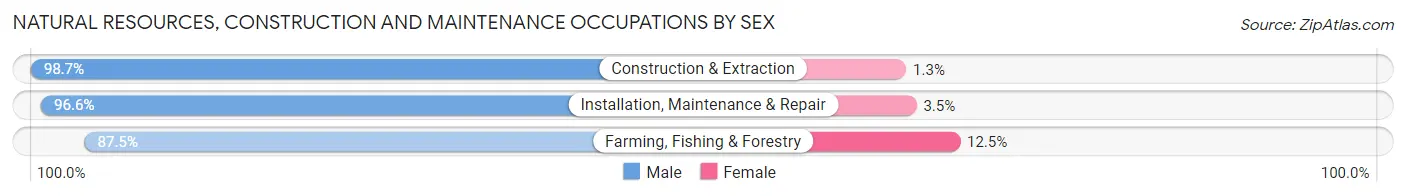
Natural Resources, Construction and Maintenance Occupations
The most common Natural Resources, Construction and Maintenance occupations in Passaic County are Construction & Extraction (12,406 | 4.9%), Installation, Maintenance & Repair (7,760 | 3.1%), and Farming, Fishing & Forestry (312 | 0.1%).

Natural Resources, Construction and Maintenance Occupations by Sex
| Occupation | Male | Female |
| Farming, Fishing & Forestry | 273 (87.5%) | 39 (12.5%) |
| Construction & Extraction | 12,245 (98.7%) | 161 (1.3%) |
| Installation, Maintenance & Repair | 7,492 (96.6%) | 268 (3.5%) |
| Total (Category) | 20,010 (97.7%) | 468 (2.3%) |
| Total (Overall) | 133,387 (53.0%) | 118,434 (47.0%) |
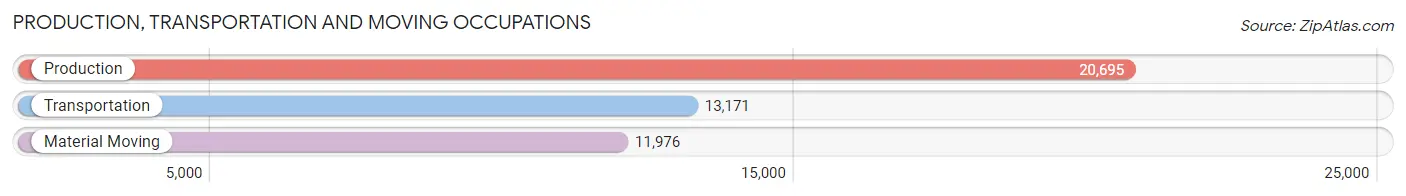
Production, Transportation and Moving Occupations
The most common Production, Transportation and Moving occupations in Passaic County are Production (20,695 | 8.2%), Transportation (13,171 | 5.2%), and Material Moving (11,976 | 4.8%).
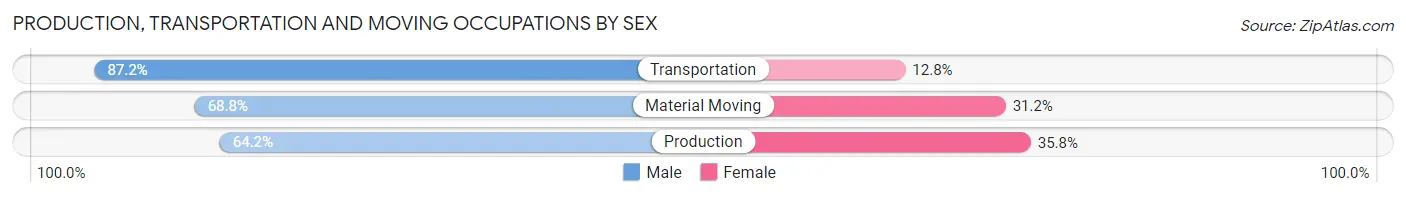
Production, Transportation and Moving Occupations by Sex
| Occupation | Male | Female |
| Production | 13,279 (64.2%) | 7,416 (35.8%) |
| Transportation | 11,483 (87.2%) | 1,688 (12.8%) |
| Material Moving | 8,237 (68.8%) | 3,739 (31.2%) |
| Total (Category) | 32,999 (72.0%) | 12,843 (28.0%) |
| Total (Overall) | 133,387 (53.0%) | 118,434 (47.0%) |
Employment Industries by Sex in Passaic County
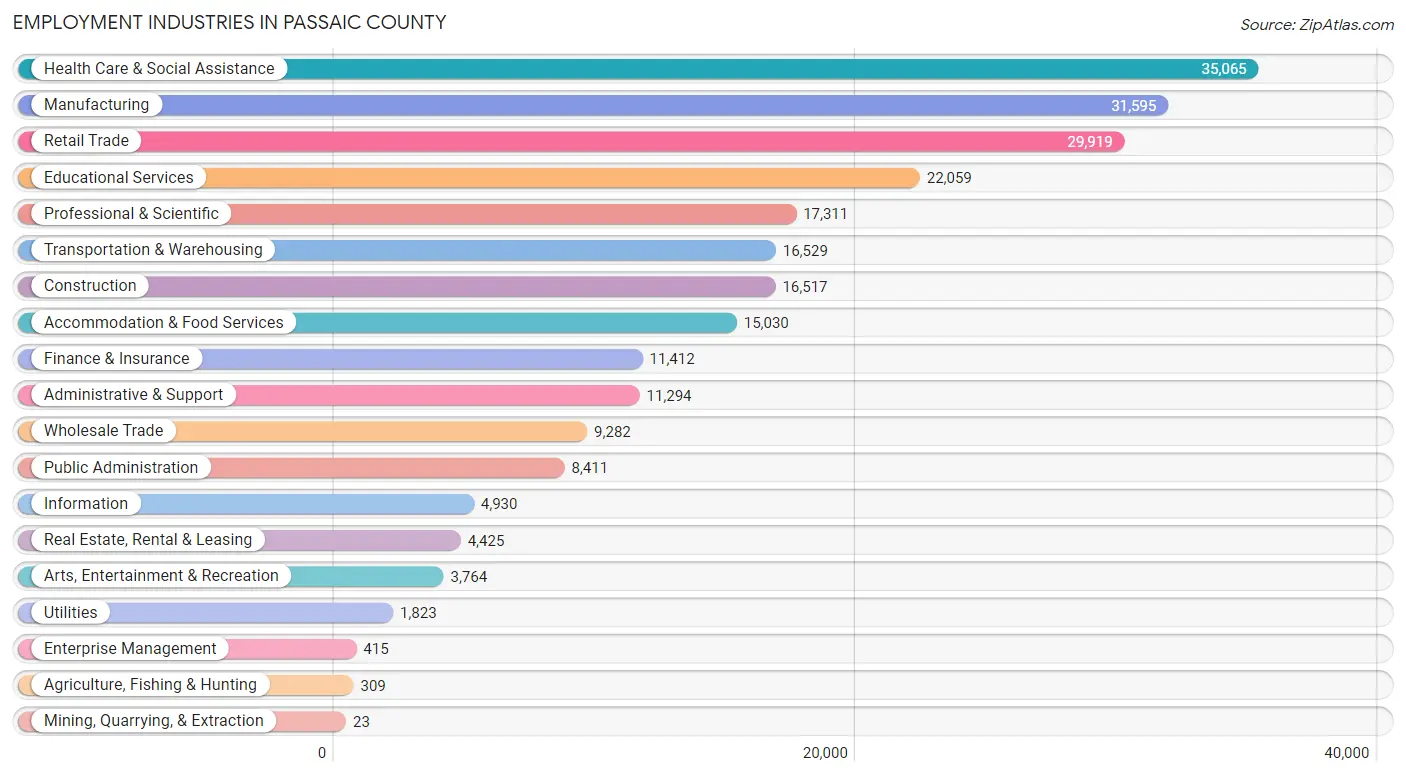
Employment Industries in Passaic County
The major employment industries in Passaic County include Health Care & Social Assistance (35,065 | 13.9%), Manufacturing (31,595 | 12.6%), Retail Trade (29,919 | 11.9%), Educational Services (22,059 | 8.8%), and Professional & Scientific (17,311 | 6.9%).
Employment Industries by Sex in Passaic County
The Passaic County industries that see more men than women are Construction (90.2%), Agriculture, Fishing & Hunting (79.9%), and Utilities (77.2%), whereas the industries that tend to have a higher number of women are Health Care & Social Assistance (80.2%), Mining, Quarrying, & Extraction (73.9%), and Educational Services (68.6%).

| Industry | Male | Female |
| Agriculture, Fishing & Hunting | 247 (79.9%) | 62 (20.1%) |
| Mining, Quarrying, & Extraction | 6 (26.1%) | 17 (73.9%) |
| Construction | 14,892 (90.2%) | 1,625 (9.8%) |
| Manufacturing | 19,868 (62.9%) | 11,727 (37.1%) |
| Wholesale Trade | 5,997 (64.6%) | 3,285 (35.4%) |
| Retail Trade | 16,087 (53.8%) | 13,832 (46.2%) |
| Transportation & Warehousing | 12,598 (76.2%) | 3,931 (23.8%) |
| Utilities | 1,408 (77.2%) | 415 (22.8%) |
| Information | 2,999 (60.8%) | 1,931 (39.2%) |
| Finance & Insurance | 5,529 (48.4%) | 5,883 (51.5%) |
| Real Estate, Rental & Leasing | 2,595 (58.6%) | 1,830 (41.4%) |
| Professional & Scientific | 9,106 (52.6%) | 8,205 (47.4%) |
| Enterprise Management | 230 (55.4%) | 185 (44.6%) |
| Administrative & Support | 7,260 (64.3%) | 4,034 (35.7%) |
| Educational Services | 6,927 (31.4%) | 15,132 (68.6%) |
| Health Care & Social Assistance | 6,936 (19.8%) | 28,129 (80.2%) |
| Arts, Entertainment & Recreation | 1,754 (46.6%) | 2,010 (53.4%) |
| Accommodation & Food Services | 7,744 (51.5%) | 7,286 (48.5%) |
| Public Administration | 5,111 (60.8%) | 3,300 (39.2%) |
| Total | 133,387 (53.0%) | 118,434 (47.0%) |
Education in Passaic County
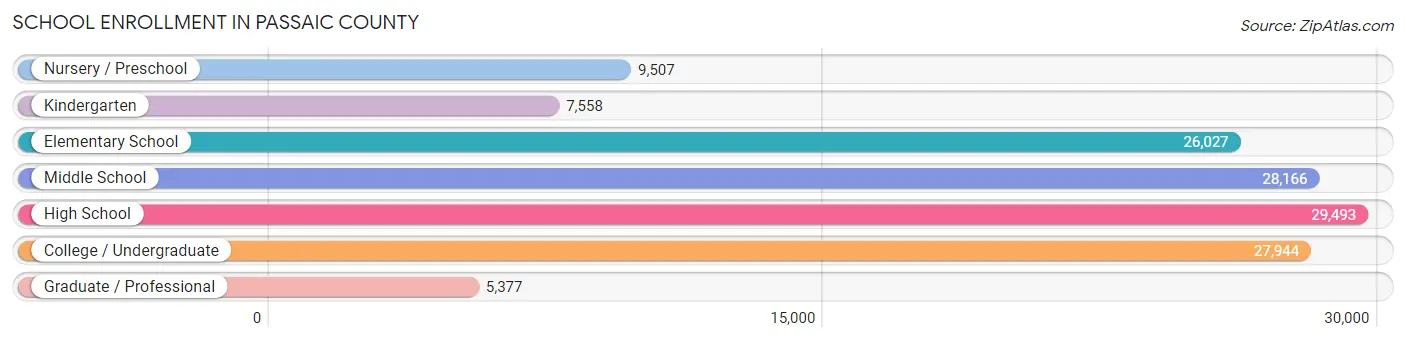
School Enrollment in Passaic County
The most common levels of schooling among the 134,072 students in Passaic County are high school (29,493 | 22.0%), middle school (28,166 | 21.0%), and college / undergraduate (27,944 | 20.8%).
| School Level | # Students | % Students |
| Nursery / Preschool | 9,507 | 7.1% |
| Kindergarten | 7,558 | 5.6% |
| Elementary School | 26,027 | 19.4% |
| Middle School | 28,166 | 21.0% |
| High School | 29,493 | 22.0% |
| College / Undergraduate | 27,944 | 20.8% |
| Graduate / Professional | 5,377 | 4.0% |
| Total | 134,072 | 100.0% |
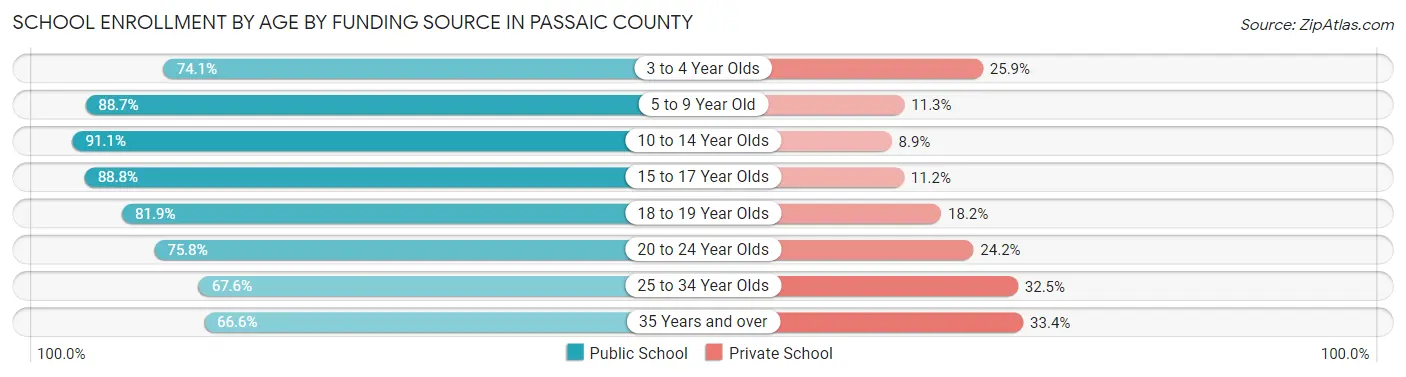
School Enrollment by Age by Funding Source in Passaic County
Out of a total of 134,072 students who are enrolled in schools in Passaic County, 20,781 (15.5%) attend a private institution, while the remaining 113,291 (84.5%) are enrolled in public schools. The age group of 35 years and over has the highest likelihood of being enrolled in private schools, with 1,514 (33.4% in the age bracket) enrolled. Conversely, the age group of 10 to 14 year olds has the lowest likelihood of being enrolled in a private school, with 32,186 (91.1% in the age bracket) attending a public institution.
| Age Bracket | Public School | Private School |
| 3 to 4 Year Olds | 6,166 (74.1%) | 2,159 (25.9%) |
| 5 to 9 Year Old | 28,095 (88.7%) | 3,583 (11.3%) |
| 10 to 14 Year Olds | 32,186 (91.1%) | 3,156 (8.9%) |
| 15 to 17 Year Olds | 18,034 (88.8%) | 2,274 (11.2%) |
| 18 to 19 Year Olds | 9,630 (81.9%) | 2,135 (18.1%) |
| 20 to 24 Year Olds | 11,483 (75.8%) | 3,661 (24.2%) |
| 25 to 34 Year Olds | 4,716 (67.5%) | 2,265 (32.5%) |
| 35 Years and over | 3,015 (66.6%) | 1,514 (33.4%) |
| Total | 113,291 (84.5%) | 20,781 (15.5%) |
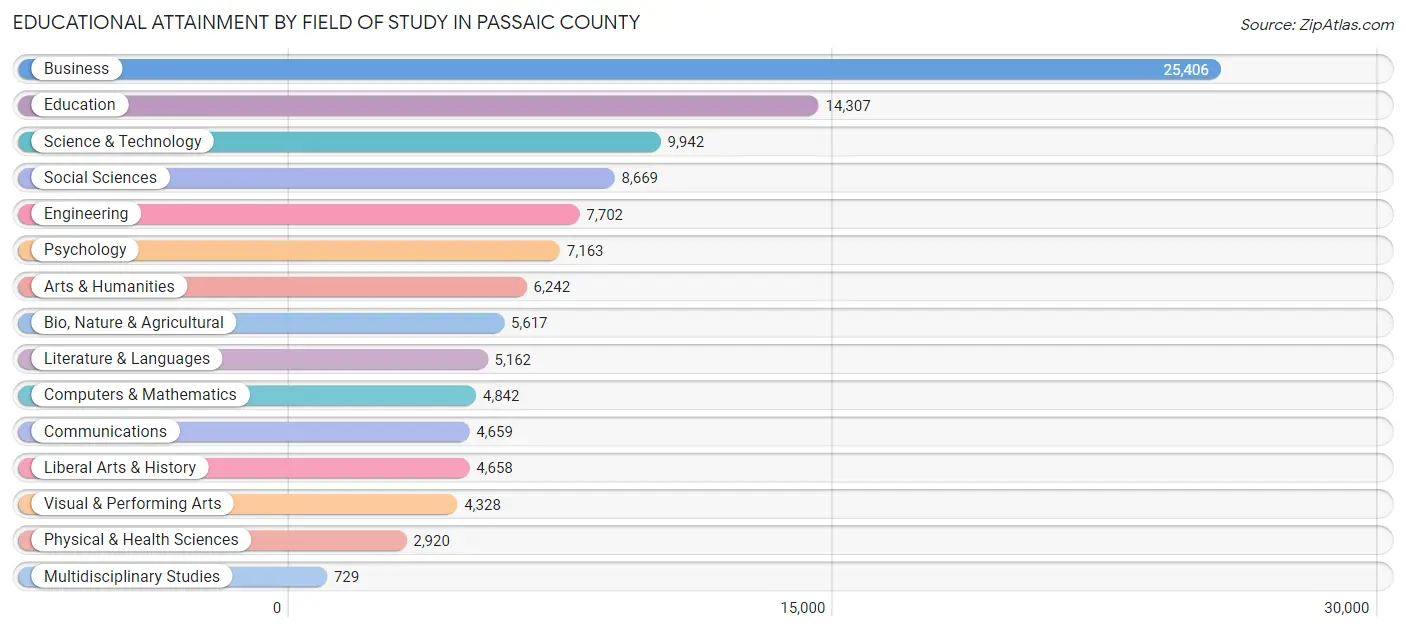
Educational Attainment by Field of Study in Passaic County
Business (25,406 | 22.6%), education (14,307 | 12.7%), science & technology (9,942 | 8.8%), social sciences (8,669 | 7.7%), and engineering (7,702 | 6.9%) are the most common fields of study among 112,346 individuals in Passaic County who have obtained a bachelor's degree or higher.
| Field of Study | # Graduates | % Graduates |
| Computers & Mathematics | 4,842 | 4.3% |
| Bio, Nature & Agricultural | 5,617 | 5.0% |
| Physical & Health Sciences | 2,920 | 2.6% |
| Psychology | 7,163 | 6.4% |
| Social Sciences | 8,669 | 7.7% |
| Engineering | 7,702 | 6.9% |
| Multidisciplinary Studies | 729 | 0.6% |
| Science & Technology | 9,942 | 8.8% |
| Business | 25,406 | 22.6% |
| Education | 14,307 | 12.7% |
| Literature & Languages | 5,162 | 4.6% |
| Liberal Arts & History | 4,658 | 4.2% |
| Visual & Performing Arts | 4,328 | 3.8% |
| Communications | 4,659 | 4.2% |
| Arts & Humanities | 6,242 | 5.6% |
| Total | 112,346 | 100.0% |
Transportation & Commute in Passaic County
Vehicle Availability by Sex in Passaic County
The most prevalent vehicle ownership categories in Passaic County are males with 2 vehicles (48,410, accounting for 37.0%) and females with 2 vehicles (40,887, making up 42.5%).
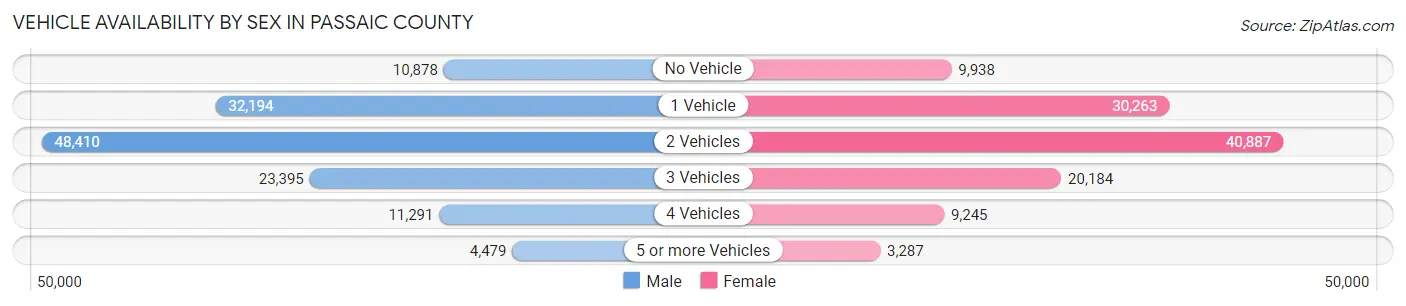
| Vehicles Available | Male | Female |
| No Vehicle | 10,878 (8.3%) | 9,938 (8.7%) |
| 1 Vehicle | 32,194 (24.6%) | 30,263 (26.6%) |
| 2 Vehicles | 48,410 (37.0%) | 40,887 (35.9%) |
| 3 Vehicles | 23,395 (17.9%) | 20,184 (17.7%) |
| 4 Vehicles | 11,291 (8.6%) | 9,245 (8.1%) |
| 5 or more Vehicles | 4,479 (3.4%) | 3,287 (2.9%) |
| Total | 130,647 (100.0%) | 113,804 (100.0%) |
Commute Time in Passaic County
The most frequently occuring commute durations in Passaic County are 10 to 14 minutes (34,002 commuters, 15.1%), 20 to 24 minutes (32,622 commuters, 14.5%), and 15 to 19 minutes (32,337 commuters, 14.4%).
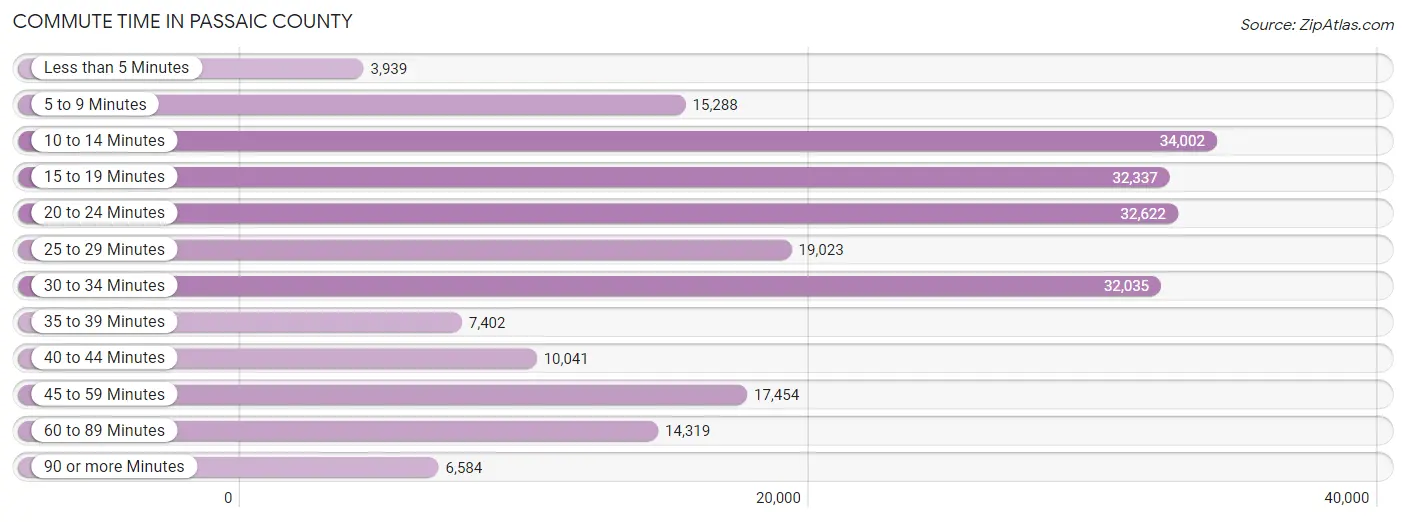
| Commute Time | # Commuters | % Commuters |
| Less than 5 Minutes | 3,939 | 1.8% |
| 5 to 9 Minutes | 15,288 | 6.8% |
| 10 to 14 Minutes | 34,002 | 15.1% |
| 15 to 19 Minutes | 32,337 | 14.4% |
| 20 to 24 Minutes | 32,622 | 14.5% |
| 25 to 29 Minutes | 19,023 | 8.5% |
| 30 to 34 Minutes | 32,035 | 14.2% |
| 35 to 39 Minutes | 7,402 | 3.3% |
| 40 to 44 Minutes | 10,041 | 4.5% |
| 45 to 59 Minutes | 17,454 | 7.8% |
| 60 to 89 Minutes | 14,319 | 6.4% |
| 90 or more Minutes | 6,584 | 2.9% |
Commute Time by Sex in Passaic County
The most common commute times in Passaic County are 15 to 19 minutes (17,778 commuters, 14.6%) for males and 10 to 14 minutes (16,813 commuters, 16.3%) for females.
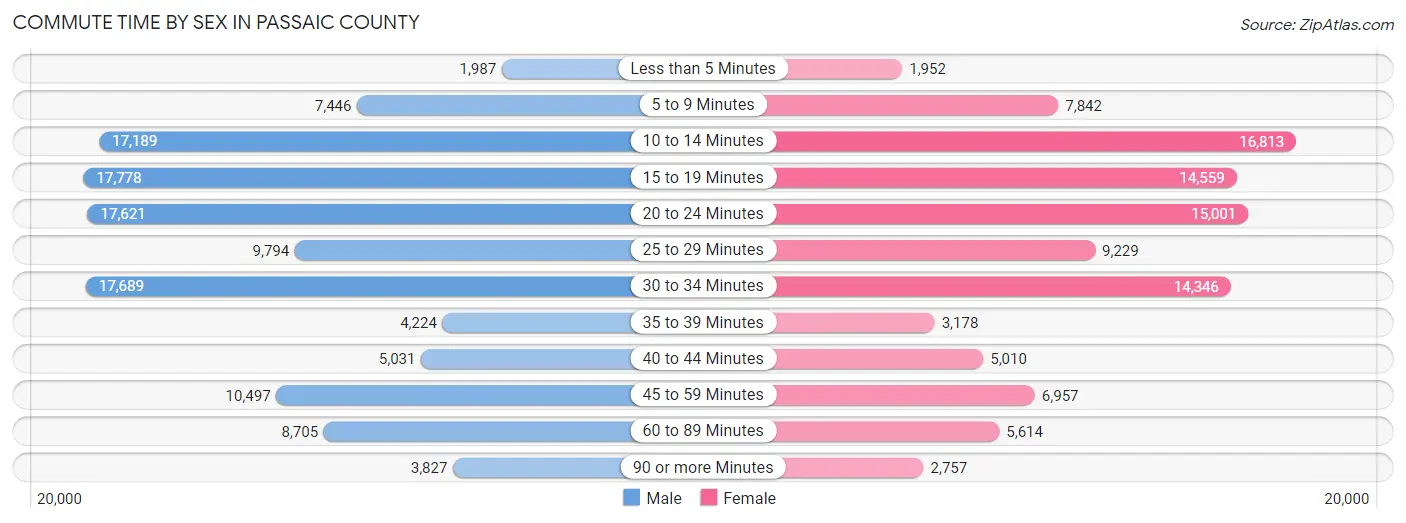
| Commute Time | Male | Female |
| Less than 5 Minutes | 1,987 (1.6%) | 1,952 (1.9%) |
| 5 to 9 Minutes | 7,446 (6.1%) | 7,842 (7.6%) |
| 10 to 14 Minutes | 17,189 (14.1%) | 16,813 (16.3%) |
| 15 to 19 Minutes | 17,778 (14.6%) | 14,559 (14.1%) |
| 20 to 24 Minutes | 17,621 (14.5%) | 15,001 (14.5%) |
| 25 to 29 Minutes | 9,794 (8.0%) | 9,229 (8.9%) |
| 30 to 34 Minutes | 17,689 (14.5%) | 14,346 (13.9%) |
| 35 to 39 Minutes | 4,224 (3.5%) | 3,178 (3.1%) |
| 40 to 44 Minutes | 5,031 (4.1%) | 5,010 (4.9%) |
| 45 to 59 Minutes | 10,497 (8.6%) | 6,957 (6.7%) |
| 60 to 89 Minutes | 8,705 (7.1%) | 5,614 (5.4%) |
| 90 or more Minutes | 3,827 (3.1%) | 2,757 (2.7%) |
Time of Departure to Work by Sex in Passaic County
The most frequent times of departure to work in Passaic County are 7:00 AM to 7:29 AM (17,887, 14.7%) for males and 8:00 AM to 8:29 AM (17,415, 16.9%) for females.
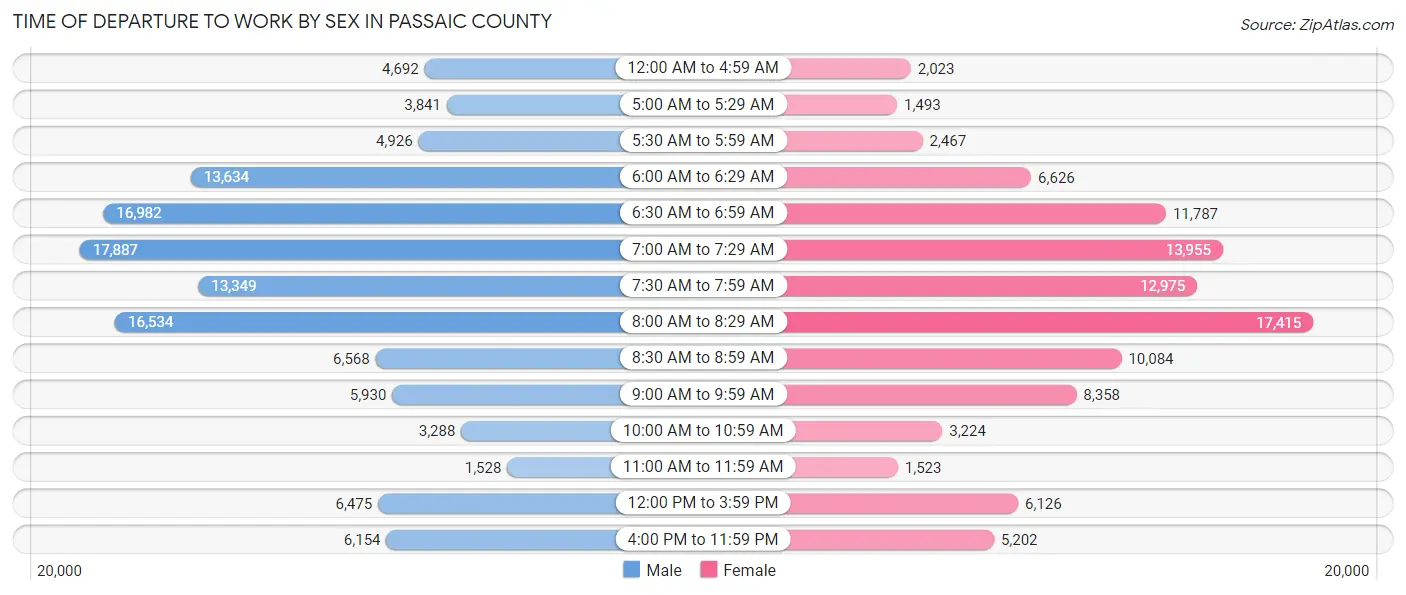
| Time of Departure | Male | Female |
| 12:00 AM to 4:59 AM | 4,692 (3.8%) | 2,023 (2.0%) |
| 5:00 AM to 5:29 AM | 3,841 (3.2%) | 1,493 (1.5%) |
| 5:30 AM to 5:59 AM | 4,926 (4.0%) | 2,467 (2.4%) |
| 6:00 AM to 6:29 AM | 13,634 (11.2%) | 6,626 (6.4%) |
| 6:30 AM to 6:59 AM | 16,982 (13.9%) | 11,787 (11.4%) |
| 7:00 AM to 7:29 AM | 17,887 (14.7%) | 13,955 (13.5%) |
| 7:30 AM to 7:59 AM | 13,349 (11.0%) | 12,975 (12.6%) |
| 8:00 AM to 8:29 AM | 16,534 (13.6%) | 17,415 (16.9%) |
| 8:30 AM to 8:59 AM | 6,568 (5.4%) | 10,084 (9.8%) |
| 9:00 AM to 9:59 AM | 5,930 (4.9%) | 8,358 (8.1%) |
| 10:00 AM to 10:59 AM | 3,288 (2.7%) | 3,224 (3.1%) |
| 11:00 AM to 11:59 AM | 1,528 (1.3%) | 1,523 (1.5%) |
| 12:00 PM to 3:59 PM | 6,475 (5.3%) | 6,126 (5.9%) |
| 4:00 PM to 11:59 PM | 6,154 (5.1%) | 5,202 (5.0%) |
| Total | 121,788 (100.0%) | 103,258 (100.0%) |
Housing Occupancy in Passaic County
Occupancy by Ownership in Passaic County
Of the total 177,209 dwellings in Passaic County, owner-occupied units account for 92,827 (52.4%), while renter-occupied units make up 84,382 (47.6%).
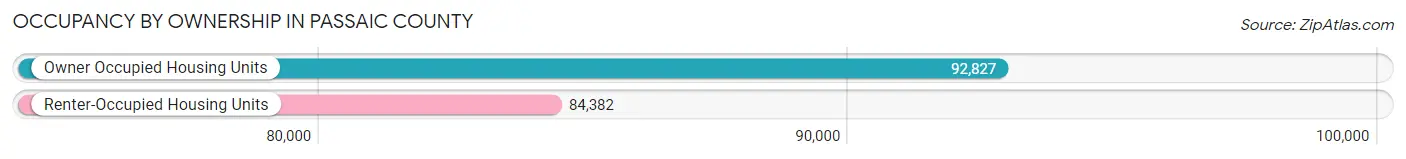
| Occupancy | # Housing Units | % Housing Units |
| Owner Occupied Housing Units | 92,827 | 52.4% |
| Renter-Occupied Housing Units | 84,382 | 47.6% |
| Total Occupied Housing Units | 177,209 | 100.0% |
Occupancy by Household Size in Passaic County
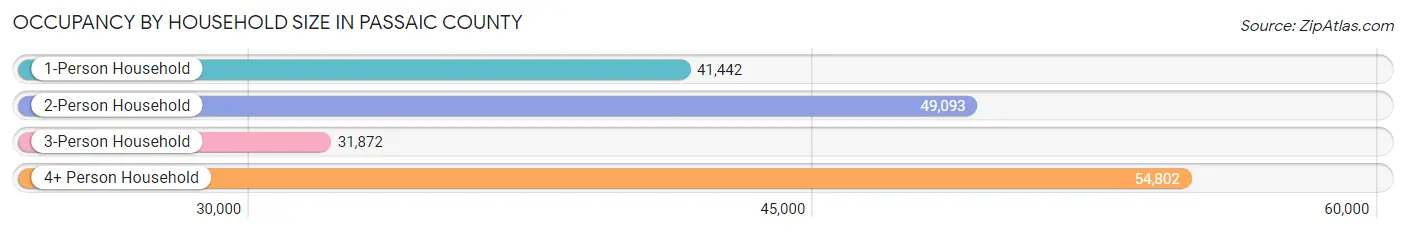
| Household Size | # Housing Units | % Housing Units |
| 1-Person Household | 41,442 | 23.4% |
| 2-Person Household | 49,093 | 27.7% |
| 3-Person Household | 31,872 | 18.0% |
| 4+ Person Household | 54,802 | 30.9% |
| Total Housing Units | 177,209 | 100.0% |
Occupancy by Ownership by Household Size in Passaic County

| Household Size | Owner-occupied | Renter-occupied |
| 1-Person Household | 17,194 (41.5%) | 24,248 (58.5%) |
| 2-Person Household | 29,135 (59.4%) | 19,958 (40.6%) |
| 3-Person Household | 16,660 (52.3%) | 15,212 (47.7%) |
| 4+ Person Household | 29,838 (54.4%) | 24,964 (45.6%) |
| Total Housing Units | 92,827 (52.4%) | 84,382 (47.6%) |
Occupancy by Educational Attainment in Passaic County
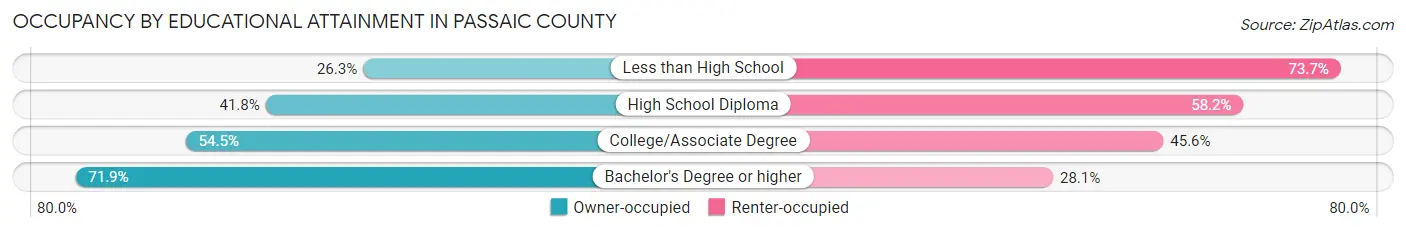
| Household Size | Owner-occupied | Renter-occupied |
| Less than High School | 6,346 (26.3%) | 17,758 (73.7%) |
| High School Diploma | 22,980 (41.8%) | 32,017 (58.2%) |
| College/Associate Degree | 22,024 (54.4%) | 18,426 (45.6%) |
| Bachelor's Degree or higher | 41,477 (71.9%) | 16,181 (28.1%) |
Occupancy by Age of Householder in Passaic County

| Age Bracket | # Households | % Households |
| Under 35 Years | 25,283 | 14.3% |
| 35 to 44 Years | 32,607 | 18.4% |
| 45 to 54 Years | 37,063 | 20.9% |
| 55 to 64 Years | 36,665 | 20.7% |
| 65 to 74 Years | 27,088 | 15.3% |
| 75 to 84 Years | 12,959 | 7.3% |
| 85 Years and Over | 5,544 | 3.1% |
| Total | 177,209 | 100.0% |
Housing Finances in Passaic County
Median Income by Occupancy in Passaic County

| Occupancy Type | # Households | Median Income |
| Owner-Occupied | 92,827 (52.4%) | $124,205 |
| Renter-Occupied | 84,382 (47.6%) | $50,493 |
| Average | 177,209 (100.0%) | $84,465 |
Occupancy by Householder Income Bracket in Passaic County
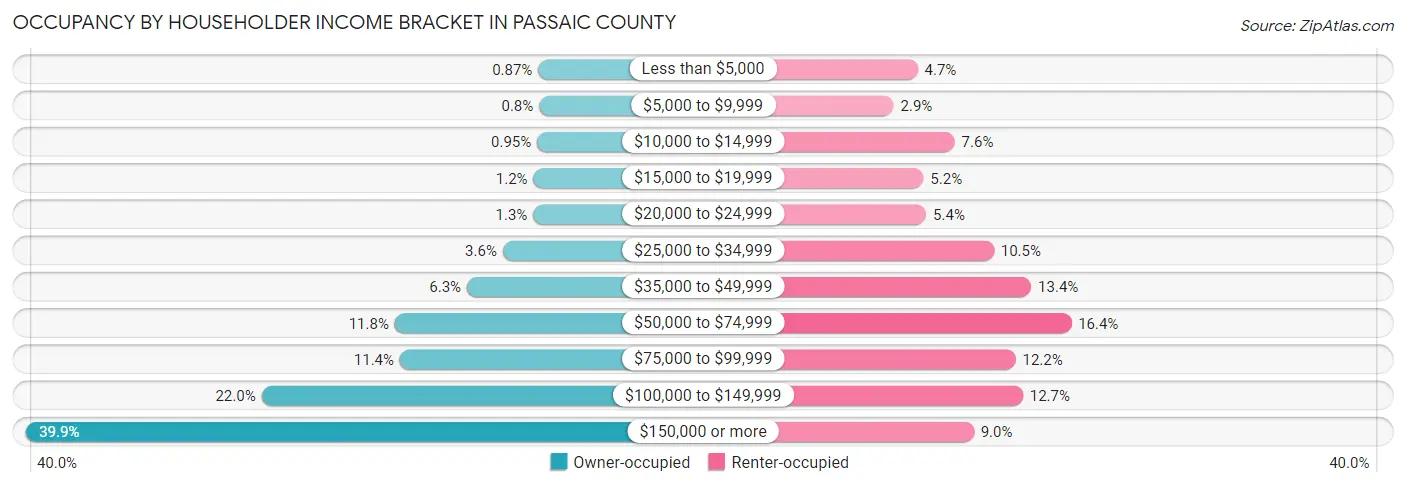
| Income Bracket | Owner-occupied | Renter-occupied |
| Less than $5,000 | 804 (0.9%) | 3,994 (4.7%) |
| $5,000 to $9,999 | 740 (0.8%) | 2,448 (2.9%) |
| $10,000 to $14,999 | 882 (0.9%) | 6,371 (7.5%) |
| $15,000 to $19,999 | 1,145 (1.2%) | 4,363 (5.2%) |
| $20,000 to $24,999 | 1,159 (1.3%) | 4,540 (5.4%) |
| $25,000 to $34,999 | 3,310 (3.6%) | 8,886 (10.5%) |
| $35,000 to $49,999 | 5,846 (6.3%) | 11,287 (13.4%) |
| $50,000 to $74,999 | 10,953 (11.8%) | 13,861 (16.4%) |
| $75,000 to $99,999 | 10,589 (11.4%) | 10,288 (12.2%) |
| $100,000 to $149,999 | 20,378 (22.0%) | 10,750 (12.7%) |
| $150,000 or more | 37,021 (39.9%) | 7,594 (9.0%) |
| Total | 92,827 (100.0%) | 84,382 (100.0%) |
Monthly Housing Cost Tiers in Passaic County
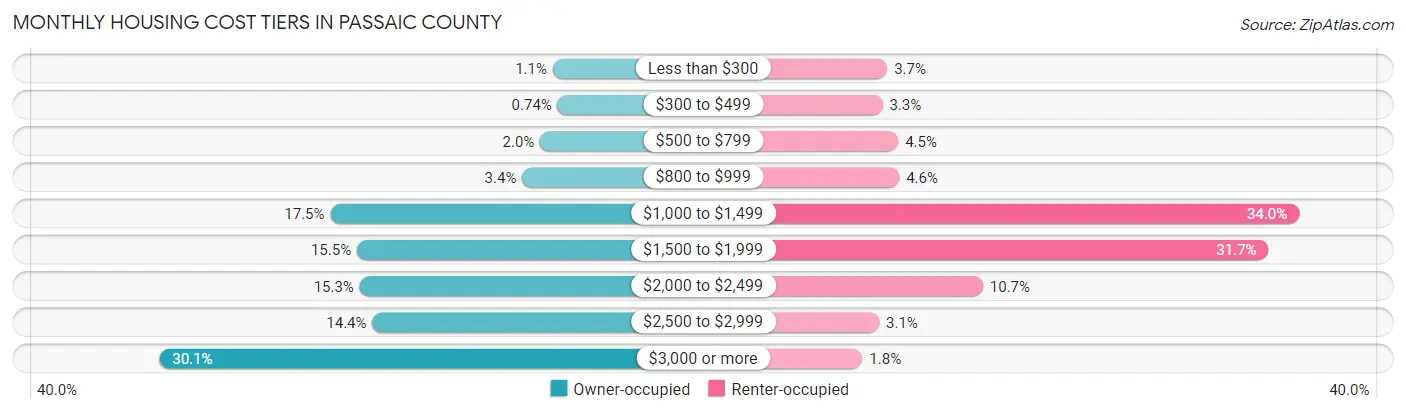
| Monthly Cost | Owner-occupied | Renter-occupied |
| Less than $300 | 1,018 (1.1%) | 3,099 (3.7%) |
| $300 to $499 | 685 (0.7%) | 2,798 (3.3%) |
| $500 to $799 | 1,888 (2.0%) | 3,782 (4.5%) |
| $800 to $999 | 3,106 (3.4%) | 3,836 (4.5%) |
| $1,000 to $1,499 | 16,228 (17.5%) | 28,687 (34.0%) |
| $1,500 to $1,999 | 14,406 (15.5%) | 26,783 (31.7%) |
| $2,000 to $2,499 | 14,218 (15.3%) | 9,037 (10.7%) |
| $2,500 to $2,999 | 13,354 (14.4%) | 2,589 (3.1%) |
| $3,000 or more | 27,924 (30.1%) | 1,549 (1.8%) |
| Total | 92,827 (100.0%) | 84,382 (100.0%) |
Physical Housing Characteristics in Passaic County
Housing Structures in Passaic County
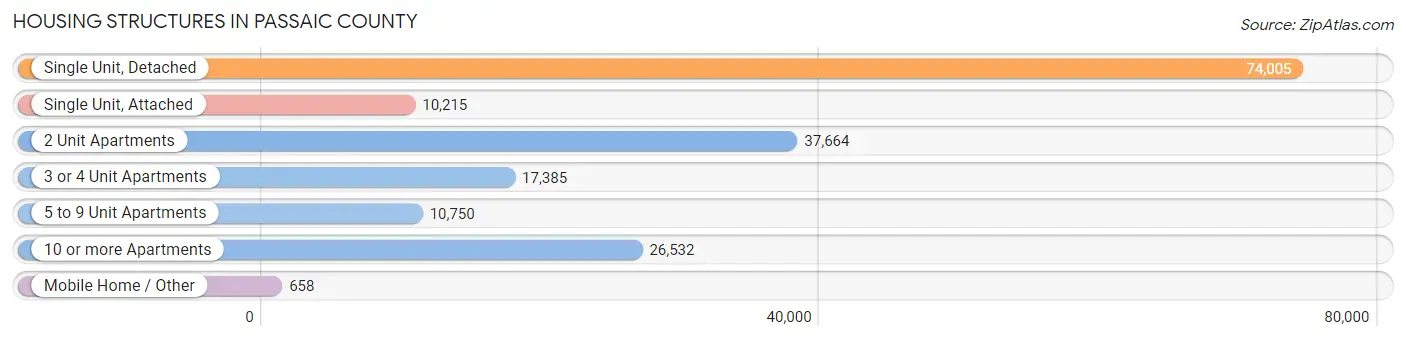
| Structure Type | # Housing Units | % Housing Units |
| Single Unit, Detached | 74,005 | 41.8% |
| Single Unit, Attached | 10,215 | 5.8% |
| 2 Unit Apartments | 37,664 | 21.2% |
| 3 or 4 Unit Apartments | 17,385 | 9.8% |
| 5 to 9 Unit Apartments | 10,750 | 6.1% |
| 10 or more Apartments | 26,532 | 15.0% |
| Mobile Home / Other | 658 | 0.4% |
| Total | 177,209 | 100.0% |
Housing Structures by Occupancy in Passaic County
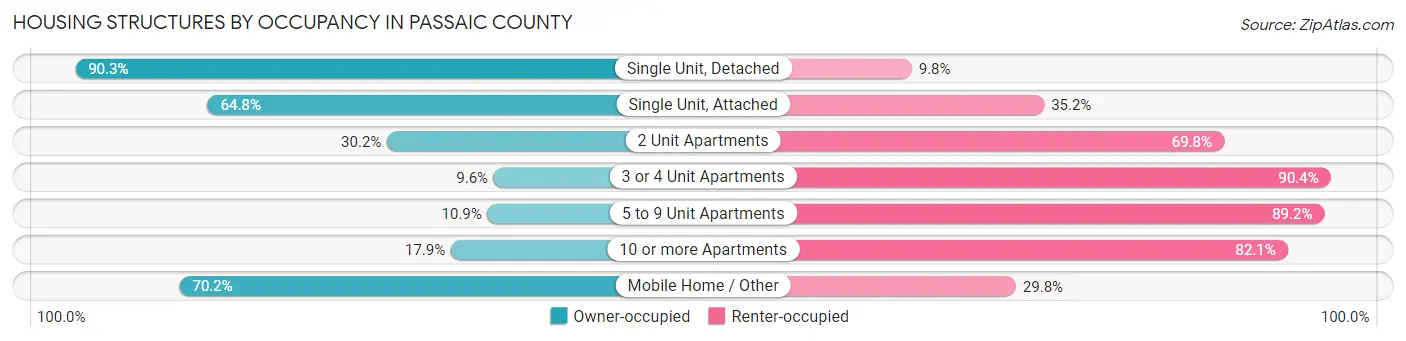
| Structure Type | Owner-occupied | Renter-occupied |
| Single Unit, Detached | 66,790 (90.2%) | 7,215 (9.8%) |
| Single Unit, Attached | 6,615 (64.8%) | 3,600 (35.2%) |
| 2 Unit Apartments | 11,370 (30.2%) | 26,294 (69.8%) |
| 3 or 4 Unit Apartments | 1,676 (9.6%) | 15,709 (90.4%) |
| 5 to 9 Unit Apartments | 1,166 (10.8%) | 9,584 (89.1%) |
| 10 or more Apartments | 4,748 (17.9%) | 21,784 (82.1%) |
| Mobile Home / Other | 462 (70.2%) | 196 (29.8%) |
| Total | 92,827 (52.4%) | 84,382 (47.6%) |
Housing Structures by Number of Rooms in Passaic County
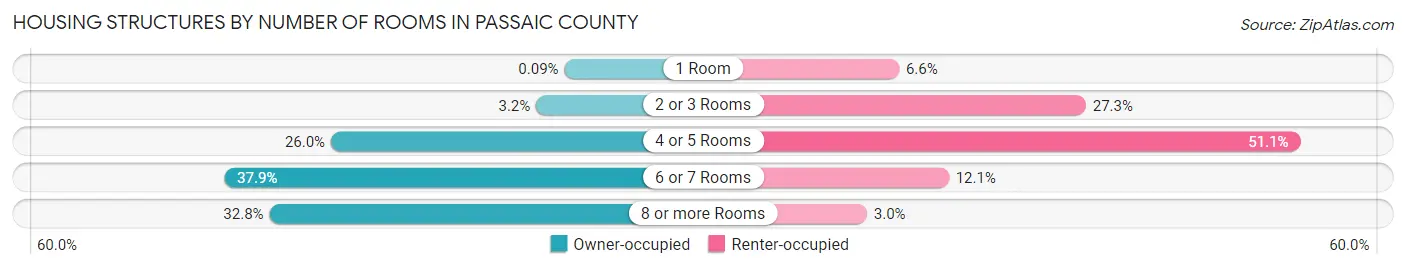
| Number of Rooms | Owner-occupied | Renter-occupied |
| 1 Room | 86 (0.1%) | 5,525 (6.6%) |
| 2 or 3 Rooms | 3,001 (3.2%) | 23,028 (27.3%) |
| 4 or 5 Rooms | 24,131 (26.0%) | 43,122 (51.1%) |
| 6 or 7 Rooms | 35,131 (37.9%) | 10,182 (12.1%) |
| 8 or more Rooms | 30,478 (32.8%) | 2,525 (3.0%) |
| Total | 92,827 (100.0%) | 84,382 (100.0%) |
Housing Structure by Heating Type in Passaic County
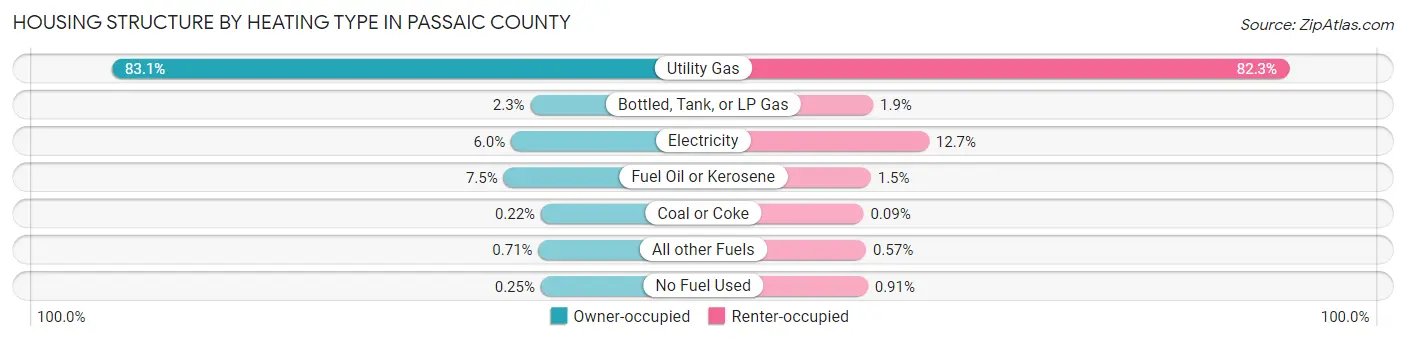
| Heating Type | Owner-occupied | Renter-occupied |
| Utility Gas | 77,154 (83.1%) | 69,431 (82.3%) |
| Bottled, Tank, or LP Gas | 2,084 (2.2%) | 1,636 (1.9%) |
| Electricity | 5,574 (6.0%) | 10,730 (12.7%) |
| Fuel Oil or Kerosene | 6,919 (7.4%) | 1,265 (1.5%) |
| Coal or Coke | 201 (0.2%) | 74 (0.1%) |
| All other Fuels | 659 (0.7%) | 482 (0.6%) |
| No Fuel Used | 236 (0.3%) | 764 (0.9%) |
| Total | 92,827 (100.0%) | 84,382 (100.0%) |
Household Vehicle Usage in Passaic County
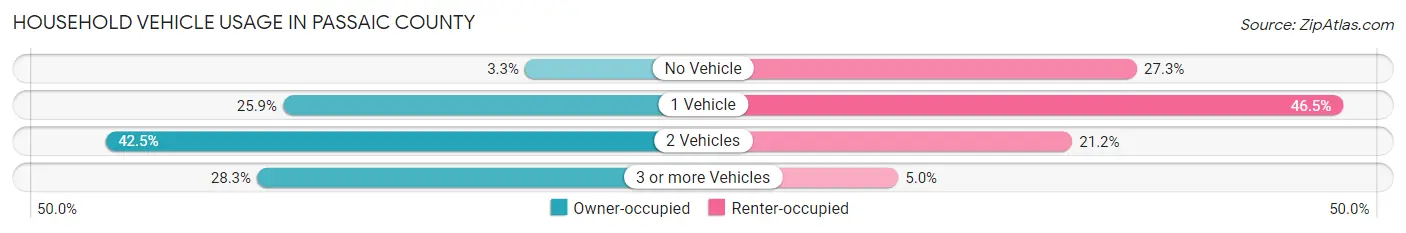
| Vehicles per Household | Owner-occupied | Renter-occupied |
| No Vehicle | 3,073 (3.3%) | 23,022 (27.3%) |
| 1 Vehicle | 24,036 (25.9%) | 39,237 (46.5%) |
| 2 Vehicles | 39,426 (42.5%) | 17,911 (21.2%) |
| 3 or more Vehicles | 26,292 (28.3%) | 4,212 (5.0%) |
| Total | 92,827 (100.0%) | 84,382 (100.0%) |
Real Estate & Mortgages in Passaic County
Real Estate and Mortgage Overview in Passaic County
| Characteristic | Without Mortgage | With Mortgage |
| Housing Units | 32,599 | 60,228 |
| Median Property Value | $409,800 | $415,400 |
| Median Household Income | $97,781 | $27,355 |
| Monthly Housing Costs | $1,358 | $27,539 |
| Real Estate Taxes | $10,001 | $797 |
Property Value by Mortgage Status in Passaic County
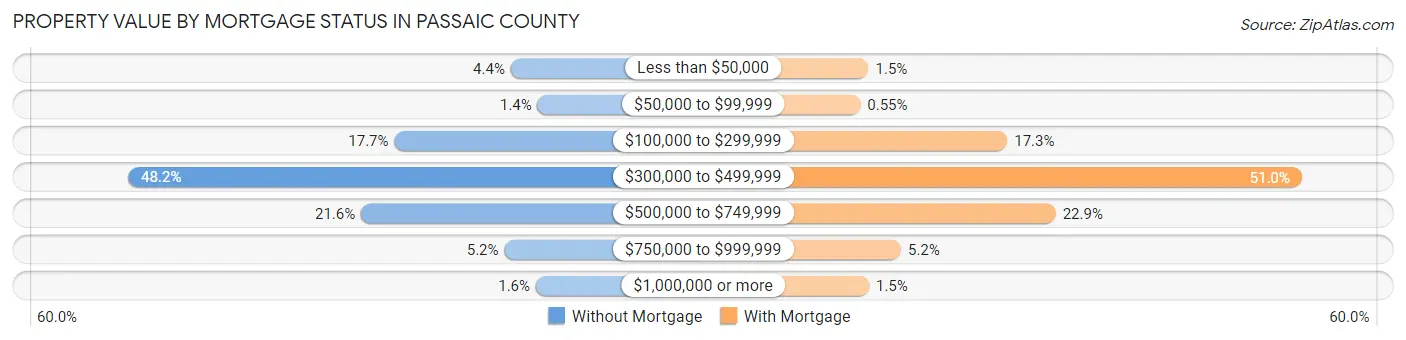
| Property Value | Without Mortgage | With Mortgage |
| Less than $50,000 | 1,447 (4.4%) | 895 (1.5%) |
| $50,000 to $99,999 | 445 (1.4%) | 333 (0.5%) |
| $100,000 to $299,999 | 5,783 (17.7%) | 10,446 (17.3%) |
| $300,000 to $499,999 | 15,703 (48.2%) | 30,714 (51.0%) |
| $500,000 to $749,999 | 7,024 (21.5%) | 13,778 (22.9%) |
| $750,000 to $999,999 | 1,684 (5.2%) | 3,132 (5.2%) |
| $1,000,000 or more | 513 (1.6%) | 930 (1.5%) |
| Total | 32,599 (100.0%) | 60,228 (100.0%) |
Household Income by Mortgage Status in Passaic County
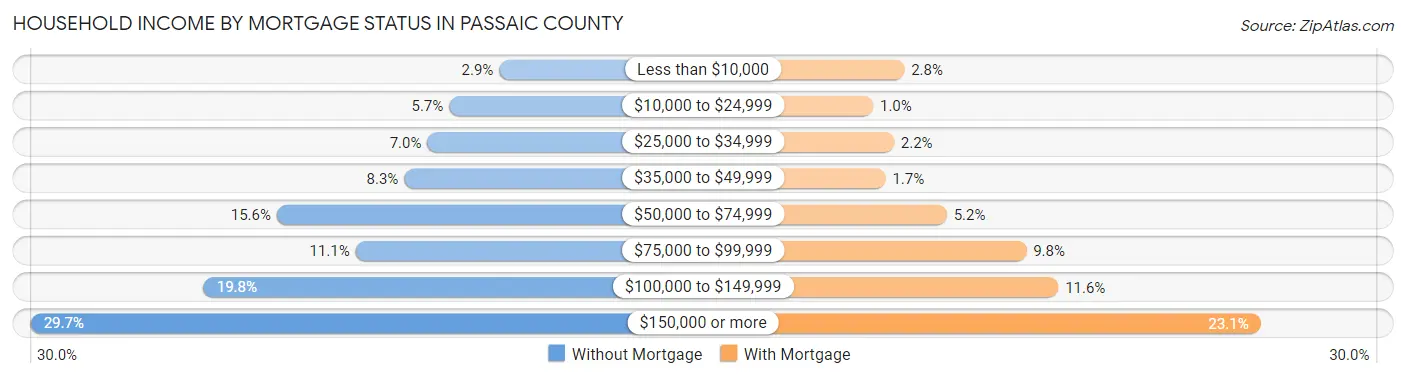
| Household Income | Without Mortgage | With Mortgage |
| Less than $10,000 | 940 (2.9%) | 1,672 (2.8%) |
| $10,000 to $24,999 | 1,870 (5.7%) | 604 (1.0%) |
| $25,000 to $34,999 | 2,279 (7.0%) | 1,316 (2.2%) |
| $35,000 to $49,999 | 2,709 (8.3%) | 1,031 (1.7%) |
| $50,000 to $74,999 | 5,081 (15.6%) | 3,137 (5.2%) |
| $75,000 to $99,999 | 3,614 (11.1%) | 5,872 (9.8%) |
| $100,000 to $149,999 | 6,440 (19.8%) | 6,975 (11.6%) |
| $150,000 or more | 9,666 (29.6%) | 13,938 (23.1%) |
| Total | 32,599 (100.0%) | 60,228 (100.0%) |
Property Value to Household Income Ratio in Passaic County
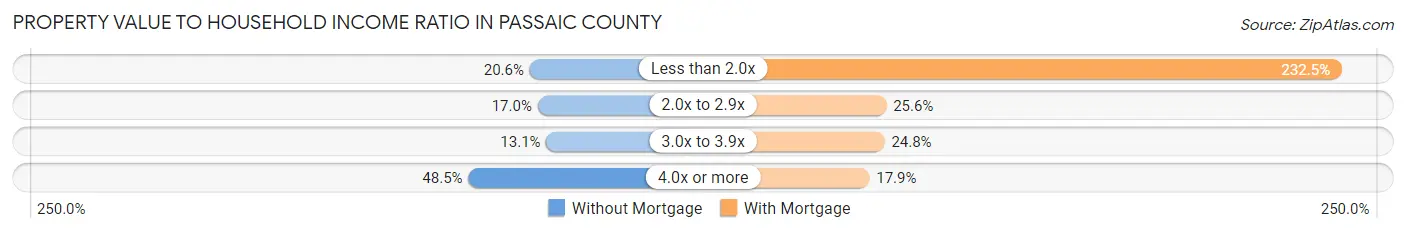
| Value-to-Income Ratio | Without Mortgage | With Mortgage |
| Less than 2.0x | 6,730 (20.6%) | 140,018 (232.5%) |
| 2.0x to 2.9x | 5,550 (17.0%) | 15,391 (25.6%) |
| 3.0x to 3.9x | 4,266 (13.1%) | 14,910 (24.8%) |
| 4.0x or more | 15,811 (48.5%) | 10,771 (17.9%) |
| Total | 32,599 (100.0%) | 60,228 (100.0%) |
Real Estate Taxes by Mortgage Status in Passaic County
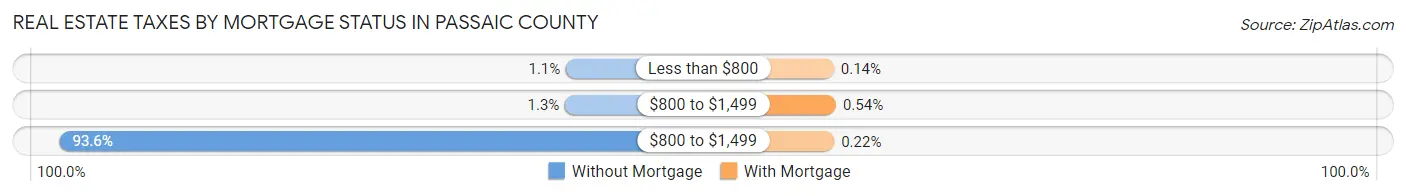
| Property Taxes | Without Mortgage | With Mortgage |
| Less than $800 | 354 (1.1%) | 87 (0.1%) |
| $800 to $1,499 | 410 (1.3%) | 323 (0.5%) |
| $800 to $1,499 | 30,520 (93.6%) | 135 (0.2%) |
| Total | 32,599 (100.0%) | 60,228 (100.0%) |
Health & Disability in Passaic County
Health Insurance Coverage by Age in Passaic County
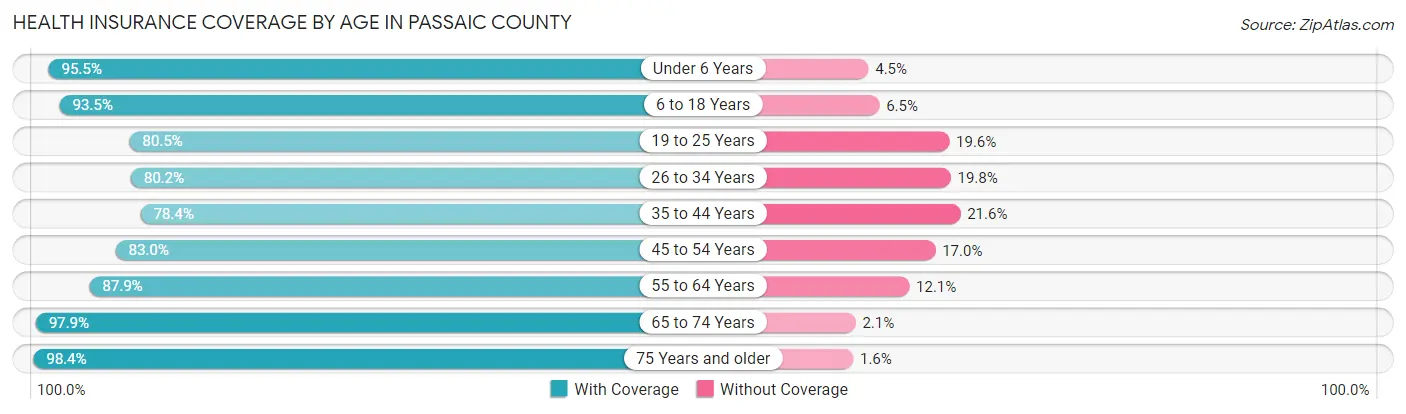
| Age Bracket | With Coverage | Without Coverage |
| Under 6 Years | 38,993 (95.5%) | 1,823 (4.5%) |
| 6 to 18 Years | 84,160 (93.5%) | 5,860 (6.5%) |
| 19 to 25 Years | 40,038 (80.4%) | 9,729 (19.6%) |
| 26 to 34 Years | 49,391 (80.2%) | 12,198 (19.8%) |
| 35 to 44 Years | 51,396 (78.4%) | 14,177 (21.6%) |
| 45 to 54 Years | 55,291 (83.0%) | 11,295 (17.0%) |
| 55 to 64 Years | 58,234 (87.9%) | 8,009 (12.1%) |
| 65 to 74 Years | 43,984 (97.9%) | 934 (2.1%) |
| 75 Years and older | 31,009 (98.4%) | 514 (1.6%) |
| Total | 452,496 (87.5%) | 64,539 (12.5%) |
Health Insurance Coverage by Citizenship Status in Passaic County
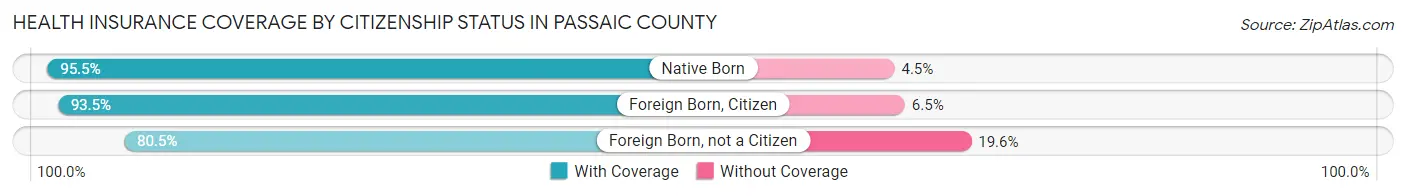
| Citizenship Status | With Coverage | Without Coverage |
| Native Born | 38,993 (95.5%) | 1,823 (4.5%) |
| Foreign Born, Citizen | 84,160 (93.5%) | 5,860 (6.5%) |
| Foreign Born, not a Citizen | 40,038 (80.4%) | 9,729 (19.6%) |
Health Insurance Coverage by Household Income in Passaic County
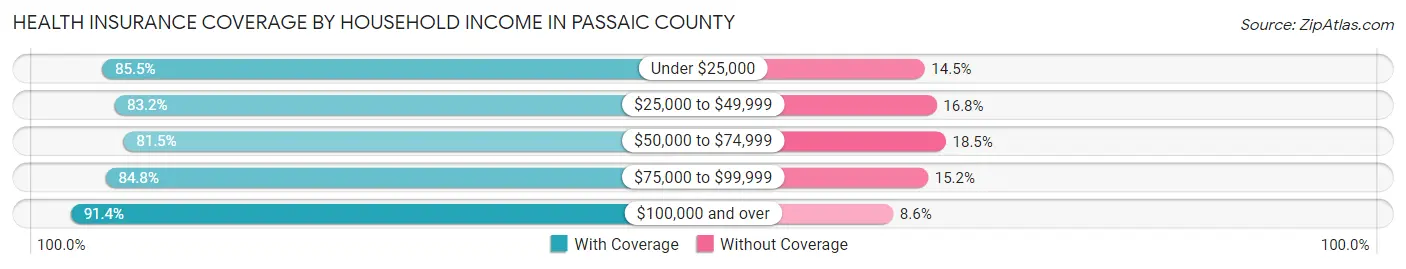
| Household Income | With Coverage | Without Coverage |
| Under $25,000 | 44,520 (85.5%) | 7,572 (14.5%) |
| $25,000 to $49,999 | 63,412 (83.2%) | 12,785 (16.8%) |
| $50,000 to $74,999 | 54,595 (81.5%) | 12,400 (18.5%) |
| $75,000 to $99,999 | 52,748 (84.8%) | 9,431 (15.2%) |
| $100,000 and over | 231,881 (91.4%) | 21,938 (8.6%) |
Public vs Private Health Insurance Coverage by Age in Passaic County
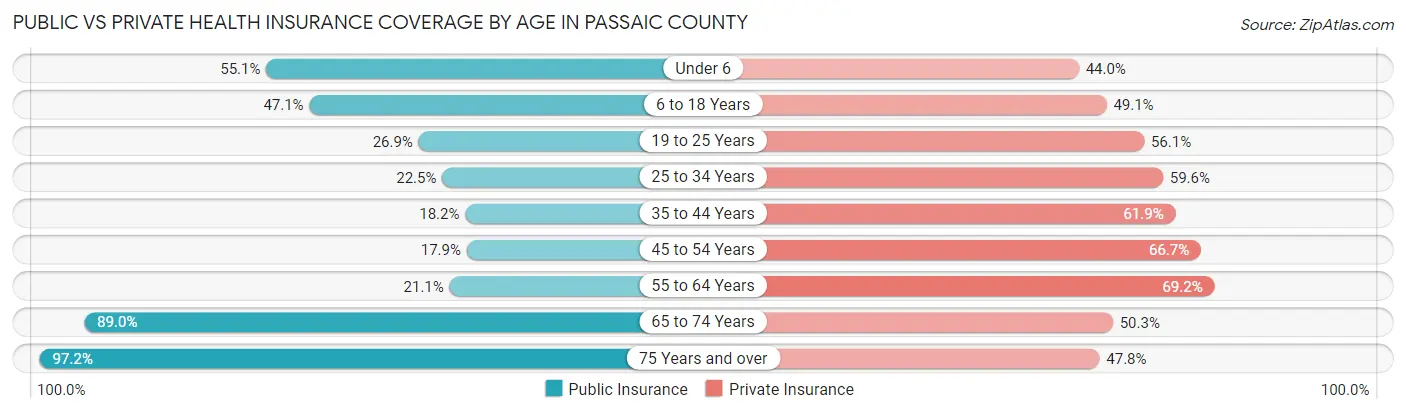
| Age Bracket | Public Insurance | Private Insurance |
| Under 6 | 22,501 (55.1%) | 17,948 (44.0%) |
| 6 to 18 Years | 42,424 (47.1%) | 44,215 (49.1%) |
| 19 to 25 Years | 13,364 (26.9%) | 27,912 (56.1%) |
| 25 to 34 Years | 13,838 (22.5%) | 36,696 (59.6%) |
| 35 to 44 Years | 11,936 (18.2%) | 40,608 (61.9%) |
| 45 to 54 Years | 11,931 (17.9%) | 44,390 (66.7%) |
| 55 to 64 Years | 13,986 (21.1%) | 45,817 (69.2%) |
| 65 to 74 Years | 39,958 (89.0%) | 22,591 (50.3%) |
| 75 Years and over | 30,650 (97.2%) | 15,070 (47.8%) |
| Total | 200,588 (38.8%) | 295,247 (57.1%) |
Disability Status by Sex by Age in Passaic County
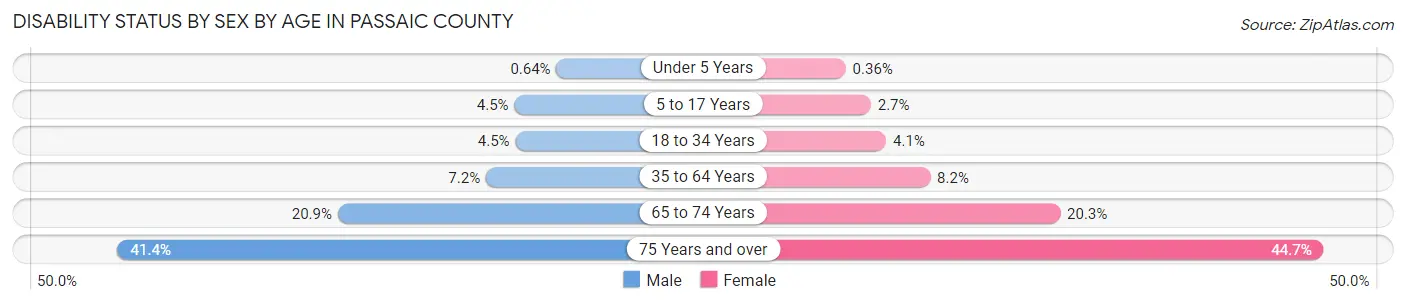
| Age Bracket | Male | Female |
| Under 5 Years | 110 (0.6%) | 59 (0.4%) |
| 5 to 17 Years | 2,086 (4.5%) | 1,169 (2.7%) |
| 18 to 34 Years | 2,665 (4.4%) | 2,441 (4.1%) |
| 35 to 64 Years | 7,055 (7.2%) | 8,209 (8.2%) |
| 65 to 74 Years | 4,350 (20.9%) | 4,889 (20.3%) |
| 75 Years and over | 5,159 (41.4%) | 8,515 (44.7%) |
Disability Class by Sex by Age in Passaic County
Disability Class: Hearing Difficulty

| Age Bracket | Male | Female |
| Under 5 Years | 97 (0.6%) | 39 (0.2%) |
| 5 to 17 Years | 106 (0.2%) | 185 (0.4%) |
| 18 to 34 Years | 327 (0.5%) | 272 (0.5%) |
| 35 to 64 Years | 1,496 (1.5%) | 929 (0.9%) |
| 65 to 74 Years | 1,264 (6.1%) | 868 (3.6%) |
| 75 Years and over | 2,357 (18.9%) | 2,999 (15.7%) |
Disability Class: Vision Difficulty
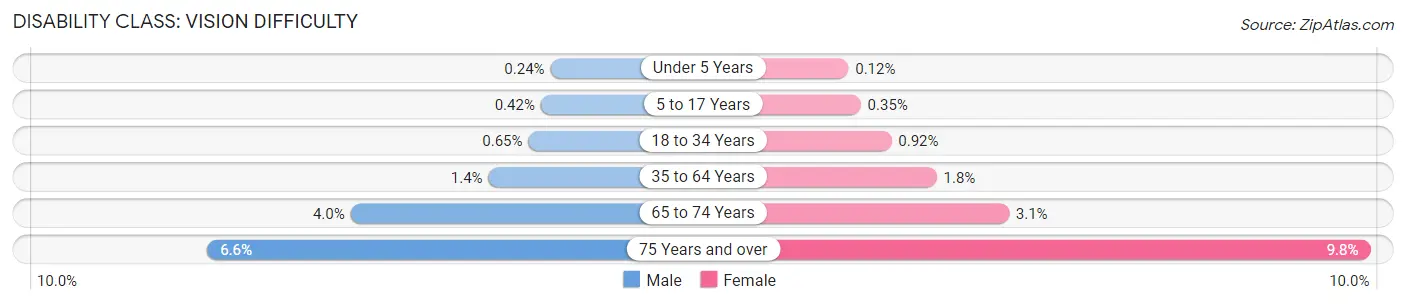
| Age Bracket | Male | Female |
| Under 5 Years | 41 (0.2%) | 20 (0.1%) |
| 5 to 17 Years | 195 (0.4%) | 154 (0.4%) |
| 18 to 34 Years | 389 (0.6%) | 547 (0.9%) |
| 35 to 64 Years | 1,362 (1.4%) | 1,762 (1.8%) |
| 65 to 74 Years | 820 (4.0%) | 748 (3.1%) |
| 75 Years and over | 824 (6.6%) | 1,869 (9.8%) |
Disability Class: Cognitive Difficulty
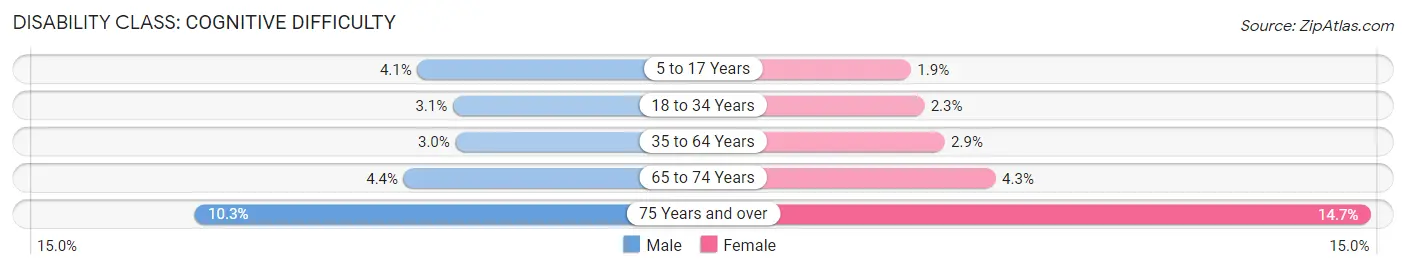
| Age Bracket | Male | Female |
| 5 to 17 Years | 1,867 (4.1%) | 831 (1.9%) |
| 18 to 34 Years | 1,840 (3.1%) | 1,355 (2.3%) |
| 35 to 64 Years | 2,950 (3.0%) | 2,854 (2.9%) |
| 65 to 74 Years | 923 (4.4%) | 1,030 (4.3%) |
| 75 Years and over | 1,278 (10.2%) | 2,802 (14.7%) |
Disability Class: Ambulatory Difficulty
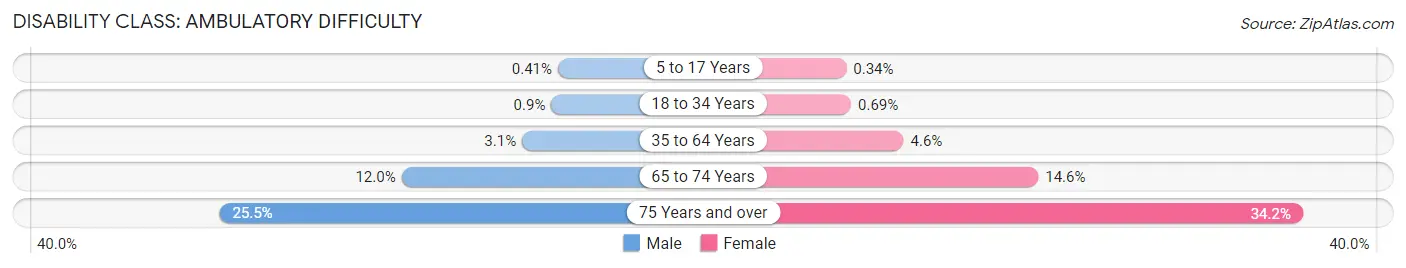
| Age Bracket | Male | Female |
| 5 to 17 Years | 187 (0.4%) | 146 (0.3%) |
| 18 to 34 Years | 539 (0.9%) | 407 (0.7%) |
| 35 to 64 Years | 3,016 (3.1%) | 4,591 (4.6%) |
| 65 to 74 Years | 2,499 (12.0%) | 3,522 (14.6%) |
| 75 Years and over | 3,184 (25.5%) | 6,519 (34.2%) |
Disability Class: Self-Care Difficulty
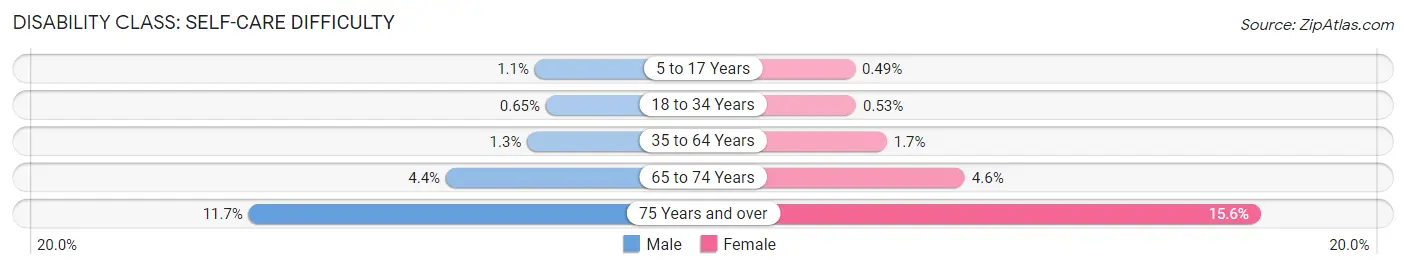
| Age Bracket | Male | Female |
| 5 to 17 Years | 487 (1.1%) | 212 (0.5%) |
| 18 to 34 Years | 391 (0.6%) | 317 (0.5%) |
| 35 to 64 Years | 1,313 (1.3%) | 1,669 (1.7%) |
| 65 to 74 Years | 906 (4.4%) | 1,103 (4.6%) |
| 75 Years and over | 1,457 (11.7%) | 2,962 (15.5%) |
Technology Access in Passaic County
Computing Device Access in Passaic County
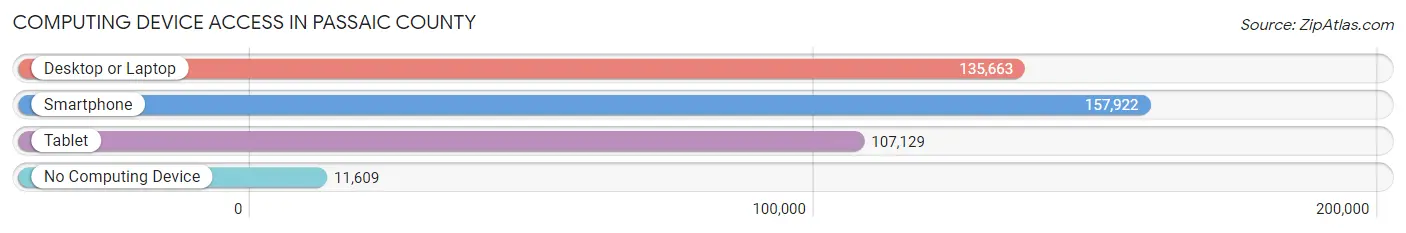
| Device Type | # Households | % Households |
| Desktop or Laptop | 135,663 | 76.6% |
| Smartphone | 157,922 | 89.1% |
| Tablet | 107,129 | 60.5% |
| No Computing Device | 11,609 | 6.6% |
| Total | 177,209 | 100.0% |
Internet Access in Passaic County
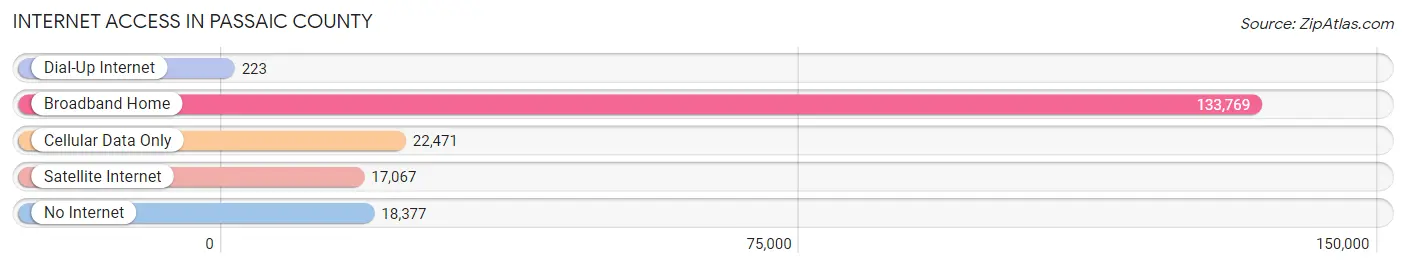
| Internet Type | # Households | % Households |
| Dial-Up Internet | 223 | 0.1% |
| Broadband Home | 133,769 | 75.5% |
| Cellular Data Only | 22,471 | 12.7% |
| Satellite Internet | 17,067 | 9.6% |
| No Internet | 18,377 | 10.4% |
| Total | 177,209 | 100.0% |
Passaic County Summary
Passaic County, NJ is located in the northern part of the state and is part of the New York metropolitan area. It is bordered by Bergen County to the north, Essex County to the east, Morris County to the south, and Sussex County to the west. The county seat is Paterson, which is the third-largest city in the state. The county has a total area of 197 square miles and a population of 501,226 as of the 2010 census.
The history of Passaic County dates back to the early 1600s when Dutch settlers first arrived in the area. The county was officially established in 1837 and was named after the Passaic River, which runs through the county. The county was originally part of Bergen County, but was split off in 1837.
The geography of Passaic County is mostly flat, with some rolling hills in the northern part of the county. The county is home to the Watchung Mountains, which are part of the Appalachian Mountains. The Passaic River runs through the county and is a major source of water for the area. The county is also home to several lakes, including Lake Hopatcong, which is the largest lake in the state.
The economy of Passaic County is largely based on manufacturing and services. The county is home to several large companies, including the pharmaceutical giant Pfizer, which has its headquarters in the county. Other major employers include the electronics manufacturer Panasonic, the food manufacturer Nestle, and the telecommunications company Verizon. The county is also home to several universities, including William Paterson University and Montclair State University.
The demographics of Passaic County are diverse. The population is mostly white (54.3%), followed by Hispanic (25.2%), African American (14.2%), and Asian (5.3%). The median household income is $63,845, and the median home value is $322,400. The county has a high rate of poverty, with 17.2% of the population living below the poverty line.
Passaic County is a diverse and vibrant county with a rich history and a strong economy. It is home to a variety of industries, universities, and cultural attractions. The county is a great place to live, work, and play, and is sure to continue to be a great place to call home for many years to come.
Common Questions
What is the Total Population of Passaic County?
Total Population of Passaic County is 519,986.
What is the Total Male Population of Passaic County?
Total Male Population of Passaic County is 255,780.
What is the Total Female Population of Passaic County?
Total Female Population of Passaic County is 264,206.
What is the Ratio of Males per 100 Females in Passaic County?
There are 96.81 Males per 100 Females in Passaic County.
What is the Ratio of Females per 100 Males in Passaic County?
There are 103.29 Females per 100 Males in Passaic County.
What is the Median Population Age in Passaic County?
Median Population Age in Passaic County is 37.8 Years.
What is the Average Family Size in Passaic County
Average Family Size in Passaic County is 3.4 People.
What is the Average Household Size in Passaic County
Average Household Size in Passaic County is 2.9 People.
What is Per Capita Income in Passaic County?
Per Capita income in Passaic County is $38,932.
What is the Median Family Income in Passaic County?
Median Family Income in Passaic County is $97,267.
What is the Median Household income in Passaic County?
Median Household Income in Passaic County is $84,465.
What is Income or Wage Gap in Passaic County?
Income or Wage Gap in Passaic County is 24.7%.
Women in Passaic County earn 75.3 cents for every dollar earned by a man.
What is Family Income Deficit in Passaic County?
Family Income Deficit in Passaic County is $11,323.
Families that are below poverty line in Passaic County earn $11,323 less on average than the poverty threshold level.
What is Inequality or Gini Index in Passaic County?
Inequality or Gini Index in Passaic County is 0.46.
How Large is the Labor Force in Passaic County?
There are 273,466 People in the Labor Forcein in Passaic County.
What is the Percentage of People in the Labor Force in Passaic County?
66.6% of People are in the Labor Force in Passaic County.
What is the Unemployment Rate in Passaic County?
Unemployment Rate in Passaic County is 7.8%.