Ocean County, NJ
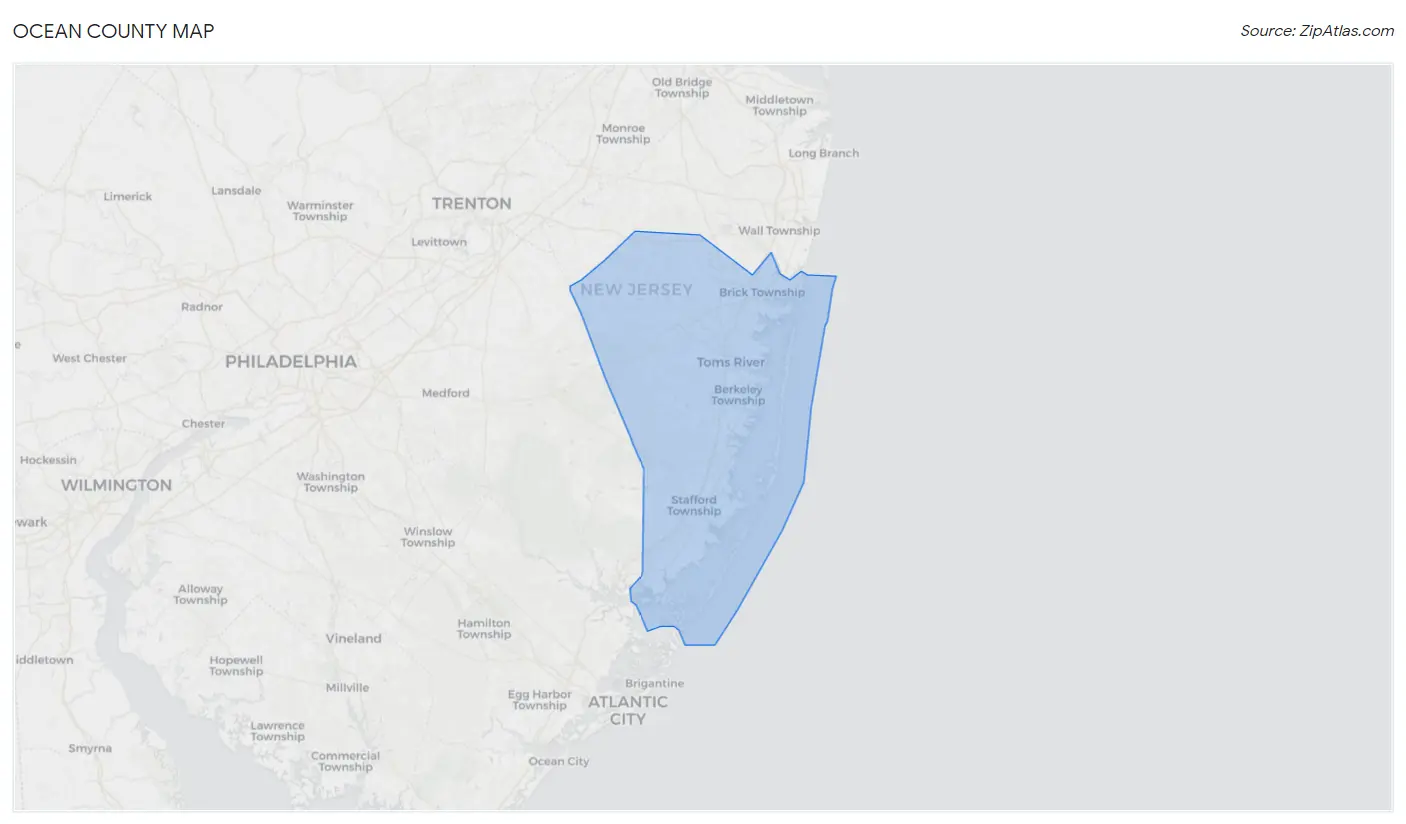
Ocean County Map
Ocean County Overview
638,691
TOTAL POPULATION
310,873
MALE POPULATION
327,818
FEMALE POPULATION
94.83
MALES / 100 FEMALES
105.45
FEMALES / 100 MALES
41.8
MEDIAN AGE
3.3
AVG FAMILY SIZE
2.6
AVG HOUSEHOLD SIZE
$42,497
PER CAPITA INCOME
$104,483
AVG FAMILY INCOME
$82,379
AVG HOUSEHOLD INCOME
36.9%
WAGE / INCOME GAP [ % ]
63.1¢/ $1
WAGE / INCOME GAP [ $ ]
$11,341
FAMILY INCOME DEFICIT
0.46
INEQUALITY / GINI INDEX
293,946
LABOR FORCE [ PEOPLE ]
58.9%
PERCENT IN LABOR FORCE
5.7%
UNEMPLOYMENT RATE
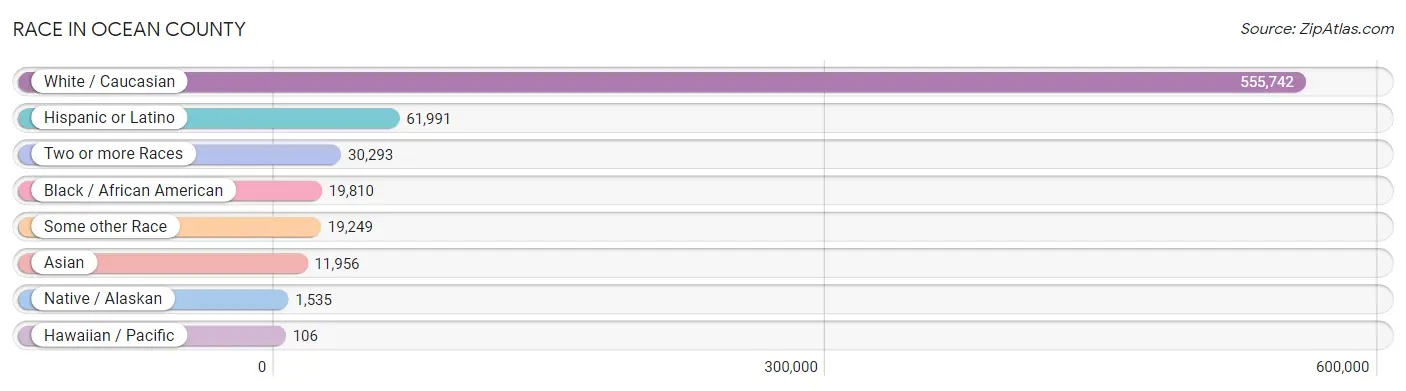
Race in Ocean County
The most populous races in Ocean County are White / Caucasian (555,742 | 87.0%), Hispanic or Latino (61,991 | 9.7%), and Two or more Races (30,293 | 4.7%).
| Race | # Population | % Population |
| Asian | 11,956 | 1.9% |
| Black / African American | 19,810 | 3.1% |
| Hawaiian / Pacific | 106 | 0.0% |
| Hispanic or Latino | 61,991 | 9.7% |
| Native / Alaskan | 1,535 | 0.2% |
| White / Caucasian | 555,742 | 87.0% |
| Two or more Races | 30,293 | 4.7% |
| Some other Race | 19,249 | 3.0% |
| Total | 638,691 | 100.0% |
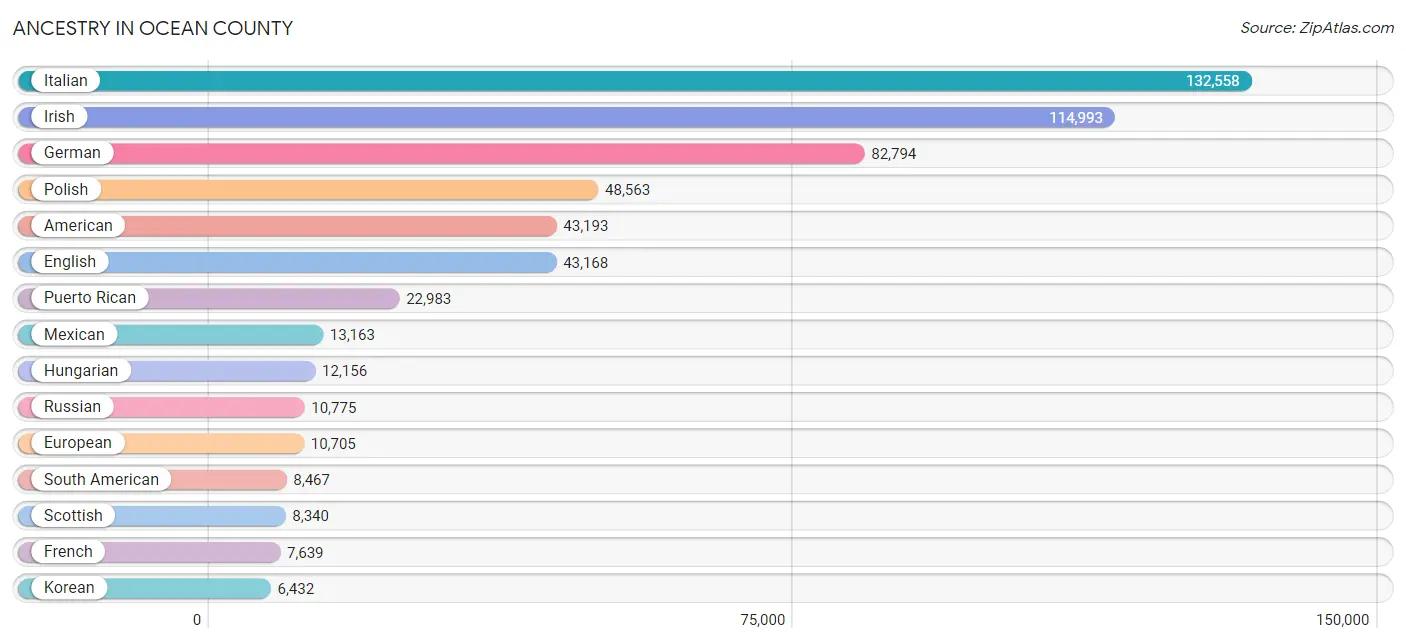
Ancestry in Ocean County
The most populous ancestries reported in Ocean County are Italian (132,558 | 20.7%), Irish (114,993 | 18.0%), German (82,794 | 13.0%), Polish (48,563 | 7.6%), and American (43,193 | 6.8%), together accounting for 66.1% of all Ocean County residents.
| Ancestry | # Population | % Population |
| African | 781 | 0.1% |
| Alaska Native | 10 | 0.0% |
| Albanian | 417 | 0.1% |
| Aleut | 4 | 0.0% |
| Alsatian | 29 | 0.0% |
| American | 43,193 | 6.8% |
| Apache | 80 | 0.0% |
| Arab | 4,788 | 0.7% |
| Argentinean | 555 | 0.1% |
| Armenian | 385 | 0.1% |
| Assyrian / Chaldean / Syriac | 37 | 0.0% |
| Australian | 90 | 0.0% |
| Austrian | 2,560 | 0.4% |
| Bahamian | 8 | 0.0% |
| Barbadian | 136 | 0.0% |
| Basque | 57 | 0.0% |
| Belgian | 450 | 0.1% |
| Belizean | 22 | 0.0% |
| Bhutanese | 855 | 0.1% |
| Blackfeet | 180 | 0.0% |
| Bolivian | 79 | 0.0% |
| Brazilian | 985 | 0.2% |
| British | 2,045 | 0.3% |
| British West Indian | 92 | 0.0% |
| Bulgarian | 173 | 0.0% |
| Burmese | 1,113 | 0.2% |
| Cajun | 3 | 0.0% |
| Cambodian | 209 | 0.0% |
| Canadian | 1,508 | 0.2% |
| Carpatho Rusyn | 25 | 0.0% |
| Celtic | 78 | 0.0% |
| Central American | 4,737 | 0.7% |
| Central American Indian | 203 | 0.0% |
| Cherokee | 703 | 0.1% |
| Chilean | 481 | 0.1% |
| Chippewa | 87 | 0.0% |
| Choctaw | 7 | 0.0% |
| Colombian | 2,352 | 0.4% |
| Comanche | 7 | 0.0% |
| Costa Rican | 1,007 | 0.2% |
| Cree | 45 | 0.0% |
| Creek | 16 | 0.0% |
| Croatian | 740 | 0.1% |
| Cuban | 2,571 | 0.4% |
| Cypriot | 68 | 0.0% |
| Czech | 2,354 | 0.4% |
| Czechoslovakian | 1,121 | 0.2% |
| Danish | 2,110 | 0.3% |
| Delaware | 164 | 0.0% |
| Dominican | 5,536 | 0.9% |
| Dutch | 6,104 | 1.0% |
| Dutch West Indian | 39 | 0.0% |
| Eastern European | 3,953 | 0.6% |
| Ecuadorian | 2,250 | 0.4% |
| Egyptian | 1,498 | 0.2% |
| English | 43,168 | 6.8% |
| Estonian | 80 | 0.0% |
| Ethiopian | 98 | 0.0% |
| European | 10,705 | 1.7% |
| Filipino | 74 | 0.0% |
| Finnish | 431 | 0.1% |
| French | 7,639 | 1.2% |
| French American Indian | 20 | 0.0% |
| French Canadian | 1,685 | 0.3% |
| German | 82,794 | 13.0% |
| Ghanaian | 311 | 0.1% |
| Greek | 4,334 | 0.7% |
| Guamanian / Chamorro | 121 | 0.0% |
| Guatemalan | 1,016 | 0.2% |
| Guyanese | 605 | 0.1% |
| Haitian | 491 | 0.1% |
| Honduran | 714 | 0.1% |
| Hungarian | 12,156 | 1.9% |
| Icelander | 26 | 0.0% |
| Indian (Asian) | 2,803 | 0.4% |
| Indonesian | 53 | 0.0% |
| Inupiat | 2 | 0.0% |
| Iranian | 242 | 0.0% |
| Iraqi | 103 | 0.0% |
| Irish | 114,993 | 18.0% |
| Israeli | 1,456 | 0.2% |
| Italian | 132,558 | 20.7% |
| Jamaican | 1,147 | 0.2% |
| Japanese | 29 | 0.0% |
| Jordanian | 9 | 0.0% |
| Kenyan | 20 | 0.0% |
| Korean | 6,432 | 1.0% |
| Laotian | 60 | 0.0% |
| Latvian | 784 | 0.1% |
| Lebanese | 551 | 0.1% |
| Liberian | 22 | 0.0% |
| Lithuanian | 4,256 | 0.7% |
| Macedonian | 133 | 0.0% |
| Malaysian | 101 | 0.0% |
| Maltese | 103 | 0.0% |
| Mexican | 13,163 | 2.1% |
| Mexican American Indian | 1,045 | 0.2% |
| Mongolian | 58 | 0.0% |
| Moroccan | 521 | 0.1% |
| Native Hawaiian | 176 | 0.0% |
| Navajo | 156 | 0.0% |
| Nicaraguan | 87 | 0.0% |
| Nigerian | 274 | 0.0% |
| Northern European | 328 | 0.1% |
| Norwegian | 4,436 | 0.7% |
| Osage | 3 | 0.0% |
| Pakistani | 84 | 0.0% |
| Palestinian | 236 | 0.0% |
| Panamanian | 134 | 0.0% |
| Paraguayan | 30 | 0.0% |
| Pennsylvania German | 236 | 0.0% |
| Peruvian | 2,337 | 0.4% |
| Polish | 48,563 | 7.6% |
| Portuguese | 4,027 | 0.6% |
| Puerto Rican | 22,983 | 3.6% |
| Romanian | 1,757 | 0.3% |
| Russian | 10,775 | 1.7% |
| Salvadoran | 1,654 | 0.3% |
| Samoan | 68 | 0.0% |
| Scandinavian | 707 | 0.1% |
| Scotch-Irish | 3,344 | 0.5% |
| Scottish | 8,340 | 1.3% |
| Serbian | 110 | 0.0% |
| Sioux | 9 | 0.0% |
| Slavic | 494 | 0.1% |
| Slovak | 3,047 | 0.5% |
| Slovene | 99 | 0.0% |
| South African | 222 | 0.0% |
| South American | 8,467 | 1.3% |
| South American Indian | 243 | 0.0% |
| Spaniard | 2,057 | 0.3% |
| Spanish | 777 | 0.1% |
| Spanish American | 24 | 0.0% |
| Spanish American Indian | 51 | 0.0% |
| Sri Lankan | 811 | 0.1% |
| Subsaharan African | 1,710 | 0.3% |
| Sudanese | 11 | 0.0% |
| Swedish | 3,781 | 0.6% |
| Swiss | 733 | 0.1% |
| Syrian | 957 | 0.2% |
| Thai | 2,006 | 0.3% |
| Tlingit-Haida | 12 | 0.0% |
| Tongan | 33 | 0.0% |
| Trinidadian and Tobagonian | 497 | 0.1% |
| Turkish | 670 | 0.1% |
| Ukrainian | 4,313 | 0.7% |
| Uruguayan | 174 | 0.0% |
| Venezuelan | 178 | 0.0% |
| Vietnamese | 66 | 0.0% |
| Welsh | 1,991 | 0.3% |
| West Indian | 315 | 0.1% |
| Yugoslavian | 182 | 0.0% | View All 152 Rows |
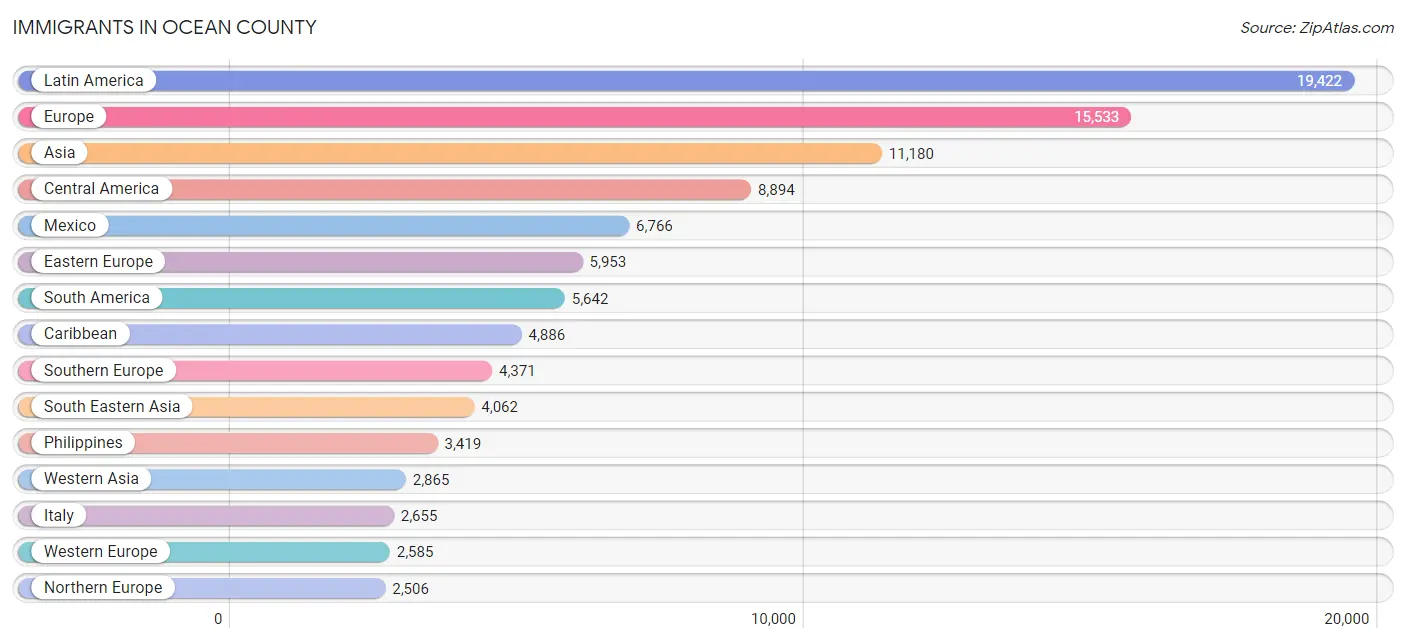
Immigrants in Ocean County
The most numerous immigrant groups reported in Ocean County came from Latin America (19,422 | 3.0%), Europe (15,533 | 2.4%), Asia (11,180 | 1.8%), Central America (8,894 | 1.4%), and Mexico (6,766 | 1.1%), together accounting for 9.7% of all Ocean County residents.
| Immigration Origin | # Population | % Population |
| Africa | 2,091 | 0.3% |
| Albania | 152 | 0.0% |
| Argentina | 131 | 0.0% |
| Armenia | 16 | 0.0% |
| Asia | 11,180 | 1.8% |
| Australia | 271 | 0.0% |
| Austria | 203 | 0.0% |
| Azores | 14 | 0.0% |
| Bangladesh | 66 | 0.0% |
| Barbados | 68 | 0.0% |
| Belarus | 172 | 0.0% |
| Belgium | 116 | 0.0% |
| Belize | 9 | 0.0% |
| Brazil | 659 | 0.1% |
| Bulgaria | 116 | 0.0% |
| Cambodia | 29 | 0.0% |
| Canada | 1,105 | 0.2% |
| Caribbean | 4,886 | 0.8% |
| Central America | 8,894 | 1.4% |
| Chile | 77 | 0.0% |
| China | 1,199 | 0.2% |
| Colombia | 1,682 | 0.3% |
| Costa Rica | 411 | 0.1% |
| Croatia | 213 | 0.0% |
| Cuba | 884 | 0.1% |
| Czechoslovakia | 399 | 0.1% |
| Denmark | 158 | 0.0% |
| Dominican Republic | 1,979 | 0.3% |
| Eastern Africa | 105 | 0.0% |
| Eastern Asia | 2,014 | 0.3% |
| Eastern Europe | 5,953 | 0.9% |
| Ecuador | 1,027 | 0.2% |
| Egypt | 663 | 0.1% |
| El Salvador | 533 | 0.1% |
| England | 886 | 0.1% |
| Ethiopia | 14 | 0.0% |
| Europe | 15,533 | 2.4% |
| France | 330 | 0.1% |
| Germany | 1,676 | 0.3% |
| Ghana | 394 | 0.1% |
| Greece | 440 | 0.1% |
| Grenada | 32 | 0.0% |
| Guatemala | 839 | 0.1% |
| Guyana | 600 | 0.1% |
| Haiti | 875 | 0.1% |
| Honduras | 276 | 0.0% |
| Hong Kong | 78 | 0.0% |
| Hungary | 347 | 0.1% |
| India | 950 | 0.2% |
| Iran | 163 | 0.0% |
| Iraq | 100 | 0.0% |
| Ireland | 440 | 0.1% |
| Israel | 1,676 | 0.3% |
| Italy | 2,655 | 0.4% |
| Jamaica | 796 | 0.1% |
| Japan | 121 | 0.0% |
| Jordan | 175 | 0.0% |
| Kazakhstan | 30 | 0.0% |
| Kenya | 20 | 0.0% |
| Korea | 694 | 0.1% |
| Laos | 59 | 0.0% |
| Latin America | 19,422 | 3.0% |
| Latvia | 430 | 0.1% |
| Lebanon | 69 | 0.0% |
| Liberia | 35 | 0.0% |
| Lithuania | 268 | 0.0% |
| Malaysia | 56 | 0.0% |
| Mexico | 6,766 | 1.1% |
| Moldova | 225 | 0.0% |
| Morocco | 95 | 0.0% |
| Netherlands | 132 | 0.0% |
| Nicaragua | 19 | 0.0% |
| Nigeria | 347 | 0.1% |
| North Macedonia | 176 | 0.0% |
| Northern Africa | 789 | 0.1% |
| Northern Europe | 2,506 | 0.4% |
| Norway | 252 | 0.0% |
| Oceania | 271 | 0.0% |
| Pakistan | 855 | 0.1% |
| Panama | 41 | 0.0% |
| Peru | 1,117 | 0.2% |
| Philippines | 3,419 | 0.5% |
| Poland | 1,375 | 0.2% |
| Portugal | 994 | 0.2% |
| Romania | 197 | 0.0% |
| Russia | 1,015 | 0.2% |
| Scotland | 221 | 0.0% |
| Sierra Leone | 66 | 0.0% |
| Singapore | 10 | 0.0% |
| South Africa | 286 | 0.0% |
| South America | 5,642 | 0.9% |
| South Central Asia | 2,225 | 0.4% |
| South Eastern Asia | 4,062 | 0.6% |
| Southern Europe | 4,371 | 0.7% |
| Spain | 247 | 0.0% |
| Sri Lanka | 22 | 0.0% |
| Sudan | 11 | 0.0% |
| Sweden | 73 | 0.0% |
| Switzerland | 128 | 0.0% |
| Syria | 155 | 0.0% |
| Taiwan | 142 | 0.0% |
| Thailand | 63 | 0.0% |
| Trinidad and Tobago | 201 | 0.0% |
| Turkey | 297 | 0.1% |
| Ukraine | 724 | 0.1% |
| Uruguay | 252 | 0.0% |
| Uzbekistan | 91 | 0.0% |
| Venezuela | 67 | 0.0% |
| Vietnam | 282 | 0.0% |
| Western Africa | 842 | 0.1% |
| Western Asia | 2,865 | 0.4% |
| Western Europe | 2,585 | 0.4% |
| Zimbabwe | 7 | 0.0% | View All 113 Rows |
Sex and Age in Ocean County
Sex and Age in Ocean County
The most populous age groups in Ocean County are Under 5 Years (23,628 | 7.6%) for men and 60 to 64 Years (23,620 | 7.2%) for women.
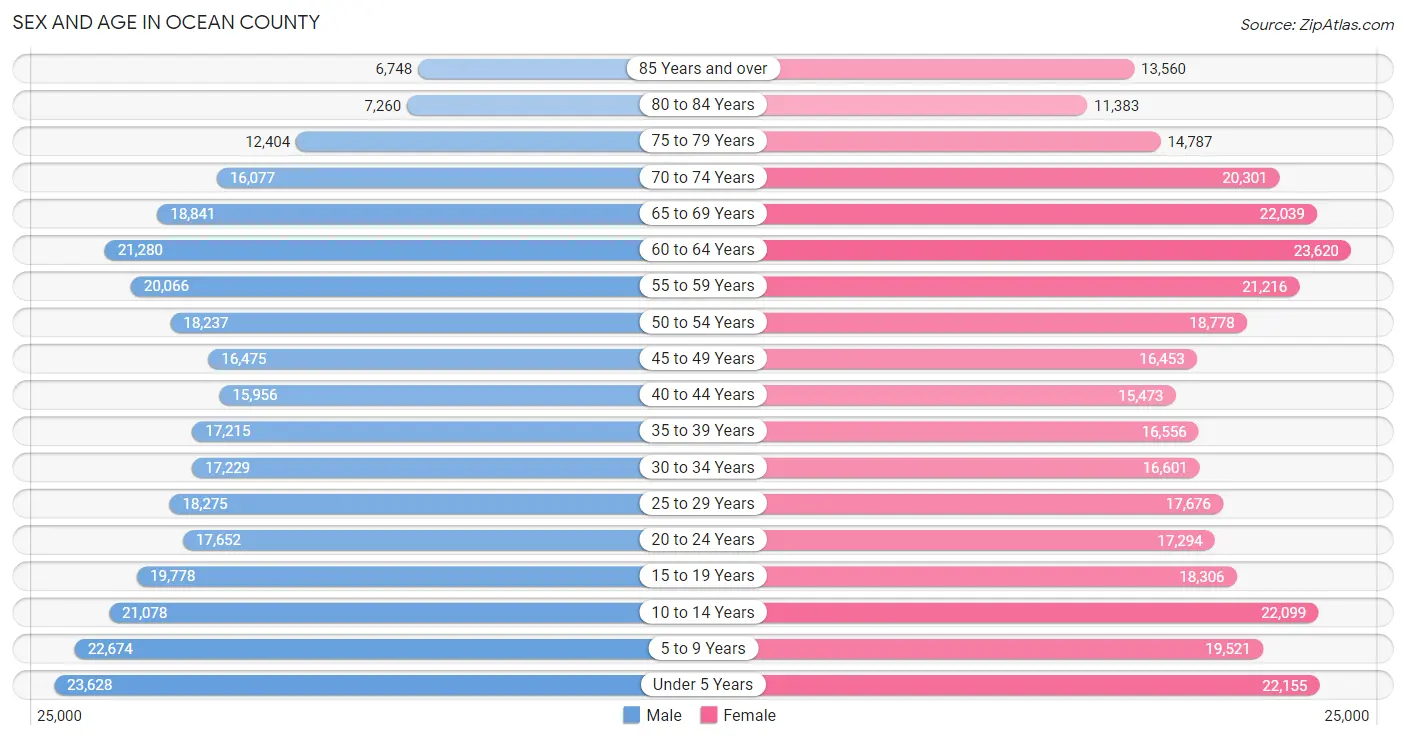
| Age Bracket | Male | Female |
| Under 5 Years | 23,628 (7.6%) | 22,155 (6.8%) |
| 5 to 9 Years | 22,674 (7.3%) | 19,521 (5.9%) |
| 10 to 14 Years | 21,078 (6.8%) | 22,099 (6.7%) |
| 15 to 19 Years | 19,778 (6.4%) | 18,306 (5.6%) |
| 20 to 24 Years | 17,652 (5.7%) | 17,294 (5.3%) |
| 25 to 29 Years | 18,275 (5.9%) | 17,676 (5.4%) |
| 30 to 34 Years | 17,229 (5.5%) | 16,601 (5.1%) |
| 35 to 39 Years | 17,215 (5.5%) | 16,556 (5.1%) |
| 40 to 44 Years | 15,956 (5.1%) | 15,473 (4.7%) |
| 45 to 49 Years | 16,475 (5.3%) | 16,453 (5.0%) |
| 50 to 54 Years | 18,237 (5.9%) | 18,778 (5.7%) |
| 55 to 59 Years | 20,066 (6.5%) | 21,216 (6.5%) |
| 60 to 64 Years | 21,280 (6.9%) | 23,620 (7.2%) |
| 65 to 69 Years | 18,841 (6.1%) | 22,039 (6.7%) |
| 70 to 74 Years | 16,077 (5.2%) | 20,301 (6.2%) |
| 75 to 79 Years | 12,404 (4.0%) | 14,787 (4.5%) |
| 80 to 84 Years | 7,260 (2.3%) | 11,383 (3.5%) |
| 85 Years and over | 6,748 (2.2%) | 13,560 (4.1%) |
| Total | 310,873 (100.0%) | 327,818 (100.0%) |
Families and Households in Ocean County
Median Family Size in Ocean County
The median family size in Ocean County is 3.31 persons per family, with married-couple families (126,346 | 79.7%) accounting for the largest median family size of 3.42 persons per family. On the other hand, single male/father families (9,124 | 5.8%) represent the smallest median family size with 2.81 persons per family.
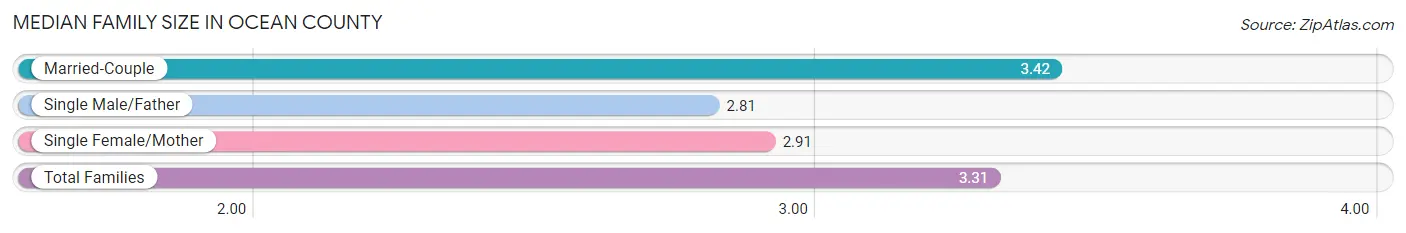
| Family Type | # Families | Family Size |
| Married-Couple | 126,346 (79.7%) | 3.42 |
| Single Male/Father | 9,124 (5.8%) | 2.81 |
| Single Female/Mother | 22,970 (14.5%) | 2.91 |
| Total Families | 158,440 (100.0%) | 3.31 |
Median Household Size in Ocean County
The median household size in Ocean County is 2.64 persons per household, with married-couple households (126,346 | 52.8%) accounting for the largest median household size of 3.45 persons per household. non-family households (81,026 | 33.8%) represent the smallest median household size with 1.19 persons per household.
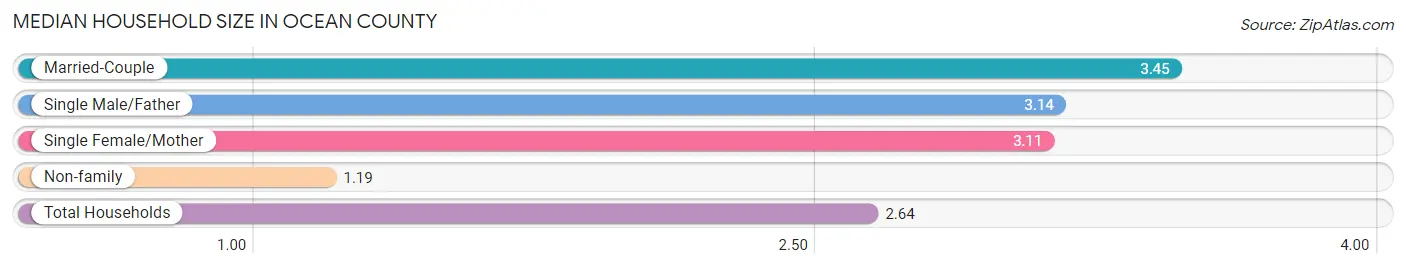
| Household Type | # Households | Household Size |
| Married-Couple | 126,346 (52.8%) | 3.45 |
| Single Male/Father | 9,124 (3.8%) | 3.14 |
| Single Female/Mother | 22,970 (9.6%) | 3.11 |
| Non-family | 81,026 (33.8%) | 1.19 |
| Total Households | 239,466 (100.0%) | 2.64 |
Household Size by Marriage Status in Ocean County
Out of a total of 239,466 households in Ocean County, 158,440 (66.2%) are family households, while 81,026 (33.8%) are nonfamily households. The most numerous type of family households are 2-person households, comprising 71,290, and the most common type of nonfamily households are 1-person households, comprising 68,431.
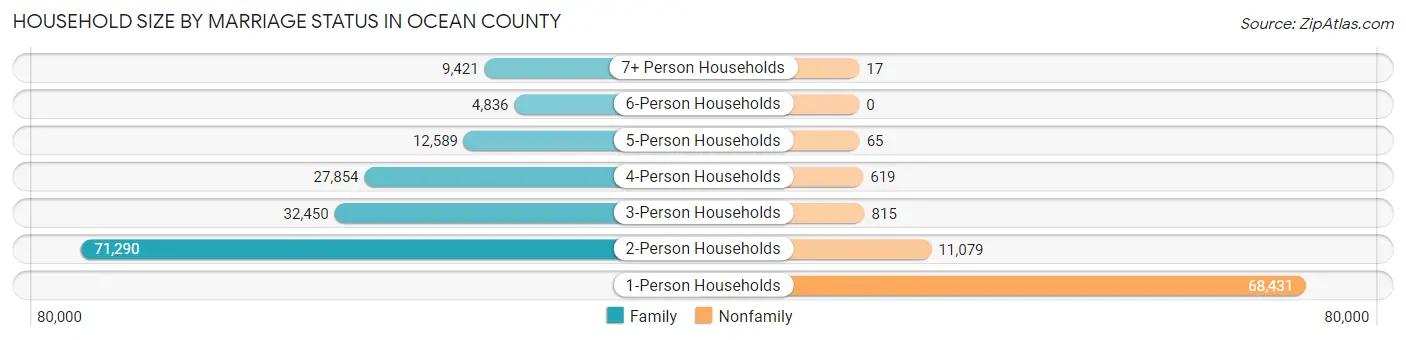
| Household Size | Family Households | Nonfamily Households |
| 1-Person Households | - | 68,431 (28.6%) |
| 2-Person Households | 71,290 (29.8%) | 11,079 (4.6%) |
| 3-Person Households | 32,450 (13.6%) | 815 (0.3%) |
| 4-Person Households | 27,854 (11.6%) | 619 (0.3%) |
| 5-Person Households | 12,589 (5.3%) | 65 (0.0%) |
| 6-Person Households | 4,836 (2.0%) | 0 (0.0%) |
| 7+ Person Households | 9,421 (3.9%) | 17 (0.0%) |
| Total | 158,440 (66.2%) | 81,026 (33.8%) |
Female Fertility in Ocean County
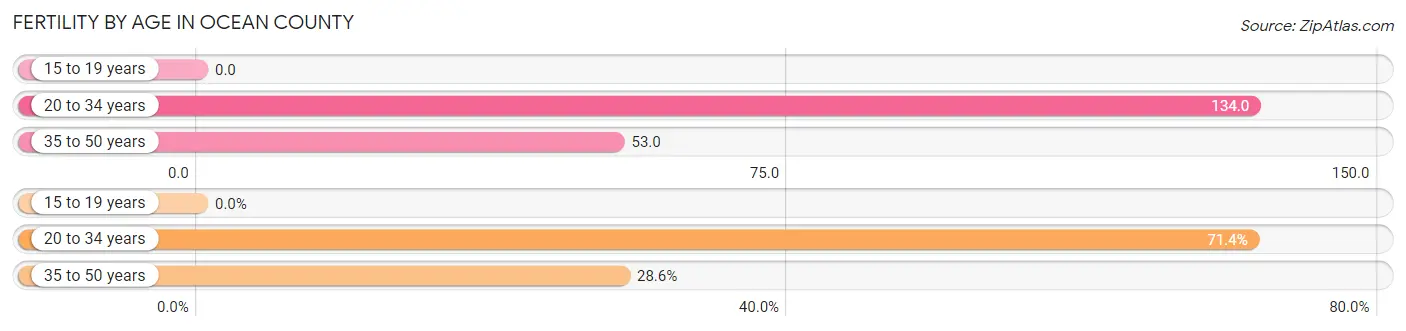
Fertility by Age in Ocean County
Average fertility rate in Ocean County is 79.0 births per 1,000 women. Women in the age bracket of 20 to 34 years have the highest fertility rate with 134.0 births per 1,000 women. Women in the age bracket of 20 to 34 years acount for 71.4% of all women with births.
| Age Bracket | Women with Births | Births / 1,000 Women |
| 15 to 19 years | 0 (0.0%) | 0.0 |
| 20 to 34 years | 6,923 (71.4%) | 134.0 |
| 35 to 50 years | 2,779 (28.6%) | 53.0 |
| Total | 9,702 (100.0%) | 79.0 |
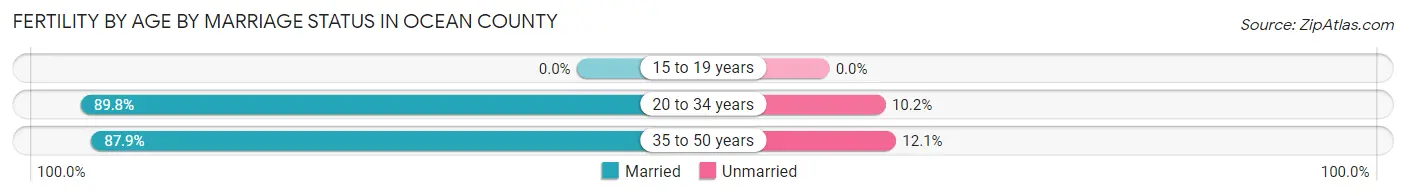
Fertility by Age by Marriage Status in Ocean County
89.3% of women with births (9,702) in Ocean County are married. The highest percentage of unmarried women with births falls into 35 to 50 years age bracket with 12.1% of them unmarried at the time of birth, while the lowest percentage of unmarried women with births belong to 20 to 34 years age bracket with 10.2% of them unmarried.
| Age Bracket | Married | Unmarried |
| 15 to 19 years | 0 (0.0%) | 0 (0.0%) |
| 20 to 34 years | 6,217 (89.8%) | 706 (10.2%) |
| 35 to 50 years | 2,443 (87.9%) | 336 (12.1%) |
| Total | 8,664 (89.3%) | 1,038 (10.7%) |
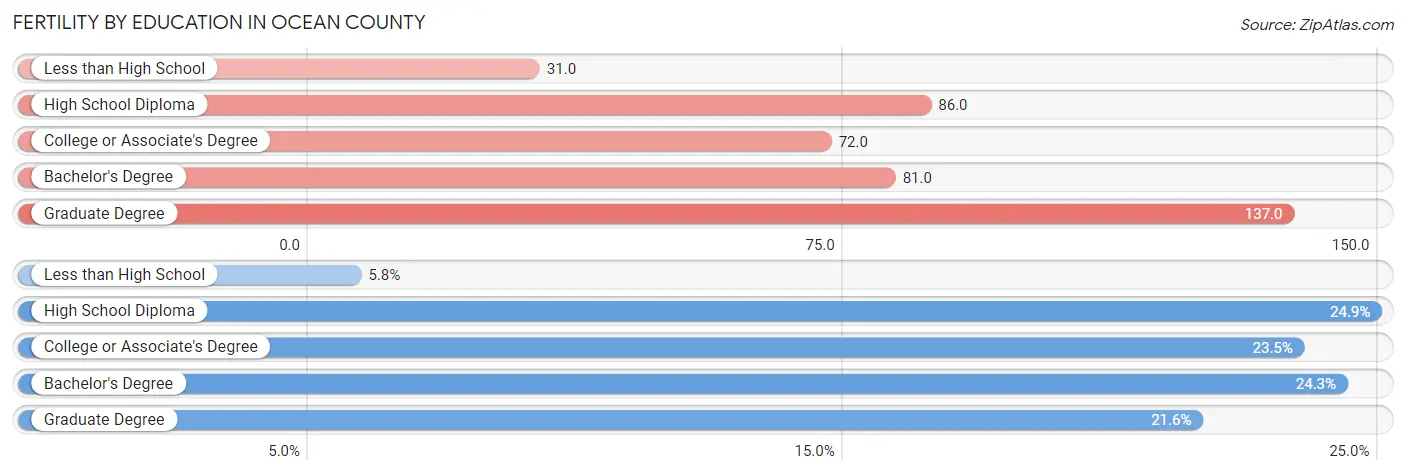
Fertility by Education in Ocean County
Average fertility rate in Ocean County is 79.0 births per 1,000 women. Women with the education attainment of graduate degree have the highest fertility rate of 137.0 births per 1,000 women, while women with the education attainment of less than high school have the lowest fertility at 31.0 births per 1,000 women. Women with the education attainment of high school diploma represent 24.9% of all women with births.
| Educational Attainment | Women with Births | Births / 1,000 Women |
| Less than High School | 562 (5.8%) | 31.0 |
| High School Diploma | 2,417 (24.9%) | 86.0 |
| College or Associate's Degree | 2,276 (23.5%) | 72.0 |
| Bachelor's Degree | 2,355 (24.3%) | 81.0 |
| Graduate Degree | 2,092 (21.6%) | 137.0 |
| Total | 9,702 (100.0%) | 79.0 |
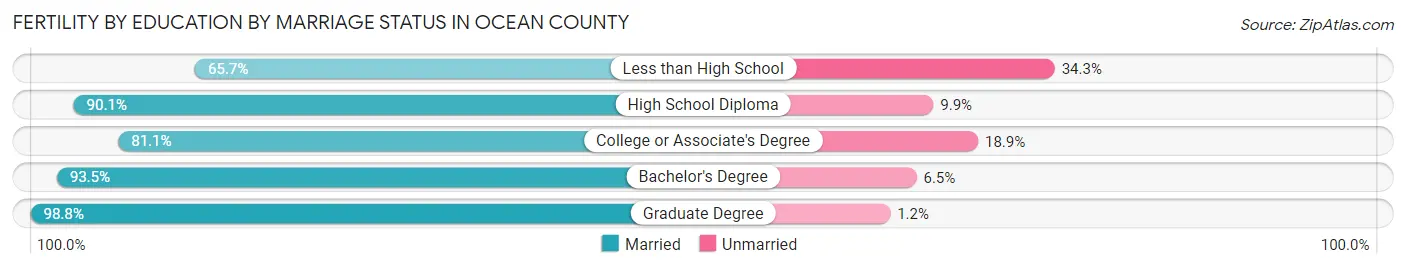
Fertility by Education by Marriage Status in Ocean County
10.7% of women with births in Ocean County are unmarried. Women with the educational attainment of graduate degree are most likely to be married with 98.8% of them married at childbirth, while women with the educational attainment of less than high school are least likely to be married with 34.3% of them unmarried at childbirth.
| Educational Attainment | Married | Unmarried |
| Less than High School | 369 (65.7%) | 193 (34.3%) |
| High School Diploma | 2,178 (90.1%) | 239 (9.9%) |
| College or Associate's Degree | 1,846 (81.1%) | 430 (18.9%) |
| Bachelor's Degree | 2,202 (93.5%) | 153 (6.5%) |
| Graduate Degree | 2,067 (98.8%) | 25 (1.2%) |
| Total | 8,664 (89.3%) | 1,038 (10.7%) |
Income in Ocean County
Income Overview in Ocean County
Per Capita Income in Ocean County is $42,497, while median incomes of families and households are $104,483 and $82,379 respectively.
| Characteristic | Number | Measure |
| Per Capita Income | 638,691 | $42,497 |
| Median Family Income | 158,440 | $104,483 |
| Mean Family Income | 158,440 | $129,682 |
| Median Household Income | 239,466 | $82,379 |
| Mean Household Income | 239,466 | $111,549 |
| Income Deficit | 158,440 | $11,341 |
| Wage / Income Gap (%) | 638,691 | 36.89% |
| Wage / Income Gap ($) | 638,691 | 63.11¢ per $1 |
| Gini / Inequality Index | 638,691 | 0.46 |
Earnings by Sex in Ocean County
Average Earnings in Ocean County are $45,877, $57,074 for men and $36,020 for women, a difference of 36.9%.
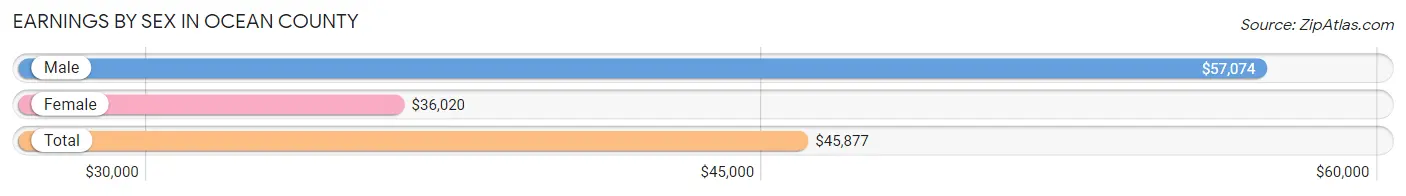
| Sex | Number | Average Earnings |
| Male | 155,368 (51.0%) | $57,074 |
| Female | 149,426 (49.0%) | $36,020 |
| Total | 304,794 (100.0%) | $45,877 |
Earnings by Sex by Income Bracket in Ocean County
The most common earnings brackets in Ocean County are $100,000+ for men (39,655 | 25.5%) and $75,000 to $99,999 for women (15,169 | 10.2%).
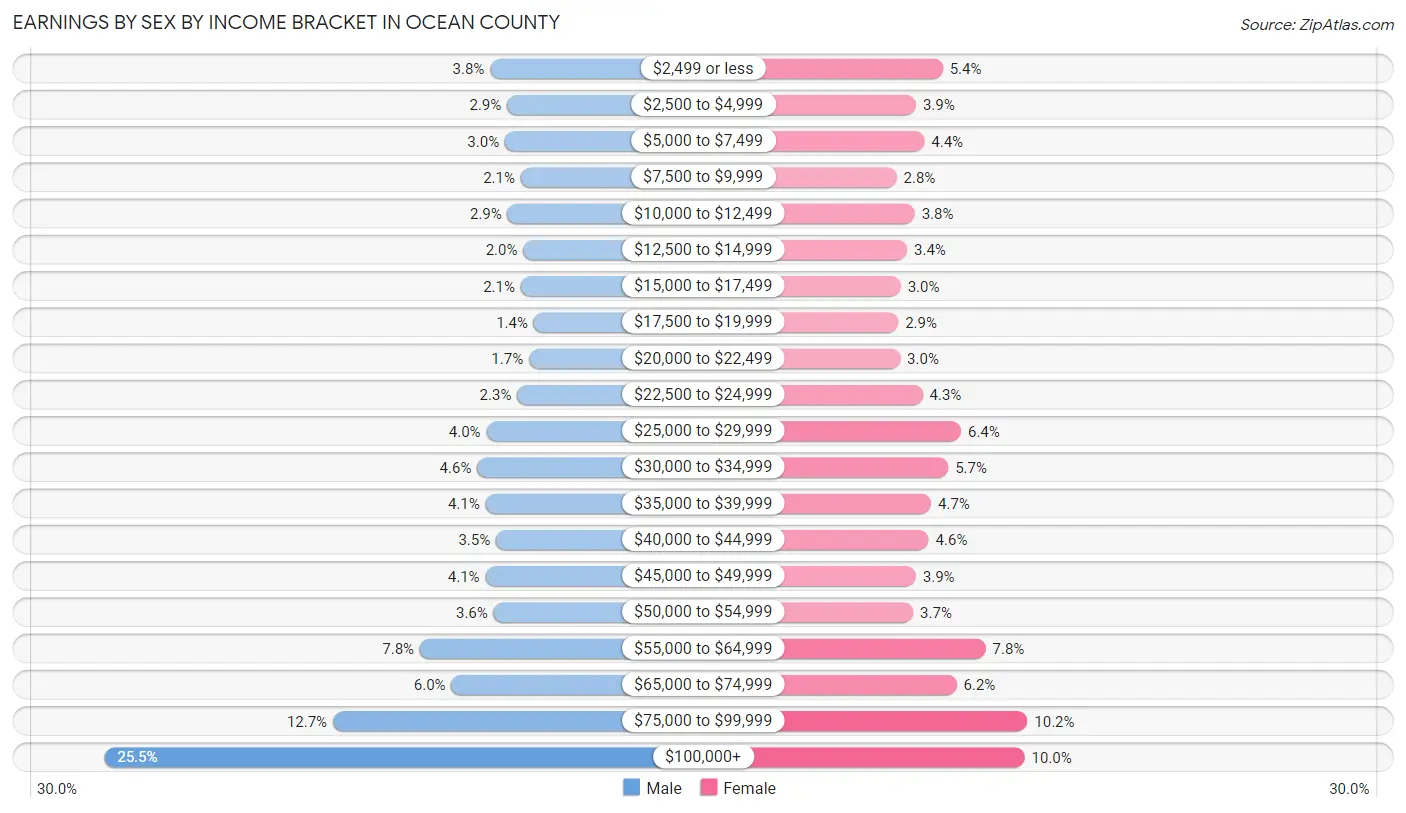
| Income | Male | Female |
| $2,499 or less | 5,945 (3.8%) | 8,048 (5.4%) |
| $2,500 to $4,999 | 4,469 (2.9%) | 5,809 (3.9%) |
| $5,000 to $7,499 | 4,667 (3.0%) | 6,521 (4.4%) |
| $7,500 to $9,999 | 3,276 (2.1%) | 4,181 (2.8%) |
| $10,000 to $12,499 | 4,422 (2.9%) | 5,713 (3.8%) |
| $12,500 to $14,999 | 3,065 (2.0%) | 5,065 (3.4%) |
| $15,000 to $17,499 | 3,276 (2.1%) | 4,526 (3.0%) |
| $17,500 to $19,999 | 2,146 (1.4%) | 4,319 (2.9%) |
| $20,000 to $22,499 | 2,560 (1.7%) | 4,489 (3.0%) |
| $22,500 to $24,999 | 3,595 (2.3%) | 6,370 (4.3%) |
| $25,000 to $29,999 | 6,275 (4.0%) | 9,586 (6.4%) |
| $30,000 to $34,999 | 7,090 (4.6%) | 8,511 (5.7%) |
| $35,000 to $39,999 | 6,352 (4.1%) | 7,086 (4.7%) |
| $40,000 to $44,999 | 5,443 (3.5%) | 6,874 (4.6%) |
| $45,000 to $49,999 | 6,369 (4.1%) | 5,791 (3.9%) |
| $50,000 to $54,999 | 5,658 (3.6%) | 5,573 (3.7%) |
| $55,000 to $64,999 | 12,080 (7.8%) | 11,651 (7.8%) |
| $65,000 to $74,999 | 9,344 (6.0%) | 9,214 (6.2%) |
| $75,000 to $99,999 | 19,681 (12.7%) | 15,169 (10.2%) |
| $100,000+ | 39,655 (25.5%) | 14,930 (10.0%) |
| Total | 155,368 (100.0%) | 149,426 (100.0%) |
Earnings by Sex by Educational Attainment in Ocean County
Average earnings in Ocean County are $65,159 for men and $42,028 for women, a difference of 35.5%. Men with an educational attainment of graduate degree enjoy the highest average annual earnings of $92,635, while those with less than high school education earn the least with $41,724. Women with an educational attainment of graduate degree earn the most with the average annual earnings of $69,032, while those with less than high school education have the smallest earnings of $27,194.
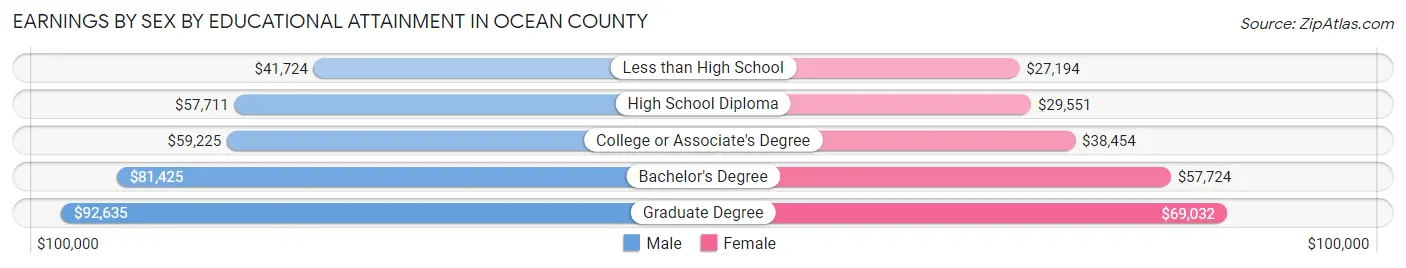
| Educational Attainment | Male Income | Female Income |
| Less than High School | $41,724 | $27,194 |
| High School Diploma | $57,711 | $29,551 |
| College or Associate's Degree | $59,225 | $38,454 |
| Bachelor's Degree | $81,425 | $57,724 |
| Graduate Degree | $92,635 | $69,032 |
| Total | $65,159 | $42,028 |
Family Income in Ocean County
Family Income Brackets in Ocean County
According to the Ocean County family income data, there are 37,075 families falling into the $100,000 to $149,999 income range, which is the most common income bracket and makes up 23.4% of all families. Conversely, the $10,000 to $14,999 income bracket is the least frequent group with only 1,743 families (1.1%) belonging to this category.
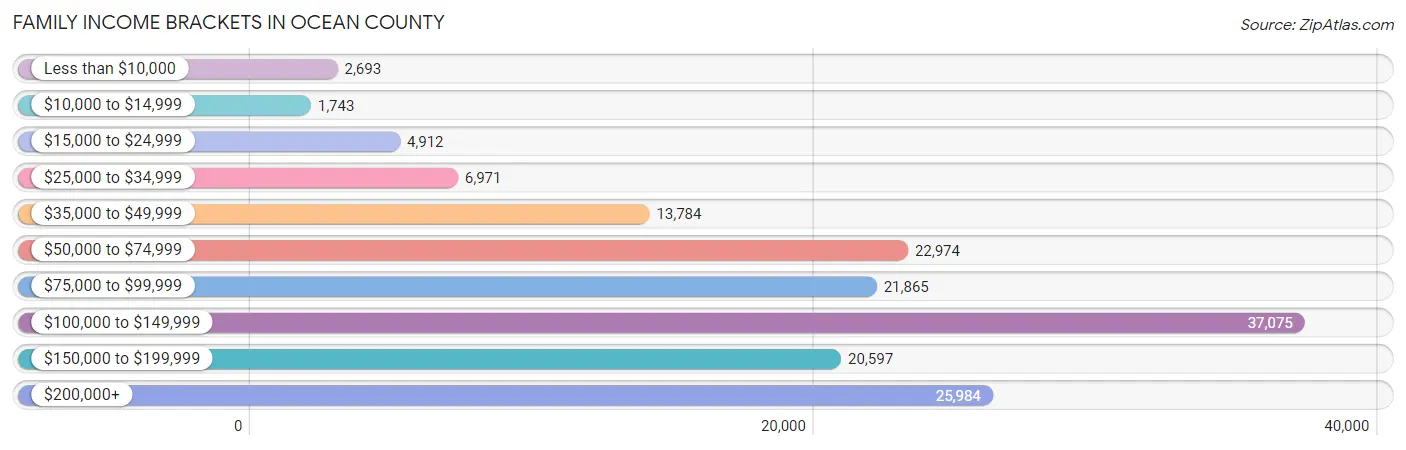
| Income Bracket | # Families | % Families |
| Less than $10,000 | 2,693 | 1.7% |
| $10,000 to $14,999 | 1,743 | 1.1% |
| $15,000 to $24,999 | 4,912 | 3.1% |
| $25,000 to $34,999 | 6,971 | 4.4% |
| $35,000 to $49,999 | 13,784 | 8.7% |
| $50,000 to $74,999 | 22,974 | 14.5% |
| $75,000 to $99,999 | 21,865 | 13.8% |
| $100,000 to $149,999 | 37,075 | 23.4% |
| $150,000 to $199,999 | 20,597 | 13.0% |
| $200,000+ | 25,984 | 16.4% |
Family Income by Famaliy Size in Ocean County
4-person families (26,982 | 17.0%) account for the highest median family income in Ocean County with $142,045 per family, while 2-person families (74,691 | 47.1%) have the highest median income of $44,804 per family member.
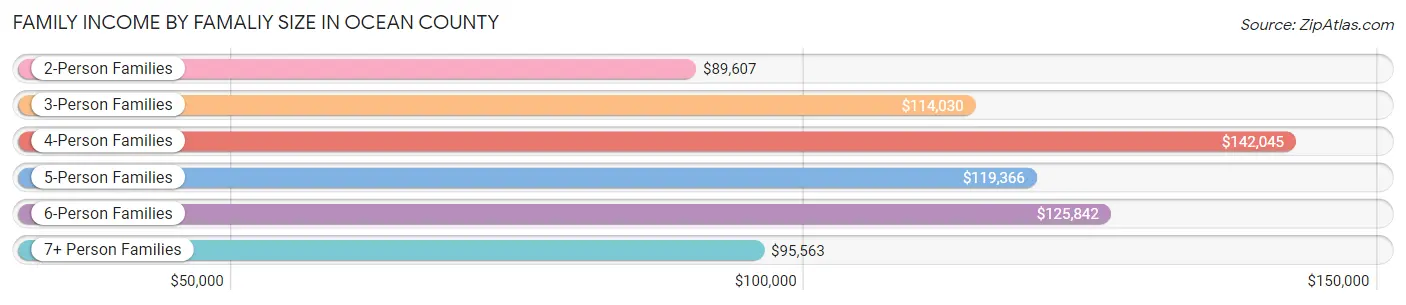
| Income Bracket | # Families | Median Income |
| 2-Person Families | 74,691 (47.1%) | $89,607 |
| 3-Person Families | 31,869 (20.1%) | $114,030 |
| 4-Person Families | 26,982 (17.0%) | $142,045 |
| 5-Person Families | 11,360 (7.2%) | $119,366 |
| 6-Person Families | 4,622 (2.9%) | $125,842 |
| 7+ Person Families | 8,916 (5.6%) | $95,563 |
| Total | 158,440 (100.0%) | $104,483 |
Family Income by Number of Earners in Ocean County
The median family income in Ocean County is $104,483, with families comprising 3+ earners (20,903) having the highest median family income of $170,542, while families with no earners (28,151) have the lowest median family income of $63,705, accounting for 13.2% and 17.8% of families, respectively.
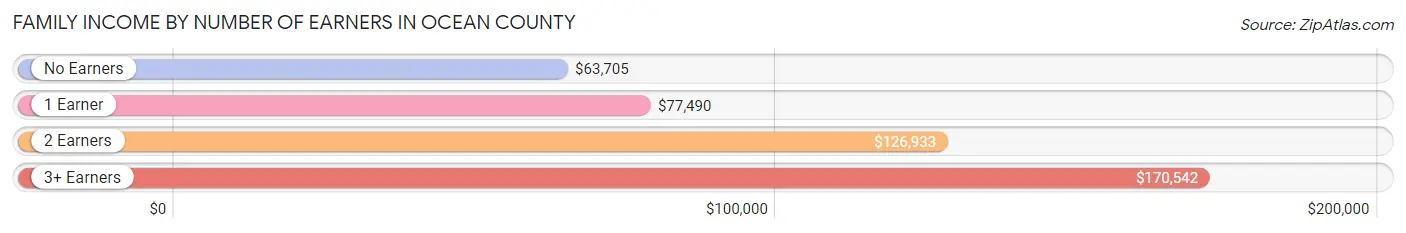
| Number of Earners | # Families | Median Income |
| No Earners | 28,151 (17.8%) | $63,705 |
| 1 Earner | 47,450 (29.9%) | $77,490 |
| 2 Earners | 61,936 (39.1%) | $126,933 |
| 3+ Earners | 20,903 (13.2%) | $170,542 |
| Total | 158,440 (100.0%) | $104,483 |
Household Income in Ocean County
Household Income Brackets in Ocean County
With 45,499 households falling in the category, the $100,000 to $149,999 income range is the most frequent in Ocean County, accounting for 19.0% of all households. In contrast, only 5,987 households (2.5%) fall into the $10,000 to $14,999 income bracket, making it the least populous group.
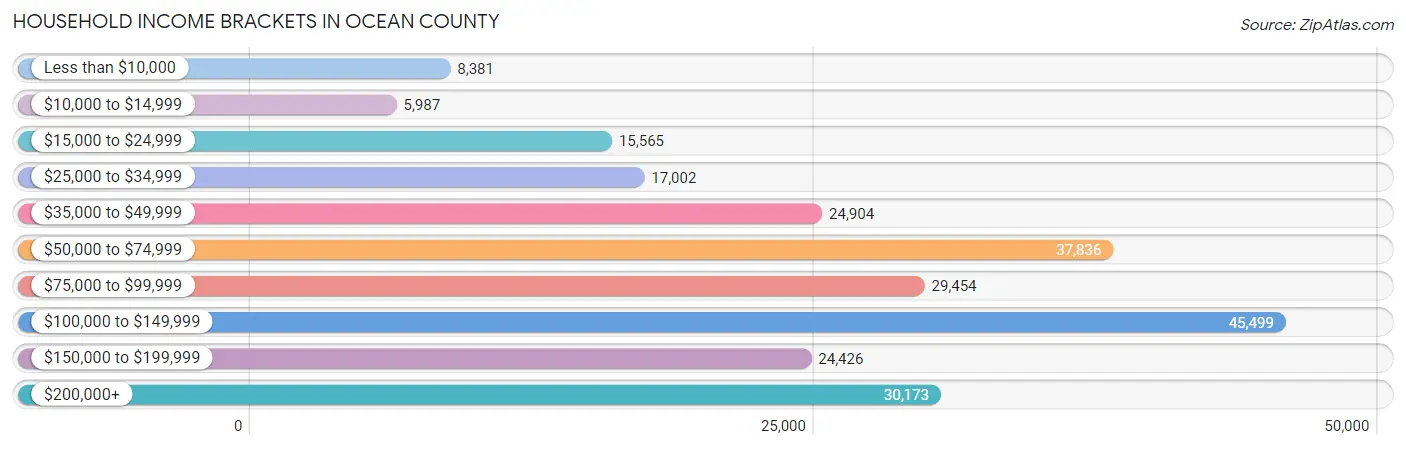
| Income Bracket | # Households | % Households |
| Less than $10,000 | 8,381 | 3.5% |
| $10,000 to $14,999 | 5,987 | 2.5% |
| $15,000 to $24,999 | 15,565 | 6.5% |
| $25,000 to $34,999 | 17,002 | 7.1% |
| $35,000 to $49,999 | 24,904 | 10.4% |
| $50,000 to $74,999 | 37,836 | 15.8% |
| $75,000 to $99,999 | 29,454 | 12.3% |
| $100,000 to $149,999 | 45,499 | 19.0% |
| $150,000 to $199,999 | 24,426 | 10.2% |
| $200,000+ | 30,173 | 12.6% |
Household Income by Householder Age in Ocean County
The median household income in Ocean County is $82,379, with the highest median household income of $109,253 found in the 45 to 64 years age bracket for the primary householder. A total of 86,212 households (36.0%) fall into this category. Meanwhile, the 15 to 24 years age bracket for the primary householder has the lowest median household income of $38,750, with 3,545 households (1.5%) in this group.
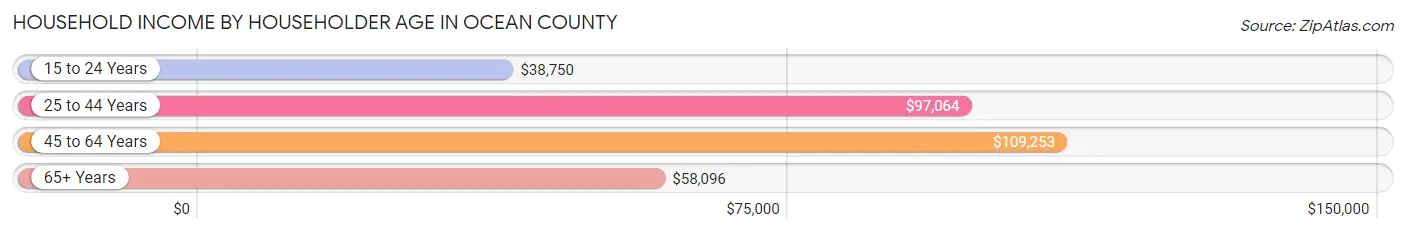
| Income Bracket | # Households | Median Income |
| 15 to 24 Years | 3,545 (1.5%) | $38,750 |
| 25 to 44 Years | 56,868 (23.7%) | $97,064 |
| 45 to 64 Years | 86,212 (36.0%) | $109,253 |
| 65+ Years | 92,841 (38.8%) | $58,096 |
| Total | 239,466 (100.0%) | $82,379 |
Poverty in Ocean County
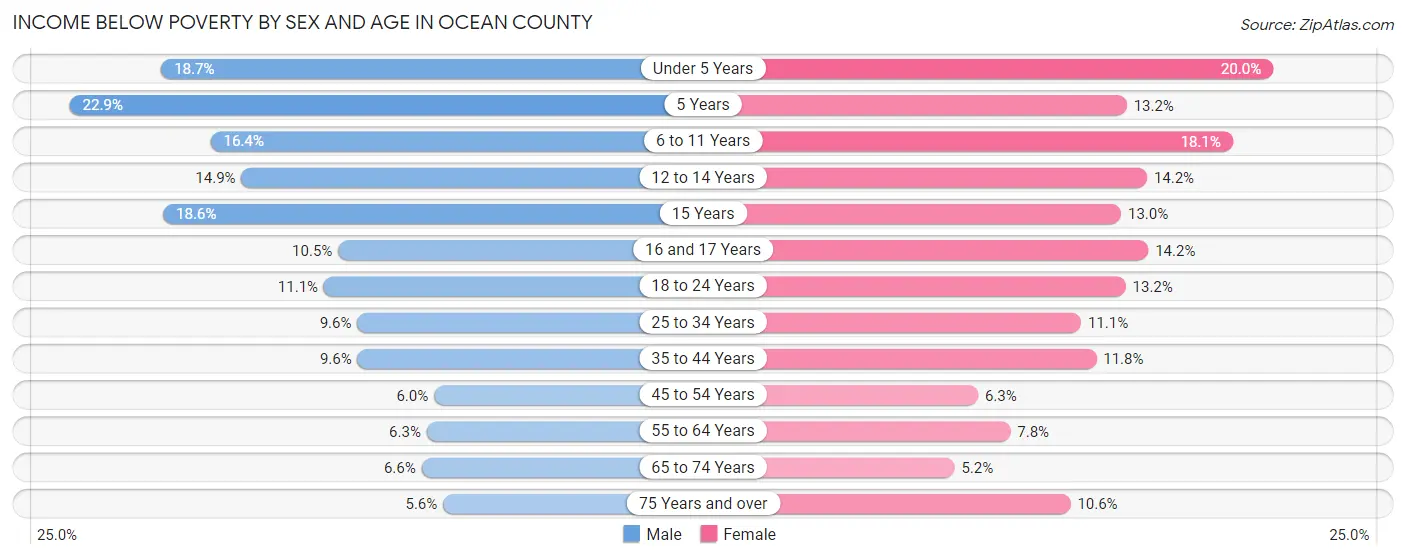
Income Below Poverty by Sex and Age in Ocean County
With 10.0% poverty level for males and 10.9% for females among the residents of Ocean County, 5 year old males and under 5 year old females are the most vulnerable to poverty, with 1,137 males (22.9%) and 4,377 females (20.0%) in their respective age groups living below the poverty level.
| Age Bracket | Male | Female |
| Under 5 Years | 4,337 (18.7%) | 4,377 (20.0%) |
| 5 Years | 1,137 (22.9%) | 396 (13.2%) |
| 6 to 11 Years | 4,328 (16.4%) | 4,525 (18.1%) |
| 12 to 14 Years | 1,785 (14.9%) | 1,897 (14.2%) |
| 15 Years | 760 (18.6%) | 567 (13.0%) |
| 16 and 17 Years | 916 (10.4%) | 1,116 (14.2%) |
| 18 to 24 Years | 2,632 (11.1%) | 3,042 (13.2%) |
| 25 to 34 Years | 3,378 (9.6%) | 3,803 (11.1%) |
| 35 to 44 Years | 3,149 (9.6%) | 3,776 (11.8%) |
| 45 to 54 Years | 2,073 (6.0%) | 2,221 (6.3%) |
| 55 to 64 Years | 2,596 (6.3%) | 3,482 (7.8%) |
| 65 to 74 Years | 2,263 (6.6%) | 2,188 (5.2%) |
| 75 Years and over | 1,444 (5.6%) | 4,070 (10.6%) |
| Total | 30,798 (10.0%) | 35,460 (10.9%) |
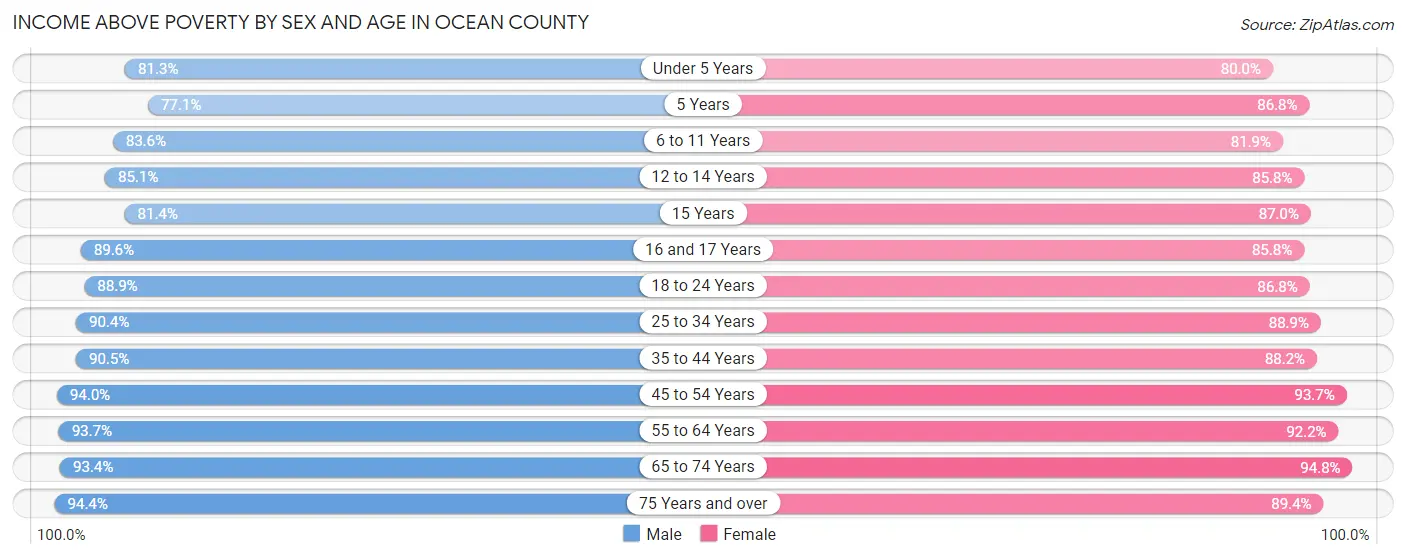
Income Above Poverty by Sex and Age in Ocean County
According to the poverty statistics in Ocean County, males aged 75 years and over and females aged 65 to 74 years are the age groups that are most secure financially, with 94.4% of males and 94.8% of females in these age groups living above the poverty line.
| Age Bracket | Male | Female |
| Under 5 Years | 18,904 (81.3%) | 17,497 (80.0%) |
| 5 Years | 3,826 (77.1%) | 2,599 (86.8%) |
| 6 to 11 Years | 22,118 (83.6%) | 20,413 (81.9%) |
| 12 to 14 Years | 10,161 (85.1%) | 11,497 (85.8%) |
| 15 Years | 3,332 (81.4%) | 3,809 (87.0%) |
| 16 and 17 Years | 7,851 (89.5%) | 6,734 (85.8%) |
| 18 to 24 Years | 21,057 (88.9%) | 20,061 (86.8%) |
| 25 to 34 Years | 31,971 (90.4%) | 30,446 (88.9%) |
| 35 to 44 Years | 29,827 (90.4%) | 28,197 (88.2%) |
| 45 to 54 Years | 32,504 (94.0%) | 32,901 (93.7%) |
| 55 to 64 Years | 38,331 (93.7%) | 41,033 (92.2%) |
| 65 to 74 Years | 32,120 (93.4%) | 39,632 (94.8%) |
| 75 Years and over | 24,432 (94.4%) | 34,297 (89.4%) |
| Total | 276,434 (90.0%) | 289,116 (89.1%) |
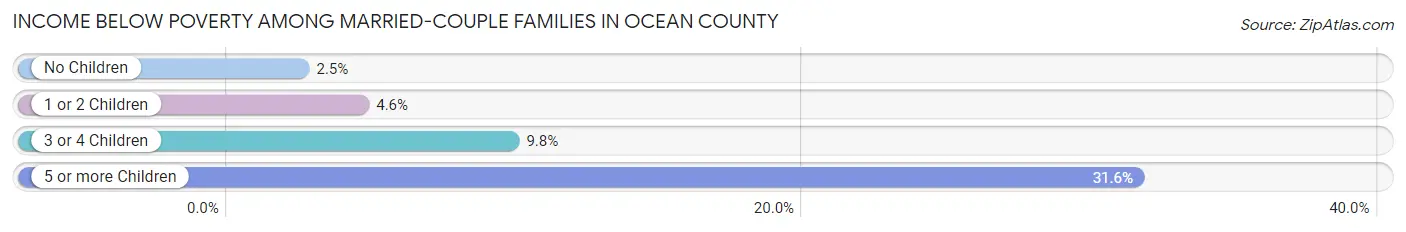
Income Below Poverty Among Married-Couple Families in Ocean County
The poverty statistics for married-couple families in Ocean County show that 5.2% or 6,533 of the total 126,346 families live below the poverty line. Families with 5 or more children have the highest poverty rate of 31.6%, comprising of 2,095 families. On the other hand, families with no children have the lowest poverty rate of 2.5%, which includes 1,881 families.
| Children | Above Poverty | Below Poverty |
| No Children | 73,571 (97.5%) | 1,881 (2.5%) |
| 1 or 2 Children | 32,497 (95.4%) | 1,557 (4.6%) |
| 3 or 4 Children | 9,204 (90.2%) | 1,000 (9.8%) |
| 5 or more Children | 4,541 (68.4%) | 2,095 (31.6%) |
| Total | 119,813 (94.8%) | 6,533 (5.2%) |
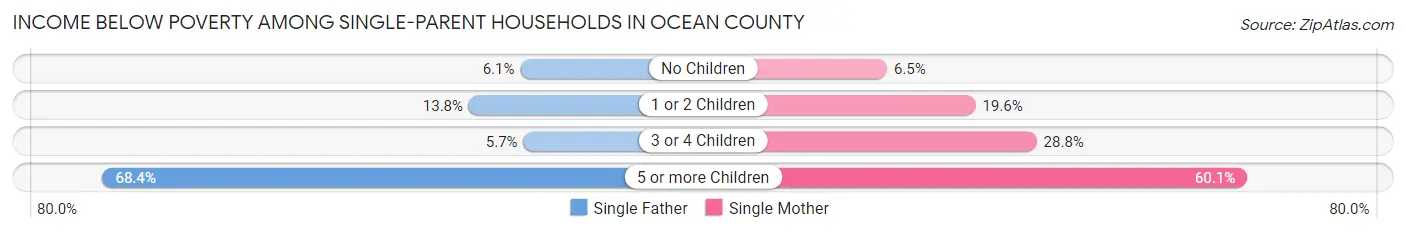
Income Below Poverty Among Single-Parent Households in Ocean County
According to the poverty data in Ocean County, 10.1% or 925 single-father households and 13.3% or 3,051 single-mother households are living below the poverty line. Among single-father households, those with 5 or more children have the highest poverty rate, with 80 households (68.4%) experiencing poverty. Likewise, among single-mother households, those with 5 or more children have the highest poverty rate, with 101 households (60.1%) falling below the poverty line.
| Children | Single Father | Single Mother |
| No Children | 286 (6.1%) | 817 (6.5%) |
| 1 or 2 Children | 531 (13.8%) | 1,691 (19.6%) |
| 3 or 4 Children | 28 (5.7%) | 442 (28.8%) |
| 5 or more Children | 80 (68.4%) | 101 (60.1%) |
| Total | 925 (10.1%) | 3,051 (13.3%) |
Income Below Poverty Among Married-Couple vs Single-Parent Households in Ocean County
The poverty data for Ocean County shows that 6,533 of the married-couple family households (5.2%) and 3,976 of the single-parent households (12.4%) are living below the poverty level. Within the married-couple family households, those with 5 or more children have the highest poverty rate, with 2,095 households (31.6%) falling below the poverty line. Among the single-parent households, those with 5 or more children have the highest poverty rate, with 181 household (63.5%) living below poverty.
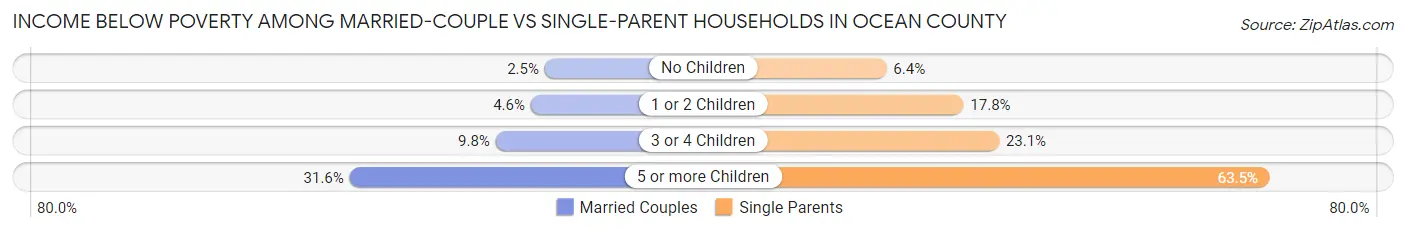
| Children | Married-Couple Families | Single-Parent Households |
| No Children | 1,881 (2.5%) | 1,103 (6.4%) |
| 1 or 2 Children | 1,557 (4.6%) | 2,222 (17.8%) |
| 3 or 4 Children | 1,000 (9.8%) | 470 (23.1%) |
| 5 or more Children | 2,095 (31.6%) | 181 (63.5%) |
| Total | 6,533 (5.2%) | 3,976 (12.4%) |
Employment Characteristics in Ocean County
Employment by Class of Employer in Ocean County
Among the 269,436 employed individuals in Ocean County, private company employees (175,916 | 65.3%), local government employees (28,700 | 10.6%), and not-for-profit organizations (21,967 | 8.2%) make up the most common classes of employment.
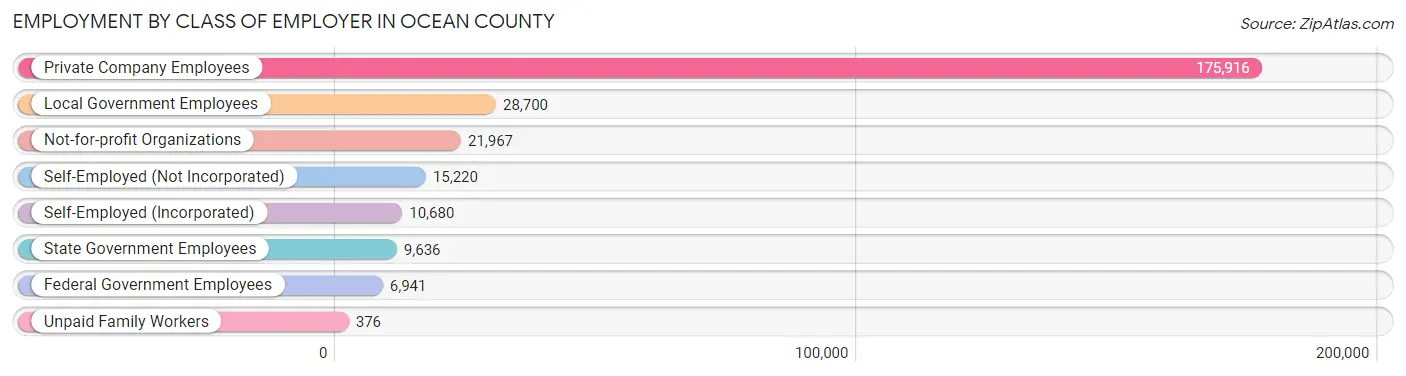
| Employer Class | # Employees | % Employees |
| Private Company Employees | 175,916 | 65.3% |
| Self-Employed (Incorporated) | 10,680 | 4.0% |
| Self-Employed (Not Incorporated) | 15,220 | 5.7% |
| Not-for-profit Organizations | 21,967 | 8.2% |
| Local Government Employees | 28,700 | 10.6% |
| State Government Employees | 9,636 | 3.6% |
| Federal Government Employees | 6,941 | 2.6% |
| Unpaid Family Workers | 376 | 0.1% |
| Total | 269,436 | 100.0% |
Employment Status by Age in Ocean County
According to the labor force statistics for Ocean County, out of the total population over 16 years of age (499,060), 58.9% or 293,946 individuals are in the labor force, with 5.7% or 16,755 of them unemployed. The age group with the highest labor force participation rate is 45 to 54 years, with 85.0% or 59,452 individuals in the labor force. Within the labor force, the 16 to 19 years age range has the highest percentage of unemployed individuals, with 12.7% or 1,451 of them being unemployed.
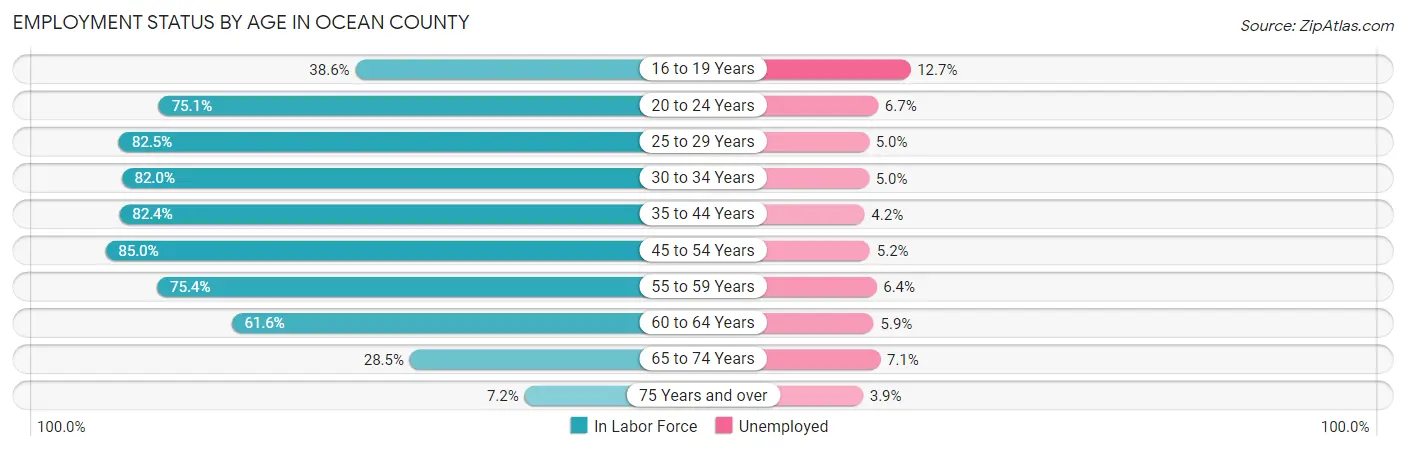
| Age Bracket | In Labor Force | Unemployed |
| 16 to 19 Years | 11,429 (38.6%) | 1,451 (12.7%) |
| 20 to 24 Years | 26,244 (75.1%) | 1,758 (6.7%) |
| 25 to 29 Years | 29,660 (82.5%) | 1,483 (5.0%) |
| 30 to 34 Years | 27,741 (82.0%) | 1,387 (5.0%) |
| 35 to 44 Years | 53,725 (82.4%) | 2,256 (4.2%) |
| 45 to 54 Years | 59,452 (85.0%) | 3,092 (5.2%) |
| 55 to 59 Years | 31,127 (75.4%) | 1,992 (6.4%) |
| 60 to 64 Years | 27,658 (61.6%) | 1,632 (5.9%) |
| 65 to 74 Years | 22,019 (28.5%) | 1,563 (7.1%) |
| 75 Years and over | 4,762 (7.2%) | 186 (3.9%) |
| Total | 293,946 (58.9%) | 16,755 (5.7%) |
Employment Status by Educational Attainment in Ocean County
According to labor force statistics for Ocean County, 78.8% of individuals (229,392) out of the total population between 25 and 64 years of age (291,106) are in the labor force, with 5.2% or 11,928 of them being unemployed. The group with the highest labor force participation rate are those with the educational attainment of bachelor's degree or higher, with 84.7% or 88,680 individuals in the labor force. Within the labor force, individuals with less than high school education have the highest percentage of unemployment, with 7.1% or 766 of them being unemployed.
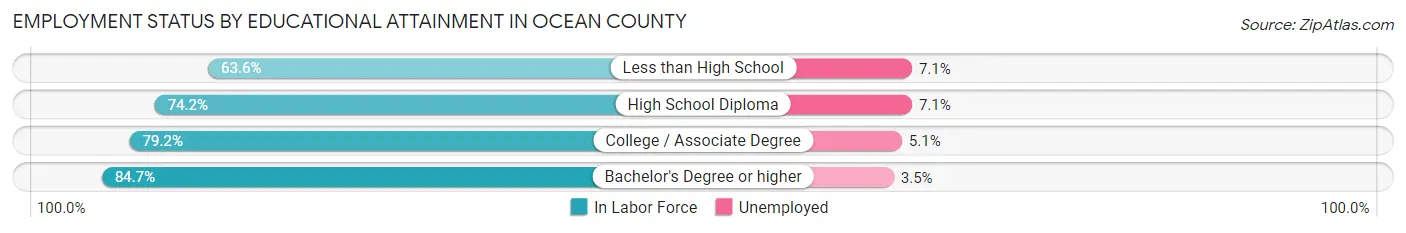
| Educational Attainment | In Labor Force | Unemployed |
| Less than High School | 10,782 (63.6%) | 1,204 (7.1%) |
| High School Diploma | 65,335 (74.2%) | 6,252 (7.1%) |
| College / Associate Degree | 64,470 (79.2%) | 4,151 (5.1%) |
| Bachelor's Degree or higher | 88,680 (84.7%) | 3,664 (3.5%) |
| Total | 229,392 (78.8%) | 15,138 (5.2%) |
Employment Occupations by Sex in Ocean County
Management, Business, Science and Arts Occupations
The most common Management, Business, Science and Arts occupations in Ocean County are Community & Social Service (38,523 | 13.9%), Management (29,757 | 10.8%), Education Instruction & Library (26,227 | 9.5%), Health Diagnosing & Treating (18,220 | 6.6%), and Business & Financial (14,673 | 5.3%).
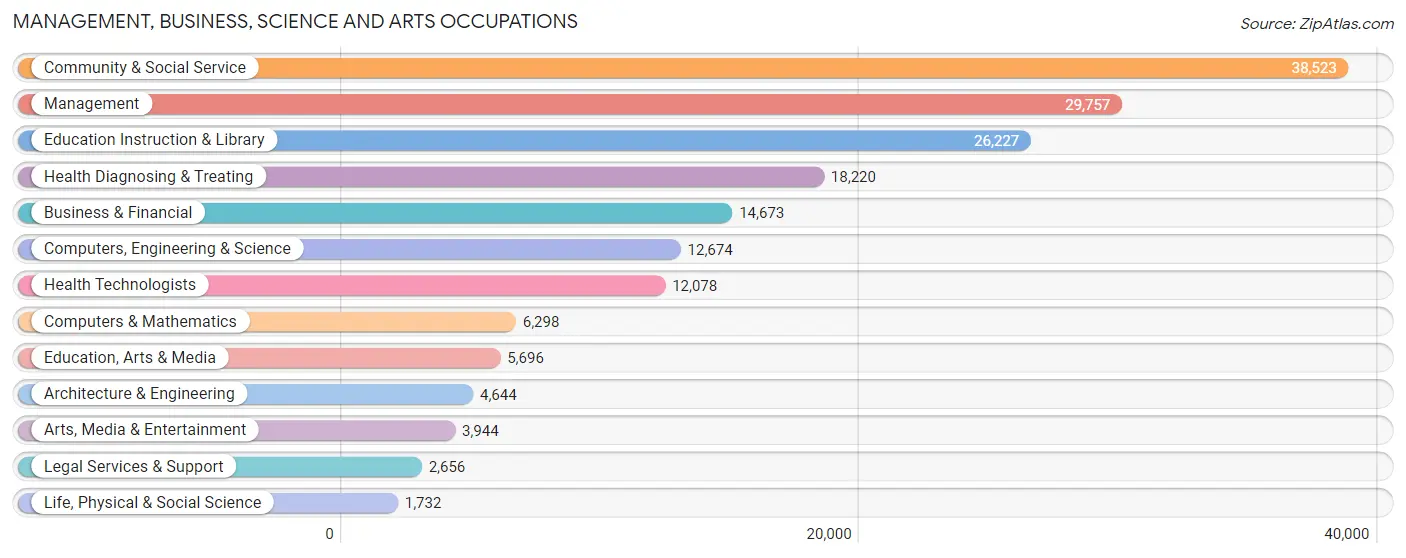
Management, Business, Science and Arts Occupations by Sex
Within the Management, Business, Science and Arts occupations in Ocean County, the most male-oriented occupations are Architecture & Engineering (87.0%), Computers & Mathematics (79.8%), and Computers, Engineering & Science (78.5%), while the most female-oriented occupations are Health Technologists (77.3%), Health Diagnosing & Treating (77.1%), and Education Instruction & Library (70.8%).

| Occupation | Male | Female |
| Management | 18,420 (61.9%) | 11,337 (38.1%) |
| Business & Financial | 7,165 (48.8%) | 7,508 (51.2%) |
| Computers, Engineering & Science | 9,944 (78.5%) | 2,730 (21.5%) |
| Computers & Mathematics | 5,029 (79.8%) | 1,269 (20.2%) |
| Architecture & Engineering | 4,040 (87.0%) | 604 (13.0%) |
| Life, Physical & Social Science | 875 (50.5%) | 857 (49.5%) |
| Community & Social Service | 12,428 (32.3%) | 26,095 (67.7%) |
| Education, Arts & Media | 1,950 (34.2%) | 3,746 (65.8%) |
| Legal Services & Support | 1,310 (49.3%) | 1,346 (50.7%) |
| Education Instruction & Library | 7,652 (29.2%) | 18,575 (70.8%) |
| Arts, Media & Entertainment | 1,516 (38.4%) | 2,428 (61.6%) |
| Health Diagnosing & Treating | 4,170 (22.9%) | 14,050 (77.1%) |
| Health Technologists | 2,742 (22.7%) | 9,336 (77.3%) |
| Total (Category) | 52,127 (45.8%) | 61,720 (54.2%) |
| Total (Overall) | 141,532 (51.2%) | 134,855 (48.8%) |
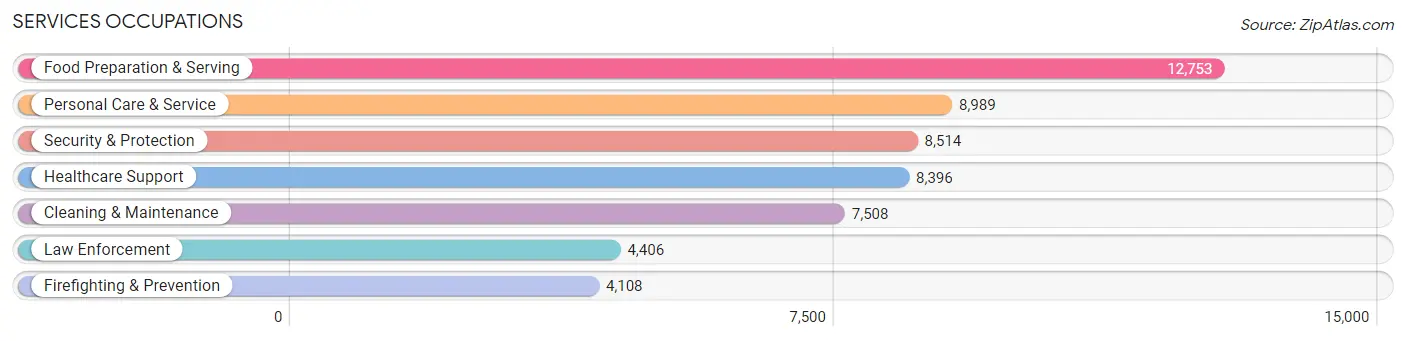
Services Occupations
The most common Services occupations in Ocean County are Food Preparation & Serving (12,753 | 4.6%), Personal Care & Service (8,989 | 3.3%), Security & Protection (8,514 | 3.1%), Healthcare Support (8,396 | 3.0%), and Cleaning & Maintenance (7,508 | 2.7%).
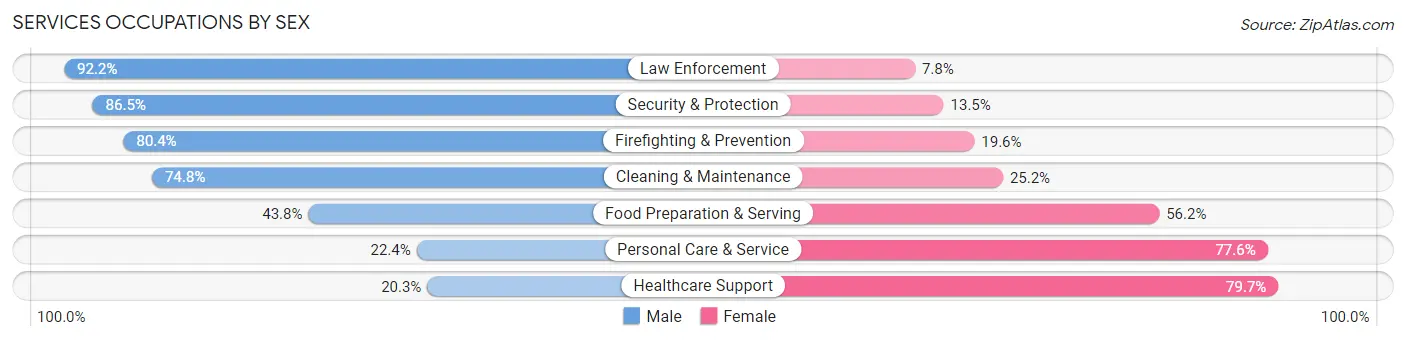
Services Occupations by Sex
Within the Services occupations in Ocean County, the most male-oriented occupations are Law Enforcement (92.2%), Security & Protection (86.5%), and Firefighting & Prevention (80.4%), while the most female-oriented occupations are Healthcare Support (79.7%), Personal Care & Service (77.6%), and Food Preparation & Serving (56.2%).
| Occupation | Male | Female |
| Healthcare Support | 1,703 (20.3%) | 6,693 (79.7%) |
| Security & Protection | 7,366 (86.5%) | 1,148 (13.5%) |
| Firefighting & Prevention | 3,304 (80.4%) | 804 (19.6%) |
| Law Enforcement | 4,062 (92.2%) | 344 (7.8%) |
| Food Preparation & Serving | 5,589 (43.8%) | 7,164 (56.2%) |
| Cleaning & Maintenance | 5,614 (74.8%) | 1,894 (25.2%) |
| Personal Care & Service | 2,013 (22.4%) | 6,976 (77.6%) |
| Total (Category) | 22,285 (48.3%) | 23,875 (51.7%) |
| Total (Overall) | 141,532 (51.2%) | 134,855 (48.8%) |
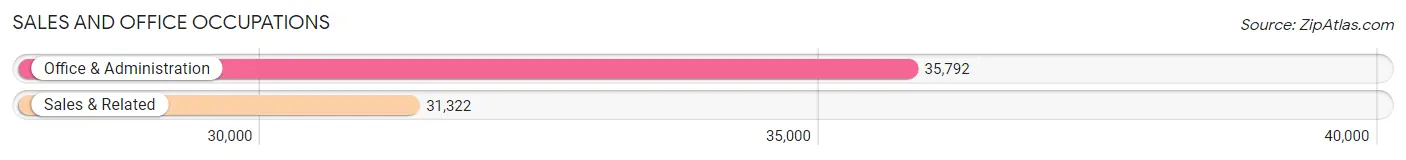
Sales and Office Occupations
The most common Sales and Office occupations in Ocean County are Office & Administration (35,792 | 13.0%), and Sales & Related (31,322 | 11.3%).
Sales and Office Occupations by Sex
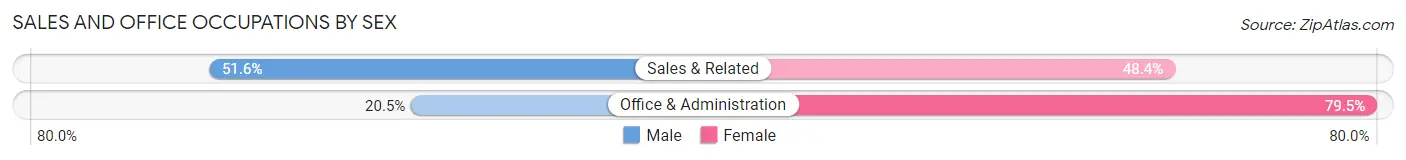
| Occupation | Male | Female |
| Sales & Related | 16,173 (51.6%) | 15,149 (48.4%) |
| Office & Administration | 7,348 (20.5%) | 28,444 (79.5%) |
| Total (Category) | 23,521 (35.0%) | 43,593 (64.9%) |
| Total (Overall) | 141,532 (51.2%) | 134,855 (48.8%) |
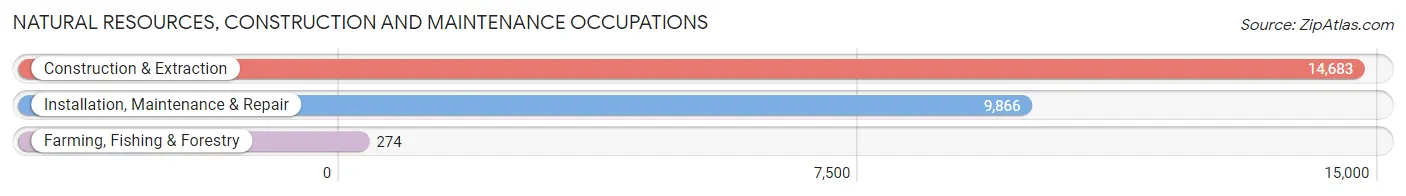
Natural Resources, Construction and Maintenance Occupations
The most common Natural Resources, Construction and Maintenance occupations in Ocean County are Construction & Extraction (14,683 | 5.3%), Installation, Maintenance & Repair (9,866 | 3.6%), and Farming, Fishing & Forestry (274 | 0.1%).
Natural Resources, Construction and Maintenance Occupations by Sex
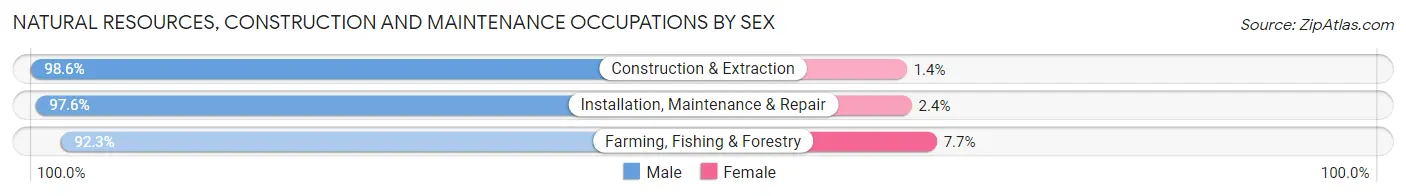
| Occupation | Male | Female |
| Farming, Fishing & Forestry | 253 (92.3%) | 21 (7.7%) |
| Construction & Extraction | 14,476 (98.6%) | 207 (1.4%) |
| Installation, Maintenance & Repair | 9,625 (97.6%) | 241 (2.4%) |
| Total (Category) | 24,354 (98.1%) | 469 (1.9%) |
| Total (Overall) | 141,532 (51.2%) | 134,855 (48.8%) |
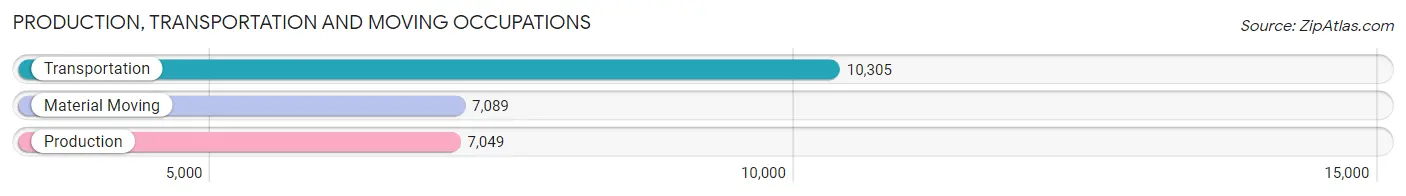
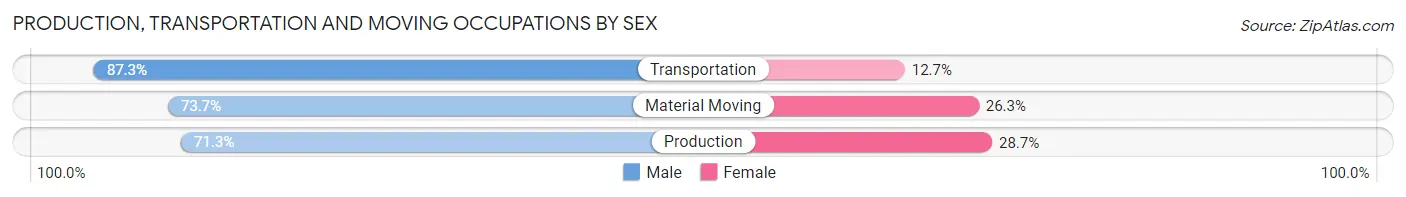
Production, Transportation and Moving Occupations
The most common Production, Transportation and Moving occupations in Ocean County are Transportation (10,305 | 3.7%), Material Moving (7,089 | 2.6%), and Production (7,049 | 2.5%).
Production, Transportation and Moving Occupations by Sex
| Occupation | Male | Female |
| Production | 5,025 (71.3%) | 2,024 (28.7%) |
| Transportation | 8,995 (87.3%) | 1,310 (12.7%) |
| Material Moving | 5,225 (73.7%) | 1,864 (26.3%) |
| Total (Category) | 19,245 (78.7%) | 5,198 (21.3%) |
| Total (Overall) | 141,532 (51.2%) | 134,855 (48.8%) |
Employment Industries by Sex in Ocean County
Employment Industries in Ocean County
The major employment industries in Ocean County include Health Care & Social Assistance (43,617 | 15.8%), Retail Trade (36,018 | 13.0%), Educational Services (35,414 | 12.8%), Construction (21,878 | 7.9%), and Professional & Scientific (19,472 | 7.0%).

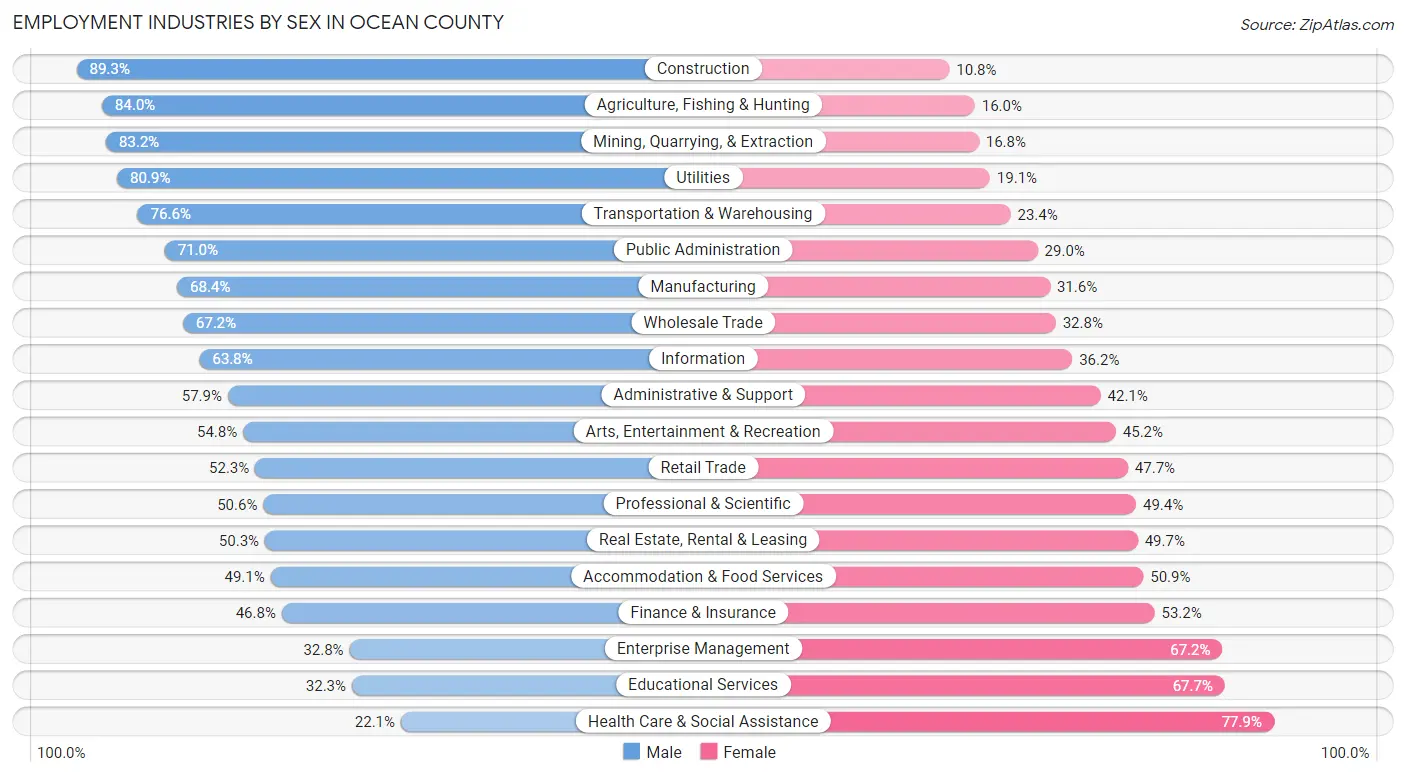
Employment Industries by Sex in Ocean County
The Ocean County industries that see more men than women are Construction (89.2%), Agriculture, Fishing & Hunting (84.0%), and Mining, Quarrying, & Extraction (83.2%), whereas the industries that tend to have a higher number of women are Health Care & Social Assistance (77.9%), Educational Services (67.7%), and Enterprise Management (67.2%).
| Industry | Male | Female |
| Agriculture, Fishing & Hunting | 593 (84.0%) | 113 (16.0%) |
| Mining, Quarrying, & Extraction | 79 (83.2%) | 16 (16.8%) |
| Construction | 19,526 (89.2%) | 2,352 (10.7%) |
| Manufacturing | 9,144 (68.4%) | 4,221 (31.6%) |
| Wholesale Trade | 4,769 (67.2%) | 2,325 (32.8%) |
| Retail Trade | 18,835 (52.3%) | 17,183 (47.7%) |
| Transportation & Warehousing | 9,474 (76.6%) | 2,895 (23.4%) |
| Utilities | 2,936 (80.9%) | 695 (19.1%) |
| Information | 3,149 (63.8%) | 1,785 (36.2%) |
| Finance & Insurance | 5,824 (46.8%) | 6,625 (53.2%) |
| Real Estate, Rental & Leasing | 2,836 (50.3%) | 2,807 (49.7%) |
| Professional & Scientific | 9,854 (50.6%) | 9,618 (49.4%) |
| Enterprise Management | 76 (32.8%) | 156 (67.2%) |
| Administrative & Support | 5,668 (57.9%) | 4,115 (42.1%) |
| Educational Services | 11,424 (32.3%) | 23,990 (67.7%) |
| Health Care & Social Assistance | 9,650 (22.1%) | 33,967 (77.9%) |
| Arts, Entertainment & Recreation | 3,772 (54.8%) | 3,112 (45.2%) |
| Accommodation & Food Services | 7,579 (49.1%) | 7,856 (50.9%) |
| Public Administration | 10,755 (71.0%) | 4,400 (29.0%) |
| Total | 141,532 (51.2%) | 134,855 (48.8%) |
Education in Ocean County
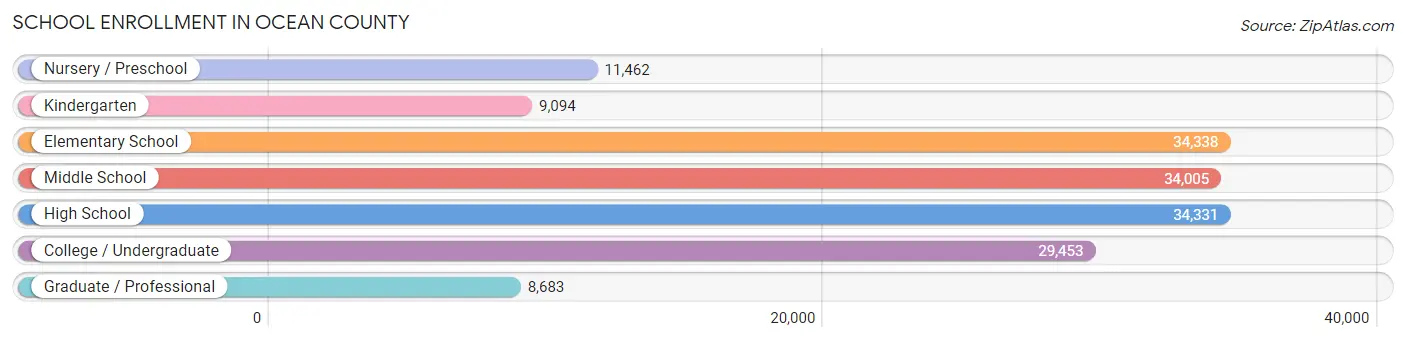
School Enrollment in Ocean County
The most common levels of schooling among the 161,366 students in Ocean County are elementary school (34,338 | 21.3%), high school (34,331 | 21.3%), and middle school (34,005 | 21.1%).
| School Level | # Students | % Students |
| Nursery / Preschool | 11,462 | 7.1% |
| Kindergarten | 9,094 | 5.6% |
| Elementary School | 34,338 | 21.3% |
| Middle School | 34,005 | 21.1% |
| High School | 34,331 | 21.3% |
| College / Undergraduate | 29,453 | 18.2% |
| Graduate / Professional | 8,683 | 5.4% |
| Total | 161,366 | 100.0% |
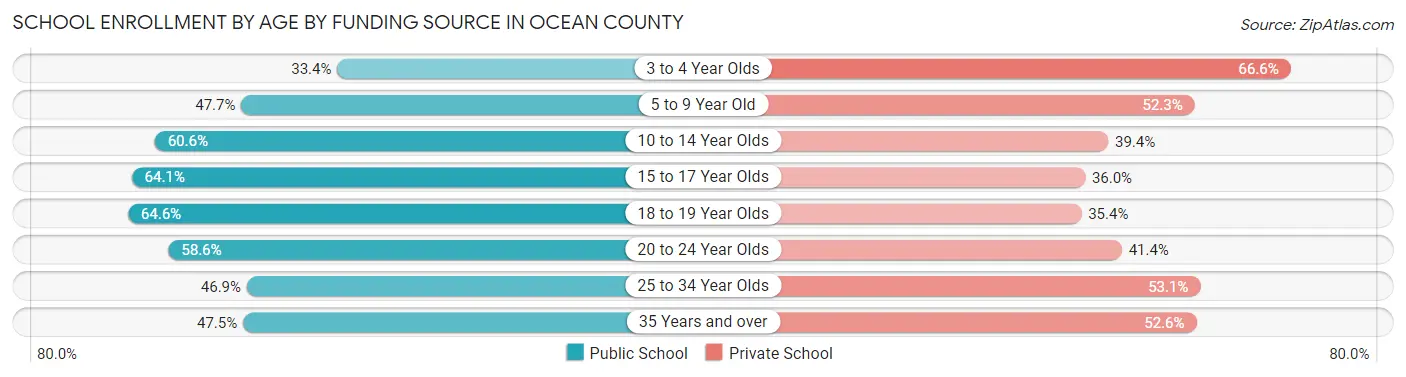
School Enrollment by Age by Funding Source in Ocean County
Out of a total of 161,366 students who are enrolled in schools in Ocean County, 73,260 (45.4%) attend a private institution, while the remaining 88,106 (54.6%) are enrolled in public schools. The age group of 3 to 4 year olds has the highest likelihood of being enrolled in private schools, with 7,150 (66.6% in the age bracket) enrolled. Conversely, the age group of 18 to 19 year olds has the lowest likelihood of being enrolled in a private school, with 6,720 (64.6% in the age bracket) attending a public institution.
| Age Bracket | Public School | Private School |
| 3 to 4 Year Olds | 3,588 (33.4%) | 7,150 (66.6%) |
| 5 to 9 Year Old | 19,301 (47.7%) | 21,158 (52.3%) |
| 10 to 14 Year Olds | 25,862 (60.6%) | 16,815 (39.4%) |
| 15 to 17 Year Olds | 15,730 (64.0%) | 8,829 (35.9%) |
| 18 to 19 Year Olds | 6,720 (64.6%) | 3,683 (35.4%) |
| 20 to 24 Year Olds | 8,166 (58.6%) | 5,777 (41.4%) |
| 25 to 34 Year Olds | 5,120 (46.9%) | 5,802 (53.1%) |
| 35 Years and over | 3,637 (47.4%) | 4,028 (52.5%) |
| Total | 88,106 (54.6%) | 73,260 (45.4%) |
Educational Attainment by Field of Study in Ocean County
Business (29,026 | 18.9%), education (26,154 | 17.1%), science & technology (15,161 | 9.9%), liberal arts & history (12,166 | 7.9%), and psychology (9,918 | 6.5%) are the most common fields of study among 153,255 individuals in Ocean County who have obtained a bachelor's degree or higher.
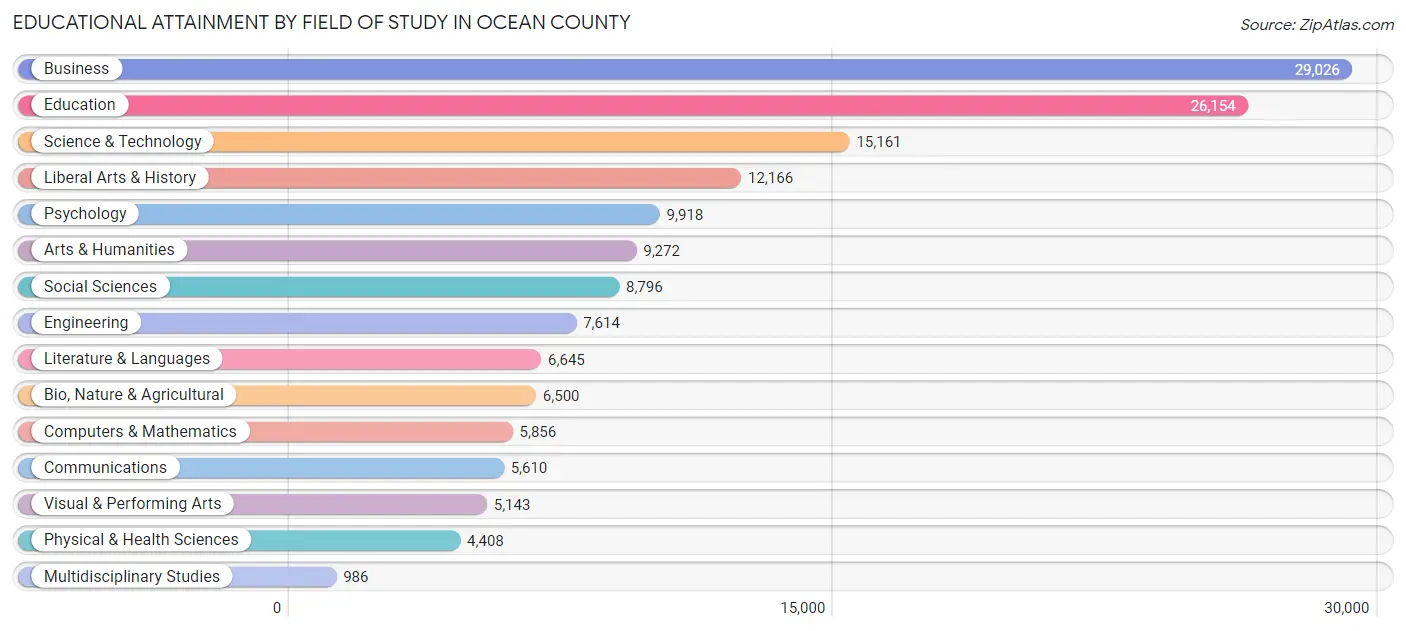
| Field of Study | # Graduates | % Graduates |
| Computers & Mathematics | 5,856 | 3.8% |
| Bio, Nature & Agricultural | 6,500 | 4.2% |
| Physical & Health Sciences | 4,408 | 2.9% |
| Psychology | 9,918 | 6.5% |
| Social Sciences | 8,796 | 5.7% |
| Engineering | 7,614 | 5.0% |
| Multidisciplinary Studies | 986 | 0.6% |
| Science & Technology | 15,161 | 9.9% |
| Business | 29,026 | 18.9% |
| Education | 26,154 | 17.1% |
| Literature & Languages | 6,645 | 4.3% |
| Liberal Arts & History | 12,166 | 7.9% |
| Visual & Performing Arts | 5,143 | 3.4% |
| Communications | 5,610 | 3.7% |
| Arts & Humanities | 9,272 | 6.0% |
| Total | 153,255 | 100.0% |
Transportation & Commute in Ocean County
Vehicle Availability by Sex in Ocean County
The most prevalent vehicle ownership categories in Ocean County are males with 2 vehicles (60,681, accounting for 43.6%) and females with 2 vehicles (55,506, making up 46.7%).
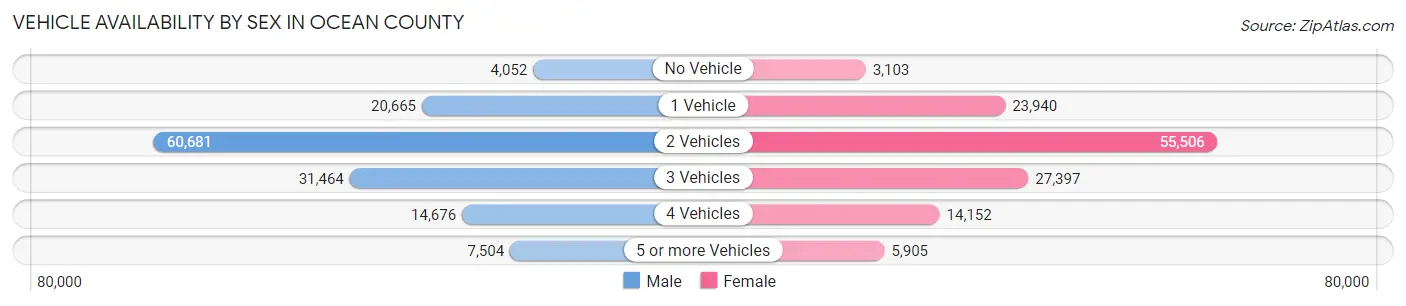
| Vehicles Available | Male | Female |
| No Vehicle | 4,052 (2.9%) | 3,103 (2.4%) |
| 1 Vehicle | 20,665 (14.9%) | 23,940 (18.4%) |
| 2 Vehicles | 60,681 (43.6%) | 55,506 (42.7%) |
| 3 Vehicles | 31,464 (22.6%) | 27,397 (21.1%) |
| 4 Vehicles | 14,676 (10.6%) | 14,152 (10.9%) |
| 5 or more Vehicles | 7,504 (5.4%) | 5,905 (4.5%) |
| Total | 139,042 (100.0%) | 130,003 (100.0%) |
Commute Time in Ocean County
The most frequently occuring commute durations in Ocean County are 15 to 19 minutes (33,582 commuters, 13.8%), 10 to 14 minutes (31,264 commuters, 12.9%), and 20 to 24 minutes (29,983 commuters, 12.4%).
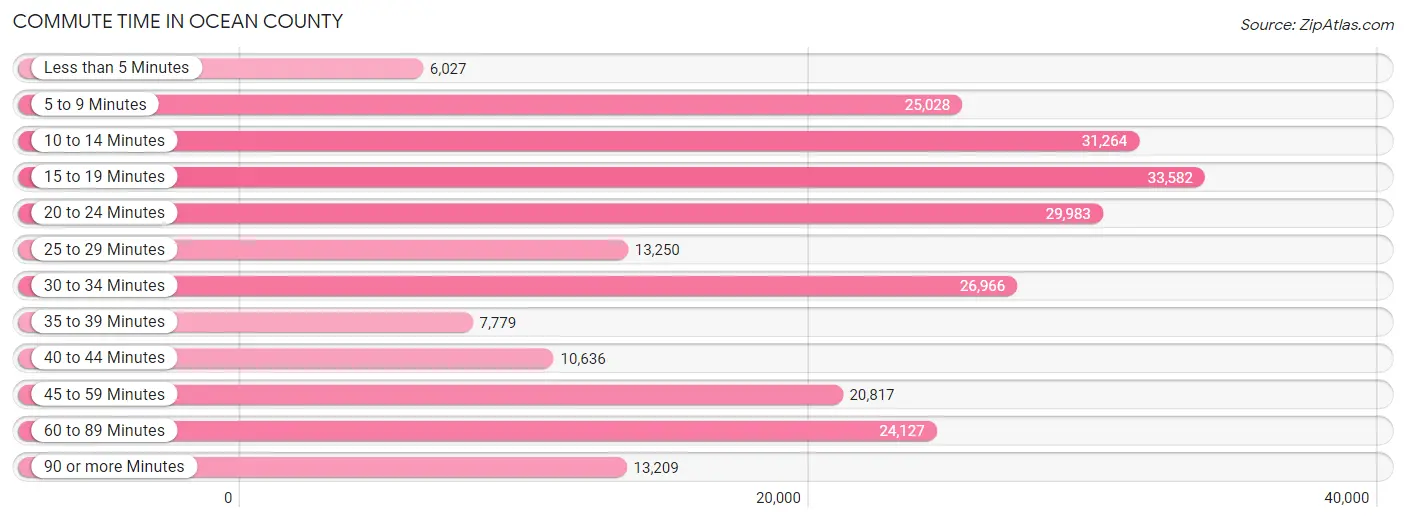
| Commute Time | # Commuters | % Commuters |
| Less than 5 Minutes | 6,027 | 2.5% |
| 5 to 9 Minutes | 25,028 | 10.3% |
| 10 to 14 Minutes | 31,264 | 12.9% |
| 15 to 19 Minutes | 33,582 | 13.8% |
| 20 to 24 Minutes | 29,983 | 12.4% |
| 25 to 29 Minutes | 13,250 | 5.5% |
| 30 to 34 Minutes | 26,966 | 11.1% |
| 35 to 39 Minutes | 7,779 | 3.2% |
| 40 to 44 Minutes | 10,636 | 4.4% |
| 45 to 59 Minutes | 20,817 | 8.6% |
| 60 to 89 Minutes | 24,127 | 9.9% |
| 90 or more Minutes | 13,209 | 5.4% |
Commute Time by Sex in Ocean County
The most common commute times in Ocean County are 60 to 89 minutes (16,832 commuters, 13.2%) for males and 15 to 19 minutes (17,258 commuters, 14.9%) for females.
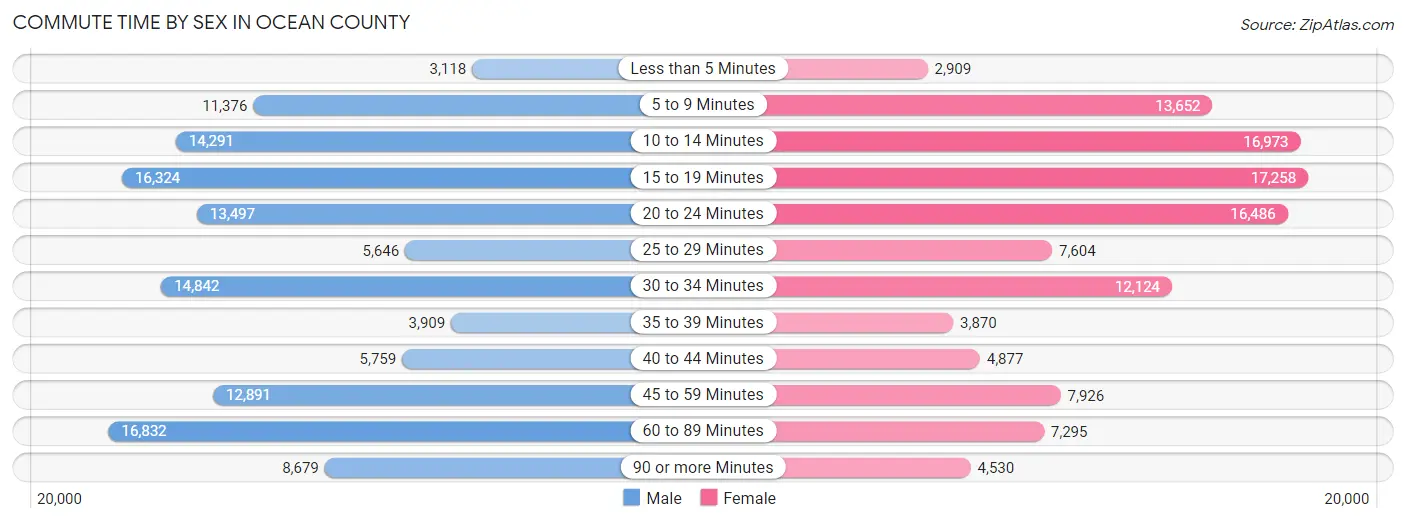
| Commute Time | Male | Female |
| Less than 5 Minutes | 3,118 (2.5%) | 2,909 (2.5%) |
| 5 to 9 Minutes | 11,376 (8.9%) | 13,652 (11.8%) |
| 10 to 14 Minutes | 14,291 (11.2%) | 16,973 (14.7%) |
| 15 to 19 Minutes | 16,324 (12.8%) | 17,258 (14.9%) |
| 20 to 24 Minutes | 13,497 (10.6%) | 16,486 (14.3%) |
| 25 to 29 Minutes | 5,646 (4.4%) | 7,604 (6.6%) |
| 30 to 34 Minutes | 14,842 (11.7%) | 12,124 (10.5%) |
| 35 to 39 Minutes | 3,909 (3.1%) | 3,870 (3.4%) |
| 40 to 44 Minutes | 5,759 (4.5%) | 4,877 (4.2%) |
| 45 to 59 Minutes | 12,891 (10.1%) | 7,926 (6.9%) |
| 60 to 89 Minutes | 16,832 (13.2%) | 7,295 (6.3%) |
| 90 or more Minutes | 8,679 (6.8%) | 4,530 (3.9%) |
Time of Departure to Work by Sex in Ocean County
The most frequent times of departure to work in Ocean County are 7:00 AM to 7:29 AM (17,112, 13.5%) for males and 8:00 AM to 8:29 AM (14,751, 12.8%) for females.
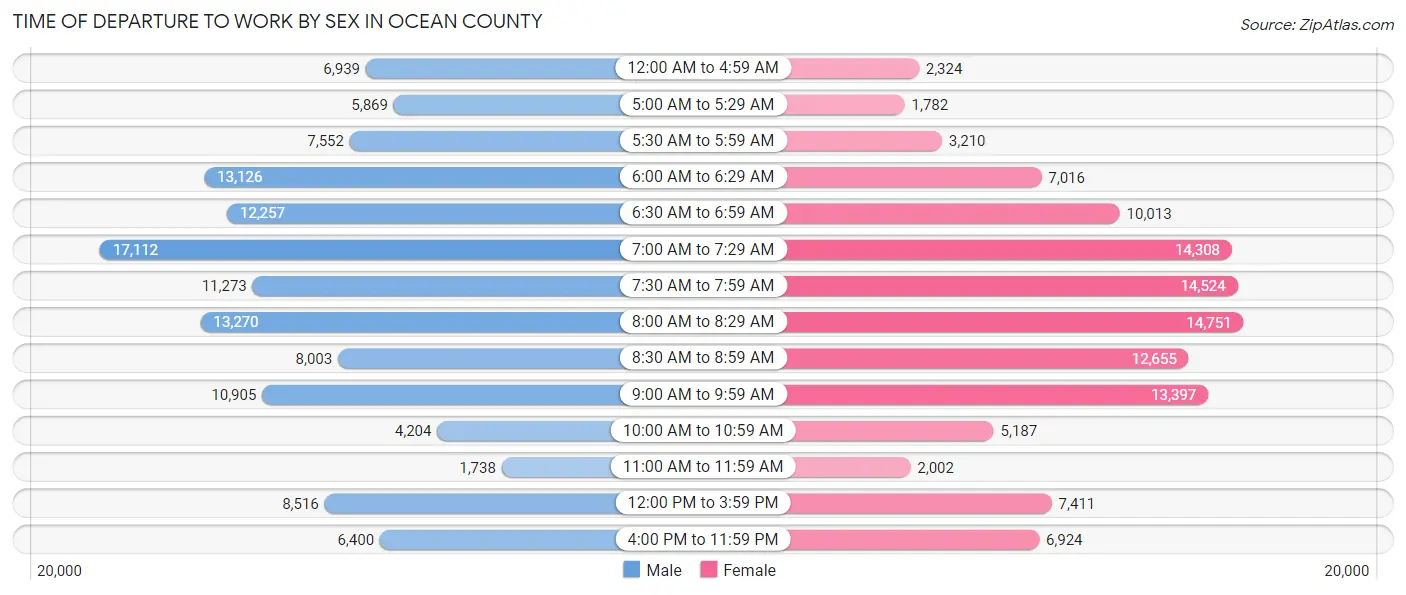
| Time of Departure | Male | Female |
| 12:00 AM to 4:59 AM | 6,939 (5.5%) | 2,324 (2.0%) |
| 5:00 AM to 5:29 AM | 5,869 (4.6%) | 1,782 (1.5%) |
| 5:30 AM to 5:59 AM | 7,552 (5.9%) | 3,210 (2.8%) |
| 6:00 AM to 6:29 AM | 13,126 (10.3%) | 7,016 (6.1%) |
| 6:30 AM to 6:59 AM | 12,257 (9.6%) | 10,013 (8.7%) |
| 7:00 AM to 7:29 AM | 17,112 (13.5%) | 14,308 (12.4%) |
| 7:30 AM to 7:59 AM | 11,273 (8.9%) | 14,524 (12.6%) |
| 8:00 AM to 8:29 AM | 13,270 (10.4%) | 14,751 (12.8%) |
| 8:30 AM to 8:59 AM | 8,003 (6.3%) | 12,655 (11.0%) |
| 9:00 AM to 9:59 AM | 10,905 (8.6%) | 13,397 (11.6%) |
| 10:00 AM to 10:59 AM | 4,204 (3.3%) | 5,187 (4.5%) |
| 11:00 AM to 11:59 AM | 1,738 (1.4%) | 2,002 (1.7%) |
| 12:00 PM to 3:59 PM | 8,516 (6.7%) | 7,411 (6.4%) |
| 4:00 PM to 11:59 PM | 6,400 (5.0%) | 6,924 (6.0%) |
| Total | 127,164 (100.0%) | 115,504 (100.0%) |
Housing Occupancy in Ocean County
Occupancy by Ownership in Ocean County
Of the total 239,466 dwellings in Ocean County, owner-occupied units account for 191,328 (79.9%), while renter-occupied units make up 48,138 (20.1%).
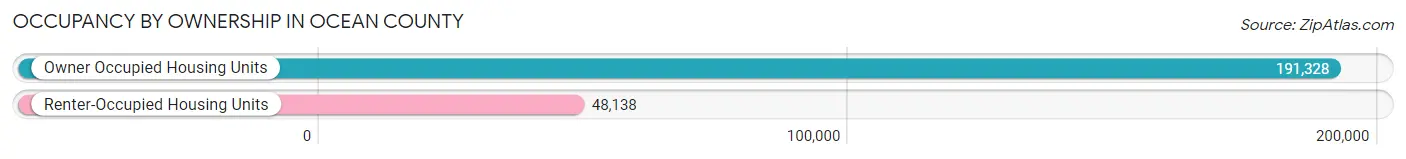
| Occupancy | # Housing Units | % Housing Units |
| Owner Occupied Housing Units | 191,328 | 79.9% |
| Renter-Occupied Housing Units | 48,138 | 20.1% |
| Total Occupied Housing Units | 239,466 | 100.0% |
Occupancy by Household Size in Ocean County
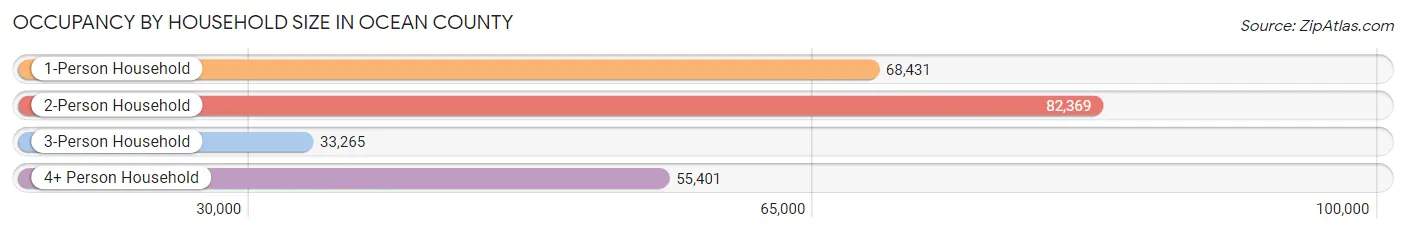
| Household Size | # Housing Units | % Housing Units |
| 1-Person Household | 68,431 | 28.6% |
| 2-Person Household | 82,369 | 34.4% |
| 3-Person Household | 33,265 | 13.9% |
| 4+ Person Household | 55,401 | 23.1% |
| Total Housing Units | 239,466 | 100.0% |
Occupancy by Ownership by Household Size in Ocean County
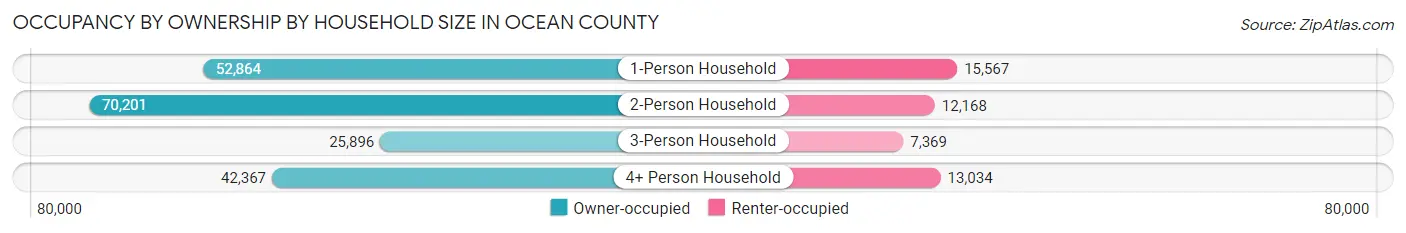
| Household Size | Owner-occupied | Renter-occupied |
| 1-Person Household | 52,864 (77.2%) | 15,567 (22.8%) |
| 2-Person Household | 70,201 (85.2%) | 12,168 (14.8%) |
| 3-Person Household | 25,896 (77.8%) | 7,369 (22.2%) |
| 4+ Person Household | 42,367 (76.5%) | 13,034 (23.5%) |
| Total Housing Units | 191,328 (79.9%) | 48,138 (20.1%) |
Occupancy by Educational Attainment in Ocean County
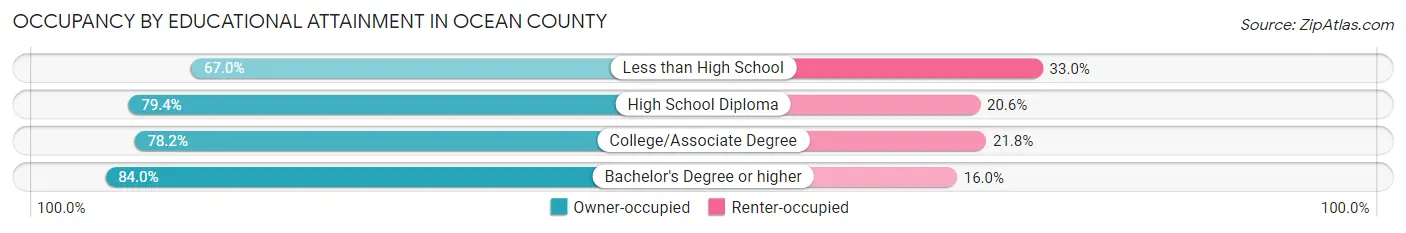
| Household Size | Owner-occupied | Renter-occupied |
| Less than High School | 9,895 (67.0%) | 4,876 (33.0%) |
| High School Diploma | 58,212 (79.4%) | 15,096 (20.6%) |
| College/Associate Degree | 53,420 (78.2%) | 14,885 (21.8%) |
| Bachelor's Degree or higher | 69,801 (84.0%) | 13,281 (16.0%) |
Occupancy by Age of Householder in Ocean County
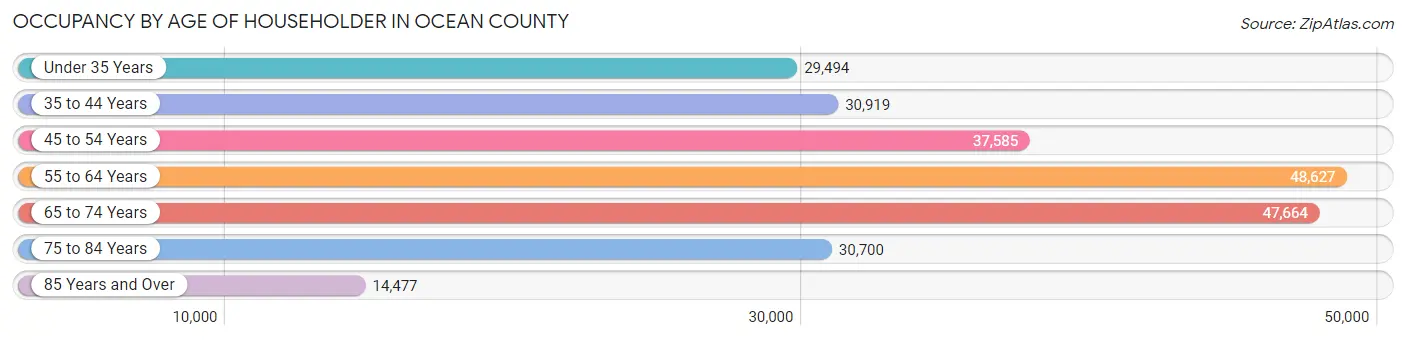
| Age Bracket | # Households | % Households |
| Under 35 Years | 29,494 | 12.3% |
| 35 to 44 Years | 30,919 | 12.9% |
| 45 to 54 Years | 37,585 | 15.7% |
| 55 to 64 Years | 48,627 | 20.3% |
| 65 to 74 Years | 47,664 | 19.9% |
| 75 to 84 Years | 30,700 | 12.8% |
| 85 Years and Over | 14,477 | 6.0% |
| Total | 239,466 | 100.0% |
Housing Finances in Ocean County
Median Income by Occupancy in Ocean County
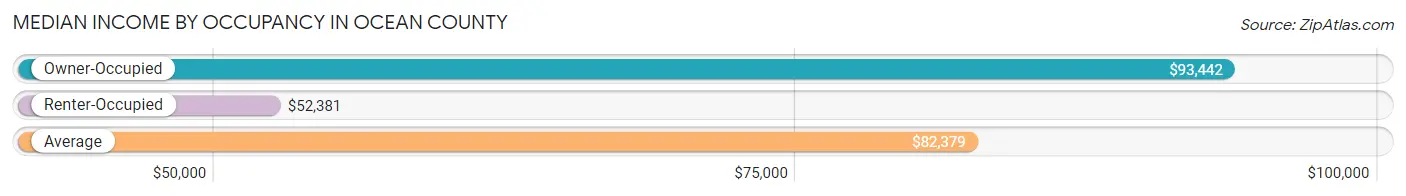
| Occupancy Type | # Households | Median Income |
| Owner-Occupied | 191,328 (79.9%) | $93,442 |
| Renter-Occupied | 48,138 (20.1%) | $52,381 |
| Average | 239,466 (100.0%) | $82,379 |
Occupancy by Householder Income Bracket in Ocean County
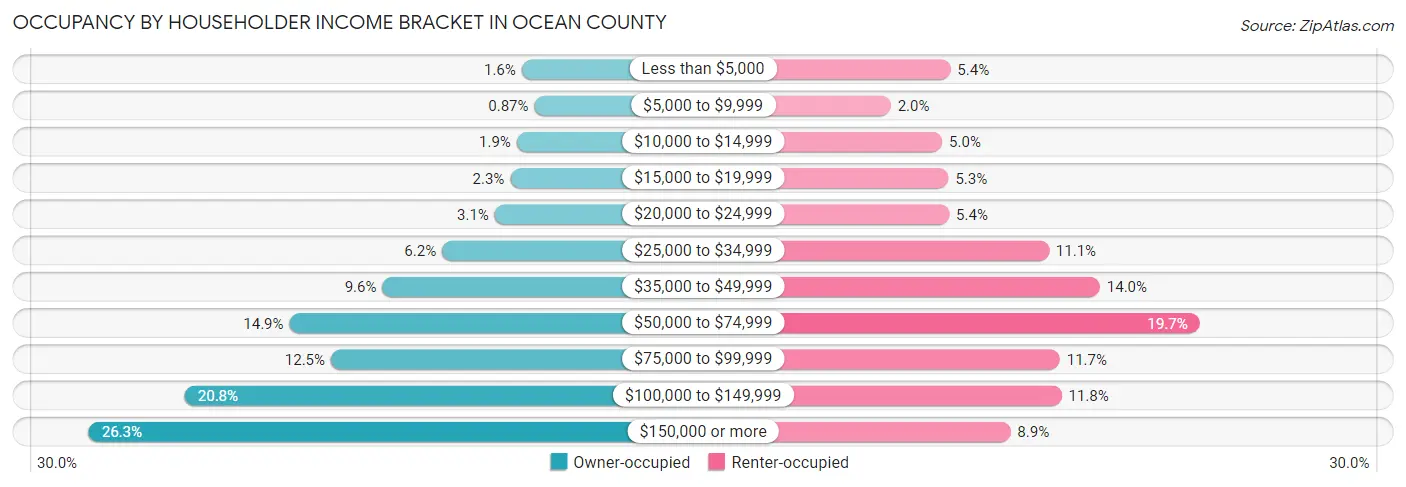
| Income Bracket | Owner-occupied | Renter-occupied |
| Less than $5,000 | 3,058 (1.6%) | 2,608 (5.4%) |
| $5,000 to $9,999 | 1,658 (0.9%) | 966 (2.0%) |
| $10,000 to $14,999 | 3,603 (1.9%) | 2,385 (5.0%) |
| $15,000 to $19,999 | 4,309 (2.2%) | 2,555 (5.3%) |
| $20,000 to $24,999 | 6,011 (3.1%) | 2,576 (5.3%) |
| $25,000 to $34,999 | 11,770 (6.1%) | 5,320 (11.1%) |
| $35,000 to $49,999 | 18,290 (9.6%) | 6,718 (14.0%) |
| $50,000 to $74,999 | 28,452 (14.9%) | 9,462 (19.7%) |
| $75,000 to $99,999 | 23,925 (12.5%) | 5,619 (11.7%) |
| $100,000 to $149,999 | 39,881 (20.8%) | 5,667 (11.8%) |
| $150,000 or more | 50,371 (26.3%) | 4,262 (8.8%) |
| Total | 191,328 (100.0%) | 48,138 (100.0%) |
Monthly Housing Cost Tiers in Ocean County
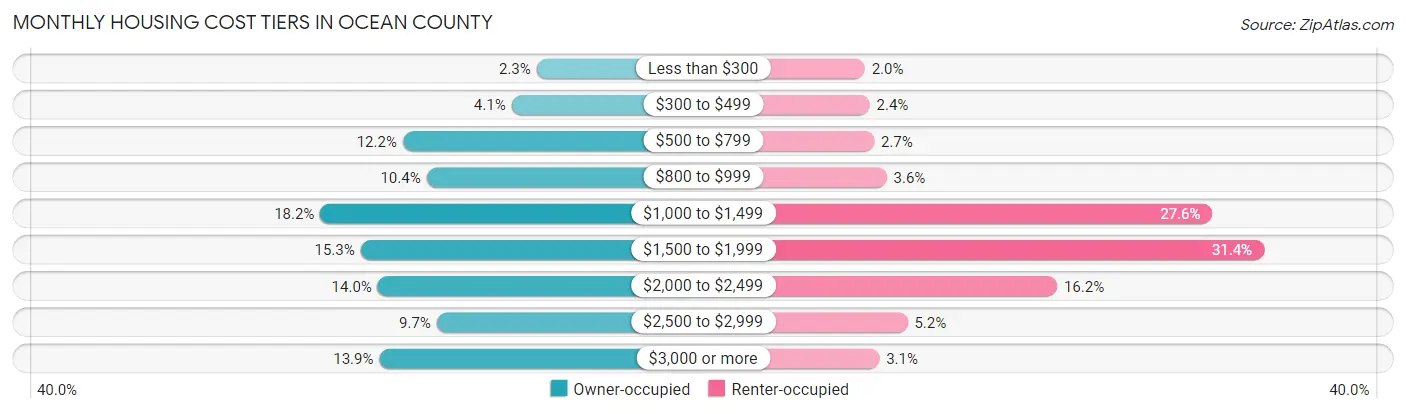
| Monthly Cost | Owner-occupied | Renter-occupied |
| Less than $300 | 4,378 (2.3%) | 968 (2.0%) |
| $300 to $499 | 7,924 (4.1%) | 1,141 (2.4%) |
| $500 to $799 | 23,242 (12.1%) | 1,295 (2.7%) |
| $800 to $999 | 19,894 (10.4%) | 1,741 (3.6%) |
| $1,000 to $1,499 | 34,883 (18.2%) | 13,293 (27.6%) |
| $1,500 to $1,999 | 29,198 (15.3%) | 15,119 (31.4%) |
| $2,000 to $2,499 | 26,786 (14.0%) | 7,782 (16.2%) |
| $2,500 to $2,999 | 18,458 (9.7%) | 2,484 (5.2%) |
| $3,000 or more | 26,565 (13.9%) | 1,483 (3.1%) |
| Total | 191,328 (100.0%) | 48,138 (100.0%) |
Physical Housing Characteristics in Ocean County
Housing Structures in Ocean County
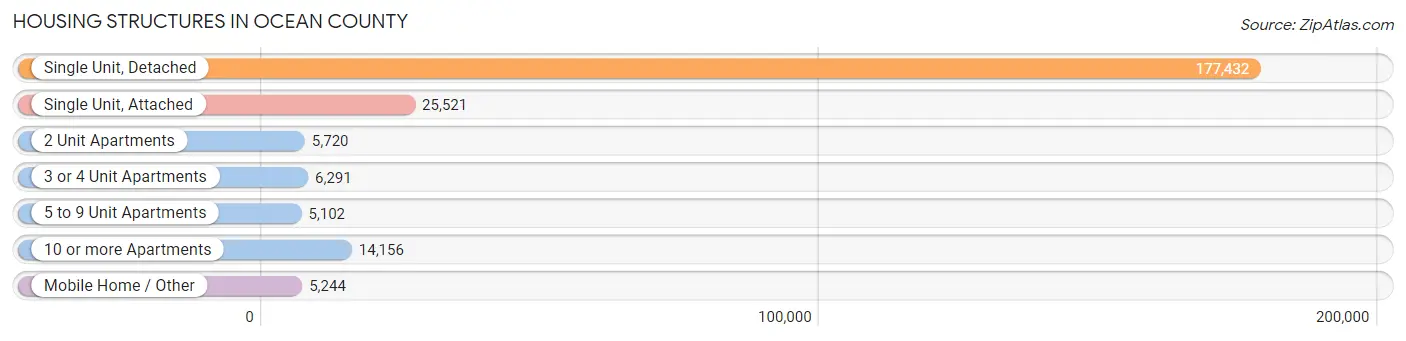
| Structure Type | # Housing Units | % Housing Units |
| Single Unit, Detached | 177,432 | 74.1% |
| Single Unit, Attached | 25,521 | 10.7% |
| 2 Unit Apartments | 5,720 | 2.4% |
| 3 or 4 Unit Apartments | 6,291 | 2.6% |
| 5 to 9 Unit Apartments | 5,102 | 2.1% |
| 10 or more Apartments | 14,156 | 5.9% |
| Mobile Home / Other | 5,244 | 2.2% |
| Total | 239,466 | 100.0% |
Housing Structures by Occupancy in Ocean County
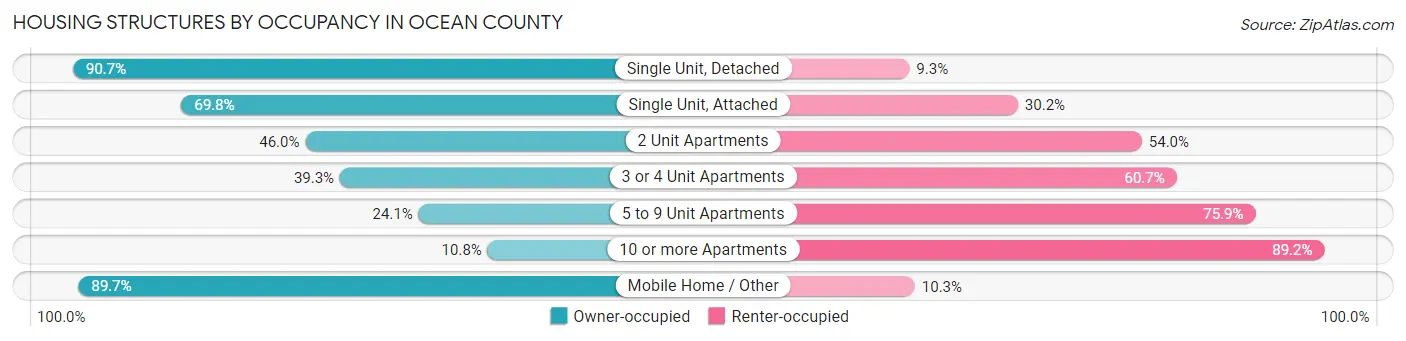
| Structure Type | Owner-occupied | Renter-occupied |
| Single Unit, Detached | 160,941 (90.7%) | 16,491 (9.3%) |
| Single Unit, Attached | 17,819 (69.8%) | 7,702 (30.2%) |
| 2 Unit Apartments | 2,629 (46.0%) | 3,091 (54.0%) |
| 3 or 4 Unit Apartments | 2,471 (39.3%) | 3,820 (60.7%) |
| 5 to 9 Unit Apartments | 1,231 (24.1%) | 3,871 (75.9%) |
| 10 or more Apartments | 1,535 (10.8%) | 12,621 (89.2%) |
| Mobile Home / Other | 4,702 (89.7%) | 542 (10.3%) |
| Total | 191,328 (79.9%) | 48,138 (20.1%) |
Housing Structures by Number of Rooms in Ocean County
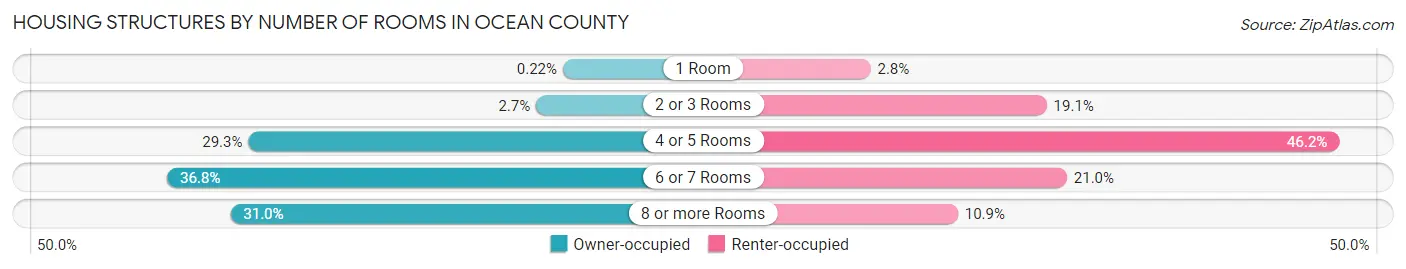
| Number of Rooms | Owner-occupied | Renter-occupied |
| 1 Room | 414 (0.2%) | 1,363 (2.8%) |
| 2 or 3 Rooms | 5,158 (2.7%) | 9,202 (19.1%) |
| 4 or 5 Rooms | 56,070 (29.3%) | 22,224 (46.2%) |
| 6 or 7 Rooms | 70,440 (36.8%) | 10,102 (21.0%) |
| 8 or more Rooms | 59,246 (31.0%) | 5,247 (10.9%) |
| Total | 191,328 (100.0%) | 48,138 (100.0%) |
Housing Structure by Heating Type in Ocean County
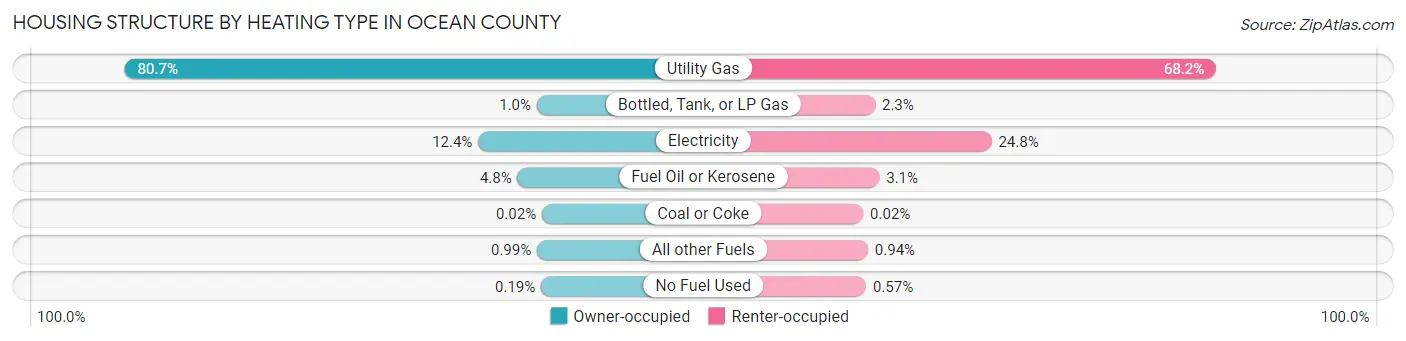
| Heating Type | Owner-occupied | Renter-occupied |
| Utility Gas | 154,389 (80.7%) | 32,835 (68.2%) |
| Bottled, Tank, or LP Gas | 1,928 (1.0%) | 1,113 (2.3%) |
| Electricity | 23,626 (12.3%) | 11,946 (24.8%) |
| Fuel Oil or Kerosene | 9,082 (4.8%) | 1,511 (3.1%) |
| Coal or Coke | 40 (0.0%) | 8 (0.0%) |
| All other Fuels | 1,901 (1.0%) | 452 (0.9%) |
| No Fuel Used | 362 (0.2%) | 273 (0.6%) |
| Total | 191,328 (100.0%) | 48,138 (100.0%) |
Household Vehicle Usage in Ocean County
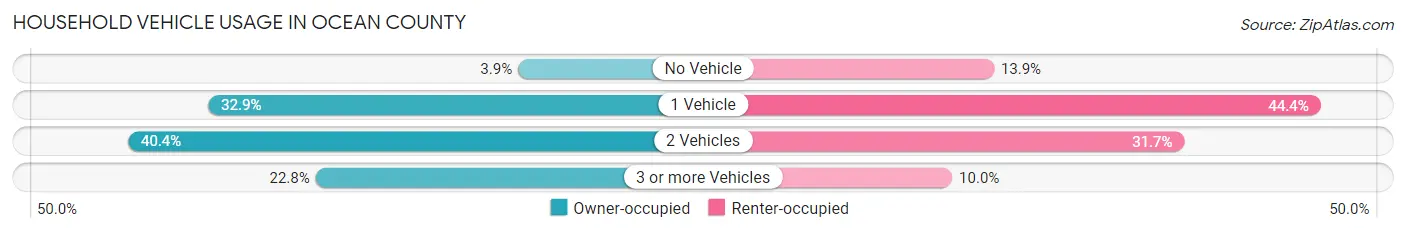
| Vehicles per Household | Owner-occupied | Renter-occupied |
| No Vehicle | 7,545 (3.9%) | 6,698 (13.9%) |
| 1 Vehicle | 62,869 (32.9%) | 21,371 (44.4%) |
| 2 Vehicles | 77,223 (40.4%) | 15,251 (31.7%) |
| 3 or more Vehicles | 43,691 (22.8%) | 4,818 (10.0%) |
| Total | 191,328 (100.0%) | 48,138 (100.0%) |
Real Estate & Mortgages in Ocean County
Real Estate and Mortgage Overview in Ocean County
| Characteristic | Without Mortgage | With Mortgage |
| Housing Units | 78,098 | 113,230 |
| Median Property Value | $303,500 | $365,700 |
| Median Household Income | $64,502 | $38,384 |
| Monthly Housing Costs | $873 | $26,098 |
| Real Estate Taxes | $5,864 | $2,271 |
Property Value by Mortgage Status in Ocean County
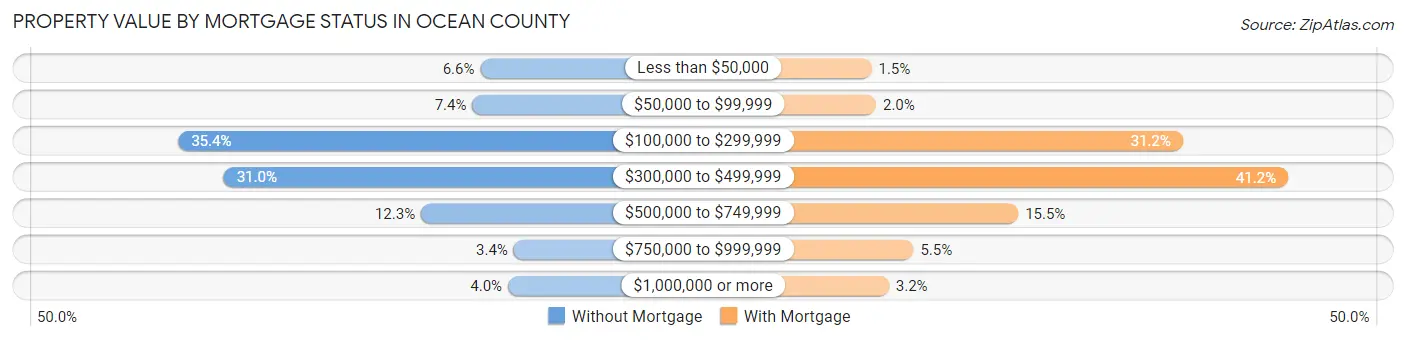
| Property Value | Without Mortgage | With Mortgage |
| Less than $50,000 | 5,157 (6.6%) | 1,726 (1.5%) |
| $50,000 to $99,999 | 5,751 (7.4%) | 2,205 (1.9%) |
| $100,000 to $299,999 | 27,622 (35.4%) | 35,286 (31.2%) |
| $300,000 to $499,999 | 24,230 (31.0%) | 46,631 (41.2%) |
| $500,000 to $749,999 | 9,569 (12.2%) | 17,544 (15.5%) |
| $750,000 to $999,999 | 2,671 (3.4%) | 6,248 (5.5%) |
| $1,000,000 or more | 3,098 (4.0%) | 3,590 (3.2%) |
| Total | 78,098 (100.0%) | 113,230 (100.0%) |
Household Income by Mortgage Status in Ocean County
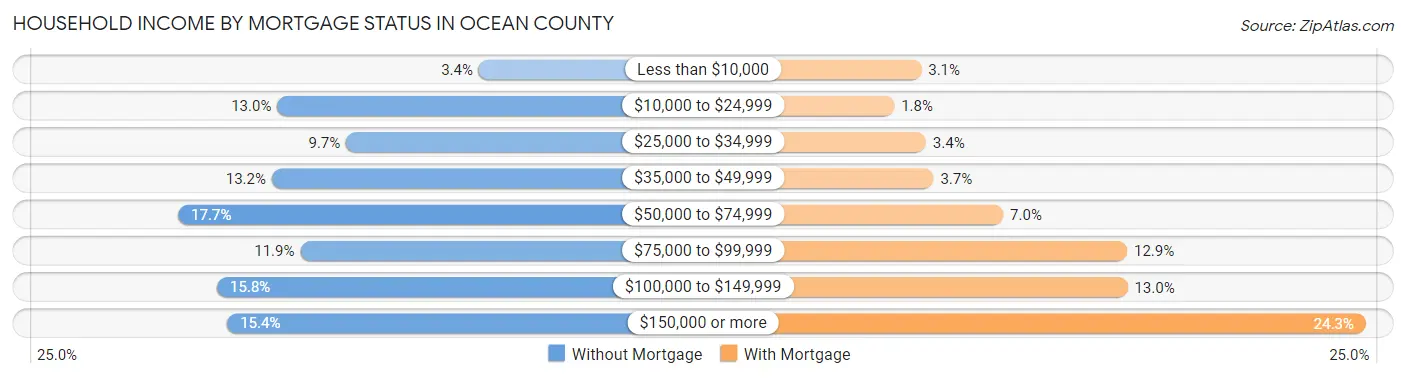
| Household Income | Without Mortgage | With Mortgage |
| Less than $10,000 | 2,628 (3.4%) | 3,544 (3.1%) |
| $10,000 to $24,999 | 10,130 (13.0%) | 2,088 (1.8%) |
| $25,000 to $34,999 | 7,571 (9.7%) | 3,793 (3.4%) |
| $35,000 to $49,999 | 10,329 (13.2%) | 4,199 (3.7%) |
| $50,000 to $74,999 | 13,815 (17.7%) | 7,961 (7.0%) |
| $75,000 to $99,999 | 9,267 (11.9%) | 14,637 (12.9%) |
| $100,000 to $149,999 | 12,371 (15.8%) | 14,658 (13.0%) |
| $150,000 or more | 11,987 (15.3%) | 27,510 (24.3%) |
| Total | 78,098 (100.0%) | 113,230 (100.0%) |
Property Value to Household Income Ratio in Ocean County
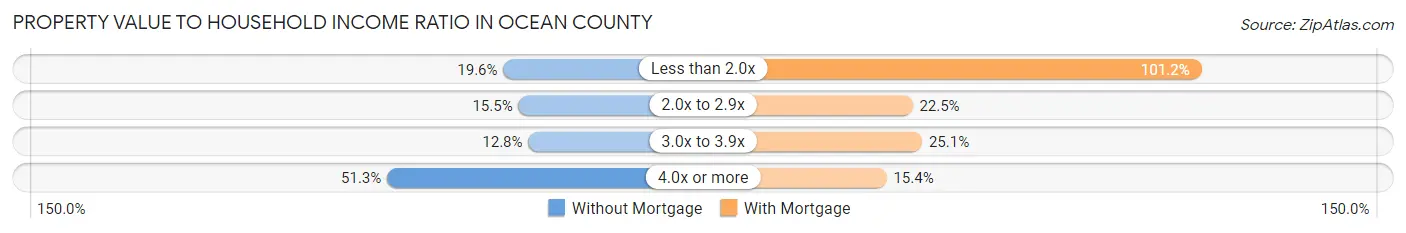
| Value-to-Income Ratio | Without Mortgage | With Mortgage |
| Less than 2.0x | 15,290 (19.6%) | 114,613 (101.2%) |
| 2.0x to 2.9x | 12,072 (15.5%) | 25,457 (22.5%) |
| 3.0x to 3.9x | 9,976 (12.8%) | 28,398 (25.1%) |
| 4.0x or more | 40,027 (51.2%) | 17,454 (15.4%) |
| Total | 78,098 (100.0%) | 113,230 (100.0%) |
Real Estate Taxes by Mortgage Status in Ocean County
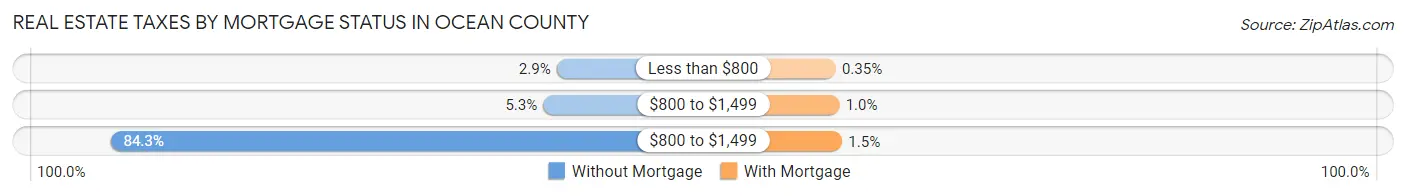
| Property Taxes | Without Mortgage | With Mortgage |
| Less than $800 | 2,226 (2.9%) | 399 (0.4%) |
| $800 to $1,499 | 4,148 (5.3%) | 1,168 (1.0%) |
| $800 to $1,499 | 65,831 (84.3%) | 1,731 (1.5%) |
| Total | 78,098 (100.0%) | 113,230 (100.0%) |
Health & Disability in Ocean County
Health Insurance Coverage by Age in Ocean County
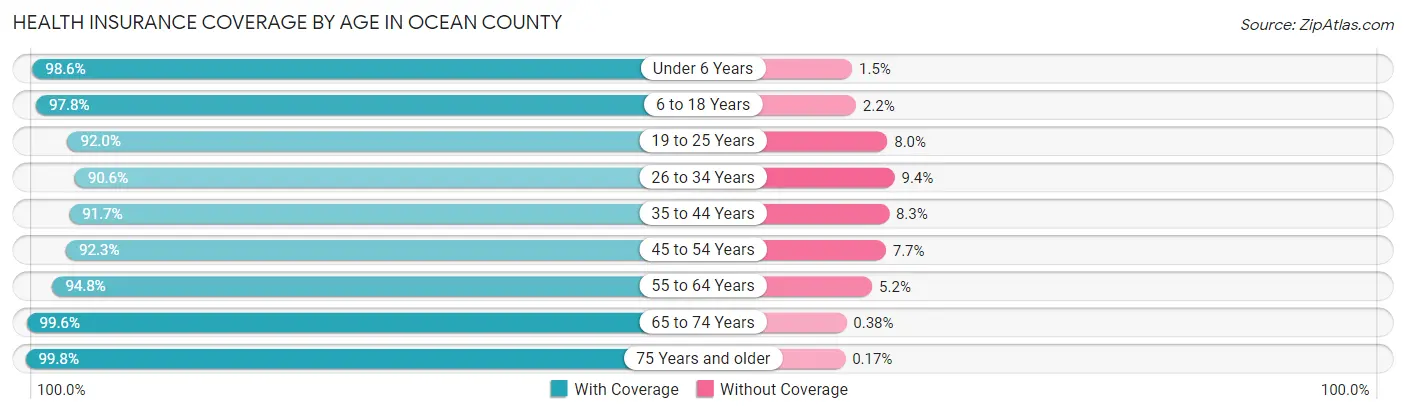
| Age Bracket | With Coverage | Without Coverage |
| Under 6 Years | 53,002 (98.6%) | 778 (1.5%) |
| 6 to 18 Years | 107,502 (97.8%) | 2,369 (2.2%) |
| 19 to 25 Years | 42,739 (92.0%) | 3,725 (8.0%) |
| 26 to 34 Years | 57,293 (90.6%) | 5,922 (9.4%) |
| 35 to 44 Years | 59,351 (91.7%) | 5,395 (8.3%) |
| 45 to 54 Years | 64,264 (92.3%) | 5,395 (7.7%) |
| 55 to 64 Years | 80,995 (94.8%) | 4,447 (5.2%) |
| 65 to 74 Years | 75,916 (99.6%) | 287 (0.4%) |
| 75 Years and older | 64,135 (99.8%) | 108 (0.2%) |
| Total | 605,197 (95.5%) | 28,426 (4.5%) |
Health Insurance Coverage by Citizenship Status in Ocean County
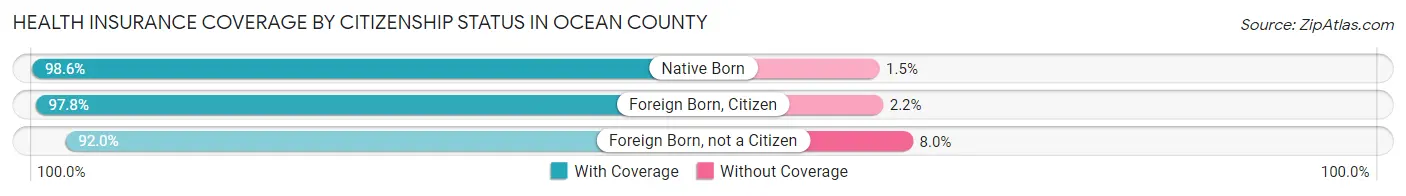
| Citizenship Status | With Coverage | Without Coverage |
| Native Born | 53,002 (98.6%) | 778 (1.5%) |
| Foreign Born, Citizen | 107,502 (97.8%) | 2,369 (2.2%) |
| Foreign Born, not a Citizen | 42,739 (92.0%) | 3,725 (8.0%) |
Health Insurance Coverage by Household Income in Ocean County
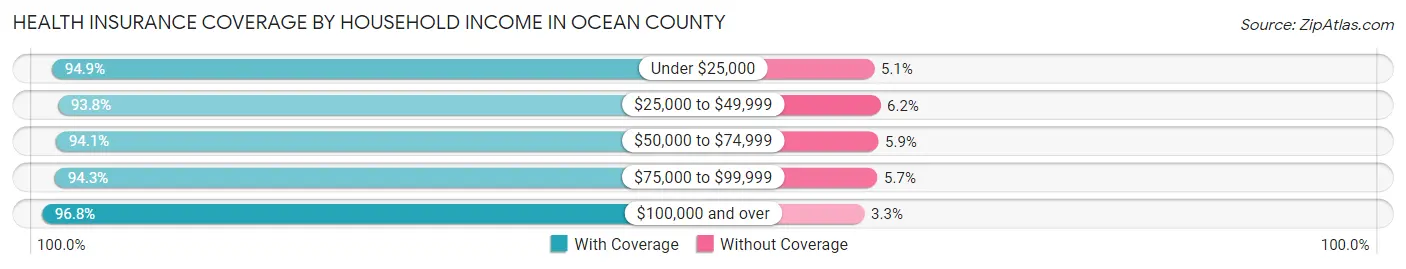
| Household Income | With Coverage | Without Coverage |
| Under $25,000 | 47,670 (94.9%) | 2,562 (5.1%) |
| $25,000 to $49,999 | 83,088 (93.8%) | 5,530 (6.2%) |
| $50,000 to $74,999 | 82,979 (94.1%) | 5,172 (5.9%) |
| $75,000 to $99,999 | 74,303 (94.3%) | 4,479 (5.7%) |
| $100,000 and over | 314,870 (96.8%) | 10,584 (3.3%) |
Public vs Private Health Insurance Coverage by Age in Ocean County
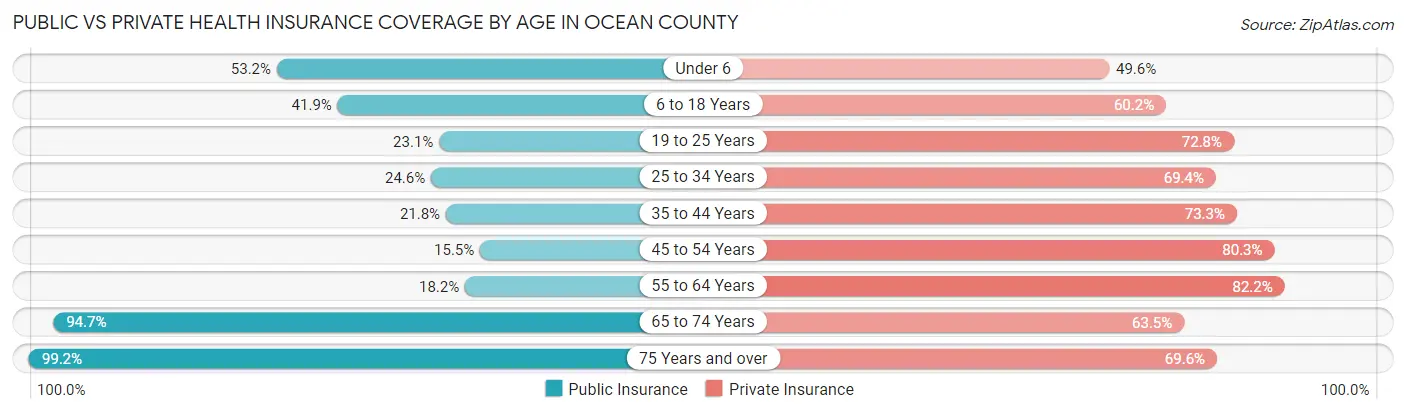
| Age Bracket | Public Insurance | Private Insurance |
| Under 6 | 28,599 (53.2%) | 26,679 (49.6%) |
| 6 to 18 Years | 46,023 (41.9%) | 66,108 (60.2%) |
| 19 to 25 Years | 10,711 (23.1%) | 33,813 (72.8%) |
| 25 to 34 Years | 15,525 (24.6%) | 43,876 (69.4%) |
| 35 to 44 Years | 14,111 (21.8%) | 47,464 (73.3%) |
| 45 to 54 Years | 10,759 (15.4%) | 55,923 (80.3%) |
| 55 to 64 Years | 15,581 (18.2%) | 70,205 (82.2%) |
| 65 to 74 Years | 72,147 (94.7%) | 48,412 (63.5%) |
| 75 Years and over | 63,730 (99.2%) | 44,723 (69.6%) |
| Total | 277,186 (43.8%) | 437,203 (69.0%) |
Disability Status by Sex by Age in Ocean County
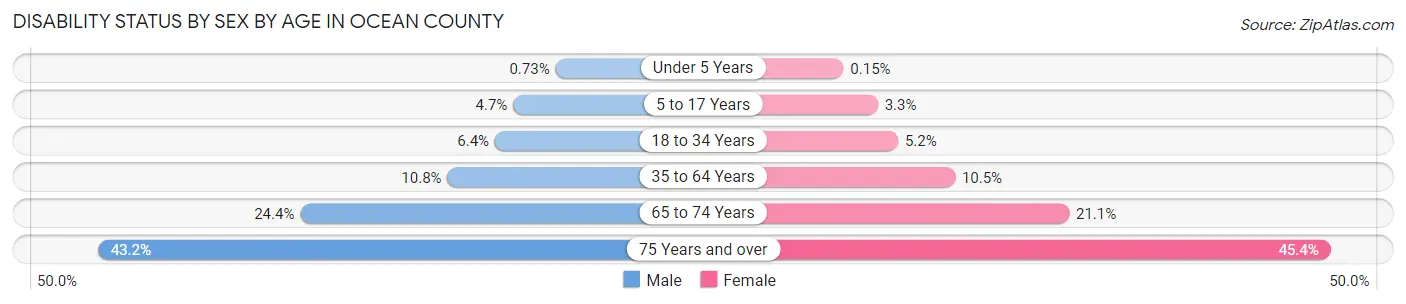
| Age Bracket | Male | Female |
| Under 5 Years | 172 (0.7%) | 34 (0.2%) |
| 5 to 17 Years | 2,638 (4.7%) | 1,791 (3.3%) |
| 18 to 34 Years | 3,782 (6.4%) | 2,998 (5.2%) |
| 35 to 64 Years | 11,642 (10.8%) | 11,719 (10.5%) |
| 65 to 74 Years | 8,398 (24.4%) | 8,820 (21.1%) |
| 75 Years and over | 11,180 (43.2%) | 17,406 (45.4%) |
Disability Class by Sex by Age in Ocean County
Disability Class: Hearing Difficulty
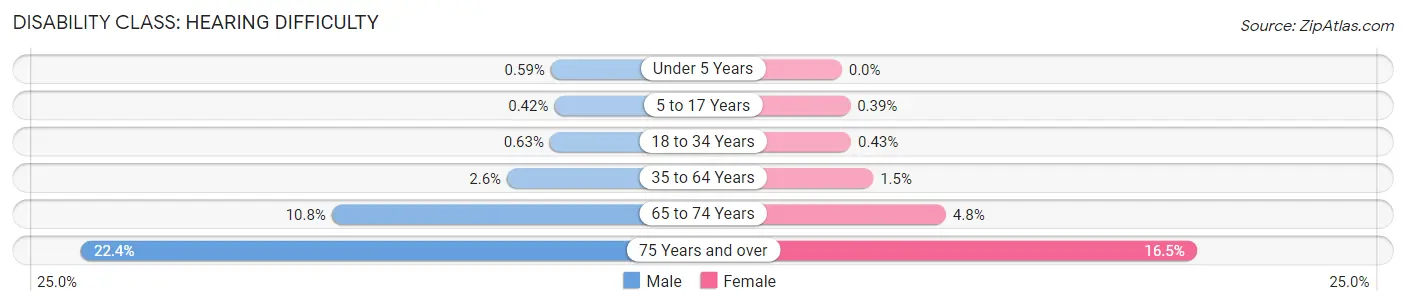
| Age Bracket | Male | Female |
| Under 5 Years | 139 (0.6%) | 0 (0.0%) |
| 5 to 17 Years | 238 (0.4%) | 209 (0.4%) |
| 18 to 34 Years | 375 (0.6%) | 247 (0.4%) |
| 35 to 64 Years | 2,835 (2.6%) | 1,635 (1.5%) |
| 65 to 74 Years | 3,696 (10.7%) | 2,020 (4.8%) |
| 75 Years and over | 5,790 (22.4%) | 6,314 (16.5%) |
Disability Class: Vision Difficulty
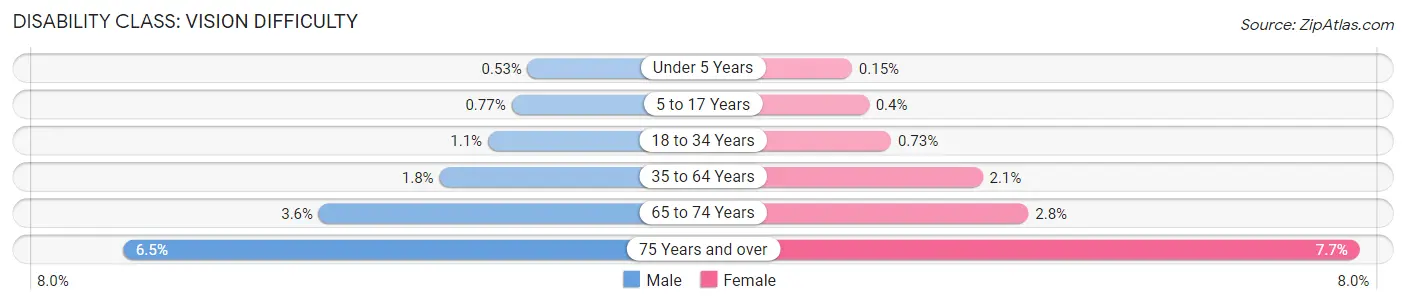
| Age Bracket | Male | Female |
| Under 5 Years | 125 (0.5%) | 34 (0.2%) |
| 5 to 17 Years | 438 (0.8%) | 215 (0.4%) |
| 18 to 34 Years | 669 (1.1%) | 420 (0.7%) |
| 35 to 64 Years | 1,988 (1.8%) | 2,337 (2.1%) |
| 65 to 74 Years | 1,248 (3.6%) | 1,159 (2.8%) |
| 75 Years and over | 1,692 (6.5%) | 2,952 (7.7%) |
Disability Class: Cognitive Difficulty
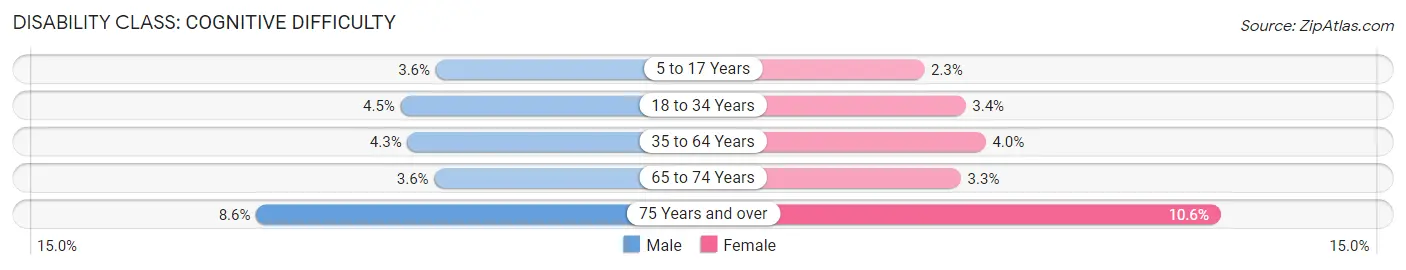
| Age Bracket | Male | Female |
| 5 to 17 Years | 2,012 (3.5%) | 1,231 (2.3%) |
| 18 to 34 Years | 2,700 (4.5%) | 1,980 (3.4%) |
| 35 to 64 Years | 4,694 (4.3%) | 4,460 (4.0%) |
| 65 to 74 Years | 1,236 (3.6%) | 1,384 (3.3%) |
| 75 Years and over | 2,212 (8.6%) | 4,048 (10.5%) |
Disability Class: Ambulatory Difficulty
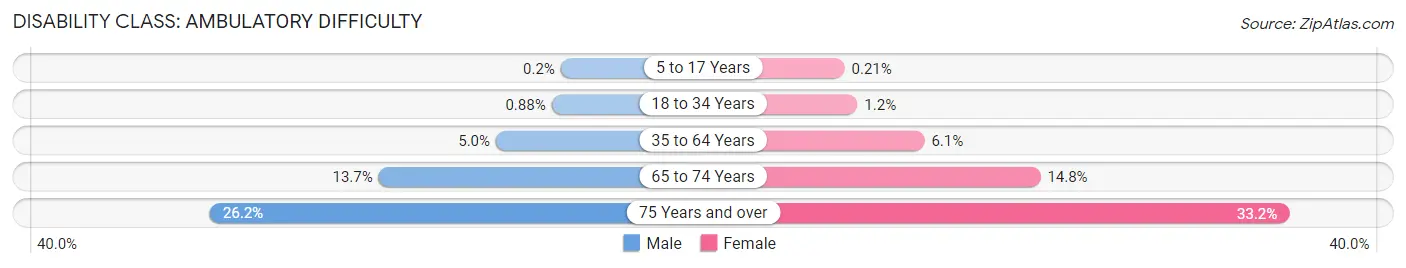
| Age Bracket | Male | Female |
| 5 to 17 Years | 115 (0.2%) | 112 (0.2%) |
| 18 to 34 Years | 524 (0.9%) | 670 (1.2%) |
| 35 to 64 Years | 5,423 (5.0%) | 6,852 (6.1%) |
| 65 to 74 Years | 4,716 (13.7%) | 6,167 (14.7%) |
| 75 Years and over | 6,790 (26.2%) | 12,743 (33.2%) |
Disability Class: Self-Care Difficulty
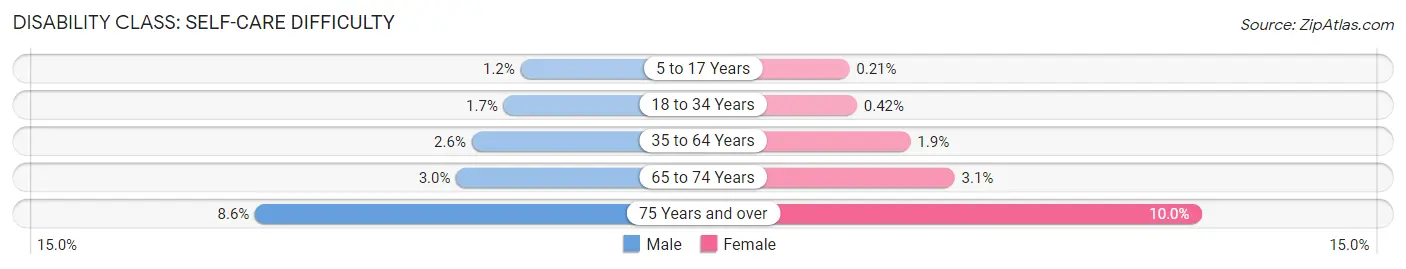
| Age Bracket | Male | Female |
| 5 to 17 Years | 675 (1.2%) | 114 (0.2%) |
| 18 to 34 Years | 986 (1.7%) | 241 (0.4%) |
| 35 to 64 Years | 2,764 (2.5%) | 2,128 (1.9%) |
| 65 to 74 Years | 1,026 (3.0%) | 1,313 (3.1%) |
| 75 Years and over | 2,219 (8.6%) | 3,840 (10.0%) |
Technology Access in Ocean County
Computing Device Access in Ocean County
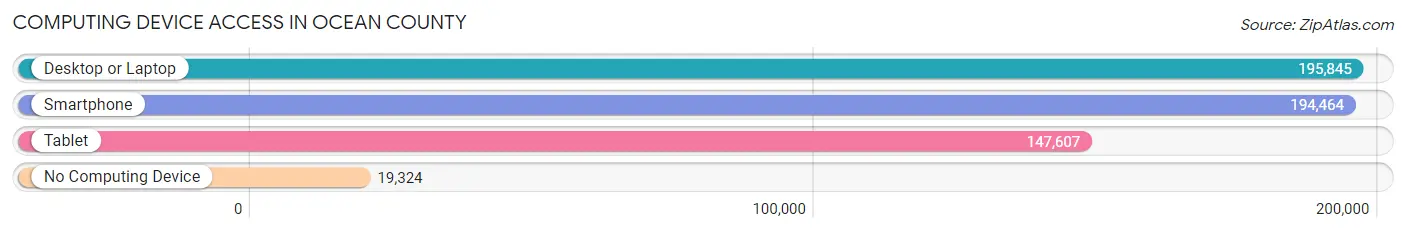
| Device Type | # Households | % Households |
| Desktop or Laptop | 195,845 | 81.8% |
| Smartphone | 194,464 | 81.2% |
| Tablet | 147,607 | 61.6% |
| No Computing Device | 19,324 | 8.1% |
| Total | 239,466 | 100.0% |
Internet Access in Ocean County
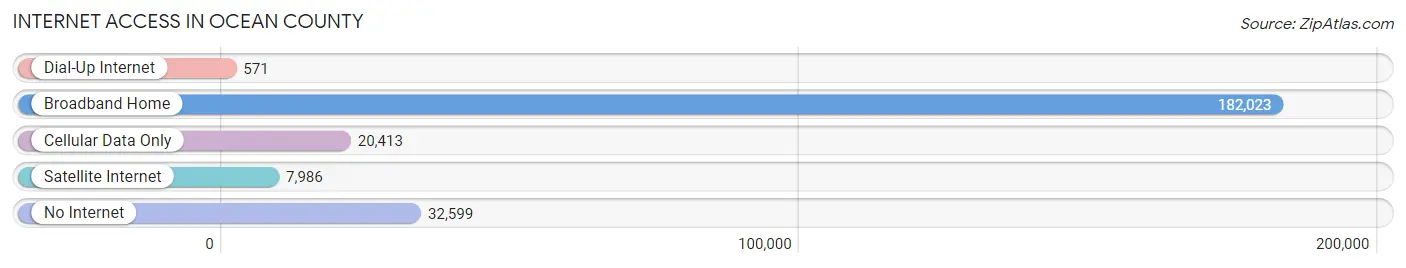
| Internet Type | # Households | % Households |
| Dial-Up Internet | 571 | 0.2% |
| Broadband Home | 182,023 | 76.0% |
| Cellular Data Only | 20,413 | 8.5% |
| Satellite Internet | 7,986 | 3.3% |
| No Internet | 32,599 | 13.6% |
| Total | 239,466 | 100.0% |
Ocean County Summary
History
Ocean County, New Jersey is located in the central part of the state and is part of the Jersey Shore region. It is bordered by Monmouth County to the north, Atlantic County to the south, and Burlington County to the west. The county was established in 1850 and was named after the Atlantic Ocean, which borders it to the east.
The area that is now Ocean County was originally inhabited by the Lenape Native Americans. The first European settlers arrived in the area in the late 1600s, and the county was officially established in 1850.
During the American Revolution, the area was a major battleground, with several battles taking place in the county. After the war, the area experienced a period of growth and development, with the establishment of several towns and villages.
In the late 1800s, the county experienced a period of industrialization, with the establishment of several factories and businesses. This period of growth and development continued into the early 1900s, with the establishment of several resorts and tourist attractions.
The county experienced a period of decline during the Great Depression, but the economy began to recover in the 1940s. During World War II, the county was home to several military bases, which helped to stimulate the local economy.
In the 1950s and 1960s, the county experienced a period of suburbanization, with the establishment of several new towns and villages. This period of growth and development continued into the 1970s and 1980s, with the establishment of several new businesses and industries.
Geography
Ocean County is located in the central part of New Jersey and is part of the Jersey Shore region. It is bordered by Monmouth County to the north, Atlantic County to the south, and Burlington County to the west. The county is located on the Atlantic Ocean, which borders it to the east.
The county is divided into three distinct regions: the northern region, the central region, and the southern region. The northern region is mostly rural and is home to several small towns and villages. The central region is more developed and is home to several larger towns and cities. The southern region is mostly residential and is home to several beach towns and resorts.
The county is home to several rivers, including the Manasquan River, the Toms River, and the Barnegat Bay. The county is also home to several lakes, including Lakehurst, Lakewood, and Lakewood Beach.
Economy
The economy of Ocean County is largely based on tourism, manufacturing, and agriculture. The county is home to several resorts and tourist attractions, including the Point Pleasant Beach Boardwalk, Jenkinson’s Boardwalk, and the Ocean County Park.
The county is also home to several manufacturing companies, including Ocean Spray Cranberries, Ocean Spray Juices, and Ocean Spray Foods. The county is also home to several agricultural operations, including dairy farms, vegetable farms, and fruit farms.
Demographics
As of the 2010 census, the population of Ocean County was 576,567. The population is largely white (84.3%), with smaller percentages of African Americans (7.2%), Hispanics (5.7%), and Asians (2.2%). The median household income is $68,945, and the median home value is $269,000.
Conclusion
Ocean County, New Jersey is a county located in the central part of the state and is part of the Jersey Shore region. It is bordered by Monmouth County to the north, Atlantic County to the south, and Burlington County to the west. The county was established in 1850 and is home to several rivers, lakes, and beaches. The economy of the county is largely based on tourism, manufacturing, and agriculture. As of the 2010 census, the population of Ocean County was 576,567, with a median household income of $68,945 and a median home value of $269,000.
Common Questions
What is the Total Population of Ocean County?
Total Population of Ocean County is 638,691.
What is the Total Male Population of Ocean County?
Total Male Population of Ocean County is 310,873.
What is the Total Female Population of Ocean County?
Total Female Population of Ocean County is 327,818.
What is the Ratio of Males per 100 Females in Ocean County?
There are 94.83 Males per 100 Females in Ocean County.
What is the Ratio of Females per 100 Males in Ocean County?
There are 105.45 Females per 100 Males in Ocean County.
What is the Median Population Age in Ocean County?
Median Population Age in Ocean County is 41.8 Years.
What is the Average Family Size in Ocean County
Average Family Size in Ocean County is 3.3 People.
What is the Average Household Size in Ocean County
Average Household Size in Ocean County is 2.6 People.
What is Per Capita Income in Ocean County?
Per Capita income in Ocean County is $42,497.
What is the Median Family Income in Ocean County?
Median Family Income in Ocean County is $104,483.
What is the Median Household income in Ocean County?
Median Household Income in Ocean County is $82,379.
What is Income or Wage Gap in Ocean County?
Income or Wage Gap in Ocean County is 36.9%.
Women in Ocean County earn 63.1 cents for every dollar earned by a man.
What is Family Income Deficit in Ocean County?
Family Income Deficit in Ocean County is $11,341.
Families that are below poverty line in Ocean County earn $11,341 less on average than the poverty threshold level.
What is Inequality or Gini Index in Ocean County?
Inequality or Gini Index in Ocean County is 0.46.
How Large is the Labor Force in Ocean County?
There are 293,946 People in the Labor Forcein in Ocean County.
What is the Percentage of People in the Labor Force in Ocean County?
58.9% of People are in the Labor Force in Ocean County.
What is the Unemployment Rate in Ocean County?
Unemployment Rate in Ocean County is 5.7%.