Morris County, NJ
Morris County Map
Morris County Overview
508,816
TOTAL POPULATION
252,441
MALE POPULATION
256,375
FEMALE POPULATION
98.47
MALES / 100 FEMALES
101.56
FEMALES / 100 MALES
42.7
MEDIAN AGE
3.2
AVG FAMILY SIZE
2.6
AVG HOUSEHOLD SIZE
$67,555
PER CAPITA INCOME
$163,598
AVG FAMILY INCOME
$130,808
AVG HOUSEHOLD INCOME
34.1%
WAGE / INCOME GAP [ % ]
65.9¢/ $1
WAGE / INCOME GAP [ $ ]
$10,262
FAMILY INCOME DEFICIT
0.46
INEQUALITY / GINI INDEX
283,011
LABOR FORCE [ PEOPLE ]
67.8%
PERCENT IN LABOR FORCE
5.3%
UNEMPLOYMENT RATE
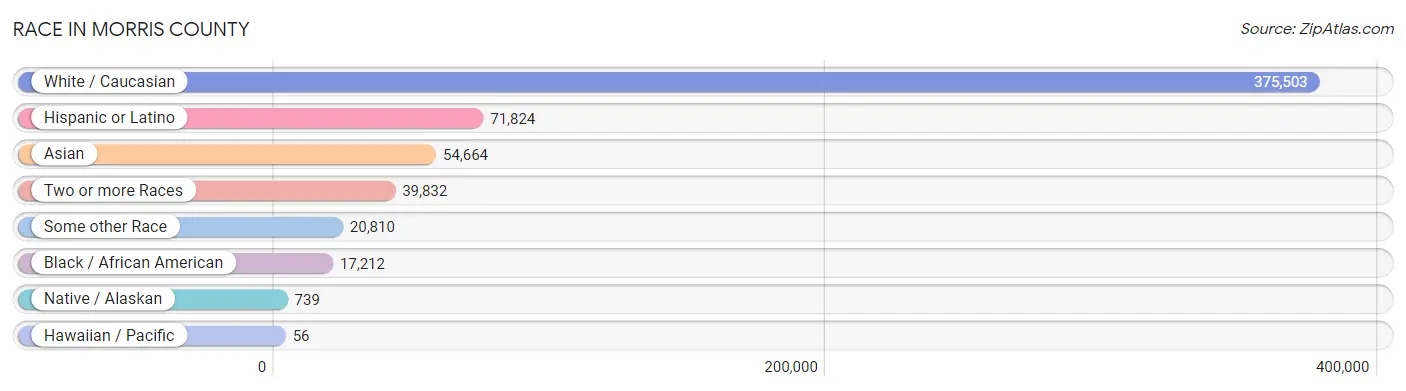
Race in Morris County
The most populous races in Morris County are White / Caucasian (375,503 | 73.8%), Hispanic or Latino (71,824 | 14.1%), and Asian (54,664 | 10.7%).
| Race | # Population | % Population |
| Asian | 54,664 | 10.7% |
| Black / African American | 17,212 | 3.4% |
| Hawaiian / Pacific | 56 | 0.0% |
| Hispanic or Latino | 71,824 | 14.1% |
| Native / Alaskan | 739 | 0.2% |
| White / Caucasian | 375,503 | 73.8% |
| Two or more Races | 39,832 | 7.8% |
| Some other Race | 20,810 | 4.1% |
| Total | 508,816 | 100.0% |
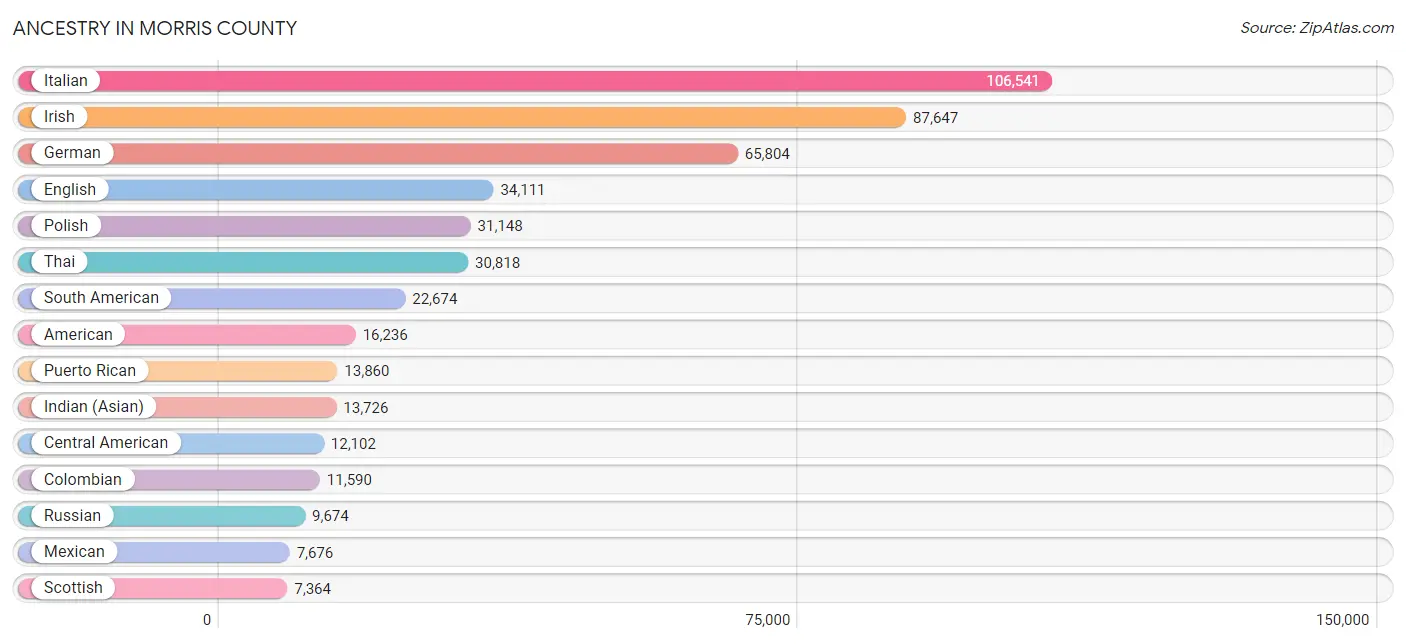
Ancestry in Morris County
The most populous ancestries reported in Morris County are Italian (106,541 | 20.9%), Irish (87,647 | 17.2%), German (65,804 | 12.9%), English (34,111 | 6.7%), and Polish (31,148 | 6.1%), together accounting for 63.9% of all Morris County residents.
| Ancestry | # Population | % Population |
| Afghan | 345 | 0.1% |
| African | 759 | 0.2% |
| Albanian | 574 | 0.1% |
| Alsatian | 57 | 0.0% |
| American | 16,236 | 3.2% |
| Arab | 4,076 | 0.8% |
| Arapaho | 20 | 0.0% |
| Argentinean | 809 | 0.2% |
| Armenian | 978 | 0.2% |
| Assyrian / Chaldean / Syriac | 60 | 0.0% |
| Australian | 54 | 0.0% |
| Austrian | 2,670 | 0.5% |
| Barbadian | 52 | 0.0% |
| Basque | 74 | 0.0% |
| Belgian | 568 | 0.1% |
| Belizean | 9 | 0.0% |
| Bhutanese | 1,165 | 0.2% |
| Blackfeet | 108 | 0.0% |
| Bolivian | 138 | 0.0% |
| Brazilian | 1,414 | 0.3% |
| British | 2,491 | 0.5% |
| British West Indian | 195 | 0.0% |
| Bulgarian | 272 | 0.1% |
| Burmese | 3,577 | 0.7% |
| Cajun | 13 | 0.0% |
| Cambodian | 75 | 0.0% |
| Canadian | 974 | 0.2% |
| Cape Verdean | 18 | 0.0% |
| Carpatho Rusyn | 64 | 0.0% |
| Celtic | 155 | 0.0% |
| Central American | 12,102 | 2.4% |
| Central American Indian | 696 | 0.1% |
| Cherokee | 363 | 0.1% |
| Chilean | 1,456 | 0.3% |
| Chippewa | 23 | 0.0% |
| Colombian | 11,590 | 2.3% |
| Costa Rican | 1,994 | 0.4% |
| Croatian | 941 | 0.2% |
| Crow | 24 | 0.0% |
| Cuban | 4,047 | 0.8% |
| Cypriot | 18 | 0.0% |
| Czech | 1,646 | 0.3% |
| Czechoslovakian | 677 | 0.1% |
| Danish | 1,540 | 0.3% |
| Delaware | 134 | 0.0% |
| Dominican | 5,538 | 1.1% |
| Dutch | 7,301 | 1.4% |
| Eastern European | 3,657 | 0.7% |
| Ecuadorian | 3,552 | 0.7% |
| Egyptian | 764 | 0.2% |
| English | 34,111 | 6.7% |
| Estonian | 78 | 0.0% |
| Ethiopian | 76 | 0.0% |
| European | 4,913 | 1.0% |
| Filipino | 1,226 | 0.2% |
| Finnish | 414 | 0.1% |
| French | 6,962 | 1.4% |
| French American Indian | 54 | 0.0% |
| French Canadian | 1,511 | 0.3% |
| German | 65,804 | 12.9% |
| Ghanaian | 542 | 0.1% |
| Greek | 5,099 | 1.0% |
| Guatemalan | 1,976 | 0.4% |
| Guyanese | 350 | 0.1% |
| Haitian | 1,247 | 0.3% |
| Honduran | 5,817 | 1.1% |
| Houma | 25 | 0.0% |
| Hungarian | 5,721 | 1.1% |
| Icelander | 149 | 0.0% |
| Indian (Asian) | 13,726 | 2.7% |
| Indonesian | 56 | 0.0% |
| Iranian | 632 | 0.1% |
| Iraqi | 135 | 0.0% |
| Irish | 87,647 | 17.2% |
| Iroquois | 103 | 0.0% |
| Israeli | 433 | 0.1% |
| Italian | 106,541 | 20.9% |
| Jamaican | 2,441 | 0.5% |
| Japanese | 17 | 0.0% |
| Jordanian | 82 | 0.0% |
| Kenyan | 156 | 0.0% |
| Korean | 6,429 | 1.3% |
| Laotian | 23 | 0.0% |
| Latvian | 373 | 0.1% |
| Lebanese | 930 | 0.2% |
| Lithuanian | 2,171 | 0.4% |
| Luxembourger | 17 | 0.0% |
| Macedonian | 828 | 0.2% |
| Malaysian | 85 | 0.0% |
| Maltese | 196 | 0.0% |
| Mexican | 7,676 | 1.5% |
| Mexican American Indian | 78 | 0.0% |
| Mongolian | 33 | 0.0% |
| Moroccan | 15 | 0.0% |
| Native Hawaiian | 161 | 0.0% |
| Nicaraguan | 351 | 0.1% |
| Nigerian | 385 | 0.1% |
| Northern European | 445 | 0.1% |
| Norwegian | 3,933 | 0.8% |
| Pakistani | 232 | 0.1% |
| Palestinian | 466 | 0.1% |
| Panamanian | 84 | 0.0% |
| Paraguayan | 7 | 0.0% |
| Pennsylvania German | 167 | 0.0% |
| Peruvian | 3,092 | 0.6% |
| Polish | 31,148 | 6.1% |
| Portuguese | 4,209 | 0.8% |
| Puerto Rican | 13,860 | 2.7% |
| Romanian | 1,379 | 0.3% |
| Russian | 9,674 | 1.9% |
| Salvadoran | 1,880 | 0.4% |
| Samoan | 25 | 0.0% |
| Scandinavian | 730 | 0.1% |
| Scotch-Irish | 2,409 | 0.5% |
| Scottish | 7,364 | 1.5% |
| Seminole | 9 | 0.0% |
| Serbian | 408 | 0.1% |
| Sierra Leonean | 140 | 0.0% |
| Sioux | 9 | 0.0% |
| Slavic | 639 | 0.1% |
| Slovak | 2,358 | 0.5% |
| Slovene | 85 | 0.0% |
| South African | 178 | 0.0% |
| South American | 22,674 | 4.5% |
| South American Indian | 144 | 0.0% |
| Soviet Union | 16 | 0.0% |
| Spaniard | 2,442 | 0.5% |
| Spanish | 1,404 | 0.3% |
| Sri Lankan | 1,614 | 0.3% |
| Subsaharan African | 2,538 | 0.5% |
| Sudanese | 22 | 0.0% |
| Swedish | 4,452 | 0.9% |
| Swiss | 1,896 | 0.4% |
| Syrian | 1,307 | 0.3% |
| Thai | 30,818 | 6.1% |
| Trinidadian and Tobagonian | 363 | 0.1% |
| Turkish | 1,465 | 0.3% |
| Ukrainian | 4,989 | 1.0% |
| Uruguayan | 900 | 0.2% |
| Venezuelan | 1,045 | 0.2% |
| Vietnamese | 42 | 0.0% |
| Welsh | 1,927 | 0.4% |
| West Indian | 213 | 0.0% |
| Yugoslavian | 646 | 0.1% | View All 144 Rows |
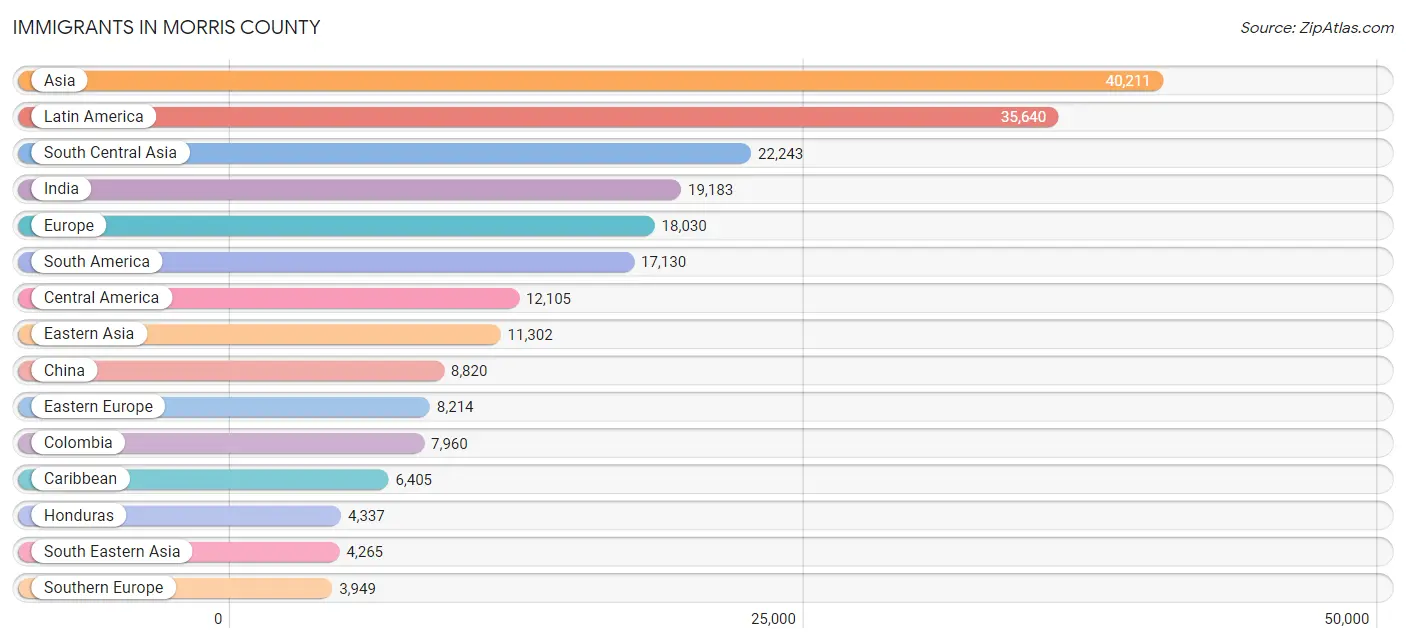
Immigrants in Morris County
The most numerous immigrant groups reported in Morris County came from Asia (40,211 | 7.9%), Latin America (35,640 | 7.0%), South Central Asia (22,243 | 4.4%), India (19,183 | 3.8%), and Europe (18,030 | 3.5%), together accounting for 26.6% of all Morris County residents.
| Immigration Origin | # Population | % Population |
| Afghanistan | 330 | 0.1% |
| Africa | 2,776 | 0.5% |
| Albania | 81 | 0.0% |
| Argentina | 564 | 0.1% |
| Armenia | 8 | 0.0% |
| Asia | 40,211 | 7.9% |
| Australia | 131 | 0.0% |
| Austria | 163 | 0.0% |
| Bangladesh | 157 | 0.0% |
| Barbados | 35 | 0.0% |
| Belarus | 312 | 0.1% |
| Belgium | 33 | 0.0% |
| Bolivia | 36 | 0.0% |
| Bosnia and Herzegovina | 266 | 0.1% |
| Brazil | 1,249 | 0.3% |
| Bulgaria | 106 | 0.0% |
| Cambodia | 8 | 0.0% |
| Cameroon | 79 | 0.0% |
| Canada | 1,551 | 0.3% |
| Caribbean | 6,405 | 1.3% |
| Central America | 12,105 | 2.4% |
| Chile | 1,100 | 0.2% |
| China | 8,820 | 1.7% |
| Colombia | 7,960 | 1.6% |
| Costa Rica | 1,260 | 0.3% |
| Croatia | 115 | 0.0% |
| Cuba | 1,246 | 0.2% |
| Czechoslovakia | 344 | 0.1% |
| Denmark | 204 | 0.0% |
| Dominica | 77 | 0.0% |
| Dominican Republic | 2,729 | 0.5% |
| Eastern Africa | 401 | 0.1% |
| Eastern Asia | 11,302 | 2.2% |
| Eastern Europe | 8,214 | 1.6% |
| Ecuador | 2,403 | 0.5% |
| Egypt | 756 | 0.2% |
| El Salvador | 1,204 | 0.2% |
| England | 1,120 | 0.2% |
| Eritrea | 11 | 0.0% |
| Ethiopia | 18 | 0.0% |
| Europe | 18,030 | 3.5% |
| France | 379 | 0.1% |
| Germany | 1,132 | 0.2% |
| Ghana | 635 | 0.1% |
| Greece | 868 | 0.2% |
| Grenada | 62 | 0.0% |
| Guatemala | 1,281 | 0.3% |
| Guyana | 514 | 0.1% |
| Haiti | 581 | 0.1% |
| Honduras | 4,337 | 0.9% |
| Hong Kong | 1,635 | 0.3% |
| Hungary | 322 | 0.1% |
| India | 19,183 | 3.8% |
| Indonesia | 39 | 0.0% |
| Iran | 464 | 0.1% |
| Iraq | 119 | 0.0% |
| Ireland | 497 | 0.1% |
| Israel | 280 | 0.1% |
| Italy | 1,744 | 0.3% |
| Jamaica | 1,316 | 0.3% |
| Japan | 240 | 0.1% |
| Jordan | 118 | 0.0% |
| Kazakhstan | 80 | 0.0% |
| Kenya | 189 | 0.0% |
| Korea | 2,242 | 0.4% |
| Kuwait | 133 | 0.0% |
| Latin America | 35,640 | 7.0% |
| Latvia | 78 | 0.0% |
| Lebanon | 154 | 0.0% |
| Lithuania | 141 | 0.0% |
| Malaysia | 152 | 0.0% |
| Mexico | 3,707 | 0.7% |
| Middle Africa | 143 | 0.0% |
| Moldova | 195 | 0.0% |
| Morocco | 9 | 0.0% |
| Nepal | 145 | 0.0% |
| Netherlands | 192 | 0.0% |
| Nicaragua | 261 | 0.1% |
| Nigeria | 342 | 0.1% |
| North Macedonia | 780 | 0.2% |
| Northern Africa | 777 | 0.2% |
| Northern Europe | 3,697 | 0.7% |
| Norway | 33 | 0.0% |
| Oceania | 164 | 0.0% |
| Pakistan | 1,517 | 0.3% |
| Panama | 55 | 0.0% |
| Peru | 1,950 | 0.4% |
| Philippines | 3,140 | 0.6% |
| Poland | 2,301 | 0.4% |
| Portugal | 977 | 0.2% |
| Romania | 459 | 0.1% |
| Russia | 827 | 0.2% |
| Saudi Arabia | 160 | 0.0% |
| Scotland | 306 | 0.1% |
| Senegal | 9 | 0.0% |
| Serbia | 85 | 0.0% |
| Sierra Leone | 61 | 0.0% |
| Singapore | 30 | 0.0% |
| South Africa | 378 | 0.1% |
| South America | 17,130 | 3.4% |
| South Central Asia | 22,243 | 4.4% |
| South Eastern Asia | 4,265 | 0.8% |
| Southern Europe | 3,949 | 0.8% |
| Spain | 333 | 0.1% |
| Sri Lanka | 88 | 0.0% |
| Sudan | 12 | 0.0% |
| Sweden | 25 | 0.0% |
| Switzerland | 229 | 0.1% |
| Syria | 257 | 0.1% |
| Taiwan | 2,287 | 0.4% |
| Thailand | 86 | 0.0% |
| Trinidad and Tobago | 344 | 0.1% |
| Turkey | 764 | 0.2% |
| Uganda | 30 | 0.0% |
| Ukraine | 1,352 | 0.3% |
| Uruguay | 646 | 0.1% |
| Uzbekistan | 200 | 0.0% |
| Venezuela | 701 | 0.1% |
| Vietnam | 777 | 0.2% |
| West Indies | 15 | 0.0% |
| Western Africa | 1,047 | 0.2% |
| Western Asia | 2,240 | 0.4% |
| Western Europe | 2,128 | 0.4% |
| Yemen | 42 | 0.0% |
| Zaire | 8 | 0.0% | View All 125 Rows |
Sex and Age in Morris County
Sex and Age in Morris County
The most populous age groups in Morris County are 55 to 59 Years (20,248 | 8.0%) for men and 55 to 59 Years (19,725 | 7.7%) for women.
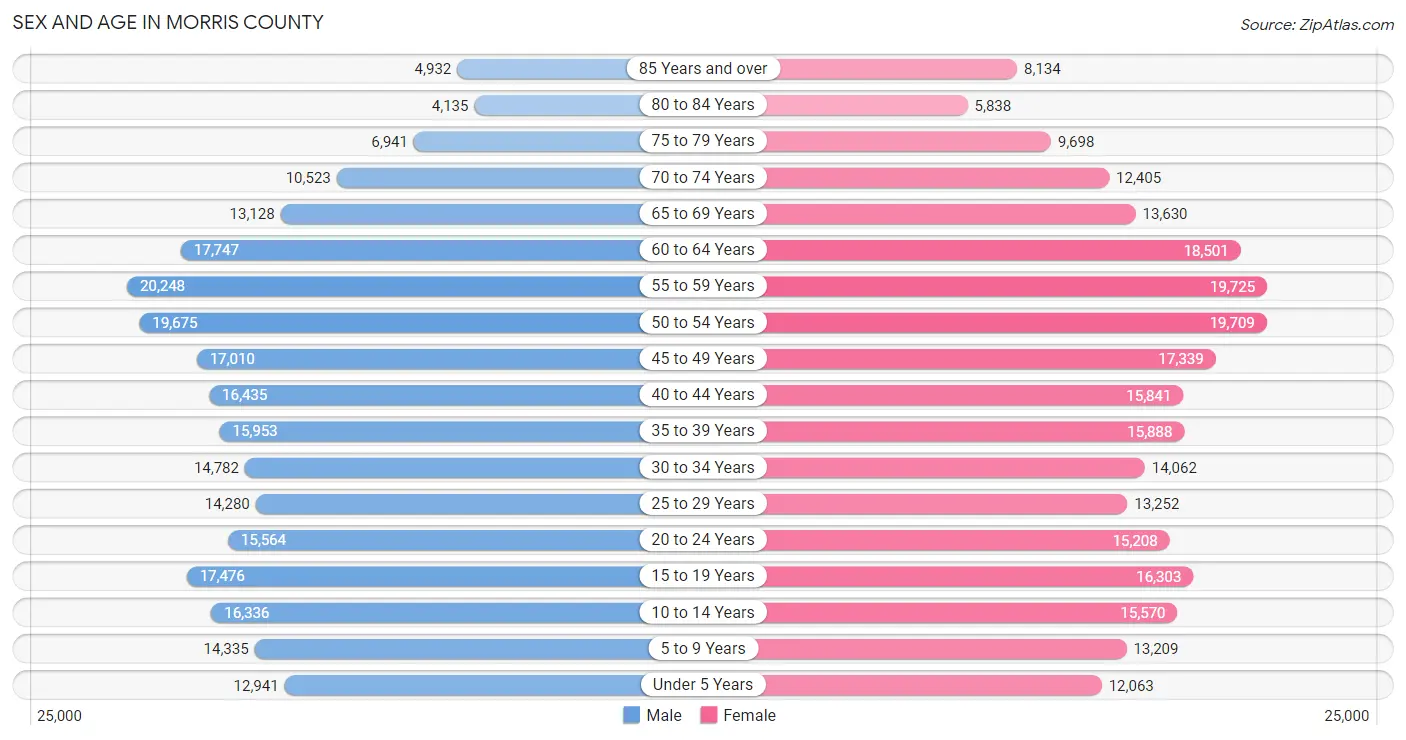
| Age Bracket | Male | Female |
| Under 5 Years | 12,941 (5.1%) | 12,063 (4.7%) |
| 5 to 9 Years | 14,335 (5.7%) | 13,209 (5.1%) |
| 10 to 14 Years | 16,336 (6.5%) | 15,570 (6.1%) |
| 15 to 19 Years | 17,476 (6.9%) | 16,303 (6.4%) |
| 20 to 24 Years | 15,564 (6.2%) | 15,208 (5.9%) |
| 25 to 29 Years | 14,280 (5.7%) | 13,252 (5.2%) |
| 30 to 34 Years | 14,782 (5.9%) | 14,062 (5.5%) |
| 35 to 39 Years | 15,953 (6.3%) | 15,888 (6.2%) |
| 40 to 44 Years | 16,435 (6.5%) | 15,841 (6.2%) |
| 45 to 49 Years | 17,010 (6.7%) | 17,339 (6.8%) |
| 50 to 54 Years | 19,675 (7.8%) | 19,709 (7.7%) |
| 55 to 59 Years | 20,248 (8.0%) | 19,725 (7.7%) |
| 60 to 64 Years | 17,747 (7.0%) | 18,501 (7.2%) |
| 65 to 69 Years | 13,128 (5.2%) | 13,630 (5.3%) |
| 70 to 74 Years | 10,523 (4.2%) | 12,405 (4.8%) |
| 75 to 79 Years | 6,941 (2.8%) | 9,698 (3.8%) |
| 80 to 84 Years | 4,135 (1.6%) | 5,838 (2.3%) |
| 85 Years and over | 4,932 (1.9%) | 8,134 (3.2%) |
| Total | 252,441 (100.0%) | 256,375 (100.0%) |
Families and Households in Morris County
Median Family Size in Morris County
The median family size in Morris County is 3.20 persons per family, with married-couple families (110,786 | 83.6%) accounting for the largest median family size of 3.26 persons per family. On the other hand, single male/father families (6,069 | 4.6%) represent the smallest median family size with 2.71 persons per family.
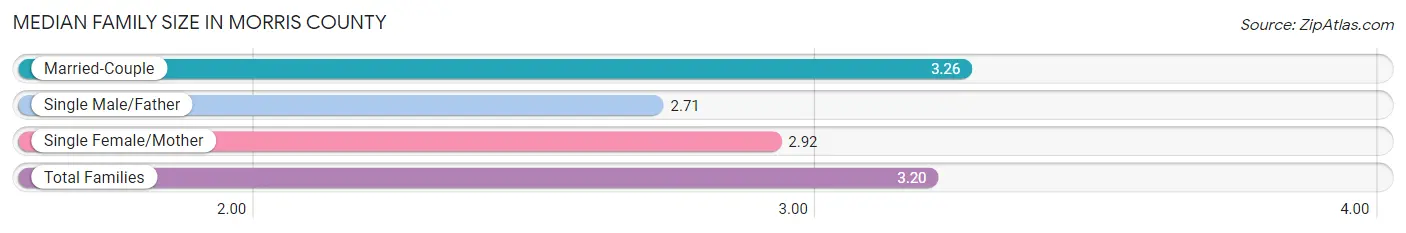
| Family Type | # Families | Family Size |
| Married-Couple | 110,786 (83.6%) | 3.26 |
| Single Male/Father | 6,069 (4.6%) | 2.71 |
| Single Female/Mother | 15,749 (11.9%) | 2.92 |
| Total Families | 132,604 (100.0%) | 3.20 |
Median Household Size in Morris County
The median household size in Morris County is 2.64 persons per household, with married-couple households (110,786 | 58.4%) accounting for the largest median household size of 3.28 persons per household. non-family households (57,003 | 30.1%) represent the smallest median household size with 1.21 persons per household.

| Household Type | # Households | Household Size |
| Married-Couple | 110,786 (58.4%) | 3.28 |
| Single Male/Father | 6,069 (3.2%) | 2.98 |
| Single Female/Mother | 15,749 (8.3%) | 3.14 |
| Non-family | 57,003 (30.1%) | 1.21 |
| Total Households | 189,607 (100.0%) | 2.64 |
Household Size by Marriage Status in Morris County
Out of a total of 189,607 households in Morris County, 132,604 (69.9%) are family households, while 57,003 (30.1%) are nonfamily households. The most numerous type of family households are 2-person households, comprising 52,161, and the most common type of nonfamily households are 1-person households, comprising 47,090.
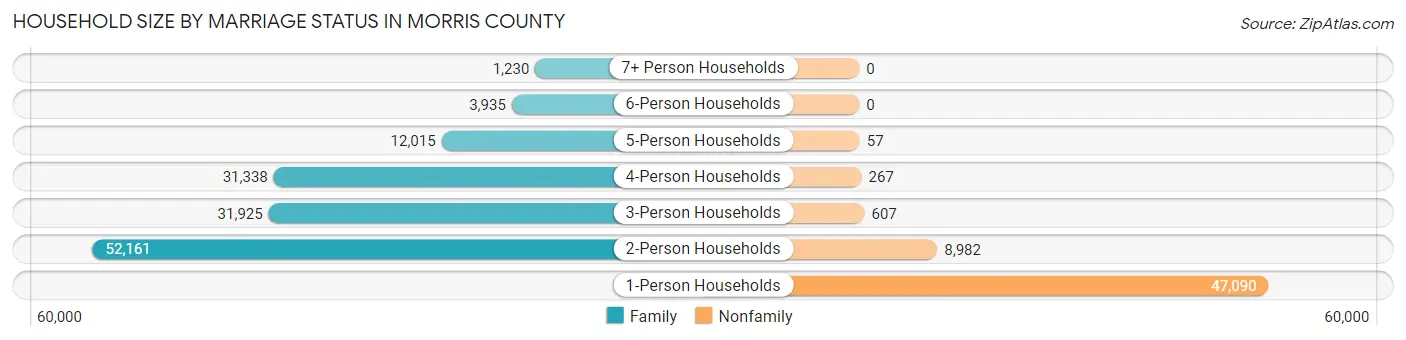
| Household Size | Family Households | Nonfamily Households |
| 1-Person Households | - | 47,090 (24.8%) |
| 2-Person Households | 52,161 (27.5%) | 8,982 (4.7%) |
| 3-Person Households | 31,925 (16.8%) | 607 (0.3%) |
| 4-Person Households | 31,338 (16.5%) | 267 (0.1%) |
| 5-Person Households | 12,015 (6.3%) | 57 (0.0%) |
| 6-Person Households | 3,935 (2.1%) | 0 (0.0%) |
| 7+ Person Households | 1,230 (0.6%) | 0 (0.0%) |
| Total | 132,604 (69.9%) | 57,003 (30.1%) |
Female Fertility in Morris County
Fertility by Age in Morris County
Average fertility rate in Morris County is 48.0 births per 1,000 women. Women in the age bracket of 20 to 34 years have the highest fertility rate with 67.0 births per 1,000 women. Women in the age bracket of 20 to 34 years acount for 53.4% of all women with births.
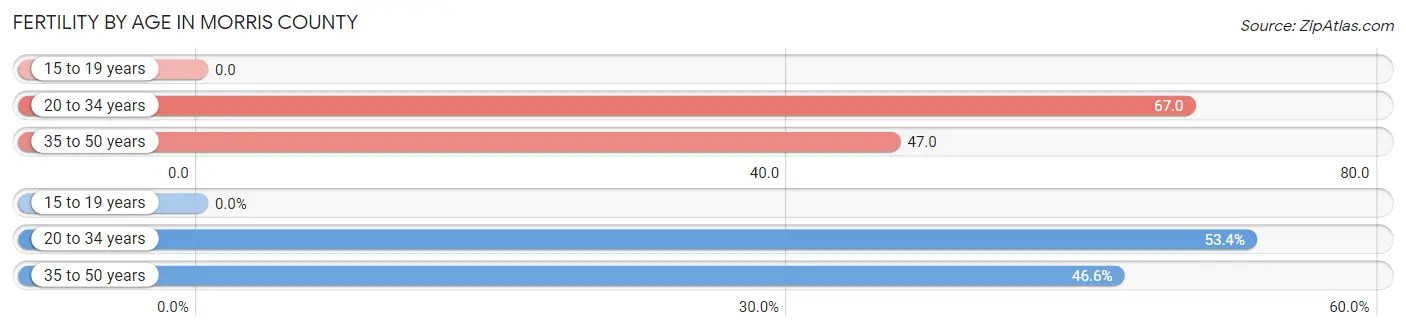
| Age Bracket | Women with Births | Births / 1,000 Women |
| 15 to 19 years | 0 (0.0%) | 0.0 |
| 20 to 34 years | 2,870 (53.4%) | 67.0 |
| 35 to 50 years | 2,508 (46.6%) | 47.0 |
| Total | 5,378 (100.0%) | 48.0 |
Fertility by Age by Marriage Status in Morris County
84.5% of women with births (5,378) in Morris County are married. The highest percentage of unmarried women with births falls into 35 to 50 years age bracket with 15.6% of them unmarried at the time of birth, while the lowest percentage of unmarried women with births belong to 20 to 34 years age bracket with 15.4% of them unmarried.
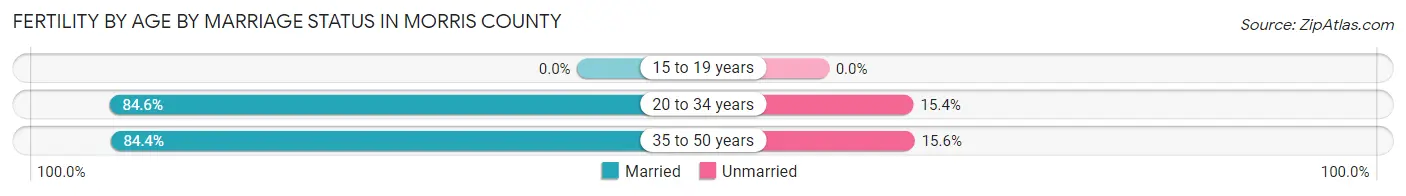
| Age Bracket | Married | Unmarried |
| 15 to 19 years | 0 (0.0%) | 0 (0.0%) |
| 20 to 34 years | 2,428 (84.6%) | 442 (15.4%) |
| 35 to 50 years | 2,117 (84.4%) | 391 (15.6%) |
| Total | 4,544 (84.5%) | 834 (15.5%) |
Fertility by Education in Morris County
Average fertility rate in Morris County is 48.0 births per 1,000 women. Women with the education attainment of graduate degree have the highest fertility rate of 80.0 births per 1,000 women, while women with the education attainment of less than high school have the lowest fertility at 6.0 births per 1,000 women. Women with the education attainment of graduate degree represent 38.1% of all women with births.
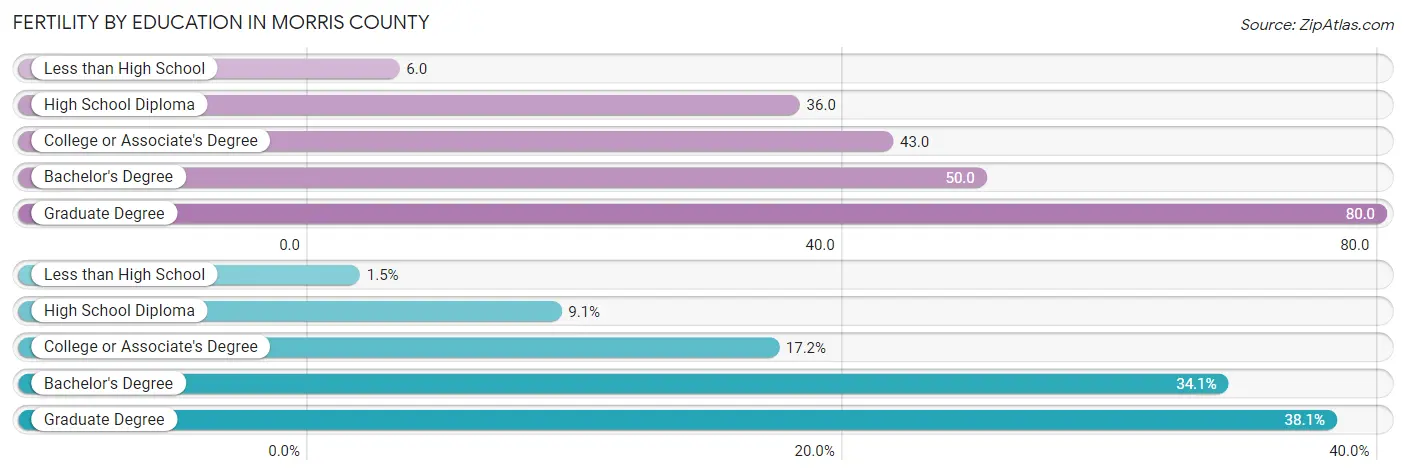
| Educational Attainment | Women with Births | Births / 1,000 Women |
| Less than High School | 82 (1.5%) | 6.0 |
| High School Diploma | 488 (9.1%) | 36.0 |
| College or Associate's Degree | 926 (17.2%) | 43.0 |
| Bachelor's Degree | 1,832 (34.1%) | 50.0 |
| Graduate Degree | 2,050 (38.1%) | 80.0 |
| Total | 5,378 (100.0%) | 48.0 |
Fertility by Education by Marriage Status in Morris County
15.5% of women with births in Morris County are unmarried. Women with the educational attainment of bachelor's degree are most likely to be married with 92.8% of them married at childbirth, while women with the educational attainment of high school diploma are least likely to be married with 47.9% of them unmarried at childbirth.
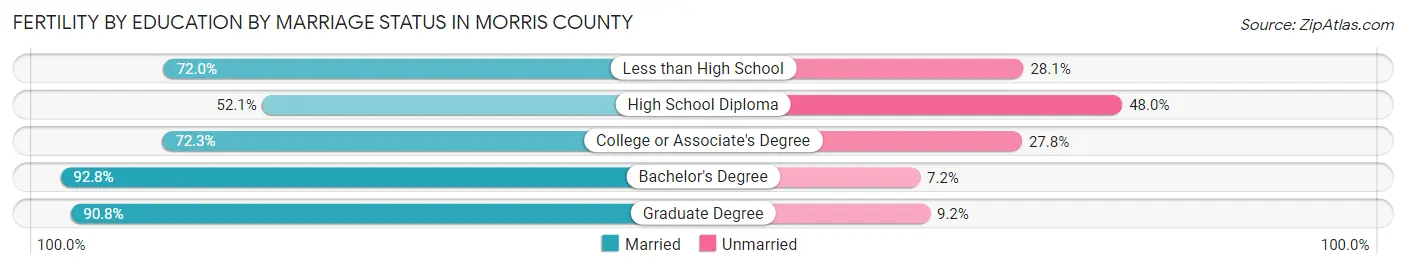
| Educational Attainment | Married | Unmarried |
| Less than High School | 59 (72.0%) | 23 (28.1%) |
| High School Diploma | 254 (52.0%) | 234 (47.9%) |
| College or Associate's Degree | 669 (72.3%) | 257 (27.8%) |
| Bachelor's Degree | 1,700 (92.8%) | 132 (7.2%) |
| Graduate Degree | 1,861 (90.8%) | 189 (9.2%) |
| Total | 4,544 (84.5%) | 834 (15.5%) |
Income in Morris County
Income Overview in Morris County
Per Capita Income in Morris County is $67,555, while median incomes of families and households are $163,598 and $130,808 respectively.
| Characteristic | Number | Measure |
| Per Capita Income | 508,816 | $67,555 |
| Median Family Income | 132,604 | $163,598 |
| Mean Family Income | 132,604 | $211,687 |
| Median Household Income | 189,607 | $130,808 |
| Mean Household Income | 189,607 | $178,045 |
| Income Deficit | 132,604 | $10,262 |
| Wage / Income Gap (%) | 508,816 | 34.09% |
| Wage / Income Gap ($) | 508,816 | 65.91¢ per $1 |
| Gini / Inequality Index | 508,816 | 0.46 |
Earnings by Sex in Morris County
Average Earnings in Morris County are $65,930, $79,402 for men and $52,330 for women, a difference of 34.1%.
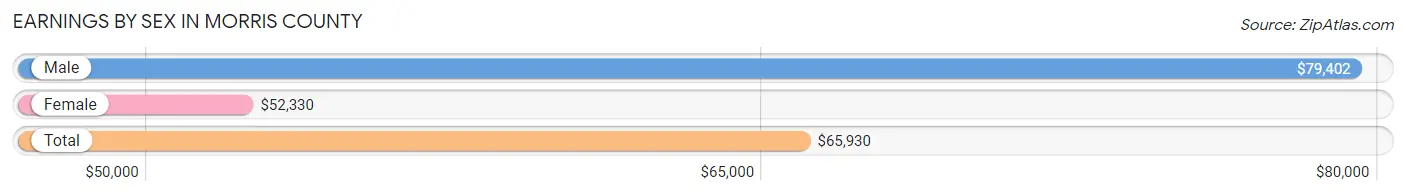
| Sex | Number | Average Earnings |
| Male | 156,756 (53.2%) | $79,402 |
| Female | 138,077 (46.8%) | $52,330 |
| Total | 294,833 (100.0%) | $65,930 |
Earnings by Sex by Income Bracket in Morris County
The most common earnings brackets in Morris County are $100,000+ for men (63,695 | 40.6%) and $100,000+ for women (32,219 | 23.3%).
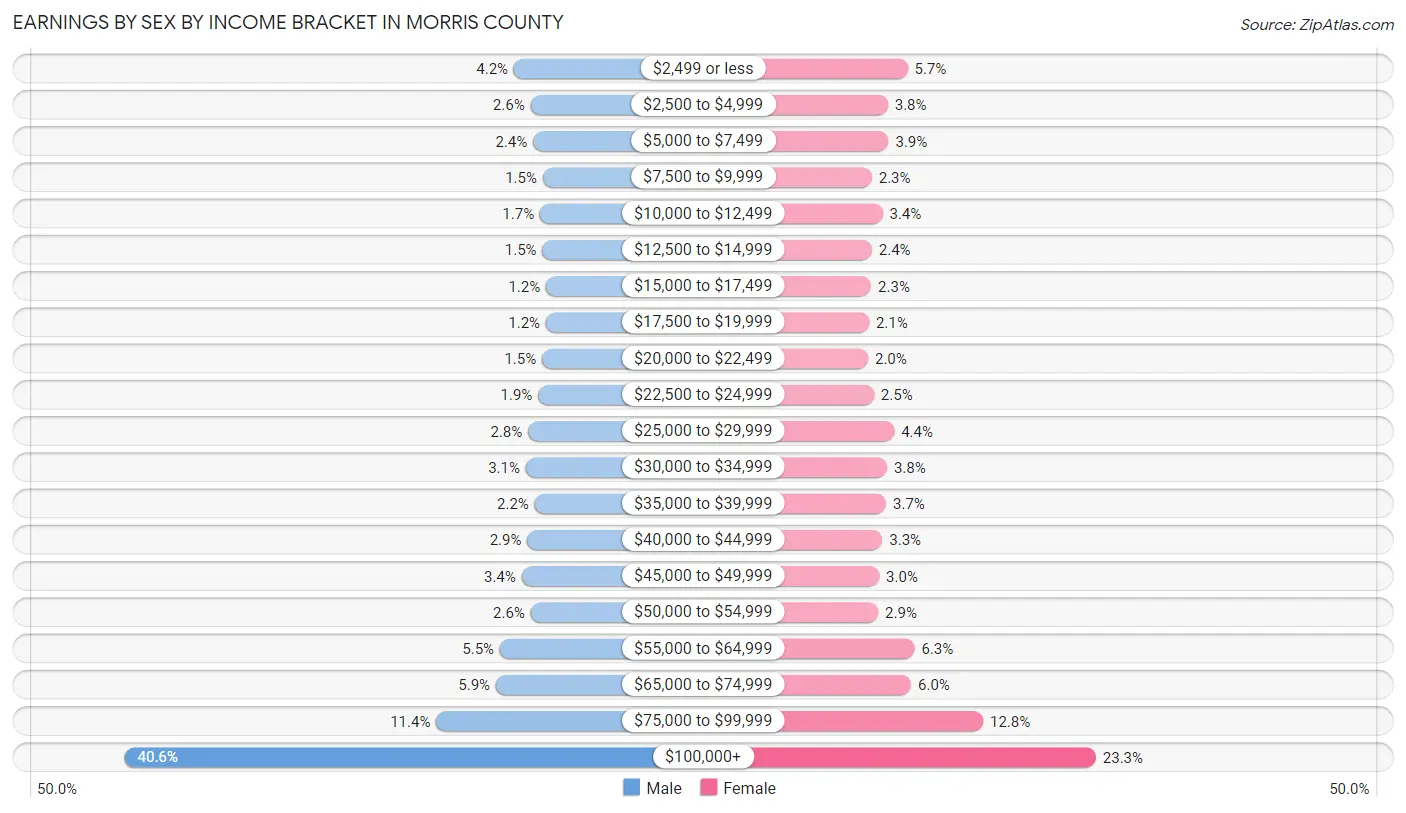
| Income | Male | Female |
| $2,499 or less | 6,526 (4.2%) | 7,857 (5.7%) |
| $2,500 to $4,999 | 4,095 (2.6%) | 5,296 (3.8%) |
| $5,000 to $7,499 | 3,717 (2.4%) | 5,404 (3.9%) |
| $7,500 to $9,999 | 2,289 (1.5%) | 3,231 (2.3%) |
| $10,000 to $12,499 | 2,699 (1.7%) | 4,623 (3.4%) |
| $12,500 to $14,999 | 2,343 (1.5%) | 3,243 (2.4%) |
| $15,000 to $17,499 | 1,802 (1.1%) | 3,150 (2.3%) |
| $17,500 to $19,999 | 1,811 (1.2%) | 2,868 (2.1%) |
| $20,000 to $22,499 | 2,391 (1.5%) | 2,746 (2.0%) |
| $22,500 to $24,999 | 2,965 (1.9%) | 3,504 (2.5%) |
| $25,000 to $29,999 | 4,451 (2.8%) | 6,134 (4.4%) |
| $30,000 to $34,999 | 4,782 (3.0%) | 5,195 (3.8%) |
| $35,000 to $39,999 | 3,484 (2.2%) | 5,079 (3.7%) |
| $40,000 to $44,999 | 4,566 (2.9%) | 4,600 (3.3%) |
| $45,000 to $49,999 | 5,399 (3.4%) | 4,178 (3.0%) |
| $50,000 to $54,999 | 4,064 (2.6%) | 4,065 (2.9%) |
| $55,000 to $64,999 | 8,574 (5.5%) | 8,756 (6.3%) |
| $65,000 to $74,999 | 9,165 (5.9%) | 8,315 (6.0%) |
| $75,000 to $99,999 | 17,938 (11.4%) | 17,614 (12.8%) |
| $100,000+ | 63,695 (40.6%) | 32,219 (23.3%) |
| Total | 156,756 (100.0%) | 138,077 (100.0%) |
Earnings by Sex by Educational Attainment in Morris County
Average earnings in Morris County are $91,515 for men and $61,633 for women, a difference of 32.7%. Men with an educational attainment of graduate degree enjoy the highest average annual earnings of $149,667, while those with less than high school education earn the least with $44,056. Women with an educational attainment of graduate degree earn the most with the average annual earnings of $93,595, while those with less than high school education have the smallest earnings of $22,959.
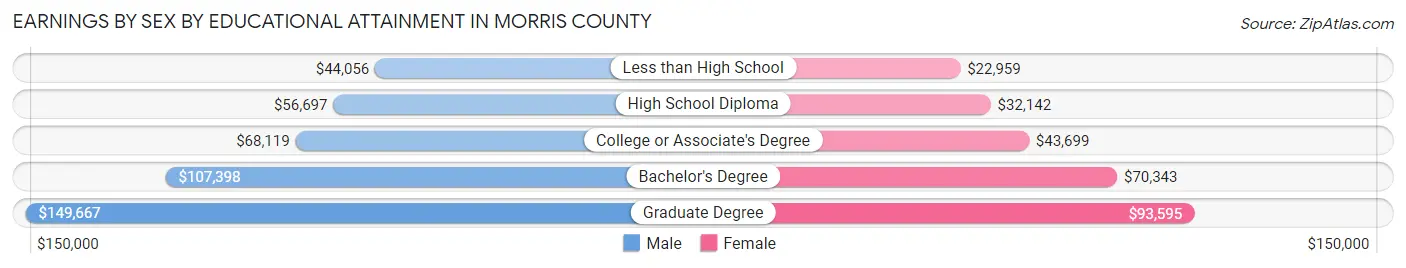
| Educational Attainment | Male Income | Female Income |
| Less than High School | $44,056 | $22,959 |
| High School Diploma | $56,697 | $32,142 |
| College or Associate's Degree | $68,119 | $43,699 |
| Bachelor's Degree | $107,398 | $70,343 |
| Graduate Degree | $149,667 | $93,595 |
| Total | $91,515 | $61,633 |
Family Income in Morris County
Family Income Brackets in Morris County
According to the Morris County family income data, there are 50,787 families falling into the $200,000+ income range, which is the most common income bracket and makes up 38.3% of all families. Conversely, the $10,000 to $14,999 income bracket is the least frequent group with only 1,193 families (0.9%) belonging to this category.
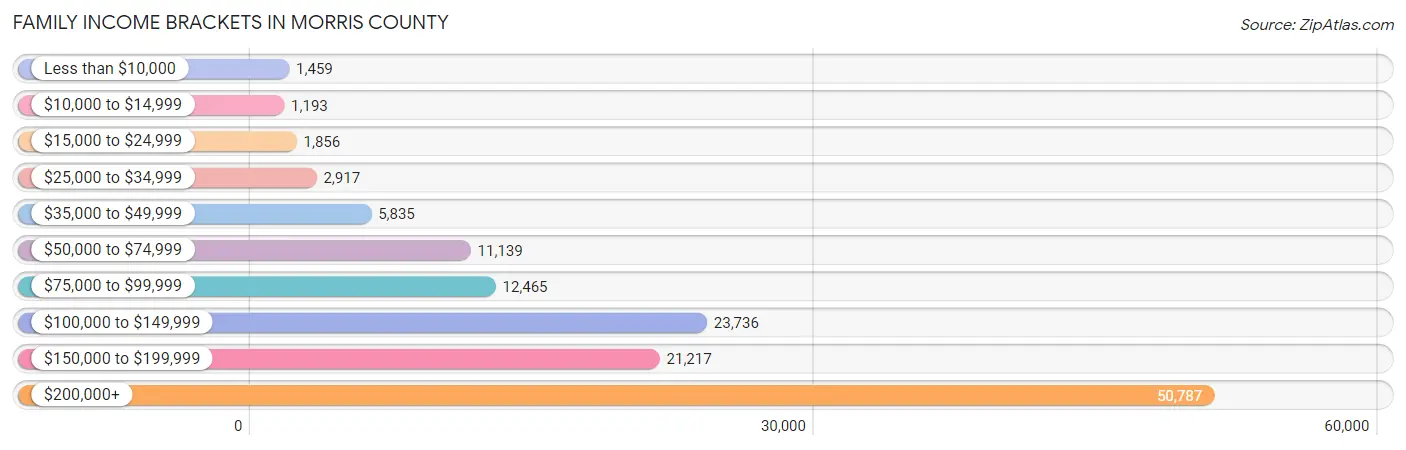
| Income Bracket | # Families | % Families |
| Less than $10,000 | 1,459 | 1.1% |
| $10,000 to $14,999 | 1,193 | 0.9% |
| $15,000 to $24,999 | 1,856 | 1.4% |
| $25,000 to $34,999 | 2,917 | 2.2% |
| $35,000 to $49,999 | 5,835 | 4.4% |
| $50,000 to $74,999 | 11,139 | 8.4% |
| $75,000 to $99,999 | 12,465 | 9.4% |
| $100,000 to $149,999 | 23,736 | 17.9% |
| $150,000 to $199,999 | 21,217 | 16.0% |
| $200,000+ | 50,787 | 38.3% |
Family Income by Famaliy Size in Morris County
7+ person families (1,069 | 0.8%) account for the highest median family income in Morris County with $250,001 per family, while 2-person families (54,276 | 40.9%) have the highest median income of $63,788 per family member.
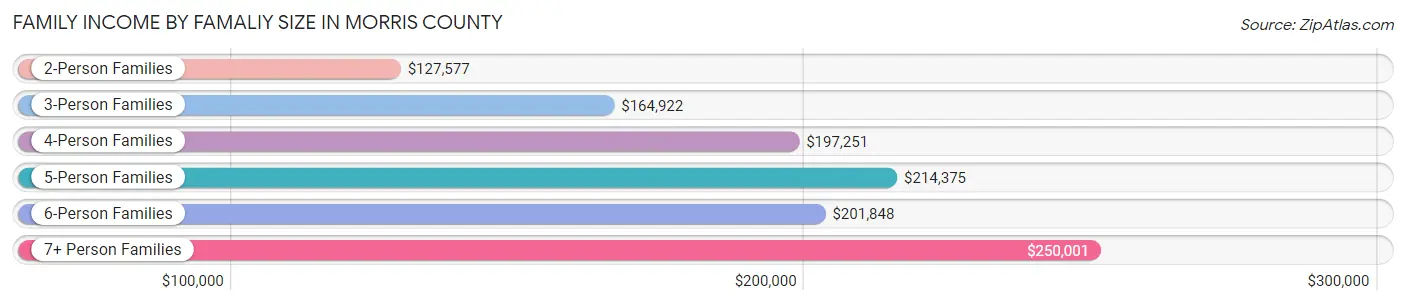
| Income Bracket | # Families | Median Income |
| 2-Person Families | 54,276 (40.9%) | $127,577 |
| 3-Person Families | 32,103 (24.2%) | $164,922 |
| 4-Person Families | 30,235 (22.8%) | $197,251 |
| 5-Person Families | 11,399 (8.6%) | $214,375 |
| 6-Person Families | 3,522 (2.7%) | $201,848 |
| 7+ Person Families | 1,069 (0.8%) | $250,001 |
| Total | 132,604 (100.0%) | $163,598 |
Family Income by Number of Earners in Morris County
The median family income in Morris County is $163,598, with families comprising 3+ earners (20,773) having the highest median family income of $213,482, while families with no earners (13,947) have the lowest median family income of $83,313, accounting for 15.7% and 10.5% of families, respectively.
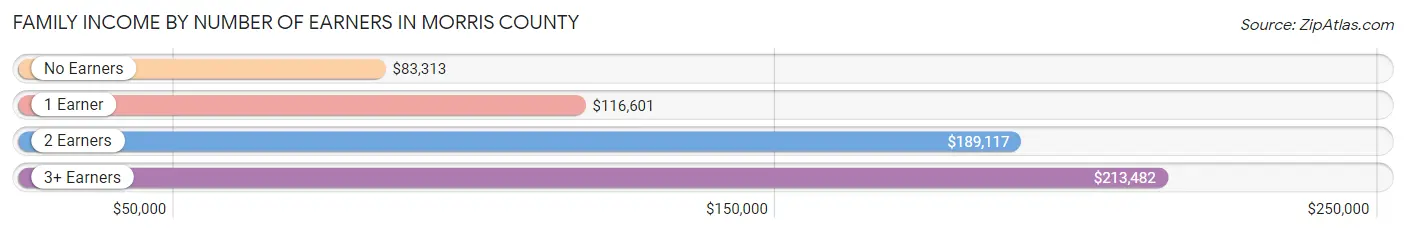
| Number of Earners | # Families | Median Income |
| No Earners | 13,947 (10.5%) | $83,313 |
| 1 Earner | 35,736 (27.0%) | $116,601 |
| 2 Earners | 62,148 (46.9%) | $189,117 |
| 3+ Earners | 20,773 (15.7%) | $213,482 |
| Total | 132,604 (100.0%) | $163,598 |
Household Income in Morris County
Household Income Brackets in Morris County
With 56,503 households falling in the category, the $200,000+ income range is the most frequent in Morris County, accounting for 29.8% of all households. In contrast, only 2,844 households (1.5%) fall into the $10,000 to $14,999 income bracket, making it the least populous group.
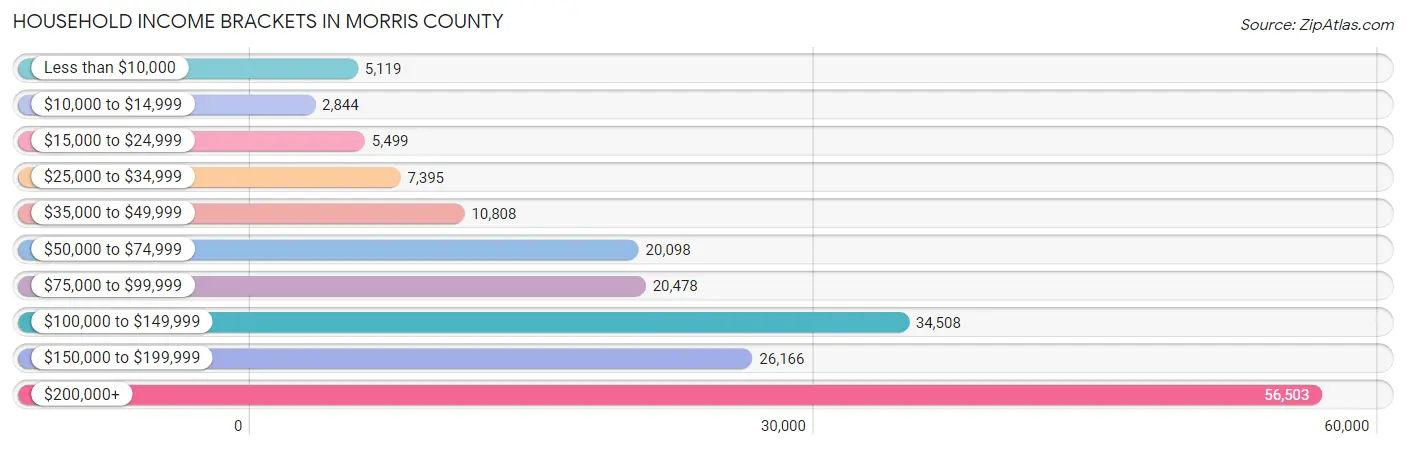
| Income Bracket | # Households | % Households |
| Less than $10,000 | 5,119 | 2.7% |
| $10,000 to $14,999 | 2,844 | 1.5% |
| $15,000 to $24,999 | 5,499 | 2.9% |
| $25,000 to $34,999 | 7,395 | 3.9% |
| $35,000 to $49,999 | 10,808 | 5.7% |
| $50,000 to $74,999 | 20,098 | 10.6% |
| $75,000 to $99,999 | 20,478 | 10.8% |
| $100,000 to $149,999 | 34,508 | 18.2% |
| $150,000 to $199,999 | 26,166 | 13.8% |
| $200,000+ | 56,503 | 29.8% |
Household Income by Householder Age in Morris County
The median household income in Morris County is $130,808, with the highest median household income of $163,973 found in the 45 to 64 years age bracket for the primary householder. A total of 82,109 households (43.3%) fall into this category. Meanwhile, the 15 to 24 years age bracket for the primary householder has the lowest median household income of $85,508, with 2,059 households (1.1%) in this group.

| Income Bracket | # Households | Median Income |
| 15 to 24 Years | 2,059 (1.1%) | $85,508 |
| 25 to 44 Years | 52,823 (27.9%) | $140,890 |
| 45 to 64 Years | 82,109 (43.3%) | $163,973 |
| 65+ Years | 52,616 (27.8%) | $85,541 |
| Total | 189,607 (100.0%) | $130,808 |
Poverty in Morris County
Income Below Poverty by Sex and Age in Morris County
With 4.4% poverty level for males and 5.5% for females among the residents of Morris County, 5 year old males and 75 year old and over females are the most vulnerable to poverty, with 254 males (9.4%) and 1,939 females (8.7%) in their respective age groups living below the poverty level.
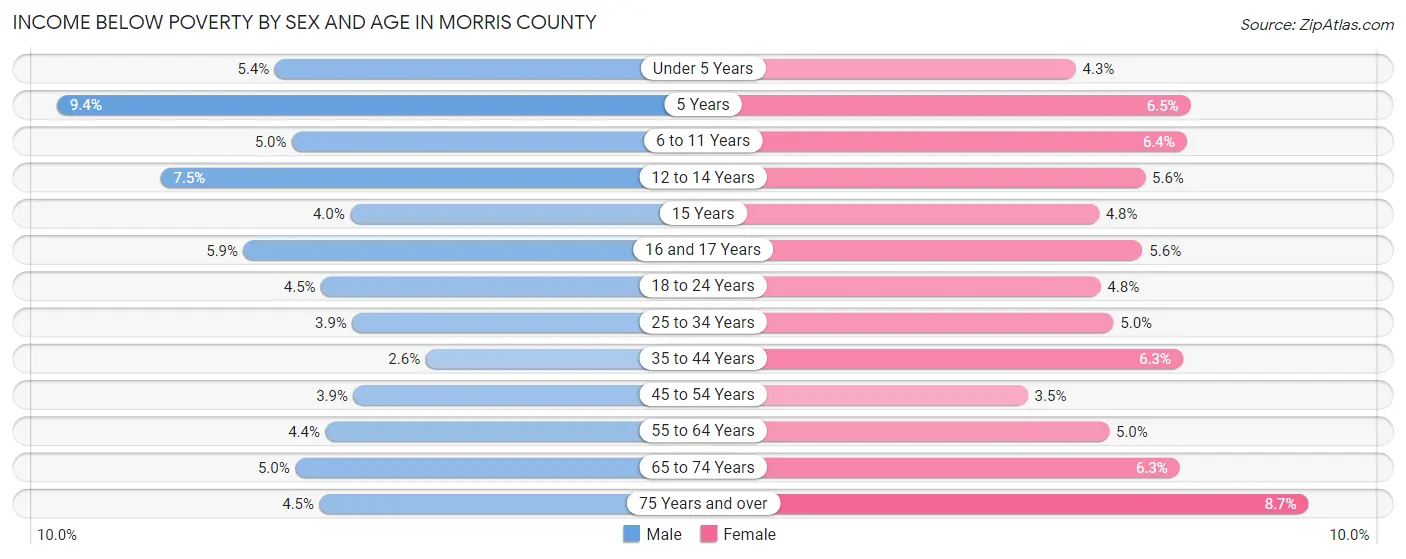
| Age Bracket | Male | Female |
| Under 5 Years | 682 (5.3%) | 519 (4.3%) |
| 5 Years | 254 (9.4%) | 164 (6.5%) |
| 6 to 11 Years | 897 (5.0%) | 1,047 (6.4%) |
| 12 to 14 Years | 740 (7.5%) | 537 (5.6%) |
| 15 Years | 145 (4.0%) | 156 (4.8%) |
| 16 and 17 Years | 422 (5.9%) | 384 (5.6%) |
| 18 to 24 Years | 931 (4.5%) | 940 (4.8%) |
| 25 to 34 Years | 1,131 (3.9%) | 1,371 (5.0%) |
| 35 to 44 Years | 824 (2.5%) | 2,007 (6.3%) |
| 45 to 54 Years | 1,421 (3.9%) | 1,276 (3.5%) |
| 55 to 64 Years | 1,654 (4.4%) | 1,888 (5.0%) |
| 65 to 74 Years | 1,158 (5.0%) | 1,618 (6.3%) |
| 75 Years and over | 695 (4.5%) | 1,939 (8.7%) |
| Total | 10,954 (4.4%) | 13,846 (5.5%) |
Income Above Poverty by Sex and Age in Morris County
According to the poverty statistics in Morris County, males aged 35 to 44 years and females aged 45 to 54 years are the age groups that are most secure financially, with 97.5% of males and 96.6% of females in these age groups living above the poverty line.
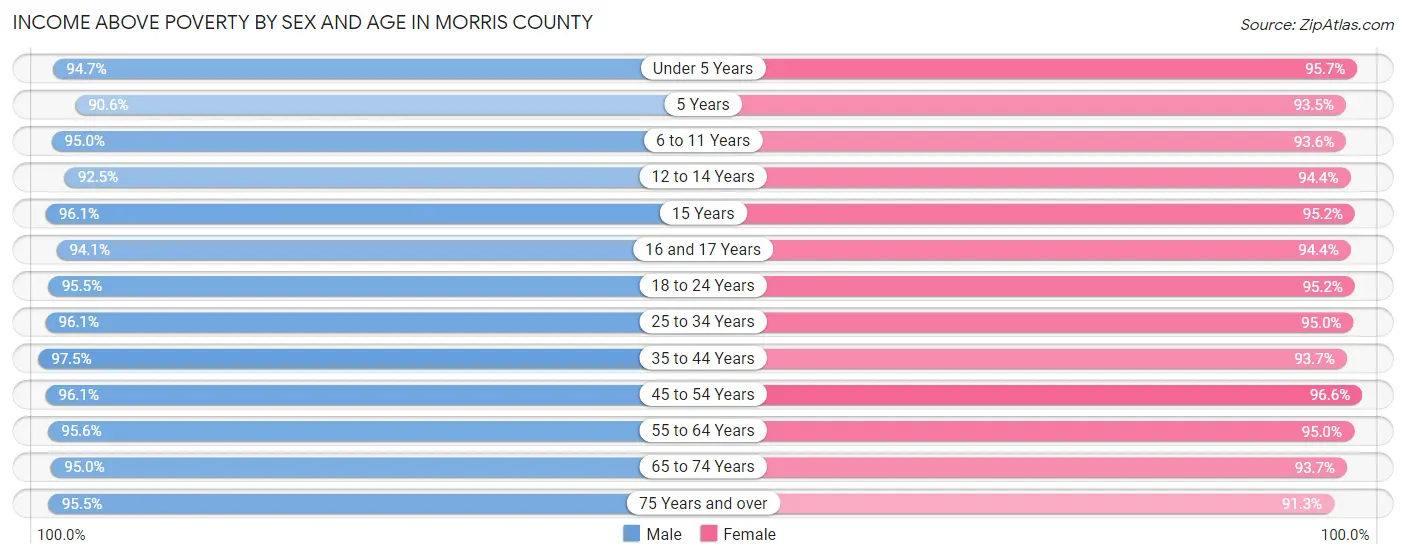
| Age Bracket | Male | Female |
| Under 5 Years | 12,054 (94.7%) | 11,439 (95.7%) |
| 5 Years | 2,448 (90.6%) | 2,371 (93.5%) |
| 6 to 11 Years | 16,939 (95.0%) | 15,316 (93.6%) |
| 12 to 14 Years | 9,157 (92.5%) | 8,998 (94.4%) |
| 15 Years | 3,528 (96.1%) | 3,113 (95.2%) |
| 16 and 17 Years | 6,697 (94.1%) | 6,498 (94.4%) |
| 18 to 24 Years | 19,787 (95.5%) | 18,659 (95.2%) |
| 25 to 34 Years | 27,768 (96.1%) | 25,853 (95.0%) |
| 35 to 44 Years | 31,444 (97.5%) | 29,689 (93.7%) |
| 45 to 54 Years | 35,132 (96.1%) | 35,674 (96.6%) |
| 55 to 64 Years | 35,892 (95.6%) | 36,199 (95.0%) |
| 65 to 74 Years | 22,155 (95.0%) | 24,195 (93.7%) |
| 75 Years and over | 14,668 (95.5%) | 20,452 (91.3%) |
| Total | 237,669 (95.6%) | 238,456 (94.5%) |
Income Below Poverty Among Married-Couple Families in Morris County
The poverty statistics for married-couple families in Morris County show that 2.0% or 2,221 of the total 110,786 families live below the poverty line. Families with 3 or 4 children have the highest poverty rate of 3.9%, comprising of 294 families. On the other hand, families with no children have the lowest poverty rate of 1.8%, which includes 1,126 families.
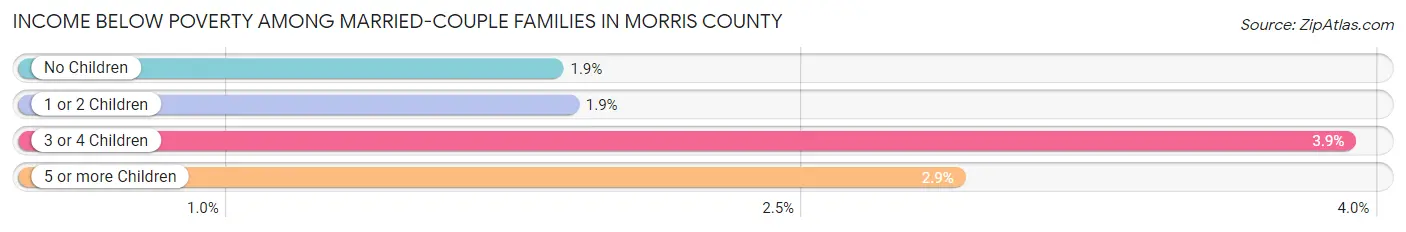
| Children | Above Poverty | Below Poverty |
| No Children | 59,882 (98.2%) | 1,126 (1.8%) |
| 1 or 2 Children | 41,279 (98.1%) | 795 (1.9%) |
| 3 or 4 Children | 7,203 (96.1%) | 294 (3.9%) |
| 5 or more Children | 201 (97.1%) | 6 (2.9%) |
| Total | 108,565 (98.0%) | 2,221 (2.0%) |
Income Below Poverty Among Single-Parent Households in Morris County
According to the poverty data in Morris County, 3.9% or 239 single-father households and 12.0% or 1,893 single-mother households are living below the poverty line. Among single-father households, those with 3 or 4 children have the highest poverty rate, with 19 households (7.3%) experiencing poverty. Likewise, among single-mother households, those with 3 or 4 children have the highest poverty rate, with 256 households (40.1%) falling below the poverty line.
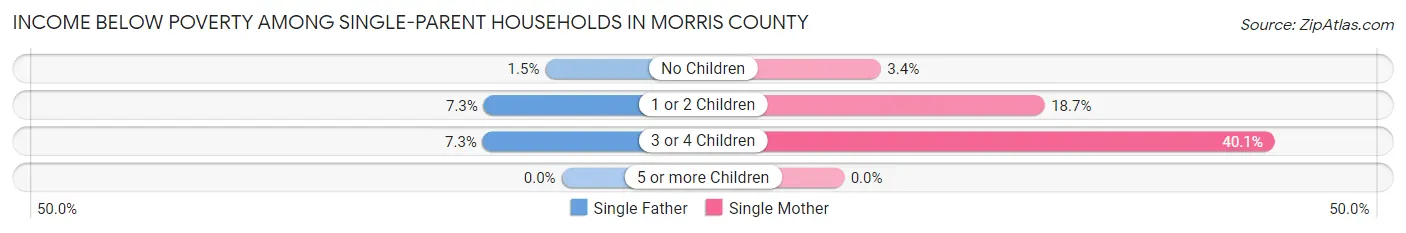
| Children | Single Father | Single Mother |
| No Children | 53 (1.5%) | 266 (3.4%) |
| 1 or 2 Children | 167 (7.2%) | 1,371 (18.7%) |
| 3 or 4 Children | 19 (7.3%) | 256 (40.1%) |
| 5 or more Children | 0 (0.0%) | 0 (0.0%) |
| Total | 239 (3.9%) | 1,893 (12.0%) |
Income Below Poverty Among Married-Couple vs Single-Parent Households in Morris County
The poverty data for Morris County shows that 2,221 of the married-couple family households (2.0%) and 2,132 of the single-parent households (9.8%) are living below the poverty level. Within the married-couple family households, those with 3 or 4 children have the highest poverty rate, with 294 households (3.9%) falling below the poverty line. Among the single-parent households, those with 3 or 4 children have the highest poverty rate, with 275 household (30.7%) living below poverty.
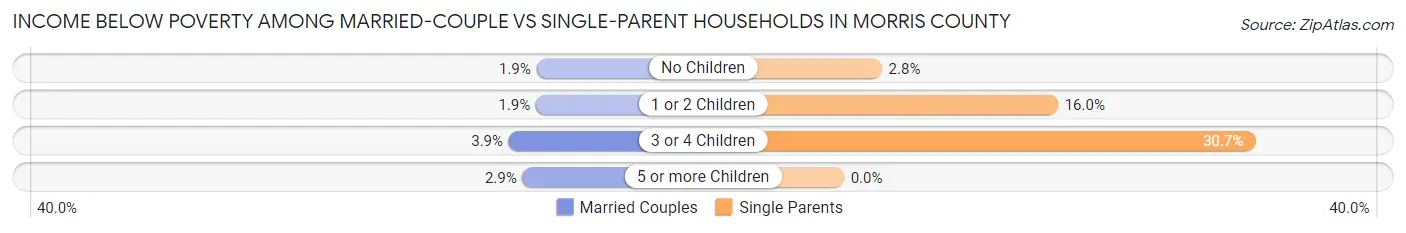
| Children | Married-Couple Families | Single-Parent Households |
| No Children | 1,126 (1.8%) | 319 (2.8%) |
| 1 or 2 Children | 795 (1.9%) | 1,538 (16.0%) |
| 3 or 4 Children | 294 (3.9%) | 275 (30.7%) |
| 5 or more Children | 6 (2.9%) | 0 (0.0%) |
| Total | 2,221 (2.0%) | 2,132 (9.8%) |
Employment Characteristics in Morris County
Employment by Class of Employer in Morris County
Among the 262,320 employed individuals in Morris County, private company employees (186,128 | 71.0%), local government employees (21,602 | 8.2%), and not-for-profit organizations (17,873 | 6.8%) make up the most common classes of employment.
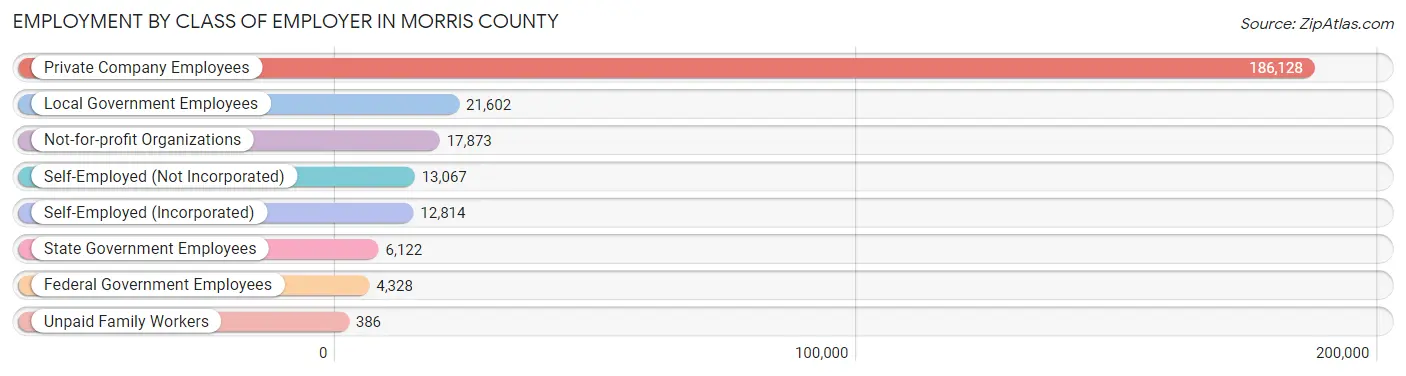
| Employer Class | # Employees | % Employees |
| Private Company Employees | 186,128 | 71.0% |
| Self-Employed (Incorporated) | 12,814 | 4.9% |
| Self-Employed (Not Incorporated) | 13,067 | 5.0% |
| Not-for-profit Organizations | 17,873 | 6.8% |
| Local Government Employees | 21,602 | 8.2% |
| State Government Employees | 6,122 | 2.3% |
| Federal Government Employees | 4,328 | 1.7% |
| Unpaid Family Workers | 386 | 0.2% |
| Total | 262,320 | 100.0% |
Employment Status by Age in Morris County
According to the labor force statistics for Morris County, out of the total population over 16 years of age (417,420), 67.8% or 283,011 individuals are in the labor force, with 5.3% or 15,000 of them unemployed. The age group with the highest labor force participation rate is 25 to 29 years, with 90.9% or 25,027 individuals in the labor force. Within the labor force, the 16 to 19 years age range has the highest percentage of unemployed individuals, with 14.2% or 1,235 of them being unemployed.
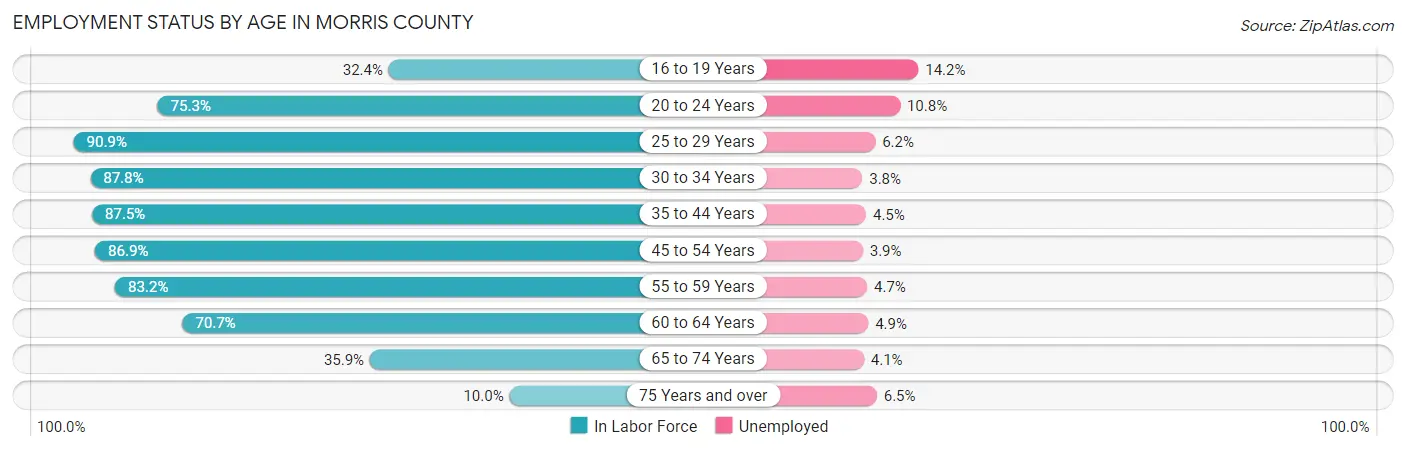
| Age Bracket | In Labor Force | Unemployed |
| 16 to 19 Years | 8,695 (32.4%) | 1,235 (14.2%) |
| 20 to 24 Years | 23,171 (75.3%) | 2,502 (10.8%) |
| 25 to 29 Years | 25,027 (90.9%) | 1,552 (6.2%) |
| 30 to 34 Years | 25,325 (87.8%) | 962 (3.8%) |
| 35 to 44 Years | 56,102 (87.5%) | 2,525 (4.5%) |
| 45 to 54 Years | 64,074 (86.9%) | 2,499 (3.9%) |
| 55 to 59 Years | 33,258 (83.2%) | 1,563 (4.7%) |
| 60 to 64 Years | 25,627 (70.7%) | 1,256 (4.9%) |
| 65 to 74 Years | 17,837 (35.9%) | 731 (4.1%) |
| 75 Years and over | 3,968 (10.0%) | 258 (6.5%) |
| Total | 283,011 (67.8%) | 15,000 (5.3%) |
Employment Status by Educational Attainment in Morris County
According to labor force statistics for Morris County, 84.8% of individuals (229,339) out of the total population between 25 and 64 years of age (270,447) are in the labor force, with 4.5% or 10,320 of them being unemployed. The group with the highest labor force participation rate are those with the educational attainment of bachelor's degree or higher, with 87.7% or 144,904 individuals in the labor force. Within the labor force, individuals with less than high school education have the highest percentage of unemployment, with 7.9% or 654 of them being unemployed.
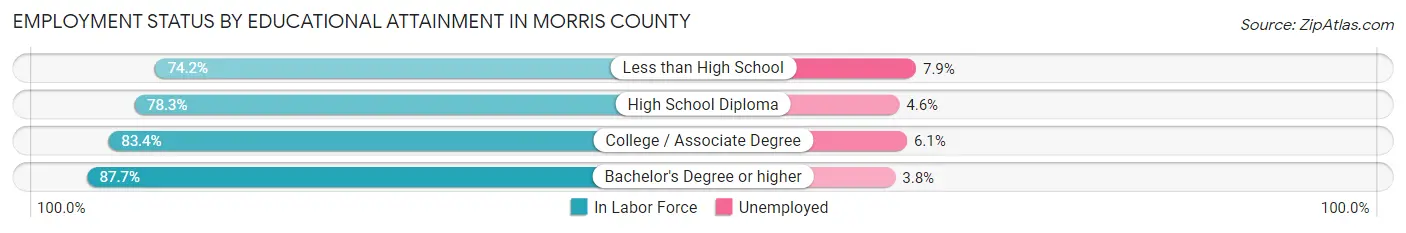
| Educational Attainment | In Labor Force | Unemployed |
| Less than High School | 8,281 (74.2%) | 882 (7.9%) |
| High School Diploma | 33,929 (78.3%) | 1,993 (4.6%) |
| College / Associate Degree | 42,306 (83.4%) | 3,094 (6.1%) |
| Bachelor's Degree or higher | 144,904 (87.7%) | 6,279 (3.8%) |
| Total | 229,339 (84.8%) | 12,170 (4.5%) |
Employment Occupations by Sex in Morris County
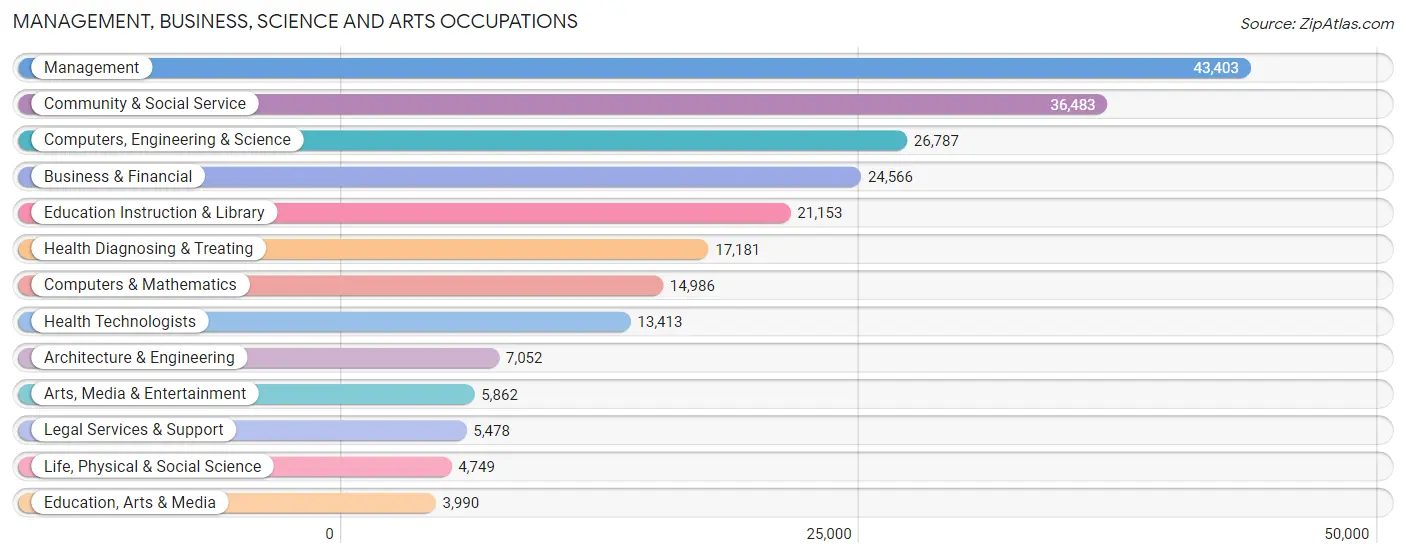
Management, Business, Science and Arts Occupations
The most common Management, Business, Science and Arts occupations in Morris County are Management (43,403 | 16.2%), Community & Social Service (36,483 | 13.6%), Computers, Engineering & Science (26,787 | 10.0%), Business & Financial (24,566 | 9.2%), and Education Instruction & Library (21,153 | 7.9%).
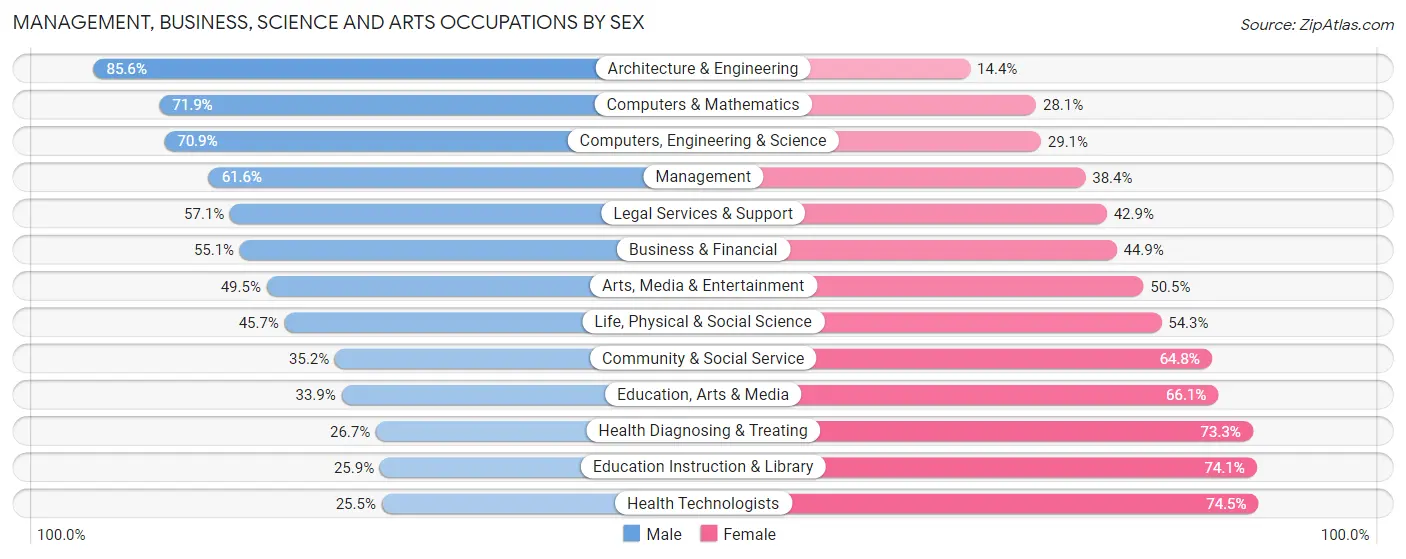
Management, Business, Science and Arts Occupations by Sex
Within the Management, Business, Science and Arts occupations in Morris County, the most male-oriented occupations are Architecture & Engineering (85.6%), Computers & Mathematics (71.9%), and Computers, Engineering & Science (70.9%), while the most female-oriented occupations are Health Technologists (74.5%), Education Instruction & Library (74.1%), and Health Diagnosing & Treating (73.3%).
| Occupation | Male | Female |
| Management | 26,732 (61.6%) | 16,671 (38.4%) |
| Business & Financial | 13,532 (55.1%) | 11,034 (44.9%) |
| Computers, Engineering & Science | 18,980 (70.9%) | 7,807 (29.1%) |
| Computers & Mathematics | 10,771 (71.9%) | 4,215 (28.1%) |
| Architecture & Engineering | 6,037 (85.6%) | 1,015 (14.4%) |
| Life, Physical & Social Science | 2,172 (45.7%) | 2,577 (54.3%) |
| Community & Social Service | 12,853 (35.2%) | 23,630 (64.8%) |
| Education, Arts & Media | 1,352 (33.9%) | 2,638 (66.1%) |
| Legal Services & Support | 3,129 (57.1%) | 2,349 (42.9%) |
| Education Instruction & Library | 5,471 (25.9%) | 15,682 (74.1%) |
| Arts, Media & Entertainment | 2,901 (49.5%) | 2,961 (50.5%) |
| Health Diagnosing & Treating | 4,585 (26.7%) | 12,596 (73.3%) |
| Health Technologists | 3,420 (25.5%) | 9,993 (74.5%) |
| Total (Category) | 76,682 (51.7%) | 71,738 (48.3%) |
| Total (Overall) | 143,797 (53.7%) | 123,977 (46.3%) |
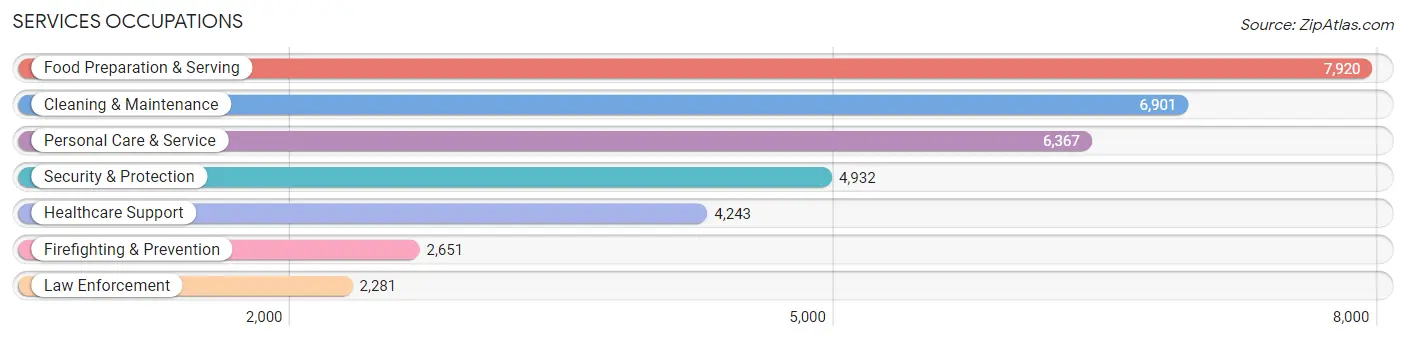
Services Occupations
The most common Services occupations in Morris County are Food Preparation & Serving (7,920 | 3.0%), Cleaning & Maintenance (6,901 | 2.6%), Personal Care & Service (6,367 | 2.4%), Security & Protection (4,932 | 1.8%), and Healthcare Support (4,243 | 1.6%).
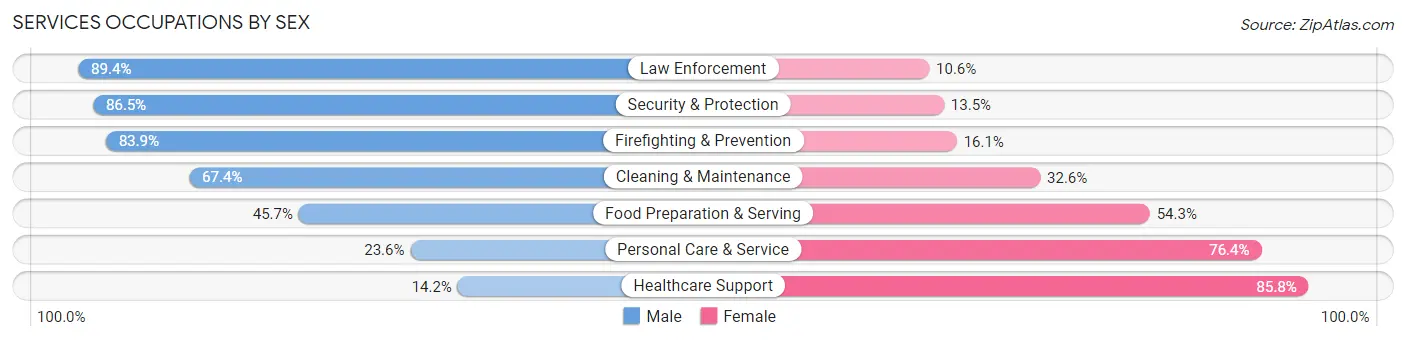
Services Occupations by Sex
Within the Services occupations in Morris County, the most male-oriented occupations are Law Enforcement (89.4%), Security & Protection (86.5%), and Firefighting & Prevention (83.9%), while the most female-oriented occupations are Healthcare Support (85.8%), Personal Care & Service (76.4%), and Food Preparation & Serving (54.3%).
| Occupation | Male | Female |
| Healthcare Support | 604 (14.2%) | 3,639 (85.8%) |
| Security & Protection | 4,264 (86.5%) | 668 (13.5%) |
| Firefighting & Prevention | 2,225 (83.9%) | 426 (16.1%) |
| Law Enforcement | 2,039 (89.4%) | 242 (10.6%) |
| Food Preparation & Serving | 3,620 (45.7%) | 4,300 (54.3%) |
| Cleaning & Maintenance | 4,652 (67.4%) | 2,249 (32.6%) |
| Personal Care & Service | 1,504 (23.6%) | 4,863 (76.4%) |
| Total (Category) | 14,644 (48.2%) | 15,719 (51.8%) |
| Total (Overall) | 143,797 (53.7%) | 123,977 (46.3%) |
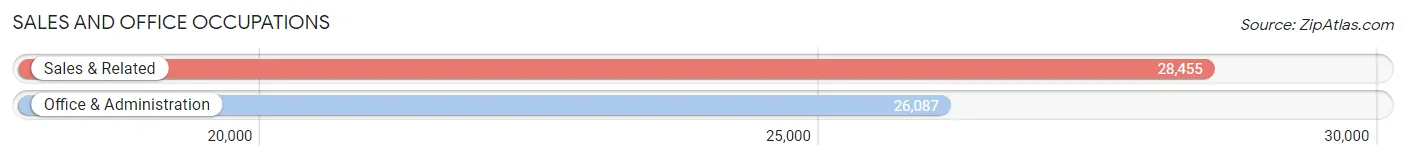
Sales and Office Occupations
The most common Sales and Office occupations in Morris County are Sales & Related (28,455 | 10.6%), and Office & Administration (26,087 | 9.7%).
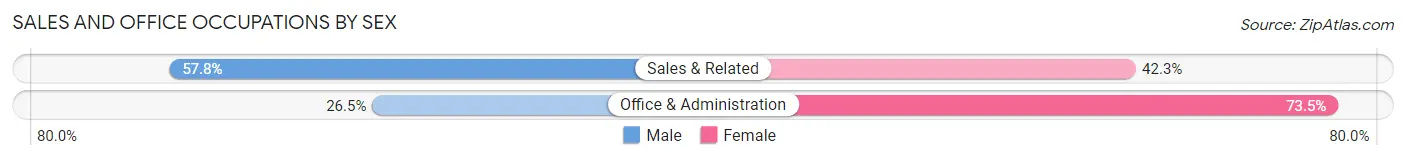
Sales and Office Occupations by Sex
| Occupation | Male | Female |
| Sales & Related | 16,432 (57.8%) | 12,023 (42.2%) |
| Office & Administration | 6,918 (26.5%) | 19,169 (73.5%) |
| Total (Category) | 23,350 (42.8%) | 31,192 (57.2%) |
| Total (Overall) | 143,797 (53.7%) | 123,977 (46.3%) |
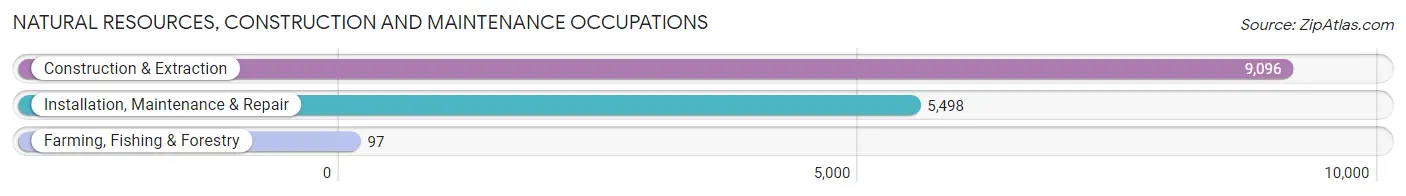
Natural Resources, Construction and Maintenance Occupations
The most common Natural Resources, Construction and Maintenance occupations in Morris County are Construction & Extraction (9,096 | 3.4%), Installation, Maintenance & Repair (5,498 | 2.1%), and Farming, Fishing & Forestry (97 | 0.0%).
Natural Resources, Construction and Maintenance Occupations by Sex
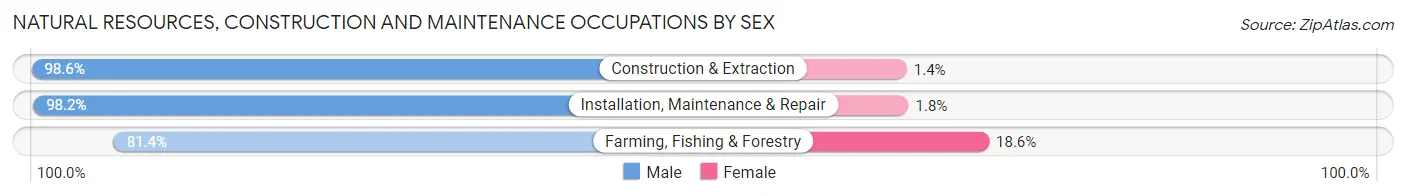
| Occupation | Male | Female |
| Farming, Fishing & Forestry | 79 (81.4%) | 18 (18.6%) |
| Construction & Extraction | 8,965 (98.6%) | 131 (1.4%) |
| Installation, Maintenance & Repair | 5,399 (98.2%) | 99 (1.8%) |
| Total (Category) | 14,443 (98.3%) | 248 (1.7%) |
| Total (Overall) | 143,797 (53.7%) | 123,977 (46.3%) |
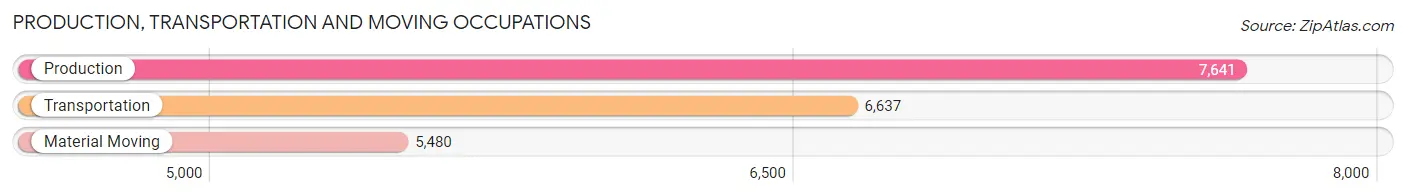
Production, Transportation and Moving Occupations
The most common Production, Transportation and Moving occupations in Morris County are Production (7,641 | 2.9%), Transportation (6,637 | 2.5%), and Material Moving (5,480 | 2.1%).
Production, Transportation and Moving Occupations by Sex
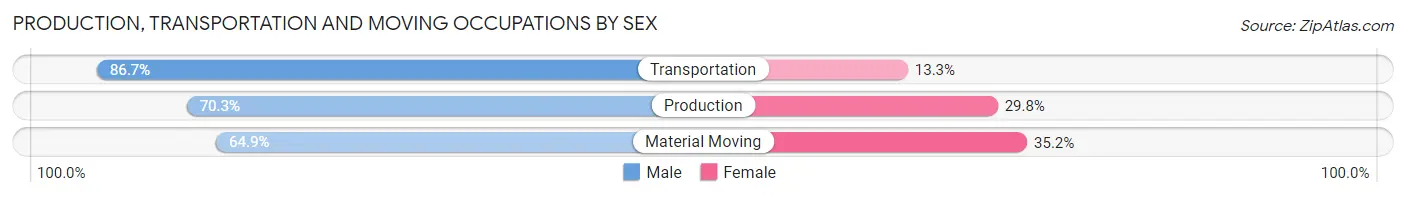
| Occupation | Male | Female |
| Production | 5,368 (70.3%) | 2,273 (29.7%) |
| Transportation | 5,756 (86.7%) | 881 (13.3%) |
| Material Moving | 3,554 (64.8%) | 1,926 (35.1%) |
| Total (Category) | 14,678 (74.3%) | 5,080 (25.7%) |
| Total (Overall) | 143,797 (53.7%) | 123,977 (46.3%) |
Employment Industries by Sex in Morris County
Employment Industries in Morris County
The major employment industries in Morris County include Professional & Scientific (34,792 | 13.0%), Health Care & Social Assistance (31,652 | 11.8%), Manufacturing (29,778 | 11.1%), Educational Services (29,199 | 10.9%), and Retail Trade (26,007 | 9.7%).

Employment Industries by Sex in Morris County
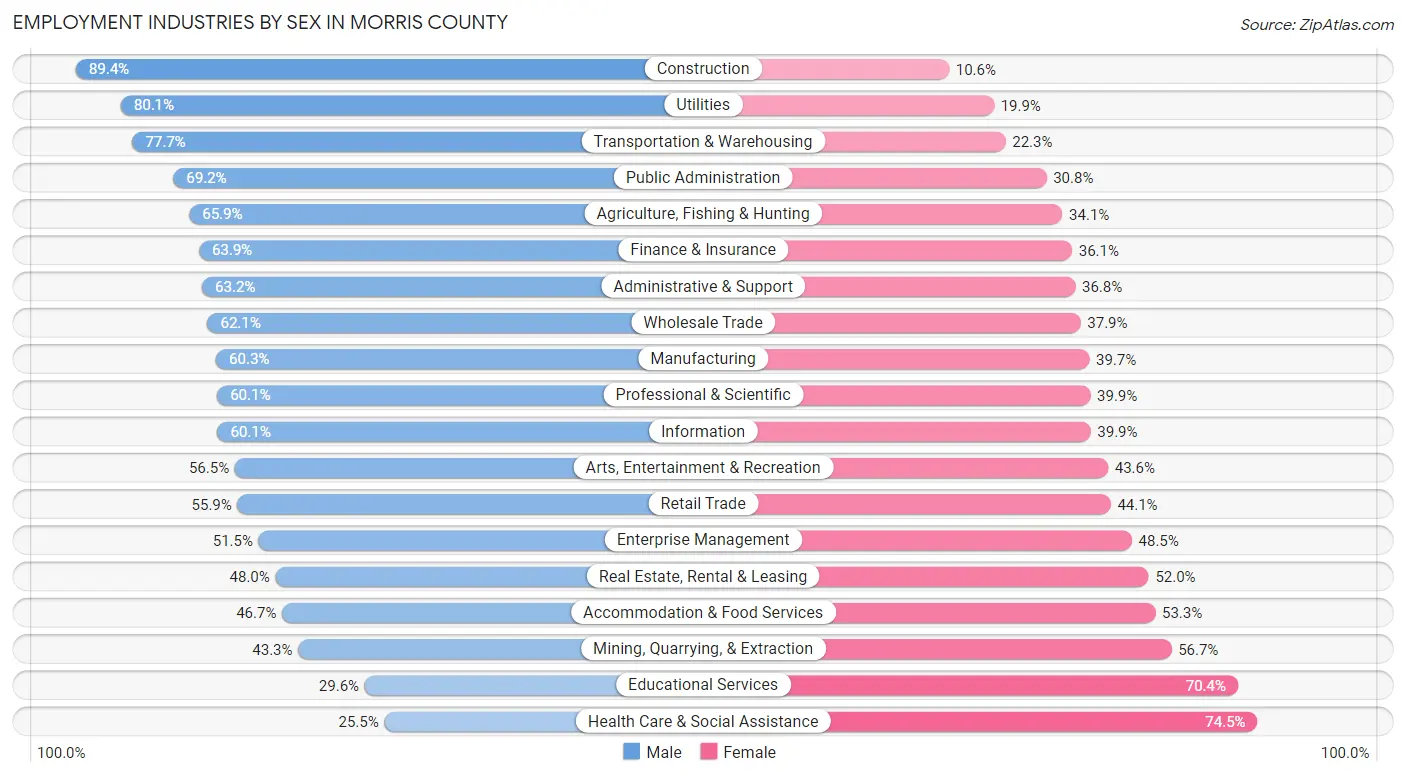
The Morris County industries that see more men than women are Construction (89.4%), Utilities (80.1%), and Transportation & Warehousing (77.7%), whereas the industries that tend to have a higher number of women are Health Care & Social Assistance (74.5%), Educational Services (70.4%), and Mining, Quarrying, & Extraction (56.7%).
| Industry | Male | Female |
| Agriculture, Fishing & Hunting | 257 (65.9%) | 133 (34.1%) |
| Mining, Quarrying, & Extraction | 52 (43.3%) | 68 (56.7%) |
| Construction | 12,514 (89.4%) | 1,489 (10.6%) |
| Manufacturing | 17,968 (60.3%) | 11,810 (39.7%) |
| Wholesale Trade | 4,795 (62.1%) | 2,923 (37.9%) |
| Retail Trade | 14,540 (55.9%) | 11,467 (44.1%) |
| Transportation & Warehousing | 7,239 (77.7%) | 2,080 (22.3%) |
| Utilities | 1,478 (80.1%) | 368 (19.9%) |
| Information | 4,626 (60.1%) | 3,075 (39.9%) |
| Finance & Insurance | 13,618 (63.9%) | 7,691 (36.1%) |
| Real Estate, Rental & Leasing | 2,933 (48.0%) | 3,172 (52.0%) |
| Professional & Scientific | 20,917 (60.1%) | 13,875 (39.9%) |
| Enterprise Management | 388 (51.5%) | 365 (48.5%) |
| Administrative & Support | 6,297 (63.2%) | 3,660 (36.8%) |
| Educational Services | 8,630 (29.6%) | 20,569 (70.4%) |
| Health Care & Social Assistance | 8,071 (25.5%) | 23,581 (74.5%) |
| Arts, Entertainment & Recreation | 3,365 (56.5%) | 2,596 (43.5%) |
| Accommodation & Food Services | 5,796 (46.7%) | 6,622 (53.3%) |
| Public Administration | 6,192 (69.2%) | 2,756 (30.8%) |
| Total | 143,797 (53.7%) | 123,977 (46.3%) |
Education in Morris County
School Enrollment in Morris County
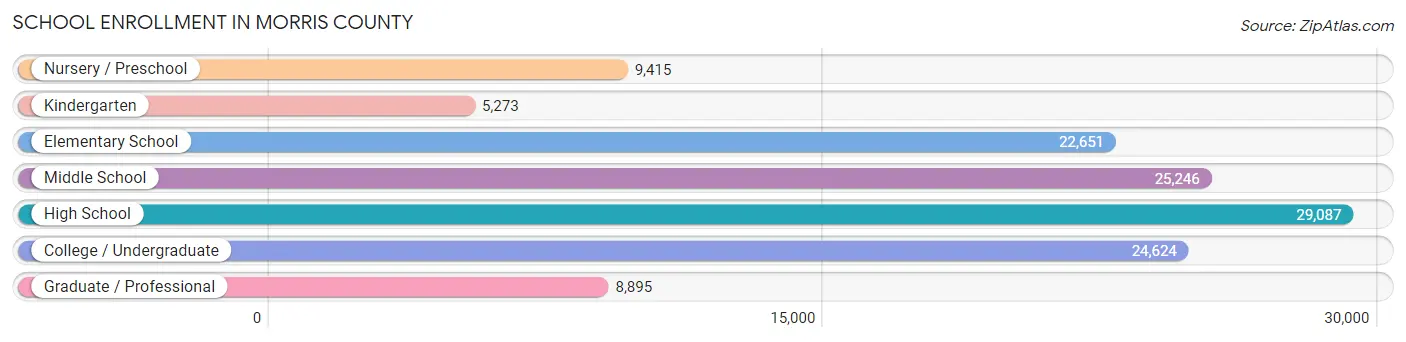
The most common levels of schooling among the 125,191 students in Morris County are high school (29,087 | 23.2%), middle school (25,246 | 20.2%), and college / undergraduate (24,624 | 19.7%).
| School Level | # Students | % Students |
| Nursery / Preschool | 9,415 | 7.5% |
| Kindergarten | 5,273 | 4.2% |
| Elementary School | 22,651 | 18.1% |
| Middle School | 25,246 | 20.2% |
| High School | 29,087 | 23.2% |
| College / Undergraduate | 24,624 | 19.7% |
| Graduate / Professional | 8,895 | 7.1% |
| Total | 125,191 | 100.0% |
School Enrollment by Age by Funding Source in Morris County
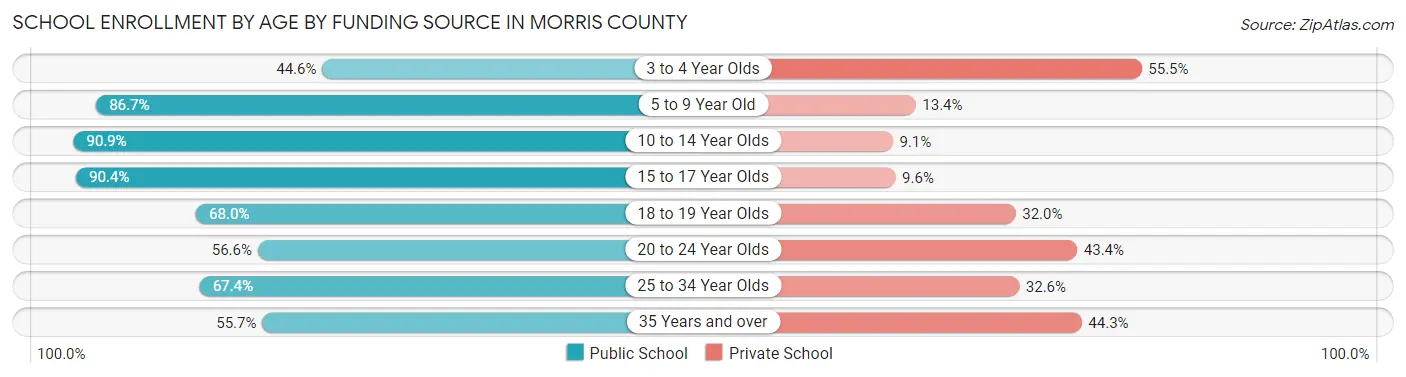
Out of a total of 125,191 students who are enrolled in schools in Morris County, 27,667 (22.1%) attend a private institution, while the remaining 97,524 (77.9%) are enrolled in public schools. The age group of 3 to 4 year olds has the highest likelihood of being enrolled in private schools, with 4,292 (55.4% in the age bracket) enrolled. Conversely, the age group of 10 to 14 year olds has the lowest likelihood of being enrolled in a private school, with 28,669 (90.9% in the age bracket) attending a public institution.
| Age Bracket | Public School | Private School |
| 3 to 4 Year Olds | 3,448 (44.6%) | 4,292 (55.4%) |
| 5 to 9 Year Old | 22,930 (86.7%) | 3,533 (13.4%) |
| 10 to 14 Year Olds | 28,669 (90.9%) | 2,868 (9.1%) |
| 15 to 17 Year Olds | 18,619 (90.4%) | 1,975 (9.6%) |
| 18 to 19 Year Olds | 7,842 (68.0%) | 3,684 (32.0%) |
| 20 to 24 Year Olds | 9,102 (56.6%) | 6,991 (43.4%) |
| 25 to 34 Year Olds | 4,044 (67.4%) | 1,959 (32.6%) |
| 35 Years and over | 2,917 (55.7%) | 2,318 (44.3%) |
| Total | 97,524 (77.9%) | 27,667 (22.1%) |
Educational Attainment by Field of Study in Morris County
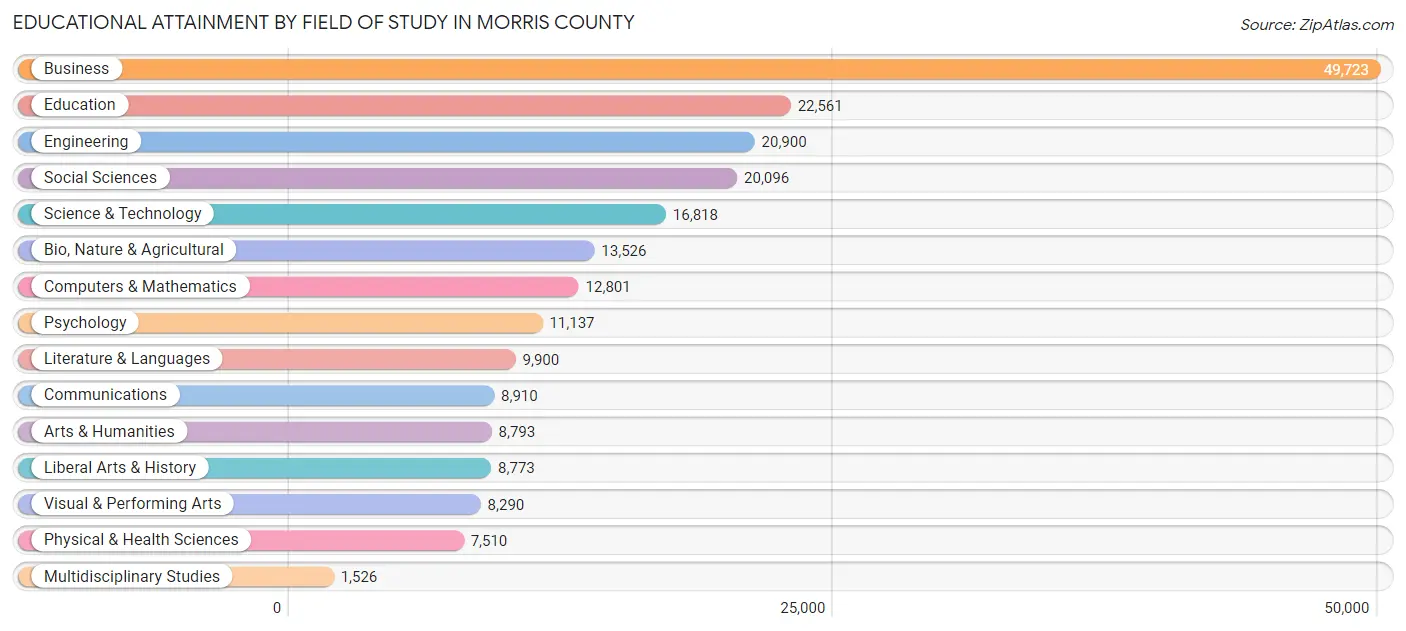
Business (49,723 | 22.5%), education (22,561 | 10.2%), engineering (20,900 | 9.5%), social sciences (20,096 | 9.1%), and science & technology (16,818 | 7.6%) are the most common fields of study among 221,264 individuals in Morris County who have obtained a bachelor's degree or higher.
| Field of Study | # Graduates | % Graduates |
| Computers & Mathematics | 12,801 | 5.8% |
| Bio, Nature & Agricultural | 13,526 | 6.1% |
| Physical & Health Sciences | 7,510 | 3.4% |
| Psychology | 11,137 | 5.0% |
| Social Sciences | 20,096 | 9.1% |
| Engineering | 20,900 | 9.5% |
| Multidisciplinary Studies | 1,526 | 0.7% |
| Science & Technology | 16,818 | 7.6% |
| Business | 49,723 | 22.5% |
| Education | 22,561 | 10.2% |
| Literature & Languages | 9,900 | 4.5% |
| Liberal Arts & History | 8,773 | 4.0% |
| Visual & Performing Arts | 8,290 | 3.7% |
| Communications | 8,910 | 4.0% |
| Arts & Humanities | 8,793 | 4.0% |
| Total | 221,264 | 100.0% |
Transportation & Commute in Morris County
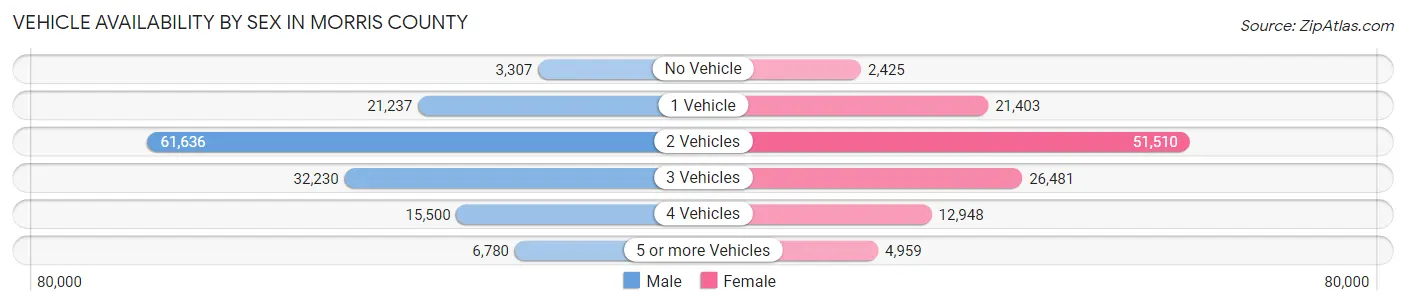
Vehicle Availability by Sex in Morris County
The most prevalent vehicle ownership categories in Morris County are males with 2 vehicles (61,636, accounting for 43.8%) and females with 2 vehicles (51,510, making up 51.5%).
| Vehicles Available | Male | Female |
| No Vehicle | 3,307 (2.4%) | 2,425 (2.0%) |
| 1 Vehicle | 21,237 (15.1%) | 21,403 (17.9%) |
| 2 Vehicles | 61,636 (43.8%) | 51,510 (43.0%) |
| 3 Vehicles | 32,230 (22.9%) | 26,481 (22.1%) |
| 4 Vehicles | 15,500 (11.0%) | 12,948 (10.8%) |
| 5 or more Vehicles | 6,780 (4.8%) | 4,959 (4.1%) |
| Total | 140,690 (100.0%) | 119,726 (100.0%) |
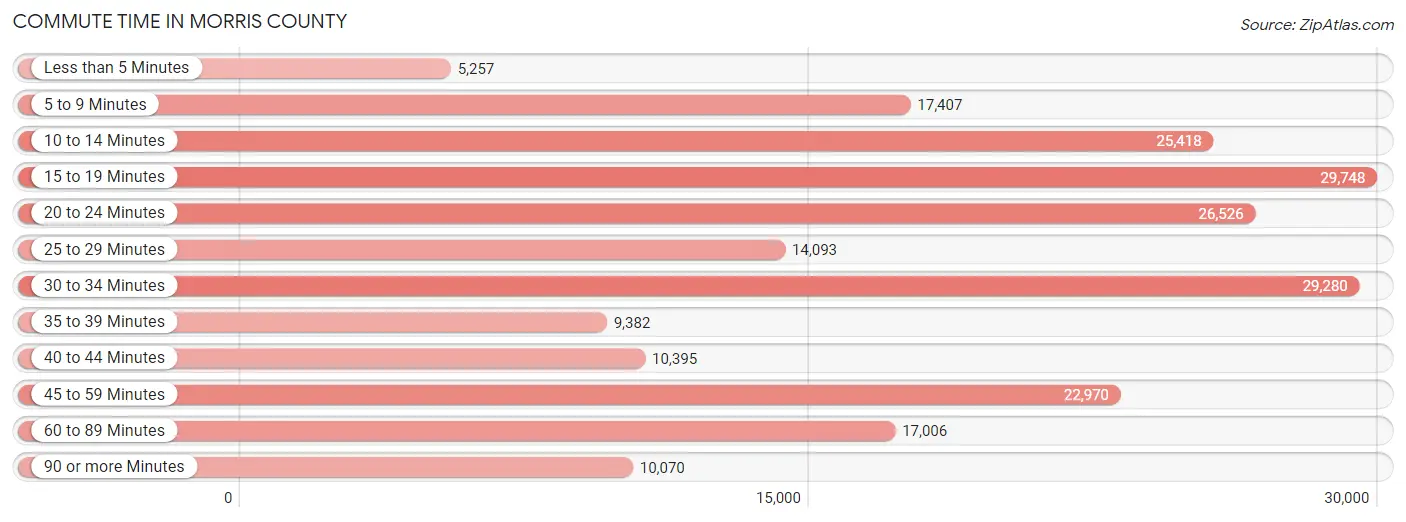
Commute Time in Morris County
The most frequently occuring commute durations in Morris County are 15 to 19 minutes (29,748 commuters, 13.7%), 30 to 34 minutes (29,280 commuters, 13.5%), and 20 to 24 minutes (26,526 commuters, 12.2%).
| Commute Time | # Commuters | % Commuters |
| Less than 5 Minutes | 5,257 | 2.4% |
| 5 to 9 Minutes | 17,407 | 8.0% |
| 10 to 14 Minutes | 25,418 | 11.7% |
| 15 to 19 Minutes | 29,748 | 13.7% |
| 20 to 24 Minutes | 26,526 | 12.2% |
| 25 to 29 Minutes | 14,093 | 6.5% |
| 30 to 34 Minutes | 29,280 | 13.5% |
| 35 to 39 Minutes | 9,382 | 4.3% |
| 40 to 44 Minutes | 10,395 | 4.8% |
| 45 to 59 Minutes | 22,970 | 10.6% |
| 60 to 89 Minutes | 17,006 | 7.8% |
| 90 or more Minutes | 10,070 | 4.6% |
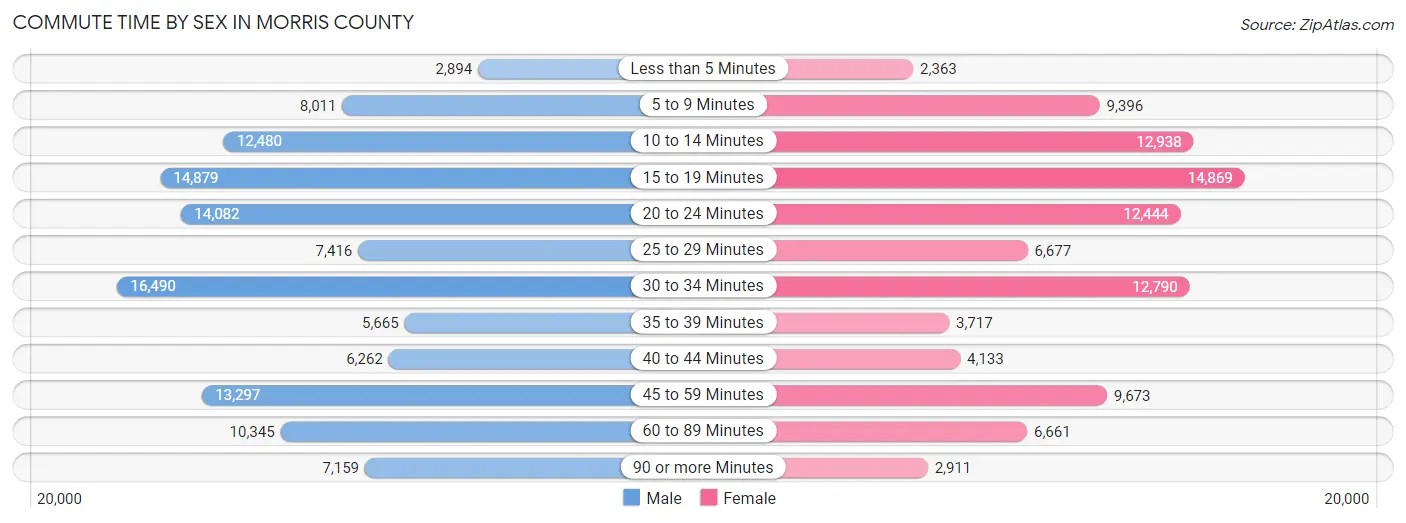
Commute Time by Sex in Morris County
The most common commute times in Morris County are 30 to 34 minutes (16,490 commuters, 13.9%) for males and 15 to 19 minutes (14,869 commuters, 15.1%) for females.
| Commute Time | Male | Female |
| Less than 5 Minutes | 2,894 (2.4%) | 2,363 (2.4%) |
| 5 to 9 Minutes | 8,011 (6.7%) | 9,396 (9.5%) |
| 10 to 14 Minutes | 12,480 (10.5%) | 12,938 (13.1%) |
| 15 to 19 Minutes | 14,879 (12.5%) | 14,869 (15.1%) |
| 20 to 24 Minutes | 14,082 (11.8%) | 12,444 (12.6%) |
| 25 to 29 Minutes | 7,416 (6.2%) | 6,677 (6.8%) |
| 30 to 34 Minutes | 16,490 (13.9%) | 12,790 (13.0%) |
| 35 to 39 Minutes | 5,665 (4.8%) | 3,717 (3.8%) |
| 40 to 44 Minutes | 6,262 (5.3%) | 4,133 (4.2%) |
| 45 to 59 Minutes | 13,297 (11.2%) | 9,673 (9.8%) |
| 60 to 89 Minutes | 10,345 (8.7%) | 6,661 (6.8%) |
| 90 or more Minutes | 7,159 (6.0%) | 2,911 (2.9%) |
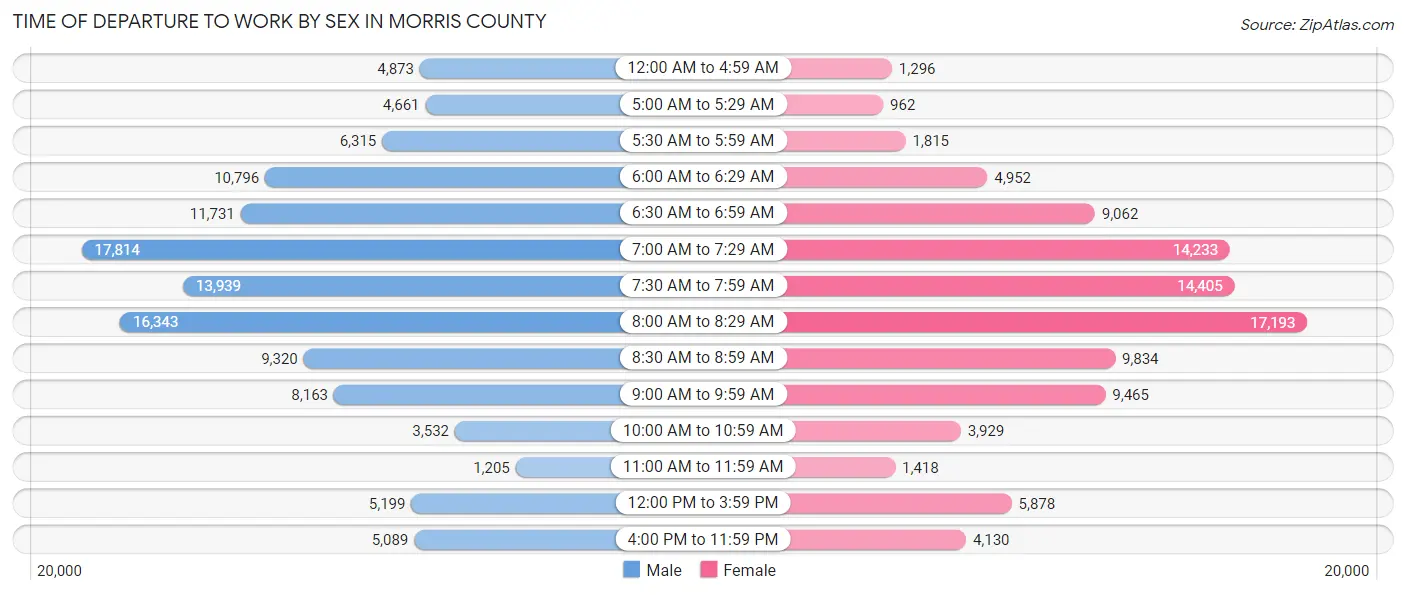
Time of Departure to Work by Sex in Morris County
The most frequent times of departure to work in Morris County are 7:00 AM to 7:29 AM (17,814, 15.0%) for males and 8:00 AM to 8:29 AM (17,193, 17.4%) for females.
| Time of Departure | Male | Female |
| 12:00 AM to 4:59 AM | 4,873 (4.1%) | 1,296 (1.3%) |
| 5:00 AM to 5:29 AM | 4,661 (3.9%) | 962 (1.0%) |
| 5:30 AM to 5:59 AM | 6,315 (5.3%) | 1,815 (1.8%) |
| 6:00 AM to 6:29 AM | 10,796 (9.1%) | 4,952 (5.0%) |
| 6:30 AM to 6:59 AM | 11,731 (9.9%) | 9,062 (9.2%) |
| 7:00 AM to 7:29 AM | 17,814 (15.0%) | 14,233 (14.4%) |
| 7:30 AM to 7:59 AM | 13,939 (11.7%) | 14,405 (14.6%) |
| 8:00 AM to 8:29 AM | 16,343 (13.7%) | 17,193 (17.4%) |
| 8:30 AM to 8:59 AM | 9,320 (7.8%) | 9,834 (10.0%) |
| 9:00 AM to 9:59 AM | 8,163 (6.9%) | 9,465 (9.6%) |
| 10:00 AM to 10:59 AM | 3,532 (3.0%) | 3,929 (4.0%) |
| 11:00 AM to 11:59 AM | 1,205 (1.0%) | 1,418 (1.4%) |
| 12:00 PM to 3:59 PM | 5,199 (4.4%) | 5,878 (6.0%) |
| 4:00 PM to 11:59 PM | 5,089 (4.3%) | 4,130 (4.2%) |
| Total | 118,980 (100.0%) | 98,572 (100.0%) |
Housing Occupancy in Morris County
Occupancy by Ownership in Morris County
Of the total 189,607 dwellings in Morris County, owner-occupied units account for 140,016 (73.9%), while renter-occupied units make up 49,591 (26.2%).
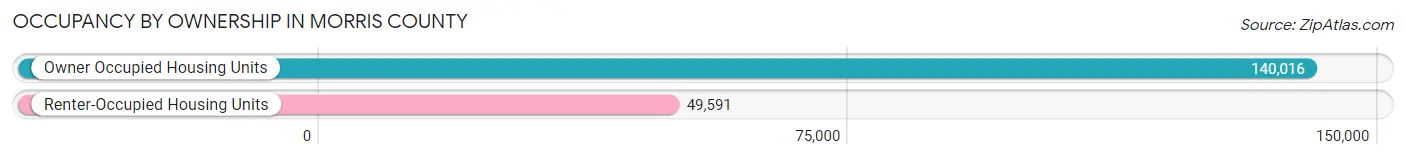
| Occupancy | # Housing Units | % Housing Units |
| Owner Occupied Housing Units | 140,016 | 73.9% |
| Renter-Occupied Housing Units | 49,591 | 26.2% |
| Total Occupied Housing Units | 189,607 | 100.0% |
Occupancy by Household Size in Morris County
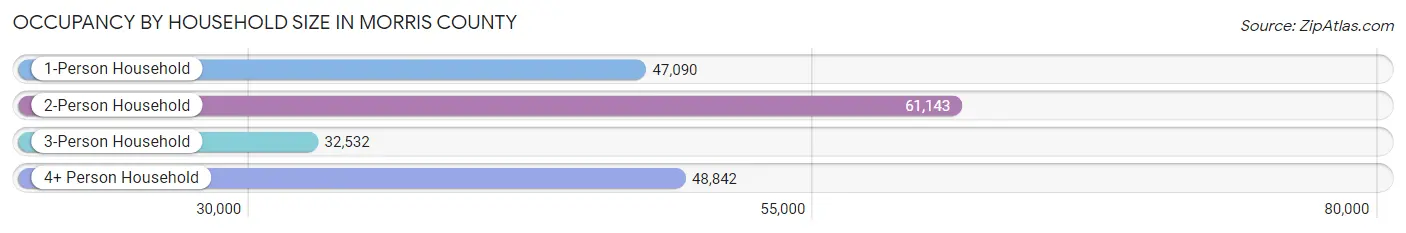
| Household Size | # Housing Units | % Housing Units |
| 1-Person Household | 47,090 | 24.8% |
| 2-Person Household | 61,143 | 32.3% |
| 3-Person Household | 32,532 | 17.2% |
| 4+ Person Household | 48,842 | 25.8% |
| Total Housing Units | 189,607 | 100.0% |
Occupancy by Ownership by Household Size in Morris County
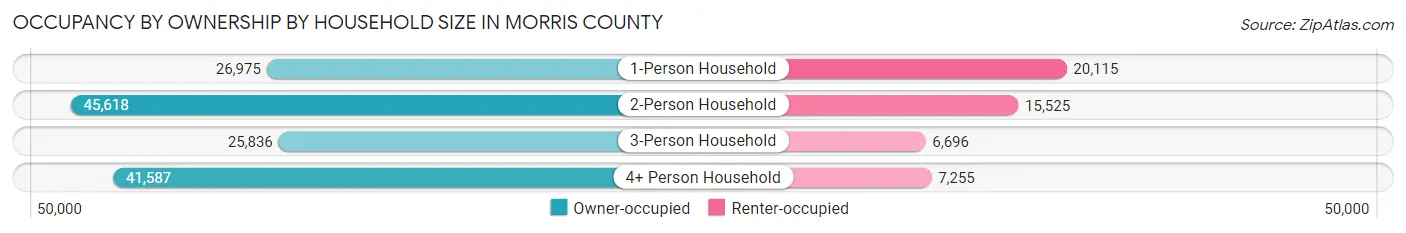
| Household Size | Owner-occupied | Renter-occupied |
| 1-Person Household | 26,975 (57.3%) | 20,115 (42.7%) |
| 2-Person Household | 45,618 (74.6%) | 15,525 (25.4%) |
| 3-Person Household | 25,836 (79.4%) | 6,696 (20.6%) |
| 4+ Person Household | 41,587 (85.2%) | 7,255 (14.8%) |
| Total Housing Units | 140,016 (73.9%) | 49,591 (26.2%) |
Occupancy by Educational Attainment in Morris County
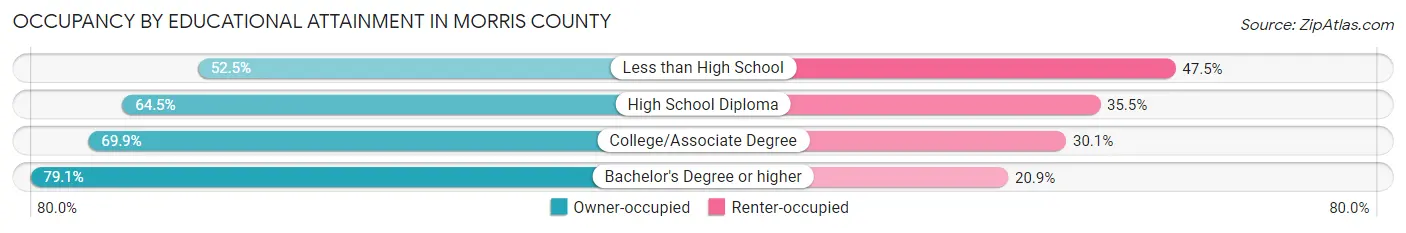
| Household Size | Owner-occupied | Renter-occupied |
| Less than High School | 3,680 (52.5%) | 3,324 (47.5%) |
| High School Diploma | 20,556 (64.5%) | 11,319 (35.5%) |
| College/Associate Degree | 25,927 (69.9%) | 11,177 (30.1%) |
| Bachelor's Degree or higher | 89,853 (79.1%) | 23,771 (20.9%) |
Occupancy by Age of Householder in Morris County
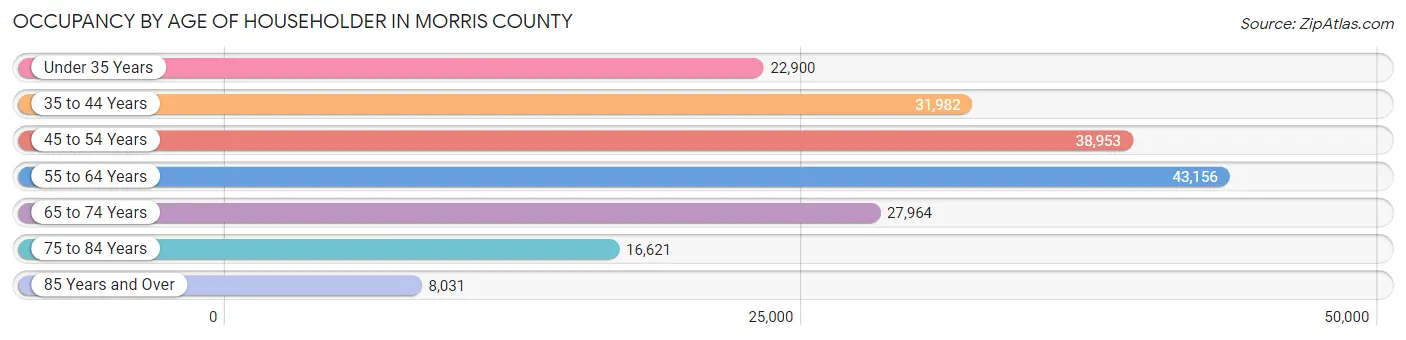
| Age Bracket | # Households | % Households |
| Under 35 Years | 22,900 | 12.1% |
| 35 to 44 Years | 31,982 | 16.9% |
| 45 to 54 Years | 38,953 | 20.5% |
| 55 to 64 Years | 43,156 | 22.8% |
| 65 to 74 Years | 27,964 | 14.7% |
| 75 to 84 Years | 16,621 | 8.8% |
| 85 Years and Over | 8,031 | 4.2% |
| Total | 189,607 | 100.0% |
Housing Finances in Morris County
Median Income by Occupancy in Morris County
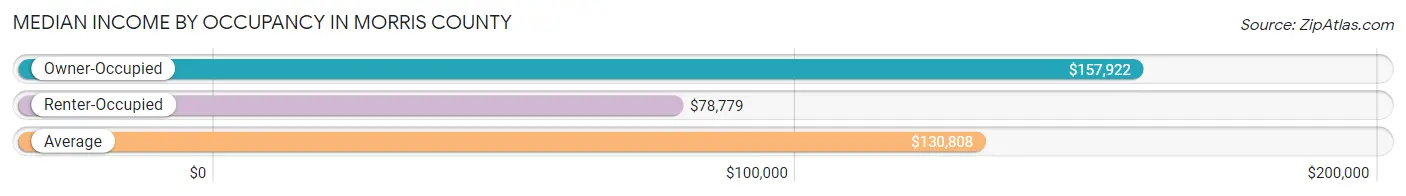
| Occupancy Type | # Households | Median Income |
| Owner-Occupied | 140,016 (73.9%) | $157,922 |
| Renter-Occupied | 49,591 (26.2%) | $78,779 |
| Average | 189,607 (100.0%) | $130,808 |
Occupancy by Householder Income Bracket in Morris County
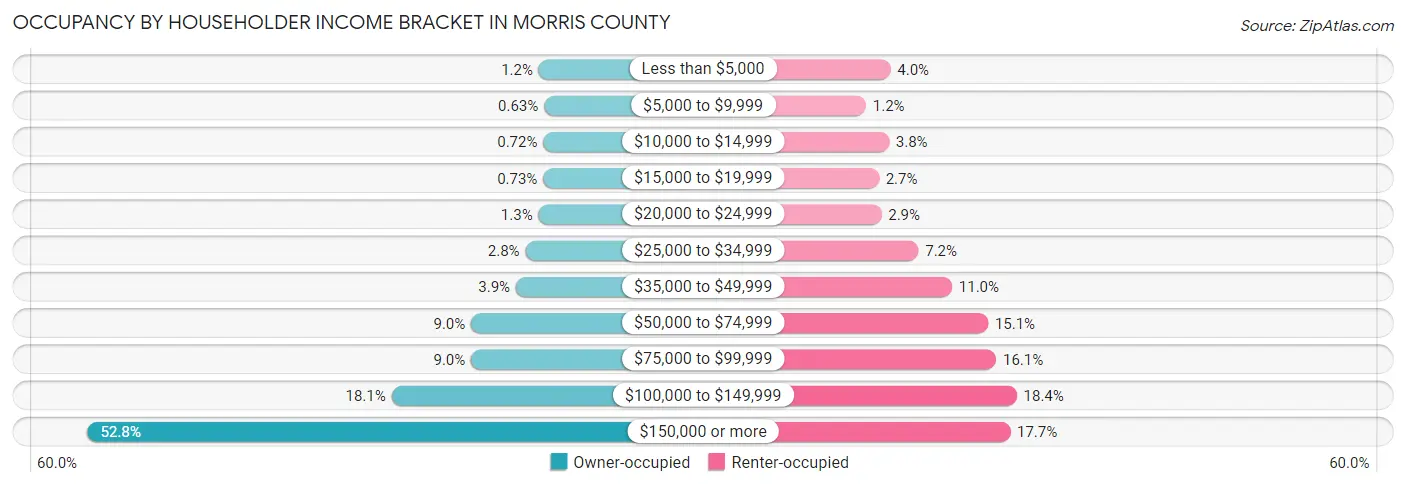
| Income Bracket | Owner-occupied | Renter-occupied |
| Less than $5,000 | 1,724 (1.2%) | 1,973 (4.0%) |
| $5,000 to $9,999 | 878 (0.6%) | 587 (1.2%) |
| $10,000 to $14,999 | 1,011 (0.7%) | 1,888 (3.8%) |
| $15,000 to $19,999 | 1,027 (0.7%) | 1,314 (2.6%) |
| $20,000 to $24,999 | 1,773 (1.3%) | 1,460 (2.9%) |
| $25,000 to $34,999 | 3,867 (2.8%) | 3,556 (7.2%) |
| $35,000 to $49,999 | 5,394 (3.8%) | 5,459 (11.0%) |
| $50,000 to $74,999 | 12,553 (9.0%) | 7,505 (15.1%) |
| $75,000 to $99,999 | 12,555 (9.0%) | 7,963 (16.1%) |
| $100,000 to $149,999 | 25,285 (18.1%) | 9,129 (18.4%) |
| $150,000 or more | 73,949 (52.8%) | 8,757 (17.7%) |
| Total | 140,016 (100.0%) | 49,591 (100.0%) |
Monthly Housing Cost Tiers in Morris County

| Monthly Cost | Owner-occupied | Renter-occupied |
| Less than $300 | 697 (0.5%) | 1,126 (2.3%) |
| $300 to $499 | 1,039 (0.7%) | 1,327 (2.7%) |
| $500 to $799 | 3,563 (2.5%) | 748 (1.5%) |
| $800 to $999 | 5,282 (3.8%) | 1,119 (2.3%) |
| $1,000 to $1,499 | 22,663 (16.2%) | 10,683 (21.5%) |
| $1,500 to $1,999 | 18,644 (13.3%) | 14,311 (28.9%) |
| $2,000 to $2,499 | 16,738 (11.9%) | 8,137 (16.4%) |
| $2,500 to $2,999 | 17,447 (12.5%) | 4,872 (9.8%) |
| $3,000 or more | 53,943 (38.5%) | 5,658 (11.4%) |
| Total | 140,016 (100.0%) | 49,591 (100.0%) |
Physical Housing Characteristics in Morris County
Housing Structures in Morris County
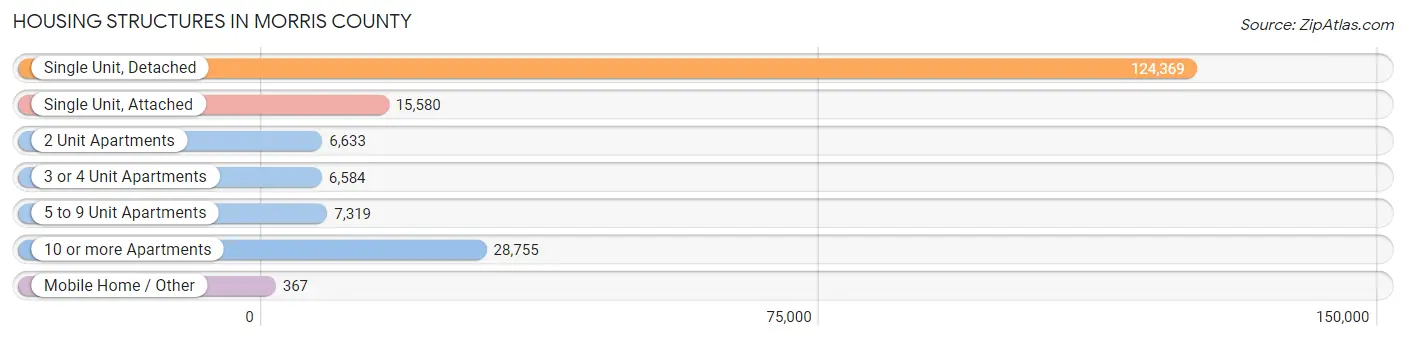
| Structure Type | # Housing Units | % Housing Units |
| Single Unit, Detached | 124,369 | 65.6% |
| Single Unit, Attached | 15,580 | 8.2% |
| 2 Unit Apartments | 6,633 | 3.5% |
| 3 or 4 Unit Apartments | 6,584 | 3.5% |
| 5 to 9 Unit Apartments | 7,319 | 3.9% |
| 10 or more Apartments | 28,755 | 15.2% |
| Mobile Home / Other | 367 | 0.2% |
| Total | 189,607 | 100.0% |
Housing Structures by Occupancy in Morris County
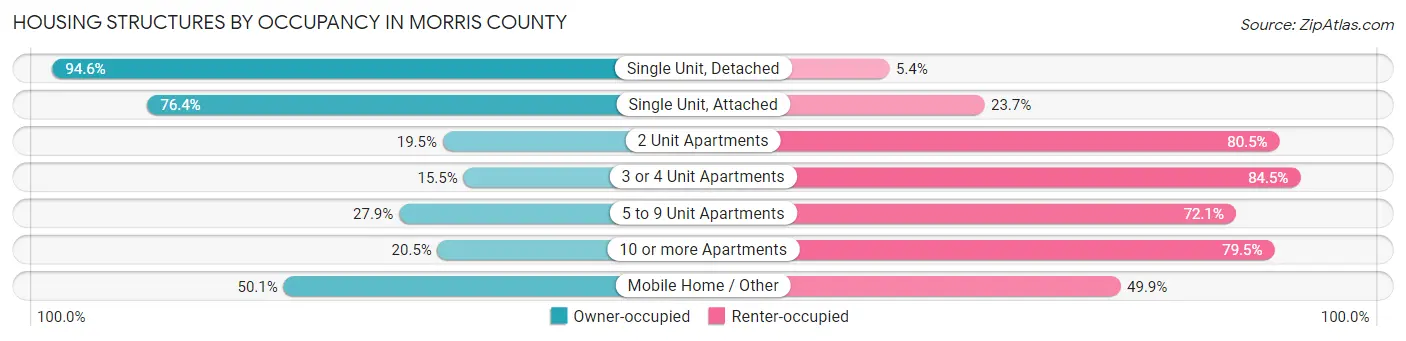
| Structure Type | Owner-occupied | Renter-occupied |
| Single Unit, Detached | 117,699 (94.6%) | 6,670 (5.4%) |
| Single Unit, Attached | 11,896 (76.3%) | 3,684 (23.6%) |
| 2 Unit Apartments | 1,292 (19.5%) | 5,341 (80.5%) |
| 3 or 4 Unit Apartments | 1,019 (15.5%) | 5,565 (84.5%) |
| 5 to 9 Unit Apartments | 2,041 (27.9%) | 5,278 (72.1%) |
| 10 or more Apartments | 5,885 (20.5%) | 22,870 (79.5%) |
| Mobile Home / Other | 184 (50.1%) | 183 (49.9%) |
| Total | 140,016 (73.9%) | 49,591 (26.2%) |
Housing Structures by Number of Rooms in Morris County
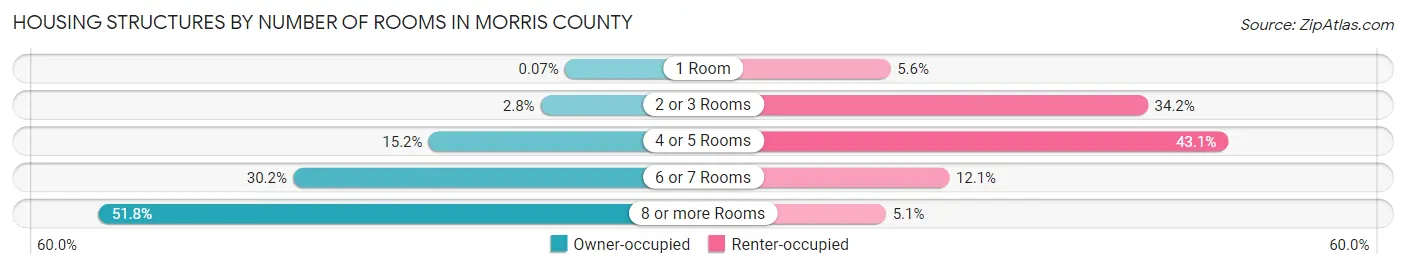
| Number of Rooms | Owner-occupied | Renter-occupied |
| 1 Room | 100 (0.1%) | 2,767 (5.6%) |
| 2 or 3 Rooms | 3,848 (2.8%) | 16,936 (34.2%) |
| 4 or 5 Rooms | 21,275 (15.2%) | 21,367 (43.1%) |
| 6 or 7 Rooms | 42,324 (30.2%) | 6,001 (12.1%) |
| 8 or more Rooms | 72,469 (51.8%) | 2,520 (5.1%) |
| Total | 140,016 (100.0%) | 49,591 (100.0%) |
Housing Structure by Heating Type in Morris County
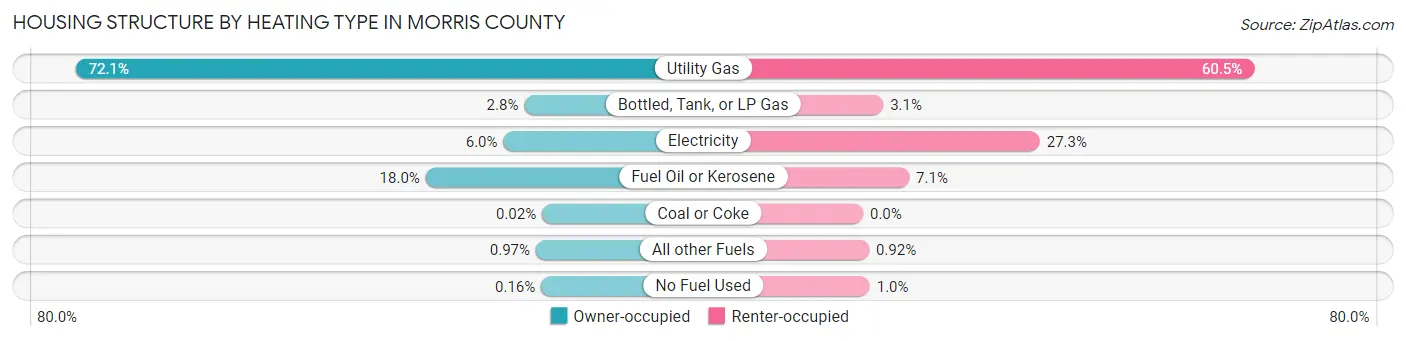
| Heating Type | Owner-occupied | Renter-occupied |
| Utility Gas | 100,964 (72.1%) | 29,980 (60.5%) |
| Bottled, Tank, or LP Gas | 3,862 (2.8%) | 1,549 (3.1%) |
| Electricity | 8,388 (6.0%) | 13,554 (27.3%) |
| Fuel Oil or Kerosene | 25,207 (18.0%) | 3,537 (7.1%) |
| Coal or Coke | 25 (0.0%) | 0 (0.0%) |
| All other Fuels | 1,352 (1.0%) | 456 (0.9%) |
| No Fuel Used | 218 (0.2%) | 515 (1.0%) |
| Total | 140,016 (100.0%) | 49,591 (100.0%) |
Household Vehicle Usage in Morris County
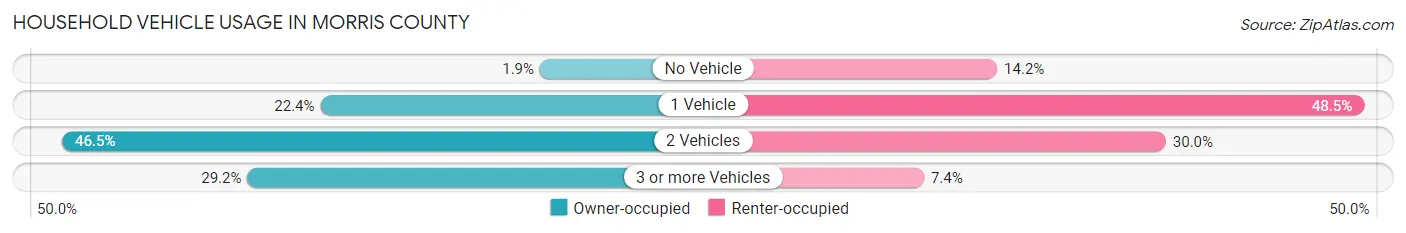
| Vehicles per Household | Owner-occupied | Renter-occupied |
| No Vehicle | 2,662 (1.9%) | 7,045 (14.2%) |
| 1 Vehicle | 31,347 (22.4%) | 24,030 (48.5%) |
| 2 Vehicles | 65,114 (46.5%) | 14,855 (30.0%) |
| 3 or more Vehicles | 40,893 (29.2%) | 3,661 (7.4%) |
| Total | 140,016 (100.0%) | 49,591 (100.0%) |
Real Estate & Mortgages in Morris County
Real Estate and Mortgage Overview in Morris County
| Characteristic | Without Mortgage | With Mortgage |
| Housing Units | 46,866 | 93,150 |
| Median Property Value | $503,200 | $545,100 |
| Median Household Income | $116,569 | $55,144 |
| Monthly Housing Costs | $1,331 | $52,566 |
| Real Estate Taxes | $10,001 | $732 |
Property Value by Mortgage Status in Morris County
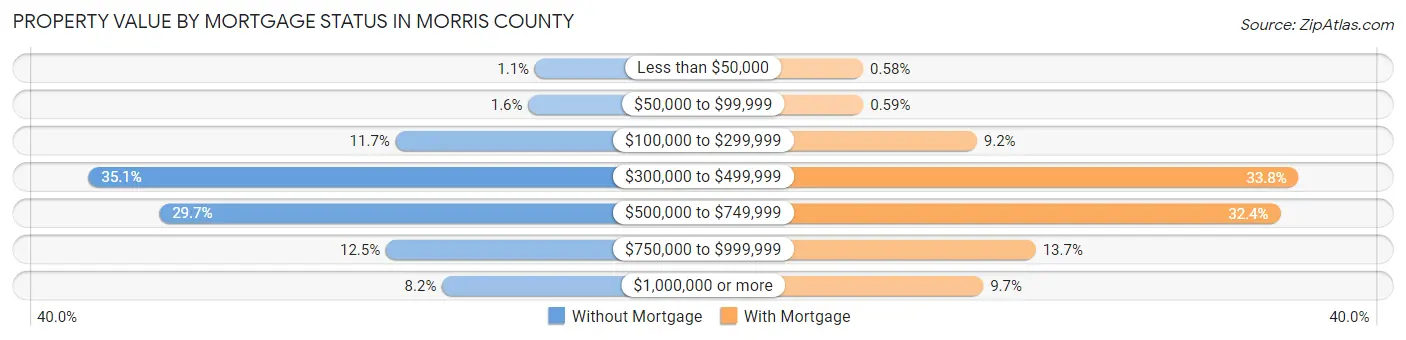
| Property Value | Without Mortgage | With Mortgage |
| Less than $50,000 | 527 (1.1%) | 537 (0.6%) |
| $50,000 to $99,999 | 760 (1.6%) | 553 (0.6%) |
| $100,000 to $299,999 | 5,499 (11.7%) | 8,608 (9.2%) |
| $300,000 to $499,999 | 16,467 (35.1%) | 31,444 (33.8%) |
| $500,000 to $749,999 | 13,940 (29.7%) | 30,148 (32.4%) |
| $750,000 to $999,999 | 5,841 (12.5%) | 12,792 (13.7%) |
| $1,000,000 or more | 3,832 (8.2%) | 9,068 (9.7%) |
| Total | 46,866 (100.0%) | 93,150 (100.0%) |
Household Income by Mortgage Status in Morris County
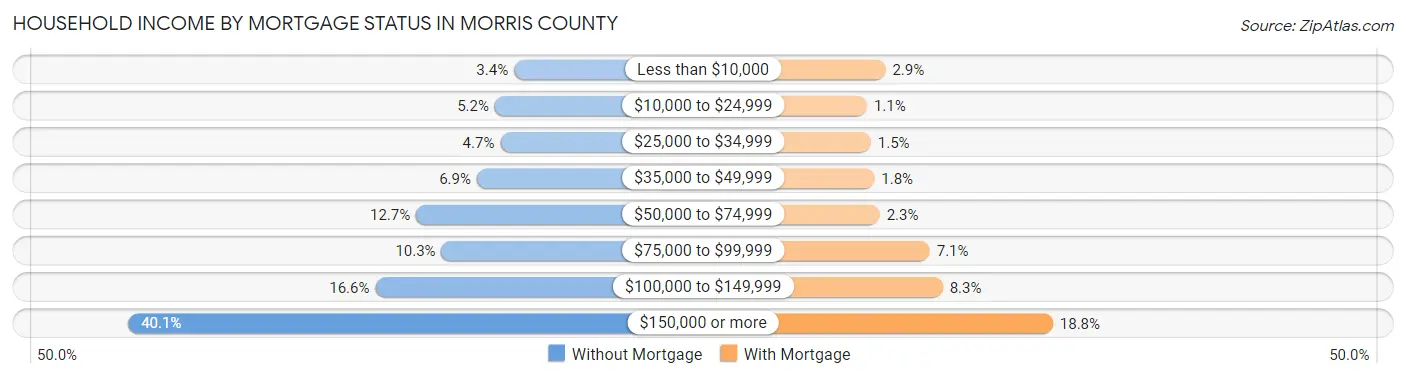
| Household Income | Without Mortgage | With Mortgage |
| Less than $10,000 | 1,591 (3.4%) | 2,658 (2.9%) |
| $10,000 to $24,999 | 2,448 (5.2%) | 1,011 (1.1%) |
| $25,000 to $34,999 | 2,202 (4.7%) | 1,363 (1.5%) |
| $35,000 to $49,999 | 3,249 (6.9%) | 1,665 (1.8%) |
| $50,000 to $74,999 | 5,963 (12.7%) | 2,145 (2.3%) |
| $75,000 to $99,999 | 4,828 (10.3%) | 6,590 (7.1%) |
| $100,000 to $149,999 | 7,780 (16.6%) | 7,727 (8.3%) |
| $150,000 or more | 18,805 (40.1%) | 17,505 (18.8%) |
| Total | 46,866 (100.0%) | 93,150 (100.0%) |
Property Value to Household Income Ratio in Morris County

| Value-to-Income Ratio | Without Mortgage | With Mortgage |
| Less than 2.0x | 7,977 (17.0%) | 175,826 (188.8%) |
| 2.0x to 2.9x | 8,689 (18.5%) | 19,414 (20.8%) |
| 3.0x to 3.9x | 6,180 (13.2%) | 27,257 (29.3%) |
| 4.0x or more | 23,478 (50.1%) | 16,652 (17.9%) |
| Total | 46,866 (100.0%) | 93,150 (100.0%) |
Real Estate Taxes by Mortgage Status in Morris County
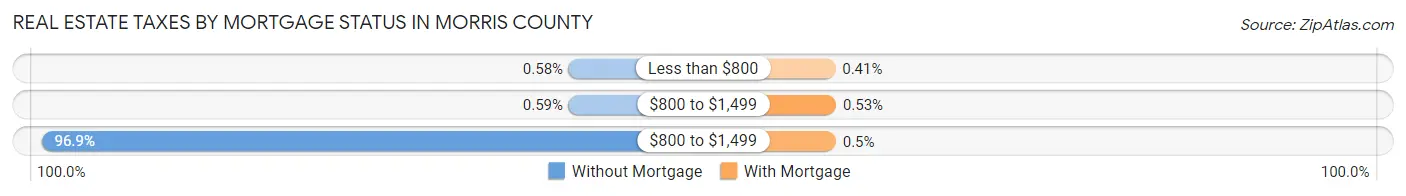
| Property Taxes | Without Mortgage | With Mortgage |
| Less than $800 | 272 (0.6%) | 386 (0.4%) |
| $800 to $1,499 | 275 (0.6%) | 497 (0.5%) |
| $800 to $1,499 | 45,415 (96.9%) | 465 (0.5%) |
| Total | 46,866 (100.0%) | 93,150 (100.0%) |
Health & Disability in Morris County
Health Insurance Coverage by Age in Morris County
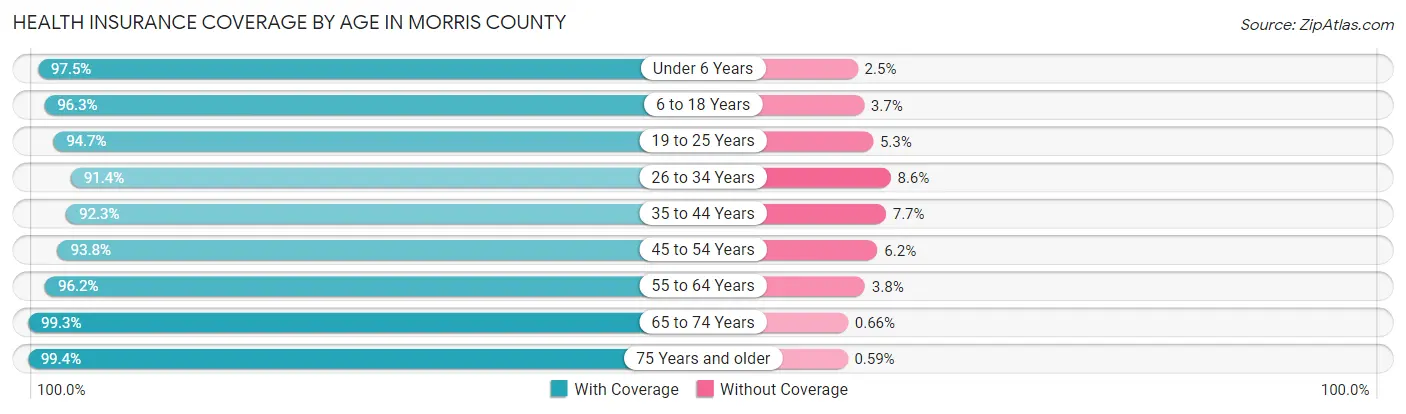
| Age Bracket | With Coverage | Without Coverage |
| Under 6 Years | 29,511 (97.5%) | 753 (2.5%) |
| 6 to 18 Years | 79,286 (96.3%) | 3,015 (3.7%) |
| 19 to 25 Years | 39,318 (94.7%) | 2,217 (5.3%) |
| 26 to 34 Years | 46,443 (91.4%) | 4,382 (8.6%) |
| 35 to 44 Years | 58,965 (92.3%) | 4,947 (7.7%) |
| 45 to 54 Years | 68,954 (93.8%) | 4,533 (6.2%) |
| 55 to 64 Years | 72,715 (96.2%) | 2,903 (3.8%) |
| 65 to 74 Years | 48,804 (99.3%) | 322 (0.7%) |
| 75 Years and older | 37,532 (99.4%) | 222 (0.6%) |
| Total | 481,528 (95.4%) | 23,294 (4.6%) |
Health Insurance Coverage by Citizenship Status in Morris County
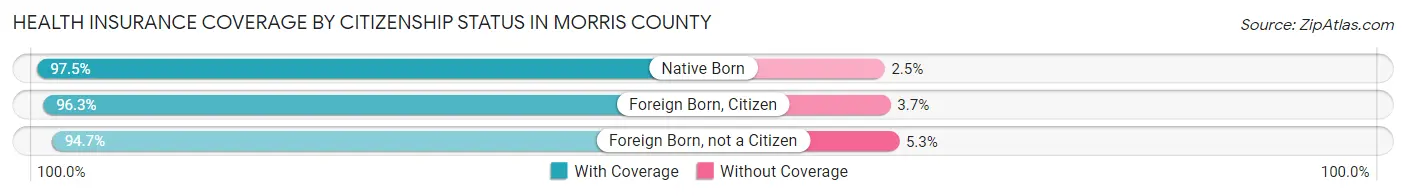
| Citizenship Status | With Coverage | Without Coverage |
| Native Born | 29,511 (97.5%) | 753 (2.5%) |
| Foreign Born, Citizen | 79,286 (96.3%) | 3,015 (3.7%) |
| Foreign Born, not a Citizen | 39,318 (94.7%) | 2,217 (5.3%) |
Health Insurance Coverage by Household Income in Morris County
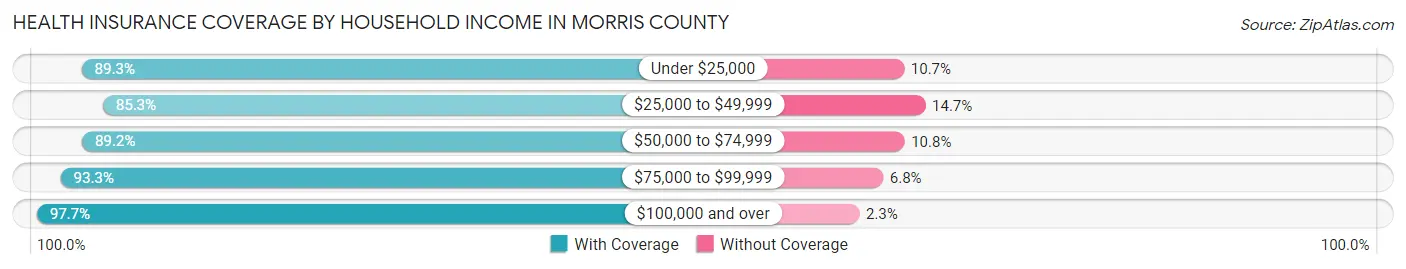
| Household Income | With Coverage | Without Coverage |
| Under $25,000 | 18,530 (89.3%) | 2,219 (10.7%) |
| $25,000 to $49,999 | 29,724 (85.3%) | 5,112 (14.7%) |
| $50,000 to $74,999 | 37,756 (89.2%) | 4,553 (10.8%) |
| $75,000 to $99,999 | 43,078 (93.2%) | 3,118 (6.8%) |
| $100,000 and over | 347,302 (97.7%) | 8,156 (2.3%) |
Public vs Private Health Insurance Coverage by Age in Morris County
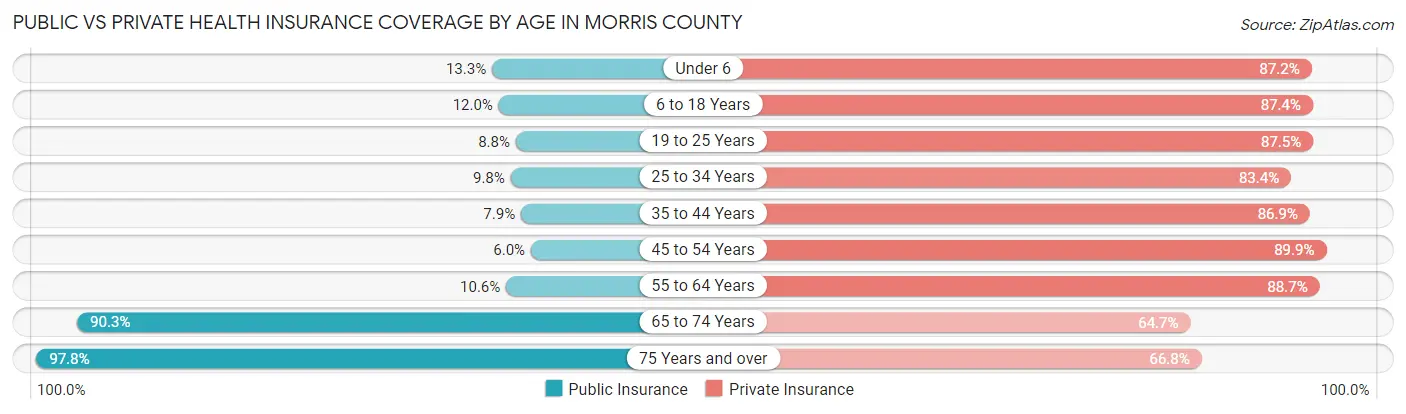
| Age Bracket | Public Insurance | Private Insurance |
| Under 6 | 4,009 (13.3%) | 26,387 (87.2%) |
| 6 to 18 Years | 9,873 (12.0%) | 71,941 (87.4%) |
| 19 to 25 Years | 3,667 (8.8%) | 36,332 (87.5%) |
| 25 to 34 Years | 4,978 (9.8%) | 42,375 (83.4%) |
| 35 to 44 Years | 5,024 (7.9%) | 55,508 (86.9%) |
| 45 to 54 Years | 4,425 (6.0%) | 66,073 (89.9%) |
| 55 to 64 Years | 8,027 (10.6%) | 67,041 (88.7%) |
| 65 to 74 Years | 44,337 (90.2%) | 31,774 (64.7%) |
| 75 Years and over | 36,932 (97.8%) | 25,204 (66.8%) |
| Total | 121,272 (24.0%) | 422,635 (83.7%) |
Disability Status by Sex by Age in Morris County
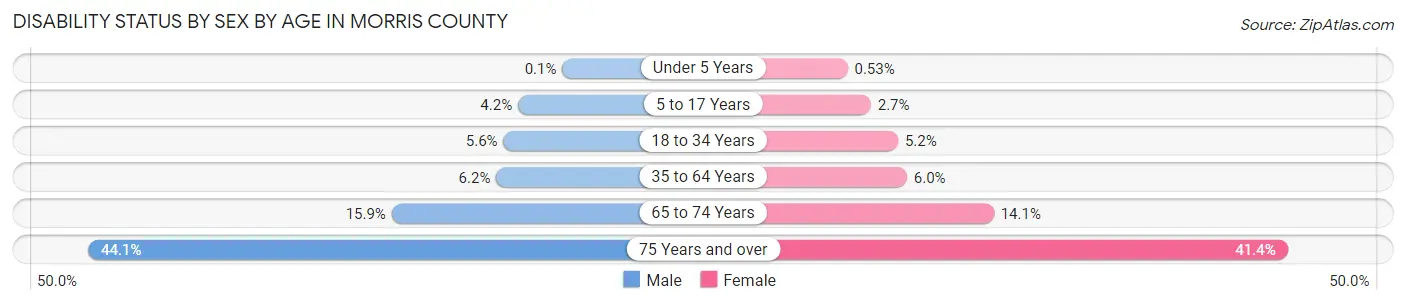
| Age Bracket | Male | Female |
| Under 5 Years | 13 (0.1%) | 64 (0.5%) |
| 5 to 17 Years | 1,746 (4.2%) | 1,046 (2.7%) |
| 18 to 34 Years | 2,832 (5.6%) | 2,531 (5.2%) |
| 35 to 64 Years | 6,623 (6.2%) | 6,448 (6.0%) |
| 65 to 74 Years | 3,713 (15.9%) | 3,640 (14.1%) |
| 75 Years and over | 6,777 (44.1%) | 9,261 (41.4%) |
Disability Class by Sex by Age in Morris County
Disability Class: Hearing Difficulty
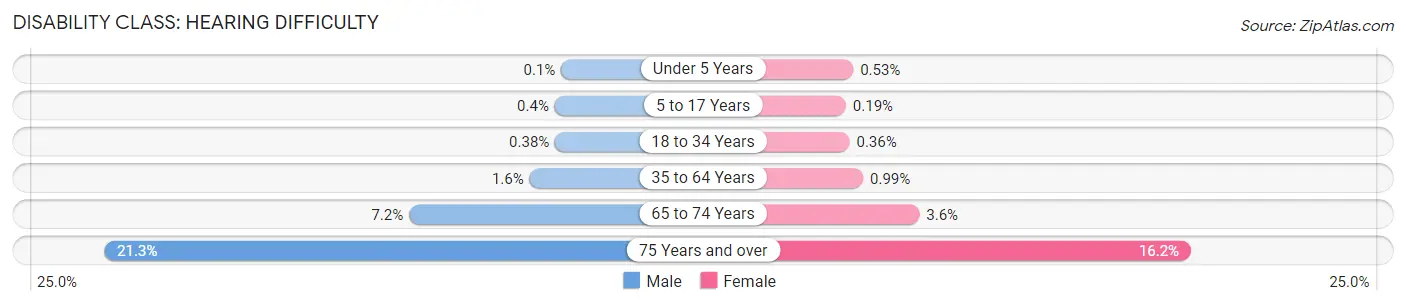
| Age Bracket | Male | Female |
| Under 5 Years | 13 (0.1%) | 64 (0.5%) |
| 5 to 17 Years | 165 (0.4%) | 75 (0.2%) |
| 18 to 34 Years | 192 (0.4%) | 173 (0.4%) |
| 35 to 64 Years | 1,666 (1.6%) | 1,059 (1.0%) |
| 65 to 74 Years | 1,670 (7.2%) | 929 (3.6%) |
| 75 Years and over | 3,274 (21.3%) | 3,628 (16.2%) |
Disability Class: Vision Difficulty
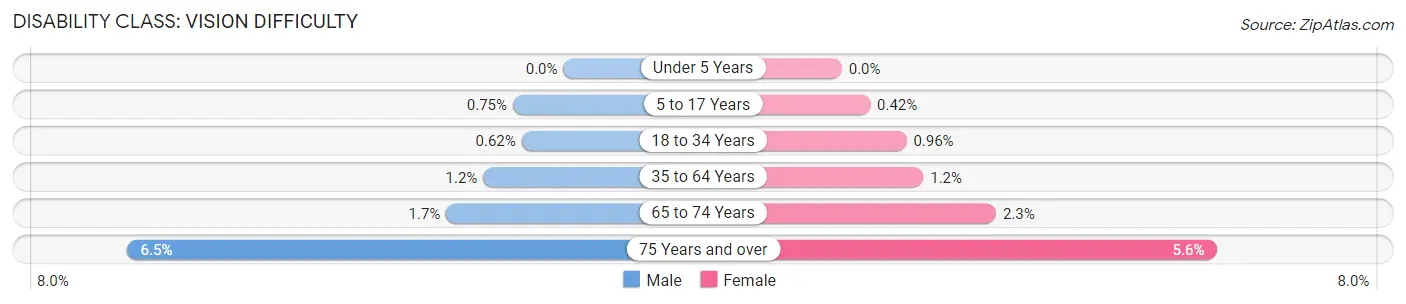
| Age Bracket | Male | Female |
| Under 5 Years | 0 (0.0%) | 0 (0.0%) |
| 5 to 17 Years | 311 (0.7%) | 162 (0.4%) |
| 18 to 34 Years | 316 (0.6%) | 466 (1.0%) |
| 35 to 64 Years | 1,263 (1.2%) | 1,294 (1.2%) |
| 65 to 74 Years | 405 (1.7%) | 591 (2.3%) |
| 75 Years and over | 994 (6.5%) | 1,246 (5.6%) |
Disability Class: Cognitive Difficulty
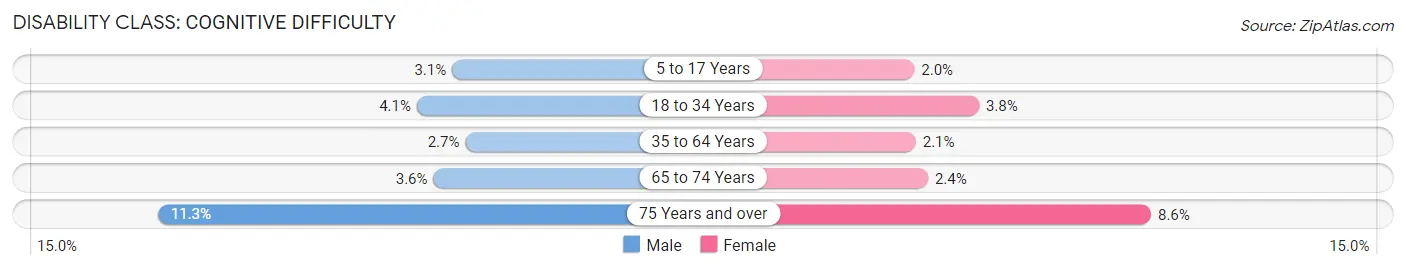
| Age Bracket | Male | Female |
| 5 to 17 Years | 1,284 (3.1%) | 788 (2.0%) |
| 18 to 34 Years | 2,078 (4.1%) | 1,854 (3.8%) |
| 35 to 64 Years | 2,906 (2.7%) | 2,201 (2.1%) |
| 65 to 74 Years | 843 (3.6%) | 620 (2.4%) |
| 75 Years and over | 1,734 (11.3%) | 1,928 (8.6%) |
Disability Class: Ambulatory Difficulty

| Age Bracket | Male | Female |
| 5 to 17 Years | 296 (0.7%) | 122 (0.3%) |
| 18 to 34 Years | 356 (0.7%) | 230 (0.5%) |
| 35 to 64 Years | 2,285 (2.1%) | 3,065 (2.9%) |
| 65 to 74 Years | 1,739 (7.5%) | 2,223 (8.6%) |
| 75 Years and over | 4,084 (26.6%) | 6,040 (27.0%) |
Disability Class: Self-Care Difficulty
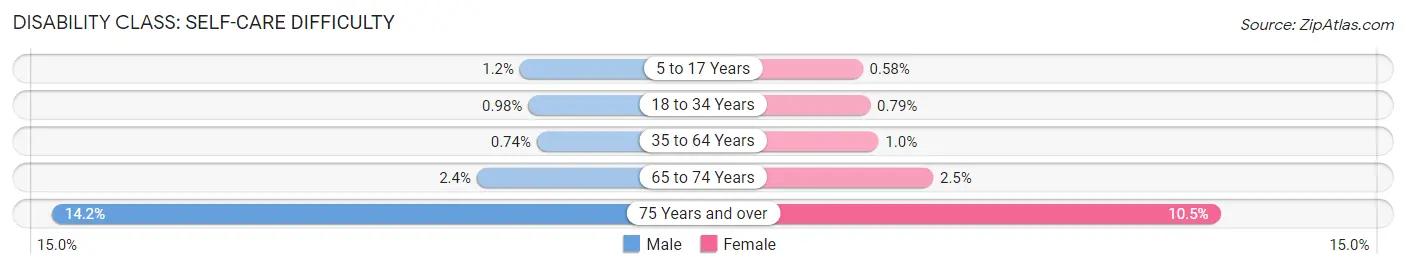
| Age Bracket | Male | Female |
| 5 to 17 Years | 500 (1.2%) | 224 (0.6%) |
| 18 to 34 Years | 502 (1.0%) | 383 (0.8%) |
| 35 to 64 Years | 789 (0.7%) | 1,084 (1.0%) |
| 65 to 74 Years | 562 (2.4%) | 655 (2.5%) |
| 75 Years and over | 2,187 (14.2%) | 2,360 (10.5%) |
Technology Access in Morris County
Computing Device Access in Morris County
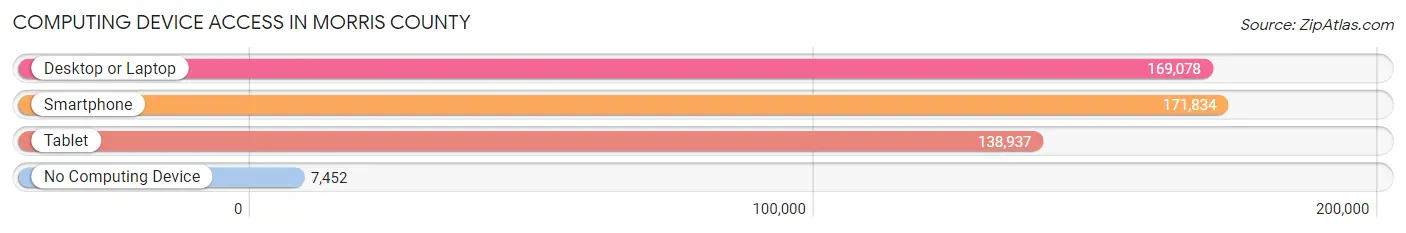
| Device Type | # Households | % Households |
| Desktop or Laptop | 169,078 | 89.2% |
| Smartphone | 171,834 | 90.6% |
| Tablet | 138,937 | 73.3% |
| No Computing Device | 7,452 | 3.9% |
| Total | 189,607 | 100.0% |
Internet Access in Morris County
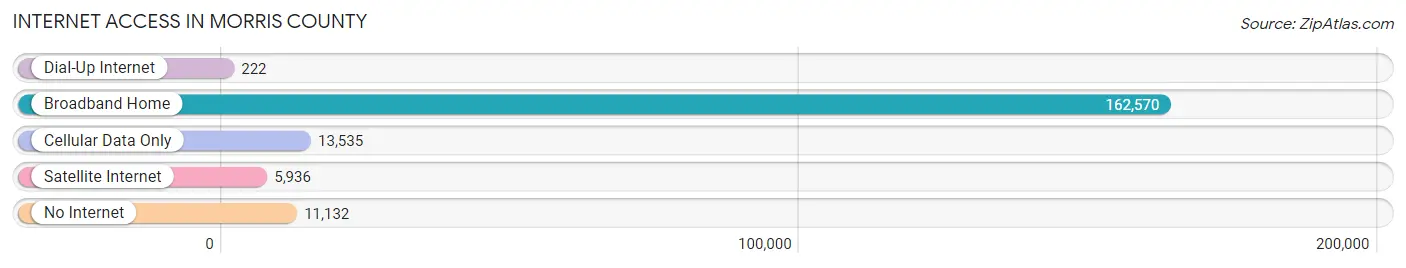
| Internet Type | # Households | % Households |
| Dial-Up Internet | 222 | 0.1% |
| Broadband Home | 162,570 | 85.7% |
| Cellular Data Only | 13,535 | 7.1% |
| Satellite Internet | 5,936 | 3.1% |
| No Internet | 11,132 | 5.9% |
| Total | 189,607 | 100.0% |
Morris County Summary
Morris County, New Jersey is located in the northern part of the state and is part of the New York metropolitan area. It is bordered by Sussex, Warren, and Hunterdon counties to the west, Essex County to the south, and Passaic County to the east. The county seat is Morristown, which is also the county’s largest municipality. Morris County is home to a population of approximately 500,000 people, making it the sixth most populous county in New Jersey.
History
Morris County was established in 1739 and was named after Colonel Lewis Morris, the first Royal Governor of New Jersey. The county was originally part of Hunterdon County, but was split off in 1739. During the American Revolution, Morris County was a major center of activity, with several battles taking place in the area. After the war, the county experienced a period of growth and development, with the construction of the Morris Canal in 1831 and the establishment of several towns and villages.
Geography
Morris County covers an area of 473 square miles and is located in the northern part of New Jersey. The county is mostly composed of rolling hills and valleys, with the highest point being the summit of Schooley’s Mountain at 1,067 feet. The county is drained by the Passaic River and its tributaries, including the Rockaway River, the Whippany River, and the Raritan River. The county is home to several state parks, including the Great Swamp National Wildlife Refuge, the Pyramid Mountain Natural Historic Area, and the Tourne County Park.
Economy
Morris County has a diverse economy, with a variety of industries represented. The county is home to several large corporations, including Honeywell, Novartis, and Wyndham Worldwide. The county is also home to several smaller businesses, including technology companies, manufacturing firms, and financial services companies. The county’s largest employers are Morristown Medical Center, Atlantic Health System, and Picatinny Arsenal.
Demographics
As of the 2010 census, Morris County had a population of 492,276 people. The racial makeup of the county was 79.2% White, 8.3% African American, 0.3% Native American, 8.2% Asian, and 3.0% from other races. The median household income was $90,890, and the median family income was $106,843. The county’s population is well-educated, with over 90% of adults having at least a high school diploma and over 40% having a bachelor’s degree or higher.
Morris County is a diverse and vibrant county with a rich history and a strong economy. The county is home to a variety of industries, and its population is well-educated and prosperous. Morris County is an ideal place to live, work, and play, and is a great place to call home.
Common Questions
What is the Total Population of Morris County?
Total Population of Morris County is 508,816.
What is the Total Male Population of Morris County?
Total Male Population of Morris County is 252,441.
What is the Total Female Population of Morris County?
Total Female Population of Morris County is 256,375.
What is the Ratio of Males per 100 Females in Morris County?
There are 98.47 Males per 100 Females in Morris County.
What is the Ratio of Females per 100 Males in Morris County?
There are 101.56 Females per 100 Males in Morris County.
What is the Median Population Age in Morris County?
Median Population Age in Morris County is 42.7 Years.
What is the Average Family Size in Morris County
Average Family Size in Morris County is 3.2 People.
What is the Average Household Size in Morris County
Average Household Size in Morris County is 2.6 People.
What is Per Capita Income in Morris County?
Per Capita income in Morris County is $67,555.
What is the Median Family Income in Morris County?
Median Family Income in Morris County is $163,598.
What is the Median Household income in Morris County?
Median Household Income in Morris County is $130,808.
What is Income or Wage Gap in Morris County?
Income or Wage Gap in Morris County is 34.1%.
Women in Morris County earn 65.9 cents for every dollar earned by a man.
What is Family Income Deficit in Morris County?
Family Income Deficit in Morris County is $10,262.
Families that are below poverty line in Morris County earn $10,262 less on average than the poverty threshold level.
What is Inequality or Gini Index in Morris County?
Inequality or Gini Index in Morris County is 0.46.
How Large is the Labor Force in Morris County?
There are 283,011 People in the Labor Forcein in Morris County.
What is the Percentage of People in the Labor Force in Morris County?
67.8% of People are in the Labor Force in Morris County.
What is the Unemployment Rate in Morris County?
Unemployment Rate in Morris County is 5.3%.