Monmouth County, NJ
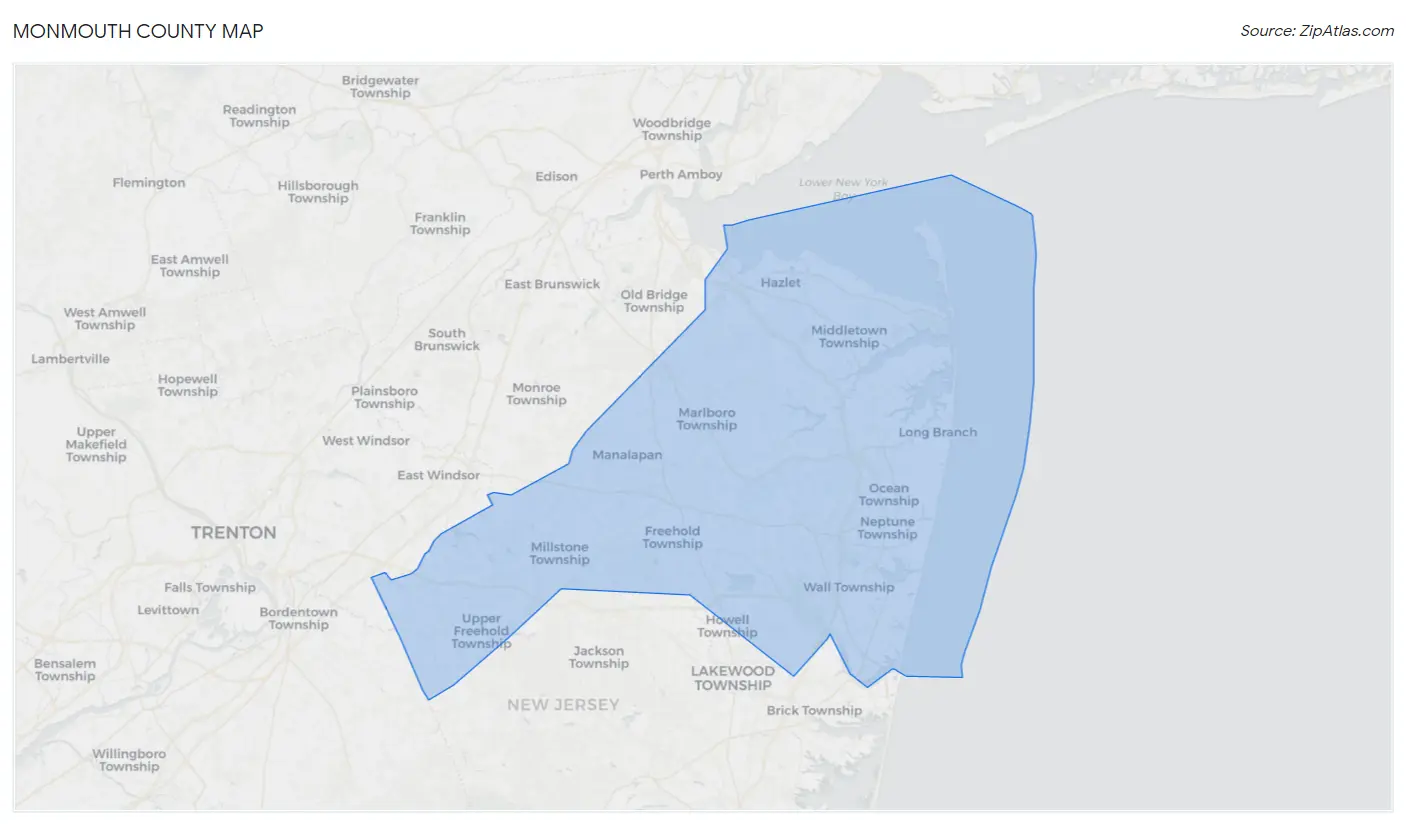
Monmouth County Map
Monmouth County Overview
643,064
TOTAL POPULATION
315,742
MALE POPULATION
327,322
FEMALE POPULATION
96.46
MALES / 100 FEMALES
103.67
FEMALES / 100 MALES
43.3
MEDIAN AGE
3.1
AVG FAMILY SIZE
2.6
AVG HOUSEHOLD SIZE
$62,998
PER CAPITA INCOME
$150,040
AVG FAMILY INCOME
$118,527
AVG HOUSEHOLD INCOME
38.2%
WAGE / INCOME GAP [ % ]
61.8¢/ $1
WAGE / INCOME GAP [ $ ]
$11,768
FAMILY INCOME DEFICIT
0.48
INEQUALITY / GINI INDEX
350,736
LABOR FORCE [ PEOPLE ]
66.5%
PERCENT IN LABOR FORCE
5.4%
UNEMPLOYMENT RATE
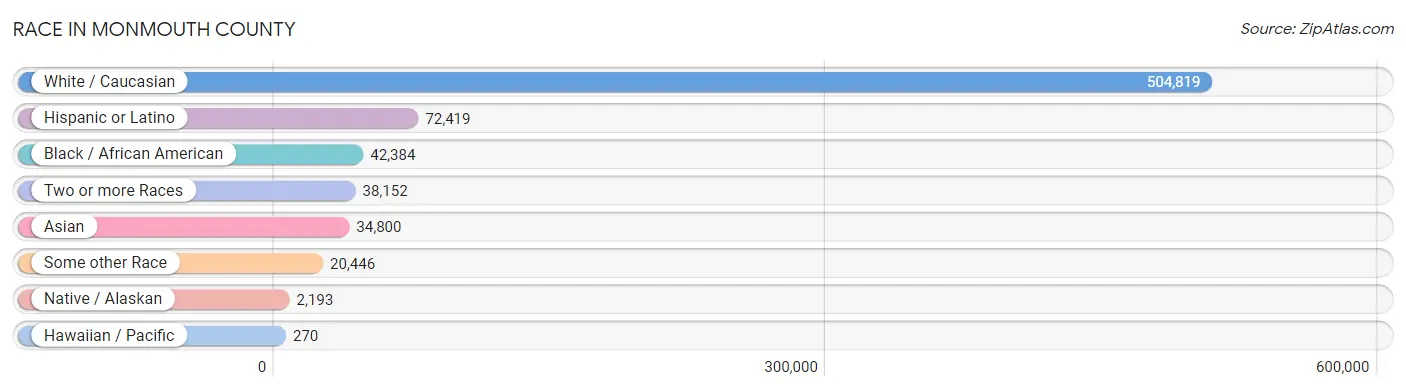
Race in Monmouth County
The most populous races in Monmouth County are White / Caucasian (504,819 | 78.5%), Hispanic or Latino (72,419 | 11.3%), and Black / African American (42,384 | 6.6%).
| Race | # Population | % Population |
| Asian | 34,800 | 5.4% |
| Black / African American | 42,384 | 6.6% |
| Hawaiian / Pacific | 270 | 0.0% |
| Hispanic or Latino | 72,419 | 11.3% |
| Native / Alaskan | 2,193 | 0.3% |
| White / Caucasian | 504,819 | 78.5% |
| Two or more Races | 38,152 | 5.9% |
| Some other Race | 20,446 | 3.2% |
| Total | 643,064 | 100.0% |
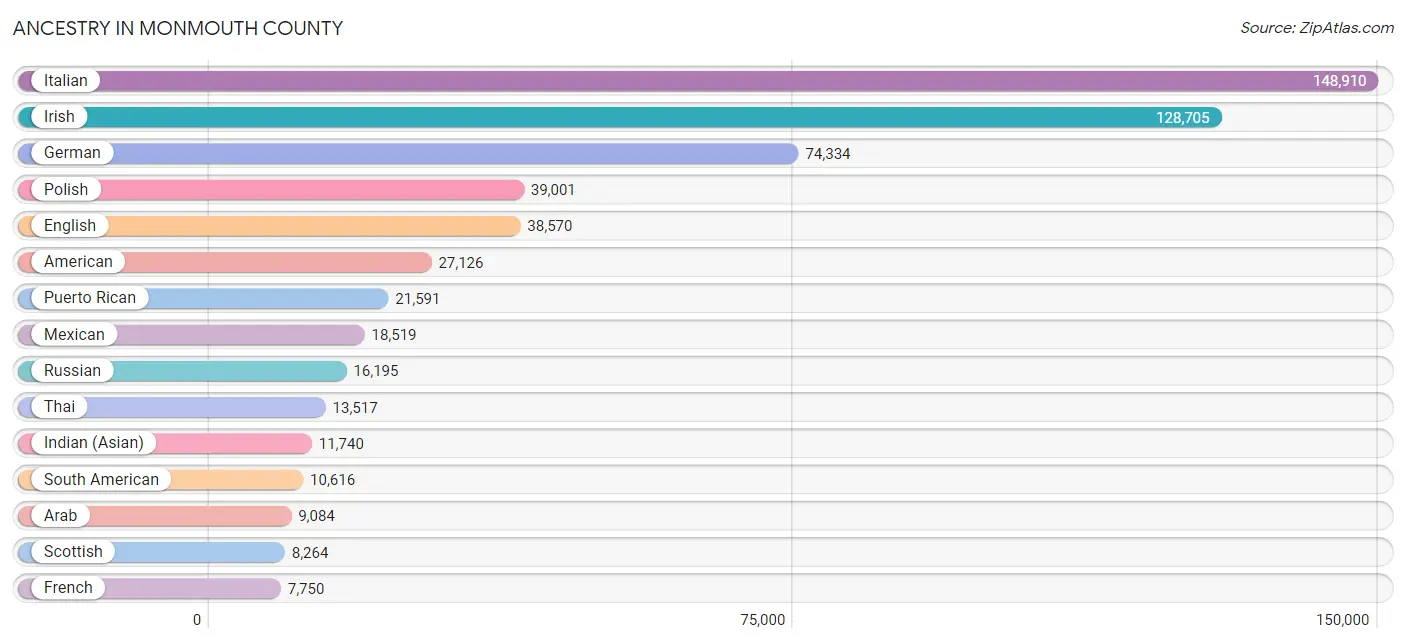
Ancestry in Monmouth County
The most populous ancestries reported in Monmouth County are Italian (148,910 | 23.2%), Irish (128,705 | 20.0%), German (74,334 | 11.6%), Polish (39,001 | 6.1%), and English (38,570 | 6.0%), together accounting for 66.8% of all Monmouth County residents.
| Ancestry | # Population | % Population |
| Afghan | 15 | 0.0% |
| African | 1,597 | 0.3% |
| Albanian | 1,195 | 0.2% |
| Alsatian | 34 | 0.0% |
| American | 27,126 | 4.2% |
| Apache | 34 | 0.0% |
| Arab | 9,084 | 1.4% |
| Argentinean | 917 | 0.1% |
| Armenian | 935 | 0.2% |
| Assyrian / Chaldean / Syriac | 66 | 0.0% |
| Australian | 182 | 0.0% |
| Austrian | 2,560 | 0.4% |
| Bahamian | 70 | 0.0% |
| Barbadian | 96 | 0.0% |
| Basque | 13 | 0.0% |
| Belgian | 396 | 0.1% |
| Belizean | 56 | 0.0% |
| Bhutanese | 756 | 0.1% |
| Blackfeet | 176 | 0.0% |
| Bolivian | 135 | 0.0% |
| Brazilian | 4,408 | 0.7% |
| British | 2,619 | 0.4% |
| British West Indian | 389 | 0.1% |
| Bulgarian | 290 | 0.1% |
| Burmese | 3,217 | 0.5% |
| Cajun | 10 | 0.0% |
| Cambodian | 90 | 0.0% |
| Canadian | 760 | 0.1% |
| Cape Verdean | 53 | 0.0% |
| Carpatho Rusyn | 25 | 0.0% |
| Celtic | 58 | 0.0% |
| Central American | 7,573 | 1.2% |
| Central American Indian | 730 | 0.1% |
| Cherokee | 580 | 0.1% |
| Cheyenne | 8 | 0.0% |
| Chickasaw | 4 | 0.0% |
| Chilean | 720 | 0.1% |
| Chippewa | 3 | 0.0% |
| Colombian | 3,942 | 0.6% |
| Costa Rican | 813 | 0.1% |
| Creek | 12 | 0.0% |
| Croatian | 1,120 | 0.2% |
| Cuban | 4,525 | 0.7% |
| Cypriot | 69 | 0.0% |
| Czech | 1,882 | 0.3% |
| Czechoslovakian | 797 | 0.1% |
| Danish | 1,596 | 0.3% |
| Delaware | 116 | 0.0% |
| Dominican | 3,885 | 0.6% |
| Dutch | 4,884 | 0.8% |
| Dutch West Indian | 1 | 0.0% |
| Eastern European | 7,223 | 1.1% |
| Ecuadorian | 1,713 | 0.3% |
| Egyptian | 3,646 | 0.6% |
| English | 38,570 | 6.0% |
| Estonian | 201 | 0.0% |
| European | 6,676 | 1.0% |
| Filipino | 490 | 0.1% |
| Finnish | 391 | 0.1% |
| French | 7,750 | 1.2% |
| French American Indian | 15 | 0.0% |
| French Canadian | 1,846 | 0.3% |
| German | 74,334 | 11.6% |
| German Russian | 32 | 0.0% |
| Ghanaian | 281 | 0.0% |
| Greek | 5,681 | 0.9% |
| Guamanian / Chamorro | 42 | 0.0% |
| Guatemalan | 1,685 | 0.3% |
| Guyanese | 329 | 0.1% |
| Haitian | 4,223 | 0.7% |
| Honduran | 528 | 0.1% |
| Hopi | 17 | 0.0% |
| Hungarian | 7,524 | 1.2% |
| Icelander | 158 | 0.0% |
| Indian (Asian) | 11,740 | 1.8% |
| Indonesian | 87 | 0.0% |
| Iranian | 392 | 0.1% |
| Iraqi | 198 | 0.0% |
| Irish | 128,705 | 20.0% |
| Iroquois | 9 | 0.0% |
| Israeli | 1,026 | 0.2% |
| Italian | 148,910 | 23.2% |
| Jamaican | 2,558 | 0.4% |
| Japanese | 321 | 0.1% |
| Jordanian | 142 | 0.0% |
| Korean | 5,956 | 0.9% |
| Laotian | 24 | 0.0% |
| Latvian | 516 | 0.1% |
| Lebanese | 1,112 | 0.2% |
| Liberian | 29 | 0.0% |
| Lithuanian | 2,445 | 0.4% |
| Macedonian | 172 | 0.0% |
| Malaysian | 111 | 0.0% |
| Maltese | 126 | 0.0% |
| Mexican | 18,519 | 2.9% |
| Mexican American Indian | 945 | 0.2% |
| Mongolian | 43 | 0.0% |
| Moroccan | 242 | 0.0% |
| Native Hawaiian | 50 | 0.0% |
| Navajo | 58 | 0.0% |
| New Zealander | 37 | 0.0% |
| Nicaraguan | 669 | 0.1% |
| Nigerian | 538 | 0.1% |
| Northern European | 452 | 0.1% |
| Norwegian | 3,503 | 0.5% |
| Okinawan | 20 | 0.0% |
| Pakistani | 374 | 0.1% |
| Palestinian | 146 | 0.0% |
| Panamanian | 337 | 0.1% |
| Paraguayan | 56 | 0.0% |
| Pennsylvania German | 79 | 0.0% |
| Peruvian | 2,128 | 0.3% |
| Polish | 39,001 | 6.1% |
| Portuguese | 4,719 | 0.7% |
| Puerto Rican | 21,591 | 3.4% |
| Puget Sound Salish | 29 | 0.0% |
| Romanian | 1,773 | 0.3% |
| Russian | 16,195 | 2.5% |
| Salvadoran | 3,541 | 0.5% |
| Samoan | 163 | 0.0% |
| Scandinavian | 790 | 0.1% |
| Scotch-Irish | 2,607 | 0.4% |
| Scottish | 8,264 | 1.3% |
| Seminole | 21 | 0.0% |
| Senegalese | 27 | 0.0% |
| Serbian | 159 | 0.0% |
| Shoshone | 6 | 0.0% |
| Sierra Leonean | 8 | 0.0% |
| Sioux | 6 | 0.0% |
| Slavic | 395 | 0.1% |
| Slovak | 2,463 | 0.4% |
| Slovene | 220 | 0.0% |
| South African | 212 | 0.0% |
| South American | 10,616 | 1.7% |
| South American Indian | 310 | 0.1% |
| Spaniard | 2,483 | 0.4% |
| Spanish | 1,311 | 0.2% |
| Spanish American | 10 | 0.0% |
| Sri Lankan | 1,373 | 0.2% |
| Subsaharan African | 2,860 | 0.4% |
| Swedish | 3,935 | 0.6% |
| Swiss | 999 | 0.2% |
| Syrian | 2,545 | 0.4% |
| Thai | 13,517 | 2.1% |
| Trinidadian and Tobagonian | 645 | 0.1% |
| Turkish | 1,419 | 0.2% |
| U.S. Virgin Islander | 82 | 0.0% |
| Ukrainian | 6,649 | 1.0% |
| Uruguayan | 250 | 0.0% |
| Venezuelan | 744 | 0.1% |
| Vietnamese | 333 | 0.1% |
| Welsh | 2,073 | 0.3% |
| West Indian | 639 | 0.1% |
| Yugoslavian | 302 | 0.1% | View All 154 Rows |
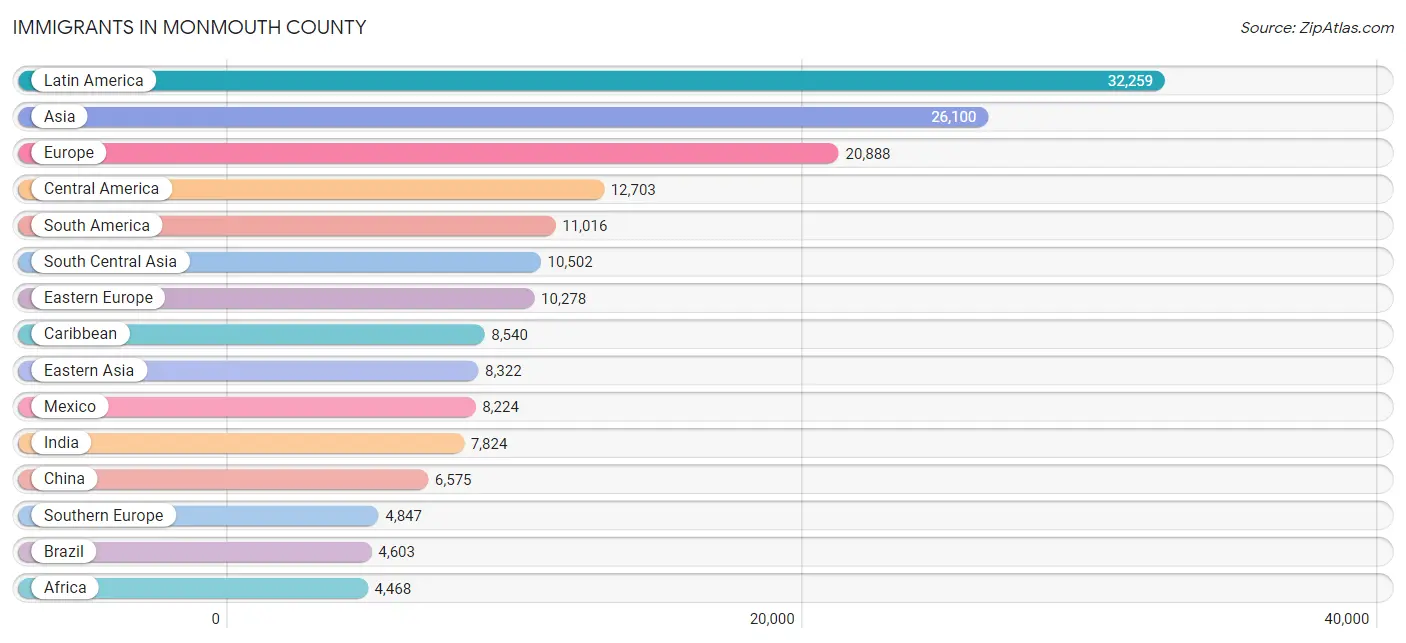
Immigrants in Monmouth County
The most numerous immigrant groups reported in Monmouth County came from Latin America (32,259 | 5.0%), Asia (26,100 | 4.1%), Europe (20,888 | 3.3%), Central America (12,703 | 2.0%), and South America (11,016 | 1.7%), together accounting for 16.0% of all Monmouth County residents.
| Immigration Origin | # Population | % Population |
| Afghanistan | 40 | 0.0% |
| Africa | 4,468 | 0.7% |
| Albania | 70 | 0.0% |
| Argentina | 534 | 0.1% |
| Armenia | 15 | 0.0% |
| Asia | 26,100 | 4.1% |
| Australia | 222 | 0.0% |
| Austria | 218 | 0.0% |
| Azores | 29 | 0.0% |
| Bahamas | 124 | 0.0% |
| Bangladesh | 346 | 0.1% |
| Barbados | 40 | 0.0% |
| Belarus | 621 | 0.1% |
| Belgium | 73 | 0.0% |
| Belize | 143 | 0.0% |
| Bolivia | 26 | 0.0% |
| Bosnia and Herzegovina | 65 | 0.0% |
| Brazil | 4,603 | 0.7% |
| Bulgaria | 419 | 0.1% |
| Cambodia | 72 | 0.0% |
| Canada | 1,142 | 0.2% |
| Caribbean | 8,540 | 1.3% |
| Central America | 12,703 | 2.0% |
| Chile | 251 | 0.0% |
| China | 6,575 | 1.0% |
| Colombia | 1,838 | 0.3% |
| Costa Rica | 573 | 0.1% |
| Croatia | 127 | 0.0% |
| Cuba | 999 | 0.2% |
| Czechoslovakia | 255 | 0.0% |
| Denmark | 29 | 0.0% |
| Dominica | 42 | 0.0% |
| Dominican Republic | 1,485 | 0.2% |
| Eastern Africa | 218 | 0.0% |
| Eastern Asia | 8,322 | 1.3% |
| Eastern Europe | 10,278 | 1.6% |
| Ecuador | 758 | 0.1% |
| Egypt | 2,750 | 0.4% |
| El Salvador | 1,929 | 0.3% |
| England | 930 | 0.1% |
| Eritrea | 6 | 0.0% |
| Europe | 20,888 | 3.3% |
| France | 584 | 0.1% |
| Germany | 1,299 | 0.2% |
| Ghana | 414 | 0.1% |
| Greece | 434 | 0.1% |
| Grenada | 136 | 0.0% |
| Guatemala | 1,135 | 0.2% |
| Guyana | 429 | 0.1% |
| Haiti | 2,873 | 0.4% |
| Honduras | 247 | 0.0% |
| Hong Kong | 1,256 | 0.2% |
| Hungary | 121 | 0.0% |
| India | 7,824 | 1.2% |
| Indonesia | 70 | 0.0% |
| Iran | 207 | 0.0% |
| Iraq | 266 | 0.0% |
| Ireland | 656 | 0.1% |
| Israel | 671 | 0.1% |
| Italy | 2,713 | 0.4% |
| Jamaica | 1,791 | 0.3% |
| Japan | 278 | 0.0% |
| Jordan | 85 | 0.0% |
| Kazakhstan | 185 | 0.0% |
| Kenya | 93 | 0.0% |
| Korea | 1,469 | 0.2% |
| Kuwait | 21 | 0.0% |
| Laos | 47 | 0.0% |
| Latin America | 32,259 | 5.0% |
| Latvia | 356 | 0.1% |
| Lebanon | 285 | 0.0% |
| Liberia | 17 | 0.0% |
| Lithuania | 256 | 0.0% |
| Malaysia | 79 | 0.0% |
| Mexico | 8,224 | 1.3% |
| Middle Africa | 86 | 0.0% |
| Moldova | 284 | 0.0% |
| Morocco | 155 | 0.0% |
| Nepal | 245 | 0.0% |
| Netherlands | 183 | 0.0% |
| Nicaragua | 369 | 0.1% |
| Nigeria | 485 | 0.1% |
| North Macedonia | 181 | 0.0% |
| Northern Africa | 2,994 | 0.5% |
| Northern Europe | 3,217 | 0.5% |
| Norway | 124 | 0.0% |
| Oceania | 262 | 0.0% |
| Pakistan | 1,213 | 0.2% |
| Panama | 83 | 0.0% |
| Peru | 1,513 | 0.2% |
| Philippines | 2,938 | 0.5% |
| Poland | 1,625 | 0.3% |
| Portugal | 1,161 | 0.2% |
| Romania | 590 | 0.1% |
| Russia | 1,977 | 0.3% |
| Saudi Arabia | 30 | 0.0% |
| Scotland | 378 | 0.1% |
| Senegal | 12 | 0.0% |
| Serbia | 26 | 0.0% |
| Sierra Leone | 19 | 0.0% |
| Singapore | 38 | 0.0% |
| South Africa | 119 | 0.0% |
| South America | 11,016 | 1.7% |
| South Central Asia | 10,502 | 1.6% |
| South Eastern Asia | 4,296 | 0.7% |
| Southern Europe | 4,847 | 0.7% |
| Spain | 505 | 0.1% |
| Sri Lanka | 172 | 0.0% |
| St. Vincent and the Grenadines | 155 | 0.0% |
| Sudan | 51 | 0.0% |
| Sweden | 142 | 0.0% |
| Switzerland | 122 | 0.0% |
| Syria | 321 | 0.1% |
| Taiwan | 1,007 | 0.2% |
| Thailand | 177 | 0.0% |
| Trinidad and Tobago | 710 | 0.1% |
| Turkey | 600 | 0.1% |
| Ukraine | 2,748 | 0.4% |
| Uruguay | 166 | 0.0% |
| Uzbekistan | 152 | 0.0% |
| Venezuela | 497 | 0.1% |
| Vietnam | 844 | 0.1% |
| Western Africa | 958 | 0.2% |
| Western Asia | 2,953 | 0.5% |
| Western Europe | 2,479 | 0.4% |
| Zimbabwe | 9 | 0.0% | View All 126 Rows |
Sex and Age in Monmouth County
Sex and Age in Monmouth County
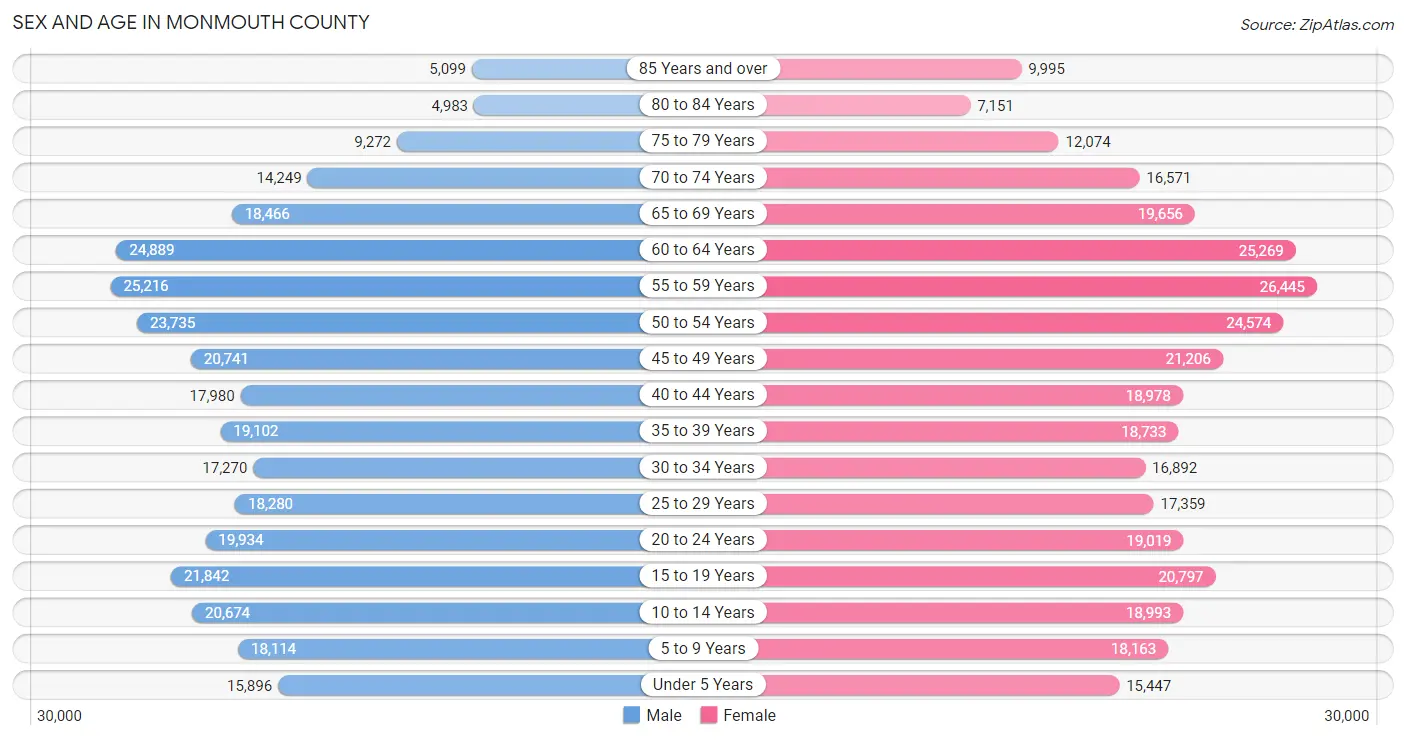
The most populous age groups in Monmouth County are 55 to 59 Years (25,216 | 8.0%) for men and 55 to 59 Years (26,445 | 8.1%) for women.
| Age Bracket | Male | Female |
| Under 5 Years | 15,896 (5.0%) | 15,447 (4.7%) |
| 5 to 9 Years | 18,114 (5.7%) | 18,163 (5.6%) |
| 10 to 14 Years | 20,674 (6.6%) | 18,993 (5.8%) |
| 15 to 19 Years | 21,842 (6.9%) | 20,797 (6.4%) |
| 20 to 24 Years | 19,934 (6.3%) | 19,019 (5.8%) |
| 25 to 29 Years | 18,280 (5.8%) | 17,359 (5.3%) |
| 30 to 34 Years | 17,270 (5.5%) | 16,892 (5.2%) |
| 35 to 39 Years | 19,102 (6.0%) | 18,733 (5.7%) |
| 40 to 44 Years | 17,980 (5.7%) | 18,978 (5.8%) |
| 45 to 49 Years | 20,741 (6.6%) | 21,206 (6.5%) |
| 50 to 54 Years | 23,735 (7.5%) | 24,574 (7.5%) |
| 55 to 59 Years | 25,216 (8.0%) | 26,445 (8.1%) |
| 60 to 64 Years | 24,889 (7.9%) | 25,269 (7.7%) |
| 65 to 69 Years | 18,466 (5.9%) | 19,656 (6.0%) |
| 70 to 74 Years | 14,249 (4.5%) | 16,571 (5.1%) |
| 75 to 79 Years | 9,272 (2.9%) | 12,074 (3.7%) |
| 80 to 84 Years | 4,983 (1.6%) | 7,151 (2.2%) |
| 85 Years and over | 5,099 (1.6%) | 9,995 (3.0%) |
| Total | 315,742 (100.0%) | 327,322 (100.0%) |
Families and Households in Monmouth County
Median Family Size in Monmouth County
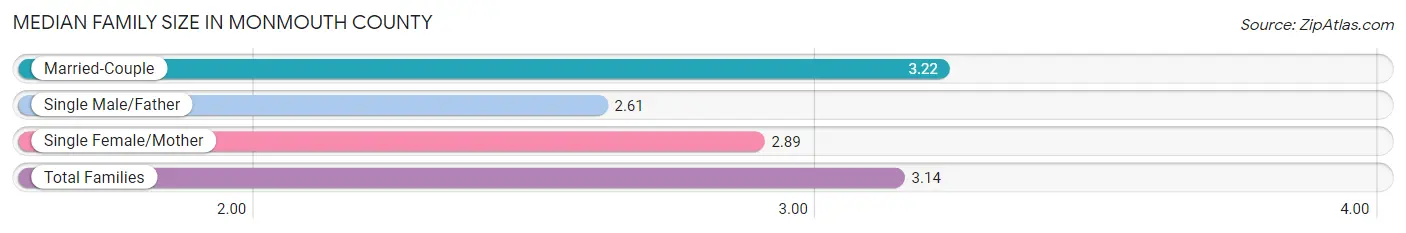
The median family size in Monmouth County is 3.14 persons per family, with married-couple families (136,568 | 80.8%) accounting for the largest median family size of 3.22 persons per family. On the other hand, single male/father families (9,354 | 5.5%) represent the smallest median family size with 2.61 persons per family.
| Family Type | # Families | Family Size |
| Married-Couple | 136,568 (80.8%) | 3.22 |
| Single Male/Father | 9,354 (5.5%) | 2.61 |
| Single Female/Mother | 22,992 (13.6%) | 2.89 |
| Total Families | 168,914 (100.0%) | 3.14 |
Median Household Size in Monmouth County
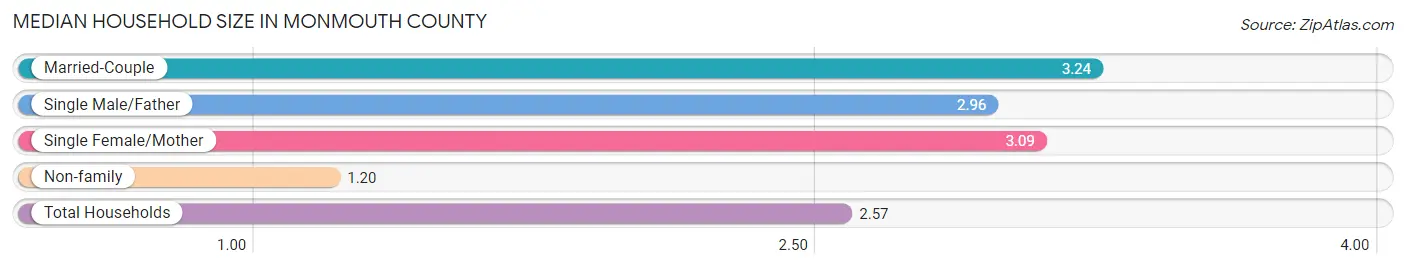
The median household size in Monmouth County is 2.57 persons per household, with married-couple households (136,568 | 55.0%) accounting for the largest median household size of 3.24 persons per household. non-family households (79,203 | 31.9%) represent the smallest median household size with 1.20 persons per household.
| Household Type | # Households | Household Size |
| Married-Couple | 136,568 (55.0%) | 3.24 |
| Single Male/Father | 9,354 (3.8%) | 2.96 |
| Single Female/Mother | 22,992 (9.3%) | 3.09 |
| Non-family | 79,203 (31.9%) | 1.20 |
| Total Households | 248,117 (100.0%) | 2.57 |
Household Size by Marriage Status in Monmouth County
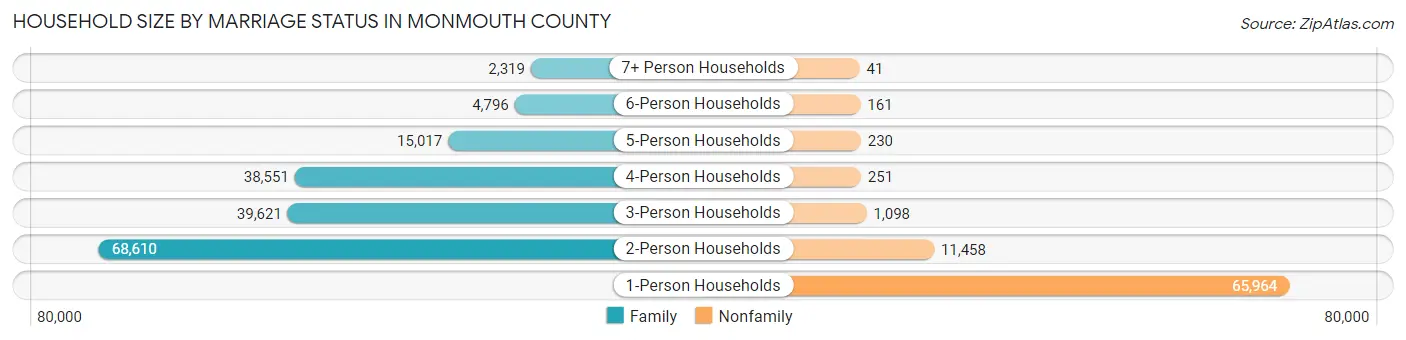
Out of a total of 248,117 households in Monmouth County, 168,914 (68.1%) are family households, while 79,203 (31.9%) are nonfamily households. The most numerous type of family households are 2-person households, comprising 68,610, and the most common type of nonfamily households are 1-person households, comprising 65,964.
| Household Size | Family Households | Nonfamily Households |
| 1-Person Households | - | 65,964 (26.6%) |
| 2-Person Households | 68,610 (27.7%) | 11,458 (4.6%) |
| 3-Person Households | 39,621 (16.0%) | 1,098 (0.4%) |
| 4-Person Households | 38,551 (15.5%) | 251 (0.1%) |
| 5-Person Households | 15,017 (6.0%) | 230 (0.1%) |
| 6-Person Households | 4,796 (1.9%) | 161 (0.1%) |
| 7+ Person Households | 2,319 (0.9%) | 41 (0.0%) |
| Total | 168,914 (68.1%) | 79,203 (31.9%) |
Female Fertility in Monmouth County
Fertility by Age in Monmouth County
Average fertility rate in Monmouth County is 47.0 births per 1,000 women. Women in the age bracket of 20 to 34 years have the highest fertility rate with 68.0 births per 1,000 women. Women in the age bracket of 20 to 34 years acount for 55.7% of all women with births.
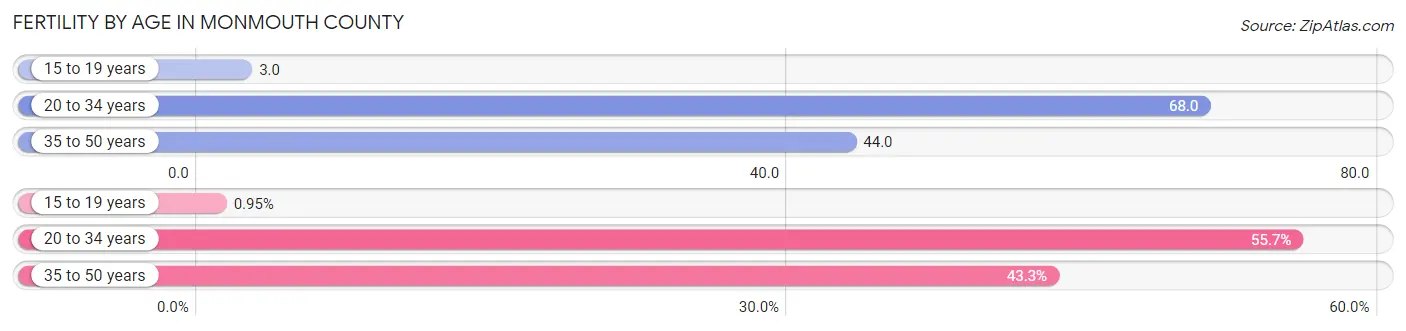
| Age Bracket | Women with Births | Births / 1,000 Women |
| 15 to 19 years | 62 (0.9%) | 3.0 |
| 20 to 34 years | 3,637 (55.7%) | 68.0 |
| 35 to 50 years | 2,826 (43.3%) | 44.0 |
| Total | 6,525 (100.0%) | 47.0 |
Fertility by Age by Marriage Status in Monmouth County
83.3% of women with births (6,525) in Monmouth County are married. The highest percentage of unmarried women with births falls into 15 to 19 years age bracket with 45.2% of them unmarried at the time of birth, while the lowest percentage of unmarried women with births belong to 35 to 50 years age bracket with 10.1% of them unmarried.
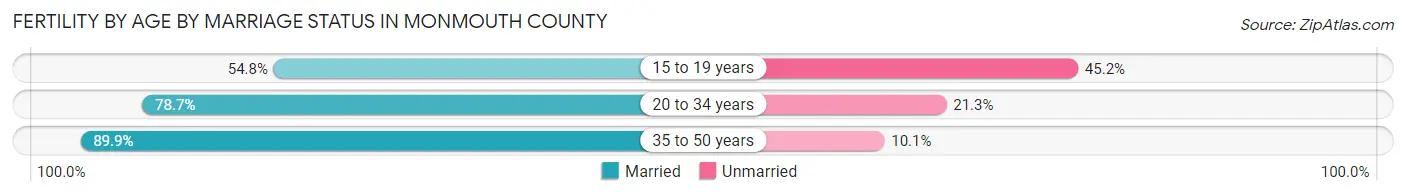
| Age Bracket | Married | Unmarried |
| 15 to 19 years | 34 (54.8%) | 28 (45.2%) |
| 20 to 34 years | 2,862 (78.7%) | 775 (21.3%) |
| 35 to 50 years | 2,541 (89.9%) | 285 (10.1%) |
| Total | 5,435 (83.3%) | 1,090 (16.7%) |
Fertility by Education in Monmouth County
Average fertility rate in Monmouth County is 47.0 births per 1,000 women. Women with the education attainment of graduate degree have the highest fertility rate of 77.0 births per 1,000 women, while women with the education attainment of less than high school have the lowest fertility at 28.0 births per 1,000 women. Women with the education attainment of bachelor's degree represent 33.6% of all women with births.
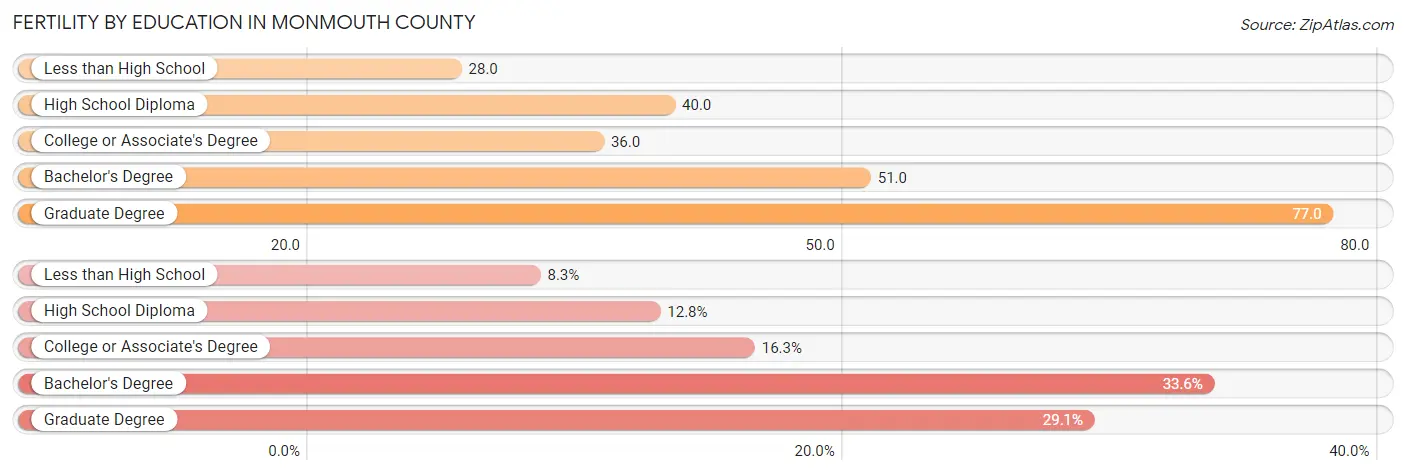
| Educational Attainment | Women with Births | Births / 1,000 Women |
| Less than High School | 541 (8.3%) | 28.0 |
| High School Diploma | 834 (12.8%) | 40.0 |
| College or Associate's Degree | 1,065 (16.3%) | 36.0 |
| Bachelor's Degree | 2,189 (33.6%) | 51.0 |
| Graduate Degree | 1,896 (29.1%) | 77.0 |
| Total | 6,525 (100.0%) | 47.0 |
Fertility by Education by Marriage Status in Monmouth County
16.7% of women with births in Monmouth County are unmarried. Women with the educational attainment of graduate degree are most likely to be married with 93.2% of them married at childbirth, while women with the educational attainment of less than high school are least likely to be married with 34.2% of them unmarried at childbirth.
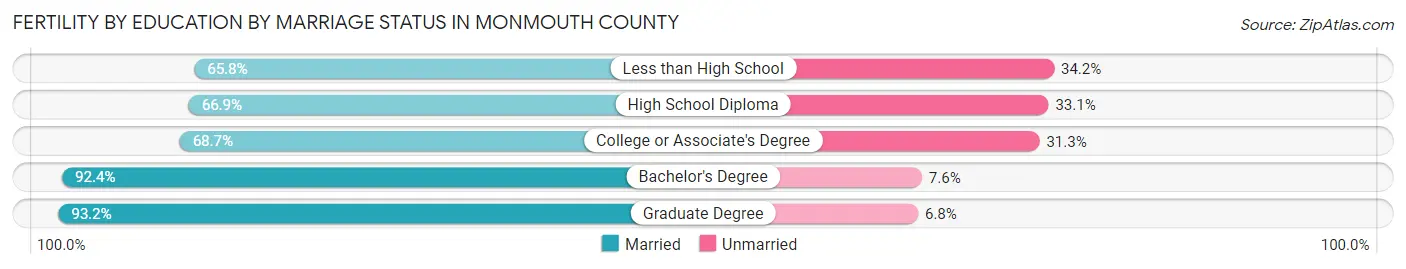
| Educational Attainment | Married | Unmarried |
| Less than High School | 356 (65.8%) | 185 (34.2%) |
| High School Diploma | 558 (66.9%) | 276 (33.1%) |
| College or Associate's Degree | 732 (68.7%) | 333 (31.3%) |
| Bachelor's Degree | 2,023 (92.4%) | 166 (7.6%) |
| Graduate Degree | 1,767 (93.2%) | 129 (6.8%) |
| Total | 5,435 (83.3%) | 1,090 (16.7%) |
Income in Monmouth County
Income Overview in Monmouth County
Per Capita Income in Monmouth County is $62,998, while median incomes of families and households are $150,040 and $118,527 respectively.
| Characteristic | Number | Measure |
| Per Capita Income | 643,064 | $62,998 |
| Median Family Income | 168,914 | $150,040 |
| Mean Family Income | 168,914 | $193,357 |
| Median Household Income | 248,117 | $118,527 |
| Mean Household Income | 248,117 | $162,075 |
| Income Deficit | 168,914 | $11,768 |
| Wage / Income Gap (%) | 643,064 | 38.17% |
| Wage / Income Gap ($) | 643,064 | 61.83¢ per $1 |
| Gini / Inequality Index | 643,064 | 0.48 |
Earnings by Sex in Monmouth County
Average Earnings in Monmouth County are $58,715, $73,636 for men and $45,526 for women, a difference of 38.2%.
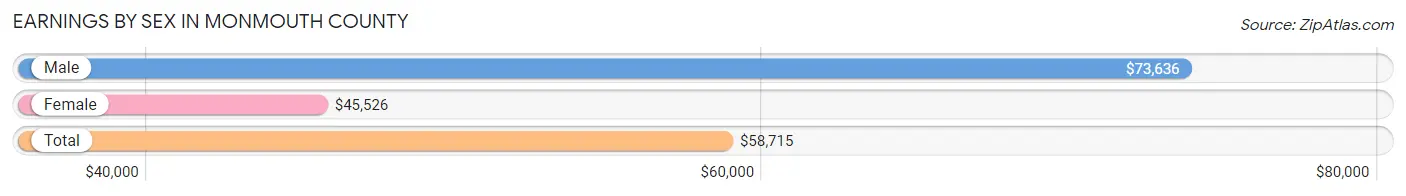
| Sex | Number | Average Earnings |
| Male | 192,709 (52.7%) | $73,636 |
| Female | 172,718 (47.3%) | $45,526 |
| Total | 365,427 (100.0%) | $58,715 |
Earnings by Sex by Income Bracket in Monmouth County
The most common earnings brackets in Monmouth County are $100,000+ for men (72,773 | 37.8%) and $100,000+ for women (31,233 | 18.1%).
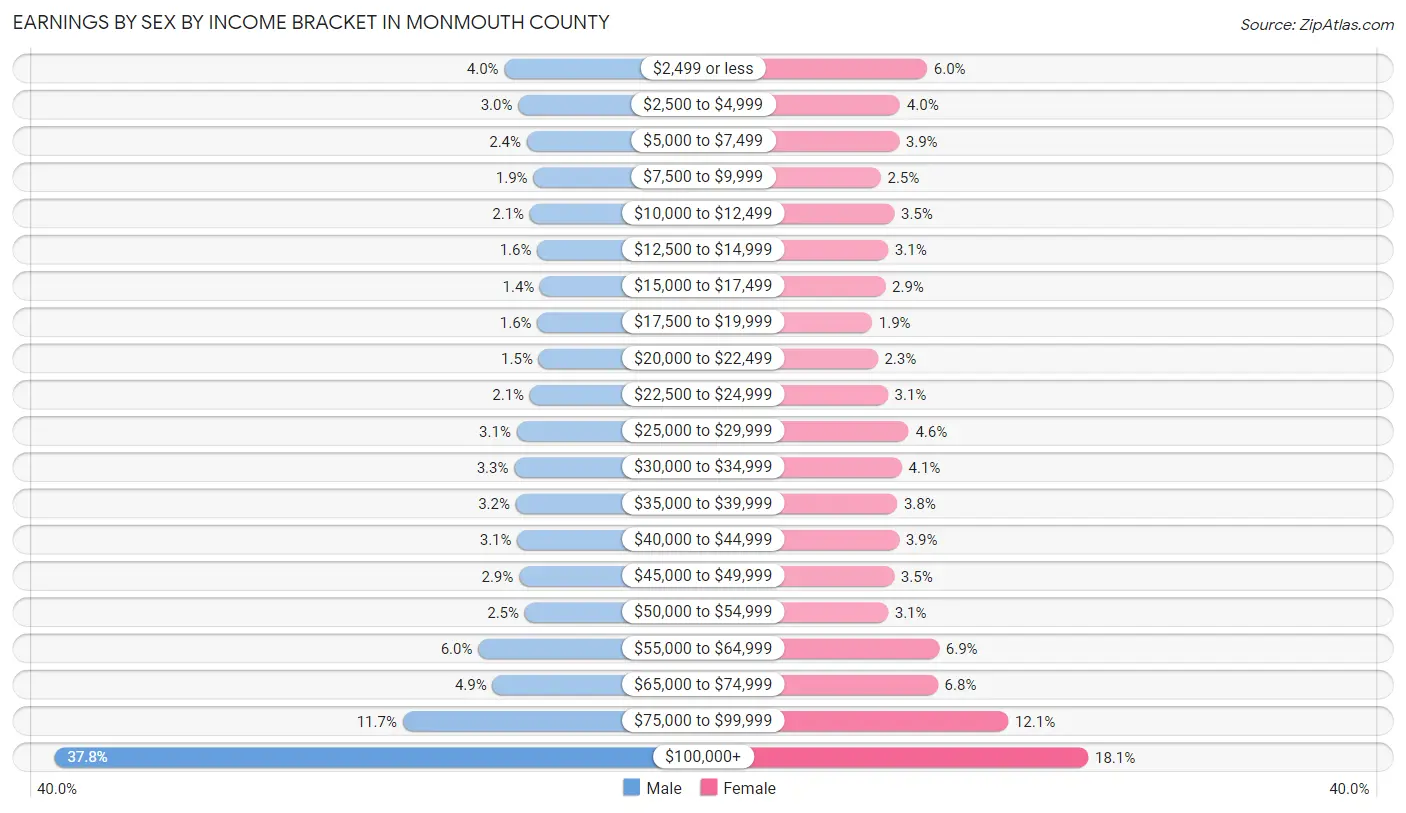
| Income | Male | Female |
| $2,499 or less | 7,779 (4.0%) | 10,363 (6.0%) |
| $2,500 to $4,999 | 5,784 (3.0%) | 6,876 (4.0%) |
| $5,000 to $7,499 | 4,545 (2.4%) | 6,744 (3.9%) |
| $7,500 to $9,999 | 3,611 (1.9%) | 4,377 (2.5%) |
| $10,000 to $12,499 | 4,109 (2.1%) | 6,111 (3.5%) |
| $12,500 to $14,999 | 3,047 (1.6%) | 5,317 (3.1%) |
| $15,000 to $17,499 | 2,622 (1.4%) | 4,960 (2.9%) |
| $17,500 to $19,999 | 3,016 (1.6%) | 3,250 (1.9%) |
| $20,000 to $22,499 | 2,841 (1.5%) | 3,980 (2.3%) |
| $22,500 to $24,999 | 4,101 (2.1%) | 5,282 (3.1%) |
| $25,000 to $29,999 | 6,016 (3.1%) | 7,988 (4.6%) |
| $30,000 to $34,999 | 6,364 (3.3%) | 7,102 (4.1%) |
| $35,000 to $39,999 | 6,145 (3.2%) | 6,489 (3.8%) |
| $40,000 to $44,999 | 5,925 (3.1%) | 6,727 (3.9%) |
| $45,000 to $49,999 | 5,665 (2.9%) | 6,089 (3.5%) |
| $50,000 to $54,999 | 4,836 (2.5%) | 5,296 (3.1%) |
| $55,000 to $64,999 | 11,563 (6.0%) | 11,917 (6.9%) |
| $65,000 to $74,999 | 9,501 (4.9%) | 11,759 (6.8%) |
| $75,000 to $99,999 | 22,466 (11.7%) | 20,858 (12.1%) |
| $100,000+ | 72,773 (37.8%) | 31,233 (18.1%) |
| Total | 192,709 (100.0%) | 172,718 (100.0%) |
Earnings by Sex by Educational Attainment in Monmouth County
Average earnings in Monmouth County are $85,889 for men and $55,600 for women, a difference of 35.3%. Men with an educational attainment of graduate degree enjoy the highest average annual earnings of $142,428, while those with less than high school education earn the least with $35,666. Women with an educational attainment of graduate degree earn the most with the average annual earnings of $82,702, while those with less than high school education have the smallest earnings of $25,541.
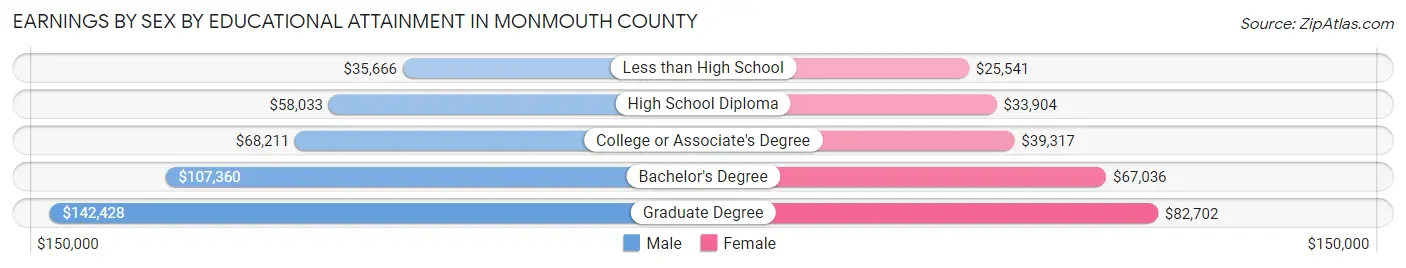
| Educational Attainment | Male Income | Female Income |
| Less than High School | $35,666 | $25,541 |
| High School Diploma | $58,033 | $33,904 |
| College or Associate's Degree | $68,211 | $39,317 |
| Bachelor's Degree | $107,360 | $67,036 |
| Graduate Degree | $142,428 | $82,702 |
| Total | $85,889 | $55,600 |
Family Income in Monmouth County
Family Income Brackets in Monmouth County
According to the Monmouth County family income data, there are 57,093 families falling into the $200,000+ income range, which is the most common income bracket and makes up 33.8% of all families. Conversely, the $10,000 to $14,999 income bracket is the least frequent group with only 1,351 families (0.8%) belonging to this category.
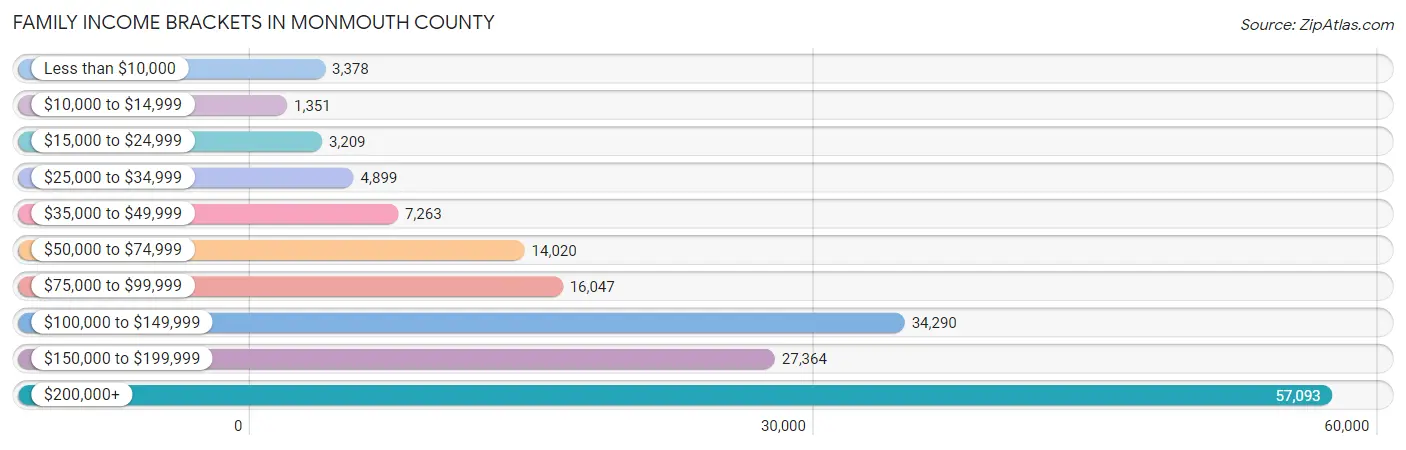
| Income Bracket | # Families | % Families |
| Less than $10,000 | 3,378 | 2.0% |
| $10,000 to $14,999 | 1,351 | 0.8% |
| $15,000 to $24,999 | 3,209 | 1.9% |
| $25,000 to $34,999 | 4,899 | 2.9% |
| $35,000 to $49,999 | 7,263 | 4.3% |
| $50,000 to $74,999 | 14,020 | 8.3% |
| $75,000 to $99,999 | 16,047 | 9.5% |
| $100,000 to $149,999 | 34,290 | 20.3% |
| $150,000 to $199,999 | 27,364 | 16.2% |
| $200,000+ | 57,093 | 33.8% |
Family Income by Famaliy Size in Monmouth County
6-person families (4,256 | 2.5%) account for the highest median family income in Monmouth County with $192,344 per family, while 2-person families (72,119 | 42.7%) have the highest median income of $59,845 per family member.
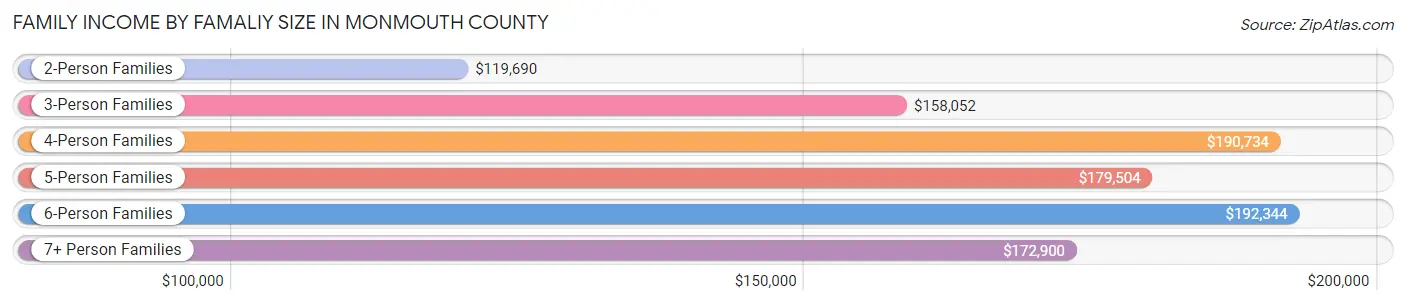
| Income Bracket | # Families | Median Income |
| 2-Person Families | 72,119 (42.7%) | $119,690 |
| 3-Person Families | 38,698 (22.9%) | $158,052 |
| 4-Person Families | 37,848 (22.4%) | $190,734 |
| 5-Person Families | 14,405 (8.5%) | $179,504 |
| 6-Person Families | 4,256 (2.5%) | $192,344 |
| 7+ Person Families | 1,588 (0.9%) | $172,900 |
| Total | 168,914 (100.0%) | $150,040 |
Family Income by Number of Earners in Monmouth County
The median family income in Monmouth County is $150,040, with families comprising 3+ earners (29,283) having the highest median family income of $203,009, while families with no earners (20,647) have the lowest median family income of $83,544, accounting for 17.3% and 12.2% of families, respectively.
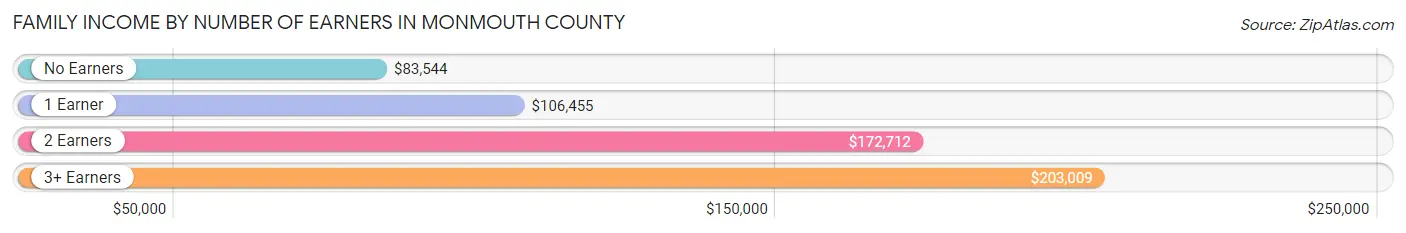
| Number of Earners | # Families | Median Income |
| No Earners | 20,647 (12.2%) | $83,544 |
| 1 Earner | 44,731 (26.5%) | $106,455 |
| 2 Earners | 74,253 (44.0%) | $172,712 |
| 3+ Earners | 29,283 (17.3%) | $203,009 |
| Total | 168,914 (100.0%) | $150,040 |
Household Income in Monmouth County
Household Income Brackets in Monmouth County
With 64,510 households falling in the category, the $200,000+ income range is the most frequent in Monmouth County, accounting for 26.0% of all households. In contrast, only 5,459 households (2.2%) fall into the $10,000 to $14,999 income bracket, making it the least populous group.
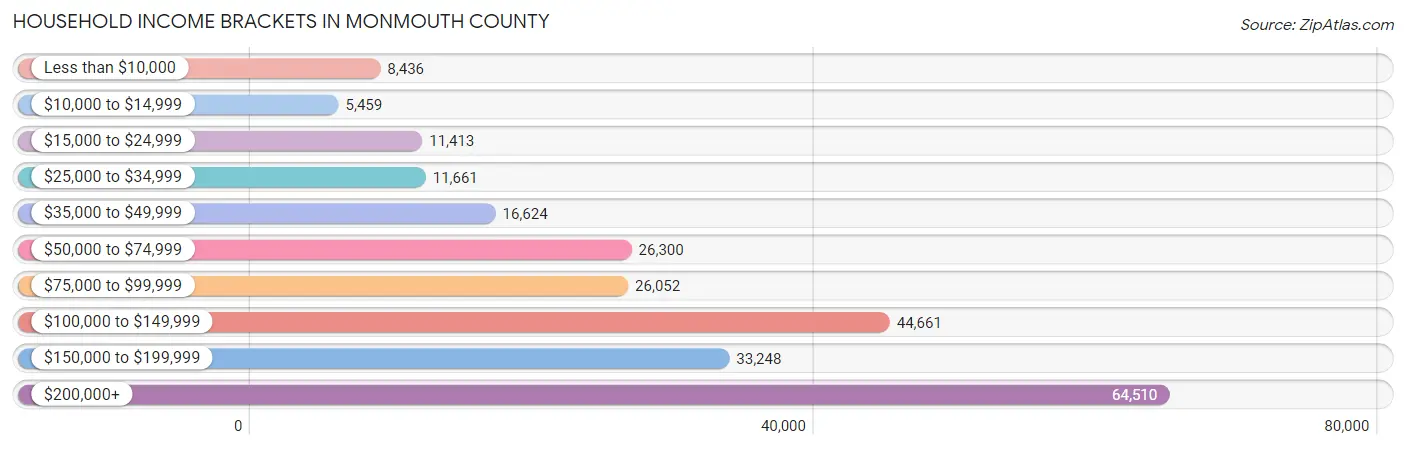
| Income Bracket | # Households | % Households |
| Less than $10,000 | 8,436 | 3.4% |
| $10,000 to $14,999 | 5,459 | 2.2% |
| $15,000 to $24,999 | 11,413 | 4.6% |
| $25,000 to $34,999 | 11,661 | 4.7% |
| $35,000 to $49,999 | 16,624 | 6.7% |
| $50,000 to $74,999 | 26,300 | 10.6% |
| $75,000 to $99,999 | 26,052 | 10.5% |
| $100,000 to $149,999 | 44,661 | 18.0% |
| $150,000 to $199,999 | 33,248 | 13.4% |
| $200,000+ | 64,510 | 26.0% |
Household Income by Householder Age in Monmouth County
The median household income in Monmouth County is $118,527, with the highest median household income of $148,135 found in the 45 to 64 years age bracket for the primary householder. A total of 107,666 households (43.4%) fall into this category. Meanwhile, the 15 to 24 years age bracket for the primary householder has the lowest median household income of $63,730, with 2,838 households (1.1%) in this group.
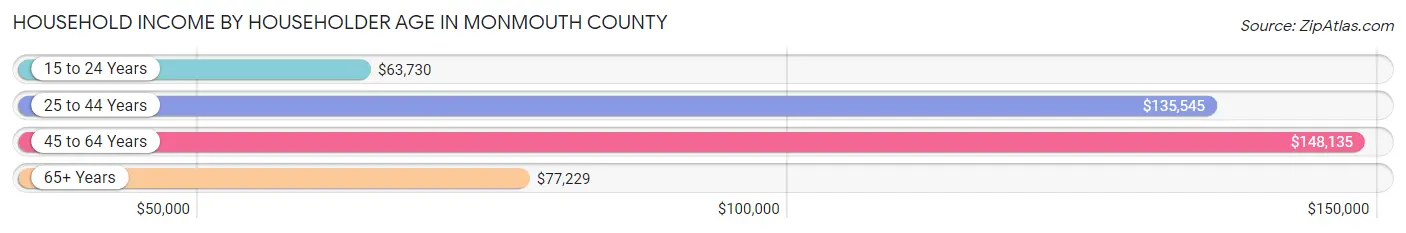
| Income Bracket | # Households | Median Income |
| 15 to 24 Years | 2,838 (1.1%) | $63,730 |
| 25 to 44 Years | 62,686 (25.3%) | $135,545 |
| 45 to 64 Years | 107,666 (43.4%) | $148,135 |
| 65+ Years | 74,927 (30.2%) | $77,229 |
| Total | 248,117 (100.0%) | $118,527 |
Poverty in Monmouth County
Income Below Poverty by Sex and Age in Monmouth County
With 5.5% poverty level for males and 7.2% for females among the residents of Monmouth County, under 5 year old males and 75 year old and over females are the most vulnerable to poverty, with 1,251 males (8.0%) and 3,133 females (11.1%) in their respective age groups living below the poverty level.
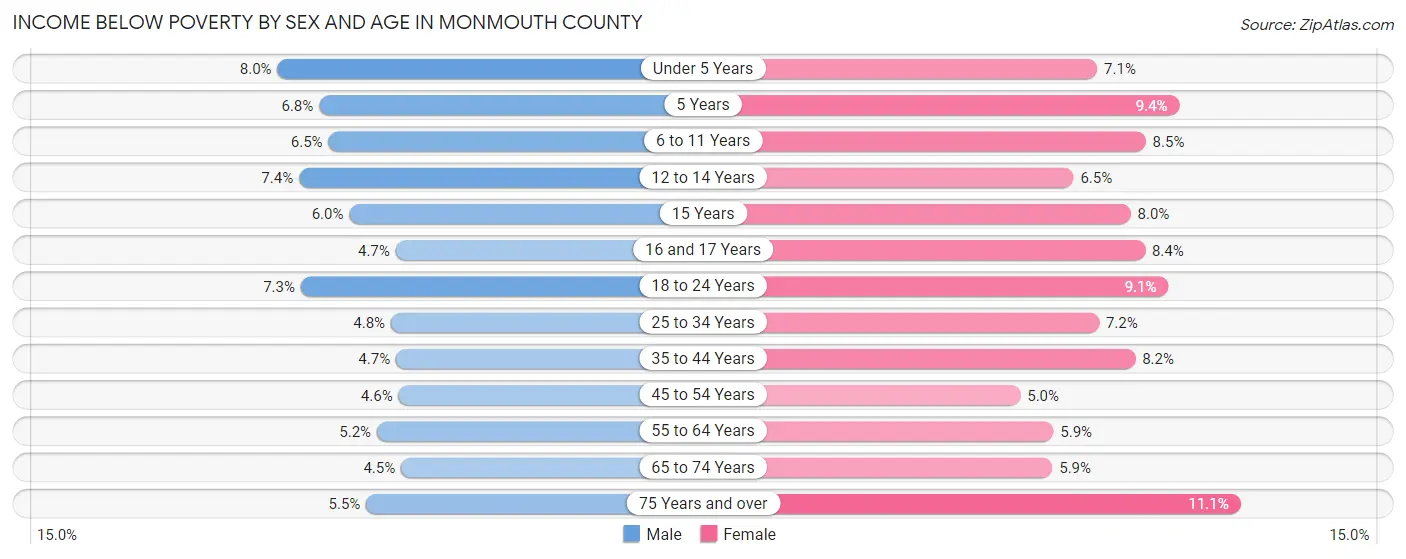
| Age Bracket | Male | Female |
| Under 5 Years | 1,251 (8.0%) | 1,082 (7.1%) |
| 5 Years | 212 (6.8%) | 350 (9.4%) |
| 6 to 11 Years | 1,487 (6.5%) | 1,815 (8.5%) |
| 12 to 14 Years | 917 (7.4%) | 736 (6.5%) |
| 15 Years | 282 (6.0%) | 291 (8.0%) |
| 16 and 17 Years | 417 (4.7%) | 793 (8.4%) |
| 18 to 24 Years | 1,990 (7.3%) | 2,371 (9.1%) |
| 25 to 34 Years | 1,696 (4.8%) | 2,449 (7.2%) |
| 35 to 44 Years | 1,720 (4.7%) | 3,077 (8.2%) |
| 45 to 54 Years | 2,035 (4.6%) | 2,273 (5.0%) |
| 55 to 64 Years | 2,588 (5.2%) | 3,037 (5.9%) |
| 65 to 74 Years | 1,467 (4.5%) | 2,098 (5.9%) |
| 75 Years and over | 1,028 (5.5%) | 3,133 (11.1%) |
| Total | 17,090 (5.5%) | 23,505 (7.2%) |
Income Above Poverty by Sex and Age in Monmouth County
According to the poverty statistics in Monmouth County, males aged 65 to 74 years and females aged 45 to 54 years are the age groups that are most secure financially, with 95.5% of males and 95.0% of females in these age groups living above the poverty line.
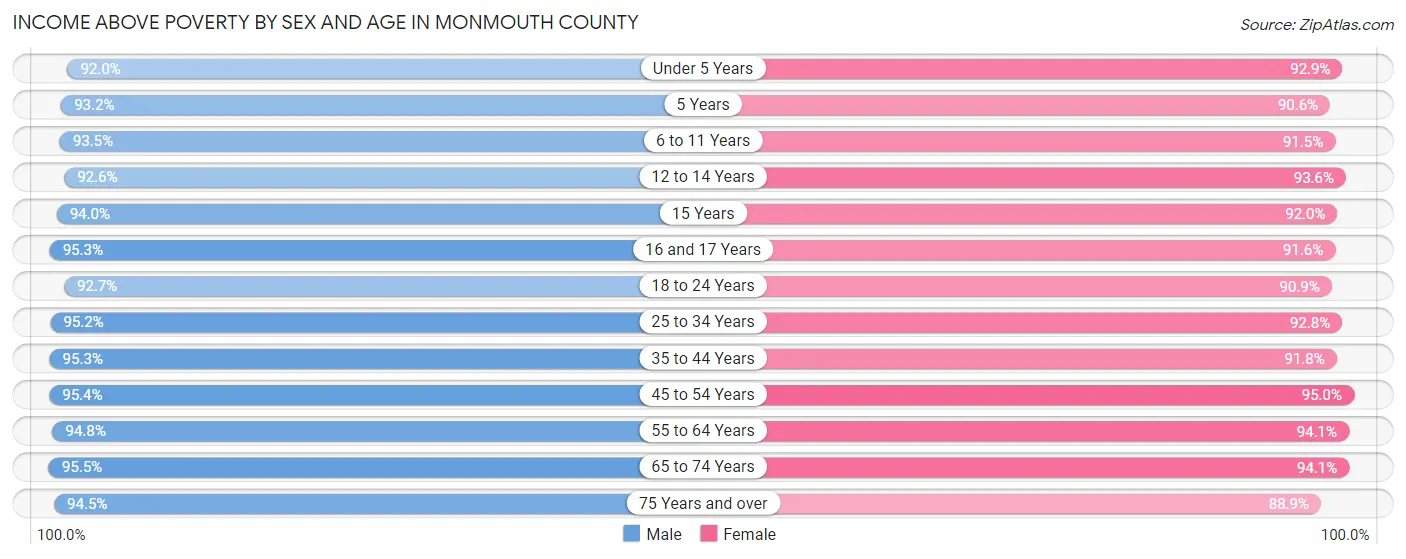
| Age Bracket | Male | Female |
| Under 5 Years | 14,474 (92.0%) | 14,128 (92.9%) |
| 5 Years | 2,907 (93.2%) | 3,373 (90.6%) |
| 6 to 11 Years | 21,234 (93.5%) | 19,644 (91.5%) |
| 12 to 14 Years | 11,537 (92.6%) | 10,673 (93.5%) |
| 15 Years | 4,450 (94.0%) | 3,329 (92.0%) |
| 16 and 17 Years | 8,507 (95.3%) | 8,604 (91.6%) |
| 18 to 24 Years | 25,229 (92.7%) | 23,700 (90.9%) |
| 25 to 34 Years | 33,645 (95.2%) | 31,736 (92.8%) |
| 35 to 44 Years | 35,160 (95.3%) | 34,578 (91.8%) |
| 45 to 54 Years | 42,325 (95.4%) | 43,462 (95.0%) |
| 55 to 64 Years | 47,305 (94.8%) | 48,526 (94.1%) |
| 65 to 74 Years | 31,020 (95.5%) | 33,733 (94.1%) |
| 75 Years and over | 17,682 (94.5%) | 25,101 (88.9%) |
| Total | 295,475 (94.5%) | 300,587 (92.7%) |
Income Below Poverty Among Married-Couple Families in Monmouth County
The poverty statistics for married-couple families in Monmouth County show that 2.1% or 2,901 of the total 136,568 families live below the poverty line. Families with 3 or 4 children have the highest poverty rate of 6.8%, comprising of 628 families. On the other hand, families with 5 or more children have the lowest poverty rate of 0.0%, which includes 0 families.
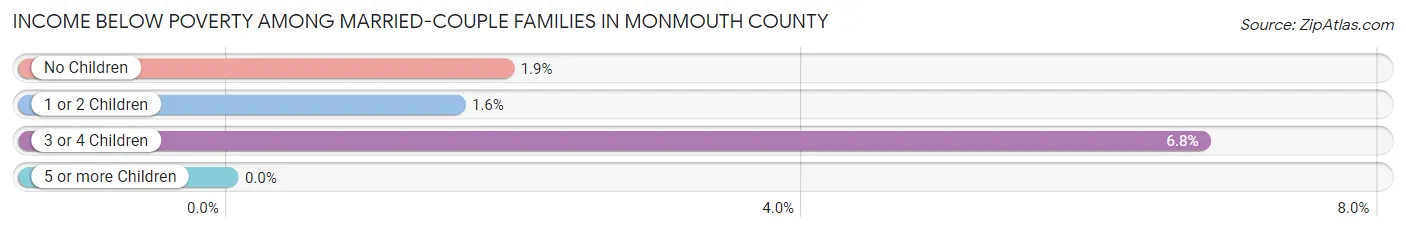
| Children | Above Poverty | Below Poverty |
| No Children | 77,717 (98.1%) | 1,519 (1.9%) |
| 1 or 2 Children | 46,907 (98.4%) | 754 (1.6%) |
| 3 or 4 Children | 8,645 (93.2%) | 628 (6.8%) |
| 5 or more Children | 398 (100.0%) | 0 (0.0%) |
| Total | 133,667 (97.9%) | 2,901 (2.1%) |
Income Below Poverty Among Single-Parent Households in Monmouth County
According to the poverty data in Monmouth County, 8.2% or 763 single-father households and 15.1% or 3,474 single-mother households are living below the poverty line. Among single-father households, those with 3 or 4 children have the highest poverty rate, with 103 households (23.7%) experiencing poverty. Likewise, among single-mother households, those with 3 or 4 children have the highest poverty rate, with 497 households (28.2%) falling below the poverty line.
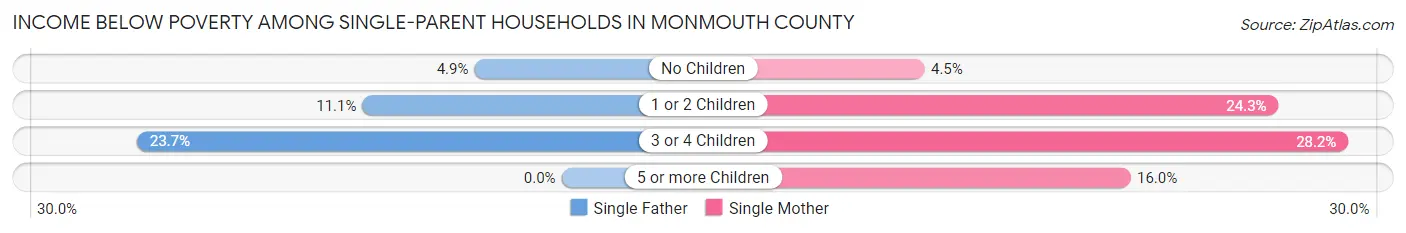
| Children | Single Father | Single Mother |
| No Children | 259 (4.9%) | 494 (4.5%) |
| 1 or 2 Children | 401 (11.1%) | 2,475 (24.3%) |
| 3 or 4 Children | 103 (23.7%) | 497 (28.2%) |
| 5 or more Children | 0 (0.0%) | 8 (16.0%) |
| Total | 763 (8.2%) | 3,474 (15.1%) |
Income Below Poverty Among Married-Couple vs Single-Parent Households in Monmouth County
The poverty data for Monmouth County shows that 2,901 of the married-couple family households (2.1%) and 4,237 of the single-parent households (13.1%) are living below the poverty level. Within the married-couple family households, those with 3 or 4 children have the highest poverty rate, with 628 households (6.8%) falling below the poverty line. Among the single-parent households, those with 3 or 4 children have the highest poverty rate, with 600 household (27.3%) living below poverty.
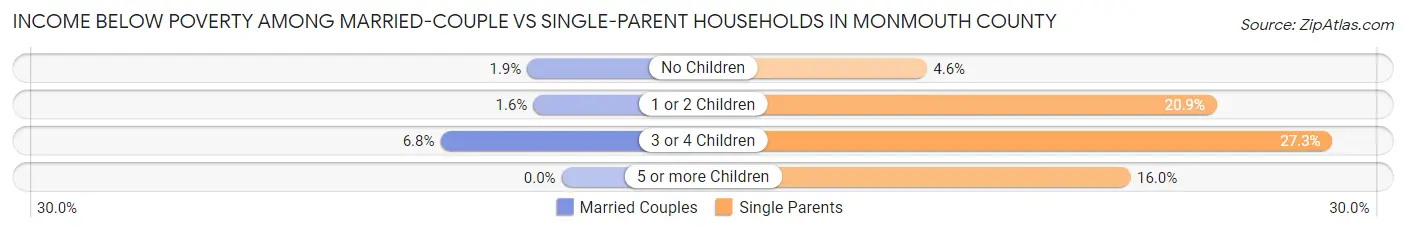
| Children | Married-Couple Families | Single-Parent Households |
| No Children | 1,519 (1.9%) | 753 (4.6%) |
| 1 or 2 Children | 754 (1.6%) | 2,876 (20.8%) |
| 3 or 4 Children | 628 (6.8%) | 600 (27.3%) |
| 5 or more Children | 0 (0.0%) | 8 (16.0%) |
| Total | 2,901 (2.1%) | 4,237 (13.1%) |
Employment Characteristics in Monmouth County
Employment by Class of Employer in Monmouth County
Among the 325,055 employed individuals in Monmouth County, private company employees (225,600 | 69.4%), local government employees (29,911 | 9.2%), and not-for-profit organizations (20,774 | 6.4%) make up the most common classes of employment.
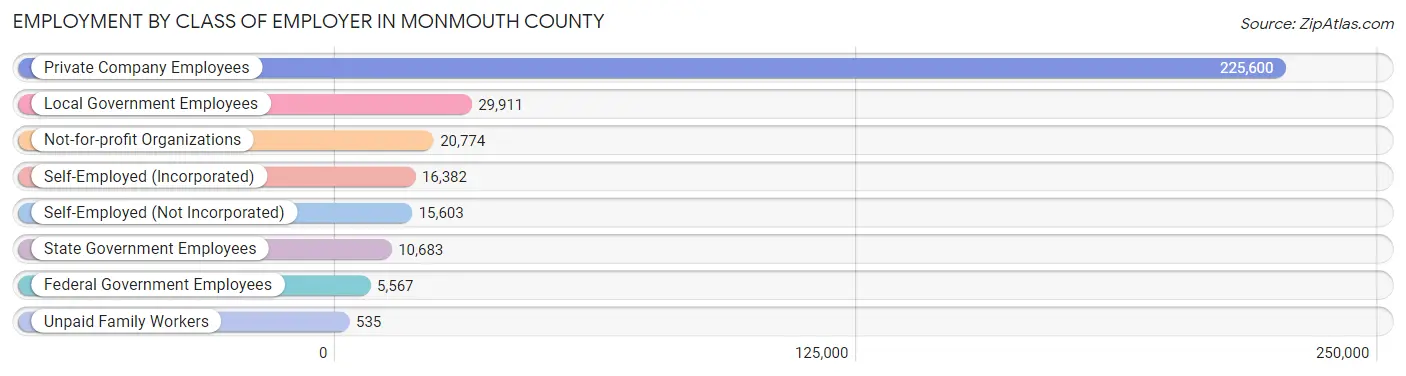
| Employer Class | # Employees | % Employees |
| Private Company Employees | 225,600 | 69.4% |
| Self-Employed (Incorporated) | 16,382 | 5.0% |
| Self-Employed (Not Incorporated) | 15,603 | 4.8% |
| Not-for-profit Organizations | 20,774 | 6.4% |
| Local Government Employees | 29,911 | 9.2% |
| State Government Employees | 10,683 | 3.3% |
| Federal Government Employees | 5,567 | 1.7% |
| Unpaid Family Workers | 535 | 0.2% |
| Total | 325,055 | 100.0% |
Employment Status by Age in Monmouth County
According to the labor force statistics for Monmouth County, out of the total population over 16 years of age (527,423), 66.5% or 350,736 individuals are in the labor force, with 5.4% or 18,940 of them unemployed. The age group with the highest labor force participation rate is 25 to 29 years, with 89.9% or 32,039 individuals in the labor force. Within the labor force, the 16 to 19 years age range has the highest percentage of unemployed individuals, with 10.6% or 1,523 of them being unemployed.
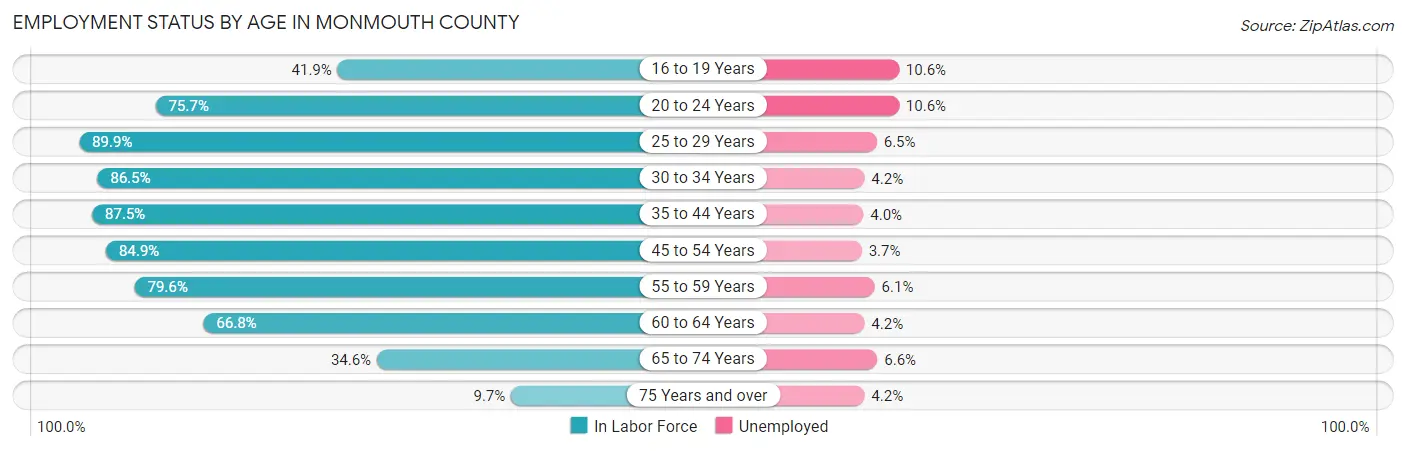
| Age Bracket | In Labor Force | Unemployed |
| 16 to 19 Years | 14,365 (41.9%) | 1,523 (10.6%) |
| 20 to 24 Years | 29,487 (75.7%) | 3,126 (10.6%) |
| 25 to 29 Years | 32,039 (89.9%) | 2,083 (6.5%) |
| 30 to 34 Years | 29,550 (86.5%) | 1,241 (4.2%) |
| 35 to 44 Years | 65,444 (87.5%) | 2,618 (4.0%) |
| 45 to 54 Years | 76,627 (84.9%) | 2,835 (3.7%) |
| 55 to 59 Years | 41,122 (79.6%) | 2,508 (6.1%) |
| 60 to 64 Years | 33,506 (66.8%) | 1,407 (4.2%) |
| 65 to 74 Years | 23,854 (34.6%) | 1,574 (6.6%) |
| 75 Years and over | 4,712 (9.7%) | 198 (4.2%) |
| Total | 350,736 (66.5%) | 18,940 (5.4%) |
Employment Status by Educational Attainment in Monmouth County
According to labor force statistics for Monmouth County, 82.7% of individuals (278,425) out of the total population between 25 and 64 years of age (336,669) are in the labor force, with 4.6% or 12,808 of them being unemployed. The group with the highest labor force participation rate are those with the educational attainment of bachelor's degree or higher, with 87.2% or 155,794 individuals in the labor force. Within the labor force, individuals with less than high school education have the highest percentage of unemployment, with 6.2% or 671 of them being unemployed.
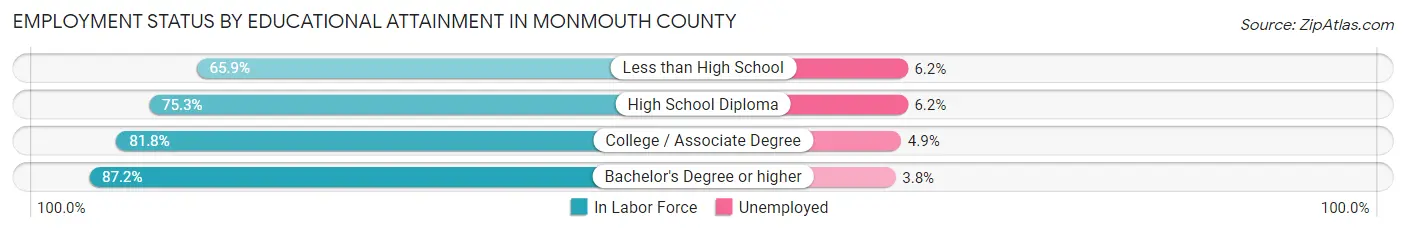
| Educational Attainment | In Labor Force | Unemployed |
| Less than High School | 10,825 (65.9%) | 1,018 (6.2%) |
| High School Diploma | 48,474 (75.3%) | 3,991 (6.2%) |
| College / Associate Degree | 63,153 (81.8%) | 3,783 (4.9%) |
| Bachelor's Degree or higher | 155,794 (87.2%) | 6,789 (3.8%) |
| Total | 278,425 (82.7%) | 15,487 (4.6%) |
Employment Occupations by Sex in Monmouth County
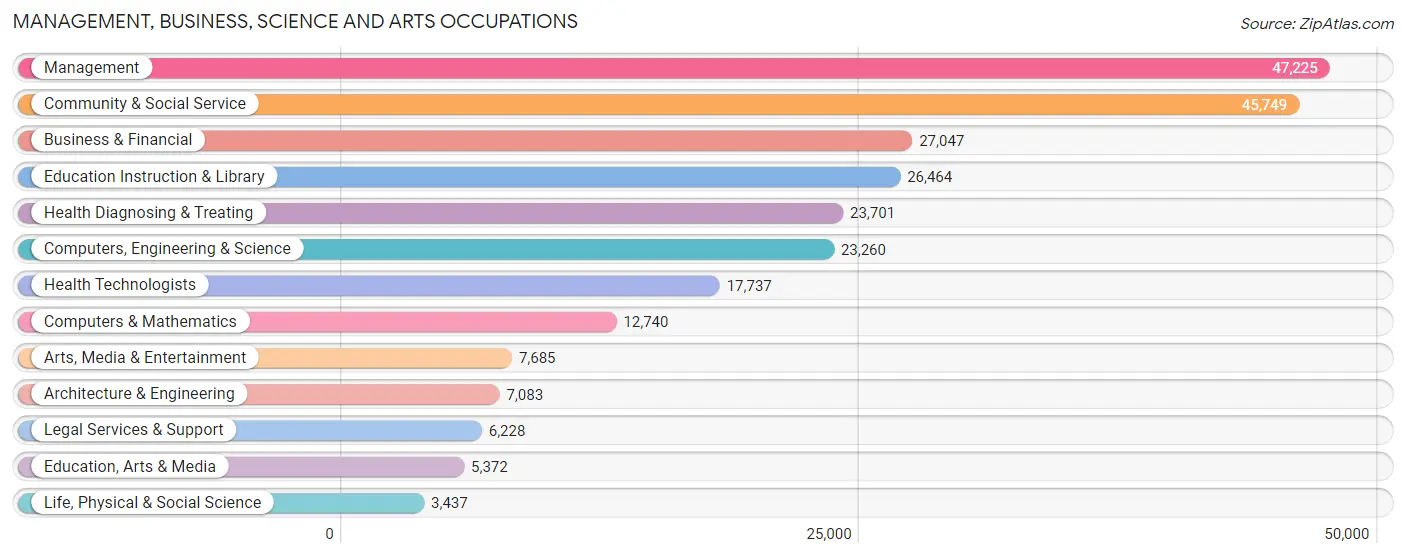
Management, Business, Science and Arts Occupations
The most common Management, Business, Science and Arts occupations in Monmouth County are Management (47,225 | 14.3%), Community & Social Service (45,749 | 13.8%), Business & Financial (27,047 | 8.2%), Education Instruction & Library (26,464 | 8.0%), and Health Diagnosing & Treating (23,701 | 7.2%).
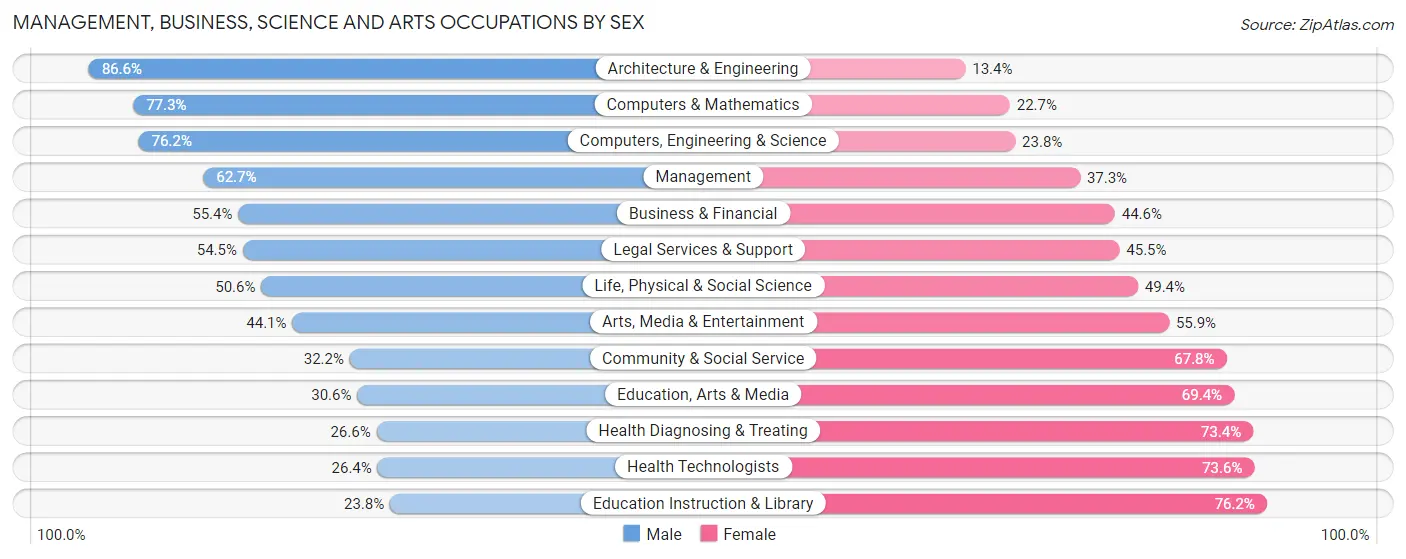
Management, Business, Science and Arts Occupations by Sex
Within the Management, Business, Science and Arts occupations in Monmouth County, the most male-oriented occupations are Architecture & Engineering (86.6%), Computers & Mathematics (77.3%), and Computers, Engineering & Science (76.2%), while the most female-oriented occupations are Education Instruction & Library (76.2%), Health Technologists (73.6%), and Health Diagnosing & Treating (73.4%).
| Occupation | Male | Female |
| Management | 29,614 (62.7%) | 17,611 (37.3%) |
| Business & Financial | 14,993 (55.4%) | 12,054 (44.6%) |
| Computers, Engineering & Science | 17,728 (76.2%) | 5,532 (23.8%) |
| Computers & Mathematics | 9,853 (77.3%) | 2,887 (22.7%) |
| Architecture & Engineering | 6,135 (86.6%) | 948 (13.4%) |
| Life, Physical & Social Science | 1,740 (50.6%) | 1,697 (49.4%) |
| Community & Social Service | 14,716 (32.2%) | 31,033 (67.8%) |
| Education, Arts & Media | 1,644 (30.6%) | 3,728 (69.4%) |
| Legal Services & Support | 3,393 (54.5%) | 2,835 (45.5%) |
| Education Instruction & Library | 6,287 (23.8%) | 20,177 (76.2%) |
| Arts, Media & Entertainment | 3,392 (44.1%) | 4,293 (55.9%) |
| Health Diagnosing & Treating | 6,302 (26.6%) | 17,399 (73.4%) |
| Health Technologists | 4,676 (26.4%) | 13,061 (73.6%) |
| Total (Category) | 83,353 (49.9%) | 83,629 (50.1%) |
| Total (Overall) | 174,909 (52.8%) | 156,223 (47.2%) |
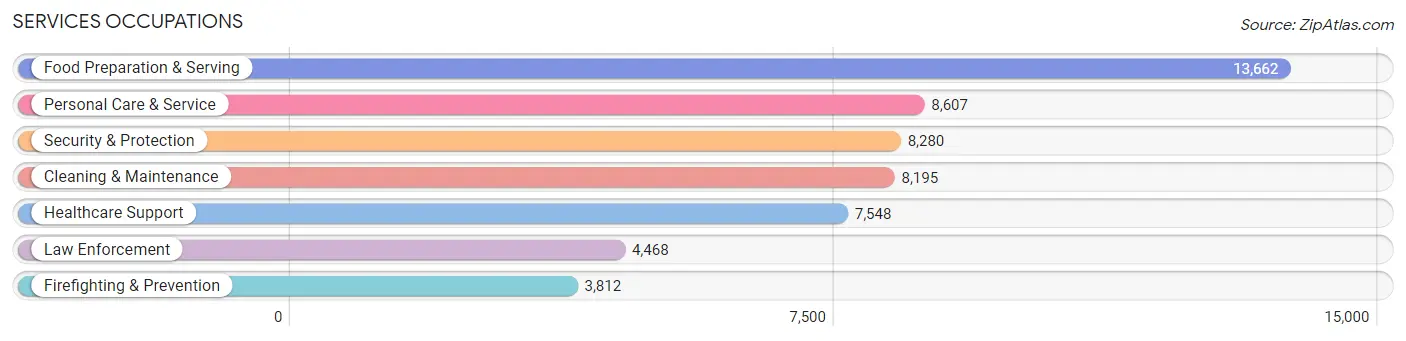
Services Occupations
The most common Services occupations in Monmouth County are Food Preparation & Serving (13,662 | 4.1%), Personal Care & Service (8,607 | 2.6%), Security & Protection (8,280 | 2.5%), Cleaning & Maintenance (8,195 | 2.5%), and Healthcare Support (7,548 | 2.3%).
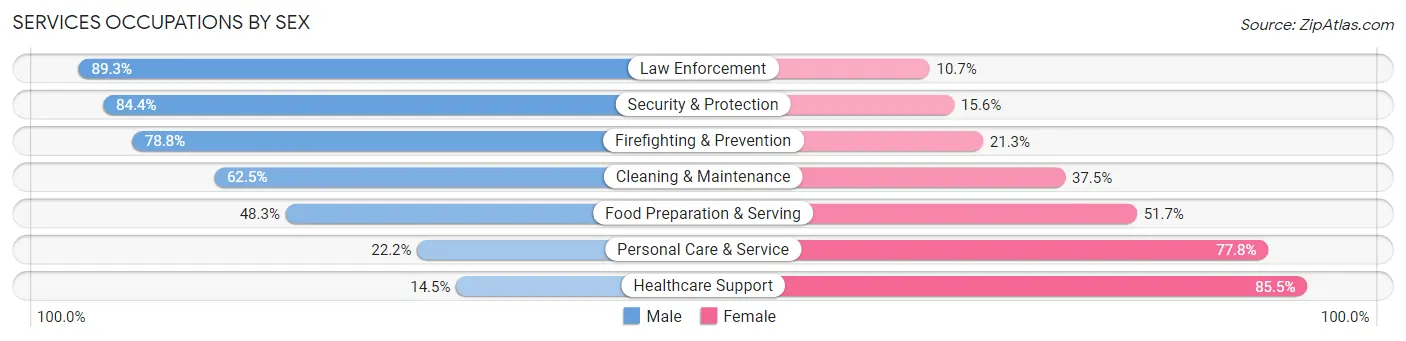
Services Occupations by Sex
Within the Services occupations in Monmouth County, the most male-oriented occupations are Law Enforcement (89.3%), Security & Protection (84.4%), and Firefighting & Prevention (78.7%), while the most female-oriented occupations are Healthcare Support (85.5%), Personal Care & Service (77.8%), and Food Preparation & Serving (51.7%).
| Occupation | Male | Female |
| Healthcare Support | 1,096 (14.5%) | 6,452 (85.5%) |
| Security & Protection | 6,992 (84.4%) | 1,288 (15.6%) |
| Firefighting & Prevention | 3,002 (78.7%) | 810 (21.2%) |
| Law Enforcement | 3,990 (89.3%) | 478 (10.7%) |
| Food Preparation & Serving | 6,597 (48.3%) | 7,065 (51.7%) |
| Cleaning & Maintenance | 5,121 (62.5%) | 3,074 (37.5%) |
| Personal Care & Service | 1,913 (22.2%) | 6,694 (77.8%) |
| Total (Category) | 21,719 (46.9%) | 24,573 (53.1%) |
| Total (Overall) | 174,909 (52.8%) | 156,223 (47.2%) |
Sales and Office Occupations
The most common Sales and Office occupations in Monmouth County are Sales & Related (38,820 | 11.7%), and Office & Administration (32,416 | 9.8%).
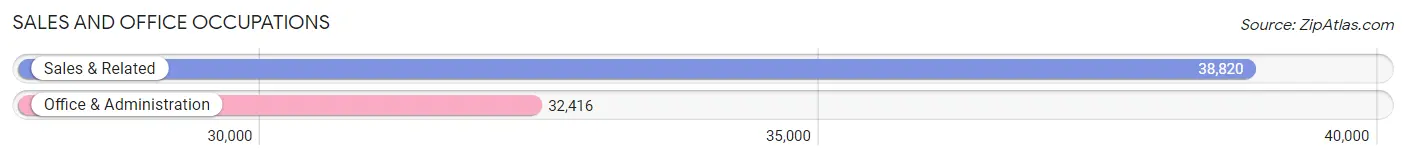
Sales and Office Occupations by Sex
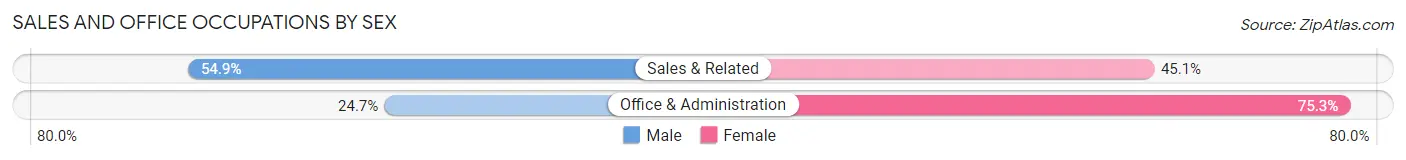
| Occupation | Male | Female |
| Sales & Related | 21,295 (54.9%) | 17,525 (45.1%) |
| Office & Administration | 8,002 (24.7%) | 24,414 (75.3%) |
| Total (Category) | 29,297 (41.1%) | 41,939 (58.9%) |
| Total (Overall) | 174,909 (52.8%) | 156,223 (47.2%) |
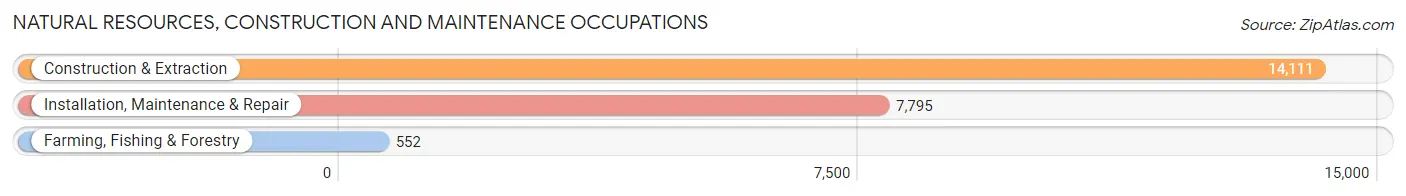
Natural Resources, Construction and Maintenance Occupations
The most common Natural Resources, Construction and Maintenance occupations in Monmouth County are Construction & Extraction (14,111 | 4.3%), Installation, Maintenance & Repair (7,795 | 2.4%), and Farming, Fishing & Forestry (552 | 0.2%).
Natural Resources, Construction and Maintenance Occupations by Sex
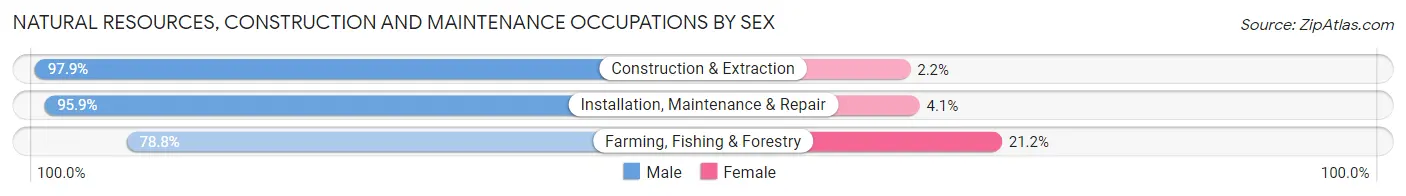
| Occupation | Male | Female |
| Farming, Fishing & Forestry | 435 (78.8%) | 117 (21.2%) |
| Construction & Extraction | 13,807 (97.9%) | 304 (2.1%) |
| Installation, Maintenance & Repair | 7,477 (95.9%) | 318 (4.1%) |
| Total (Category) | 21,719 (96.7%) | 739 (3.3%) |
| Total (Overall) | 174,909 (52.8%) | 156,223 (47.2%) |
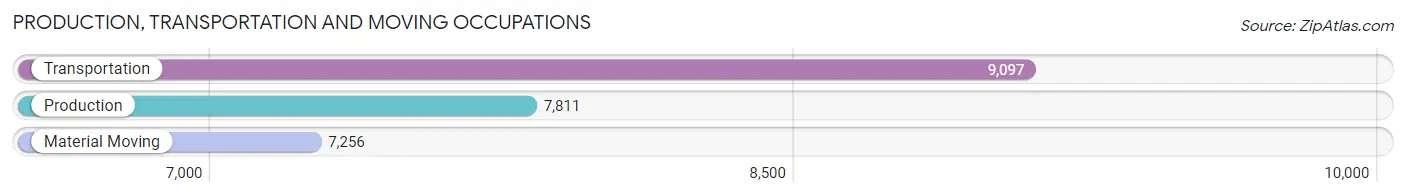
Production, Transportation and Moving Occupations
The most common Production, Transportation and Moving occupations in Monmouth County are Transportation (9,097 | 2.8%), Production (7,811 | 2.4%), and Material Moving (7,256 | 2.2%).
Production, Transportation and Moving Occupations by Sex
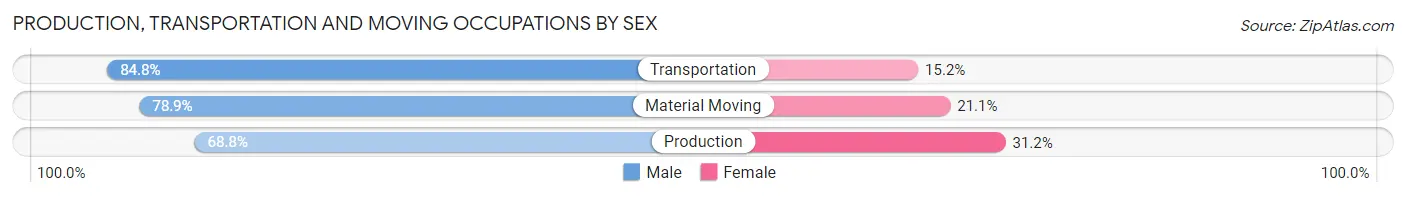
| Occupation | Male | Female |
| Production | 5,375 (68.8%) | 2,436 (31.2%) |
| Transportation | 7,718 (84.8%) | 1,379 (15.2%) |
| Material Moving | 5,728 (78.9%) | 1,528 (21.1%) |
| Total (Category) | 18,821 (77.9%) | 5,343 (22.1%) |
| Total (Overall) | 174,909 (52.8%) | 156,223 (47.2%) |
Employment Industries by Sex in Monmouth County
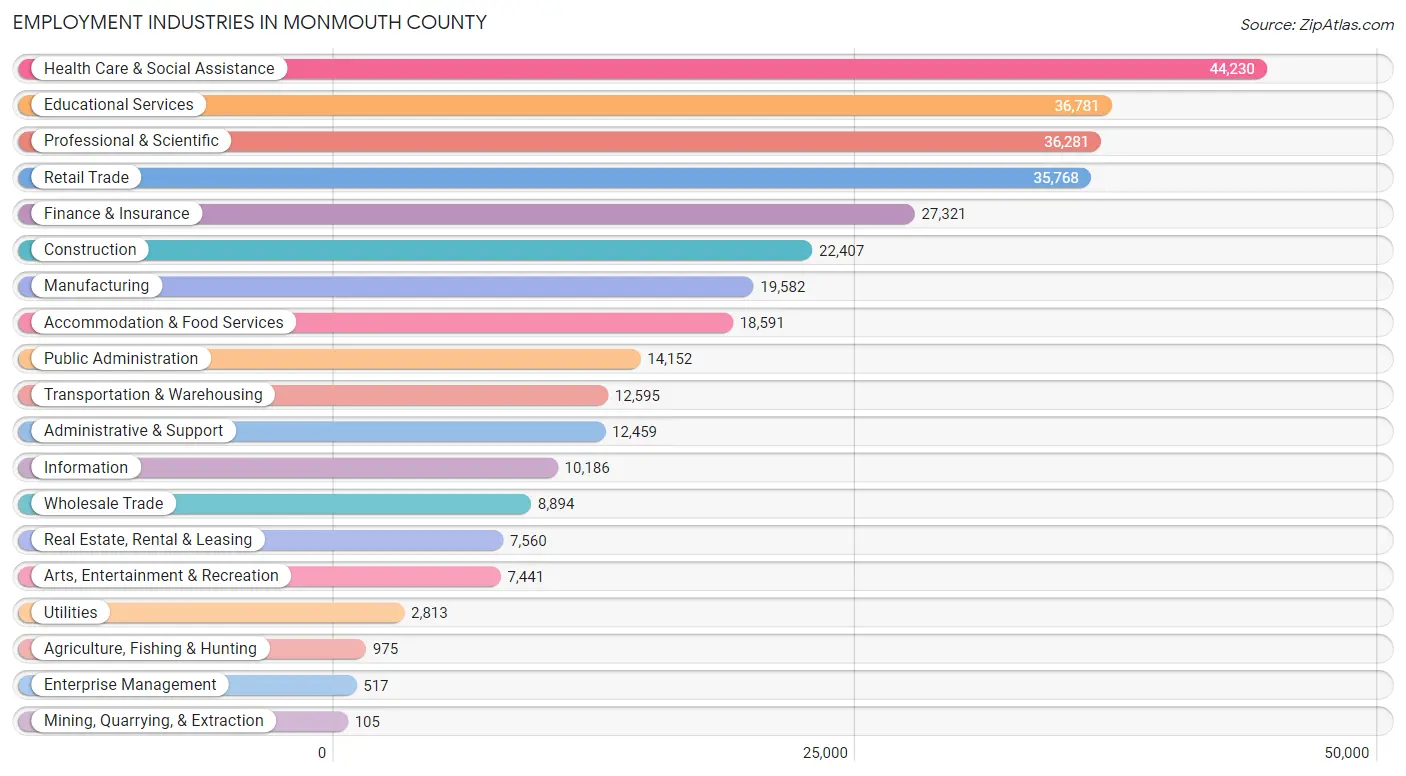
Employment Industries in Monmouth County
The major employment industries in Monmouth County include Health Care & Social Assistance (44,230 | 13.4%), Educational Services (36,781 | 11.1%), Professional & Scientific (36,281 | 11.0%), Retail Trade (35,768 | 10.8%), and Finance & Insurance (27,321 | 8.3%).
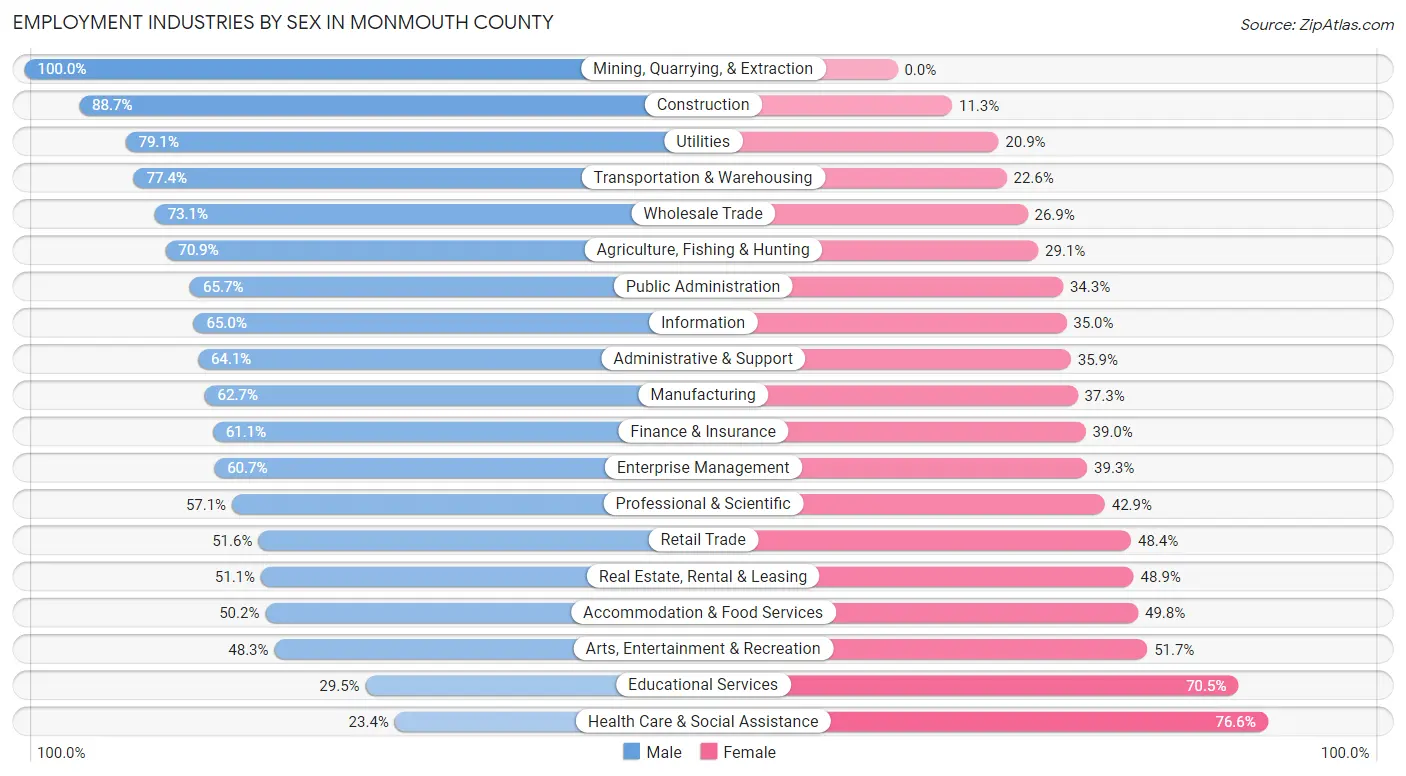
Employment Industries by Sex in Monmouth County
The Monmouth County industries that see more men than women are Mining, Quarrying, & Extraction (100.0%), Construction (88.7%), and Utilities (79.1%), whereas the industries that tend to have a higher number of women are Health Care & Social Assistance (76.6%), Educational Services (70.5%), and Arts, Entertainment & Recreation (51.7%).
| Industry | Male | Female |
| Agriculture, Fishing & Hunting | 691 (70.9%) | 284 (29.1%) |
| Mining, Quarrying, & Extraction | 105 (100.0%) | 0 (0.0%) |
| Construction | 19,874 (88.7%) | 2,533 (11.3%) |
| Manufacturing | 12,284 (62.7%) | 7,298 (37.3%) |
| Wholesale Trade | 6,498 (73.1%) | 2,396 (26.9%) |
| Retail Trade | 18,471 (51.6%) | 17,297 (48.4%) |
| Transportation & Warehousing | 9,751 (77.4%) | 2,844 (22.6%) |
| Utilities | 2,225 (79.1%) | 588 (20.9%) |
| Information | 6,624 (65.0%) | 3,562 (35.0%) |
| Finance & Insurance | 16,679 (61.1%) | 10,642 (39.0%) |
| Real Estate, Rental & Leasing | 3,863 (51.1%) | 3,697 (48.9%) |
| Professional & Scientific | 20,710 (57.1%) | 15,571 (42.9%) |
| Enterprise Management | 314 (60.7%) | 203 (39.3%) |
| Administrative & Support | 7,987 (64.1%) | 4,472 (35.9%) |
| Educational Services | 10,837 (29.5%) | 25,944 (70.5%) |
| Health Care & Social Assistance | 10,350 (23.4%) | 33,880 (76.6%) |
| Arts, Entertainment & Recreation | 3,594 (48.3%) | 3,847 (51.7%) |
| Accommodation & Food Services | 9,330 (50.2%) | 9,261 (49.8%) |
| Public Administration | 9,302 (65.7%) | 4,850 (34.3%) |
| Total | 174,909 (52.8%) | 156,223 (47.2%) |
Education in Monmouth County
School Enrollment in Monmouth County
The most common levels of schooling among the 153,862 students in Monmouth County are high school (36,689 | 23.8%), middle school (31,412 | 20.4%), and college / undergraduate (29,719 | 19.3%).
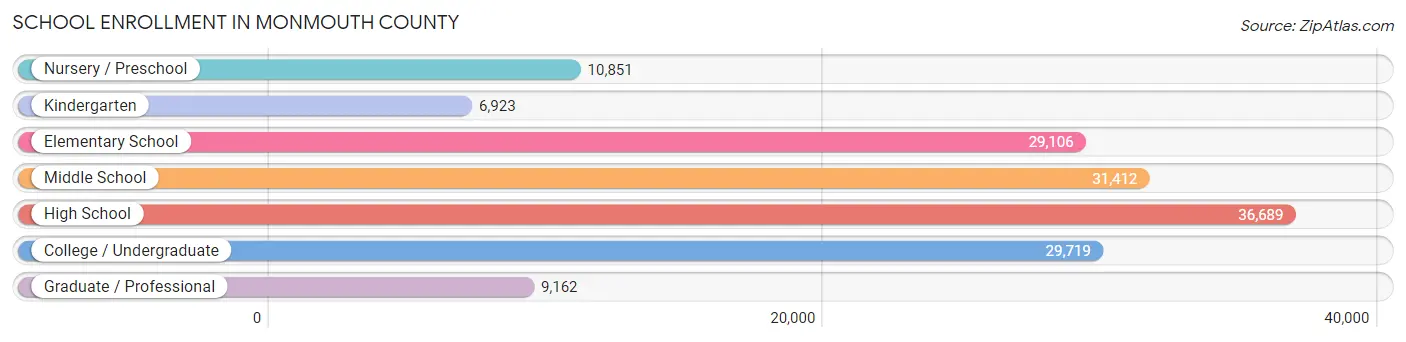
| School Level | # Students | % Students |
| Nursery / Preschool | 10,851 | 7.0% |
| Kindergarten | 6,923 | 4.5% |
| Elementary School | 29,106 | 18.9% |
| Middle School | 31,412 | 20.4% |
| High School | 36,689 | 23.8% |
| College / Undergraduate | 29,719 | 19.3% |
| Graduate / Professional | 9,162 | 5.9% |
| Total | 153,862 | 100.0% |
School Enrollment by Age by Funding Source in Monmouth County
Out of a total of 153,862 students who are enrolled in schools in Monmouth County, 34,773 (22.6%) attend a private institution, while the remaining 119,089 (77.4%) are enrolled in public schools. The age group of 3 to 4 year olds has the highest likelihood of being enrolled in private schools, with 4,824 (54.5% in the age bracket) enrolled. Conversely, the age group of 10 to 14 year olds has the lowest likelihood of being enrolled in a private school, with 35,183 (90.2% in the age bracket) attending a public institution.
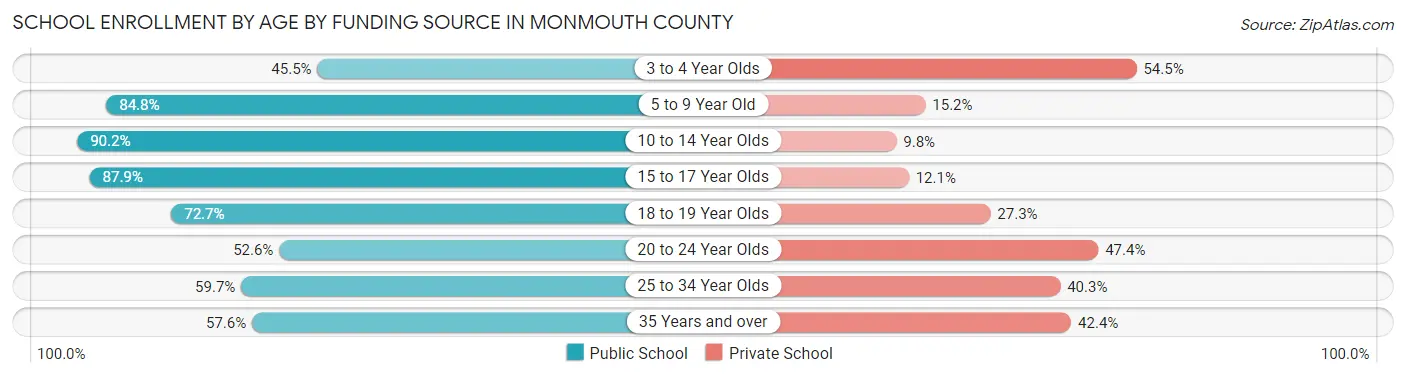
| Age Bracket | Public School | Private School |
| 3 to 4 Year Olds | 4,021 (45.5%) | 4,824 (54.5%) |
| 5 to 9 Year Old | 29,723 (84.8%) | 5,335 (15.2%) |
| 10 to 14 Year Olds | 35,183 (90.2%) | 3,826 (9.8%) |
| 15 to 17 Year Olds | 23,035 (87.9%) | 3,177 (12.1%) |
| 18 to 19 Year Olds | 9,860 (72.7%) | 3,708 (27.3%) |
| 20 to 24 Year Olds | 8,964 (52.6%) | 8,083 (47.4%) |
| 25 to 34 Year Olds | 4,138 (59.7%) | 2,798 (40.3%) |
| 35 Years and over | 4,142 (57.6%) | 3,045 (42.4%) |
| Total | 119,089 (77.4%) | 34,773 (22.6%) |
Educational Attainment by Field of Study in Monmouth County
Business (56,629 | 23.2%), education (27,735 | 11.4%), social sciences (21,594 | 8.9%), science & technology (19,830 | 8.1%), and engineering (16,732 | 6.9%) are the most common fields of study among 243,758 individuals in Monmouth County who have obtained a bachelor's degree or higher.
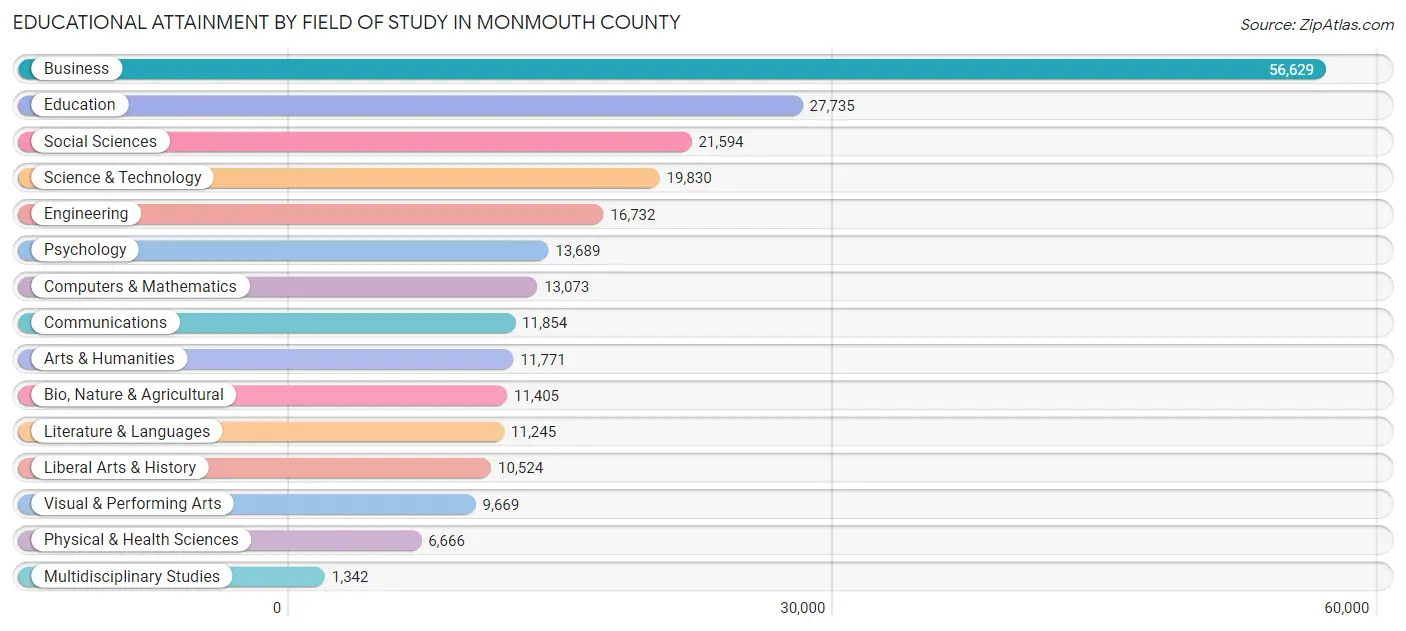
| Field of Study | # Graduates | % Graduates |
| Computers & Mathematics | 13,073 | 5.4% |
| Bio, Nature & Agricultural | 11,405 | 4.7% |
| Physical & Health Sciences | 6,666 | 2.7% |
| Psychology | 13,689 | 5.6% |
| Social Sciences | 21,594 | 8.9% |
| Engineering | 16,732 | 6.9% |
| Multidisciplinary Studies | 1,342 | 0.5% |
| Science & Technology | 19,830 | 8.1% |
| Business | 56,629 | 23.2% |
| Education | 27,735 | 11.4% |
| Literature & Languages | 11,245 | 4.6% |
| Liberal Arts & History | 10,524 | 4.3% |
| Visual & Performing Arts | 9,669 | 4.0% |
| Communications | 11,854 | 4.9% |
| Arts & Humanities | 11,771 | 4.8% |
| Total | 243,758 | 100.0% |
Transportation & Commute in Monmouth County
Vehicle Availability by Sex in Monmouth County
The most prevalent vehicle ownership categories in Monmouth County are males with 2 vehicles (75,548, accounting for 43.8%) and females with 2 vehicles (63,721, making up 49.7%).
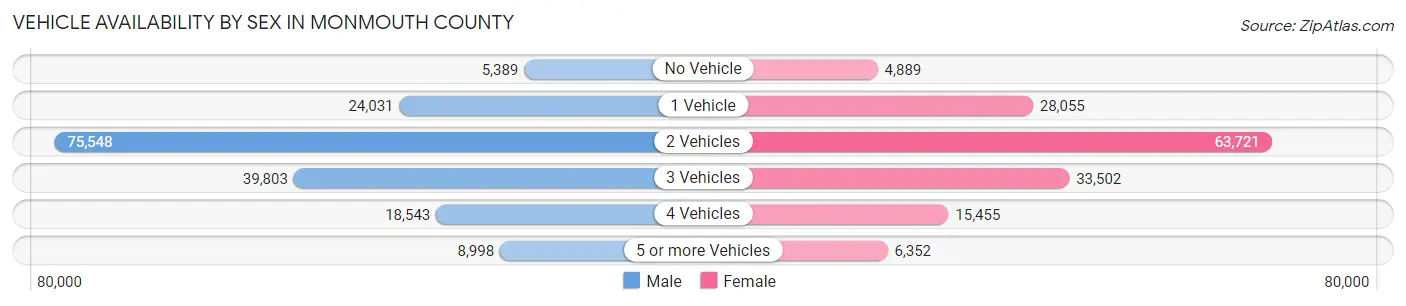
| Vehicles Available | Male | Female |
| No Vehicle | 5,389 (3.1%) | 4,889 (3.2%) |
| 1 Vehicle | 24,031 (14.0%) | 28,055 (18.5%) |
| 2 Vehicles | 75,548 (43.8%) | 63,721 (41.9%) |
| 3 Vehicles | 39,803 (23.1%) | 33,502 (22.0%) |
| 4 Vehicles | 18,543 (10.8%) | 15,455 (10.2%) |
| 5 or more Vehicles | 8,998 (5.2%) | 6,352 (4.2%) |
| Total | 172,312 (100.0%) | 151,974 (100.0%) |
Commute Time in Monmouth County
The most frequently occuring commute durations in Monmouth County are 10 to 14 minutes (35,665 commuters, 12.9%), 15 to 19 minutes (35,478 commuters, 12.8%), and 30 to 34 minutes (30,612 commuters, 11.0%).
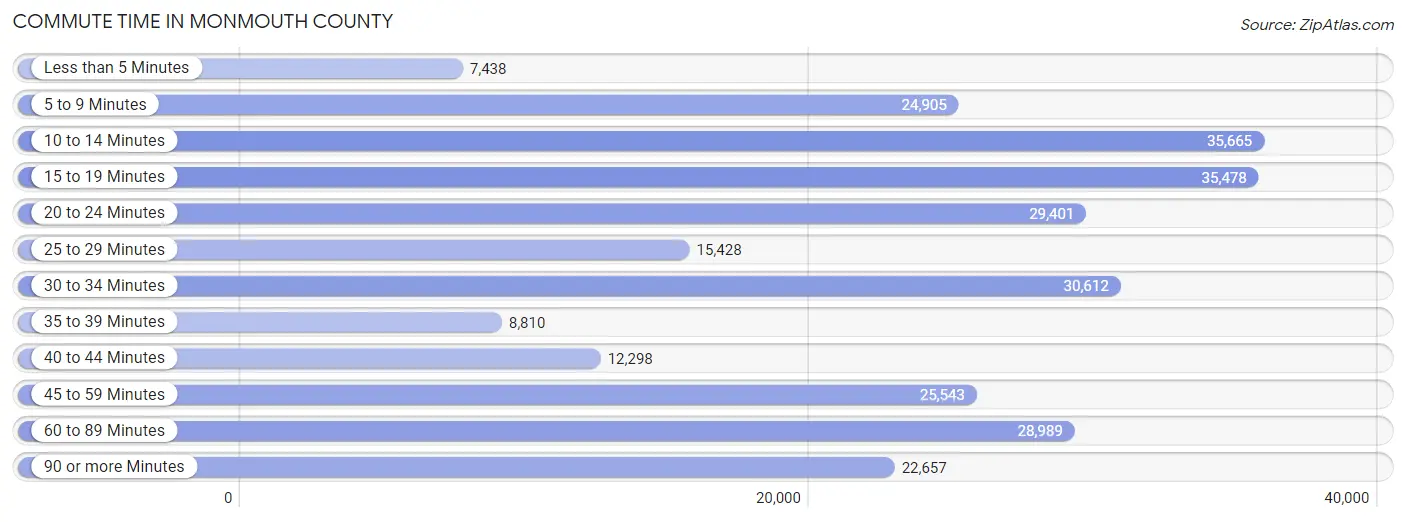
| Commute Time | # Commuters | % Commuters |
| Less than 5 Minutes | 7,438 | 2.7% |
| 5 to 9 Minutes | 24,905 | 9.0% |
| 10 to 14 Minutes | 35,665 | 12.9% |
| 15 to 19 Minutes | 35,478 | 12.8% |
| 20 to 24 Minutes | 29,401 | 10.6% |
| 25 to 29 Minutes | 15,428 | 5.6% |
| 30 to 34 Minutes | 30,612 | 11.0% |
| 35 to 39 Minutes | 8,810 | 3.2% |
| 40 to 44 Minutes | 12,298 | 4.4% |
| 45 to 59 Minutes | 25,543 | 9.2% |
| 60 to 89 Minutes | 28,989 | 10.5% |
| 90 or more Minutes | 22,657 | 8.2% |
Commute Time by Sex in Monmouth County
The most common commute times in Monmouth County are 60 to 89 minutes (19,489 commuters, 13.2%) for males and 10 to 14 minutes (19,493 commuters, 15.0%) for females.
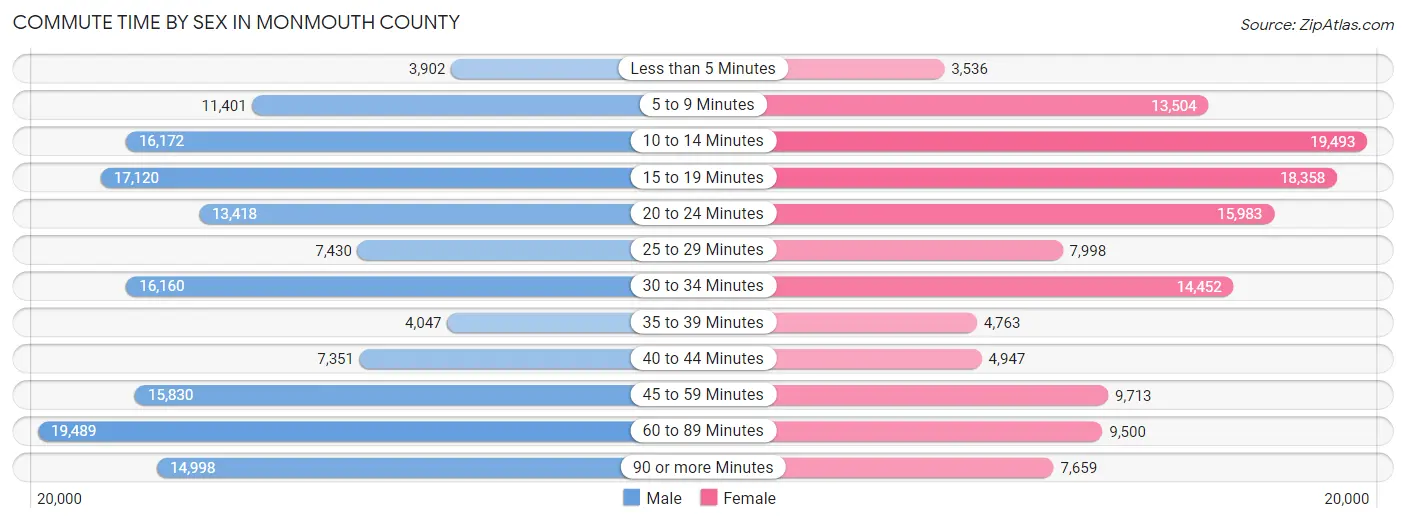
| Commute Time | Male | Female |
| Less than 5 Minutes | 3,902 (2.6%) | 3,536 (2.7%) |
| 5 to 9 Minutes | 11,401 (7.7%) | 13,504 (10.4%) |
| 10 to 14 Minutes | 16,172 (11.0%) | 19,493 (15.0%) |
| 15 to 19 Minutes | 17,120 (11.6%) | 18,358 (14.1%) |
| 20 to 24 Minutes | 13,418 (9.1%) | 15,983 (12.3%) |
| 25 to 29 Minutes | 7,430 (5.0%) | 7,998 (6.2%) |
| 30 to 34 Minutes | 16,160 (11.0%) | 14,452 (11.1%) |
| 35 to 39 Minutes | 4,047 (2.8%) | 4,763 (3.7%) |
| 40 to 44 Minutes | 7,351 (5.0%) | 4,947 (3.8%) |
| 45 to 59 Minutes | 15,830 (10.7%) | 9,713 (7.5%) |
| 60 to 89 Minutes | 19,489 (13.2%) | 9,500 (7.3%) |
| 90 or more Minutes | 14,998 (10.2%) | 7,659 (5.9%) |
Time of Departure to Work by Sex in Monmouth County
The most frequent times of departure to work in Monmouth County are 7:00 AM to 7:29 AM (19,496, 13.2%) for males and 8:00 AM to 8:29 AM (19,401, 14.9%) for females.
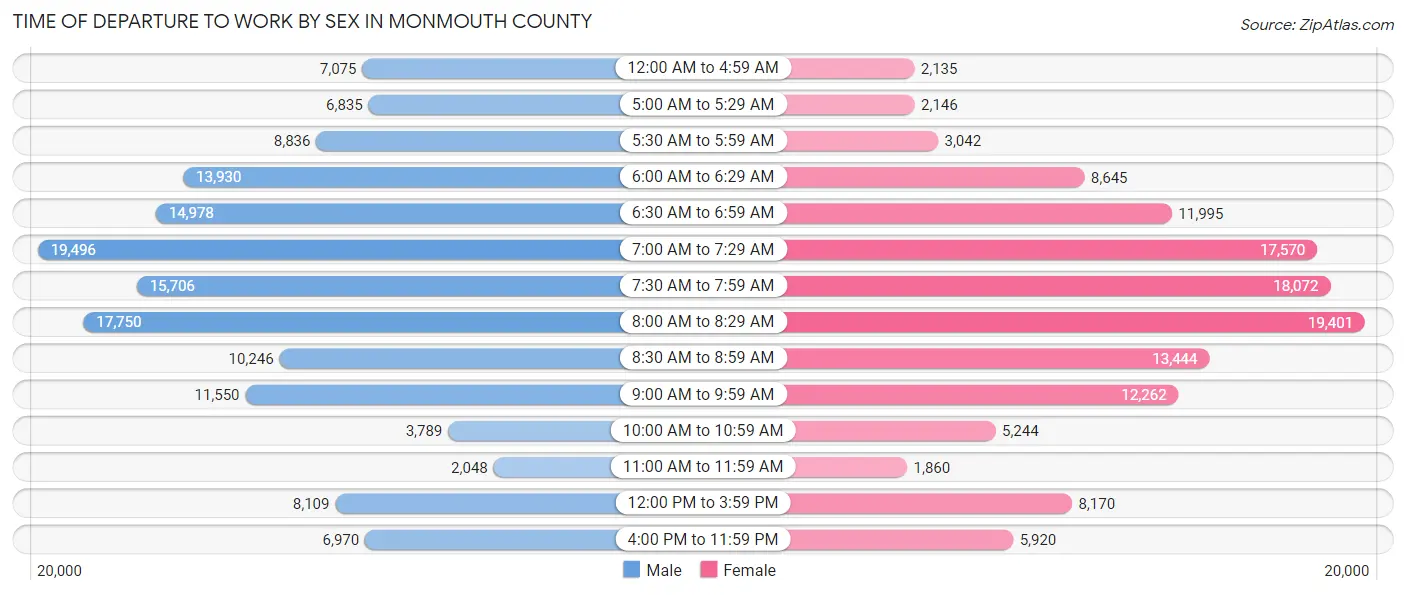
| Time of Departure | Male | Female |
| 12:00 AM to 4:59 AM | 7,075 (4.8%) | 2,135 (1.6%) |
| 5:00 AM to 5:29 AM | 6,835 (4.6%) | 2,146 (1.7%) |
| 5:30 AM to 5:59 AM | 8,836 (6.0%) | 3,042 (2.3%) |
| 6:00 AM to 6:29 AM | 13,930 (9.5%) | 8,645 (6.7%) |
| 6:30 AM to 6:59 AM | 14,978 (10.2%) | 11,995 (9.2%) |
| 7:00 AM to 7:29 AM | 19,496 (13.2%) | 17,570 (13.5%) |
| 7:30 AM to 7:59 AM | 15,706 (10.7%) | 18,072 (13.9%) |
| 8:00 AM to 8:29 AM | 17,750 (12.0%) | 19,401 (14.9%) |
| 8:30 AM to 8:59 AM | 10,246 (7.0%) | 13,444 (10.3%) |
| 9:00 AM to 9:59 AM | 11,550 (7.8%) | 12,262 (9.4%) |
| 10:00 AM to 10:59 AM | 3,789 (2.6%) | 5,244 (4.0%) |
| 11:00 AM to 11:59 AM | 2,048 (1.4%) | 1,860 (1.4%) |
| 12:00 PM to 3:59 PM | 8,109 (5.5%) | 8,170 (6.3%) |
| 4:00 PM to 11:59 PM | 6,970 (4.7%) | 5,920 (4.6%) |
| Total | 147,318 (100.0%) | 129,906 (100.0%) |
Housing Occupancy in Monmouth County
Occupancy by Ownership in Monmouth County
Of the total 248,117 dwellings in Monmouth County, owner-occupied units account for 187,471 (75.6%), while renter-occupied units make up 60,646 (24.4%).
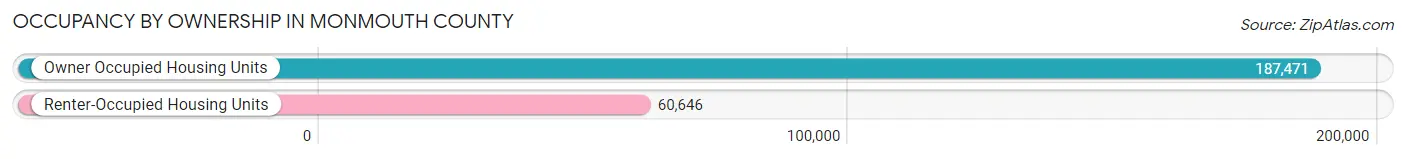
| Occupancy | # Housing Units | % Housing Units |
| Owner Occupied Housing Units | 187,471 | 75.6% |
| Renter-Occupied Housing Units | 60,646 | 24.4% |
| Total Occupied Housing Units | 248,117 | 100.0% |
Occupancy by Household Size in Monmouth County
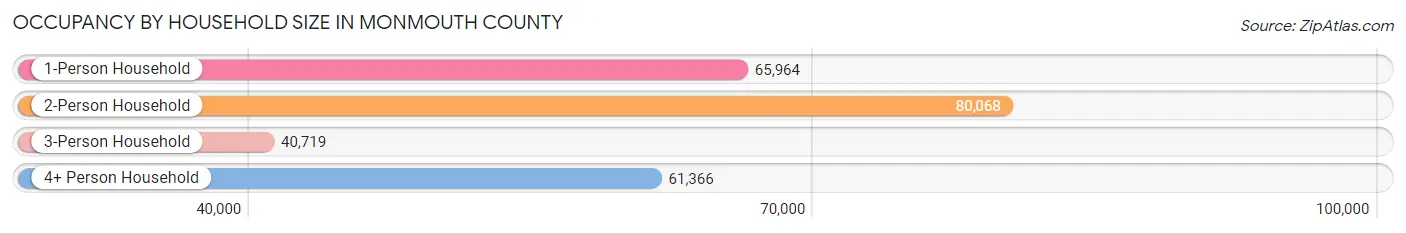
| Household Size | # Housing Units | % Housing Units |
| 1-Person Household | 65,964 | 26.6% |
| 2-Person Household | 80,068 | 32.3% |
| 3-Person Household | 40,719 | 16.4% |
| 4+ Person Household | 61,366 | 24.7% |
| Total Housing Units | 248,117 | 100.0% |
Occupancy by Ownership by Household Size in Monmouth County
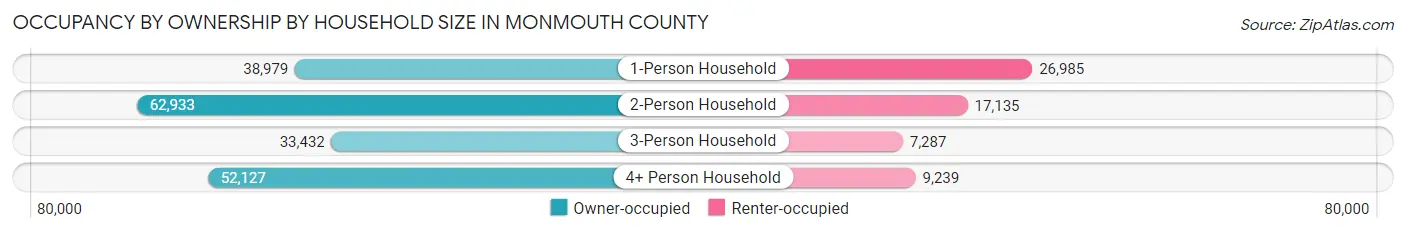
| Household Size | Owner-occupied | Renter-occupied |
| 1-Person Household | 38,979 (59.1%) | 26,985 (40.9%) |
| 2-Person Household | 62,933 (78.6%) | 17,135 (21.4%) |
| 3-Person Household | 33,432 (82.1%) | 7,287 (17.9%) |
| 4+ Person Household | 52,127 (84.9%) | 9,239 (15.1%) |
| Total Housing Units | 187,471 (75.6%) | 60,646 (24.4%) |
Occupancy by Educational Attainment in Monmouth County
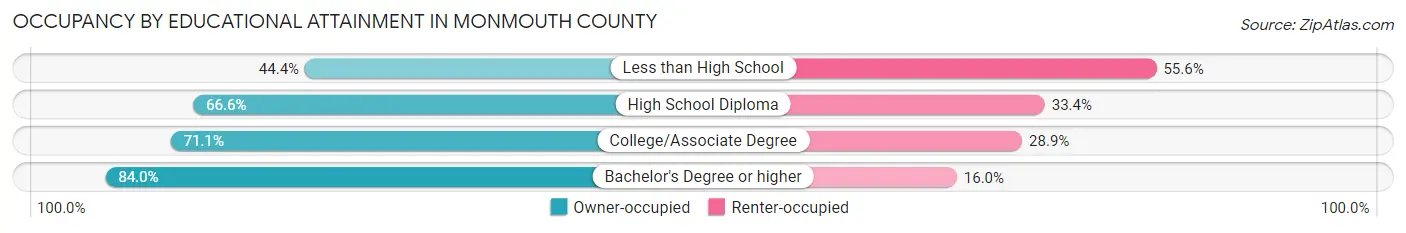
| Household Size | Owner-occupied | Renter-occupied |
| Less than High School | 5,529 (44.4%) | 6,919 (55.6%) |
| High School Diploma | 31,348 (66.6%) | 15,742 (33.4%) |
| College/Associate Degree | 42,886 (71.1%) | 17,470 (28.9%) |
| Bachelor's Degree or higher | 107,708 (84.0%) | 20,515 (16.0%) |
Occupancy by Age of Householder in Monmouth County
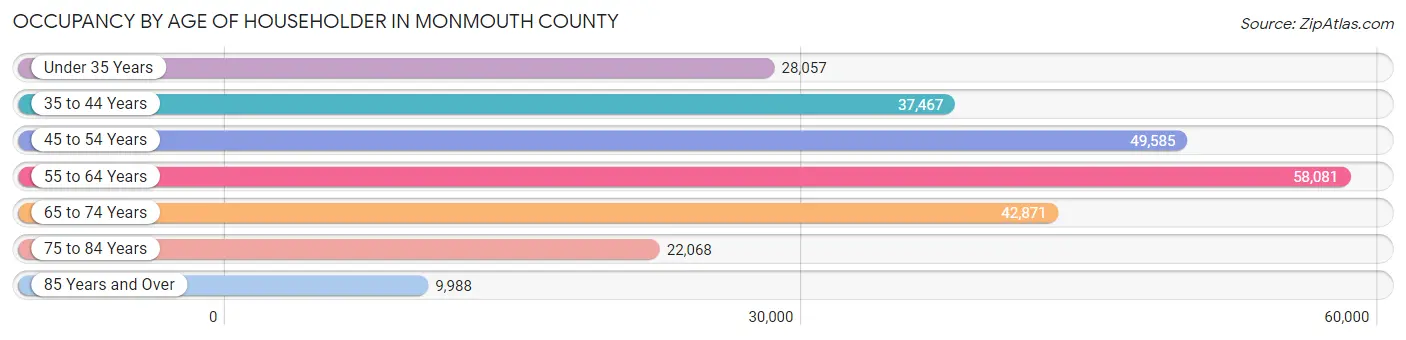
| Age Bracket | # Households | % Households |
| Under 35 Years | 28,057 | 11.3% |
| 35 to 44 Years | 37,467 | 15.1% |
| 45 to 54 Years | 49,585 | 20.0% |
| 55 to 64 Years | 58,081 | 23.4% |
| 65 to 74 Years | 42,871 | 17.3% |
| 75 to 84 Years | 22,068 | 8.9% |
| 85 Years and Over | 9,988 | 4.0% |
| Total | 248,117 | 100.0% |
Housing Finances in Monmouth County
Median Income by Occupancy in Monmouth County
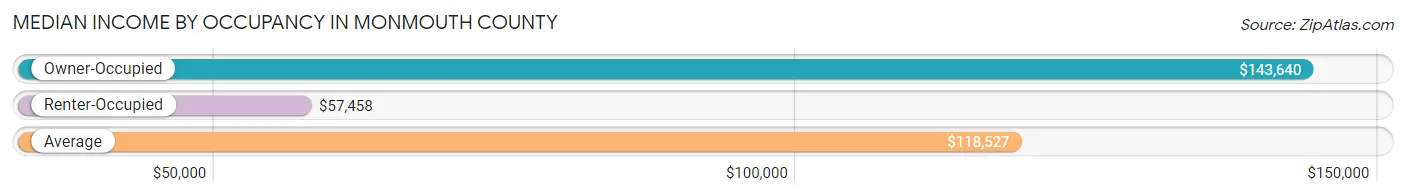
| Occupancy Type | # Households | Median Income |
| Owner-Occupied | 187,471 (75.6%) | $143,640 |
| Renter-Occupied | 60,646 (24.4%) | $57,458 |
| Average | 248,117 (100.0%) | $118,527 |
Occupancy by Householder Income Bracket in Monmouth County
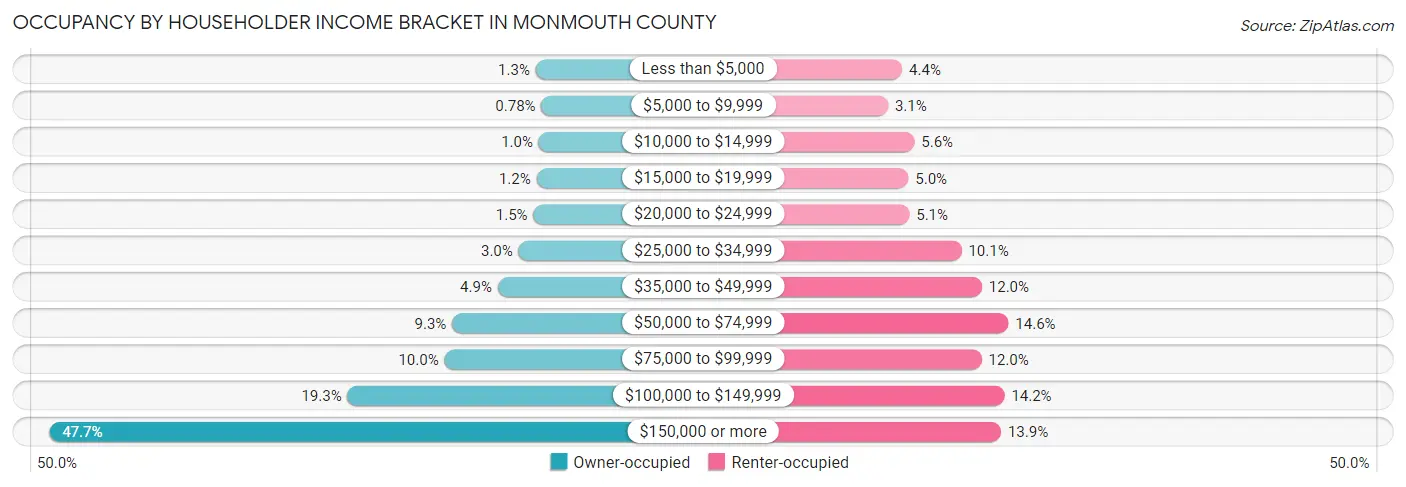
| Income Bracket | Owner-occupied | Renter-occupied |
| Less than $5,000 | 2,476 (1.3%) | 2,692 (4.4%) |
| $5,000 to $9,999 | 1,468 (0.8%) | 1,872 (3.1%) |
| $10,000 to $14,999 | 1,938 (1.0%) | 3,399 (5.6%) |
| $15,000 to $19,999 | 2,321 (1.2%) | 3,049 (5.0%) |
| $20,000 to $24,999 | 2,878 (1.5%) | 3,107 (5.1%) |
| $25,000 to $34,999 | 5,534 (2.9%) | 6,117 (10.1%) |
| $35,000 to $49,999 | 9,252 (4.9%) | 7,297 (12.0%) |
| $50,000 to $74,999 | 17,405 (9.3%) | 8,830 (14.6%) |
| $75,000 to $99,999 | 18,771 (10.0%) | 7,280 (12.0%) |
| $100,000 to $149,999 | 36,090 (19.3%) | 8,602 (14.2%) |
| $150,000 or more | 89,338 (47.6%) | 8,401 (13.9%) |
| Total | 187,471 (100.0%) | 60,646 (100.0%) |
Monthly Housing Cost Tiers in Monmouth County
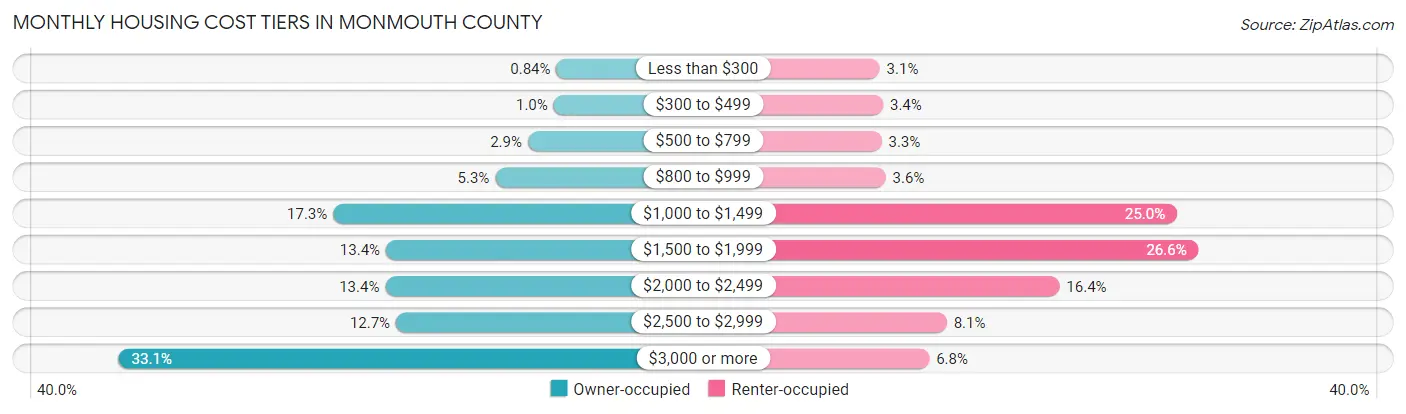
| Monthly Cost | Owner-occupied | Renter-occupied |
| Less than $300 | 1,567 (0.8%) | 1,885 (3.1%) |
| $300 to $499 | 1,955 (1.0%) | 2,037 (3.4%) |
| $500 to $799 | 5,516 (2.9%) | 1,971 (3.3%) |
| $800 to $999 | 10,005 (5.3%) | 2,150 (3.5%) |
| $1,000 to $1,499 | 32,394 (17.3%) | 15,166 (25.0%) |
| $1,500 to $1,999 | 25,107 (13.4%) | 16,123 (26.6%) |
| $2,000 to $2,499 | 25,199 (13.4%) | 9,916 (16.4%) |
| $2,500 to $2,999 | 23,724 (12.7%) | 4,881 (8.1%) |
| $3,000 or more | 62,004 (33.1%) | 4,101 (6.8%) |
| Total | 187,471 (100.0%) | 60,646 (100.0%) |
Physical Housing Characteristics in Monmouth County
Housing Structures in Monmouth County
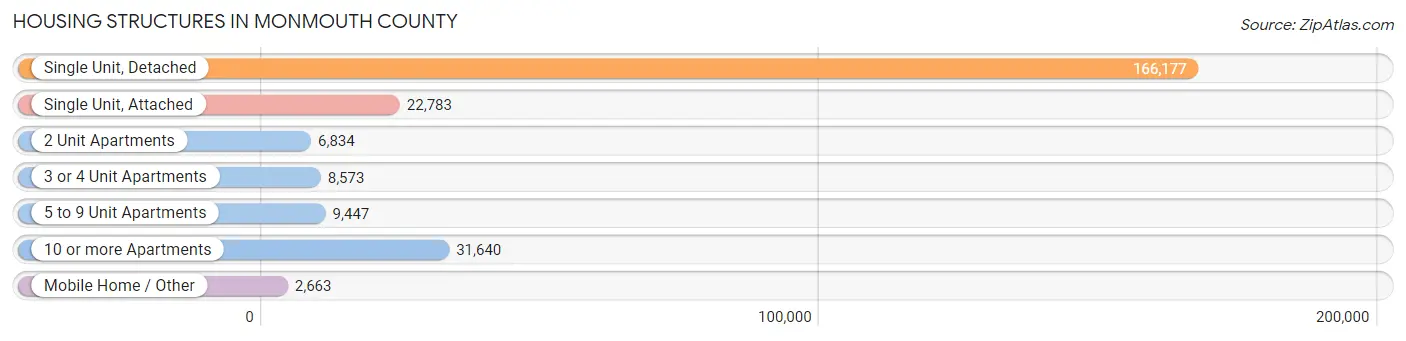
| Structure Type | # Housing Units | % Housing Units |
| Single Unit, Detached | 166,177 | 67.0% |
| Single Unit, Attached | 22,783 | 9.2% |
| 2 Unit Apartments | 6,834 | 2.8% |
| 3 or 4 Unit Apartments | 8,573 | 3.5% |
| 5 to 9 Unit Apartments | 9,447 | 3.8% |
| 10 or more Apartments | 31,640 | 12.8% |
| Mobile Home / Other | 2,663 | 1.1% |
| Total | 248,117 | 100.0% |
Housing Structures by Occupancy in Monmouth County
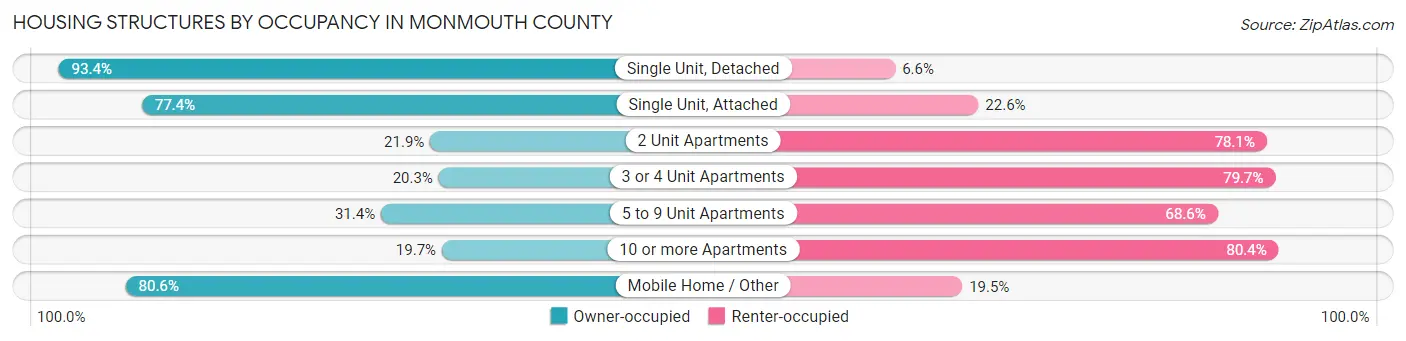
| Structure Type | Owner-occupied | Renter-occupied |
| Single Unit, Detached | 155,269 (93.4%) | 10,908 (6.6%) |
| Single Unit, Attached | 17,641 (77.4%) | 5,142 (22.6%) |
| 2 Unit Apartments | 1,498 (21.9%) | 5,336 (78.1%) |
| 3 or 4 Unit Apartments | 1,738 (20.3%) | 6,835 (79.7%) |
| 5 to 9 Unit Apartments | 2,964 (31.4%) | 6,483 (68.6%) |
| 10 or more Apartments | 6,216 (19.7%) | 25,424 (80.3%) |
| Mobile Home / Other | 2,145 (80.5%) | 518 (19.5%) |
| Total | 187,471 (75.6%) | 60,646 (24.4%) |
Housing Structures by Number of Rooms in Monmouth County
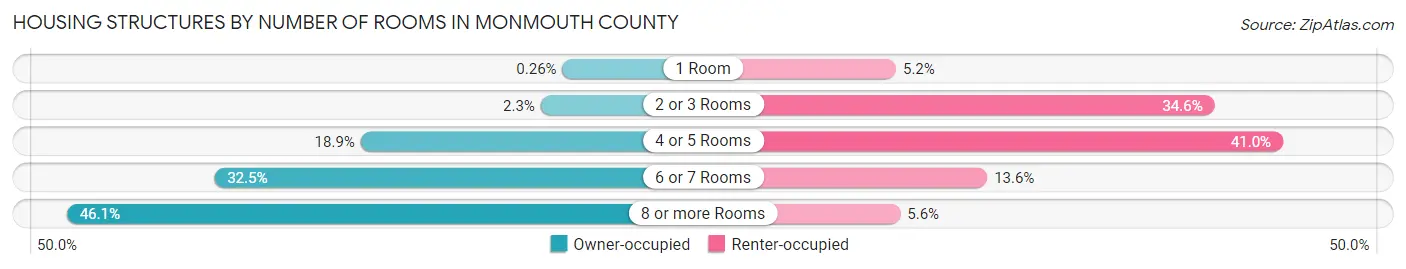
| Number of Rooms | Owner-occupied | Renter-occupied |
| 1 Room | 486 (0.3%) | 3,146 (5.2%) |
| 2 or 3 Rooms | 4,253 (2.3%) | 21,008 (34.6%) |
| 4 or 5 Rooms | 35,464 (18.9%) | 24,845 (41.0%) |
| 6 or 7 Rooms | 60,849 (32.5%) | 8,257 (13.6%) |
| 8 or more Rooms | 86,419 (46.1%) | 3,390 (5.6%) |
| Total | 187,471 (100.0%) | 60,646 (100.0%) |
Housing Structure by Heating Type in Monmouth County
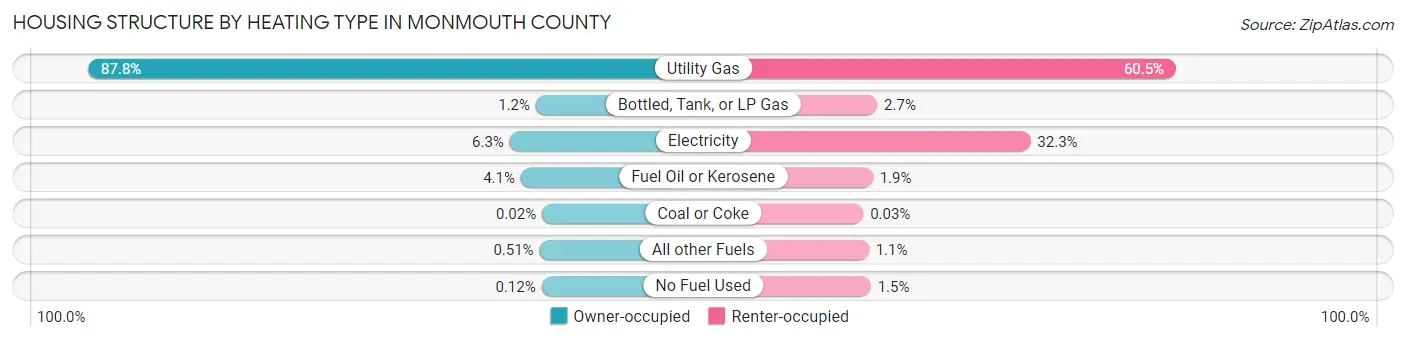
| Heating Type | Owner-occupied | Renter-occupied |
| Utility Gas | 164,524 (87.8%) | 36,666 (60.5%) |
| Bottled, Tank, or LP Gas | 2,268 (1.2%) | 1,653 (2.7%) |
| Electricity | 11,740 (6.3%) | 19,615 (32.3%) |
| Fuel Oil or Kerosene | 7,720 (4.1%) | 1,134 (1.9%) |
| Coal or Coke | 38 (0.0%) | 17 (0.0%) |
| All other Fuels | 959 (0.5%) | 660 (1.1%) |
| No Fuel Used | 222 (0.1%) | 901 (1.5%) |
| Total | 187,471 (100.0%) | 60,646 (100.0%) |
Household Vehicle Usage in Monmouth County
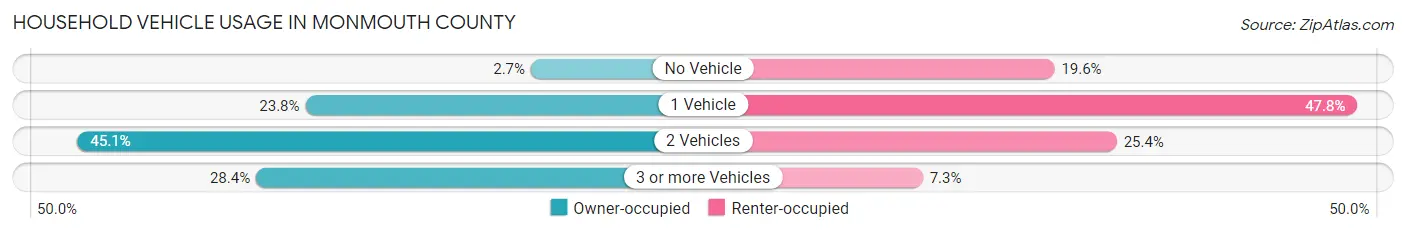
| Vehicles per Household | Owner-occupied | Renter-occupied |
| No Vehicle | 5,139 (2.7%) | 11,861 (19.6%) |
| 1 Vehicle | 44,592 (23.8%) | 28,998 (47.8%) |
| 2 Vehicles | 84,493 (45.1%) | 15,387 (25.4%) |
| 3 or more Vehicles | 53,247 (28.4%) | 4,400 (7.3%) |
| Total | 187,471 (100.0%) | 60,646 (100.0%) |
Real Estate & Mortgages in Monmouth County
Real Estate and Mortgage Overview in Monmouth County
| Characteristic | Without Mortgage | With Mortgage |
| Housing Units | 64,986 | 122,485 |
| Median Property Value | $496,000 | $530,900 |
| Median Household Income | $103,107 | $67,791 |
| Monthly Housing Costs | $1,272 | $60,245 |
| Real Estate Taxes | $9,713 | $1,616 |
Property Value by Mortgage Status in Monmouth County
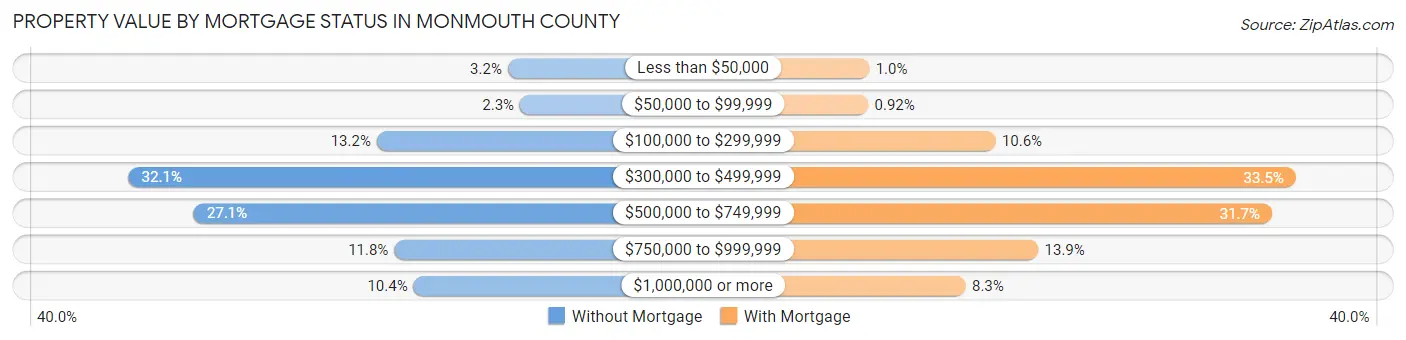
| Property Value | Without Mortgage | With Mortgage |
| Less than $50,000 | 2,070 (3.2%) | 1,228 (1.0%) |
| $50,000 to $99,999 | 1,470 (2.3%) | 1,128 (0.9%) |
| $100,000 to $299,999 | 8,557 (13.2%) | 13,010 (10.6%) |
| $300,000 to $499,999 | 20,842 (32.1%) | 41,071 (33.5%) |
| $500,000 to $749,999 | 17,608 (27.1%) | 38,837 (31.7%) |
| $750,000 to $999,999 | 7,697 (11.8%) | 16,994 (13.9%) |
| $1,000,000 or more | 6,742 (10.4%) | 10,217 (8.3%) |
| Total | 64,986 (100.0%) | 122,485 (100.0%) |
Household Income by Mortgage Status in Monmouth County
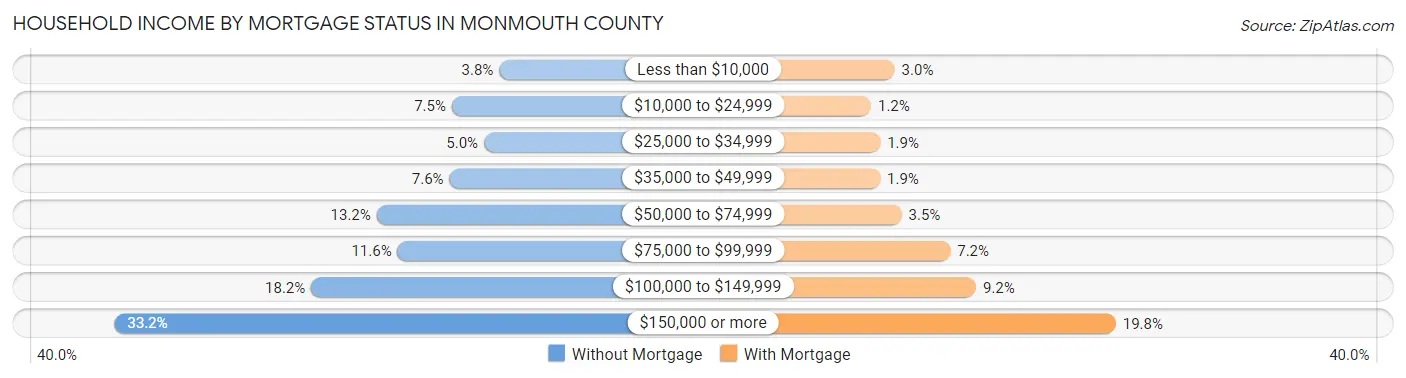
| Household Income | Without Mortgage | With Mortgage |
| Less than $10,000 | 2,495 (3.8%) | 3,656 (3.0%) |
| $10,000 to $24,999 | 4,839 (7.4%) | 1,449 (1.2%) |
| $25,000 to $34,999 | 3,247 (5.0%) | 2,298 (1.9%) |
| $35,000 to $49,999 | 4,958 (7.6%) | 2,287 (1.9%) |
| $50,000 to $74,999 | 8,563 (13.2%) | 4,294 (3.5%) |
| $75,000 to $99,999 | 7,531 (11.6%) | 8,842 (7.2%) |
| $100,000 to $149,999 | 11,806 (18.2%) | 11,240 (9.2%) |
| $150,000 or more | 21,547 (33.2%) | 24,284 (19.8%) |
| Total | 64,986 (100.0%) | 122,485 (100.0%) |
Property Value to Household Income Ratio in Monmouth County
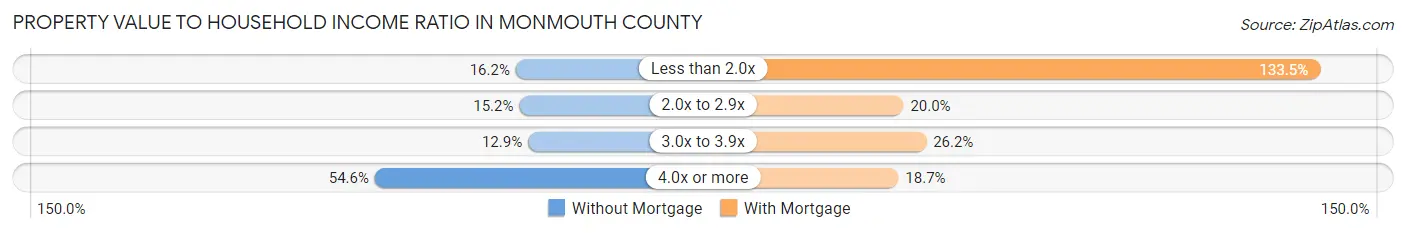
| Value-to-Income Ratio | Without Mortgage | With Mortgage |
| Less than 2.0x | 10,537 (16.2%) | 163,531 (133.5%) |
| 2.0x to 2.9x | 9,904 (15.2%) | 24,533 (20.0%) |
| 3.0x to 3.9x | 8,363 (12.9%) | 32,133 (26.2%) |
| 4.0x or more | 35,483 (54.6%) | 22,858 (18.7%) |
| Total | 64,986 (100.0%) | 122,485 (100.0%) |
Real Estate Taxes by Mortgage Status in Monmouth County
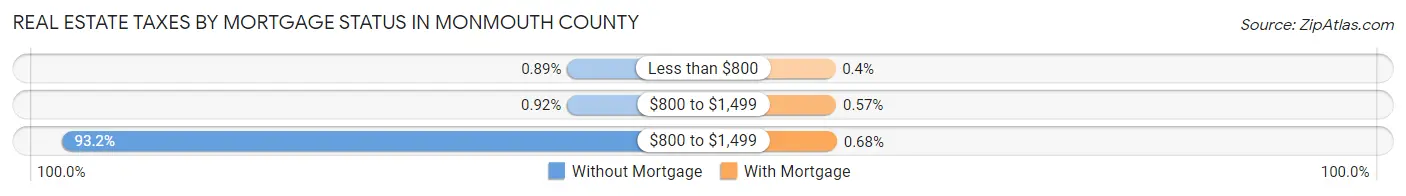
| Property Taxes | Without Mortgage | With Mortgage |
| Less than $800 | 579 (0.9%) | 495 (0.4%) |
| $800 to $1,499 | 596 (0.9%) | 696 (0.6%) |
| $800 to $1,499 | 60,589 (93.2%) | 827 (0.7%) |
| Total | 64,986 (100.0%) | 122,485 (100.0%) |
Health & Disability in Monmouth County
Health Insurance Coverage by Age in Monmouth County
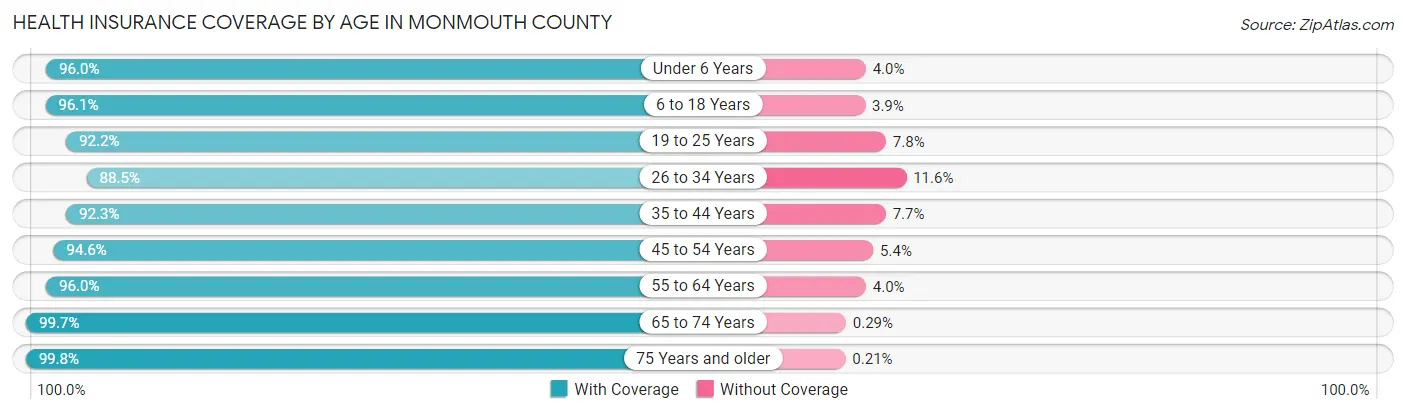
| Age Bracket | With Coverage | Without Coverage |
| Under 6 Years | 36,726 (96.0%) | 1,529 (4.0%) |
| 6 to 18 Years | 100,146 (96.1%) | 4,036 (3.9%) |
| 19 to 25 Years | 48,540 (92.2%) | 4,083 (7.8%) |
| 26 to 34 Years | 55,608 (88.4%) | 7,259 (11.6%) |
| 35 to 44 Years | 68,717 (92.3%) | 5,755 (7.7%) |
| 45 to 54 Years | 85,213 (94.6%) | 4,841 (5.4%) |
| 55 to 64 Years | 97,377 (96.0%) | 4,079 (4.0%) |
| 65 to 74 Years | 68,117 (99.7%) | 201 (0.3%) |
| 75 Years and older | 46,844 (99.8%) | 100 (0.2%) |
| Total | 607,288 (95.0%) | 31,883 (5.0%) |
Health Insurance Coverage by Citizenship Status in Monmouth County
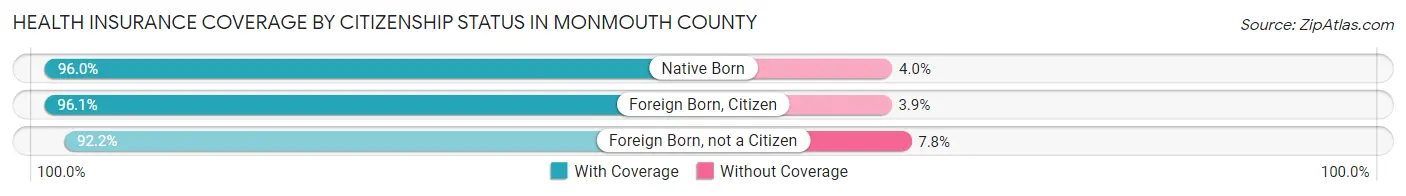
| Citizenship Status | With Coverage | Without Coverage |
| Native Born | 36,726 (96.0%) | 1,529 (4.0%) |
| Foreign Born, Citizen | 100,146 (96.1%) | 4,036 (3.9%) |
| Foreign Born, not a Citizen | 48,540 (92.2%) | 4,083 (7.8%) |
Health Insurance Coverage by Household Income in Monmouth County
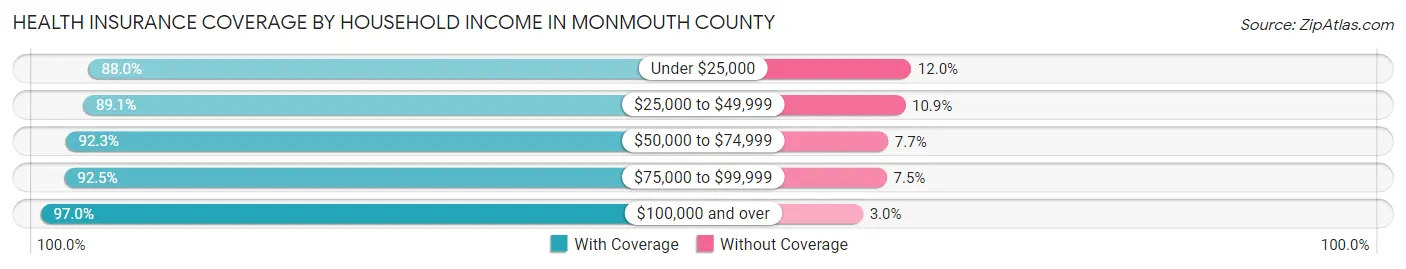
| Household Income | With Coverage | Without Coverage |
| Under $25,000 | 34,247 (88.0%) | 4,676 (12.0%) |
| $25,000 to $49,999 | 47,394 (89.1%) | 5,803 (10.9%) |
| $50,000 to $74,999 | 49,057 (92.3%) | 4,093 (7.7%) |
| $75,000 to $99,999 | 53,193 (92.5%) | 4,288 (7.5%) |
| $100,000 and over | 420,481 (97.0%) | 12,936 (3.0%) |
Public vs Private Health Insurance Coverage by Age in Monmouth County
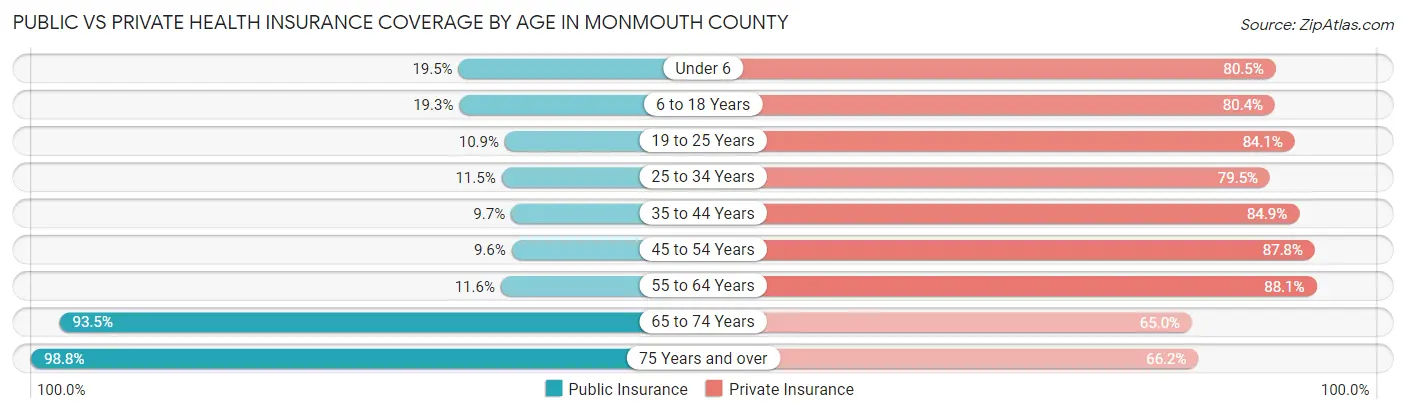
| Age Bracket | Public Insurance | Private Insurance |
| Under 6 | 7,447 (19.5%) | 30,804 (80.5%) |
| 6 to 18 Years | 20,139 (19.3%) | 83,751 (80.4%) |
| 19 to 25 Years | 5,722 (10.9%) | 44,237 (84.1%) |
| 25 to 34 Years | 7,214 (11.5%) | 49,951 (79.5%) |
| 35 to 44 Years | 7,240 (9.7%) | 63,199 (84.9%) |
| 45 to 54 Years | 8,661 (9.6%) | 79,070 (87.8%) |
| 55 to 64 Years | 11,792 (11.6%) | 89,360 (88.1%) |
| 65 to 74 Years | 63,874 (93.5%) | 44,390 (65.0%) |
| 75 Years and over | 46,382 (98.8%) | 31,056 (66.2%) |
| Total | 178,471 (27.9%) | 515,818 (80.7%) |
Disability Status by Sex by Age in Monmouth County
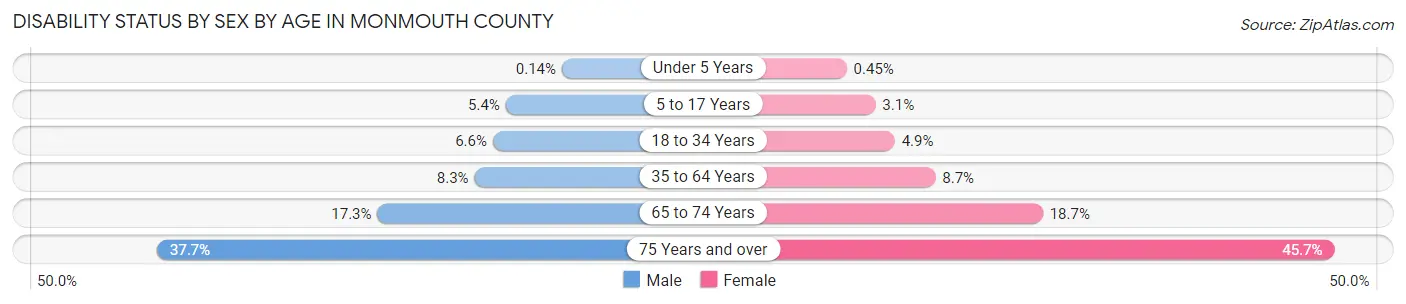
| Age Bracket | Male | Female |
| Under 5 Years | 22 (0.1%) | 69 (0.4%) |
| 5 to 17 Years | 2,805 (5.3%) | 1,567 (3.1%) |
| 18 to 34 Years | 4,133 (6.6%) | 2,992 (4.9%) |
| 35 to 64 Years | 10,813 (8.3%) | 11,712 (8.7%) |
| 65 to 74 Years | 5,606 (17.3%) | 6,681 (18.6%) |
| 75 Years and over | 7,057 (37.7%) | 12,909 (45.7%) |
Disability Class by Sex by Age in Monmouth County
Disability Class: Hearing Difficulty
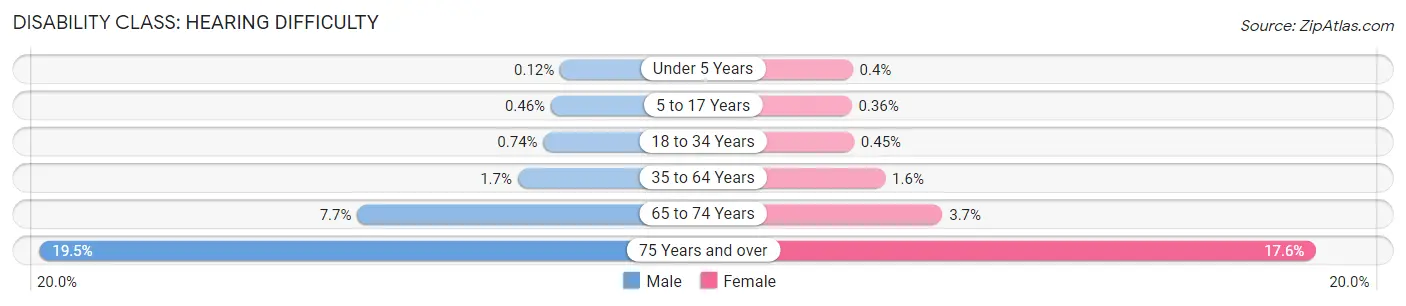
| Age Bracket | Male | Female |
| Under 5 Years | 19 (0.1%) | 62 (0.4%) |
| 5 to 17 Years | 243 (0.5%) | 179 (0.4%) |
| 18 to 34 Years | 467 (0.7%) | 277 (0.4%) |
| 35 to 64 Years | 2,215 (1.7%) | 2,166 (1.6%) |
| 65 to 74 Years | 2,486 (7.6%) | 1,337 (3.7%) |
| 75 Years and over | 3,639 (19.5%) | 4,971 (17.6%) |
Disability Class: Vision Difficulty
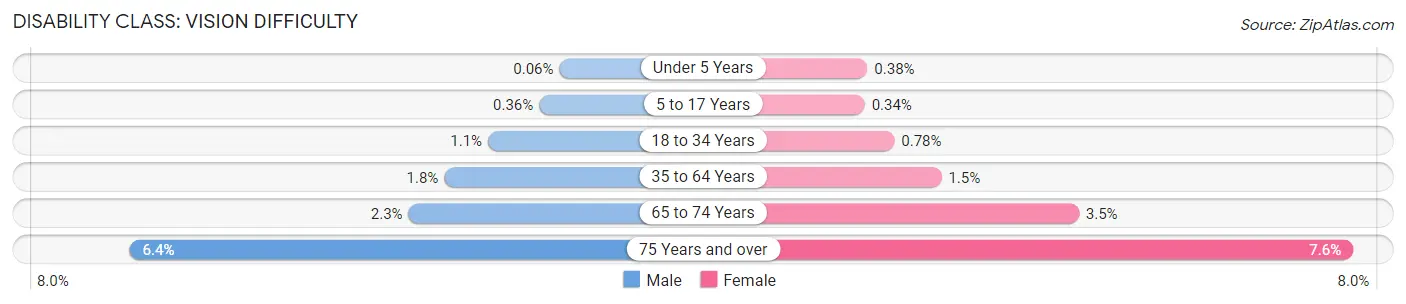
| Age Bracket | Male | Female |
| Under 5 Years | 10 (0.1%) | 58 (0.4%) |
| 5 to 17 Years | 190 (0.4%) | 170 (0.3%) |
| 18 to 34 Years | 705 (1.1%) | 473 (0.8%) |
| 35 to 64 Years | 2,316 (1.8%) | 1,991 (1.5%) |
| 65 to 74 Years | 747 (2.3%) | 1,261 (3.5%) |
| 75 Years and over | 1,204 (6.4%) | 2,142 (7.6%) |
Disability Class: Cognitive Difficulty
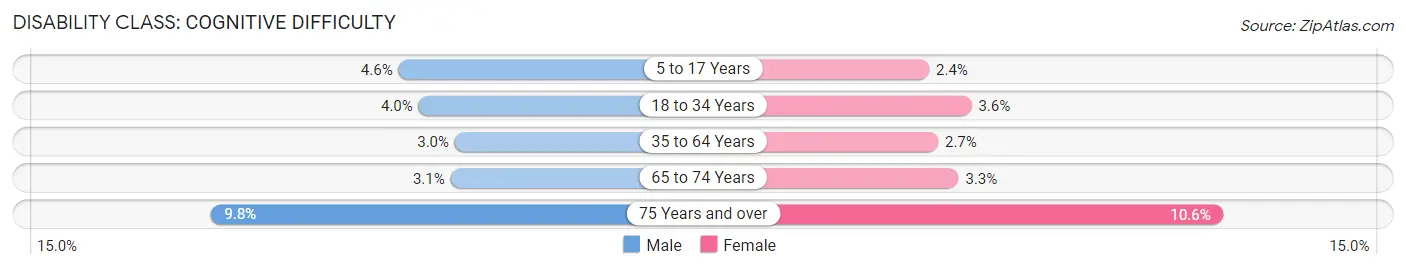
| Age Bracket | Male | Female |
| 5 to 17 Years | 2,406 (4.6%) | 1,219 (2.4%) |
| 18 to 34 Years | 2,544 (4.0%) | 2,200 (3.6%) |
| 35 to 64 Years | 3,957 (3.0%) | 3,614 (2.7%) |
| 65 to 74 Years | 1,021 (3.1%) | 1,166 (3.3%) |
| 75 Years and over | 1,834 (9.8%) | 2,992 (10.6%) |
Disability Class: Ambulatory Difficulty
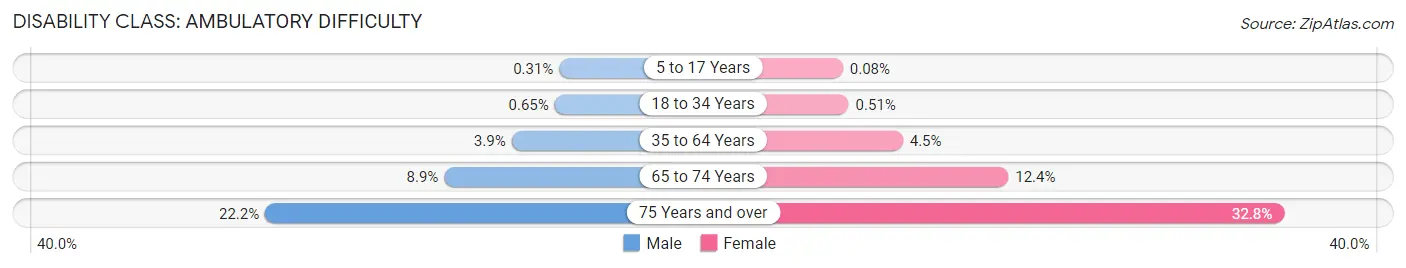
| Age Bracket | Male | Female |
| 5 to 17 Years | 164 (0.3%) | 38 (0.1%) |
| 18 to 34 Years | 411 (0.6%) | 313 (0.5%) |
| 35 to 64 Years | 5,043 (3.8%) | 6,116 (4.5%) |
| 65 to 74 Years | 2,875 (8.8%) | 4,429 (12.4%) |
| 75 Years and over | 4,144 (22.2%) | 9,270 (32.8%) |
Disability Class: Self-Care Difficulty
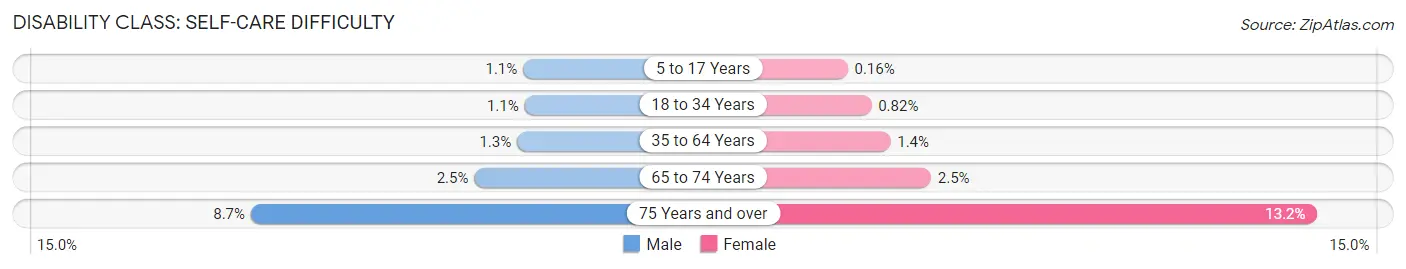
| Age Bracket | Male | Female |
| 5 to 17 Years | 585 (1.1%) | 78 (0.2%) |
| 18 to 34 Years | 682 (1.1%) | 501 (0.8%) |
| 35 to 64 Years | 1,685 (1.3%) | 1,817 (1.3%) |
| 65 to 74 Years | 806 (2.5%) | 889 (2.5%) |
| 75 Years and over | 1,628 (8.7%) | 3,737 (13.2%) |
Technology Access in Monmouth County
Computing Device Access in Monmouth County
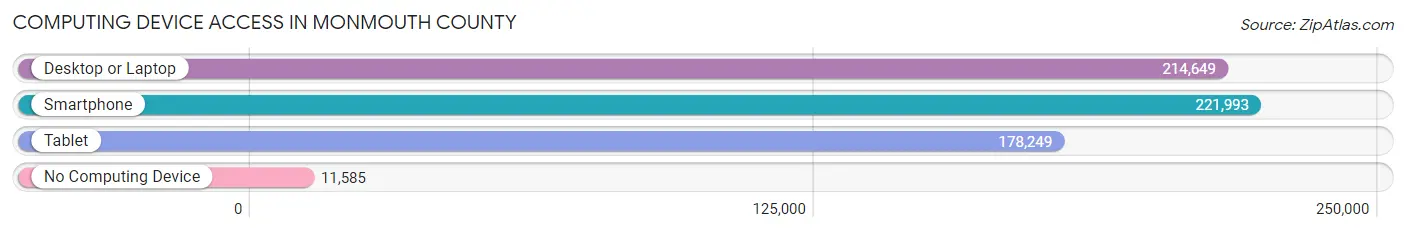
| Device Type | # Households | % Households |
| Desktop or Laptop | 214,649 | 86.5% |
| Smartphone | 221,993 | 89.5% |
| Tablet | 178,249 | 71.8% |
| No Computing Device | 11,585 | 4.7% |
| Total | 248,117 | 100.0% |
Internet Access in Monmouth County
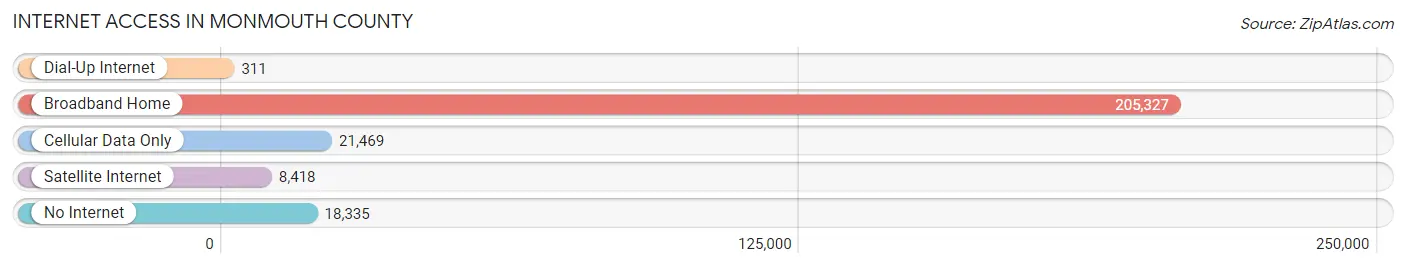
| Internet Type | # Households | % Households |
| Dial-Up Internet | 311 | 0.1% |
| Broadband Home | 205,327 | 82.8% |
| Cellular Data Only | 21,469 | 8.6% |
| Satellite Internet | 8,418 | 3.4% |
| No Internet | 18,335 | 7.4% |
| Total | 248,117 | 100.0% |
Monmouth County Summary
Monmouth County, New Jersey is located in the central part of the state and is part of the New York metropolitan area. It is bordered by Ocean County to the south, Middlesex County to the north, and Mercer County to the west. The county seat is Freehold Borough. Monmouth County is home to a population of 615,301 people, making it the fifth most populous county in New Jersey.
Geography
Monmouth County covers an area of 665 square miles and is located in the central part of the state. It is bordered by Ocean County to the south, Middlesex County to the north, and Mercer County to the west. The county is divided into two distinct regions: the coastal plain and the hills. The coastal plain is located in the eastern part of the county and is characterized by flat terrain and sandy soils. The hills are located in the western part of the county and are characterized by rolling hills and rocky soils. The highest point in the county is located in the hills, at an elevation of 845 feet.
The county is home to several rivers, including the Manasquan River, the Shark River, and the Metedeconk River. The county also contains several lakes, including Lake Como, Lake Topanemus, and Lake Oswego.
Climate
Monmouth County has a humid subtropical climate, with hot, humid summers and cold, wet winters. The average annual temperature is 54°F, with an average high of 79°F in July and an average low of 28°F in January. The average annual precipitation is 45 inches, with an average of 4.5 inches of snowfall per year.
Demographics
As of the 2010 census, Monmouth County had a population of 615,301 people. The racial makeup of the county was 79.2% White, 11.2% African American, 0.3% Native American, 3.3% Asian, and 4.9% from two or more races. Hispanic or Latino of any race made up 8.7% of the population.
The median household income in Monmouth County was $81,856 in 2017, and the median family income was $97,817. The per capita income was $41,945. The poverty rate was 6.2%.
Economy
Monmouth County is home to a diverse economy, with a mix of manufacturing, retail, and service industries. The county is home to several major employers, including Fort Monmouth, Monmouth Medical Center, and the Monmouth Mall. The county is also home to several major corporations, including AT&T, Verizon, and Johnson & Johnson.
Monmouth County is home to several major tourist attractions, including the Jersey Shore, Six Flags Great Adventure, and the Monmouth Race Track. The county is also home to several major universities, including Monmouth University, Brookdale Community College, and Rutgers University.
Monmouth County is home to several major transportation hubs, including the Garden State Parkway, the New Jersey Turnpike, and the Atlantic City Expressway. The county is also served by several major airports, including Newark Liberty International Airport, LaGuardia Airport, and John F. Kennedy International Airport.
Conclusion
Monmouth County, New Jersey is a diverse and vibrant county located in the central part of the state. It is home to a population of 615,301 people and is bordered by Ocean County to the south, Middlesex County to the north, and Mercer County to the west. The county is home to a diverse economy, with a mix of manufacturing, retail, and service industries. It is also home to several major tourist attractions, universities, and transportation hubs.
Common Questions
What is the Total Population of Monmouth County?
Total Population of Monmouth County is 643,064.
What is the Total Male Population of Monmouth County?
Total Male Population of Monmouth County is 315,742.
What is the Total Female Population of Monmouth County?
Total Female Population of Monmouth County is 327,322.
What is the Ratio of Males per 100 Females in Monmouth County?
There are 96.46 Males per 100 Females in Monmouth County.
What is the Ratio of Females per 100 Males in Monmouth County?
There are 103.67 Females per 100 Males in Monmouth County.
What is the Median Population Age in Monmouth County?
Median Population Age in Monmouth County is 43.3 Years.
What is the Average Family Size in Monmouth County
Average Family Size in Monmouth County is 3.1 People.
What is the Average Household Size in Monmouth County
Average Household Size in Monmouth County is 2.6 People.
What is Per Capita Income in Monmouth County?
Per Capita income in Monmouth County is $62,998.
What is the Median Family Income in Monmouth County?
Median Family Income in Monmouth County is $150,040.
What is the Median Household income in Monmouth County?
Median Household Income in Monmouth County is $118,527.
What is Income or Wage Gap in Monmouth County?
Income or Wage Gap in Monmouth County is 38.2%.
Women in Monmouth County earn 61.8 cents for every dollar earned by a man.
What is Family Income Deficit in Monmouth County?
Family Income Deficit in Monmouth County is $11,768.
Families that are below poverty line in Monmouth County earn $11,768 less on average than the poverty threshold level.
What is Inequality or Gini Index in Monmouth County?
Inequality or Gini Index in Monmouth County is 0.48.
How Large is the Labor Force in Monmouth County?
There are 350,736 People in the Labor Forcein in Monmouth County.
What is the Percentage of People in the Labor Force in Monmouth County?
66.5% of People are in the Labor Force in Monmouth County.
What is the Unemployment Rate in Monmouth County?
Unemployment Rate in Monmouth County is 5.4%.