Middlesex County, NJ
Middlesex County Map
Middlesex County Overview
860,147
TOTAL POPULATION
427,707
MALE POPULATION
432,440
FEMALE POPULATION
98.91
MALES / 100 FEMALES
101.11
FEMALES / 100 MALES
39.1
MEDIAN AGE
3.3
AVG FAMILY SIZE
2.8
AVG HOUSEHOLD SIZE
$47,196
PER CAPITA INCOME
$124,842
AVG FAMILY INCOME
$105,206
AVG HOUSEHOLD INCOME
33.2%
WAGE / INCOME GAP [ % ]
66.8¢/ $1
WAGE / INCOME GAP [ $ ]
$10,071
FAMILY INCOME DEFICIT
0.43
INEQUALITY / GINI INDEX
462,489
LABOR FORCE [ PEOPLE ]
66.4%
PERCENT IN LABOR FORCE
6.3%
UNEMPLOYMENT RATE
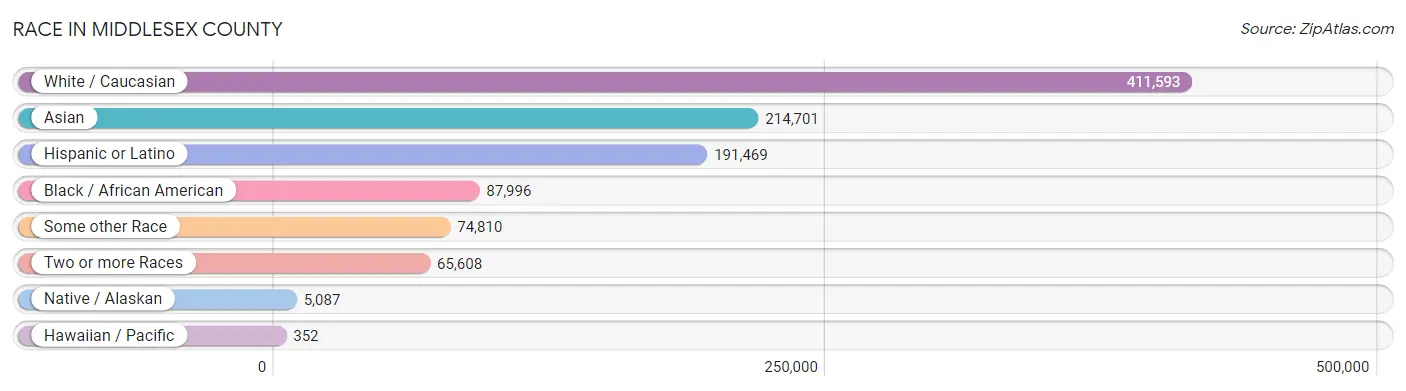
Race in Middlesex County
The most populous races in Middlesex County are White / Caucasian (411,593 | 47.8%), Asian (214,701 | 25.0%), and Hispanic or Latino (191,469 | 22.3%).
| Race | # Population | % Population |
| Asian | 214,701 | 25.0% |
| Black / African American | 87,996 | 10.2% |
| Hawaiian / Pacific | 352 | 0.0% |
| Hispanic or Latino | 191,469 | 22.3% |
| Native / Alaskan | 5,087 | 0.6% |
| White / Caucasian | 411,593 | 47.8% |
| Two or more Races | 65,608 | 7.6% |
| Some other Race | 74,810 | 8.7% |
| Total | 860,147 | 100.0% |
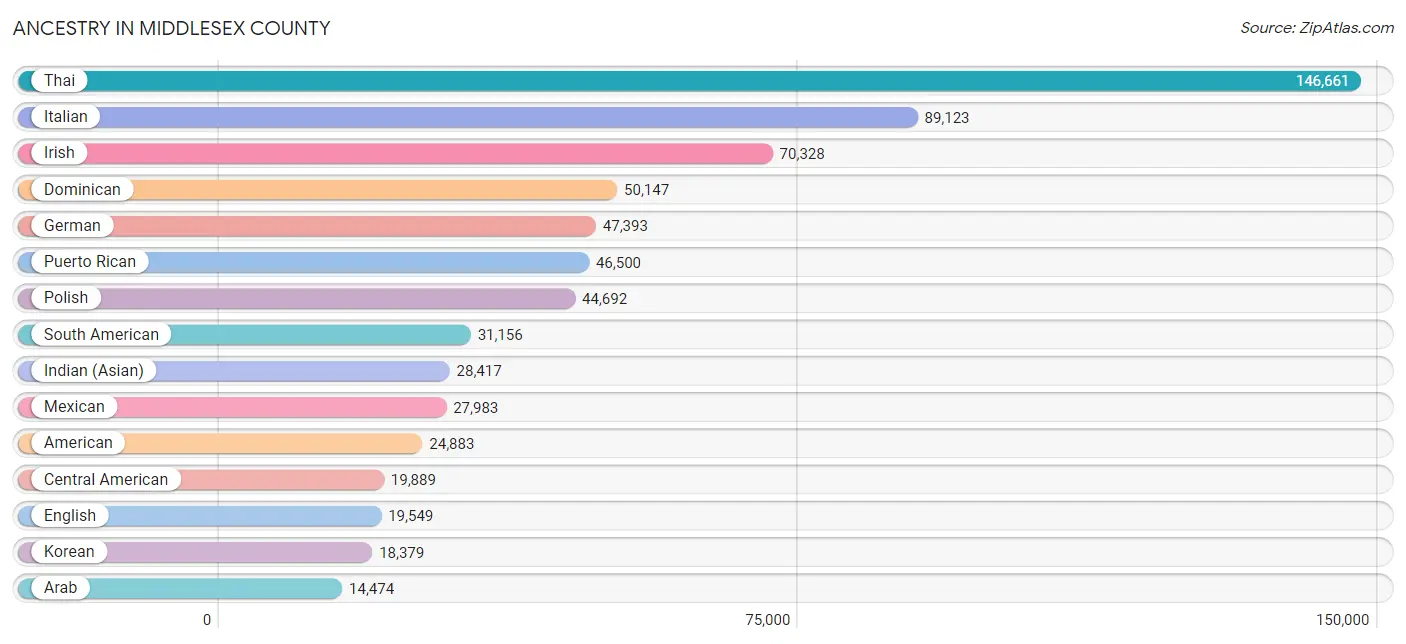
Ancestry in Middlesex County
The most populous ancestries reported in Middlesex County are Thai (146,661 | 17.1%), Italian (89,123 | 10.4%), Irish (70,328 | 8.2%), Dominican (50,147 | 5.8%), and German (47,393 | 5.5%), together accounting for 46.9% of all Middlesex County residents.
| Ancestry | # Population | % Population |
| Afghan | 386 | 0.0% |
| African | 3,898 | 0.4% |
| Alaskan Athabascan | 71 | 0.0% |
| Albanian | 827 | 0.1% |
| Alsatian | 17 | 0.0% |
| American | 24,883 | 2.9% |
| Apache | 130 | 0.0% |
| Arab | 14,474 | 1.7% |
| Argentinean | 2,563 | 0.3% |
| Armenian | 646 | 0.1% |
| Assyrian / Chaldean / Syriac | 47 | 0.0% |
| Australian | 77 | 0.0% |
| Austrian | 2,496 | 0.3% |
| Bahamian | 51 | 0.0% |
| Barbadian | 506 | 0.1% |
| Basque | 33 | 0.0% |
| Belgian | 706 | 0.1% |
| Belizean | 48 | 0.0% |
| Bermudan | 6 | 0.0% |
| Bhutanese | 1,662 | 0.2% |
| Blackfeet | 242 | 0.0% |
| Bolivian | 354 | 0.0% |
| Brazilian | 2,287 | 0.3% |
| British | 1,671 | 0.2% |
| British West Indian | 652 | 0.1% |
| Bulgarian | 210 | 0.0% |
| Burmese | 7,122 | 0.8% |
| Cambodian | 95 | 0.0% |
| Canadian | 654 | 0.1% |
| Cape Verdean | 26 | 0.0% |
| Carpatho Rusyn | 55 | 0.0% |
| Celtic | 16 | 0.0% |
| Central American | 19,889 | 2.3% |
| Central American Indian | 2,555 | 0.3% |
| Cherokee | 511 | 0.1% |
| Chickasaw | 3 | 0.0% |
| Chilean | 405 | 0.1% |
| Chippewa | 39 | 0.0% |
| Choctaw | 136 | 0.0% |
| Colombian | 10,285 | 1.2% |
| Comanche | 9 | 0.0% |
| Costa Rican | 1,034 | 0.1% |
| Cree | 59 | 0.0% |
| Creek | 12 | 0.0% |
| Croatian | 386 | 0.0% |
| Cuban | 5,508 | 0.6% |
| Cypriot | 31 | 0.0% |
| Czech | 1,782 | 0.2% |
| Czechoslovakian | 858 | 0.1% |
| Danish | 1,779 | 0.2% |
| Delaware | 392 | 0.1% |
| Dominican | 50,147 | 5.8% |
| Dutch | 2,445 | 0.3% |
| Dutch West Indian | 53 | 0.0% |
| Eastern European | 4,998 | 0.6% |
| Ecuadorian | 7,015 | 0.8% |
| Egyptian | 10,141 | 1.2% |
| English | 19,549 | 2.3% |
| Estonian | 117 | 0.0% |
| Ethiopian | 112 | 0.0% |
| European | 4,707 | 0.5% |
| Filipino | 1,865 | 0.2% |
| Finnish | 292 | 0.0% |
| French | 5,673 | 0.7% |
| French American Indian | 31 | 0.0% |
| French Canadian | 1,144 | 0.1% |
| German | 47,393 | 5.5% |
| German Russian | 59 | 0.0% |
| Ghanaian | 2,435 | 0.3% |
| Greek | 5,684 | 0.7% |
| Guamanian / Chamorro | 223 | 0.0% |
| Guatemalan | 3,017 | 0.4% |
| Guyanese | 2,586 | 0.3% |
| Haitian | 2,556 | 0.3% |
| Honduran | 8,044 | 0.9% |
| Hungarian | 13,463 | 1.6% |
| Indian (Asian) | 28,417 | 3.3% |
| Indonesian | 243 | 0.0% |
| Iranian | 651 | 0.1% |
| Iraqi | 239 | 0.0% |
| Irish | 70,328 | 8.2% |
| Iroquois | 215 | 0.0% |
| Israeli | 274 | 0.0% |
| Italian | 89,123 | 10.4% |
| Jamaican | 5,927 | 0.7% |
| Japanese | 84 | 0.0% |
| Jordanian | 449 | 0.1% |
| Kenyan | 429 | 0.1% |
| Korean | 18,379 | 2.1% |
| Laotian | 586 | 0.1% |
| Latvian | 165 | 0.0% |
| Lebanese | 1,226 | 0.1% |
| Liberian | 20 | 0.0% |
| Lithuanian | 1,795 | 0.2% |
| Lumbee | 7 | 0.0% |
| Luxembourger | 5 | 0.0% |
| Macedonian | 658 | 0.1% |
| Malaysian | 21 | 0.0% |
| Maltese | 87 | 0.0% |
| Mexican | 27,983 | 3.3% |
| Mexican American Indian | 1,860 | 0.2% |
| Mongolian | 165 | 0.0% |
| Moroccan | 530 | 0.1% |
| Native Hawaiian | 159 | 0.0% |
| Navajo | 76 | 0.0% |
| Nicaraguan | 1,017 | 0.1% |
| Nigerian | 3,520 | 0.4% |
| Northern European | 226 | 0.0% |
| Norwegian | 2,229 | 0.3% |
| Okinawan | 51 | 0.0% |
| Osage | 34 | 0.0% |
| Pakistani | 670 | 0.1% |
| Palestinian | 637 | 0.1% |
| Panamanian | 1,347 | 0.2% |
| Paraguayan | 165 | 0.0% |
| Pennsylvania German | 118 | 0.0% |
| Peruvian | 7,767 | 0.9% |
| Polish | 44,692 | 5.2% |
| Portuguese | 8,586 | 1.0% |
| Pueblo | 21 | 0.0% |
| Puerto Rican | 46,500 | 5.4% |
| Romanian | 1,374 | 0.2% |
| Russian | 13,764 | 1.6% |
| Salvadoran | 5,369 | 0.6% |
| Samoan | 43 | 0.0% |
| Scandinavian | 594 | 0.1% |
| Scotch-Irish | 1,537 | 0.2% |
| Scottish | 3,944 | 0.5% |
| Seminole | 22 | 0.0% |
| Serbian | 358 | 0.0% |
| Sierra Leonean | 281 | 0.0% |
| Sioux | 53 | 0.0% |
| Slavic | 968 | 0.1% |
| Slovak | 3,498 | 0.4% |
| Slovene | 64 | 0.0% |
| South African | 201 | 0.0% |
| South American | 31,156 | 3.6% |
| South American Indian | 339 | 0.0% |
| Soviet Union | 16 | 0.0% |
| Spaniard | 2,762 | 0.3% |
| Spanish | 1,643 | 0.2% |
| Spanish American | 89 | 0.0% |
| Spanish American Indian | 12 | 0.0% |
| Sri Lankan | 2,883 | 0.3% |
| Subsaharan African | 11,301 | 1.3% |
| Sudanese | 59 | 0.0% |
| Swedish | 2,311 | 0.3% |
| Swiss | 720 | 0.1% |
| Syrian | 342 | 0.0% |
| Thai | 146,661 | 17.1% |
| Trinidadian and Tobagonian | 1,655 | 0.2% |
| Turkish | 1,485 | 0.2% |
| U.S. Virgin Islander | 228 | 0.0% |
| Ugandan | 25 | 0.0% |
| Ukrainian | 7,272 | 0.9% |
| Uruguayan | 457 | 0.1% |
| Venezuelan | 1,899 | 0.2% |
| Vietnamese | 1,518 | 0.2% |
| Welsh | 1,264 | 0.2% |
| West Indian | 2,183 | 0.3% |
| Yugoslavian | 137 | 0.0% |
| Zimbabwean | 7 | 0.0% | View All 162 Rows |
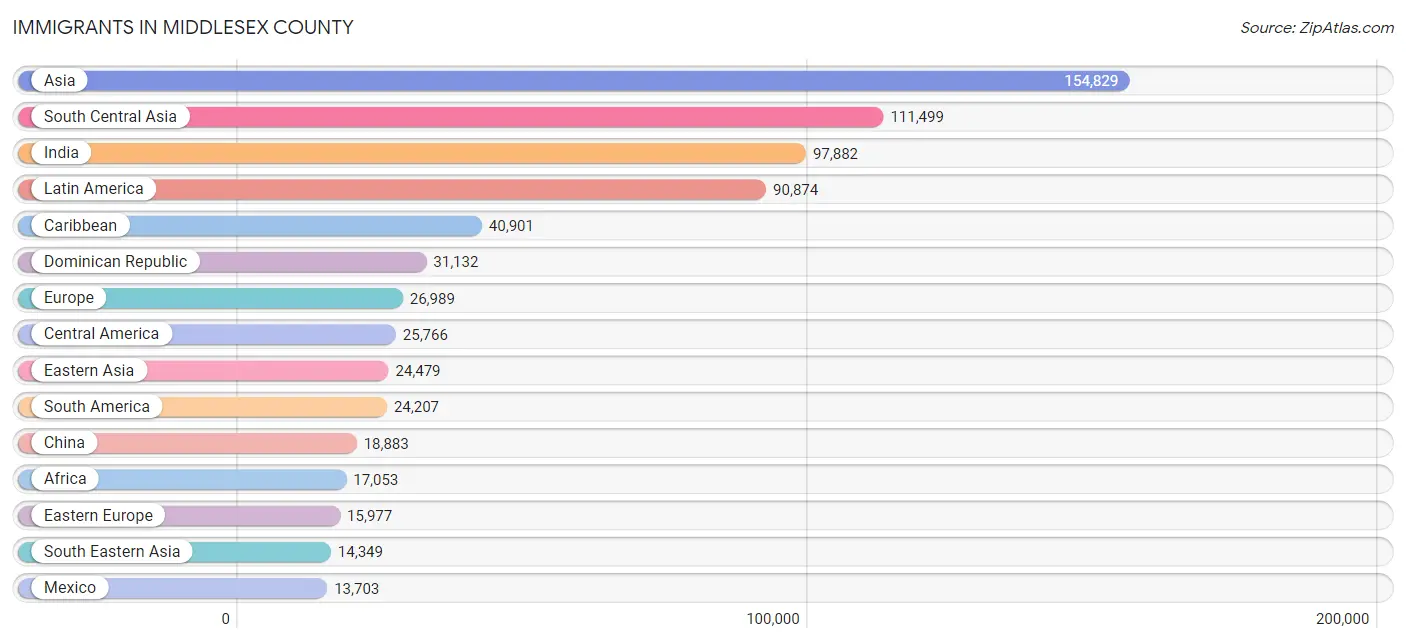
Immigrants in Middlesex County
The most numerous immigrant groups reported in Middlesex County came from Asia (154,829 | 18.0%), South Central Asia (111,499 | 13.0%), India (97,882 | 11.4%), Latin America (90,874 | 10.6%), and Caribbean (40,901 | 4.8%), together accounting for 57.7% of all Middlesex County residents.
| Immigration Origin | # Population | % Population |
| Afghanistan | 278 | 0.0% |
| Africa | 17,053 | 2.0% |
| Albania | 99 | 0.0% |
| Argentina | 1,384 | 0.2% |
| Armenia | 32 | 0.0% |
| Asia | 154,829 | 18.0% |
| Australia | 126 | 0.0% |
| Austria | 116 | 0.0% |
| Bahamas | 90 | 0.0% |
| Bangladesh | 1,936 | 0.2% |
| Barbados | 332 | 0.0% |
| Belarus | 286 | 0.0% |
| Belgium | 94 | 0.0% |
| Belize | 159 | 0.0% |
| Bolivia | 92 | 0.0% |
| Bosnia and Herzegovina | 20 | 0.0% |
| Brazil | 2,265 | 0.3% |
| Bulgaria | 201 | 0.0% |
| Cambodia | 46 | 0.0% |
| Cameroon | 63 | 0.0% |
| Canada | 3,393 | 0.4% |
| Caribbean | 40,901 | 4.8% |
| Central America | 25,766 | 3.0% |
| Chile | 336 | 0.0% |
| China | 18,883 | 2.2% |
| Colombia | 5,821 | 0.7% |
| Costa Rica | 625 | 0.1% |
| Croatia | 55 | 0.0% |
| Cuba | 1,952 | 0.2% |
| Czechoslovakia | 606 | 0.1% |
| Denmark | 43 | 0.0% |
| Dominica | 591 | 0.1% |
| Dominican Republic | 31,132 | 3.6% |
| Eastern Africa | 2,132 | 0.3% |
| Eastern Asia | 24,479 | 2.9% |
| Eastern Europe | 15,977 | 1.9% |
| Ecuador | 4,237 | 0.5% |
| Egypt | 6,984 | 0.8% |
| El Salvador | 3,095 | 0.4% |
| England | 563 | 0.1% |
| Ethiopia | 124 | 0.0% |
| Europe | 26,989 | 3.1% |
| Fiji | 88 | 0.0% |
| France | 259 | 0.0% |
| Germany | 1,219 | 0.1% |
| Ghana | 2,827 | 0.3% |
| Greece | 996 | 0.1% |
| Grenada | 222 | 0.0% |
| Guatemala | 2,190 | 0.3% |
| Guyana | 2,489 | 0.3% |
| Haiti | 1,396 | 0.2% |
| Honduras | 4,743 | 0.5% |
| Hong Kong | 2,097 | 0.2% |
| Hungary | 760 | 0.1% |
| India | 97,882 | 11.4% |
| Indonesia | 634 | 0.1% |
| Iran | 393 | 0.1% |
| Iraq | 233 | 0.0% |
| Ireland | 720 | 0.1% |
| Israel | 616 | 0.1% |
| Italy | 2,026 | 0.2% |
| Jamaica | 3,159 | 0.4% |
| Japan | 695 | 0.1% |
| Jordan | 357 | 0.0% |
| Kazakhstan | 101 | 0.0% |
| Kenya | 1,437 | 0.2% |
| Korea | 4,901 | 0.6% |
| Kuwait | 264 | 0.0% |
| Laos | 6 | 0.0% |
| Latin America | 90,874 | 10.6% |
| Latvia | 154 | 0.0% |
| Lebanon | 443 | 0.1% |
| Liberia | 170 | 0.0% |
| Lithuania | 273 | 0.0% |
| Malaysia | 254 | 0.0% |
| Mexico | 13,703 | 1.6% |
| Middle Africa | 151 | 0.0% |
| Moldova | 282 | 0.0% |
| Morocco | 402 | 0.1% |
| Nepal | 665 | 0.1% |
| Netherlands | 170 | 0.0% |
| Nicaragua | 513 | 0.1% |
| Nigeria | 2,460 | 0.3% |
| North Macedonia | 419 | 0.1% |
| Northern Africa | 7,764 | 0.9% |
| Northern Europe | 2,549 | 0.3% |
| Oceania | 214 | 0.0% |
| Pakistan | 8,007 | 0.9% |
| Panama | 738 | 0.1% |
| Peru | 5,439 | 0.6% |
| Philippines | 10,978 | 1.3% |
| Poland | 6,381 | 0.7% |
| Portugal | 3,108 | 0.4% |
| Romania | 423 | 0.1% |
| Russia | 2,139 | 0.3% |
| Saudi Arabia | 385 | 0.0% |
| Scotland | 166 | 0.0% |
| Senegal | 116 | 0.0% |
| Serbia | 147 | 0.0% |
| Sierra Leone | 648 | 0.1% |
| Singapore | 226 | 0.0% |
| South Africa | 218 | 0.0% |
| South America | 24,207 | 2.8% |
| South Central Asia | 111,499 | 13.0% |
| South Eastern Asia | 14,349 | 1.7% |
| Southern Europe | 6,431 | 0.7% |
| Spain | 294 | 0.0% |
| Sri Lanka | 1,383 | 0.2% |
| St. Vincent and the Grenadines | 131 | 0.0% |
| Sudan | 251 | 0.0% |
| Sweden | 21 | 0.0% |
| Switzerland | 108 | 0.0% |
| Syria | 87 | 0.0% |
| Taiwan | 3,041 | 0.4% |
| Thailand | 286 | 0.0% |
| Trinidad and Tobago | 1,285 | 0.2% |
| Turkey | 723 | 0.1% |
| Uganda | 258 | 0.0% |
| Ukraine | 3,231 | 0.4% |
| Uruguay | 269 | 0.0% |
| Uzbekistan | 517 | 0.1% |
| Venezuela | 1,654 | 0.2% |
| Vietnam | 1,665 | 0.2% |
| West Indies | 33 | 0.0% |
| Western Africa | 6,501 | 0.8% |
| Western Asia | 4,294 | 0.5% |
| Western Europe | 1,983 | 0.2% |
| Yemen | 135 | 0.0% |
| Zaire | 79 | 0.0% |
| Zimbabwe | 45 | 0.0% | View All 130 Rows |
Sex and Age in Middlesex County
Sex and Age in Middlesex County
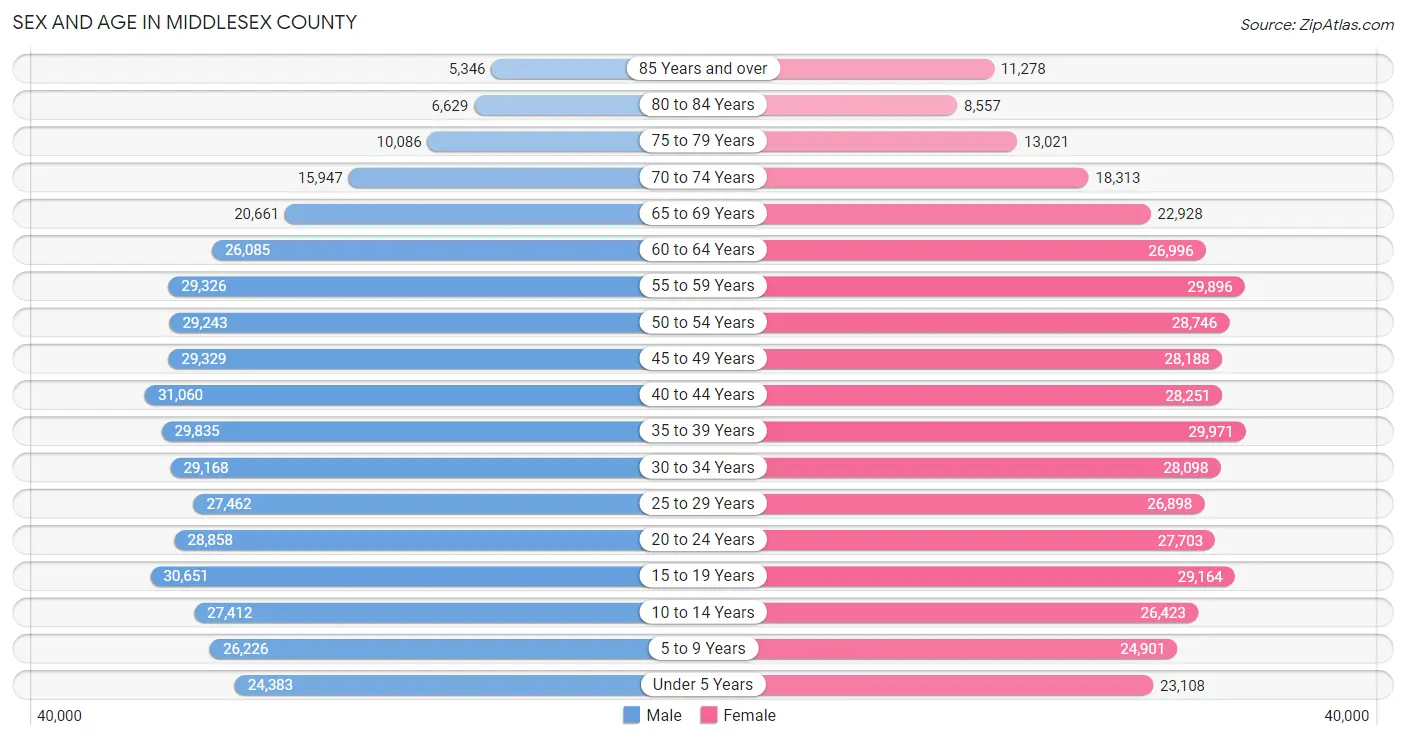
The most populous age groups in Middlesex County are 40 to 44 Years (31,060 | 7.3%) for men and 35 to 39 Years (29,971 | 6.9%) for women.
| Age Bracket | Male | Female |
| Under 5 Years | 24,383 (5.7%) | 23,108 (5.3%) |
| 5 to 9 Years | 26,226 (6.1%) | 24,901 (5.8%) |
| 10 to 14 Years | 27,412 (6.4%) | 26,423 (6.1%) |
| 15 to 19 Years | 30,651 (7.2%) | 29,164 (6.7%) |
| 20 to 24 Years | 28,858 (6.8%) | 27,703 (6.4%) |
| 25 to 29 Years | 27,462 (6.4%) | 26,898 (6.2%) |
| 30 to 34 Years | 29,168 (6.8%) | 28,098 (6.5%) |
| 35 to 39 Years | 29,835 (7.0%) | 29,971 (6.9%) |
| 40 to 44 Years | 31,060 (7.3%) | 28,251 (6.5%) |
| 45 to 49 Years | 29,329 (6.9%) | 28,188 (6.5%) |
| 50 to 54 Years | 29,243 (6.8%) | 28,746 (6.7%) |
| 55 to 59 Years | 29,326 (6.9%) | 29,896 (6.9%) |
| 60 to 64 Years | 26,085 (6.1%) | 26,996 (6.2%) |
| 65 to 69 Years | 20,661 (4.8%) | 22,928 (5.3%) |
| 70 to 74 Years | 15,947 (3.7%) | 18,313 (4.2%) |
| 75 to 79 Years | 10,086 (2.4%) | 13,021 (3.0%) |
| 80 to 84 Years | 6,629 (1.5%) | 8,557 (2.0%) |
| 85 Years and over | 5,346 (1.3%) | 11,278 (2.6%) |
| Total | 427,707 (100.0%) | 432,440 (100.0%) |
Families and Households in Middlesex County
Median Family Size in Middlesex County
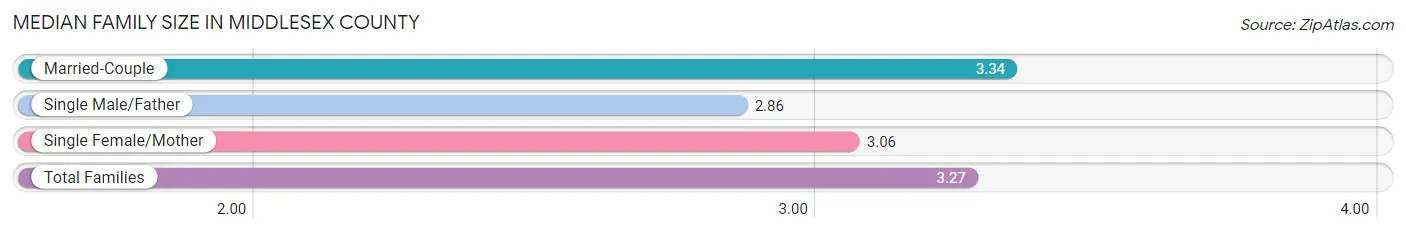
The median family size in Middlesex County is 3.27 persons per family, with married-couple families (167,206 | 76.9%) accounting for the largest median family size of 3.34 persons per family. On the other hand, single male/father families (14,023 | 6.5%) represent the smallest median family size with 2.86 persons per family.
| Family Type | # Families | Family Size |
| Married-Couple | 167,206 (76.9%) | 3.34 |
| Single Male/Father | 14,023 (6.5%) | 2.86 |
| Single Female/Mother | 36,071 (16.6%) | 3.06 |
| Total Families | 217,300 (100.0%) | 3.27 |
Median Household Size in Middlesex County
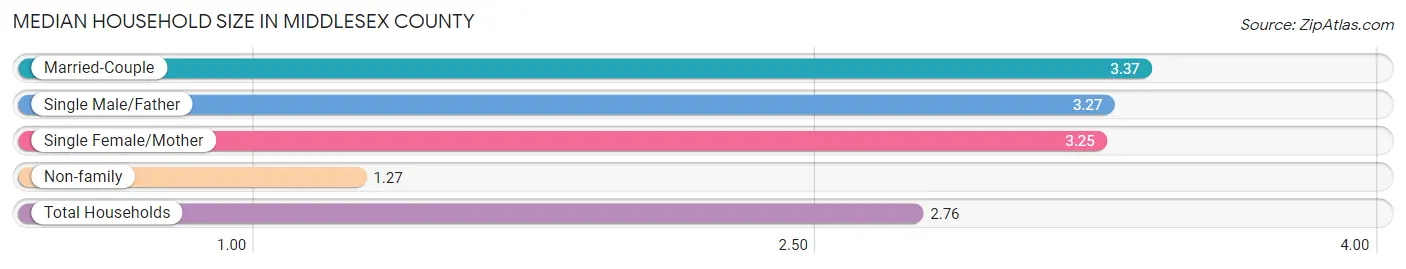
The median household size in Middlesex County is 2.76 persons per household, with married-couple households (167,206 | 55.4%) accounting for the largest median household size of 3.37 persons per household. non-family households (84,667 | 28.0%) represent the smallest median household size with 1.27 persons per household.
| Household Type | # Households | Household Size |
| Married-Couple | 167,206 (55.4%) | 3.37 |
| Single Male/Father | 14,023 (4.6%) | 3.27 |
| Single Female/Mother | 36,071 (11.9%) | 3.25 |
| Non-family | 84,667 (28.0%) | 1.27 |
| Total Households | 301,967 (100.0%) | 2.76 |
Household Size by Marriage Status in Middlesex County
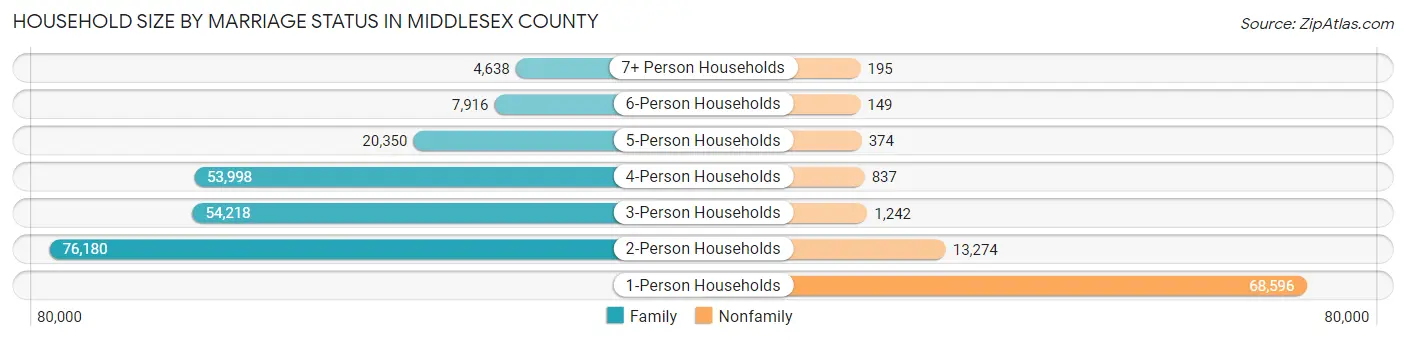
Out of a total of 301,967 households in Middlesex County, 217,300 (72.0%) are family households, while 84,667 (28.0%) are nonfamily households. The most numerous type of family households are 2-person households, comprising 76,180, and the most common type of nonfamily households are 1-person households, comprising 68,596.
| Household Size | Family Households | Nonfamily Households |
| 1-Person Households | - | 68,596 (22.7%) |
| 2-Person Households | 76,180 (25.2%) | 13,274 (4.4%) |
| 3-Person Households | 54,218 (17.9%) | 1,242 (0.4%) |
| 4-Person Households | 53,998 (17.9%) | 837 (0.3%) |
| 5-Person Households | 20,350 (6.7%) | 374 (0.1%) |
| 6-Person Households | 7,916 (2.6%) | 149 (0.1%) |
| 7+ Person Households | 4,638 (1.5%) | 195 (0.1%) |
| Total | 217,300 (72.0%) | 84,667 (28.0%) |
Female Fertility in Middlesex County
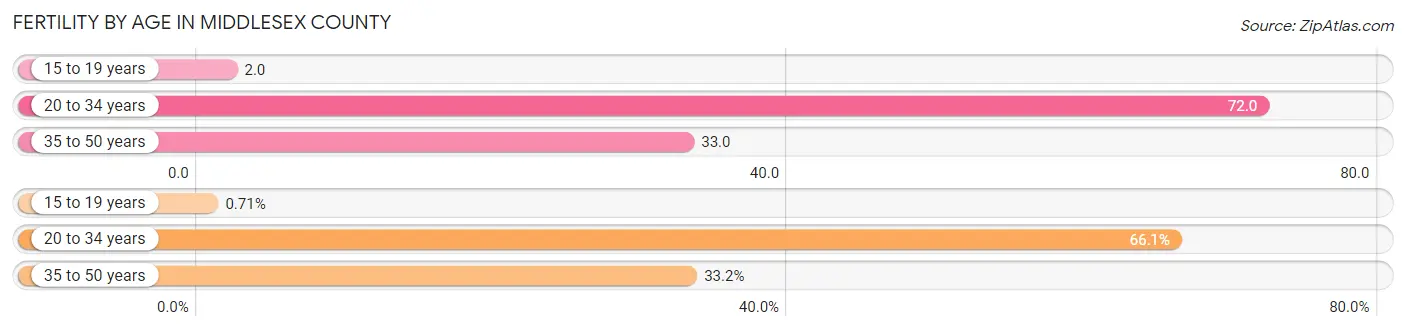
Fertility by Age in Middlesex County
Average fertility rate in Middlesex County is 44.0 births per 1,000 women. Women in the age bracket of 20 to 34 years have the highest fertility rate with 72.0 births per 1,000 women. Women in the age bracket of 20 to 34 years acount for 66.1% of all women with births.
| Age Bracket | Women with Births | Births / 1,000 Women |
| 15 to 19 years | 64 (0.7%) | 2.0 |
| 20 to 34 years | 5,977 (66.1%) | 72.0 |
| 35 to 50 years | 3,003 (33.2%) | 33.0 |
| Total | 9,044 (100.0%) | 44.0 |
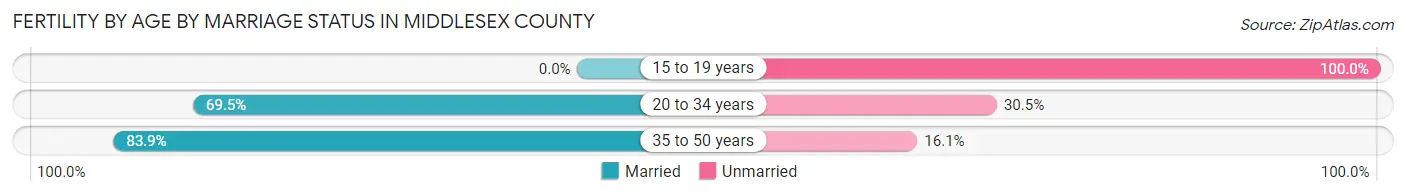
Fertility by Age by Marriage Status in Middlesex County
73.8% of women with births (9,044) in Middlesex County are married. The highest percentage of unmarried women with births falls into 15 to 19 years age bracket with 100.0% of them unmarried at the time of birth, while the lowest percentage of unmarried women with births belong to 35 to 50 years age bracket with 16.1% of them unmarried.
| Age Bracket | Married | Unmarried |
| 15 to 19 years | 0 (0.0%) | 64 (100.0%) |
| 20 to 34 years | 4,154 (69.5%) | 1,823 (30.5%) |
| 35 to 50 years | 2,520 (83.9%) | 483 (16.1%) |
| Total | 6,674 (73.8%) | 2,370 (26.2%) |
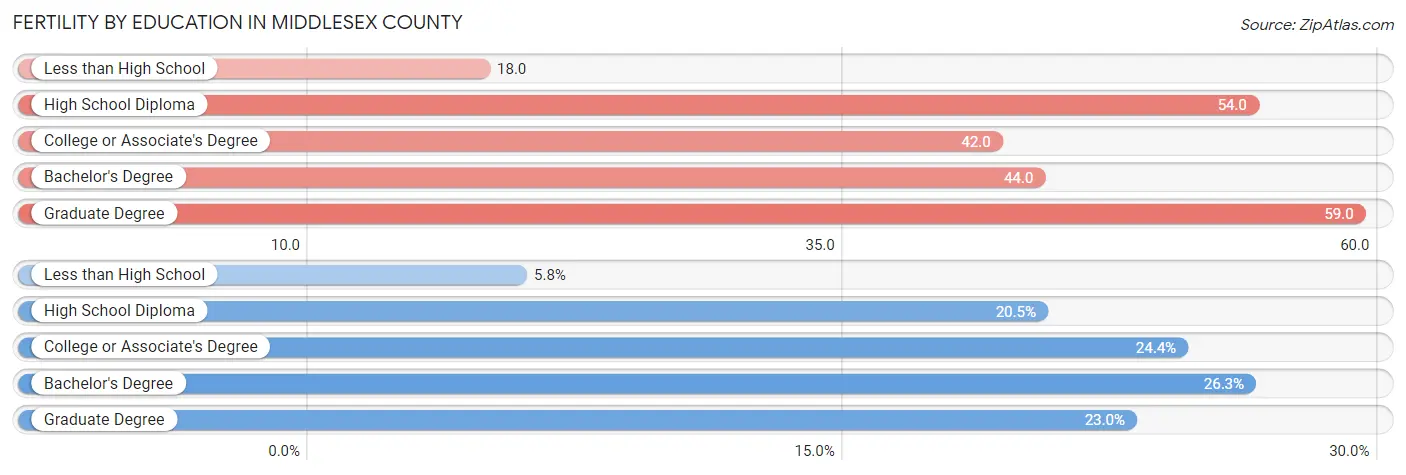
Fertility by Education in Middlesex County
Average fertility rate in Middlesex County is 44.0 births per 1,000 women. Women with the education attainment of graduate degree have the highest fertility rate of 59.0 births per 1,000 women, while women with the education attainment of less than high school have the lowest fertility at 18.0 births per 1,000 women. Women with the education attainment of bachelor's degree represent 26.3% of all women with births.
| Educational Attainment | Women with Births | Births / 1,000 Women |
| Less than High School | 528 (5.8%) | 18.0 |
| High School Diploma | 1,851 (20.5%) | 54.0 |
| College or Associate's Degree | 2,208 (24.4%) | 42.0 |
| Bachelor's Degree | 2,380 (26.3%) | 44.0 |
| Graduate Degree | 2,077 (23.0%) | 59.0 |
| Total | 9,044 (100.0%) | 44.0 |
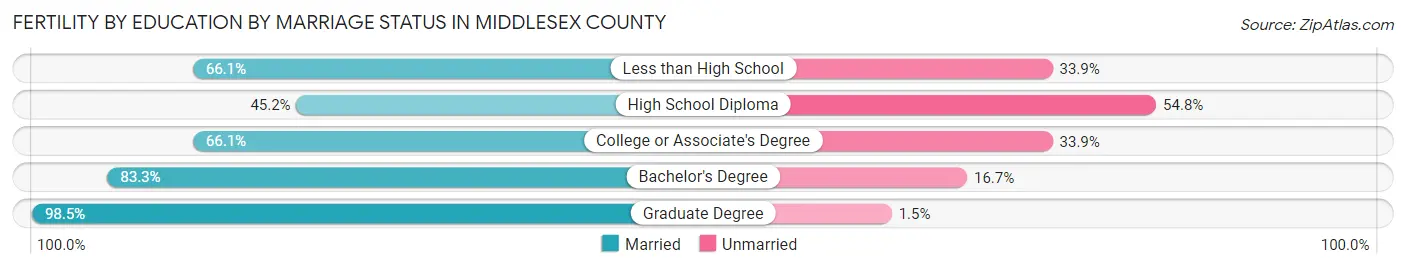
Fertility by Education by Marriage Status in Middlesex County
26.2% of women with births in Middlesex County are unmarried. Women with the educational attainment of graduate degree are most likely to be married with 98.5% of them married at childbirth, while women with the educational attainment of high school diploma are least likely to be married with 54.8% of them unmarried at childbirth.
| Educational Attainment | Married | Unmarried |
| Less than High School | 349 (66.1%) | 179 (33.9%) |
| High School Diploma | 837 (45.2%) | 1,014 (54.8%) |
| College or Associate's Degree | 1,459 (66.1%) | 749 (33.9%) |
| Bachelor's Degree | 1,983 (83.3%) | 397 (16.7%) |
| Graduate Degree | 2,046 (98.5%) | 31 (1.5%) |
| Total | 6,674 (73.8%) | 2,370 (26.2%) |
Income in Middlesex County
Income Overview in Middlesex County
Per Capita Income in Middlesex County is $47,196, while median incomes of families and households are $124,842 and $105,206 respectively.
| Characteristic | Number | Measure |
| Per Capita Income | 860,147 | $47,196 |
| Median Family Income | 217,300 | $124,842 |
| Mean Family Income | 217,300 | $151,439 |
| Median Household Income | 301,967 | $105,206 |
| Mean Household Income | 301,967 | $132,224 |
| Income Deficit | 217,300 | $10,071 |
| Wage / Income Gap (%) | 860,147 | 33.24% |
| Wage / Income Gap ($) | 860,147 | 66.76¢ per $1 |
| Gini / Inequality Index | 860,147 | 0.43 |
Earnings by Sex in Middlesex County
Average Earnings in Middlesex County are $53,205, $63,884 for men and $42,646 for women, a difference of 33.2%.
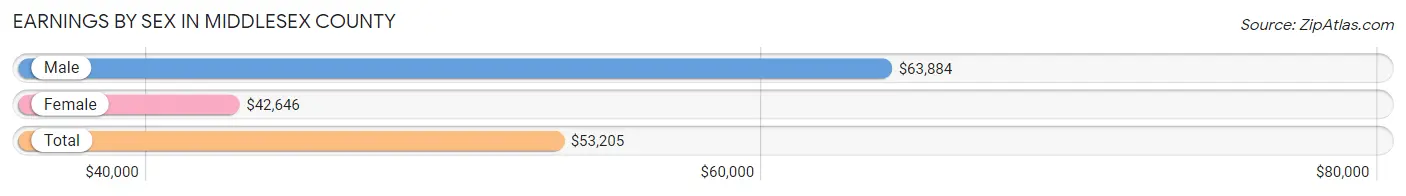
| Sex | Number | Average Earnings |
| Male | 254,893 (53.8%) | $63,884 |
| Female | 219,057 (46.2%) | $42,646 |
| Total | 473,950 (100.0%) | $53,205 |
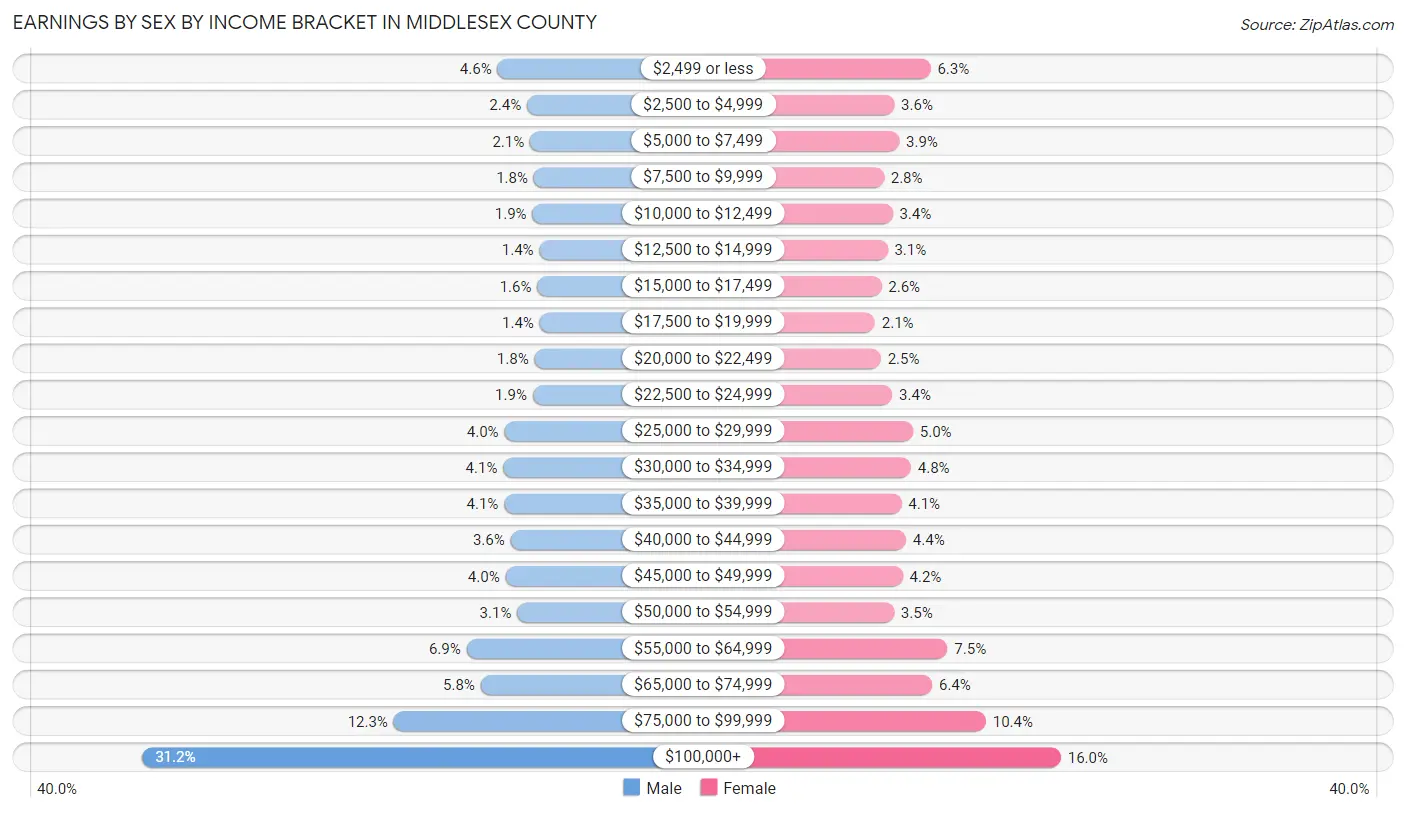
Earnings by Sex by Income Bracket in Middlesex County
The most common earnings brackets in Middlesex County are $100,000+ for men (79,484 | 31.2%) and $100,000+ for women (35,143 | 16.0%).
| Income | Male | Female |
| $2,499 or less | 11,628 (4.6%) | 13,733 (6.3%) |
| $2,500 to $4,999 | 5,986 (2.4%) | 7,770 (3.5%) |
| $5,000 to $7,499 | 5,394 (2.1%) | 8,584 (3.9%) |
| $7,500 to $9,999 | 4,695 (1.8%) | 6,078 (2.8%) |
| $10,000 to $12,499 | 4,946 (1.9%) | 7,497 (3.4%) |
| $12,500 to $14,999 | 3,614 (1.4%) | 6,691 (3.0%) |
| $15,000 to $17,499 | 4,031 (1.6%) | 5,667 (2.6%) |
| $17,500 to $19,999 | 3,558 (1.4%) | 4,607 (2.1%) |
| $20,000 to $22,499 | 4,575 (1.8%) | 5,556 (2.5%) |
| $22,500 to $24,999 | 4,906 (1.9%) | 7,450 (3.4%) |
| $25,000 to $29,999 | 10,297 (4.0%) | 10,839 (5.0%) |
| $30,000 to $34,999 | 10,533 (4.1%) | 10,510 (4.8%) |
| $35,000 to $39,999 | 10,336 (4.1%) | 8,970 (4.1%) |
| $40,000 to $44,999 | 9,132 (3.6%) | 9,709 (4.4%) |
| $45,000 to $49,999 | 10,101 (4.0%) | 9,158 (4.2%) |
| $50,000 to $54,999 | 7,846 (3.1%) | 7,738 (3.5%) |
| $55,000 to $64,999 | 17,544 (6.9%) | 16,527 (7.5%) |
| $65,000 to $74,999 | 14,825 (5.8%) | 14,003 (6.4%) |
| $75,000 to $99,999 | 31,462 (12.3%) | 22,827 (10.4%) |
| $100,000+ | 79,484 (31.2%) | 35,143 (16.0%) |
| Total | 254,893 (100.0%) | 219,057 (100.0%) |
Earnings by Sex by Educational Attainment in Middlesex County
Average earnings in Middlesex County are $74,147 for men and $49,751 for women, a difference of 32.9%. Men with an educational attainment of graduate degree enjoy the highest average annual earnings of $119,889, while those with less than high school education earn the least with $37,591. Women with an educational attainment of graduate degree earn the most with the average annual earnings of $77,703, while those with less than high school education have the smallest earnings of $25,786.
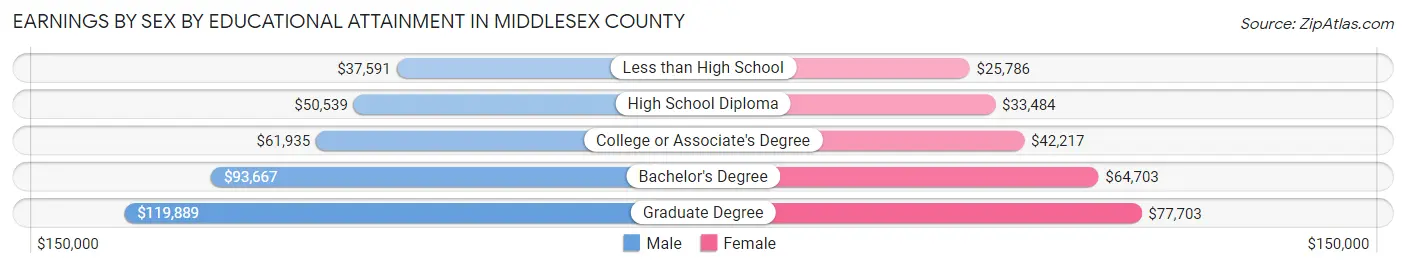
| Educational Attainment | Male Income | Female Income |
| Less than High School | $37,591 | $25,786 |
| High School Diploma | $50,539 | $33,484 |
| College or Associate's Degree | $61,935 | $42,217 |
| Bachelor's Degree | $93,667 | $64,703 |
| Graduate Degree | $119,889 | $77,703 |
| Total | $74,147 | $49,751 |
Family Income in Middlesex County
Family Income Brackets in Middlesex County
According to the Middlesex County family income data, there are 52,152 families falling into the $200,000+ income range, which is the most common income bracket and makes up 24.0% of all families. Conversely, the $10,000 to $14,999 income bracket is the least frequent group with only 2,608 families (1.2%) belonging to this category.
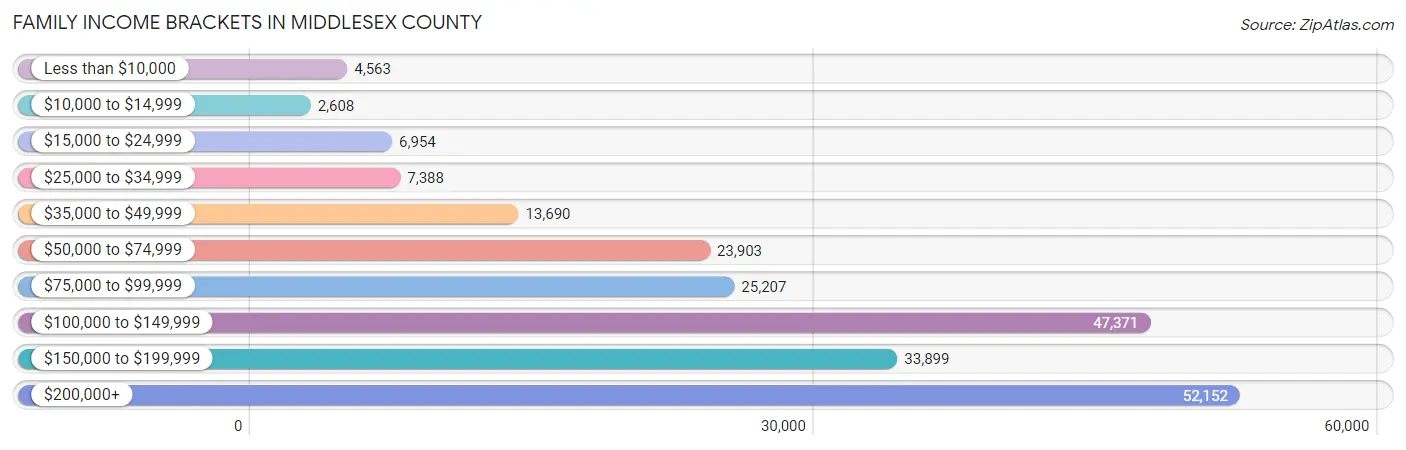
| Income Bracket | # Families | % Families |
| Less than $10,000 | 4,563 | 2.1% |
| $10,000 to $14,999 | 2,608 | 1.2% |
| $15,000 to $24,999 | 6,954 | 3.2% |
| $25,000 to $34,999 | 7,388 | 3.4% |
| $35,000 to $49,999 | 13,690 | 6.3% |
| $50,000 to $74,999 | 23,903 | 11.0% |
| $75,000 to $99,999 | 25,207 | 11.6% |
| $100,000 to $149,999 | 47,371 | 21.8% |
| $150,000 to $199,999 | 33,899 | 15.6% |
| $200,000+ | 52,152 | 24.0% |
Family Income by Famaliy Size in Middlesex County
7+ person families (3,920 | 1.8%) account for the highest median family income in Middlesex County with $164,135 per family, while 2-person families (80,468 | 37.0%) have the highest median income of $48,431 per family member.
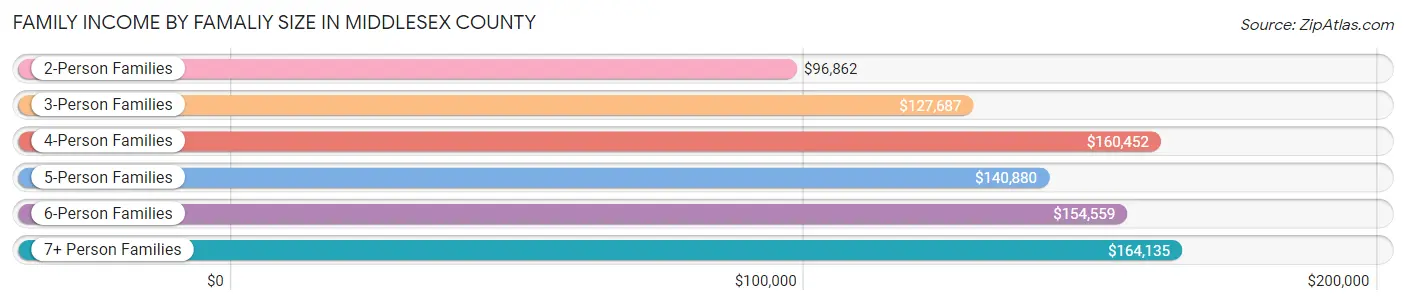
| Income Bracket | # Families | Median Income |
| 2-Person Families | 80,468 (37.0%) | $96,862 |
| 3-Person Families | 55,316 (25.5%) | $127,687 |
| 4-Person Families | 51,314 (23.6%) | $160,452 |
| 5-Person Families | 19,416 (8.9%) | $140,880 |
| 6-Person Families | 6,866 (3.2%) | $154,559 |
| 7+ Person Families | 3,920 (1.8%) | $164,135 |
| Total | 217,300 (100.0%) | $124,842 |
Family Income by Number of Earners in Middlesex County
The median family income in Middlesex County is $124,842, with families comprising 3+ earners (38,354) having the highest median family income of $179,587, while families with no earners (23,012) have the lowest median family income of $55,251, accounting for 17.6% and 10.6% of families, respectively.
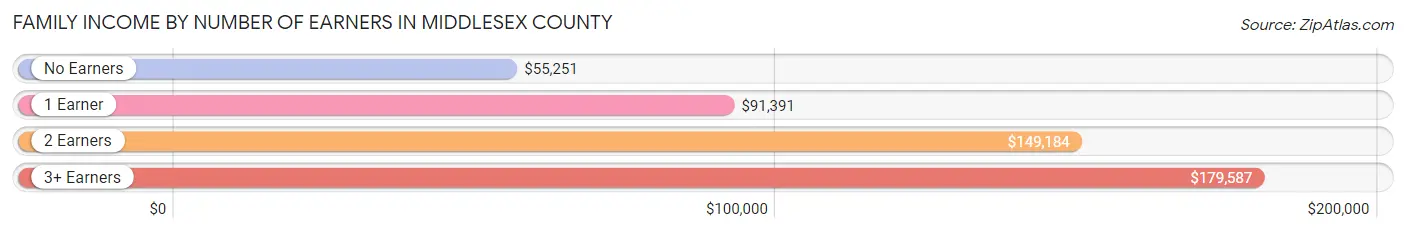
| Number of Earners | # Families | Median Income |
| No Earners | 23,012 (10.6%) | $55,251 |
| 1 Earner | 63,550 (29.2%) | $91,391 |
| 2 Earners | 92,384 (42.5%) | $149,184 |
| 3+ Earners | 38,354 (17.6%) | $179,587 |
| Total | 217,300 (100.0%) | $124,842 |
Household Income in Middlesex County
Household Income Brackets in Middlesex County
With 60,695 households falling in the category, the $100,000 to $149,999 income range is the most frequent in Middlesex County, accounting for 20.1% of all households. In contrast, only 7,549 households (2.5%) fall into the $10,000 to $14,999 income bracket, making it the least populous group.
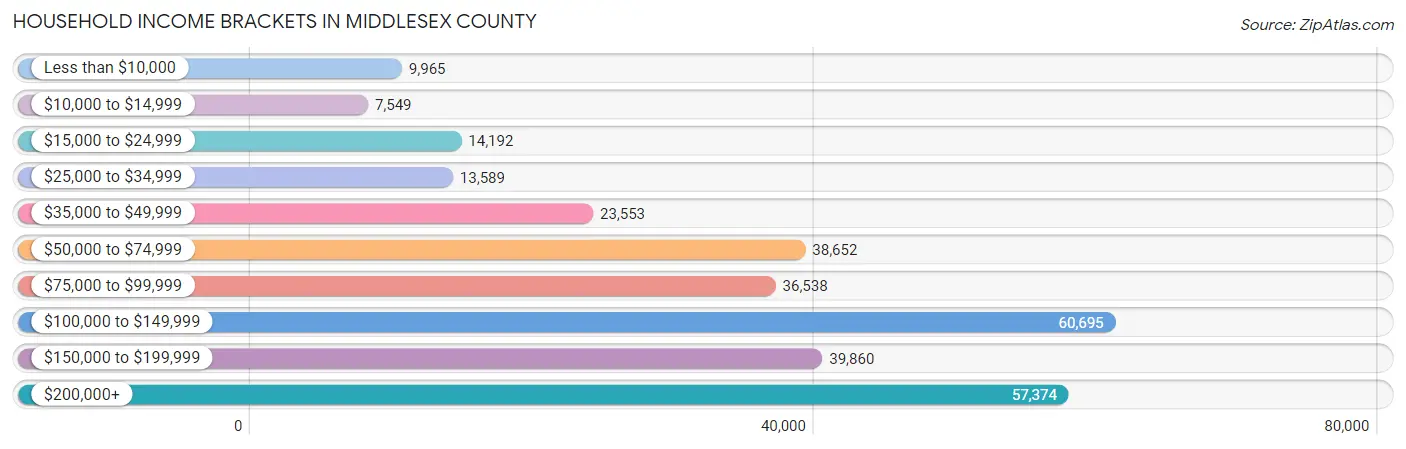
| Income Bracket | # Households | % Households |
| Less than $10,000 | 9,965 | 3.3% |
| $10,000 to $14,999 | 7,549 | 2.5% |
| $15,000 to $24,999 | 14,192 | 4.7% |
| $25,000 to $34,999 | 13,589 | 4.5% |
| $35,000 to $49,999 | 23,553 | 7.8% |
| $50,000 to $74,999 | 38,652 | 12.8% |
| $75,000 to $99,999 | 36,538 | 12.1% |
| $100,000 to $149,999 | 60,695 | 20.1% |
| $150,000 to $199,999 | 39,860 | 13.2% |
| $200,000+ | 57,374 | 19.0% |
Household Income by Householder Age in Middlesex County
The median household income in Middlesex County is $105,206, with the highest median household income of $127,352 found in the 45 to 64 years age bracket for the primary householder. A total of 123,156 households (40.8%) fall into this category. Meanwhile, the 15 to 24 years age bracket for the primary householder has the lowest median household income of $47,210, with 5,248 households (1.7%) in this group.
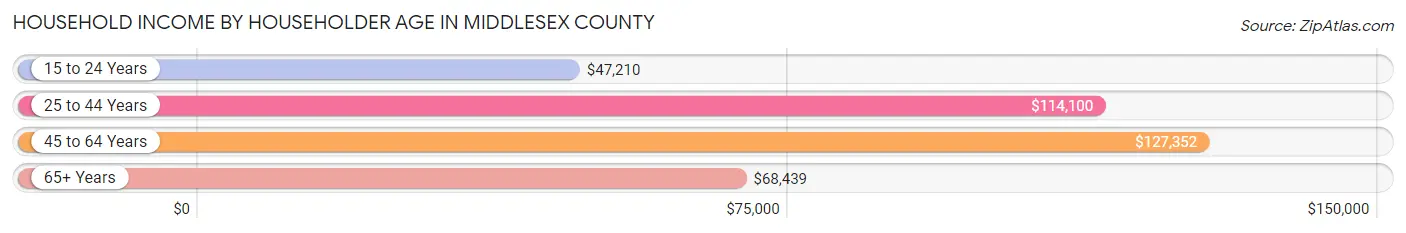
| Income Bracket | # Households | Median Income |
| 15 to 24 Years | 5,248 (1.7%) | $47,210 |
| 25 to 44 Years | 97,769 (32.4%) | $114,100 |
| 45 to 64 Years | 123,156 (40.8%) | $127,352 |
| 65+ Years | 75,794 (25.1%) | $68,439 |
| Total | 301,967 (100.0%) | $105,206 |
Poverty in Middlesex County
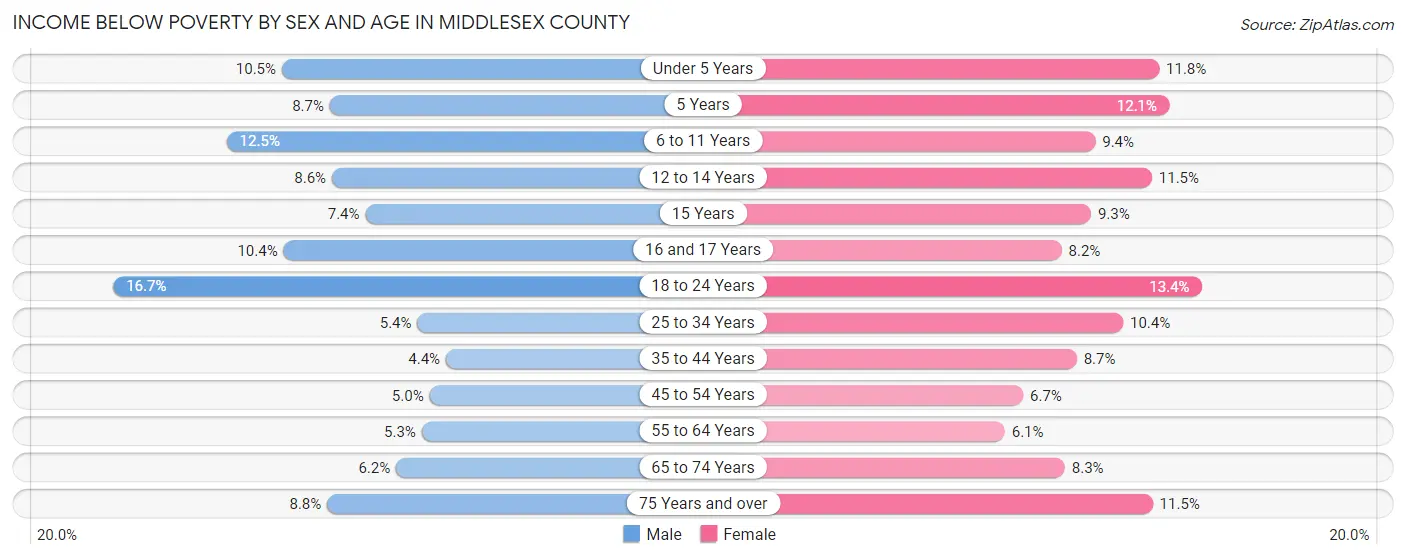
Income Below Poverty by Sex and Age in Middlesex County
With 7.5% poverty level for males and 9.2% for females among the residents of Middlesex County, 18 to 24 year old males and 18 to 24 year old females are the most vulnerable to poverty, with 5,686 males (16.7%) and 4,199 females (13.4%) in their respective age groups living below the poverty level.
| Age Bracket | Male | Female |
| Under 5 Years | 2,516 (10.4%) | 2,663 (11.8%) |
| 5 Years | 448 (8.7%) | 590 (12.1%) |
| 6 to 11 Years | 3,937 (12.5%) | 2,871 (9.4%) |
| 12 to 14 Years | 1,423 (8.6%) | 1,793 (11.5%) |
| 15 Years | 426 (7.3%) | 497 (9.2%) |
| 16 and 17 Years | 1,141 (10.4%) | 880 (8.2%) |
| 18 to 24 Years | 5,686 (16.7%) | 4,199 (13.4%) |
| 25 to 34 Years | 3,012 (5.4%) | 5,729 (10.4%) |
| 35 to 44 Years | 2,617 (4.4%) | 5,063 (8.7%) |
| 45 to 54 Years | 2,865 (5.0%) | 3,825 (6.7%) |
| 55 to 64 Years | 2,855 (5.3%) | 3,431 (6.0%) |
| 65 to 74 Years | 2,242 (6.2%) | 3,396 (8.3%) |
| 75 Years and over | 1,880 (8.8%) | 3,641 (11.5%) |
| Total | 31,048 (7.5%) | 38,578 (9.2%) |
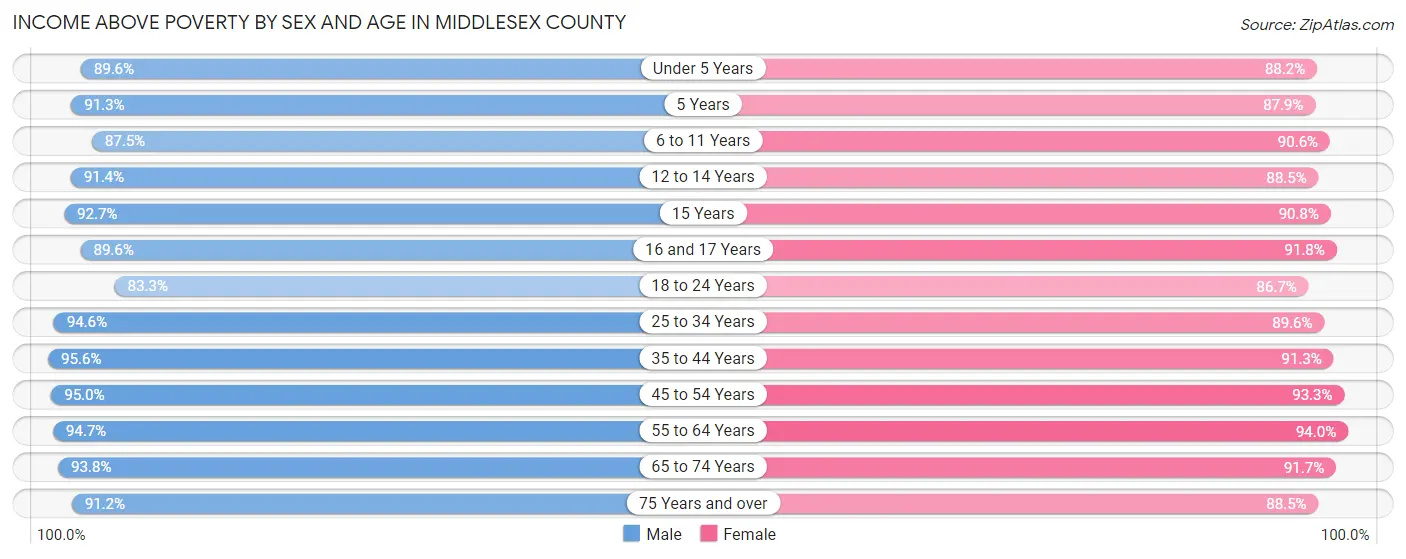
Income Above Poverty by Sex and Age in Middlesex County
According to the poverty statistics in Middlesex County, males aged 35 to 44 years and females aged 55 to 64 years are the age groups that are most secure financially, with 95.6% of males and 94.0% of females in these age groups living above the poverty line.
| Age Bracket | Male | Female |
| Under 5 Years | 21,572 (89.5%) | 19,939 (88.2%) |
| 5 Years | 4,721 (91.3%) | 4,269 (87.9%) |
| 6 to 11 Years | 27,568 (87.5%) | 27,639 (90.6%) |
| 12 to 14 Years | 15,134 (91.4%) | 13,788 (88.5%) |
| 15 Years | 5,370 (92.6%) | 4,874 (90.7%) |
| 16 and 17 Years | 9,846 (89.6%) | 9,906 (91.8%) |
| 18 to 24 Years | 28,350 (83.3%) | 27,262 (86.7%) |
| 25 to 34 Years | 52,565 (94.6%) | 49,134 (89.6%) |
| 35 to 44 Years | 57,386 (95.6%) | 52,994 (91.3%) |
| 45 to 54 Years | 54,725 (95.0%) | 53,050 (93.3%) |
| 55 to 64 Years | 51,409 (94.7%) | 53,310 (94.0%) |
| 65 to 74 Years | 33,836 (93.8%) | 37,631 (91.7%) |
| 75 Years and over | 19,559 (91.2%) | 27,919 (88.5%) |
| Total | 382,041 (92.5%) | 381,715 (90.8%) |
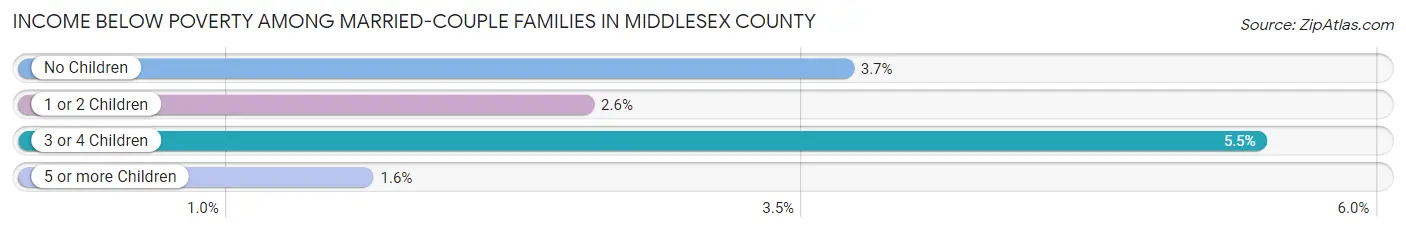
Income Below Poverty Among Married-Couple Families in Middlesex County
The poverty statistics for married-couple families in Middlesex County show that 3.3% or 5,556 of the total 167,206 families live below the poverty line. Families with 3 or 4 children have the highest poverty rate of 5.5%, comprising of 542 families. On the other hand, families with 5 or more children have the lowest poverty rate of 1.6%, which includes 8 families.
| Children | Above Poverty | Below Poverty |
| No Children | 85,742 (96.3%) | 3,277 (3.7%) |
| 1 or 2 Children | 66,069 (97.5%) | 1,729 (2.5%) |
| 3 or 4 Children | 9,343 (94.5%) | 542 (5.5%) |
| 5 or more Children | 496 (98.4%) | 8 (1.6%) |
| Total | 161,650 (96.7%) | 5,556 (3.3%) |
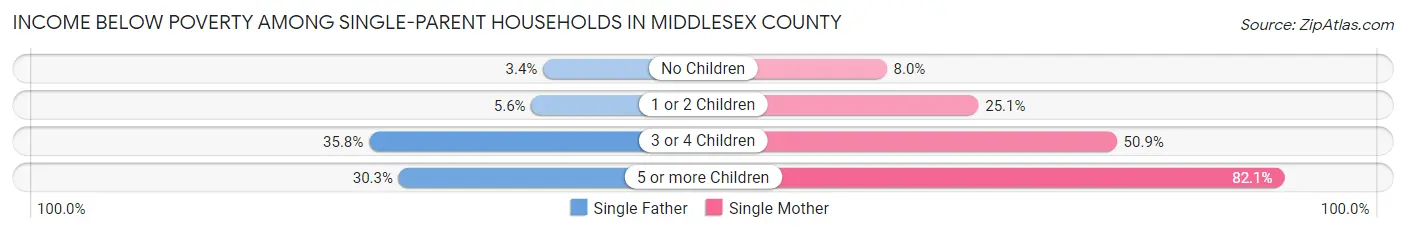
Income Below Poverty Among Single-Parent Households in Middlesex County
According to the poverty data in Middlesex County, 6.7% or 932 single-father households and 19.0% or 6,865 single-mother households are living below the poverty line. Among single-father households, those with 3 or 4 children have the highest poverty rate, with 354 households (35.8%) experiencing poverty. Likewise, among single-mother households, those with 5 or more children have the highest poverty rate, with 151 households (82.1%) falling below the poverty line.
| Children | Single Father | Single Mother |
| No Children | 250 (3.4%) | 1,337 (8.0%) |
| 1 or 2 Children | 318 (5.6%) | 4,246 (25.1%) |
| 3 or 4 Children | 354 (35.8%) | 1,131 (50.8%) |
| 5 or more Children | 10 (30.3%) | 151 (82.1%) |
| Total | 932 (6.7%) | 6,865 (19.0%) |
Income Below Poverty Among Married-Couple vs Single-Parent Households in Middlesex County
The poverty data for Middlesex County shows that 5,556 of the married-couple family households (3.3%) and 7,797 of the single-parent households (15.6%) are living below the poverty level. Within the married-couple family households, those with 3 or 4 children have the highest poverty rate, with 542 households (5.5%) falling below the poverty line. Among the single-parent households, those with 5 or more children have the highest poverty rate, with 161 household (74.2%) living below poverty.
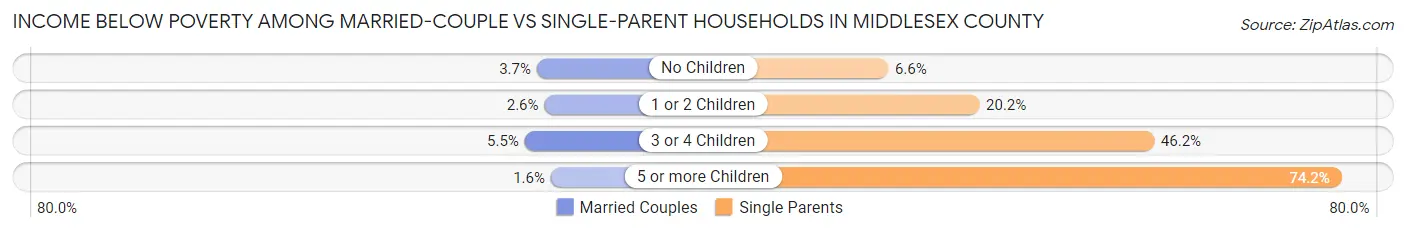
| Children | Married-Couple Families | Single-Parent Households |
| No Children | 3,277 (3.7%) | 1,587 (6.6%) |
| 1 or 2 Children | 1,729 (2.5%) | 4,564 (20.2%) |
| 3 or 4 Children | 542 (5.5%) | 1,485 (46.2%) |
| 5 or more Children | 8 (1.6%) | 161 (74.2%) |
| Total | 5,556 (3.3%) | 7,797 (15.6%) |
Employment Characteristics in Middlesex County
Employment by Class of Employer in Middlesex County
Among the 420,626 employed individuals in Middlesex County, private company employees (300,649 | 71.5%), not-for-profit organizations (30,904 | 7.3%), and local government employees (29,346 | 7.0%) make up the most common classes of employment.
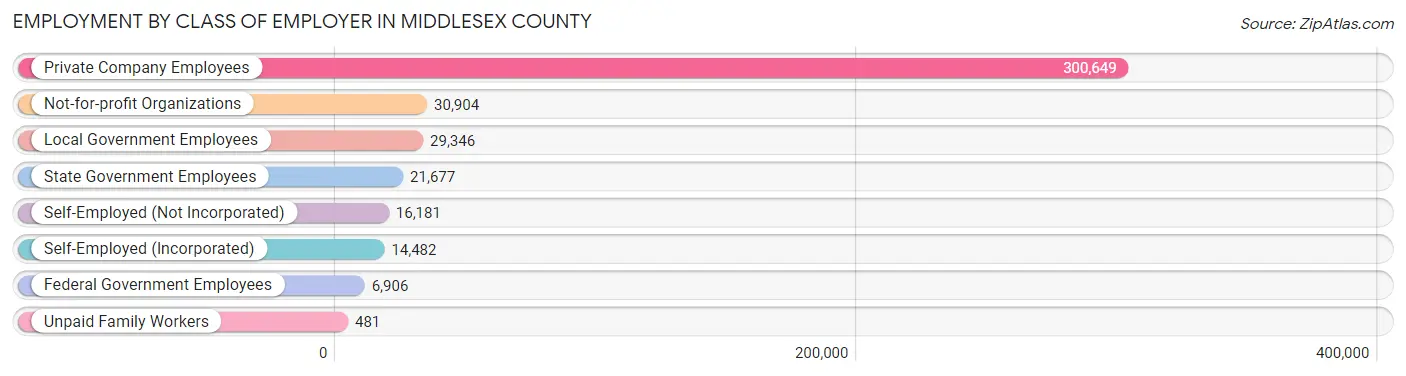
| Employer Class | # Employees | % Employees |
| Private Company Employees | 300,649 | 71.5% |
| Self-Employed (Incorporated) | 14,482 | 3.4% |
| Self-Employed (Not Incorporated) | 16,181 | 3.8% |
| Not-for-profit Organizations | 30,904 | 7.3% |
| Local Government Employees | 29,346 | 7.0% |
| State Government Employees | 21,677 | 5.1% |
| Federal Government Employees | 6,906 | 1.6% |
| Unpaid Family Workers | 481 | 0.1% |
| Total | 420,626 | 100.0% |
Employment Status by Age in Middlesex County
According to the labor force statistics for Middlesex County, out of the total population over 16 years of age (696,520), 66.4% or 462,489 individuals are in the labor force, with 6.3% or 29,137 of them unemployed. The age group with the highest labor force participation rate is 45 to 54 years, with 86.2% or 99,566 individuals in the labor force. Within the labor force, the 16 to 19 years age range has the highest percentage of unemployed individuals, with 15.5% or 2,563 of them being unemployed.
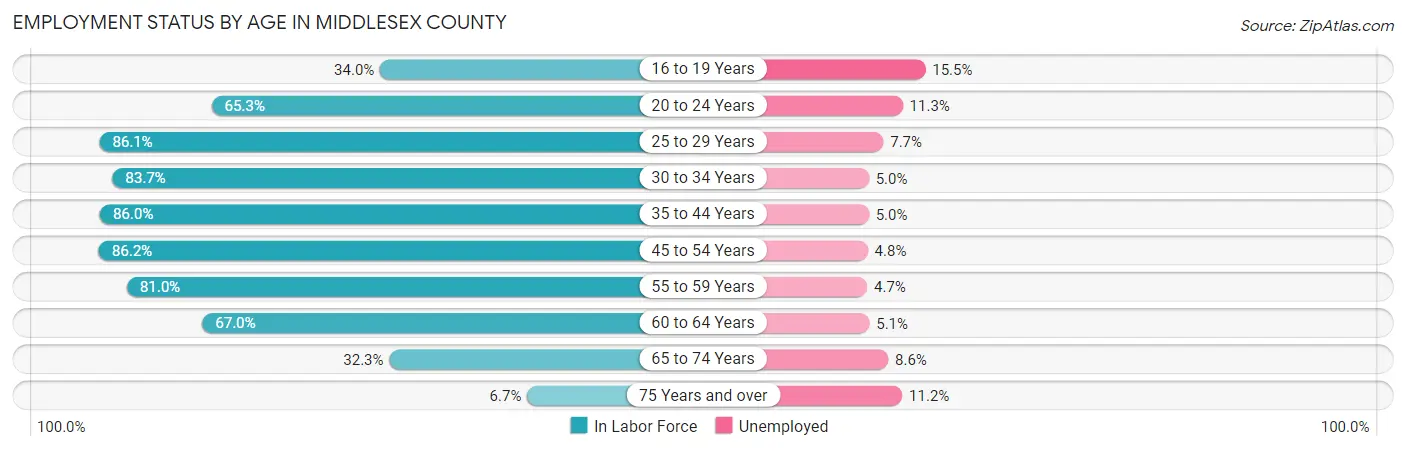
| Age Bracket | In Labor Force | Unemployed |
| 16 to 19 Years | 16,538 (34.0%) | 2,563 (15.5%) |
| 20 to 24 Years | 36,934 (65.3%) | 4,174 (11.3%) |
| 25 to 29 Years | 46,804 (86.1%) | 3,604 (7.7%) |
| 30 to 34 Years | 47,932 (83.7%) | 2,397 (5.0%) |
| 35 to 44 Years | 102,441 (86.0%) | 5,122 (5.0%) |
| 45 to 54 Years | 99,566 (86.2%) | 4,779 (4.8%) |
| 55 to 59 Years | 47,970 (81.0%) | 2,255 (4.7%) |
| 60 to 64 Years | 35,564 (67.0%) | 1,814 (5.1%) |
| 65 to 74 Years | 25,145 (32.3%) | 2,162 (8.6%) |
| 75 Years and over | 3,679 (6.7%) | 412 (11.2%) |
| Total | 462,489 (66.4%) | 29,137 (6.3%) |
Employment Status by Educational Attainment in Middlesex County
According to labor force statistics for Middlesex County, 82.9% of individuals (380,140) out of the total population between 25 and 64 years of age (458,552) are in the labor force, with 5.2% or 19,767 of them being unemployed. The group with the highest labor force participation rate are those with the educational attainment of bachelor's degree or higher, with 87.5% or 193,994 individuals in the labor force. Within the labor force, individuals with less than high school education have the highest percentage of unemployment, with 7.9% or 2,258 of them being unemployed.
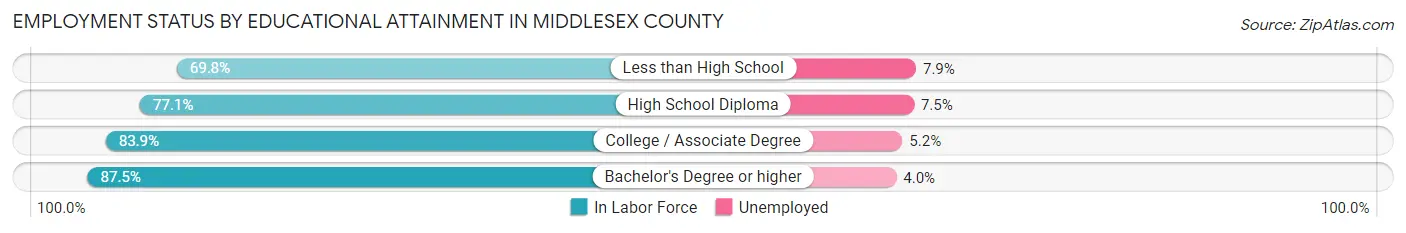
| Educational Attainment | In Labor Force | Unemployed |
| Less than High School | 28,582 (69.8%) | 3,235 (7.9%) |
| High School Diploma | 74,786 (77.1%) | 7,275 (7.5%) |
| College / Associate Degree | 82,975 (83.9%) | 5,143 (5.2%) |
| Bachelor's Degree or higher | 193,994 (87.5%) | 8,868 (4.0%) |
| Total | 380,140 (82.9%) | 23,845 (5.2%) |
Employment Occupations by Sex in Middlesex County
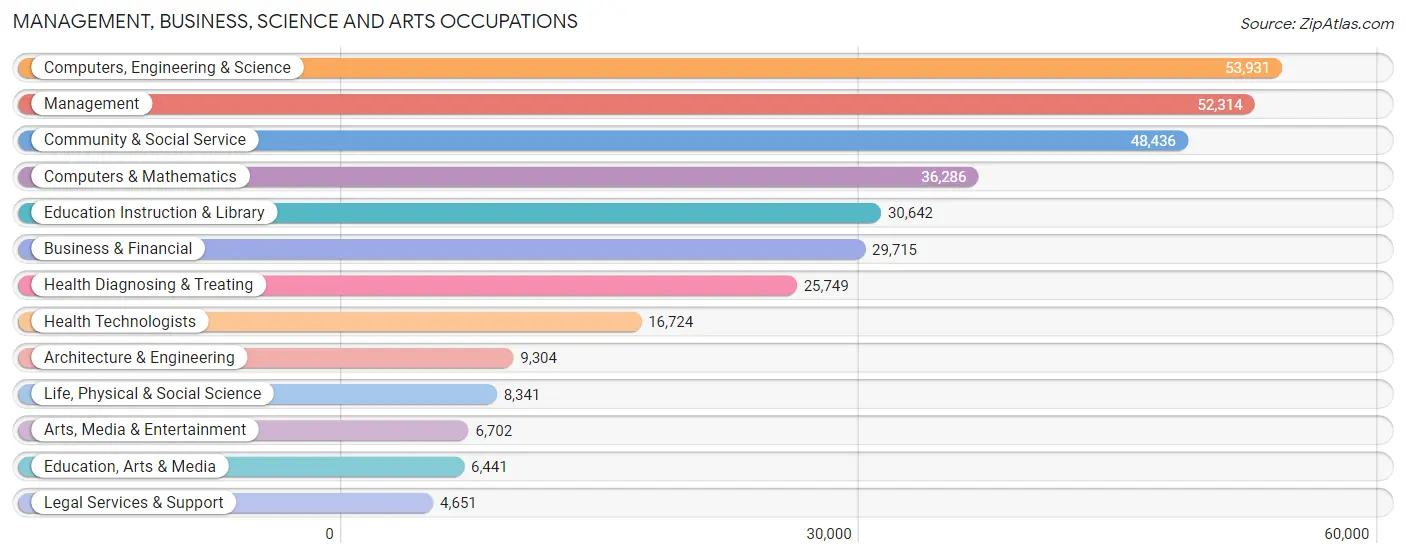
Management, Business, Science and Arts Occupations
The most common Management, Business, Science and Arts occupations in Middlesex County are Computers, Engineering & Science (53,931 | 12.4%), Management (52,314 | 12.1%), Community & Social Service (48,436 | 11.2%), Computers & Mathematics (36,286 | 8.4%), and Education Instruction & Library (30,642 | 7.1%).
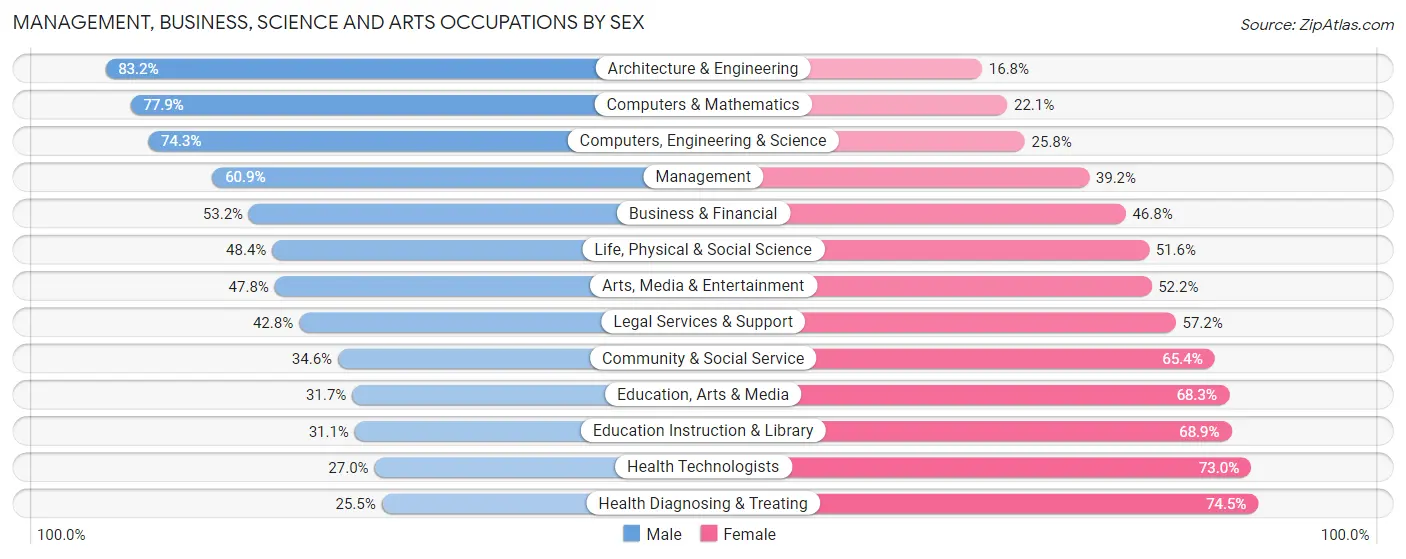
Management, Business, Science and Arts Occupations by Sex
Within the Management, Business, Science and Arts occupations in Middlesex County, the most male-oriented occupations are Architecture & Engineering (83.2%), Computers & Mathematics (77.9%), and Computers, Engineering & Science (74.3%), while the most female-oriented occupations are Health Diagnosing & Treating (74.5%), Health Technologists (73.0%), and Education Instruction & Library (68.9%).
| Occupation | Male | Female |
| Management | 31,831 (60.9%) | 20,483 (39.2%) |
| Business & Financial | 15,812 (53.2%) | 13,903 (46.8%) |
| Computers, Engineering & Science | 40,046 (74.3%) | 13,885 (25.8%) |
| Computers & Mathematics | 28,274 (77.9%) | 8,012 (22.1%) |
| Architecture & Engineering | 7,738 (83.2%) | 1,566 (16.8%) |
| Life, Physical & Social Science | 4,034 (48.4%) | 4,307 (51.6%) |
| Community & Social Service | 16,776 (34.6%) | 31,660 (65.4%) |
| Education, Arts & Media | 2,040 (31.7%) | 4,401 (68.3%) |
| Legal Services & Support | 1,989 (42.8%) | 2,662 (57.2%) |
| Education Instruction & Library | 9,541 (31.1%) | 21,101 (68.9%) |
| Arts, Media & Entertainment | 3,206 (47.8%) | 3,496 (52.2%) |
| Health Diagnosing & Treating | 6,574 (25.5%) | 19,175 (74.5%) |
| Health Technologists | 4,520 (27.0%) | 12,204 (73.0%) |
| Total (Category) | 111,039 (52.8%) | 99,106 (47.2%) |
| Total (Overall) | 235,143 (54.3%) | 197,939 (45.7%) |
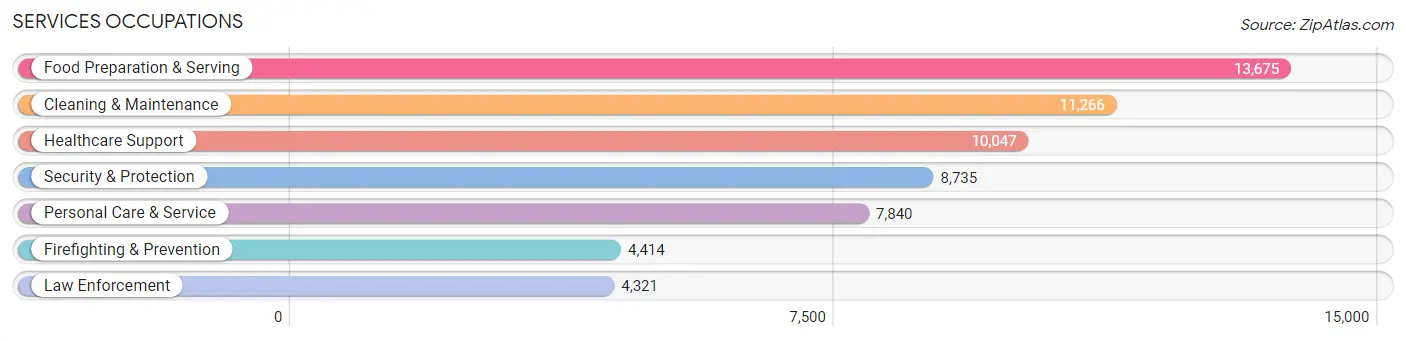
Services Occupations
The most common Services occupations in Middlesex County are Food Preparation & Serving (13,675 | 3.2%), Cleaning & Maintenance (11,266 | 2.6%), Healthcare Support (10,047 | 2.3%), Security & Protection (8,735 | 2.0%), and Personal Care & Service (7,840 | 1.8%).
Services Occupations by Sex
Within the Services occupations in Middlesex County, the most male-oriented occupations are Law Enforcement (87.8%), Security & Protection (84.9%), and Firefighting & Prevention (82.1%), while the most female-oriented occupations are Healthcare Support (81.0%), Personal Care & Service (76.2%), and Food Preparation & Serving (51.2%).

| Occupation | Male | Female |
| Healthcare Support | 1,906 (19.0%) | 8,141 (81.0%) |
| Security & Protection | 7,419 (84.9%) | 1,316 (15.1%) |
| Firefighting & Prevention | 3,624 (82.1%) | 790 (17.9%) |
| Law Enforcement | 3,795 (87.8%) | 526 (12.2%) |
| Food Preparation & Serving | 6,673 (48.8%) | 7,002 (51.2%) |
| Cleaning & Maintenance | 6,979 (62.0%) | 4,287 (38.1%) |
| Personal Care & Service | 1,867 (23.8%) | 5,973 (76.2%) |
| Total (Category) | 24,844 (48.2%) | 26,719 (51.8%) |
| Total (Overall) | 235,143 (54.3%) | 197,939 (45.7%) |
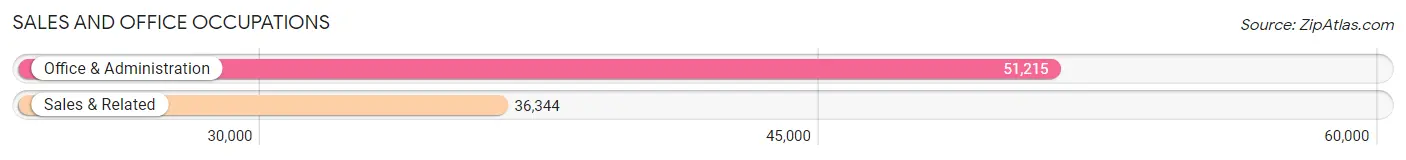
Sales and Office Occupations
The most common Sales and Office occupations in Middlesex County are Office & Administration (51,215 | 11.8%), and Sales & Related (36,344 | 8.4%).
Sales and Office Occupations by Sex
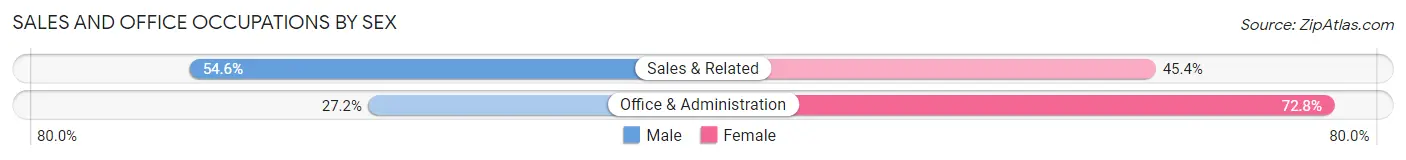
| Occupation | Male | Female |
| Sales & Related | 19,839 (54.6%) | 16,505 (45.4%) |
| Office & Administration | 13,928 (27.2%) | 37,287 (72.8%) |
| Total (Category) | 33,767 (38.6%) | 53,792 (61.4%) |
| Total (Overall) | 235,143 (54.3%) | 197,939 (45.7%) |
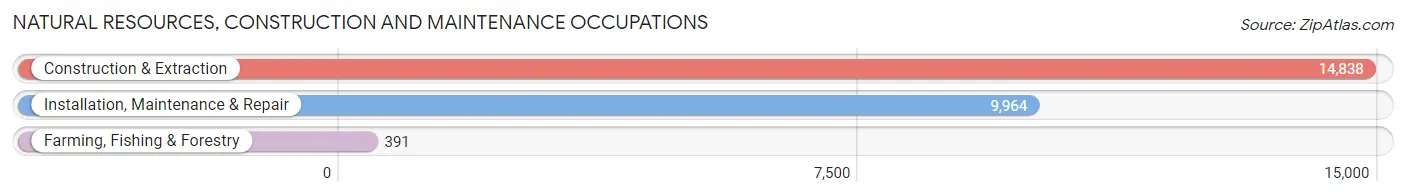
Natural Resources, Construction and Maintenance Occupations
The most common Natural Resources, Construction and Maintenance occupations in Middlesex County are Construction & Extraction (14,838 | 3.4%), Installation, Maintenance & Repair (9,964 | 2.3%), and Farming, Fishing & Forestry (391 | 0.1%).
Natural Resources, Construction and Maintenance Occupations by Sex
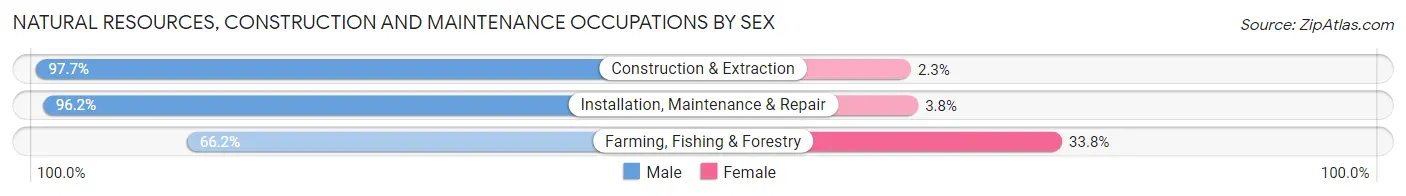
| Occupation | Male | Female |
| Farming, Fishing & Forestry | 259 (66.2%) | 132 (33.8%) |
| Construction & Extraction | 14,495 (97.7%) | 343 (2.3%) |
| Installation, Maintenance & Repair | 9,585 (96.2%) | 379 (3.8%) |
| Total (Category) | 24,339 (96.6%) | 854 (3.4%) |
| Total (Overall) | 235,143 (54.3%) | 197,939 (45.7%) |
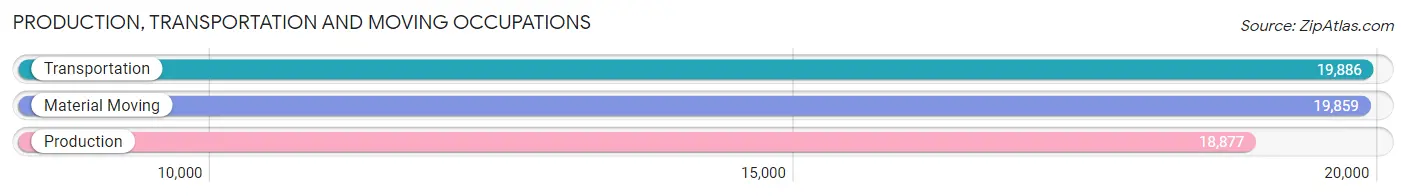
Production, Transportation and Moving Occupations
The most common Production, Transportation and Moving occupations in Middlesex County are Transportation (19,886 | 4.6%), Material Moving (19,859 | 4.6%), and Production (18,877 | 4.4%).
Production, Transportation and Moving Occupations by Sex
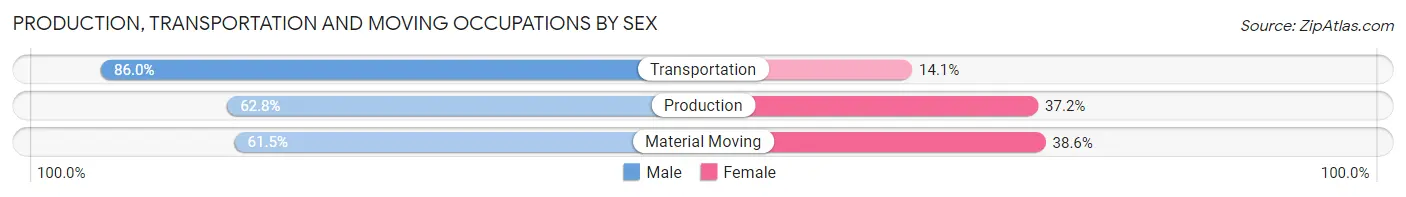
| Occupation | Male | Female |
| Production | 11,859 (62.8%) | 7,018 (37.2%) |
| Transportation | 17,092 (86.0%) | 2,794 (14.1%) |
| Material Moving | 12,203 (61.5%) | 7,656 (38.6%) |
| Total (Category) | 41,154 (70.2%) | 17,468 (29.8%) |
| Total (Overall) | 235,143 (54.3%) | 197,939 (45.7%) |
Employment Industries by Sex in Middlesex County
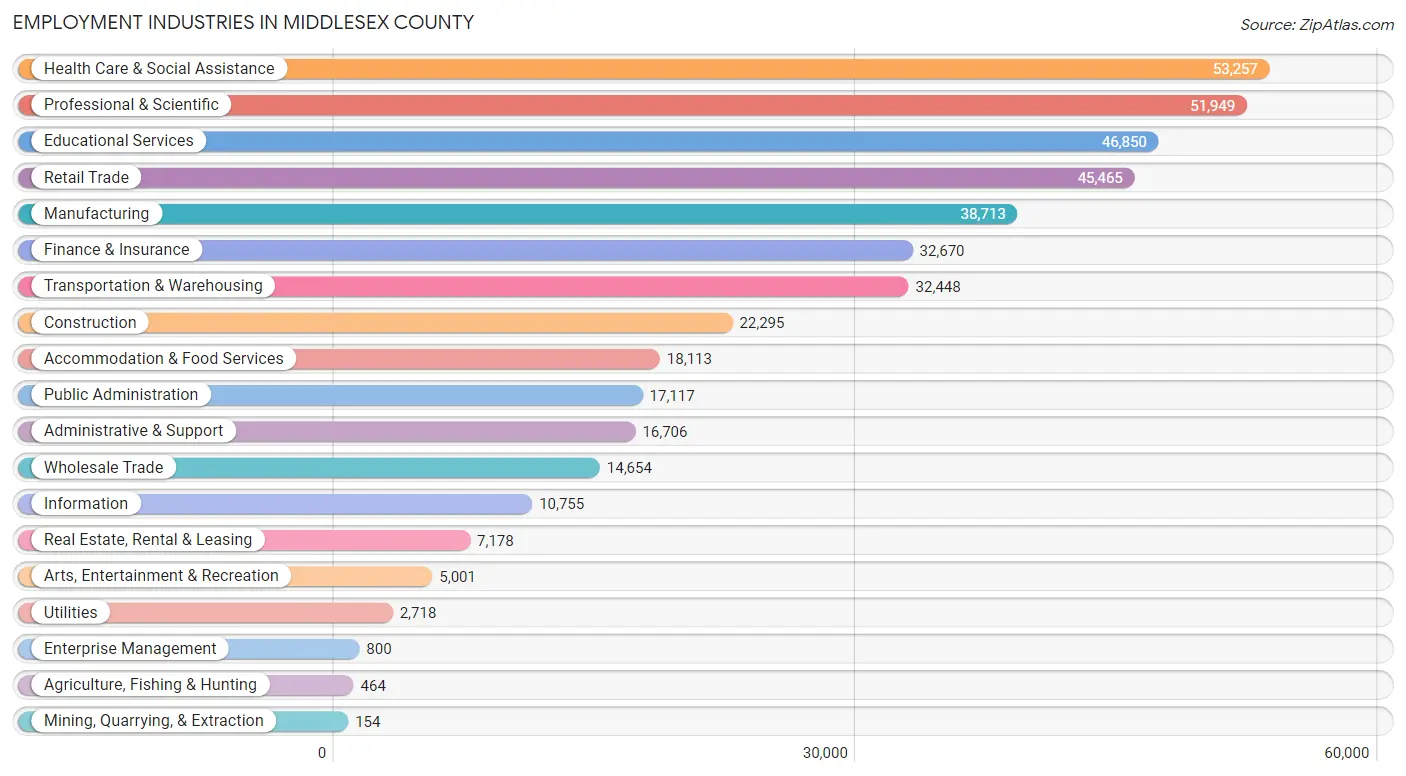
Employment Industries in Middlesex County
The major employment industries in Middlesex County include Health Care & Social Assistance (53,257 | 12.3%), Professional & Scientific (51,949 | 12.0%), Educational Services (46,850 | 10.8%), Retail Trade (45,465 | 10.5%), and Manufacturing (38,713 | 8.9%).
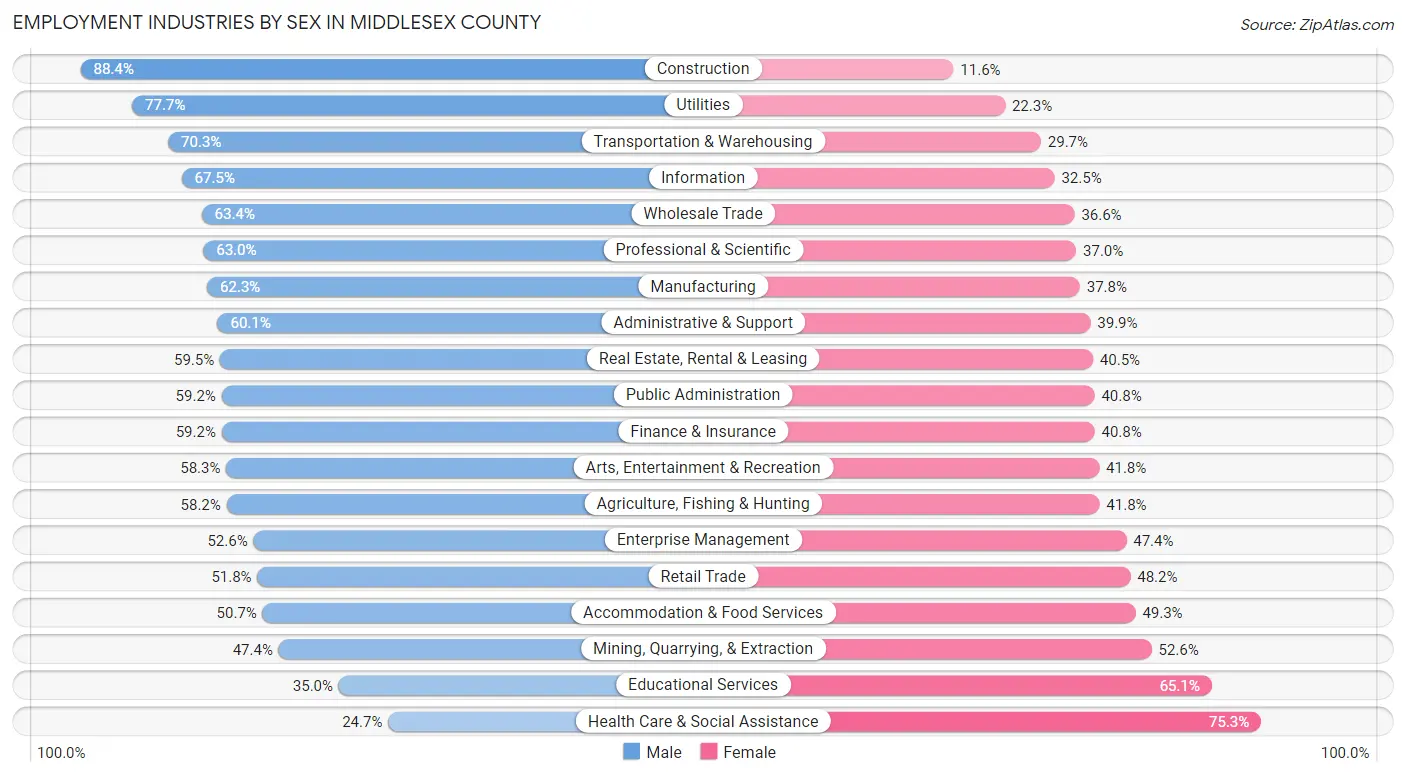
Employment Industries by Sex in Middlesex County
The Middlesex County industries that see more men than women are Construction (88.4%), Utilities (77.7%), and Transportation & Warehousing (70.3%), whereas the industries that tend to have a higher number of women are Health Care & Social Assistance (75.3%), Educational Services (65.0%), and Mining, Quarrying, & Extraction (52.6%).
| Industry | Male | Female |
| Agriculture, Fishing & Hunting | 270 (58.2%) | 194 (41.8%) |
| Mining, Quarrying, & Extraction | 73 (47.4%) | 81 (52.6%) |
| Construction | 19,711 (88.4%) | 2,584 (11.6%) |
| Manufacturing | 24,097 (62.3%) | 14,616 (37.8%) |
| Wholesale Trade | 9,285 (63.4%) | 5,369 (36.6%) |
| Retail Trade | 23,552 (51.8%) | 21,913 (48.2%) |
| Transportation & Warehousing | 22,813 (70.3%) | 9,635 (29.7%) |
| Utilities | 2,113 (77.7%) | 605 (22.3%) |
| Information | 7,259 (67.5%) | 3,496 (32.5%) |
| Finance & Insurance | 19,342 (59.2%) | 13,328 (40.8%) |
| Real Estate, Rental & Leasing | 4,274 (59.5%) | 2,904 (40.5%) |
| Professional & Scientific | 32,733 (63.0%) | 19,216 (37.0%) |
| Enterprise Management | 421 (52.6%) | 379 (47.4%) |
| Administrative & Support | 10,033 (60.1%) | 6,673 (39.9%) |
| Educational Services | 16,374 (34.9%) | 30,476 (65.0%) |
| Health Care & Social Assistance | 13,171 (24.7%) | 40,086 (75.3%) |
| Arts, Entertainment & Recreation | 2,913 (58.3%) | 2,088 (41.7%) |
| Accommodation & Food Services | 9,189 (50.7%) | 8,924 (49.3%) |
| Public Administration | 10,135 (59.2%) | 6,982 (40.8%) |
| Total | 235,143 (54.3%) | 197,939 (45.7%) |
Education in Middlesex County
School Enrollment in Middlesex County
The most common levels of schooling among the 226,236 students in Middlesex County are college / undergraduate (59,417 | 26.3%), high school (43,060 | 19.0%), and middle school (42,528 | 18.8%).

| School Level | # Students | % Students |
| Nursery / Preschool | 14,237 | 6.3% |
| Kindergarten | 10,566 | 4.7% |
| Elementary School | 40,781 | 18.0% |
| Middle School | 42,528 | 18.8% |
| High School | 43,060 | 19.0% |
| College / Undergraduate | 59,417 | 26.3% |
| Graduate / Professional | 15,647 | 6.9% |
| Total | 226,236 | 100.0% |
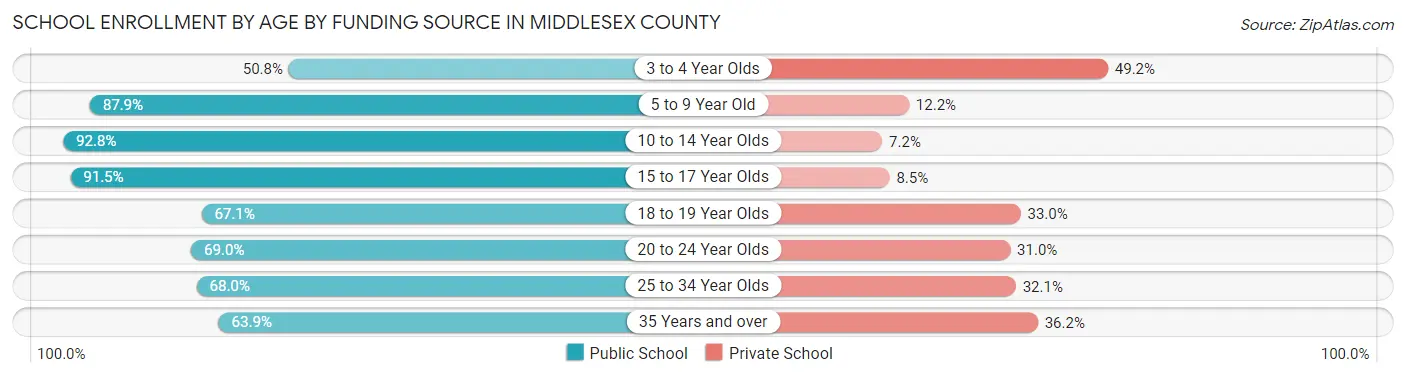
School Enrollment by Age by Funding Source in Middlesex County
Out of a total of 226,236 students who are enrolled in schools in Middlesex County, 44,342 (19.6%) attend a private institution, while the remaining 181,894 (80.4%) are enrolled in public schools. The age group of 3 to 4 year olds has the highest likelihood of being enrolled in private schools, with 5,838 (49.2% in the age bracket) enrolled. Conversely, the age group of 10 to 14 year olds has the lowest likelihood of being enrolled in a private school, with 49,125 (92.8% in the age bracket) attending a public institution.
| Age Bracket | Public School | Private School |
| 3 to 4 Year Olds | 6,025 (50.8%) | 5,838 (49.2%) |
| 5 to 9 Year Old | 43,181 (87.8%) | 5,970 (12.1%) |
| 10 to 14 Year Olds | 49,125 (92.8%) | 3,794 (7.2%) |
| 15 to 17 Year Olds | 29,740 (91.5%) | 2,773 (8.5%) |
| 18 to 19 Year Olds | 15,723 (67.0%) | 7,725 (33.0%) |
| 20 to 24 Year Olds | 22,622 (69.0%) | 10,168 (31.0%) |
| 25 to 34 Year Olds | 9,087 (67.9%) | 4,287 (32.1%) |
| 35 Years and over | 6,499 (63.8%) | 3,679 (36.1%) |
| Total | 181,894 (80.4%) | 44,342 (19.6%) |
Educational Attainment by Field of Study in Middlesex County
Business (54,246 | 18.9%), engineering (37,405 | 13.1%), computers & mathematics (30,692 | 10.7%), science & technology (26,499 | 9.2%), and education (22,213 | 7.8%) are the most common fields of study among 286,430 individuals in Middlesex County who have obtained a bachelor's degree or higher.
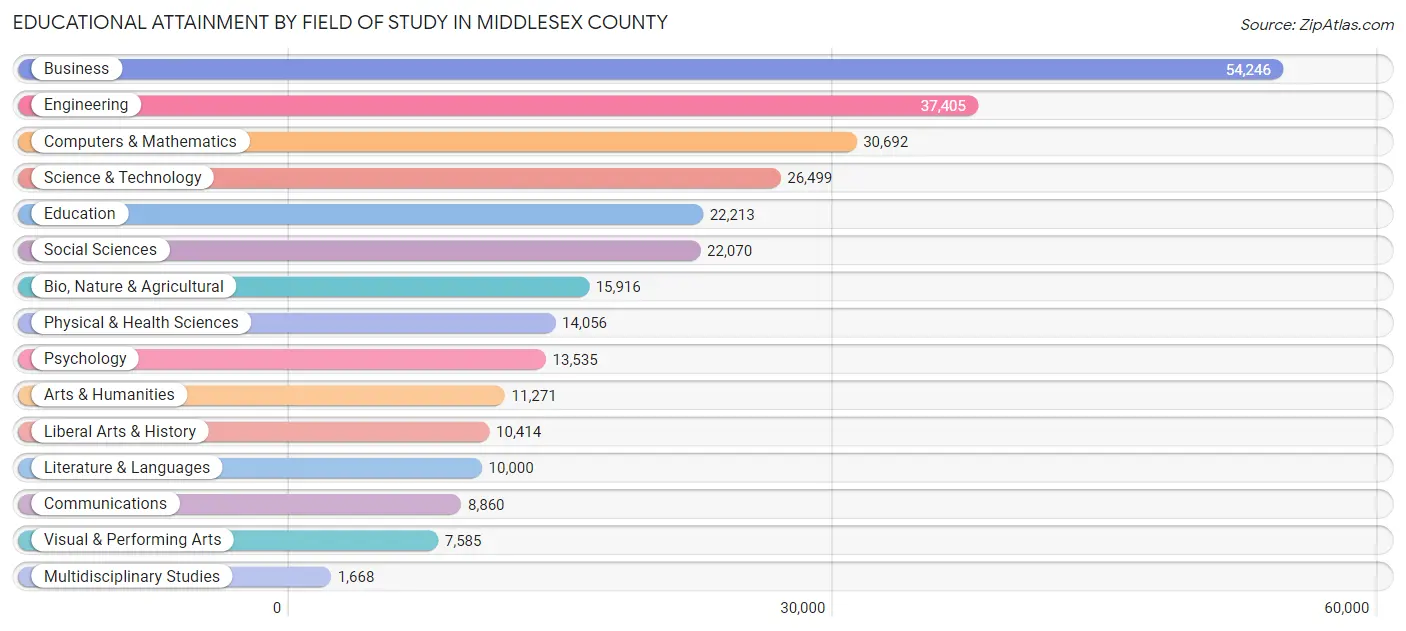
| Field of Study | # Graduates | % Graduates |
| Computers & Mathematics | 30,692 | 10.7% |
| Bio, Nature & Agricultural | 15,916 | 5.6% |
| Physical & Health Sciences | 14,056 | 4.9% |
| Psychology | 13,535 | 4.7% |
| Social Sciences | 22,070 | 7.7% |
| Engineering | 37,405 | 13.1% |
| Multidisciplinary Studies | 1,668 | 0.6% |
| Science & Technology | 26,499 | 9.2% |
| Business | 54,246 | 18.9% |
| Education | 22,213 | 7.8% |
| Literature & Languages | 10,000 | 3.5% |
| Liberal Arts & History | 10,414 | 3.6% |
| Visual & Performing Arts | 7,585 | 2.6% |
| Communications | 8,860 | 3.1% |
| Arts & Humanities | 11,271 | 3.9% |
| Total | 286,430 | 100.0% |
Transportation & Commute in Middlesex County
Vehicle Availability by Sex in Middlesex County
The most prevalent vehicle ownership categories in Middlesex County are males with 2 vehicles (96,672, accounting for 42.7%) and females with 2 vehicles (76,130, making up 51.3%).
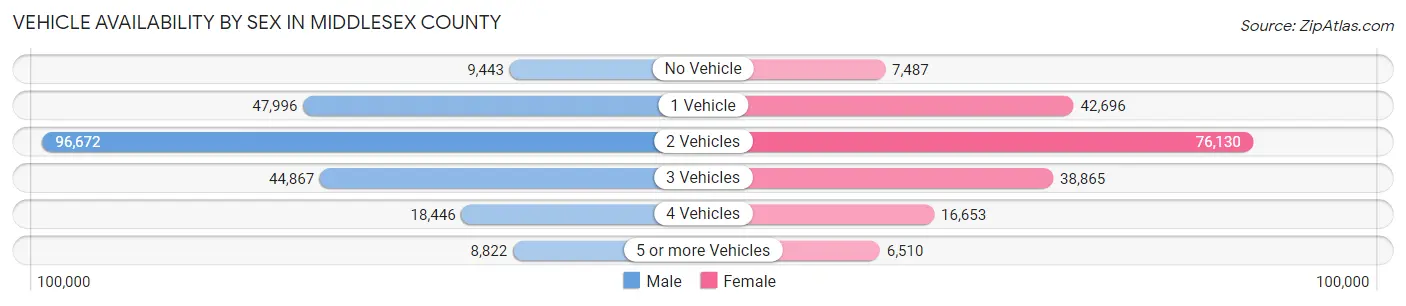
| Vehicles Available | Male | Female |
| No Vehicle | 9,443 (4.2%) | 7,487 (4.0%) |
| 1 Vehicle | 47,996 (21.2%) | 42,696 (22.7%) |
| 2 Vehicles | 96,672 (42.7%) | 76,130 (40.4%) |
| 3 Vehicles | 44,867 (19.8%) | 38,865 (20.6%) |
| 4 Vehicles | 18,446 (8.2%) | 16,653 (8.8%) |
| 5 or more Vehicles | 8,822 (3.9%) | 6,510 (3.5%) |
| Total | 226,246 (100.0%) | 188,341 (100.0%) |
Commute Time in Middlesex County
The most frequently occuring commute durations in Middlesex County are 30 to 34 minutes (50,512 commuters, 14.0%), 15 to 19 minutes (46,533 commuters, 12.9%), and 20 to 24 minutes (42,058 commuters, 11.6%).

| Commute Time | # Commuters | % Commuters |
| Less than 5 Minutes | 6,179 | 1.7% |
| 5 to 9 Minutes | 28,364 | 7.8% |
| 10 to 14 Minutes | 41,166 | 11.4% |
| 15 to 19 Minutes | 46,533 | 12.9% |
| 20 to 24 Minutes | 42,058 | 11.6% |
| 25 to 29 Minutes | 21,742 | 6.0% |
| 30 to 34 Minutes | 50,512 | 14.0% |
| 35 to 39 Minutes | 11,877 | 3.3% |
| 40 to 44 Minutes | 16,448 | 4.5% |
| 45 to 59 Minutes | 36,480 | 10.1% |
| 60 to 89 Minutes | 36,608 | 10.1% |
| 90 or more Minutes | 24,002 | 6.6% |
Commute Time by Sex in Middlesex County
The most common commute times in Middlesex County are 30 to 34 minutes (26,982 commuters, 13.6%) for males and 15 to 19 minutes (24,173 commuters, 14.8%) for females.
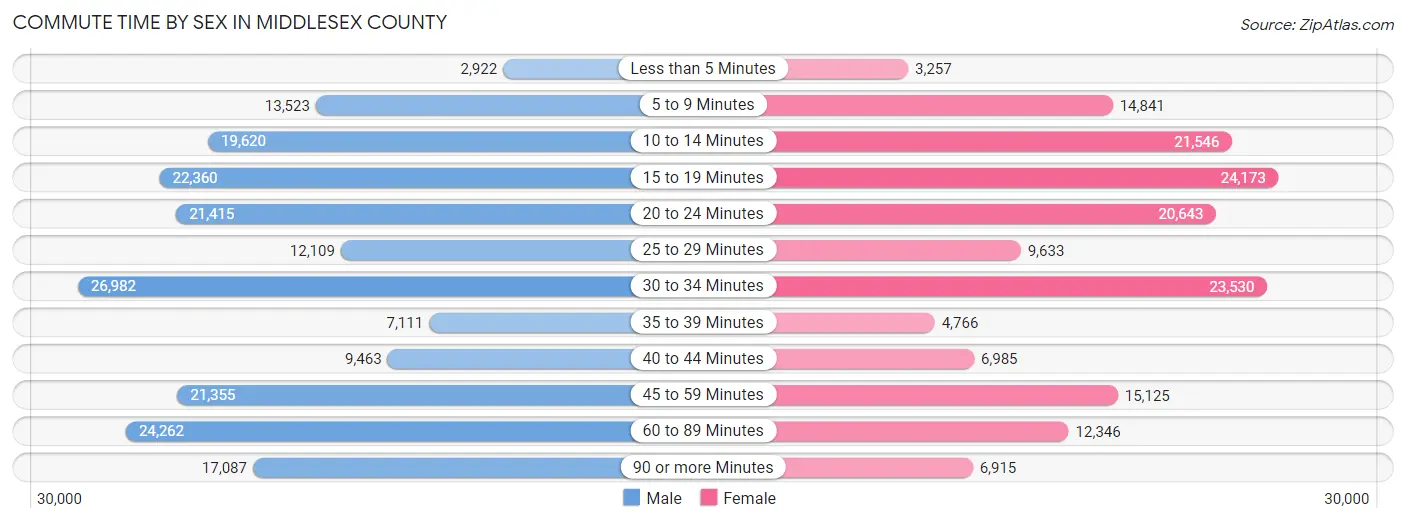
| Commute Time | Male | Female |
| Less than 5 Minutes | 2,922 (1.5%) | 3,257 (2.0%) |
| 5 to 9 Minutes | 13,523 (6.8%) | 14,841 (9.1%) |
| 10 to 14 Minutes | 19,620 (9.9%) | 21,546 (13.2%) |
| 15 to 19 Minutes | 22,360 (11.3%) | 24,173 (14.8%) |
| 20 to 24 Minutes | 21,415 (10.8%) | 20,643 (12.6%) |
| 25 to 29 Minutes | 12,109 (6.1%) | 9,633 (5.9%) |
| 30 to 34 Minutes | 26,982 (13.6%) | 23,530 (14.4%) |
| 35 to 39 Minutes | 7,111 (3.6%) | 4,766 (2.9%) |
| 40 to 44 Minutes | 9,463 (4.8%) | 6,985 (4.3%) |
| 45 to 59 Minutes | 21,355 (10.8%) | 15,125 (9.2%) |
| 60 to 89 Minutes | 24,262 (12.2%) | 12,346 (7.5%) |
| 90 or more Minutes | 17,087 (8.6%) | 6,915 (4.2%) |
Time of Departure to Work by Sex in Middlesex County
The most frequent times of departure to work in Middlesex County are 7:00 AM to 7:29 AM (27,064, 13.7%) for males and 8:00 AM to 8:29 AM (23,844, 14.6%) for females.
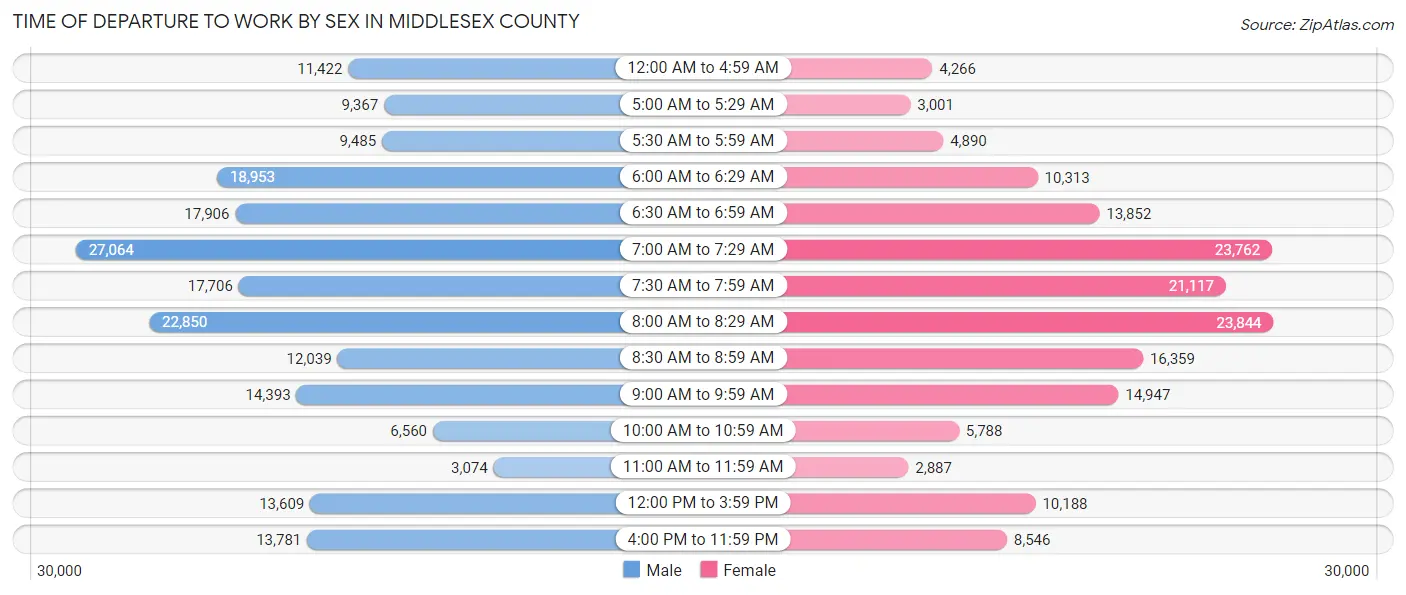
| Time of Departure | Male | Female |
| 12:00 AM to 4:59 AM | 11,422 (5.8%) | 4,266 (2.6%) |
| 5:00 AM to 5:29 AM | 9,367 (4.7%) | 3,001 (1.8%) |
| 5:30 AM to 5:59 AM | 9,485 (4.8%) | 4,890 (3.0%) |
| 6:00 AM to 6:29 AM | 18,953 (9.6%) | 10,313 (6.3%) |
| 6:30 AM to 6:59 AM | 17,906 (9.0%) | 13,852 (8.5%) |
| 7:00 AM to 7:29 AM | 27,064 (13.7%) | 23,762 (14.5%) |
| 7:30 AM to 7:59 AM | 17,706 (8.9%) | 21,117 (12.9%) |
| 8:00 AM to 8:29 AM | 22,850 (11.5%) | 23,844 (14.6%) |
| 8:30 AM to 8:59 AM | 12,039 (6.1%) | 16,359 (10.0%) |
| 9:00 AM to 9:59 AM | 14,393 (7.3%) | 14,947 (9.1%) |
| 10:00 AM to 10:59 AM | 6,560 (3.3%) | 5,788 (3.5%) |
| 11:00 AM to 11:59 AM | 3,074 (1.5%) | 2,887 (1.8%) |
| 12:00 PM to 3:59 PM | 13,609 (6.9%) | 10,188 (6.2%) |
| 4:00 PM to 11:59 PM | 13,781 (7.0%) | 8,546 (5.2%) |
| Total | 198,209 (100.0%) | 163,760 (100.0%) |
Housing Occupancy in Middlesex County
Occupancy by Ownership in Middlesex County
Of the total 301,967 dwellings in Middlesex County, owner-occupied units account for 192,805 (63.8%), while renter-occupied units make up 109,162 (36.1%).
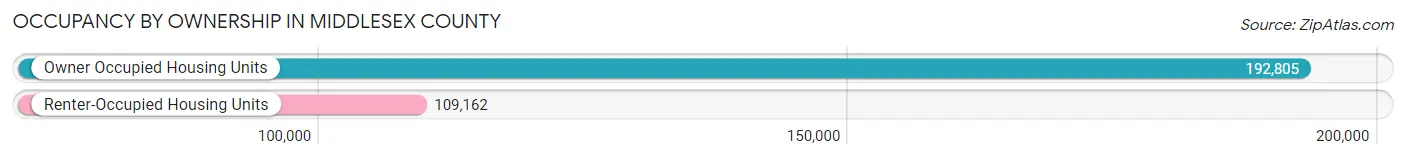
| Occupancy | # Housing Units | % Housing Units |
| Owner Occupied Housing Units | 192,805 | 63.8% |
| Renter-Occupied Housing Units | 109,162 | 36.1% |
| Total Occupied Housing Units | 301,967 | 100.0% |
Occupancy by Household Size in Middlesex County
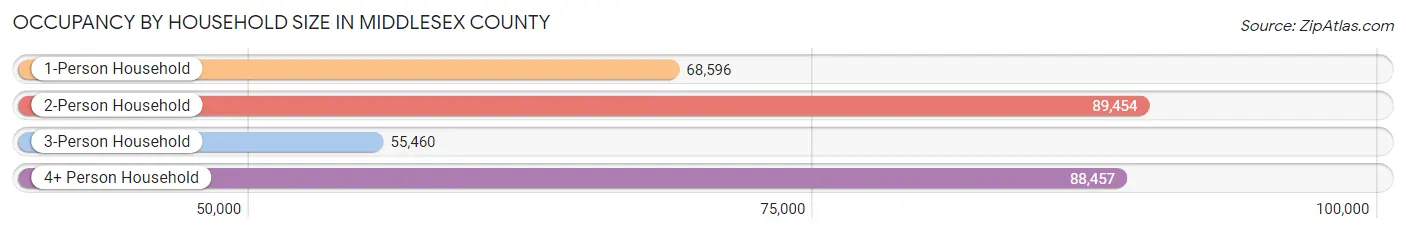
| Household Size | # Housing Units | % Housing Units |
| 1-Person Household | 68,596 | 22.7% |
| 2-Person Household | 89,454 | 29.6% |
| 3-Person Household | 55,460 | 18.4% |
| 4+ Person Household | 88,457 | 29.3% |
| Total Housing Units | 301,967 | 100.0% |
Occupancy by Ownership by Household Size in Middlesex County
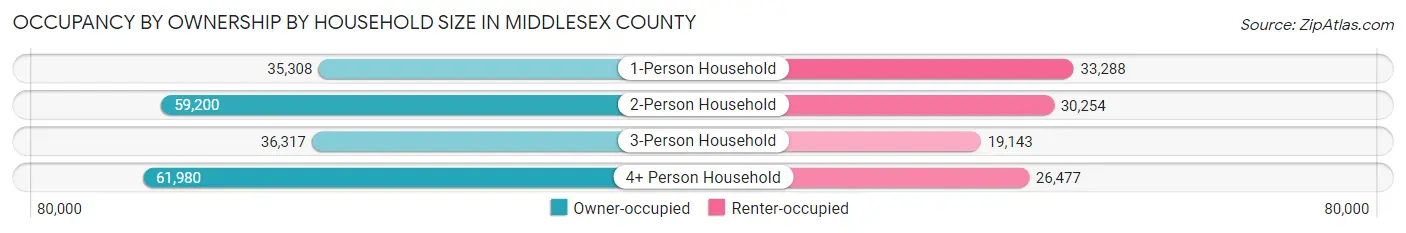
| Household Size | Owner-occupied | Renter-occupied |
| 1-Person Household | 35,308 (51.5%) | 33,288 (48.5%) |
| 2-Person Household | 59,200 (66.2%) | 30,254 (33.8%) |
| 3-Person Household | 36,317 (65.5%) | 19,143 (34.5%) |
| 4+ Person Household | 61,980 (70.1%) | 26,477 (29.9%) |
| Total Housing Units | 192,805 (63.8%) | 109,162 (36.1%) |
Occupancy by Educational Attainment in Middlesex County
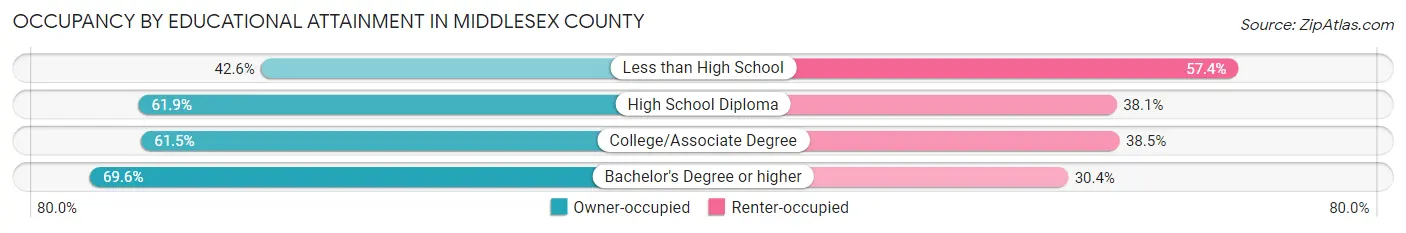
| Household Size | Owner-occupied | Renter-occupied |
| Less than High School | 10,960 (42.6%) | 14,788 (57.4%) |
| High School Diploma | 40,117 (61.9%) | 24,665 (38.1%) |
| College/Associate Degree | 41,373 (61.5%) | 25,911 (38.5%) |
| Bachelor's Degree or higher | 100,355 (69.6%) | 43,798 (30.4%) |
Occupancy by Age of Householder in Middlesex County
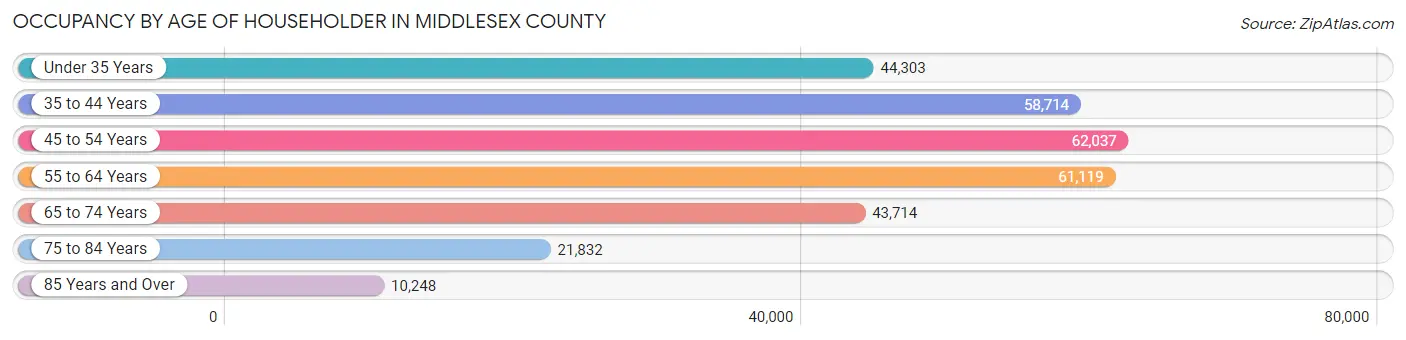
| Age Bracket | # Households | % Households |
| Under 35 Years | 44,303 | 14.7% |
| 35 to 44 Years | 58,714 | 19.4% |
| 45 to 54 Years | 62,037 | 20.5% |
| 55 to 64 Years | 61,119 | 20.2% |
| 65 to 74 Years | 43,714 | 14.5% |
| 75 to 84 Years | 21,832 | 7.2% |
| 85 Years and Over | 10,248 | 3.4% |
| Total | 301,967 | 100.0% |
Housing Finances in Middlesex County
Median Income by Occupancy in Middlesex County
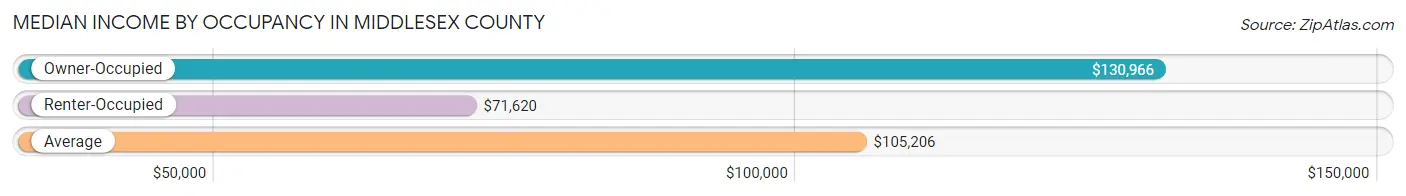
| Occupancy Type | # Households | Median Income |
| Owner-Occupied | 192,805 (63.8%) | $130,966 |
| Renter-Occupied | 109,162 (36.1%) | $71,620 |
| Average | 301,967 (100.0%) | $105,206 |
Occupancy by Householder Income Bracket in Middlesex County

| Income Bracket | Owner-occupied | Renter-occupied |
| Less than $5,000 | 2,193 (1.1%) | 4,152 (3.8%) |
| $5,000 to $9,999 | 1,205 (0.6%) | 2,323 (2.1%) |
| $10,000 to $14,999 | 2,216 (1.1%) | 5,292 (4.9%) |
| $15,000 to $19,999 | 2,433 (1.3%) | 4,053 (3.7%) |
| $20,000 to $24,999 | 3,588 (1.9%) | 4,042 (3.7%) |
| $25,000 to $34,999 | 6,359 (3.3%) | 7,288 (6.7%) |
| $35,000 to $49,999 | 11,798 (6.1%) | 11,708 (10.7%) |
| $50,000 to $74,999 | 20,435 (10.6%) | 18,322 (16.8%) |
| $75,000 to $99,999 | 21,060 (10.9%) | 15,541 (14.2%) |
| $100,000 to $149,999 | 40,314 (20.9%) | 20,360 (18.6%) |
| $150,000 or more | 81,204 (42.1%) | 16,081 (14.7%) |
| Total | 192,805 (100.0%) | 109,162 (100.0%) |
Monthly Housing Cost Tiers in Middlesex County
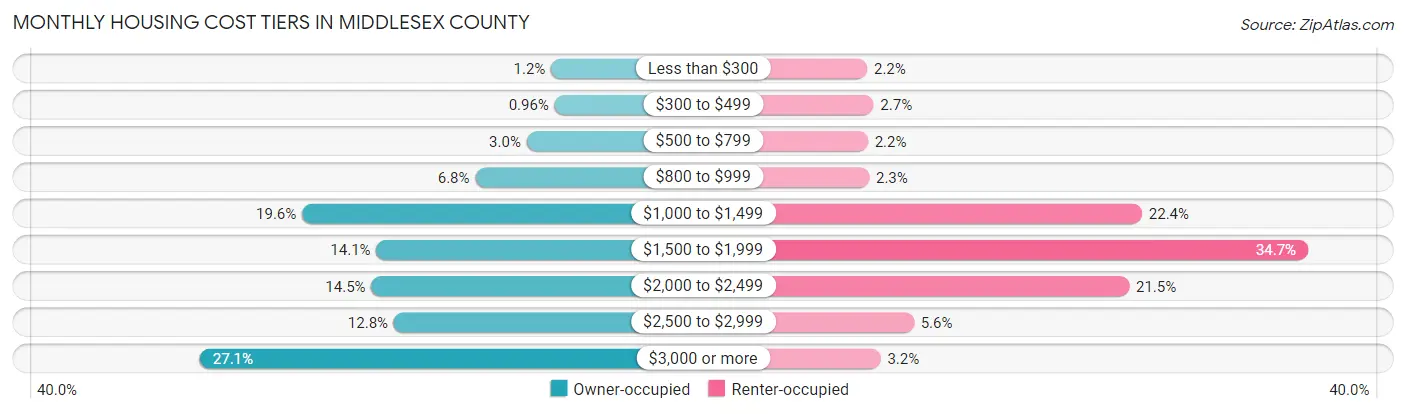
| Monthly Cost | Owner-occupied | Renter-occupied |
| Less than $300 | 2,350 (1.2%) | 2,382 (2.2%) |
| $300 to $499 | 1,842 (1.0%) | 2,893 (2.6%) |
| $500 to $799 | 5,816 (3.0%) | 2,439 (2.2%) |
| $800 to $999 | 13,118 (6.8%) | 2,543 (2.3%) |
| $1,000 to $1,499 | 37,709 (19.6%) | 24,469 (22.4%) |
| $1,500 to $1,999 | 27,166 (14.1%) | 37,821 (34.6%) |
| $2,000 to $2,499 | 27,881 (14.5%) | 23,451 (21.5%) |
| $2,500 to $2,999 | 24,685 (12.8%) | 6,133 (5.6%) |
| $3,000 or more | 52,238 (27.1%) | 3,455 (3.2%) |
| Total | 192,805 (100.0%) | 109,162 (100.0%) |
Physical Housing Characteristics in Middlesex County
Housing Structures in Middlesex County
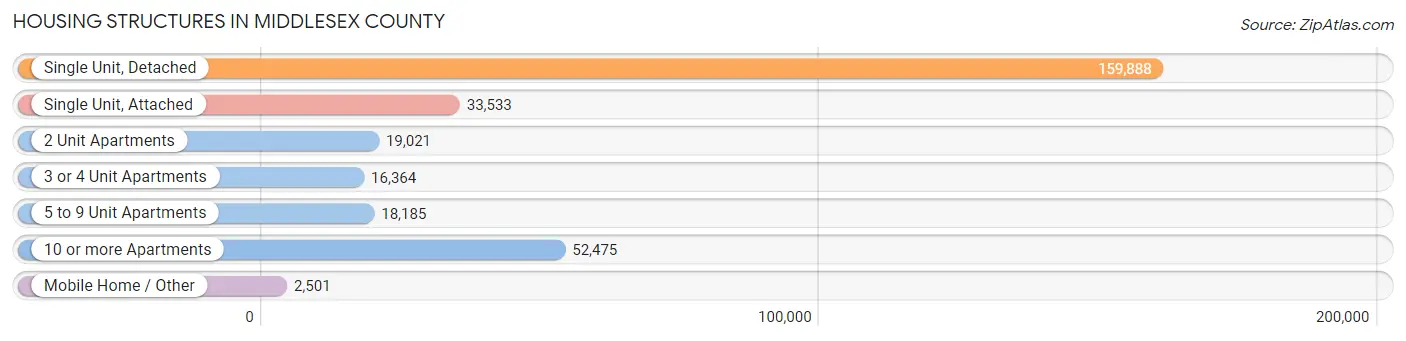
| Structure Type | # Housing Units | % Housing Units |
| Single Unit, Detached | 159,888 | 52.9% |
| Single Unit, Attached | 33,533 | 11.1% |
| 2 Unit Apartments | 19,021 | 6.3% |
| 3 or 4 Unit Apartments | 16,364 | 5.4% |
| 5 to 9 Unit Apartments | 18,185 | 6.0% |
| 10 or more Apartments | 52,475 | 17.4% |
| Mobile Home / Other | 2,501 | 0.8% |
| Total | 301,967 | 100.0% |
Housing Structures by Occupancy in Middlesex County
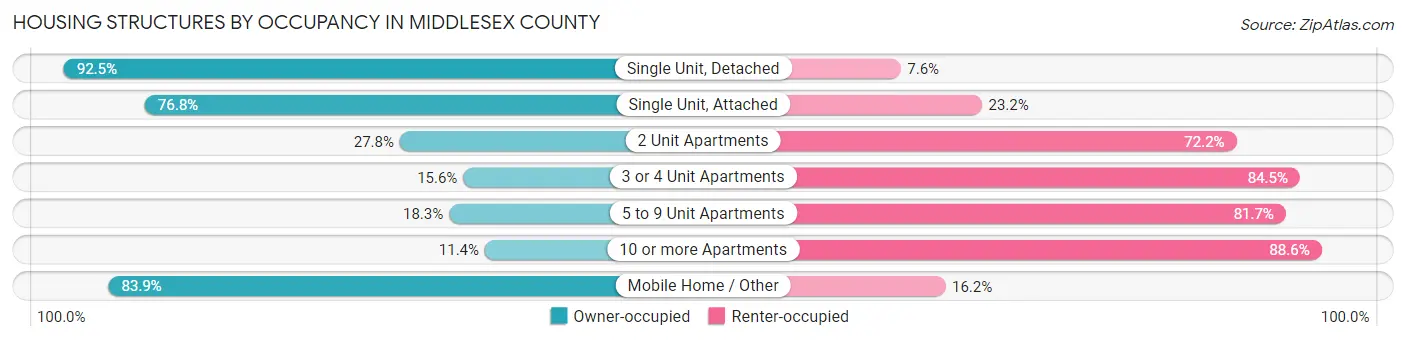
| Structure Type | Owner-occupied | Renter-occupied |
| Single Unit, Detached | 147,824 (92.4%) | 12,064 (7.5%) |
| Single Unit, Attached | 25,763 (76.8%) | 7,770 (23.2%) |
| 2 Unit Apartments | 5,280 (27.8%) | 13,741 (72.2%) |
| 3 or 4 Unit Apartments | 2,544 (15.5%) | 13,820 (84.5%) |
| 5 to 9 Unit Apartments | 3,323 (18.3%) | 14,862 (81.7%) |
| 10 or more Apartments | 5,974 (11.4%) | 46,501 (88.6%) |
| Mobile Home / Other | 2,097 (83.9%) | 404 (16.2%) |
| Total | 192,805 (63.8%) | 109,162 (36.1%) |
Housing Structures by Number of Rooms in Middlesex County
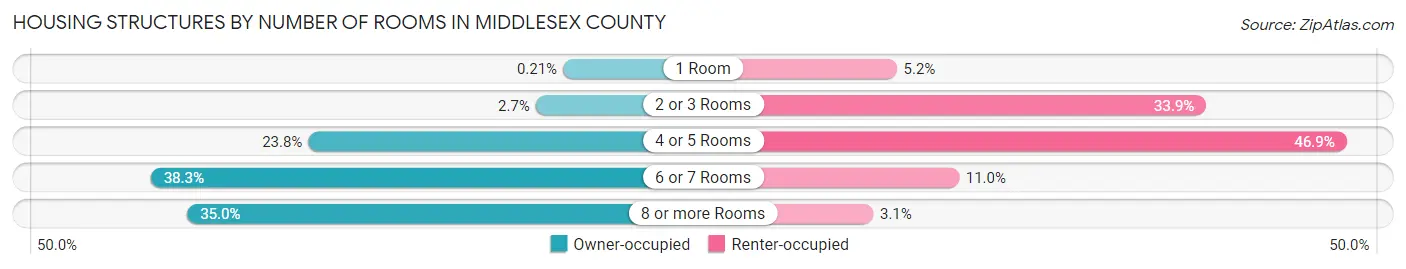
| Number of Rooms | Owner-occupied | Renter-occupied |
| 1 Room | 407 (0.2%) | 5,720 (5.2%) |
| 2 or 3 Rooms | 5,259 (2.7%) | 36,973 (33.9%) |
| 4 or 5 Rooms | 45,836 (23.8%) | 51,140 (46.9%) |
| 6 or 7 Rooms | 73,906 (38.3%) | 11,992 (11.0%) |
| 8 or more Rooms | 67,397 (35.0%) | 3,337 (3.1%) |
| Total | 192,805 (100.0%) | 109,162 (100.0%) |
Housing Structure by Heating Type in Middlesex County
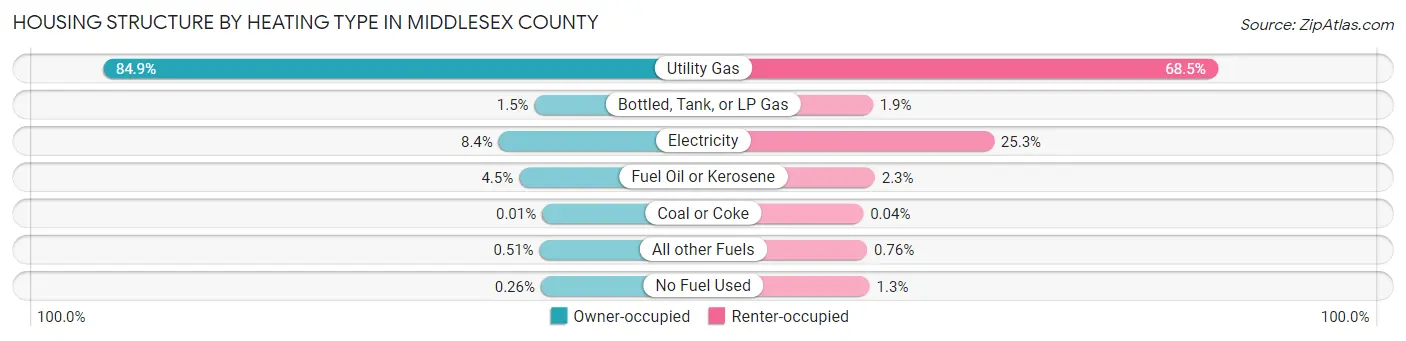
| Heating Type | Owner-occupied | Renter-occupied |
| Utility Gas | 163,662 (84.9%) | 74,757 (68.5%) |
| Bottled, Tank, or LP Gas | 2,873 (1.5%) | 2,045 (1.9%) |
| Electricity | 16,205 (8.4%) | 27,608 (25.3%) |
| Fuel Oil or Kerosene | 8,579 (4.4%) | 2,482 (2.3%) |
| Coal or Coke | 14 (0.0%) | 43 (0.0%) |
| All other Fuels | 980 (0.5%) | 835 (0.8%) |
| No Fuel Used | 492 (0.3%) | 1,392 (1.3%) |
| Total | 192,805 (100.0%) | 109,162 (100.0%) |
Household Vehicle Usage in Middlesex County
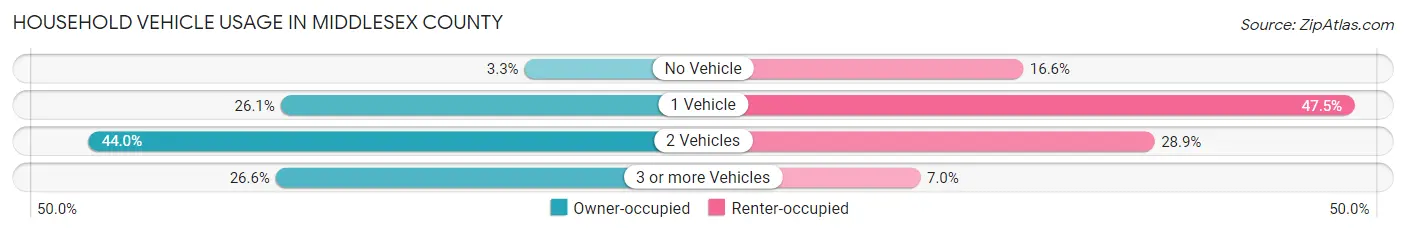
| Vehicles per Household | Owner-occupied | Renter-occupied |
| No Vehicle | 6,438 (3.3%) | 18,128 (16.6%) |
| 1 Vehicle | 50,329 (26.1%) | 51,864 (47.5%) |
| 2 Vehicles | 84,827 (44.0%) | 31,519 (28.9%) |
| 3 or more Vehicles | 51,211 (26.6%) | 7,651 (7.0%) |
| Total | 192,805 (100.0%) | 109,162 (100.0%) |
Real Estate & Mortgages in Middlesex County
Real Estate and Mortgage Overview in Middlesex County
| Characteristic | Without Mortgage | With Mortgage |
| Housing Units | 68,722 | 124,083 |
| Median Property Value | $390,800 | $423,500 |
| Median Household Income | $97,708 | $60,249 |
| Monthly Housing Costs | $1,174 | $51,311 |
| Real Estate Taxes | $9,238 | $1,942 |
Property Value by Mortgage Status in Middlesex County
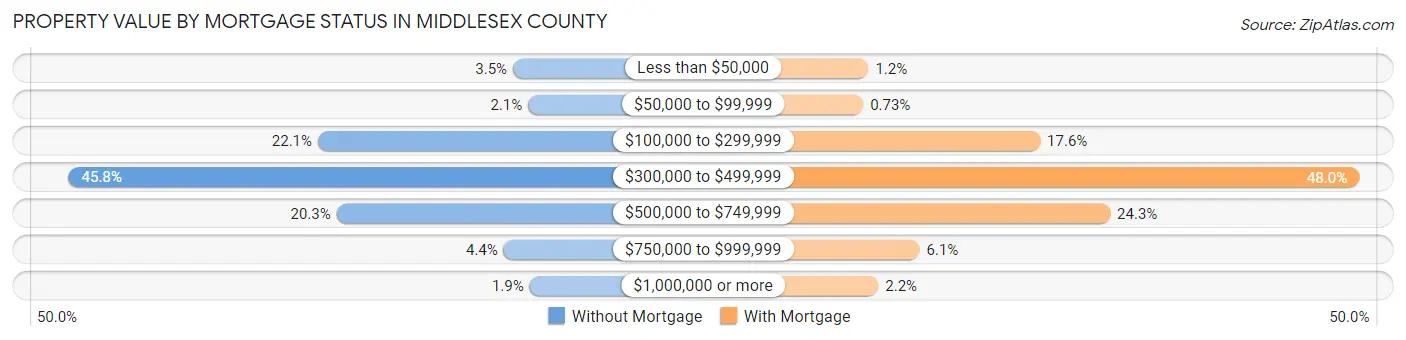
| Property Value | Without Mortgage | With Mortgage |
| Less than $50,000 | 2,401 (3.5%) | 1,524 (1.2%) |
| $50,000 to $99,999 | 1,408 (2.1%) | 906 (0.7%) |
| $100,000 to $299,999 | 15,167 (22.1%) | 21,808 (17.6%) |
| $300,000 to $499,999 | 31,480 (45.8%) | 59,497 (47.9%) |
| $500,000 to $749,999 | 13,943 (20.3%) | 30,091 (24.2%) |
| $750,000 to $999,999 | 3,007 (4.4%) | 7,570 (6.1%) |
| $1,000,000 or more | 1,316 (1.9%) | 2,687 (2.2%) |
| Total | 68,722 (100.0%) | 124,083 (100.0%) |
Household Income by Mortgage Status in Middlesex County
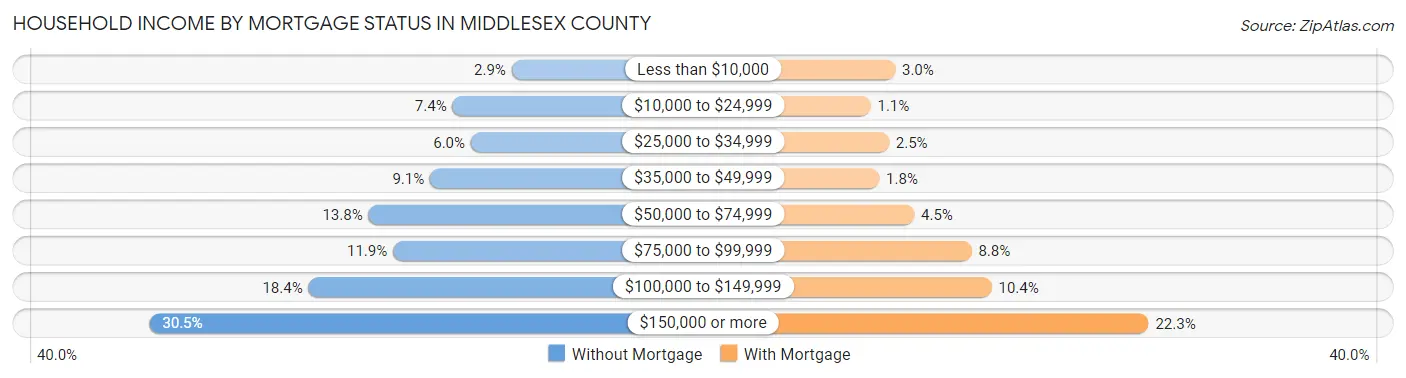
| Household Income | Without Mortgage | With Mortgage |
| Less than $10,000 | 1,987 (2.9%) | 3,739 (3.0%) |
| $10,000 to $24,999 | 5,087 (7.4%) | 1,411 (1.1%) |
| $25,000 to $34,999 | 4,123 (6.0%) | 3,150 (2.5%) |
| $35,000 to $49,999 | 6,264 (9.1%) | 2,236 (1.8%) |
| $50,000 to $74,999 | 9,482 (13.8%) | 5,534 (4.5%) |
| $75,000 to $99,999 | 8,201 (11.9%) | 10,953 (8.8%) |
| $100,000 to $149,999 | 12,623 (18.4%) | 12,859 (10.4%) |
| $150,000 or more | 20,955 (30.5%) | 27,691 (22.3%) |
| Total | 68,722 (100.0%) | 124,083 (100.0%) |
Property Value to Household Income Ratio in Middlesex County

| Value-to-Income Ratio | Without Mortgage | With Mortgage |
| Less than 2.0x | 14,439 (21.0%) | 147,145 (118.6%) |
| 2.0x to 2.9x | 12,722 (18.5%) | 28,953 (23.3%) |
| 3.0x to 3.9x | 10,533 (15.3%) | 36,306 (29.3%) |
| 4.0x or more | 30,448 (44.3%) | 22,465 (18.1%) |
| Total | 68,722 (100.0%) | 124,083 (100.0%) |
Real Estate Taxes by Mortgage Status in Middlesex County
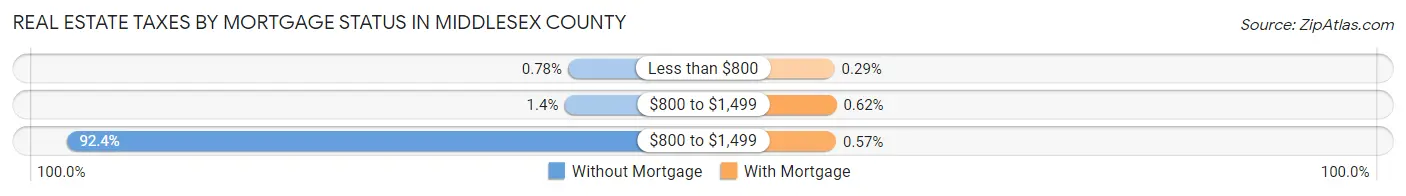
| Property Taxes | Without Mortgage | With Mortgage |
| Less than $800 | 533 (0.8%) | 360 (0.3%) |
| $800 to $1,499 | 991 (1.4%) | 765 (0.6%) |
| $800 to $1,499 | 63,466 (92.3%) | 707 (0.6%) |
| Total | 68,722 (100.0%) | 124,083 (100.0%) |
Health & Disability in Middlesex County
Health Insurance Coverage by Age in Middlesex County
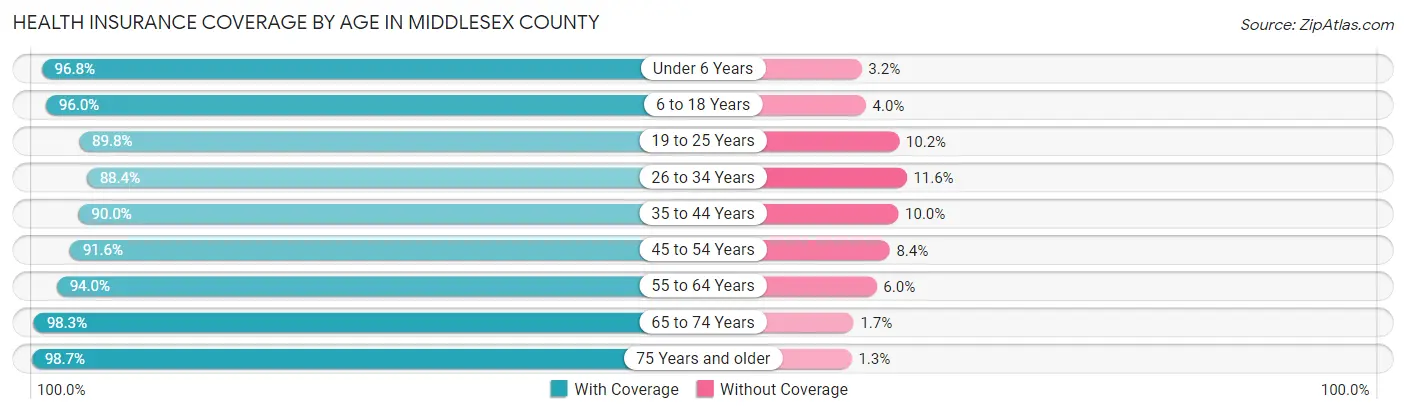
| Age Bracket | With Coverage | Without Coverage |
| Under 6 Years | 55,806 (96.8%) | 1,839 (3.2%) |
| 6 to 18 Years | 134,526 (96.0%) | 5,583 (4.0%) |
| 19 to 25 Years | 73,695 (89.8%) | 8,355 (10.2%) |
| 26 to 34 Years | 87,754 (88.4%) | 11,508 (11.6%) |
| 35 to 44 Years | 106,358 (90.0%) | 11,867 (10.0%) |
| 45 to 54 Years | 104,859 (91.6%) | 9,635 (8.4%) |
| 55 to 64 Years | 104,358 (94.0%) | 6,647 (6.0%) |
| 65 to 74 Years | 75,787 (98.3%) | 1,318 (1.7%) |
| 75 Years and older | 52,296 (98.7%) | 703 (1.3%) |
| Total | 795,439 (93.3%) | 57,455 (6.7%) |
Health Insurance Coverage by Citizenship Status in Middlesex County
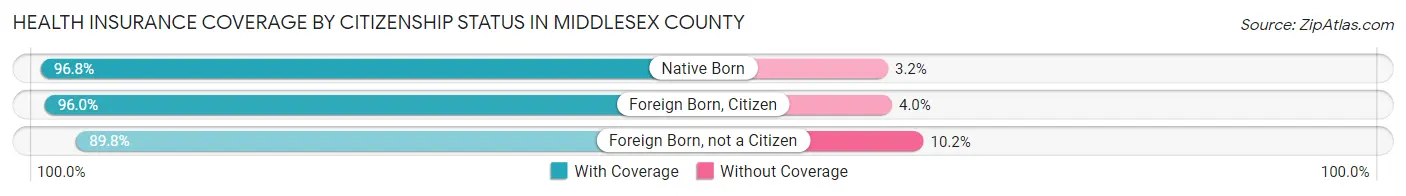
| Citizenship Status | With Coverage | Without Coverage |
| Native Born | 55,806 (96.8%) | 1,839 (3.2%) |
| Foreign Born, Citizen | 134,526 (96.0%) | 5,583 (4.0%) |
| Foreign Born, not a Citizen | 73,695 (89.8%) | 8,355 (10.2%) |
Health Insurance Coverage by Household Income in Middlesex County
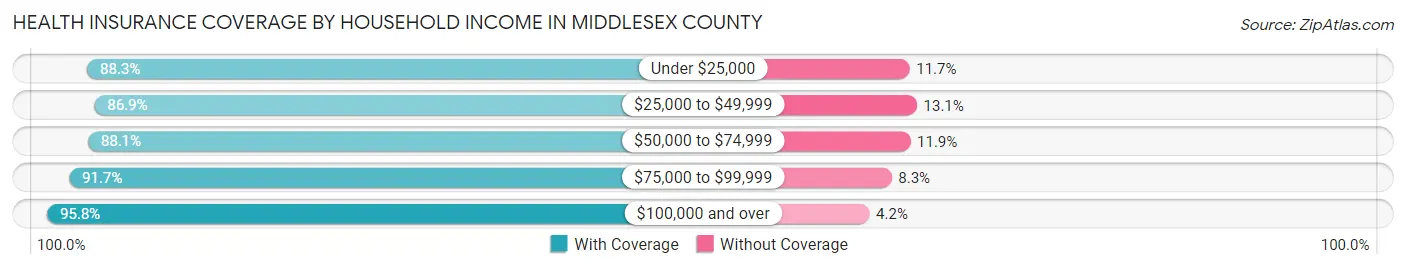
| Household Income | With Coverage | Without Coverage |
| Under $25,000 | 50,114 (88.3%) | 6,646 (11.7%) |
| $25,000 to $49,999 | 70,454 (86.9%) | 10,602 (13.1%) |
| $50,000 to $74,999 | 79,164 (88.1%) | 10,657 (11.9%) |
| $75,000 to $99,999 | 86,405 (91.7%) | 7,865 (8.3%) |
| $100,000 and over | 490,057 (95.8%) | 21,408 (4.2%) |
Public vs Private Health Insurance Coverage by Age in Middlesex County
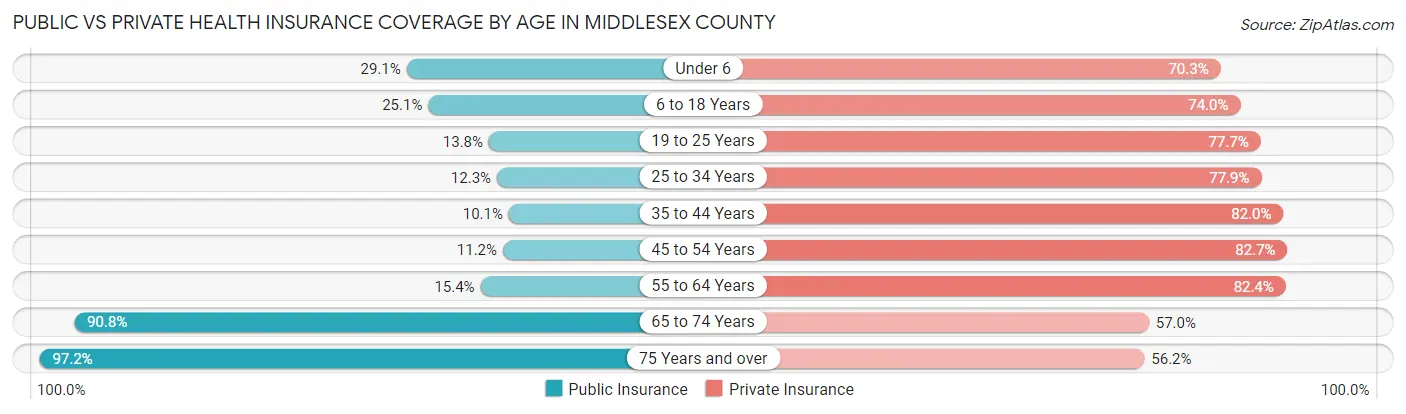
| Age Bracket | Public Insurance | Private Insurance |
| Under 6 | 16,773 (29.1%) | 40,512 (70.3%) |
| 6 to 18 Years | 35,137 (25.1%) | 103,628 (74.0%) |
| 19 to 25 Years | 11,350 (13.8%) | 63,784 (77.7%) |
| 25 to 34 Years | 12,237 (12.3%) | 77,287 (77.9%) |
| 35 to 44 Years | 11,971 (10.1%) | 96,898 (82.0%) |
| 45 to 54 Years | 12,861 (11.2%) | 94,693 (82.7%) |
| 55 to 64 Years | 17,085 (15.4%) | 91,453 (82.4%) |
| 65 to 74 Years | 70,032 (90.8%) | 43,931 (57.0%) |
| 75 Years and over | 51,534 (97.2%) | 29,765 (56.2%) |
| Total | 238,980 (28.0%) | 641,951 (75.3%) |
Disability Status by Sex by Age in Middlesex County
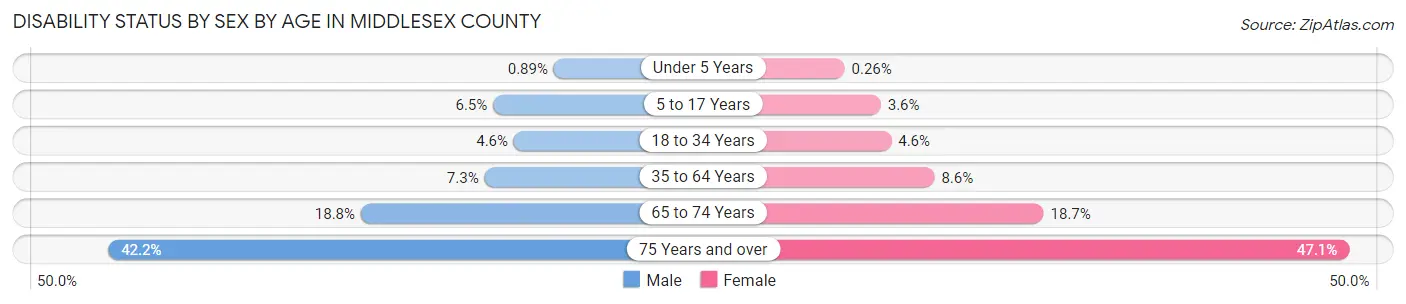
| Age Bracket | Male | Female |
| Under 5 Years | 216 (0.9%) | 59 (0.3%) |
| 5 to 17 Years | 4,601 (6.5%) | 2,444 (3.6%) |
| 18 to 34 Years | 4,499 (4.6%) | 4,381 (4.6%) |
| 35 to 64 Years | 12,583 (7.3%) | 14,769 (8.6%) |
| 65 to 74 Years | 6,778 (18.8%) | 7,684 (18.7%) |
| 75 Years and over | 9,055 (42.2%) | 14,860 (47.1%) |
Disability Class by Sex by Age in Middlesex County
Disability Class: Hearing Difficulty
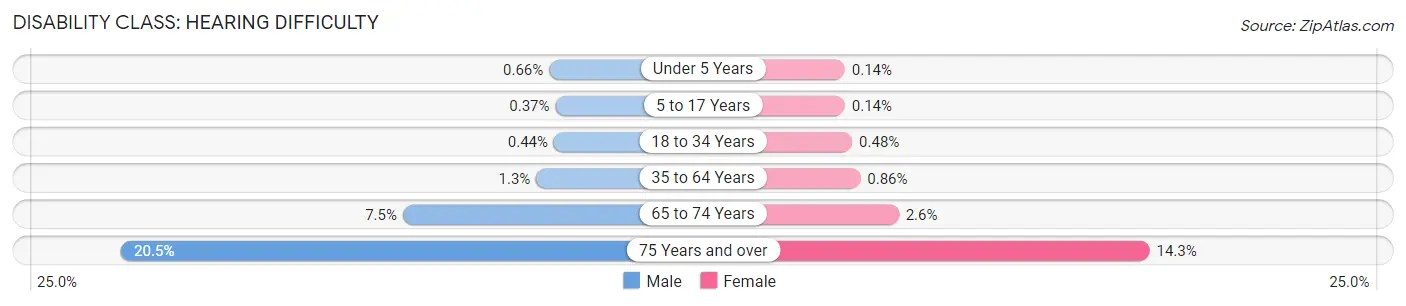
| Age Bracket | Male | Female |
| Under 5 Years | 160 (0.7%) | 32 (0.1%) |
| 5 to 17 Years | 262 (0.4%) | 96 (0.1%) |
| 18 to 34 Years | 435 (0.4%) | 457 (0.5%) |
| 35 to 64 Years | 2,164 (1.3%) | 1,472 (0.9%) |
| 65 to 74 Years | 2,689 (7.4%) | 1,083 (2.6%) |
| 75 Years and over | 4,400 (20.5%) | 4,506 (14.3%) |
Disability Class: Vision Difficulty
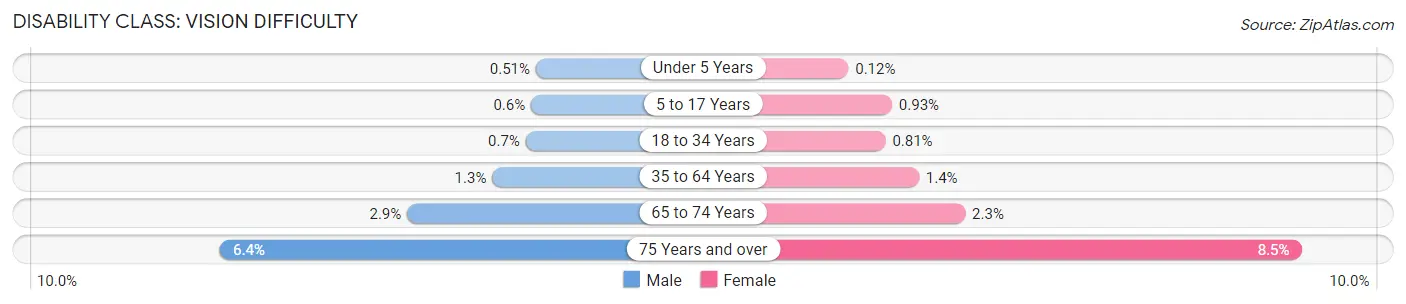
| Age Bracket | Male | Female |
| Under 5 Years | 124 (0.5%) | 27 (0.1%) |
| 5 to 17 Years | 424 (0.6%) | 625 (0.9%) |
| 18 to 34 Years | 689 (0.7%) | 773 (0.8%) |
| 35 to 64 Years | 2,266 (1.3%) | 2,450 (1.4%) |
| 65 to 74 Years | 1,047 (2.9%) | 941 (2.3%) |
| 75 Years and over | 1,365 (6.4%) | 2,693 (8.5%) |
Disability Class: Cognitive Difficulty
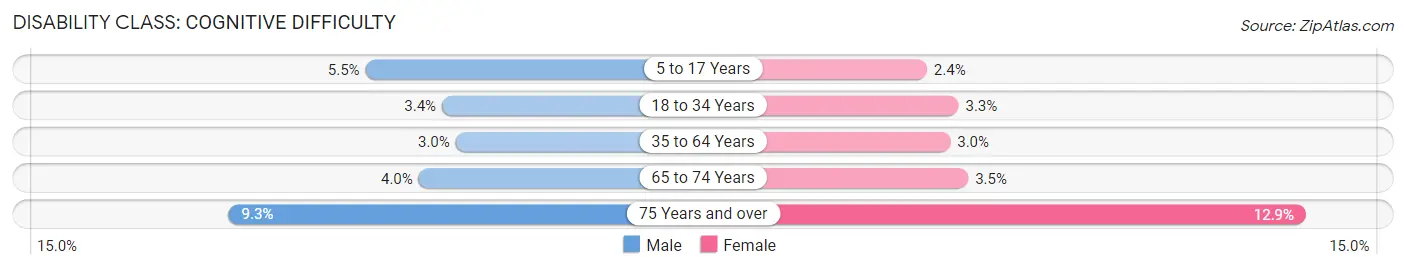
| Age Bracket | Male | Female |
| 5 to 17 Years | 3,889 (5.5%) | 1,601 (2.4%) |
| 18 to 34 Years | 3,316 (3.4%) | 3,101 (3.3%) |
| 35 to 64 Years | 5,159 (3.0%) | 5,194 (3.0%) |
| 65 to 74 Years | 1,454 (4.0%) | 1,444 (3.5%) |
| 75 Years and over | 1,999 (9.3%) | 4,078 (12.9%) |
Disability Class: Ambulatory Difficulty
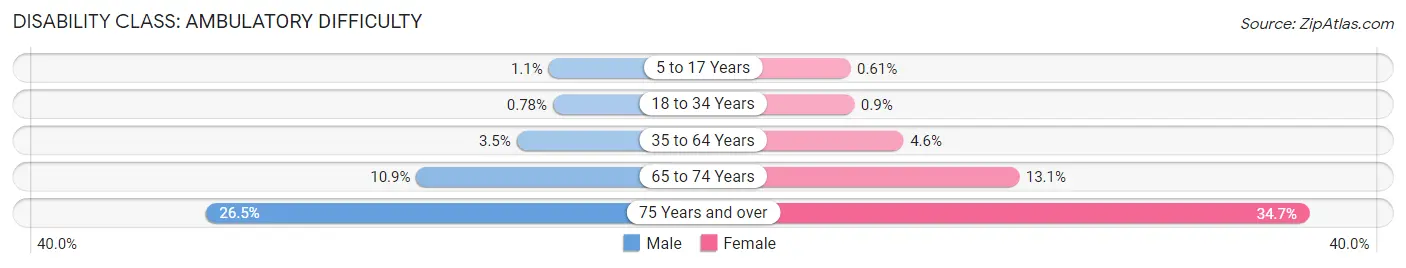
| Age Bracket | Male | Female |
| 5 to 17 Years | 776 (1.1%) | 414 (0.6%) |
| 18 to 34 Years | 762 (0.8%) | 856 (0.9%) |
| 35 to 64 Years | 5,969 (3.5%) | 7,840 (4.6%) |
| 65 to 74 Years | 3,940 (10.9%) | 5,390 (13.1%) |
| 75 Years and over | 5,681 (26.5%) | 10,942 (34.7%) |
Disability Class: Self-Care Difficulty
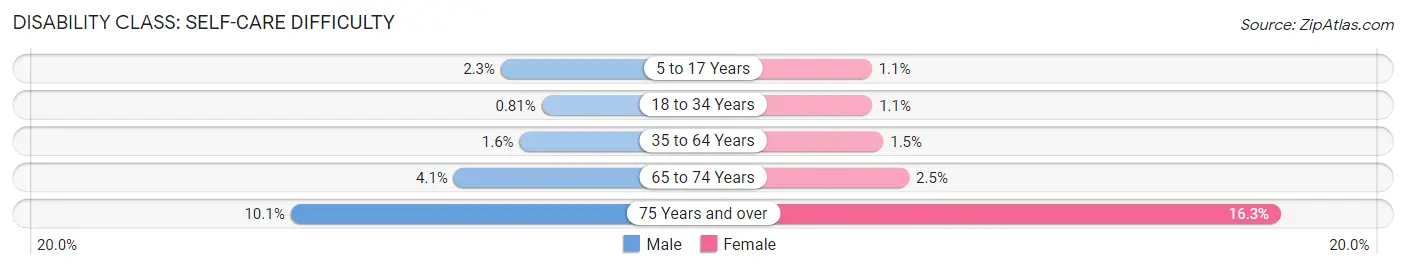
| Age Bracket | Male | Female |
| 5 to 17 Years | 1,637 (2.3%) | 747 (1.1%) |
| 18 to 34 Years | 796 (0.8%) | 1,077 (1.1%) |
| 35 to 64 Years | 2,809 (1.6%) | 2,641 (1.5%) |
| 65 to 74 Years | 1,469 (4.1%) | 1,025 (2.5%) |
| 75 Years and over | 2,172 (10.1%) | 5,145 (16.3%) |
Technology Access in Middlesex County
Computing Device Access in Middlesex County
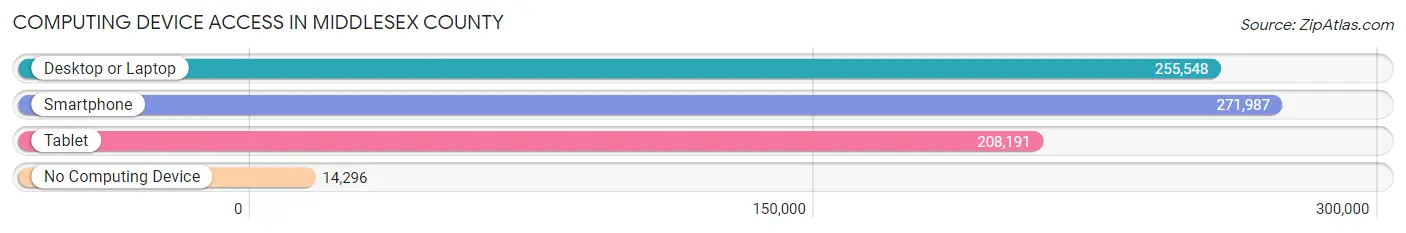
| Device Type | # Households | % Households |
| Desktop or Laptop | 255,548 | 84.6% |
| Smartphone | 271,987 | 90.1% |
| Tablet | 208,191 | 68.9% |
| No Computing Device | 14,296 | 4.7% |
| Total | 301,967 | 100.0% |
Internet Access in Middlesex County
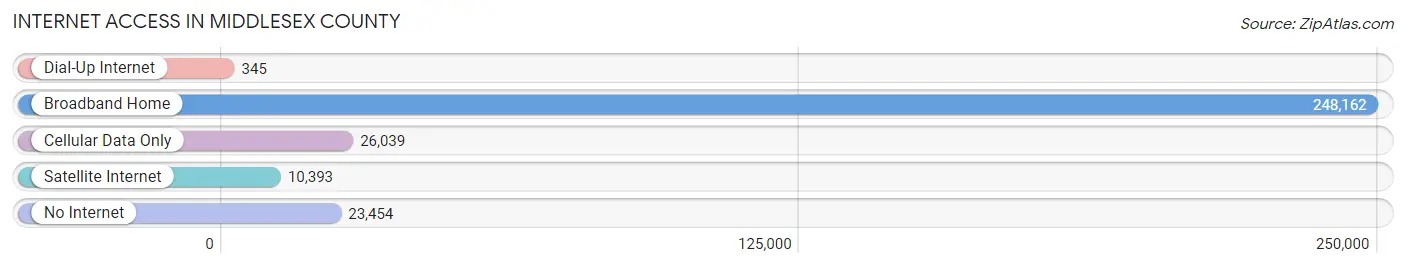
| Internet Type | # Households | % Households |
| Dial-Up Internet | 345 | 0.1% |
| Broadband Home | 248,162 | 82.2% |
| Cellular Data Only | 26,039 | 8.6% |
| Satellite Internet | 10,393 | 3.4% |
| No Internet | 23,454 | 7.8% |
| Total | 301,967 | 100.0% |
Middlesex County Summary
Middlesex County, New Jersey is located in the central part of the state and is the second most populous county in the state. It is bordered by Union, Somerset, Mercer, Monmouth, and Ocean counties. The county seat is New Brunswick, and the county is part of the New York metropolitan area.
Geography
Middlesex County covers an area of 322 square miles and is located in the central part of the state. It is bordered by Union, Somerset, Mercer, Monmouth, and Ocean counties. The county is divided into two parts by the Raritan River, which runs through the center of the county. The northern part of the county is mostly rural, while the southern part is more urbanized. The county is home to several parks, including Cheesequake State Park, Thompson Park, and Roosevelt Park.
The county is located in the Piedmont region of New Jersey, which is characterized by rolling hills and valleys. The highest point in the county is the Watchung Mountains, which reach an elevation of 1,000 feet. The county is also home to several rivers, including the Raritan, Millstone, and Rahway.
Demographics
As of the 2010 census, Middlesex County had a population of 809,858. The population was spread out with 24.3% under the age of 18, 10.3% from 18 to 24, 32.3% from 25 to 44, 22.5% from 45 to 64, and 10.6% who were 65 years of age or older. The median age was 36.4 years. The gender makeup of the county was 49.2% male and 50.8% female.
The racial makeup of the county was 57.2% White, 24.2% African American, 0.3% Native American, 11.2% Asian, 0.1% Pacific Islander, 4.2% from other races, and 2.9% from two or more races. Hispanic or Latino of any race were 14.9% of the population.
Economy
Middlesex County has a diverse economy, with a mix of manufacturing, retail, and service industries. The county is home to several major employers, including Johnson & Johnson, Merck & Co., and Rutgers University. The county is also home to several major shopping malls, including Menlo Park Mall, Woodbridge Center, and Brunswick Square Mall.
The county has a strong agricultural sector, with dairy, poultry, and vegetable farming being the main industries. The county is also home to several wineries, breweries, and distilleries.
The county has a strong transportation infrastructure, with several major highways, including the New Jersey Turnpike, Interstate 287, and the Garden State Parkway. The county is also served by several airports, including Newark Liberty International Airport, Trenton-Mercer Airport, and Princeton Airport.
Conclusion
Middlesex County, New Jersey is a diverse and vibrant county located in the central part of the state. It is bordered by Union, Somerset, Mercer, Monmouth, and Ocean counties and is home to a population of 809,858. The county has a diverse economy, with a mix of manufacturing, retail, and service industries. It is also home to several major employers, shopping malls, and transportation infrastructure. The county is also home to several parks, rivers, and wineries.
Common Questions
What is the Total Population of Middlesex County?
Total Population of Middlesex County is 860,147.
What is the Total Male Population of Middlesex County?
Total Male Population of Middlesex County is 427,707.
What is the Total Female Population of Middlesex County?
Total Female Population of Middlesex County is 432,440.
What is the Ratio of Males per 100 Females in Middlesex County?
There are 98.91 Males per 100 Females in Middlesex County.
What is the Ratio of Females per 100 Males in Middlesex County?
There are 101.11 Females per 100 Males in Middlesex County.
What is the Median Population Age in Middlesex County?
Median Population Age in Middlesex County is 39.1 Years.
What is the Average Family Size in Middlesex County
Average Family Size in Middlesex County is 3.3 People.
What is the Average Household Size in Middlesex County
Average Household Size in Middlesex County is 2.8 People.
What is Per Capita Income in Middlesex County?
Per Capita income in Middlesex County is $47,196.
What is the Median Family Income in Middlesex County?
Median Family Income in Middlesex County is $124,842.
What is the Median Household income in Middlesex County?
Median Household Income in Middlesex County is $105,206.
What is Income or Wage Gap in Middlesex County?
Income or Wage Gap in Middlesex County is 33.2%.
Women in Middlesex County earn 66.8 cents for every dollar earned by a man.
What is Family Income Deficit in Middlesex County?
Family Income Deficit in Middlesex County is $10,071.
Families that are below poverty line in Middlesex County earn $10,071 less on average than the poverty threshold level.
What is Inequality or Gini Index in Middlesex County?
Inequality or Gini Index in Middlesex County is 0.43.
How Large is the Labor Force in Middlesex County?
There are 462,489 People in the Labor Forcein in Middlesex County.
What is the Percentage of People in the Labor Force in Middlesex County?
66.4% of People are in the Labor Force in Middlesex County.
What is the Unemployment Rate in Middlesex County?
Unemployment Rate in Middlesex County is 6.3%.