Mercer County, NJ
Mercer County Overview
383,732
TOTAL POPULATION
189,495
MALE POPULATION
194,237
FEMALE POPULATION
97.56
MALES / 100 FEMALES
102.50
FEMALES / 100 MALES
39.3
MEDIAN AGE
3.3
AVG FAMILY SIZE
2.6
AVG HOUSEHOLD SIZE
$50,053
PER CAPITA INCOME
$120,093
AVG FAMILY INCOME
$92,697
AVG HOUSEHOLD INCOME
22.3%
WAGE / INCOME GAP [ % ]
77.7¢/ $1
WAGE / INCOME GAP [ $ ]
$10,935
FAMILY INCOME DEFICIT
0.50
INEQUALITY / GINI INDEX
198,759
LABOR FORCE [ PEOPLE ]
63.8%
PERCENT IN LABOR FORCE
6.1%
UNEMPLOYMENT RATE
Mercer County Area Codes
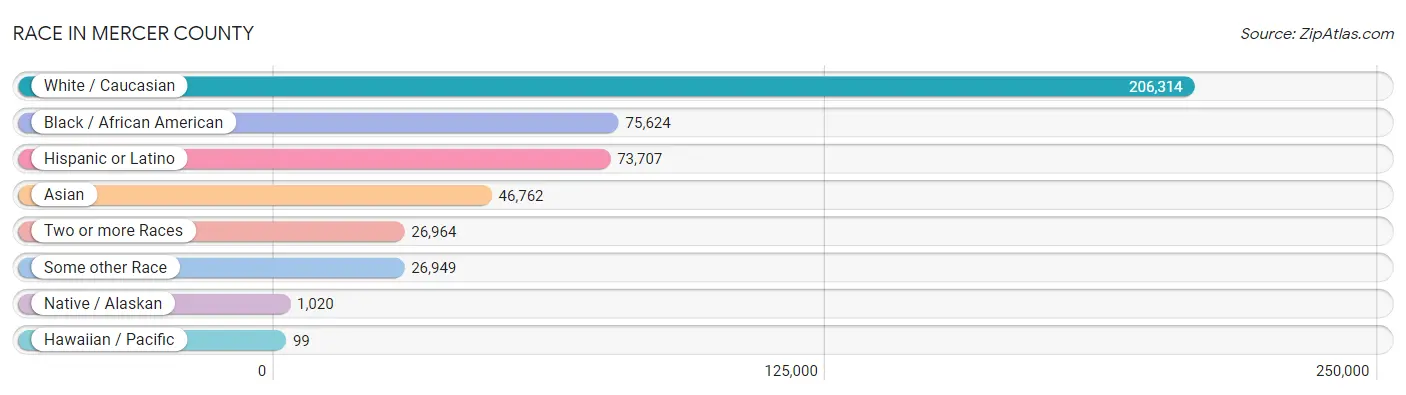
Race in Mercer County
The most populous races in Mercer County are White / Caucasian (206,314 | 53.8%), Black / African American (75,624 | 19.7%), and Hispanic or Latino (73,707 | 19.2%).
| Race | # Population | % Population |
| Asian | 46,762 | 12.2% |
| Black / African American | 75,624 | 19.7% |
| Hawaiian / Pacific | 99 | 0.0% |
| Hispanic or Latino | 73,707 | 19.2% |
| Native / Alaskan | 1,020 | 0.3% |
| White / Caucasian | 206,314 | 53.8% |
| Two or more Races | 26,964 | 7.0% |
| Some other Race | 26,949 | 7.0% |
| Total | 383,732 | 100.0% |
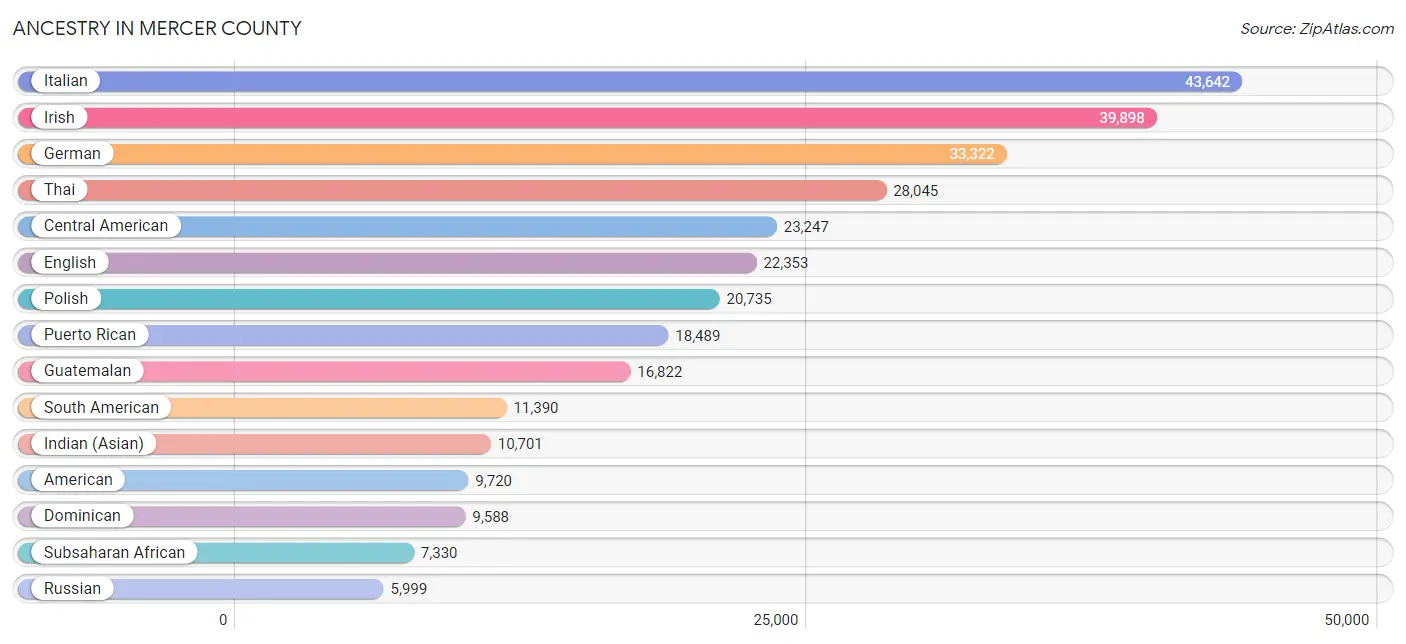
Ancestry in Mercer County
The most populous ancestries reported in Mercer County are Italian (43,642 | 11.4%), Irish (39,898 | 10.4%), German (33,322 | 8.7%), Thai (28,045 | 7.3%), and Central American (23,247 | 6.1%), together accounting for 43.8% of all Mercer County residents.
| Ancestry | # Population | % Population |
| African | 2,412 | 0.6% |
| Alaska Native | 16 | 0.0% |
| Albanian | 96 | 0.0% |
| American | 9,720 | 2.5% |
| Apache | 33 | 0.0% |
| Arab | 2,932 | 0.8% |
| Argentinean | 293 | 0.1% |
| Armenian | 360 | 0.1% |
| Australian | 141 | 0.0% |
| Austrian | 799 | 0.2% |
| Bangladeshi | 11 | 0.0% |
| Barbadian | 106 | 0.0% |
| Basque | 57 | 0.0% |
| Belgian | 281 | 0.1% |
| Belizean | 190 | 0.1% |
| Bermudan | 3 | 0.0% |
| Bhutanese | 1,697 | 0.4% |
| Blackfeet | 61 | 0.0% |
| Bolivian | 180 | 0.1% |
| Brazilian | 754 | 0.2% |
| British | 1,572 | 0.4% |
| British West Indian | 215 | 0.1% |
| Bulgarian | 279 | 0.1% |
| Burmese | 3,464 | 0.9% |
| Cambodian | 124 | 0.0% |
| Canadian | 719 | 0.2% |
| Carpatho Rusyn | 29 | 0.0% |
| Celtic | 94 | 0.0% |
| Central American | 23,247 | 6.1% |
| Central American Indian | 614 | 0.2% |
| Cherokee | 317 | 0.1% |
| Chilean | 391 | 0.1% |
| Chinese | 2 | 0.0% |
| Chippewa | 26 | 0.0% |
| Choctaw | 2 | 0.0% |
| Colombian | 2,449 | 0.6% |
| Costa Rican | 2,020 | 0.5% |
| Creek | 28 | 0.0% |
| Croatian | 293 | 0.1% |
| Cuban | 1,220 | 0.3% |
| Czech | 949 | 0.3% |
| Czechoslovakian | 257 | 0.1% |
| Danish | 941 | 0.3% |
| Delaware | 85 | 0.0% |
| Dominican | 9,588 | 2.5% |
| Dutch | 2,763 | 0.7% |
| Eastern European | 2,587 | 0.7% |
| Ecuadorian | 5,499 | 1.4% |
| Egyptian | 1,158 | 0.3% |
| English | 22,353 | 5.8% |
| Estonian | 47 | 0.0% |
| Ethiopian | 221 | 0.1% |
| European | 2,866 | 0.7% |
| Filipino | 671 | 0.2% |
| Finnish | 105 | 0.0% |
| French | 4,608 | 1.2% |
| French Canadian | 612 | 0.2% |
| German | 33,322 | 8.7% |
| Ghanaian | 980 | 0.3% |
| Greek | 1,813 | 0.5% |
| Guamanian / Chamorro | 95 | 0.0% |
| Guatemalan | 16,822 | 4.4% |
| Guyanese | 465 | 0.1% |
| Haitian | 5,150 | 1.3% |
| Honduran | 2,551 | 0.7% |
| Hungarian | 4,983 | 1.3% |
| Icelander | 12 | 0.0% |
| Indian (Asian) | 10,701 | 2.8% |
| Indonesian | 711 | 0.2% |
| Iranian | 328 | 0.1% |
| Iraqi | 80 | 0.0% |
| Irish | 39,898 | 10.4% |
| Iroquois | 63 | 0.0% |
| Israeli | 369 | 0.1% |
| Italian | 43,642 | 11.4% |
| Jamaican | 2,513 | 0.6% |
| Japanese | 9 | 0.0% |
| Jordanian | 53 | 0.0% |
| Kenyan | 229 | 0.1% |
| Korean | 3,544 | 0.9% |
| Laotian | 50 | 0.0% |
| Latvian | 246 | 0.1% |
| Lebanese | 452 | 0.1% |
| Liberian | 2,434 | 0.6% |
| Lithuanian | 1,384 | 0.4% |
| Luxembourger | 11 | 0.0% |
| Macedonian | 151 | 0.0% |
| Malaysian | 4 | 0.0% |
| Maltese | 19 | 0.0% |
| Mexican | 5,094 | 1.3% |
| Mexican American Indian | 64 | 0.0% |
| Mongolian | 58 | 0.0% |
| Moroccan | 459 | 0.1% |
| Native Hawaiian | 184 | 0.1% |
| New Zealander | 15 | 0.0% |
| Nicaraguan | 90 | 0.0% |
| Nigerian | 888 | 0.2% |
| Northern European | 211 | 0.1% |
| Norwegian | 1,214 | 0.3% |
| Okinawan | 49 | 0.0% |
| Pakistani | 155 | 0.0% |
| Palestinian | 411 | 0.1% |
| Panamanian | 583 | 0.2% |
| Paraguayan | 11 | 0.0% |
| Pennsylvania German | 350 | 0.1% |
| Peruvian | 1,531 | 0.4% |
| Polish | 20,735 | 5.4% |
| Portuguese | 741 | 0.2% |
| Puerto Rican | 18,489 | 4.8% |
| Romanian | 1,050 | 0.3% |
| Russian | 5,999 | 1.6% |
| Salvadoran | 1,050 | 0.3% |
| Samoan | 29 | 0.0% |
| Scandinavian | 499 | 0.1% |
| Scotch-Irish | 1,077 | 0.3% |
| Scottish | 3,612 | 0.9% |
| Senegalese | 27 | 0.0% |
| Serbian | 144 | 0.0% |
| Sierra Leonean | 33 | 0.0% |
| Sioux | 58 | 0.0% |
| Slavic | 283 | 0.1% |
| Slovak | 1,484 | 0.4% |
| Slovene | 83 | 0.0% |
| Somali | 11 | 0.0% |
| South African | 44 | 0.0% |
| South American | 11,390 | 3.0% |
| South American Indian | 116 | 0.0% |
| Spaniard | 1,018 | 0.3% |
| Spanish | 380 | 0.1% |
| Spanish American | 73 | 0.0% |
| Sri Lankan | 570 | 0.2% |
| Subsaharan African | 7,330 | 1.9% |
| Sudanese | 55 | 0.0% |
| Swedish | 1,561 | 0.4% |
| Swiss | 466 | 0.1% |
| Syrian | 68 | 0.0% |
| Thai | 28,045 | 7.3% |
| Trinidadian and Tobagonian | 504 | 0.1% |
| Turkish | 1,153 | 0.3% |
| U.S. Virgin Islander | 149 | 0.0% |
| Ugandan | 8 | 0.0% |
| Ukrainian | 2,458 | 0.6% |
| Uruguayan | 164 | 0.0% |
| Venezuelan | 640 | 0.2% |
| Vietnamese | 170 | 0.0% |
| Welsh | 1,315 | 0.3% |
| West Indian | 518 | 0.1% |
| Yugoslavian | 410 | 0.1% | View All 148 Rows |
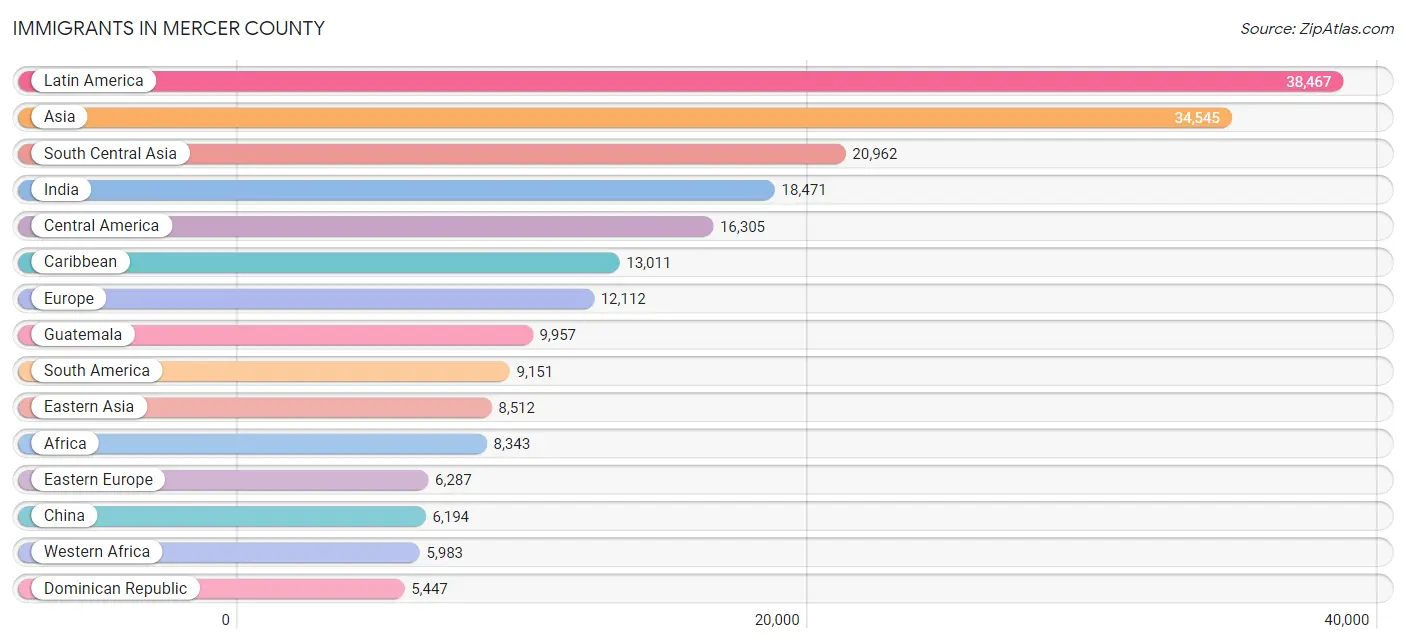
Immigrants in Mercer County
The most numerous immigrant groups reported in Mercer County came from Latin America (38,467 | 10.0%), Asia (34,545 | 9.0%), South Central Asia (20,962 | 5.5%), India (18,471 | 4.8%), and Central America (16,305 | 4.3%), together accounting for 33.5% of all Mercer County residents.
| Immigration Origin | # Population | % Population |
| Africa | 8,343 | 2.2% |
| Albania | 15 | 0.0% |
| Argentina | 171 | 0.0% |
| Armenia | 2 | 0.0% |
| Asia | 34,545 | 9.0% |
| Australia | 135 | 0.0% |
| Austria | 68 | 0.0% |
| Bangladesh | 485 | 0.1% |
| Barbados | 37 | 0.0% |
| Belarus | 88 | 0.0% |
| Belgium | 54 | 0.0% |
| Belize | 56 | 0.0% |
| Bolivia | 172 | 0.0% |
| Bosnia and Herzegovina | 58 | 0.0% |
| Brazil | 606 | 0.2% |
| Bulgaria | 205 | 0.1% |
| Cabo Verde | 48 | 0.0% |
| Cambodia | 32 | 0.0% |
| Cameroon | 72 | 0.0% |
| Canada | 733 | 0.2% |
| Caribbean | 13,011 | 3.4% |
| Central America | 16,305 | 4.3% |
| Chile | 255 | 0.1% |
| China | 6,194 | 1.6% |
| Colombia | 1,992 | 0.5% |
| Costa Rica | 1,386 | 0.4% |
| Croatia | 42 | 0.0% |
| Cuba | 312 | 0.1% |
| Czechoslovakia | 168 | 0.0% |
| Denmark | 163 | 0.0% |
| Dominica | 32 | 0.0% |
| Dominican Republic | 5,447 | 1.4% |
| Eastern Africa | 834 | 0.2% |
| Eastern Asia | 8,512 | 2.2% |
| Eastern Europe | 6,287 | 1.6% |
| Ecuador | 3,478 | 0.9% |
| Egypt | 704 | 0.2% |
| El Salvador | 701 | 0.2% |
| England | 485 | 0.1% |
| Eritrea | 136 | 0.0% |
| Ethiopia | 68 | 0.0% |
| Europe | 12,112 | 3.2% |
| France | 715 | 0.2% |
| Germany | 1,103 | 0.3% |
| Ghana | 938 | 0.2% |
| Greece | 195 | 0.1% |
| Grenada | 23 | 0.0% |
| Guatemala | 9,957 | 2.6% |
| Guyana | 634 | 0.2% |
| Haiti | 3,962 | 1.0% |
| Honduras | 2,071 | 0.5% |
| Hong Kong | 521 | 0.1% |
| Hungary | 254 | 0.1% |
| India | 18,471 | 4.8% |
| Indonesia | 26 | 0.0% |
| Iran | 143 | 0.0% |
| Iraq | 58 | 0.0% |
| Ireland | 214 | 0.1% |
| Israel | 374 | 0.1% |
| Italy | 1,159 | 0.3% |
| Jamaica | 2,182 | 0.6% |
| Japan | 604 | 0.2% |
| Kazakhstan | 11 | 0.0% |
| Kenya | 308 | 0.1% |
| Korea | 1,714 | 0.4% |
| Kuwait | 7 | 0.0% |
| Latin America | 38,467 | 10.0% |
| Latvia | 27 | 0.0% |
| Lebanon | 124 | 0.0% |
| Liberia | 3,811 | 1.0% |
| Lithuania | 79 | 0.0% |
| Malaysia | 281 | 0.1% |
| Mexico | 1,801 | 0.5% |
| Middle Africa | 82 | 0.0% |
| Moldova | 45 | 0.0% |
| Morocco | 162 | 0.0% |
| Nepal | 169 | 0.0% |
| Netherlands | 193 | 0.1% |
| Nicaragua | 78 | 0.0% |
| Nigeria | 761 | 0.2% |
| North Macedonia | 53 | 0.0% |
| Northern Africa | 1,101 | 0.3% |
| Northern Europe | 1,893 | 0.5% |
| Norway | 44 | 0.0% |
| Oceania | 153 | 0.0% |
| Pakistan | 1,502 | 0.4% |
| Panama | 124 | 0.0% |
| Peru | 1,118 | 0.3% |
| Philippines | 1,966 | 0.5% |
| Poland | 2,840 | 0.7% |
| Portugal | 128 | 0.0% |
| Romania | 294 | 0.1% |
| Russia | 912 | 0.2% |
| Saudi Arabia | 28 | 0.0% |
| Scotland | 106 | 0.0% |
| Senegal | 90 | 0.0% |
| Serbia | 23 | 0.0% |
| Sierra Leone | 89 | 0.0% |
| Singapore | 358 | 0.1% |
| South Africa | 59 | 0.0% |
| South America | 9,151 | 2.4% |
| South Central Asia | 20,962 | 5.5% |
| South Eastern Asia | 3,493 | 0.9% |
| Southern Europe | 1,713 | 0.4% |
| Spain | 229 | 0.1% |
| Sri Lanka | 41 | 0.0% |
| St. Vincent and the Grenadines | 50 | 0.0% |
| Sudan | 146 | 0.0% |
| Sweden | 119 | 0.0% |
| Switzerland | 37 | 0.0% |
| Syria | 10 | 0.0% |
| Taiwan | 839 | 0.2% |
| Thailand | 164 | 0.0% |
| Trinidad and Tobago | 466 | 0.1% |
| Turkey | 695 | 0.2% |
| Uganda | 14 | 0.0% |
| Ukraine | 716 | 0.2% |
| Uruguay | 51 | 0.0% |
| Uzbekistan | 118 | 0.0% |
| Venezuela | 613 | 0.2% |
| Vietnam | 297 | 0.1% |
| Western Africa | 5,983 | 1.6% |
| Western Asia | 1,472 | 0.4% |
| Western Europe | 2,196 | 0.6% |
| Zaire | 10 | 0.0% |
| Zimbabwe | 8 | 0.0% | View All 126 Rows |
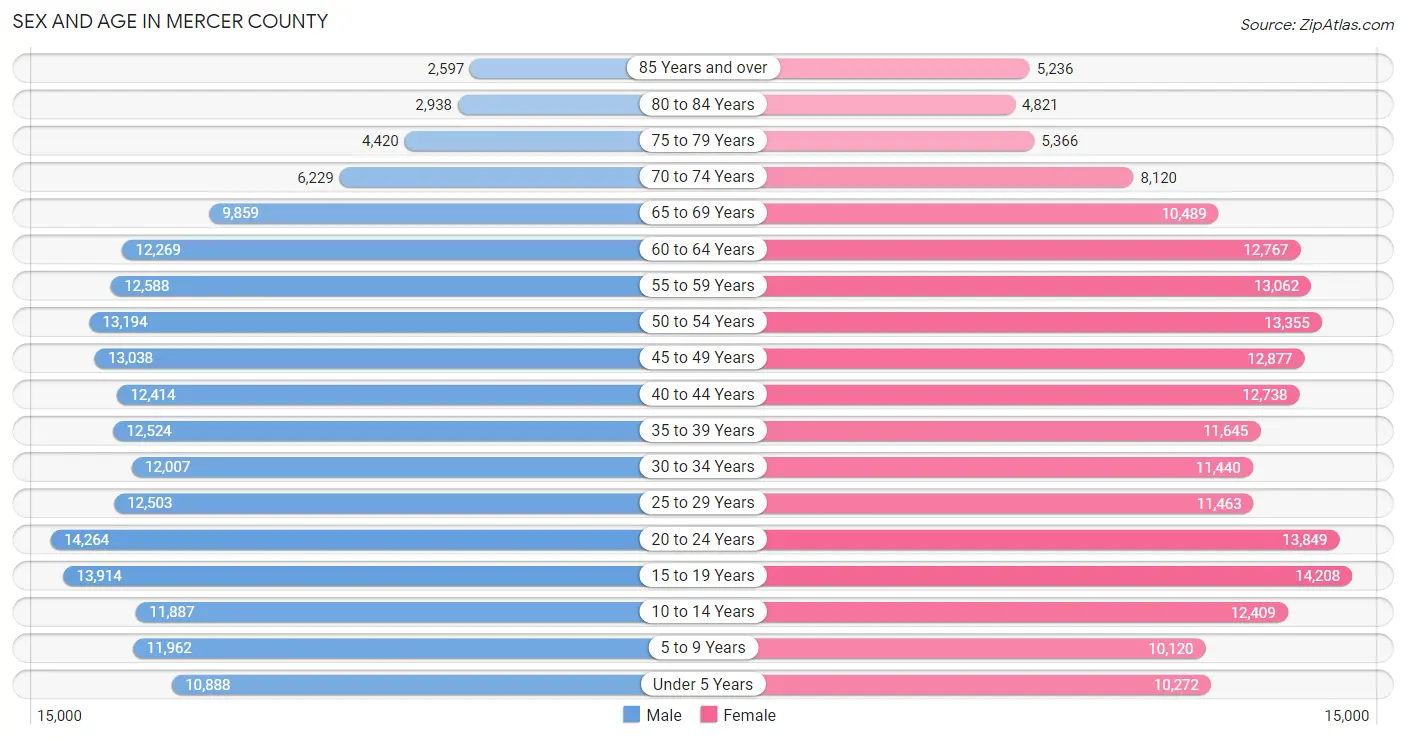
Sex and Age in Mercer County
Sex and Age in Mercer County
The most populous age groups in Mercer County are 20 to 24 Years (14,264 | 7.5%) for men and 15 to 19 Years (14,208 | 7.3%) for women.
| Age Bracket | Male | Female |
| Under 5 Years | 10,888 (5.8%) | 10,272 (5.3%) |
| 5 to 9 Years | 11,962 (6.3%) | 10,120 (5.2%) |
| 10 to 14 Years | 11,887 (6.3%) | 12,409 (6.4%) |
| 15 to 19 Years | 13,914 (7.3%) | 14,208 (7.3%) |
| 20 to 24 Years | 14,264 (7.5%) | 13,849 (7.1%) |
| 25 to 29 Years | 12,503 (6.6%) | 11,463 (5.9%) |
| 30 to 34 Years | 12,007 (6.3%) | 11,440 (5.9%) |
| 35 to 39 Years | 12,524 (6.6%) | 11,645 (6.0%) |
| 40 to 44 Years | 12,414 (6.6%) | 12,738 (6.6%) |
| 45 to 49 Years | 13,038 (6.9%) | 12,877 (6.6%) |
| 50 to 54 Years | 13,194 (7.0%) | 13,355 (6.9%) |
| 55 to 59 Years | 12,588 (6.6%) | 13,062 (6.7%) |
| 60 to 64 Years | 12,269 (6.5%) | 12,767 (6.6%) |
| 65 to 69 Years | 9,859 (5.2%) | 10,489 (5.4%) |
| 70 to 74 Years | 6,229 (3.3%) | 8,120 (4.2%) |
| 75 to 79 Years | 4,420 (2.3%) | 5,366 (2.8%) |
| 80 to 84 Years | 2,938 (1.5%) | 4,821 (2.5%) |
| 85 Years and over | 2,597 (1.4%) | 5,236 (2.7%) |
| Total | 189,495 (100.0%) | 194,237 (100.0%) |
Families and Households in Mercer County
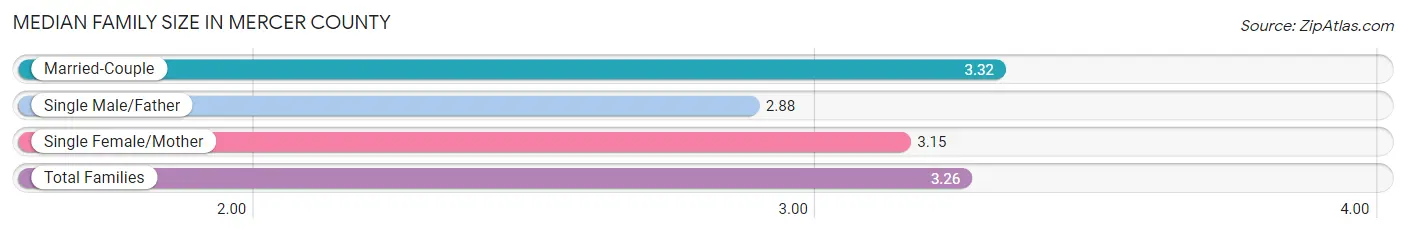
Median Family Size in Mercer County
The median family size in Mercer County is 3.26 persons per family, with married-couple families (66,422 | 72.4%) accounting for the largest median family size of 3.32 persons per family. On the other hand, single male/father families (7,019 | 7.6%) represent the smallest median family size with 2.88 persons per family.
| Family Type | # Families | Family Size |
| Married-Couple | 66,422 (72.4%) | 3.32 |
| Single Male/Father | 7,019 (7.6%) | 2.88 |
| Single Female/Mother | 18,301 (20.0%) | 3.15 |
| Total Families | 91,742 (100.0%) | 3.26 |
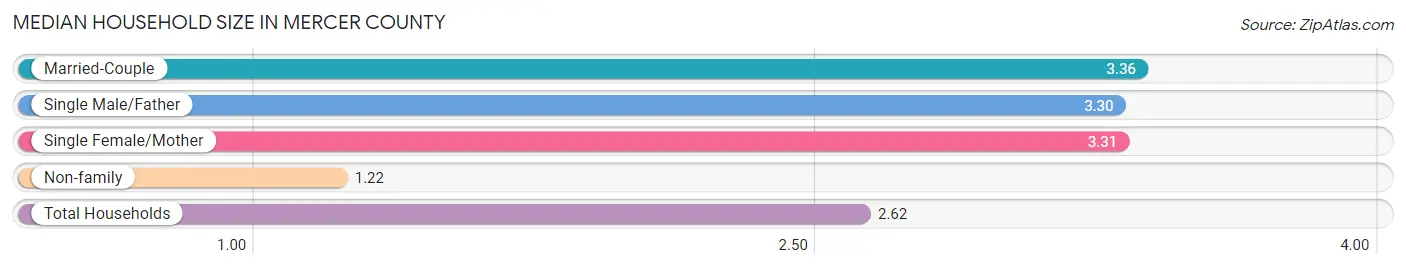
Median Household Size in Mercer County
The median household size in Mercer County is 2.62 persons per household, with married-couple households (66,422 | 47.6%) accounting for the largest median household size of 3.36 persons per household. non-family households (47,807 | 34.3%) represent the smallest median household size with 1.22 persons per household.
| Household Type | # Households | Household Size |
| Married-Couple | 66,422 (47.6%) | 3.36 |
| Single Male/Father | 7,019 (5.0%) | 3.30 |
| Single Female/Mother | 18,301 (13.1%) | 3.31 |
| Non-family | 47,807 (34.3%) | 1.22 |
| Total Households | 139,549 (100.0%) | 2.62 |
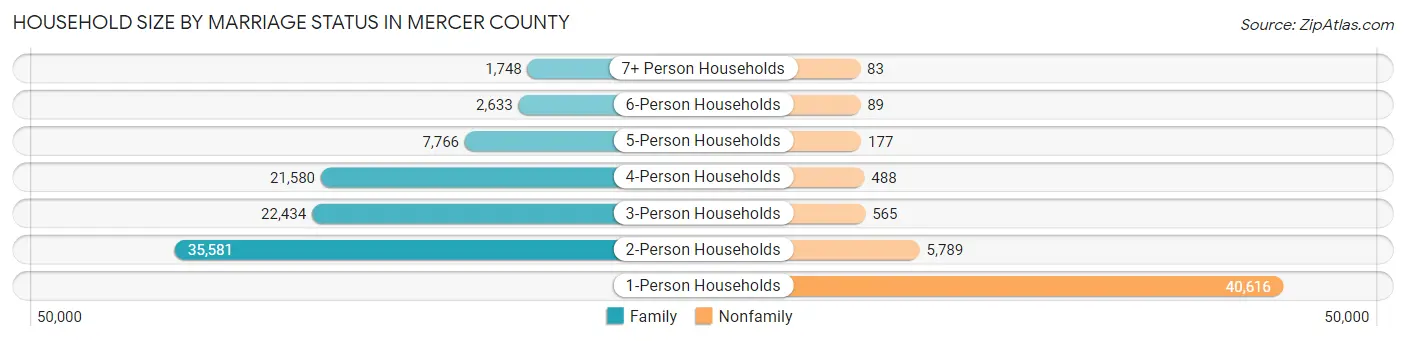
Household Size by Marriage Status in Mercer County
Out of a total of 139,549 households in Mercer County, 91,742 (65.7%) are family households, while 47,807 (34.3%) are nonfamily households. The most numerous type of family households are 2-person households, comprising 35,581, and the most common type of nonfamily households are 1-person households, comprising 40,616.
| Household Size | Family Households | Nonfamily Households |
| 1-Person Households | - | 40,616 (29.1%) |
| 2-Person Households | 35,581 (25.5%) | 5,789 (4.2%) |
| 3-Person Households | 22,434 (16.1%) | 565 (0.4%) |
| 4-Person Households | 21,580 (15.5%) | 488 (0.4%) |
| 5-Person Households | 7,766 (5.6%) | 177 (0.1%) |
| 6-Person Households | 2,633 (1.9%) | 89 (0.1%) |
| 7+ Person Households | 1,748 (1.3%) | 83 (0.1%) |
| Total | 91,742 (65.7%) | 47,807 (34.3%) |
Female Fertility in Mercer County
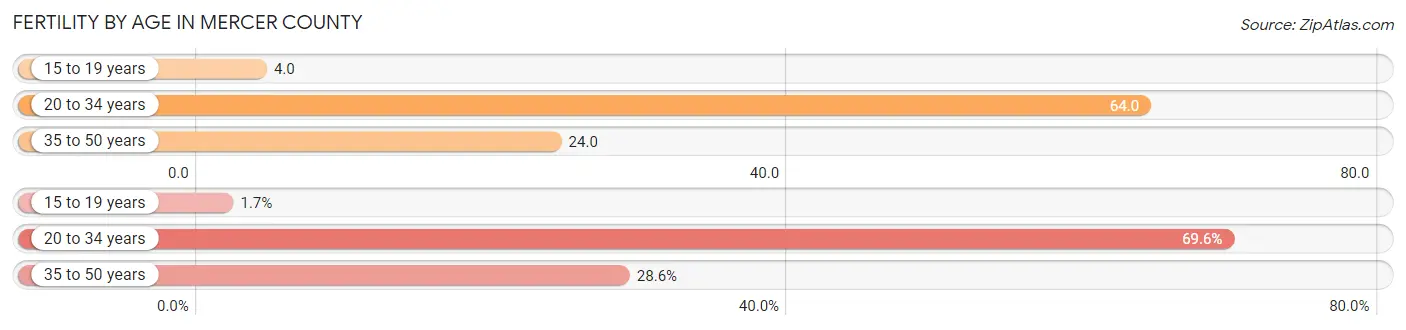
Fertility by Age in Mercer County
Average fertility rate in Mercer County is 37.0 births per 1,000 women. Women in the age bracket of 20 to 34 years have the highest fertility rate with 64.0 births per 1,000 women. Women in the age bracket of 20 to 34 years acount for 69.6% of all women with births.
| Age Bracket | Women with Births | Births / 1,000 Women |
| 15 to 19 years | 58 (1.7%) | 4.0 |
| 20 to 34 years | 2,335 (69.6%) | 64.0 |
| 35 to 50 years | 960 (28.6%) | 24.0 |
| Total | 3,353 (100.0%) | 37.0 |
Fertility by Age by Marriage Status in Mercer County
66.0% of women with births (3,353) in Mercer County are married. The highest percentage of unmarried women with births falls into 15 to 19 years age bracket with 100.0% of them unmarried at the time of birth, while the lowest percentage of unmarried women with births belong to 35 to 50 years age bracket with 18.5% of them unmarried.
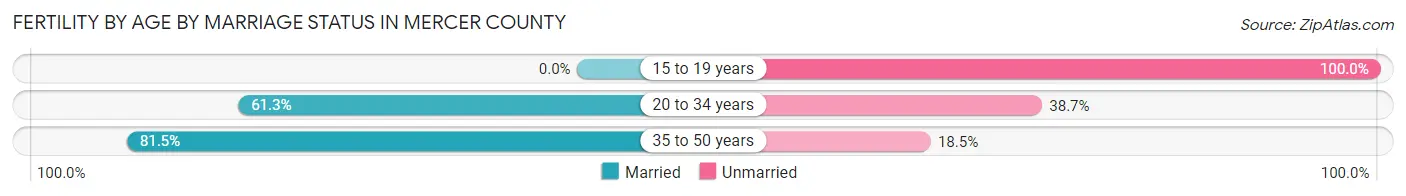
| Age Bracket | Married | Unmarried |
| 15 to 19 years | 0 (0.0%) | 58 (100.0%) |
| 20 to 34 years | 1,431 (61.3%) | 904 (38.7%) |
| 35 to 50 years | 782 (81.5%) | 178 (18.5%) |
| Total | 2,213 (66.0%) | 1,140 (34.0%) |
Fertility by Education in Mercer County
Average fertility rate in Mercer County is 37.0 births per 1,000 women. Women with the education attainment of high school diploma have the highest fertility rate of 52.0 births per 1,000 women, while women with the education attainment of bachelor's degree have the lowest fertility at 28.0 births per 1,000 women. Women with the education attainment of high school diploma represent 27.7% of all women with births.
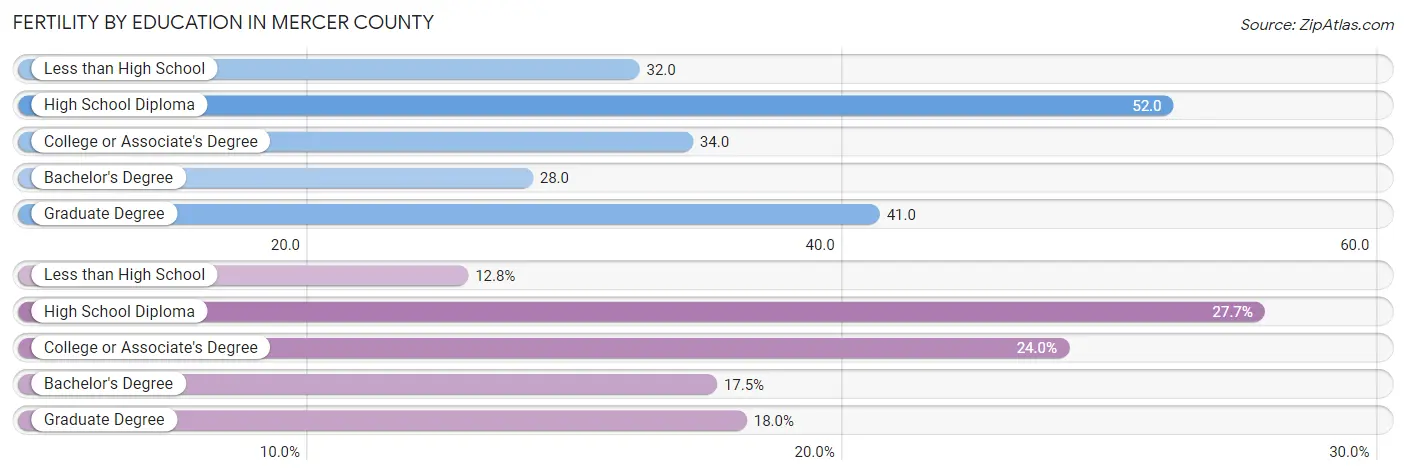
| Educational Attainment | Women with Births | Births / 1,000 Women |
| Less than High School | 429 (12.8%) | 32.0 |
| High School Diploma | 929 (27.7%) | 52.0 |
| College or Associate's Degree | 806 (24.0%) | 34.0 |
| Bachelor's Degree | 585 (17.4%) | 28.0 |
| Graduate Degree | 604 (18.0%) | 41.0 |
| Total | 3,353 (100.0%) | 37.0 |
Fertility by Education by Marriage Status in Mercer County
34.0% of women with births in Mercer County are unmarried. Women with the educational attainment of graduate degree are most likely to be married with 95.0% of them married at childbirth, while women with the educational attainment of college or associate's degree are least likely to be married with 61.5% of them unmarried at childbirth.
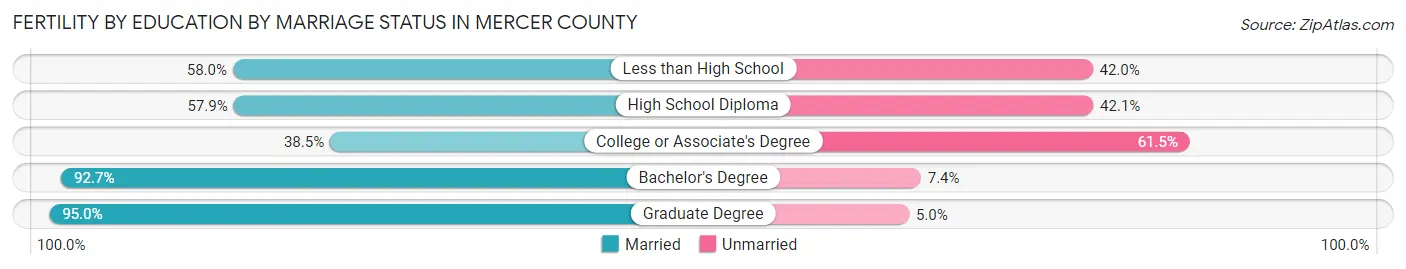
| Educational Attainment | Married | Unmarried |
| Less than High School | 249 (58.0%) | 180 (42.0%) |
| High School Diploma | 538 (57.9%) | 391 (42.1%) |
| College or Associate's Degree | 310 (38.5%) | 496 (61.5%) |
| Bachelor's Degree | 542 (92.6%) | 43 (7.3%) |
| Graduate Degree | 574 (95.0%) | 30 (5.0%) |
| Total | 2,213 (66.0%) | 1,140 (34.0%) |
Income in Mercer County
Income Overview in Mercer County
Per Capita Income in Mercer County is $50,053, while median incomes of families and households are $120,093 and $92,697 respectively.
| Characteristic | Number | Measure |
| Per Capita Income | 383,732 | $50,053 |
| Median Family Income | 91,742 | $120,093 |
| Mean Family Income | 91,742 | $164,874 |
| Median Household Income | 139,549 | $92,697 |
| Mean Household Income | 139,549 | $133,816 |
| Income Deficit | 91,742 | $10,935 |
| Wage / Income Gap (%) | 383,732 | 22.26% |
| Wage / Income Gap ($) | 383,732 | 77.74¢ per $1 |
| Gini / Inequality Index | 383,732 | 0.50 |
Earnings by Sex in Mercer County
Average Earnings in Mercer County are $47,012, $53,111 for men and $41,291 for women, a difference of 22.3%.
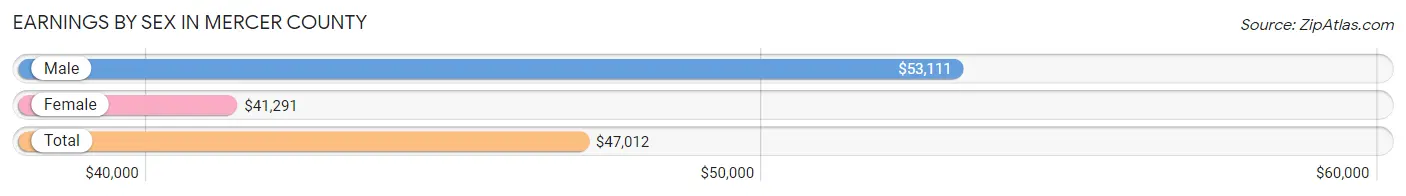
| Sex | Number | Average Earnings |
| Male | 109,494 (52.5%) | $53,111 |
| Female | 99,211 (47.5%) | $41,291 |
| Total | 208,705 (100.0%) | $47,012 |
Earnings by Sex by Income Bracket in Mercer County
The most common earnings brackets in Mercer County are $100,000+ for men (29,790 | 27.2%) and $100,000+ for women (15,567 | 15.7%).
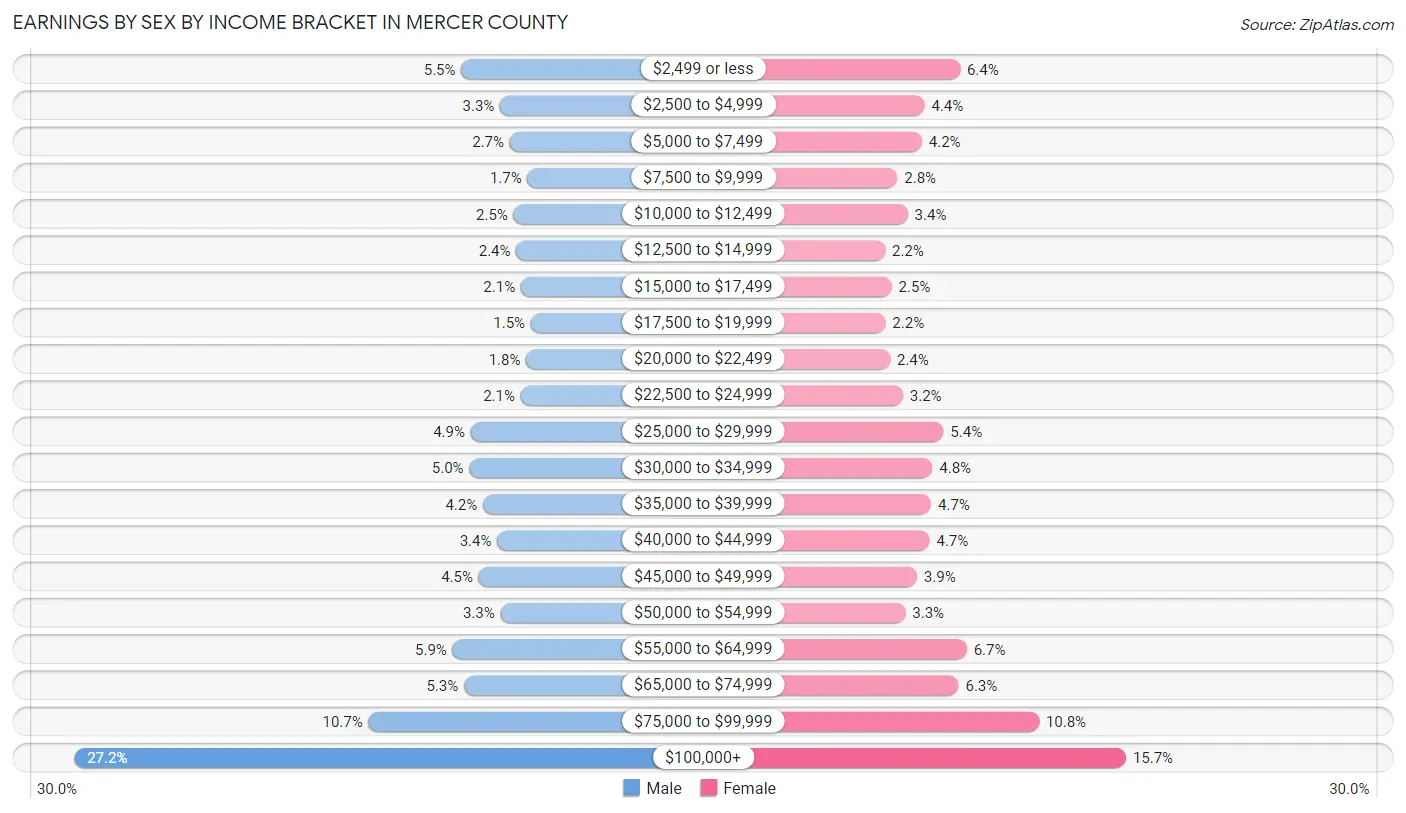
| Income | Male | Female |
| $2,499 or less | 5,967 (5.4%) | 6,312 (6.4%) |
| $2,500 to $4,999 | 3,575 (3.3%) | 4,332 (4.4%) |
| $5,000 to $7,499 | 2,994 (2.7%) | 4,184 (4.2%) |
| $7,500 to $9,999 | 1,889 (1.7%) | 2,814 (2.8%) |
| $10,000 to $12,499 | 2,748 (2.5%) | 3,395 (3.4%) |
| $12,500 to $14,999 | 2,581 (2.4%) | 2,132 (2.1%) |
| $15,000 to $17,499 | 2,298 (2.1%) | 2,501 (2.5%) |
| $17,500 to $19,999 | 1,689 (1.5%) | 2,153 (2.2%) |
| $20,000 to $22,499 | 1,969 (1.8%) | 2,406 (2.4%) |
| $22,500 to $24,999 | 2,305 (2.1%) | 3,128 (3.2%) |
| $25,000 to $29,999 | 5,384 (4.9%) | 5,389 (5.4%) |
| $30,000 to $34,999 | 5,477 (5.0%) | 4,769 (4.8%) |
| $35,000 to $39,999 | 4,633 (4.2%) | 4,704 (4.7%) |
| $40,000 to $44,999 | 3,759 (3.4%) | 4,613 (4.6%) |
| $45,000 to $49,999 | 4,892 (4.5%) | 3,912 (3.9%) |
| $50,000 to $54,999 | 3,560 (3.3%) | 3,263 (3.3%) |
| $55,000 to $64,999 | 6,499 (5.9%) | 6,688 (6.7%) |
| $65,000 to $74,999 | 5,804 (5.3%) | 6,234 (6.3%) |
| $75,000 to $99,999 | 11,681 (10.7%) | 10,715 (10.8%) |
| $100,000+ | 29,790 (27.2%) | 15,567 (15.7%) |
| Total | 109,494 (100.0%) | 99,211 (100.0%) |
Earnings by Sex by Educational Attainment in Mercer County
Average earnings in Mercer County are $64,982 for men and $50,863 for women, a difference of 21.7%. Men with an educational attainment of graduate degree enjoy the highest average annual earnings of $129,136, while those with less than high school education earn the least with $34,646. Women with an educational attainment of graduate degree earn the most with the average annual earnings of $88,426, while those with less than high school education have the smallest earnings of $25,709.
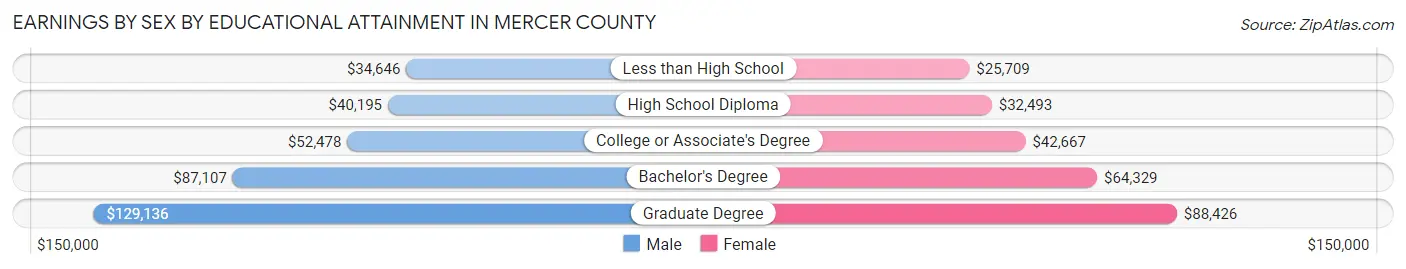
| Educational Attainment | Male Income | Female Income |
| Less than High School | $34,646 | $25,709 |
| High School Diploma | $40,195 | $32,493 |
| College or Associate's Degree | $52,478 | $42,667 |
| Bachelor's Degree | $87,107 | $64,329 |
| Graduate Degree | $129,136 | $88,426 |
| Total | $64,982 | $50,863 |
Family Income in Mercer County
Family Income Brackets in Mercer County
According to the Mercer County family income data, there are 23,211 families falling into the $200,000+ income range, which is the most common income bracket and makes up 25.3% of all families. Conversely, the $10,000 to $14,999 income bracket is the least frequent group with only 1,835 families (2.0%) belonging to this category.
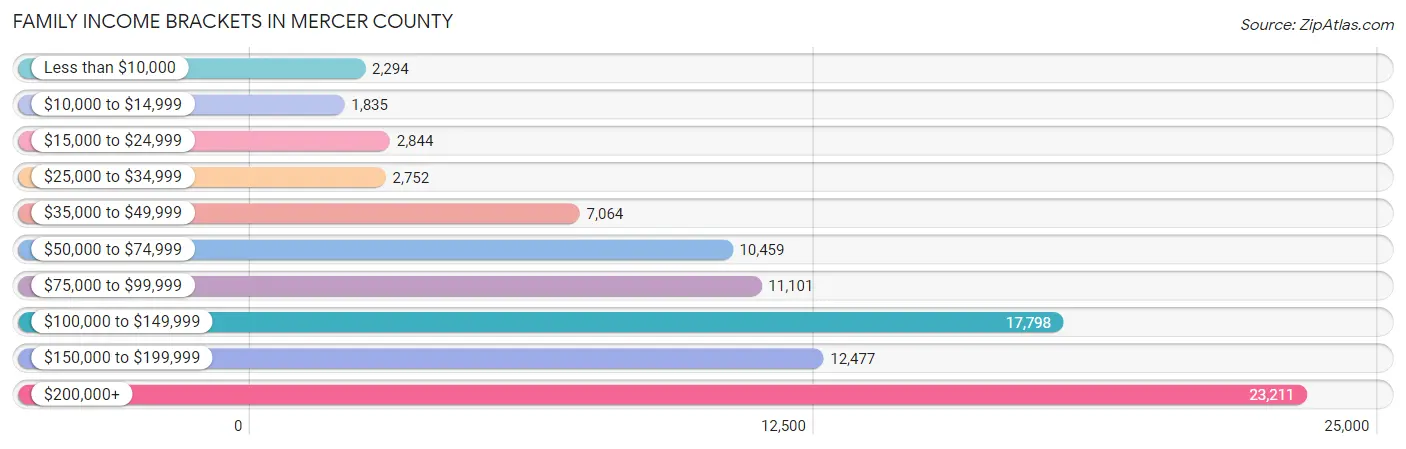
| Income Bracket | # Families | % Families |
| Less than $10,000 | 2,294 | 2.5% |
| $10,000 to $14,999 | 1,835 | 2.0% |
| $15,000 to $24,999 | 2,844 | 3.1% |
| $25,000 to $34,999 | 2,752 | 3.0% |
| $35,000 to $49,999 | 7,064 | 7.7% |
| $50,000 to $74,999 | 10,459 | 11.4% |
| $75,000 to $99,999 | 11,101 | 12.1% |
| $100,000 to $149,999 | 17,798 | 19.4% |
| $150,000 to $199,999 | 12,477 | 13.6% |
| $200,000+ | 23,211 | 25.3% |
Family Income by Famaliy Size in Mercer County
4-person families (20,742 | 22.6%) account for the highest median family income in Mercer County with $157,742 per family, while 2-person families (37,771 | 41.2%) have the highest median income of $48,934 per family member.
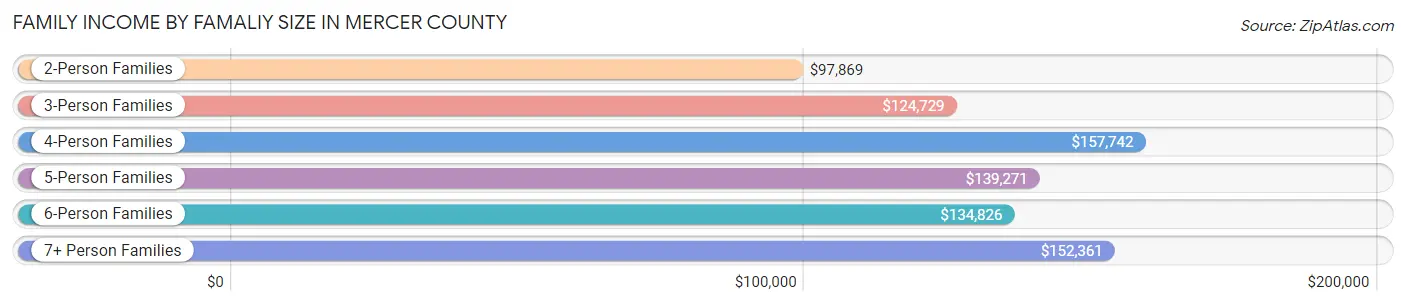
| Income Bracket | # Families | Median Income |
| 2-Person Families | 37,771 (41.2%) | $97,869 |
| 3-Person Families | 22,878 (24.9%) | $124,729 |
| 4-Person Families | 20,742 (22.6%) | $157,742 |
| 5-Person Families | 6,502 (7.1%) | $139,271 |
| 6-Person Families | 2,310 (2.5%) | $134,826 |
| 7+ Person Families | 1,539 (1.7%) | $152,361 |
| Total | 91,742 (100.0%) | $120,093 |
Family Income by Number of Earners in Mercer County
The median family income in Mercer County is $120,093, with families comprising 3+ earners (13,595) having the highest median family income of $180,640, while families with no earners (11,224) have the lowest median family income of $55,706, accounting for 14.8% and 12.2% of families, respectively.
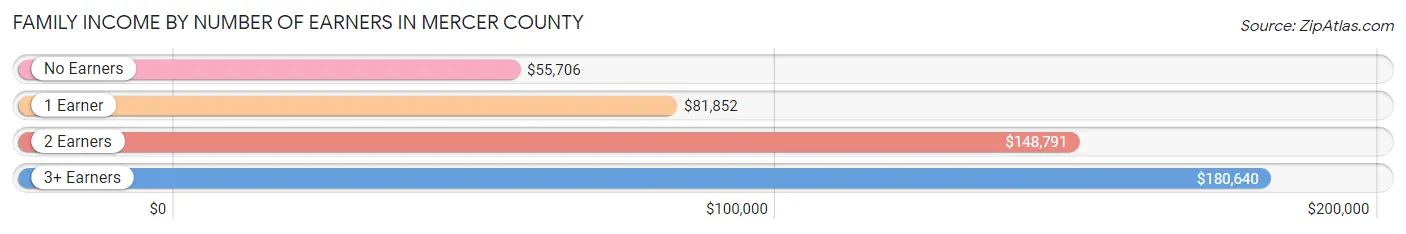
| Number of Earners | # Families | Median Income |
| No Earners | 11,224 (12.2%) | $55,706 |
| 1 Earner | 27,195 (29.6%) | $81,852 |
| 2 Earners | 39,728 (43.3%) | $148,791 |
| 3+ Earners | 13,595 (14.8%) | $180,640 |
| Total | 91,742 (100.0%) | $120,093 |
Household Income in Mercer County
Household Income Brackets in Mercer County
With 25,956 households falling in the category, the $200,000+ income range is the most frequent in Mercer County, accounting for 18.6% of all households. In contrast, only 5,722 households (4.1%) fall into the $10,000 to $14,999 income bracket, making it the least populous group.
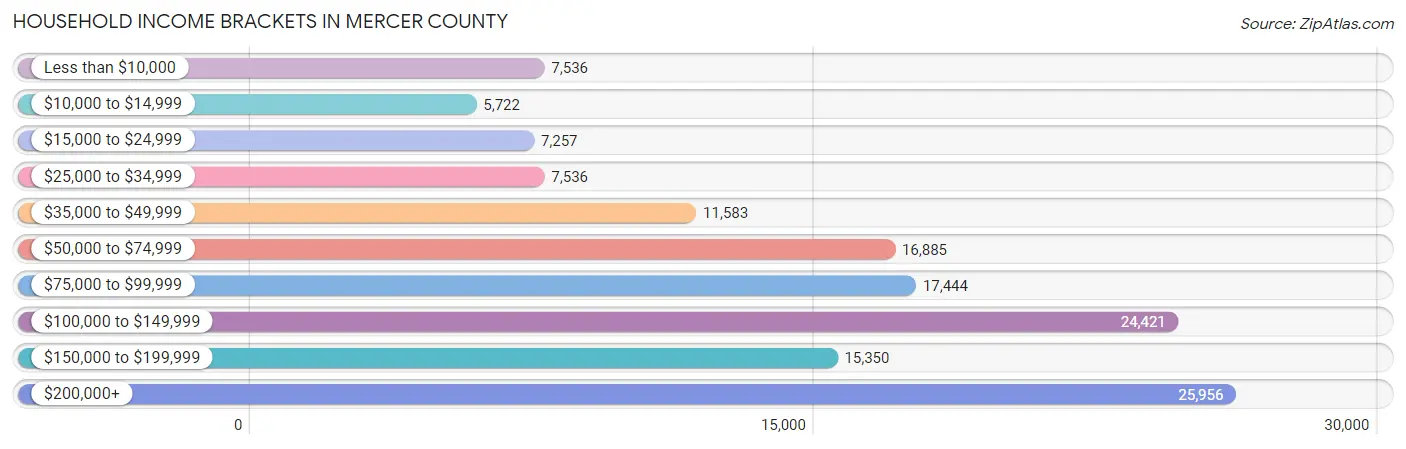
| Income Bracket | # Households | % Households |
| Less than $10,000 | 7,536 | 5.4% |
| $10,000 to $14,999 | 5,722 | 4.1% |
| $15,000 to $24,999 | 7,257 | 5.2% |
| $25,000 to $34,999 | 7,536 | 5.4% |
| $35,000 to $49,999 | 11,583 | 8.3% |
| $50,000 to $74,999 | 16,885 | 12.1% |
| $75,000 to $99,999 | 17,444 | 12.5% |
| $100,000 to $149,999 | 24,421 | 17.5% |
| $150,000 to $199,999 | 15,350 | 11.0% |
| $200,000+ | 25,956 | 18.6% |
Household Income by Householder Age in Mercer County
The median household income in Mercer County is $92,697, with the highest median household income of $115,800 found in the 45 to 64 years age bracket for the primary householder. A total of 57,469 households (41.2%) fall into this category. Meanwhile, the 15 to 24 years age bracket for the primary householder has the lowest median household income of $39,633, with 3,304 households (2.4%) in this group.
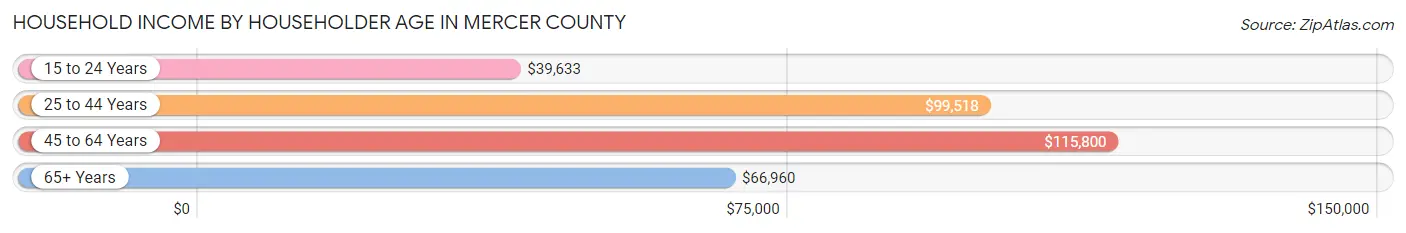
| Income Bracket | # Households | Median Income |
| 15 to 24 Years | 3,304 (2.4%) | $39,633 |
| 25 to 44 Years | 40,920 (29.3%) | $99,518 |
| 45 to 64 Years | 57,469 (41.2%) | $115,800 |
| 65+ Years | 37,856 (27.1%) | $66,960 |
| Total | 139,549 (100.0%) | $92,697 |
Poverty in Mercer County
Income Below Poverty by Sex and Age in Mercer County
With 9.7% poverty level for males and 12.7% for females among the residents of Mercer County, 15 year old males and 5 year old females are the most vulnerable to poverty, with 409 males (17.6%) and 397 females (18.1%) in their respective age groups living below the poverty level.
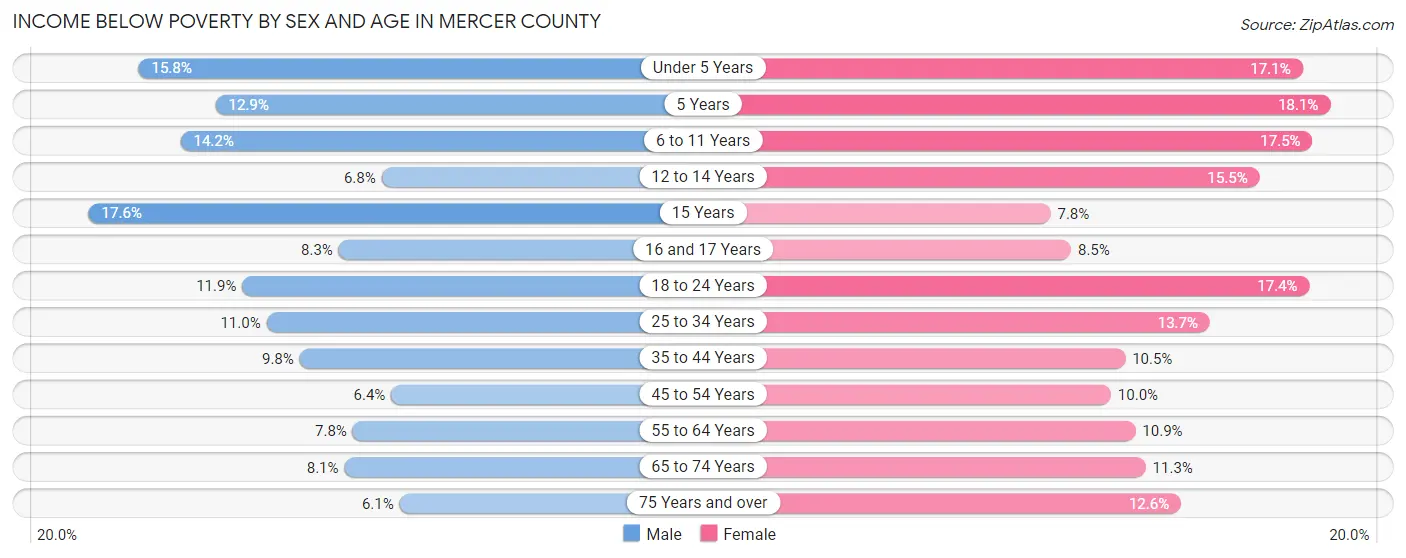
| Age Bracket | Male | Female |
| Under 5 Years | 1,691 (15.8%) | 1,741 (17.1%) |
| 5 Years | 289 (12.9%) | 397 (18.1%) |
| 6 to 11 Years | 2,038 (14.2%) | 2,323 (17.5%) |
| 12 to 14 Years | 478 (6.8%) | 1,064 (15.5%) |
| 15 Years | 409 (17.6%) | 181 (7.7%) |
| 16 and 17 Years | 432 (8.3%) | 406 (8.5%) |
| 18 to 24 Years | 1,841 (11.9%) | 2,472 (17.4%) |
| 25 to 34 Years | 2,560 (11.0%) | 3,074 (13.7%) |
| 35 to 44 Years | 2,373 (9.8%) | 2,563 (10.5%) |
| 45 to 54 Years | 1,637 (6.4%) | 2,619 (10.0%) |
| 55 to 64 Years | 1,921 (7.8%) | 2,806 (10.9%) |
| 65 to 74 Years | 1,292 (8.1%) | 2,077 (11.3%) |
| 75 Years and over | 583 (6.1%) | 1,812 (12.6%) |
| Total | 17,544 (9.7%) | 23,535 (12.7%) |
Income Above Poverty by Sex and Age in Mercer County
According to the poverty statistics in Mercer County, males aged 75 years and over and females aged 15 years are the age groups that are most secure financially, with 93.9% of males and 92.2% of females in these age groups living above the poverty line.
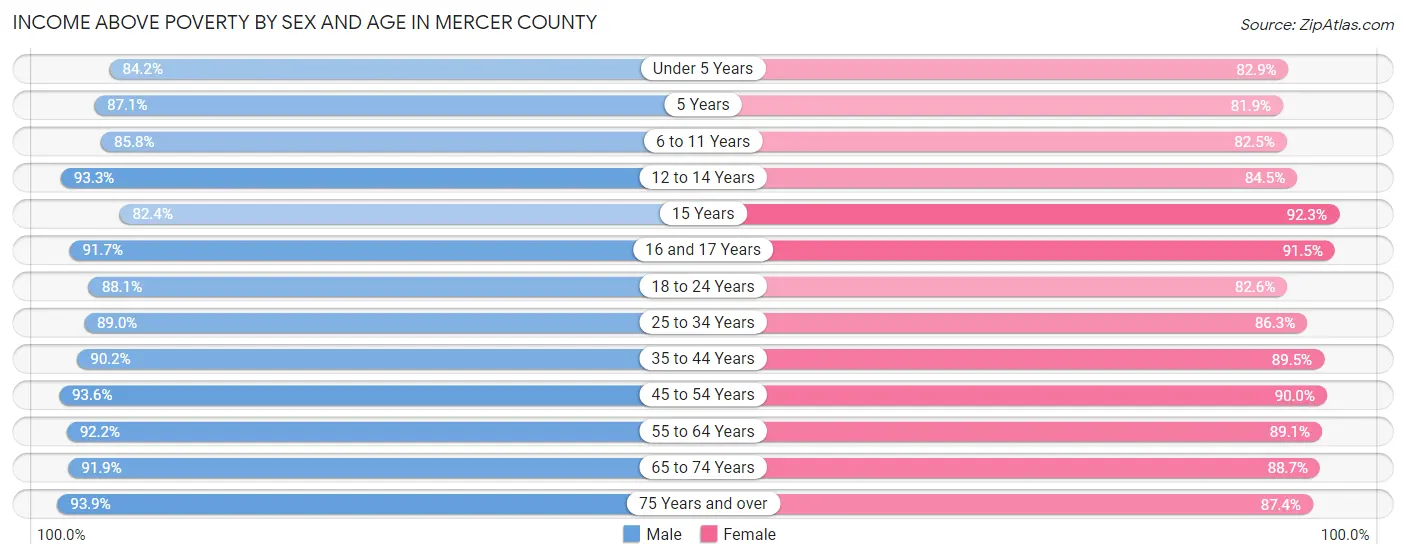
| Age Bracket | Male | Female |
| Under 5 Years | 9,032 (84.2%) | 8,441 (82.9%) |
| 5 Years | 1,950 (87.1%) | 1,793 (81.9%) |
| 6 to 11 Years | 12,299 (85.8%) | 10,975 (82.5%) |
| 12 to 14 Years | 6,604 (93.2%) | 5,797 (84.5%) |
| 15 Years | 1,912 (82.4%) | 2,155 (92.2%) |
| 16 and 17 Years | 4,750 (91.7%) | 4,363 (91.5%) |
| 18 to 24 Years | 13,605 (88.1%) | 11,766 (82.6%) |
| 25 to 34 Years | 20,673 (89.0%) | 19,437 (86.3%) |
| 35 to 44 Years | 21,869 (90.2%) | 21,790 (89.5%) |
| 45 to 54 Years | 23,987 (93.6%) | 23,592 (90.0%) |
| 55 to 64 Years | 22,645 (92.2%) | 22,948 (89.1%) |
| 65 to 74 Years | 14,603 (91.9%) | 16,336 (88.7%) |
| 75 Years and over | 9,011 (93.9%) | 12,581 (87.4%) |
| Total | 162,940 (90.3%) | 161,974 (87.3%) |
Income Below Poverty Among Married-Couple Families in Mercer County
The poverty statistics for married-couple families in Mercer County show that 3.1% or 2,075 of the total 66,422 families live below the poverty line. Families with 5 or more children have the highest poverty rate of 25.5%, comprising of 74 families. On the other hand, families with no children have the lowest poverty rate of 2.6%, which includes 959 families.
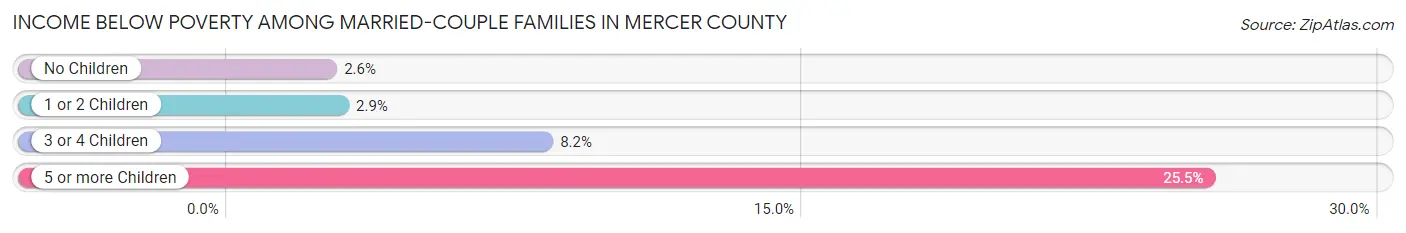
| Children | Above Poverty | Below Poverty |
| No Children | 36,128 (97.4%) | 959 (2.6%) |
| 1 or 2 Children | 24,570 (97.1%) | 734 (2.9%) |
| 3 or 4 Children | 3,433 (91.8%) | 308 (8.2%) |
| 5 or more Children | 216 (74.5%) | 74 (25.5%) |
| Total | 64,347 (96.9%) | 2,075 (3.1%) |
Income Below Poverty Among Single-Parent Households in Mercer County
According to the poverty data in Mercer County, 5.8% or 407 single-father households and 23.3% or 4,259 single-mother households are living below the poverty line. Among single-father households, those with 3 or 4 children have the highest poverty rate, with 50 households (22.9%) experiencing poverty. Likewise, among single-mother households, those with 3 or 4 children have the highest poverty rate, with 721 households (46.1%) falling below the poverty line.
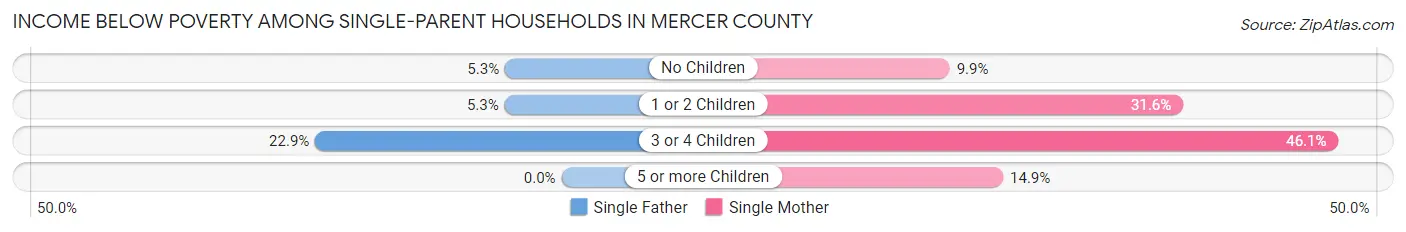
| Children | Single Father | Single Mother |
| No Children | 192 (5.3%) | 789 (9.9%) |
| 1 or 2 Children | 165 (5.3%) | 2,734 (31.6%) |
| 3 or 4 Children | 50 (22.9%) | 721 (46.1%) |
| 5 or more Children | 0 (0.0%) | 15 (14.8%) |
| Total | 407 (5.8%) | 4,259 (23.3%) |
Income Below Poverty Among Married-Couple vs Single-Parent Households in Mercer County
The poverty data for Mercer County shows that 2,075 of the married-couple family households (3.1%) and 4,666 of the single-parent households (18.4%) are living below the poverty level. Within the married-couple family households, those with 5 or more children have the highest poverty rate, with 74 households (25.5%) falling below the poverty line. Among the single-parent households, those with 3 or 4 children have the highest poverty rate, with 771 household (43.2%) living below poverty.
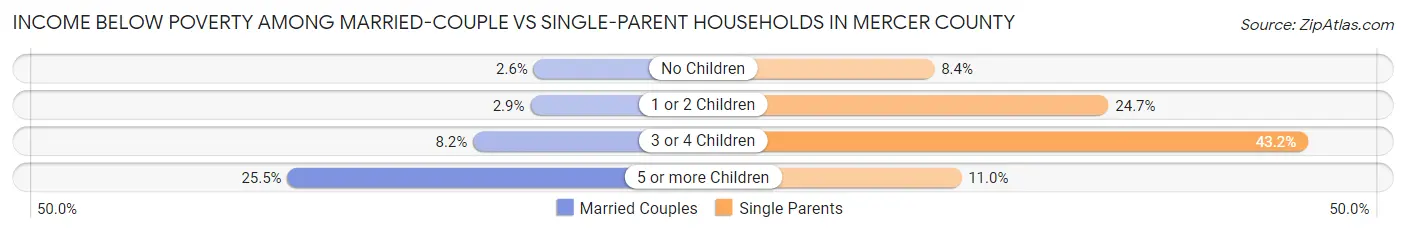
| Children | Married-Couple Families | Single-Parent Households |
| No Children | 959 (2.6%) | 981 (8.4%) |
| 1 or 2 Children | 734 (2.9%) | 2,899 (24.6%) |
| 3 or 4 Children | 308 (8.2%) | 771 (43.2%) |
| 5 or more Children | 74 (25.5%) | 15 (11.0%) |
| Total | 2,075 (3.1%) | 4,666 (18.4%) |
Employment Characteristics in Mercer County
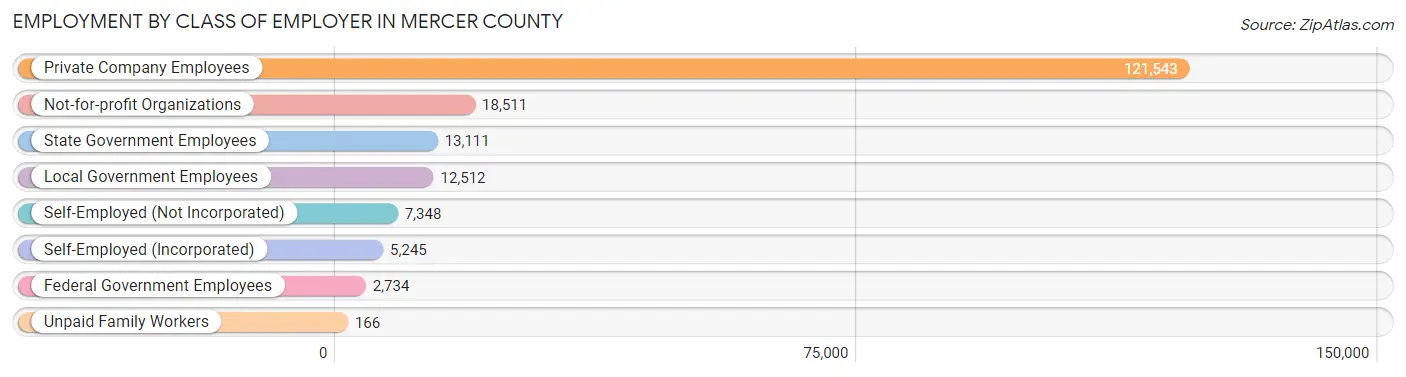
Employment by Class of Employer in Mercer County
Among the 181,170 employed individuals in Mercer County, private company employees (121,543 | 67.1%), not-for-profit organizations (18,511 | 10.2%), and state government employees (13,111 | 7.2%) make up the most common classes of employment.
| Employer Class | # Employees | % Employees |
| Private Company Employees | 121,543 | 67.1% |
| Self-Employed (Incorporated) | 5,245 | 2.9% |
| Self-Employed (Not Incorporated) | 7,348 | 4.1% |
| Not-for-profit Organizations | 18,511 | 10.2% |
| Local Government Employees | 12,512 | 6.9% |
| State Government Employees | 13,111 | 7.2% |
| Federal Government Employees | 2,734 | 1.5% |
| Unpaid Family Workers | 166 | 0.1% |
| Total | 181,170 | 100.0% |
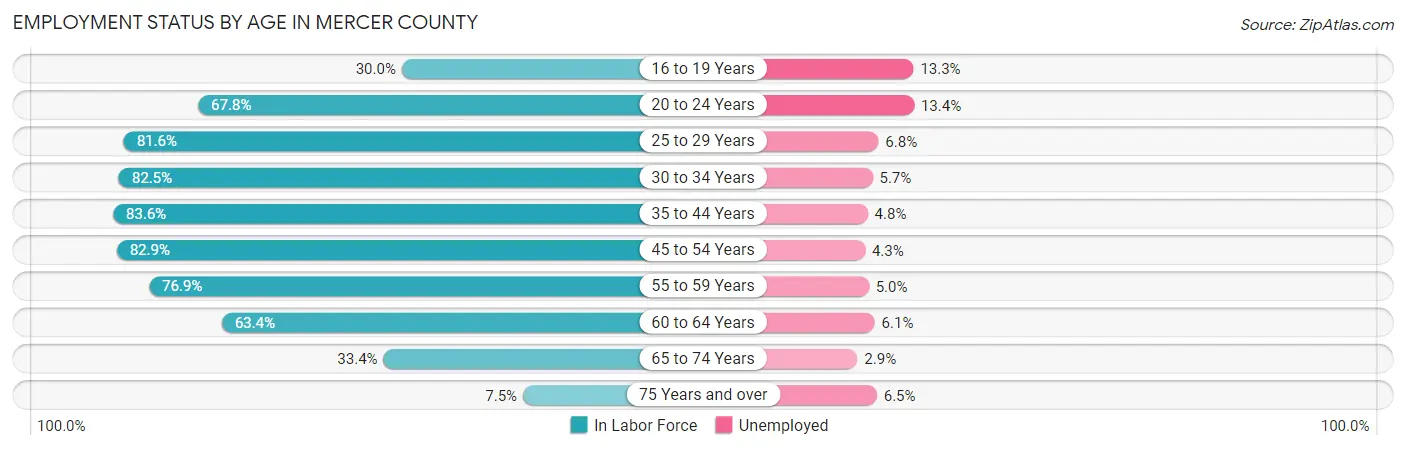
Employment Status by Age in Mercer County
According to the labor force statistics for Mercer County, out of the total population over 16 years of age (311,534), 63.8% or 198,759 individuals are in the labor force, with 6.1% or 12,124 of them unemployed. The age group with the highest labor force participation rate is 35 to 44 years, with 83.6% or 41,232 individuals in the labor force. Within the labor force, the 20 to 24 years age range has the highest percentage of unemployed individuals, with 13.4% or 2,554 of them being unemployed.
| Age Bracket | In Labor Force | Unemployed |
| 16 to 19 Years | 7,039 (30.0%) | 936 (13.3%) |
| 20 to 24 Years | 19,061 (67.8%) | 2,554 (13.4%) |
| 25 to 29 Years | 19,556 (81.6%) | 1,330 (6.8%) |
| 30 to 34 Years | 19,344 (82.5%) | 1,103 (5.7%) |
| 35 to 44 Years | 41,232 (83.6%) | 1,979 (4.8%) |
| 45 to 54 Years | 43,493 (82.9%) | 1,870 (4.3%) |
| 55 to 59 Years | 19,725 (76.9%) | 986 (5.0%) |
| 60 to 64 Years | 15,873 (63.4%) | 968 (6.1%) |
| 65 to 74 Years | 11,589 (33.4%) | 336 (2.9%) |
| 75 Years and over | 1,903 (7.5%) | 124 (6.5%) |
| Total | 198,759 (63.8%) | 12,124 (6.1%) |
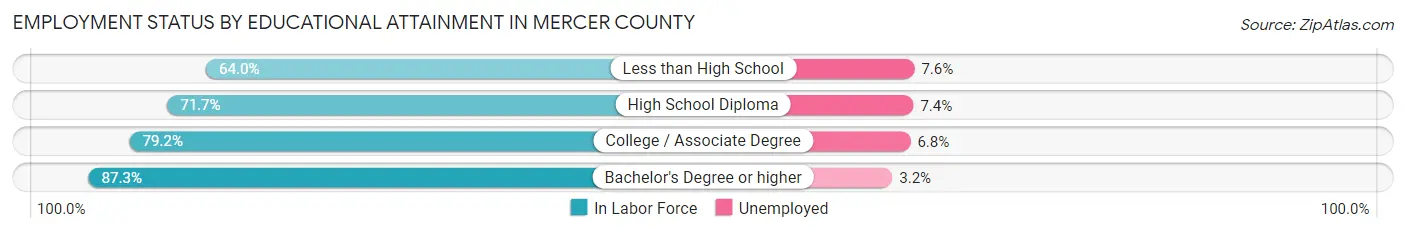
Employment Status by Educational Attainment in Mercer County
According to labor force statistics for Mercer County, 79.7% of individuals (159,308) out of the total population between 25 and 64 years of age (199,884) are in the labor force, with 5.2% or 8,284 of them being unemployed. The group with the highest labor force participation rate are those with the educational attainment of bachelor's degree or higher, with 87.3% or 80,266 individuals in the labor force. Within the labor force, individuals with less than high school education have the highest percentage of unemployment, with 7.6% or 963 of them being unemployed.
| Educational Attainment | In Labor Force | Unemployed |
| Less than High School | 12,673 (64.0%) | 1,505 (7.6%) |
| High School Diploma | 33,690 (71.7%) | 3,477 (7.4%) |
| College / Associate Degree | 32,592 (79.2%) | 2,798 (6.8%) |
| Bachelor's Degree or higher | 80,266 (87.3%) | 2,942 (3.2%) |
| Total | 159,308 (79.7%) | 10,394 (5.2%) |
Employment Occupations by Sex in Mercer County
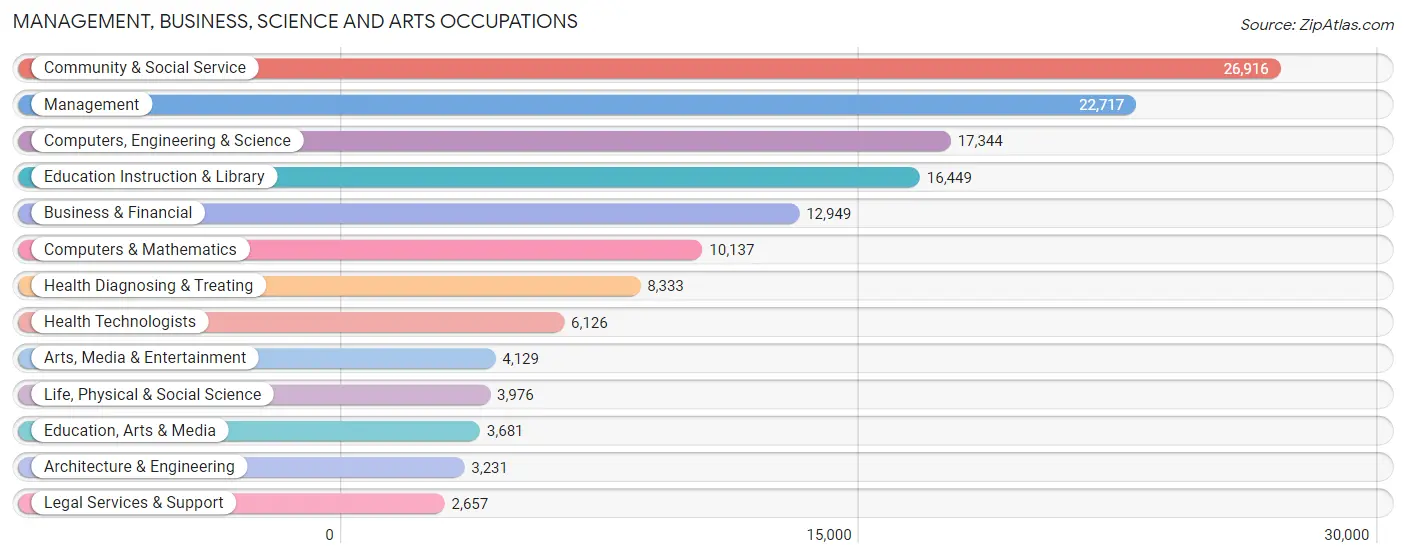
Management, Business, Science and Arts Occupations
The most common Management, Business, Science and Arts occupations in Mercer County are Community & Social Service (26,916 | 14.4%), Management (22,717 | 12.2%), Computers, Engineering & Science (17,344 | 9.3%), Education Instruction & Library (16,449 | 8.8%), and Business & Financial (12,949 | 6.9%).
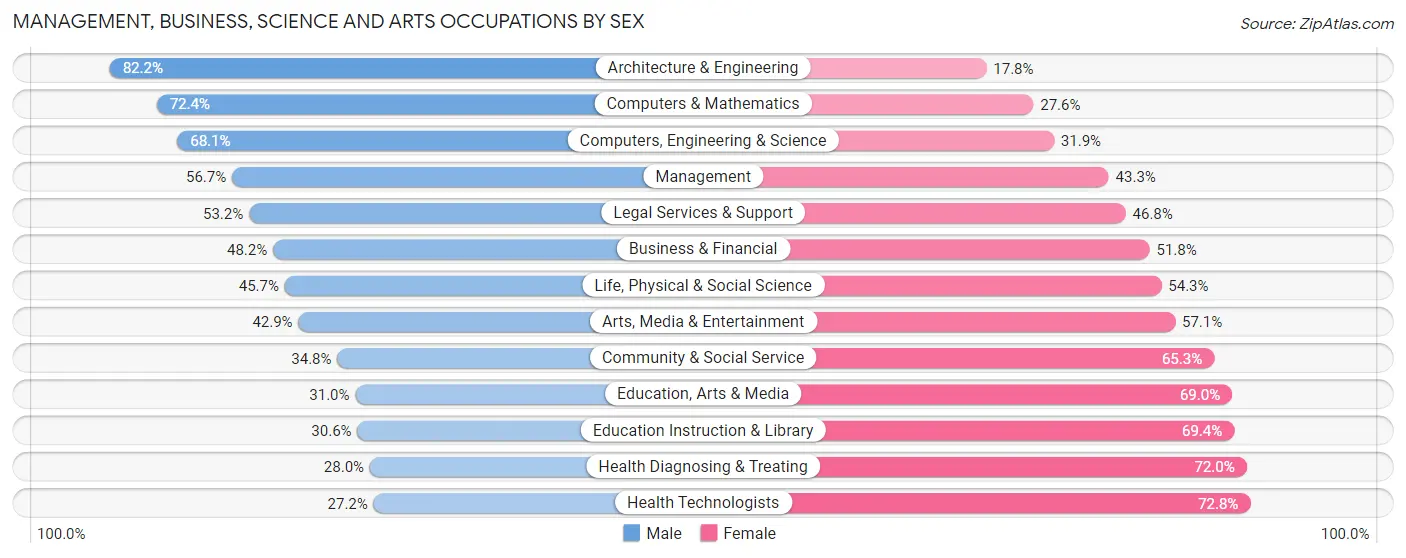
Management, Business, Science and Arts Occupations by Sex
Within the Management, Business, Science and Arts occupations in Mercer County, the most male-oriented occupations are Architecture & Engineering (82.2%), Computers & Mathematics (72.4%), and Computers, Engineering & Science (68.1%), while the most female-oriented occupations are Health Technologists (72.8%), Health Diagnosing & Treating (72.0%), and Education Instruction & Library (69.4%).
| Occupation | Male | Female |
| Management | 12,885 (56.7%) | 9,832 (43.3%) |
| Business & Financial | 6,239 (48.2%) | 6,710 (51.8%) |
| Computers, Engineering & Science | 11,818 (68.1%) | 5,526 (31.9%) |
| Computers & Mathematics | 7,343 (72.4%) | 2,794 (27.6%) |
| Architecture & Engineering | 2,657 (82.2%) | 574 (17.8%) |
| Life, Physical & Social Science | 1,818 (45.7%) | 2,158 (54.3%) |
| Community & Social Service | 9,352 (34.7%) | 17,564 (65.2%) |
| Education, Arts & Media | 1,141 (31.0%) | 2,540 (69.0%) |
| Legal Services & Support | 1,413 (53.2%) | 1,244 (46.8%) |
| Education Instruction & Library | 5,028 (30.6%) | 11,421 (69.4%) |
| Arts, Media & Entertainment | 1,770 (42.9%) | 2,359 (57.1%) |
| Health Diagnosing & Treating | 2,331 (28.0%) | 6,002 (72.0%) |
| Health Technologists | 1,666 (27.2%) | 4,460 (72.8%) |
| Total (Category) | 42,625 (48.3%) | 45,634 (51.7%) |
| Total (Overall) | 98,079 (52.6%) | 88,390 (47.4%) |
Services Occupations
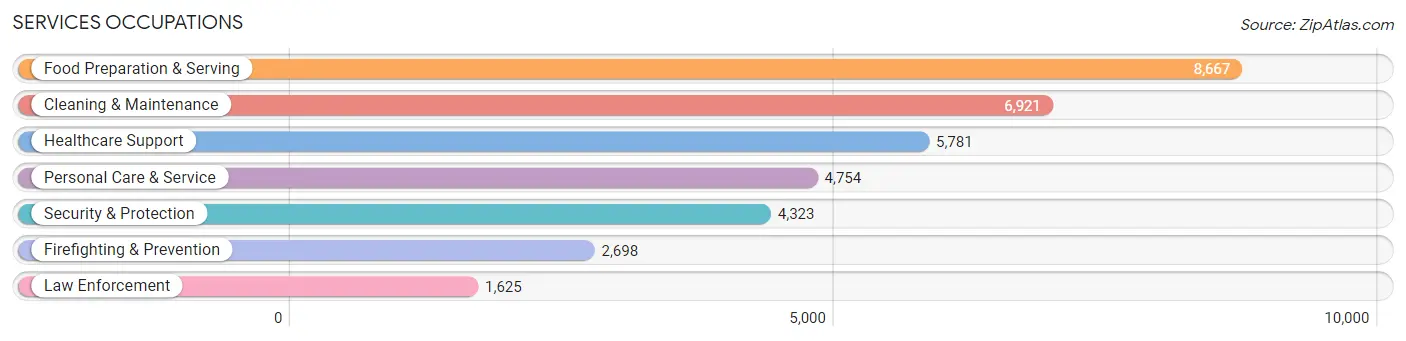
The most common Services occupations in Mercer County are Food Preparation & Serving (8,667 | 4.6%), Cleaning & Maintenance (6,921 | 3.7%), Healthcare Support (5,781 | 3.1%), Personal Care & Service (4,754 | 2.5%), and Security & Protection (4,323 | 2.3%).
Services Occupations by Sex
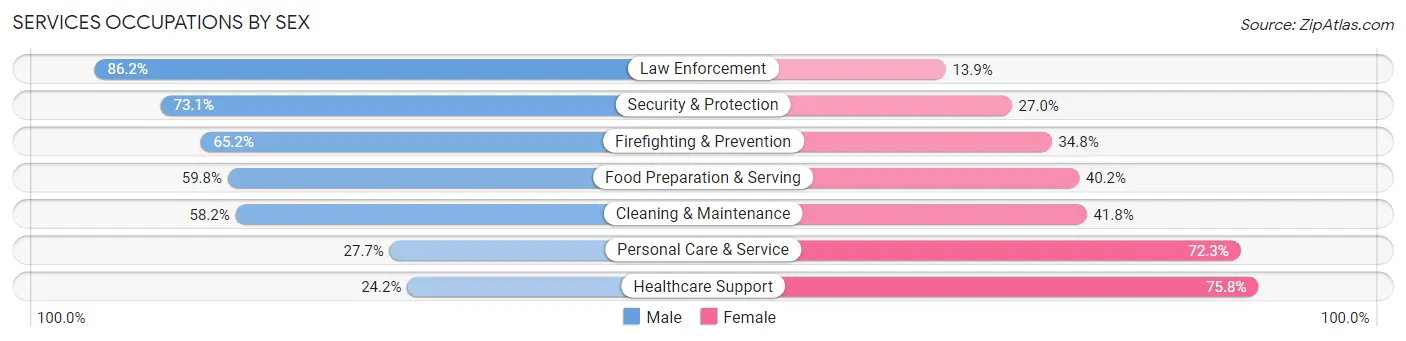
Within the Services occupations in Mercer County, the most male-oriented occupations are Law Enforcement (86.2%), Security & Protection (73.1%), and Firefighting & Prevention (65.2%), while the most female-oriented occupations are Healthcare Support (75.8%), Personal Care & Service (72.3%), and Cleaning & Maintenance (41.8%).
| Occupation | Male | Female |
| Healthcare Support | 1,401 (24.2%) | 4,380 (75.8%) |
| Security & Protection | 3,158 (73.1%) | 1,165 (27.0%) |
| Firefighting & Prevention | 1,758 (65.2%) | 940 (34.8%) |
| Law Enforcement | 1,400 (86.2%) | 225 (13.9%) |
| Food Preparation & Serving | 5,179 (59.8%) | 3,488 (40.2%) |
| Cleaning & Maintenance | 4,030 (58.2%) | 2,891 (41.8%) |
| Personal Care & Service | 1,318 (27.7%) | 3,436 (72.3%) |
| Total (Category) | 15,086 (49.5%) | 15,360 (50.4%) |
| Total (Overall) | 98,079 (52.6%) | 88,390 (47.4%) |
Sales and Office Occupations
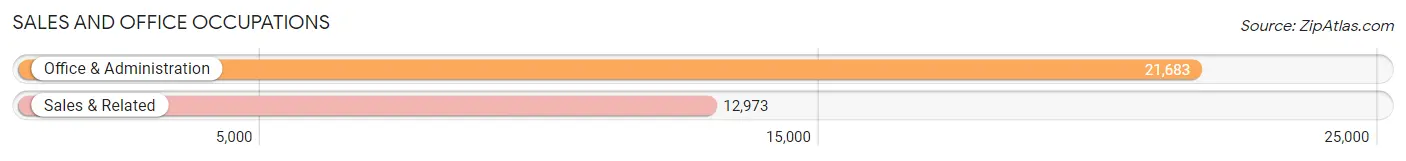
The most common Sales and Office occupations in Mercer County are Office & Administration (21,683 | 11.6%), and Sales & Related (12,973 | 7.0%).
Sales and Office Occupations by Sex
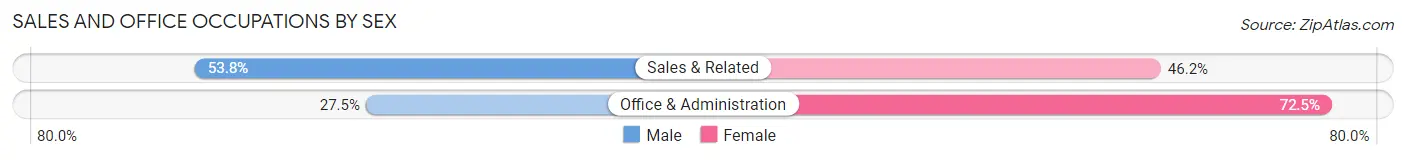
| Occupation | Male | Female |
| Sales & Related | 6,978 (53.8%) | 5,995 (46.2%) |
| Office & Administration | 5,965 (27.5%) | 15,718 (72.5%) |
| Total (Category) | 12,943 (37.3%) | 21,713 (62.6%) |
| Total (Overall) | 98,079 (52.6%) | 88,390 (47.4%) |
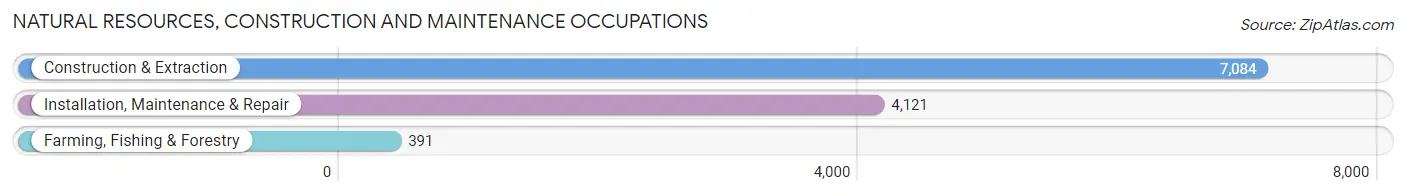
Natural Resources, Construction and Maintenance Occupations
The most common Natural Resources, Construction and Maintenance occupations in Mercer County are Construction & Extraction (7,084 | 3.8%), Installation, Maintenance & Repair (4,121 | 2.2%), and Farming, Fishing & Forestry (391 | 0.2%).
Natural Resources, Construction and Maintenance Occupations by Sex
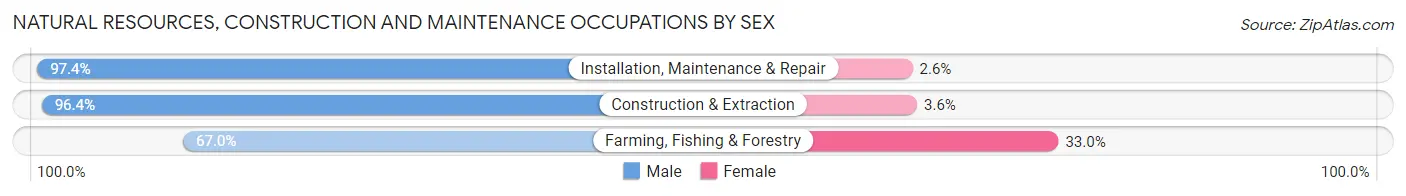
| Occupation | Male | Female |
| Farming, Fishing & Forestry | 262 (67.0%) | 129 (33.0%) |
| Construction & Extraction | 6,831 (96.4%) | 253 (3.6%) |
| Installation, Maintenance & Repair | 4,012 (97.4%) | 109 (2.6%) |
| Total (Category) | 11,105 (95.8%) | 491 (4.2%) |
| Total (Overall) | 98,079 (52.6%) | 88,390 (47.4%) |
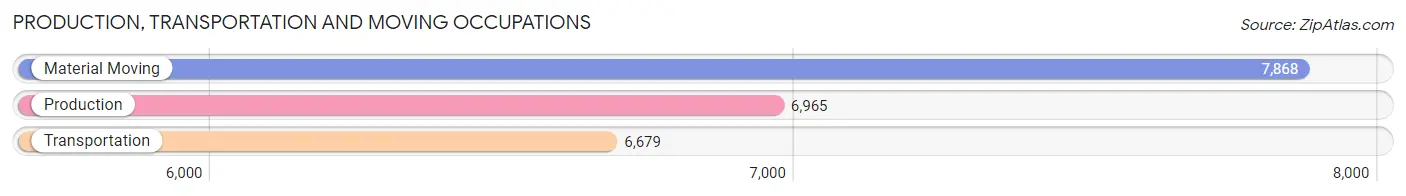
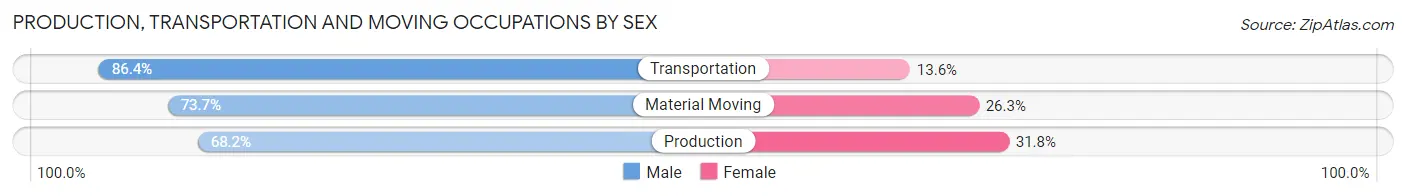
Production, Transportation and Moving Occupations
The most common Production, Transportation and Moving occupations in Mercer County are Material Moving (7,868 | 4.2%), Production (6,965 | 3.7%), and Transportation (6,679 | 3.6%).
Production, Transportation and Moving Occupations by Sex
| Occupation | Male | Female |
| Production | 4,751 (68.2%) | 2,214 (31.8%) |
| Transportation | 5,768 (86.4%) | 911 (13.6%) |
| Material Moving | 5,801 (73.7%) | 2,067 (26.3%) |
| Total (Category) | 16,320 (75.9%) | 5,192 (24.1%) |
| Total (Overall) | 98,079 (52.6%) | 88,390 (47.4%) |
Employment Industries by Sex in Mercer County
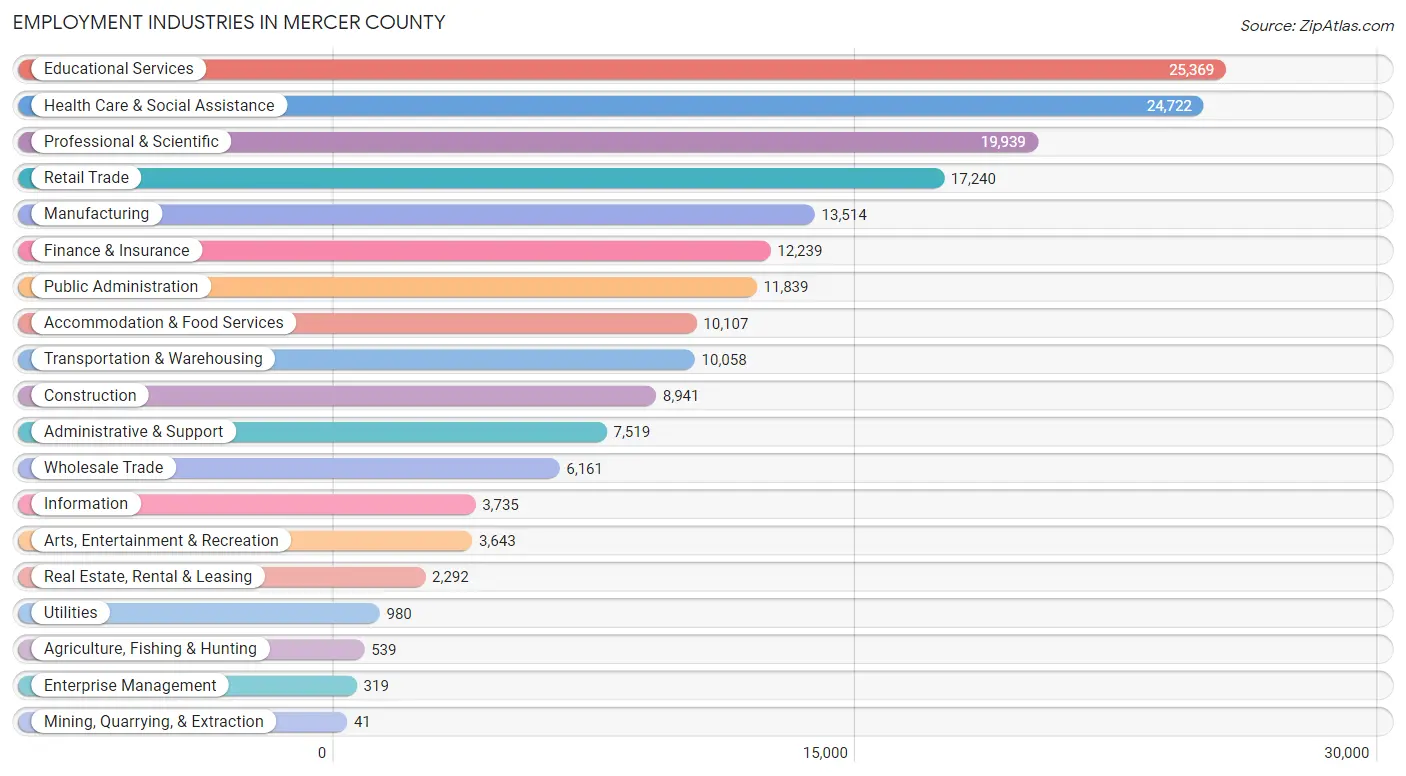
Employment Industries in Mercer County
The major employment industries in Mercer County include Educational Services (25,369 | 13.6%), Health Care & Social Assistance (24,722 | 13.3%), Professional & Scientific (19,939 | 10.7%), Retail Trade (17,240 | 9.2%), and Manufacturing (13,514 | 7.2%).
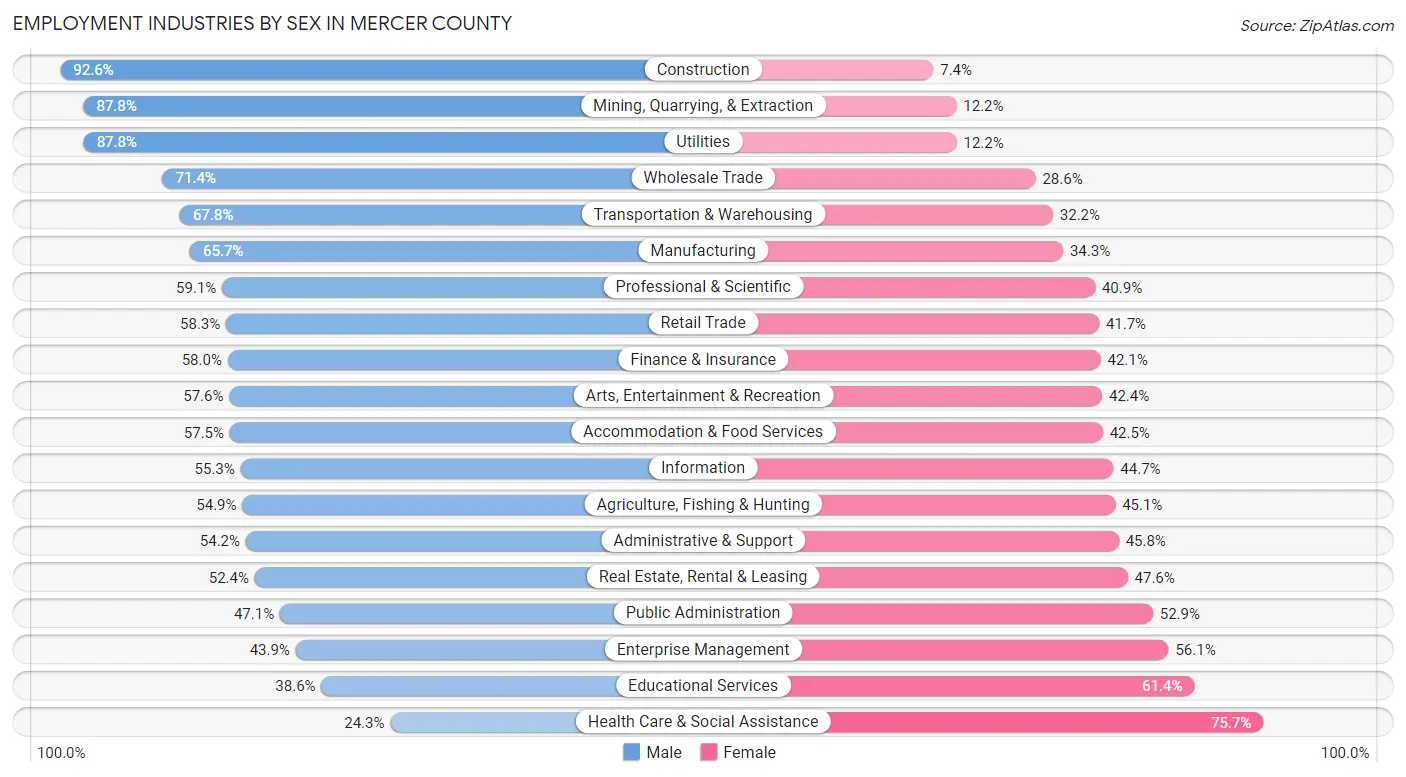
Employment Industries by Sex in Mercer County
The Mercer County industries that see more men than women are Construction (92.6%), Mining, Quarrying, & Extraction (87.8%), and Utilities (87.8%), whereas the industries that tend to have a higher number of women are Health Care & Social Assistance (75.7%), Educational Services (61.4%), and Enterprise Management (56.1%).
| Industry | Male | Female |
| Agriculture, Fishing & Hunting | 296 (54.9%) | 243 (45.1%) |
| Mining, Quarrying, & Extraction | 36 (87.8%) | 5 (12.2%) |
| Construction | 8,278 (92.6%) | 663 (7.4%) |
| Manufacturing | 8,883 (65.7%) | 4,631 (34.3%) |
| Wholesale Trade | 4,400 (71.4%) | 1,761 (28.6%) |
| Retail Trade | 10,050 (58.3%) | 7,190 (41.7%) |
| Transportation & Warehousing | 6,822 (67.8%) | 3,236 (32.2%) |
| Utilities | 860 (87.8%) | 120 (12.2%) |
| Information | 2,065 (55.3%) | 1,670 (44.7%) |
| Finance & Insurance | 7,092 (58.0%) | 5,147 (42.0%) |
| Real Estate, Rental & Leasing | 1,200 (52.4%) | 1,092 (47.6%) |
| Professional & Scientific | 11,785 (59.1%) | 8,154 (40.9%) |
| Enterprise Management | 140 (43.9%) | 179 (56.1%) |
| Administrative & Support | 4,075 (54.2%) | 3,444 (45.8%) |
| Educational Services | 9,783 (38.6%) | 15,586 (61.4%) |
| Health Care & Social Assistance | 6,007 (24.3%) | 18,715 (75.7%) |
| Arts, Entertainment & Recreation | 2,100 (57.6%) | 1,543 (42.4%) |
| Accommodation & Food Services | 5,813 (57.5%) | 4,294 (42.5%) |
| Public Administration | 5,581 (47.1%) | 6,258 (52.9%) |
| Total | 98,079 (52.6%) | 88,390 (47.4%) |
Education in Mercer County
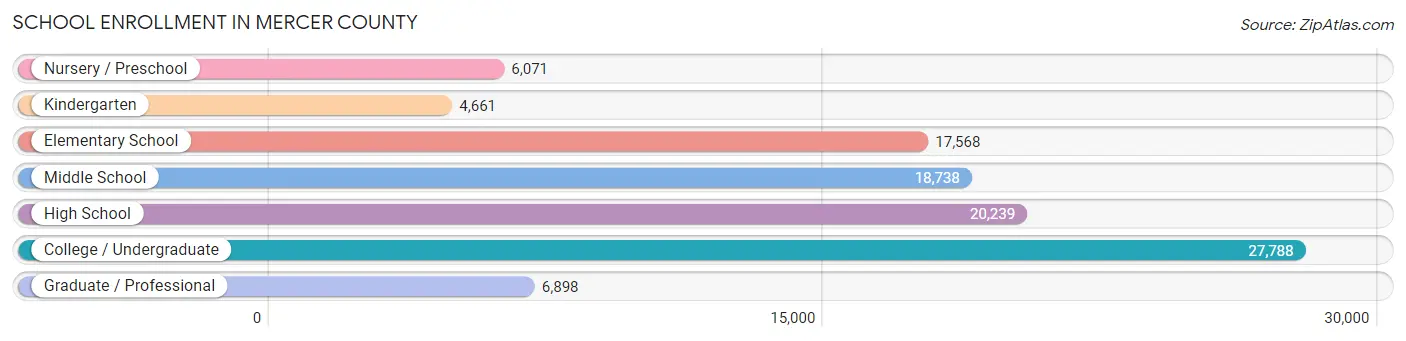
School Enrollment in Mercer County
The most common levels of schooling among the 101,963 students in Mercer County are college / undergraduate (27,788 | 27.3%), high school (20,239 | 19.9%), and middle school (18,738 | 18.4%).
| School Level | # Students | % Students |
| Nursery / Preschool | 6,071 | 5.9% |
| Kindergarten | 4,661 | 4.6% |
| Elementary School | 17,568 | 17.2% |
| Middle School | 18,738 | 18.4% |
| High School | 20,239 | 19.9% |
| College / Undergraduate | 27,788 | 27.3% |
| Graduate / Professional | 6,898 | 6.8% |
| Total | 101,963 | 100.0% |
School Enrollment by Age by Funding Source in Mercer County
Out of a total of 101,963 students who are enrolled in schools in Mercer County, 23,859 (23.4%) attend a private institution, while the remaining 78,104 (76.6%) are enrolled in public schools. The age group of 25 to 34 year olds has the highest likelihood of being enrolled in private schools, with 2,642 (52.1% in the age bracket) enrolled. Conversely, the age group of 10 to 14 year olds has the lowest likelihood of being enrolled in a private school, with 22,100 (92.7% in the age bracket) attending a public institution.
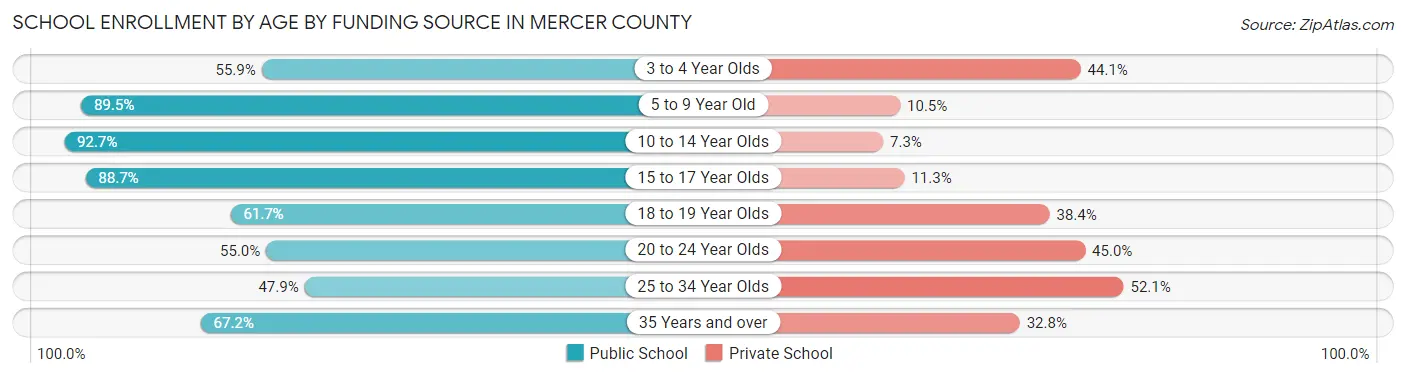
| Age Bracket | Public School | Private School |
| 3 to 4 Year Olds | 2,991 (55.9%) | 2,363 (44.1%) |
| 5 to 9 Year Old | 18,413 (89.5%) | 2,162 (10.5%) |
| 10 to 14 Year Olds | 22,100 (92.7%) | 1,750 (7.3%) |
| 15 to 17 Year Olds | 12,921 (88.7%) | 1,651 (11.3%) |
| 18 to 19 Year Olds | 7,336 (61.7%) | 4,564 (38.4%) |
| 20 to 24 Year Olds | 8,671 (55.0%) | 7,088 (45.0%) |
| 25 to 34 Year Olds | 2,426 (47.9%) | 2,642 (52.1%) |
| 35 Years and over | 3,283 (67.2%) | 1,602 (32.8%) |
| Total | 78,104 (76.6%) | 23,859 (23.4%) |
Educational Attainment by Field of Study in Mercer County
Business (22,295 | 18.0%), social sciences (11,844 | 9.6%), engineering (11,792 | 9.5%), education (10,271 | 8.3%), and computers & mathematics (8,601 | 7.0%) are the most common fields of study among 123,694 individuals in Mercer County who have obtained a bachelor's degree or higher.
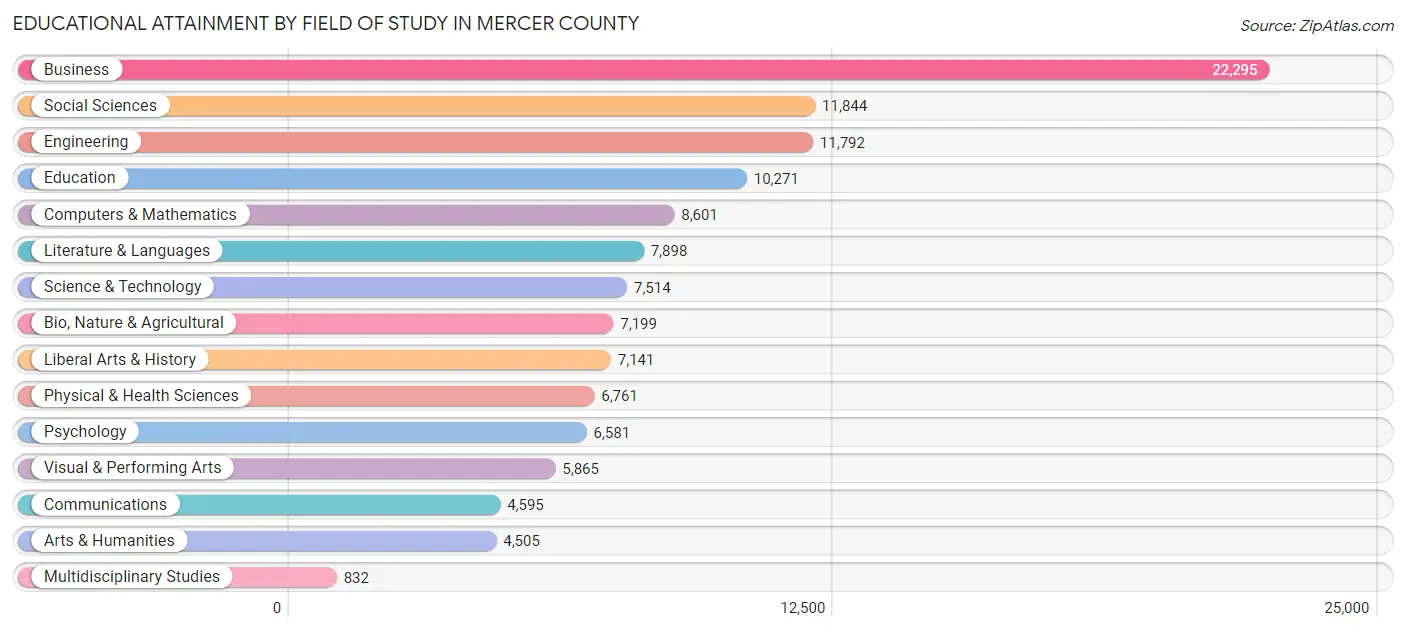
| Field of Study | # Graduates | % Graduates |
| Computers & Mathematics | 8,601 | 7.0% |
| Bio, Nature & Agricultural | 7,199 | 5.8% |
| Physical & Health Sciences | 6,761 | 5.5% |
| Psychology | 6,581 | 5.3% |
| Social Sciences | 11,844 | 9.6% |
| Engineering | 11,792 | 9.5% |
| Multidisciplinary Studies | 832 | 0.7% |
| Science & Technology | 7,514 | 6.1% |
| Business | 22,295 | 18.0% |
| Education | 10,271 | 8.3% |
| Literature & Languages | 7,898 | 6.4% |
| Liberal Arts & History | 7,141 | 5.8% |
| Visual & Performing Arts | 5,865 | 4.7% |
| Communications | 4,595 | 3.7% |
| Arts & Humanities | 4,505 | 3.6% |
| Total | 123,694 | 100.0% |
Transportation & Commute in Mercer County
Vehicle Availability by Sex in Mercer County
The most prevalent vehicle ownership categories in Mercer County are males with 2 vehicles (38,403, accounting for 40.7%) and females with 2 vehicles (33,970, making up 46.5%).
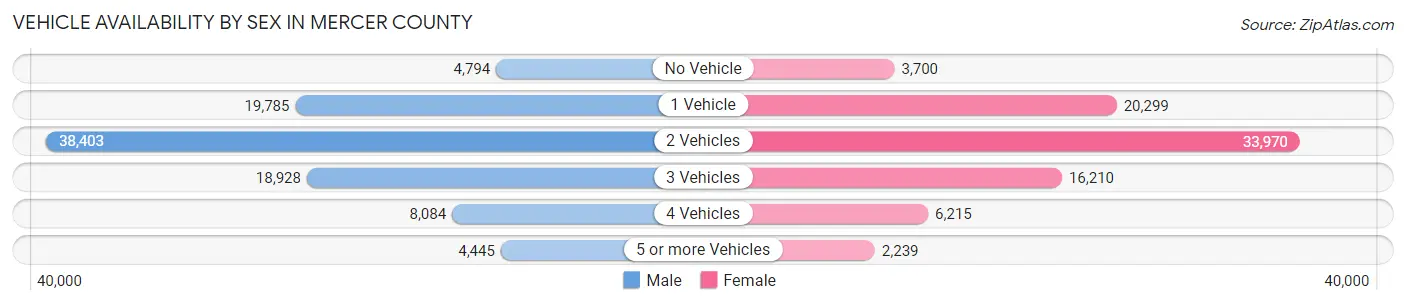
| Vehicles Available | Male | Female |
| No Vehicle | 4,794 (5.1%) | 3,700 (4.5%) |
| 1 Vehicle | 19,785 (20.9%) | 20,299 (24.6%) |
| 2 Vehicles | 38,403 (40.7%) | 33,970 (41.1%) |
| 3 Vehicles | 18,928 (20.0%) | 16,210 (19.6%) |
| 4 Vehicles | 8,084 (8.6%) | 6,215 (7.5%) |
| 5 or more Vehicles | 4,445 (4.7%) | 2,239 (2.7%) |
| Total | 94,439 (100.0%) | 82,633 (100.0%) |
Commute Time in Mercer County
The most frequently occuring commute durations in Mercer County are 15 to 19 minutes (26,924 commuters, 17.6%), 20 to 24 minutes (23,705 commuters, 15.5%), and 10 to 14 minutes (23,099 commuters, 15.1%).
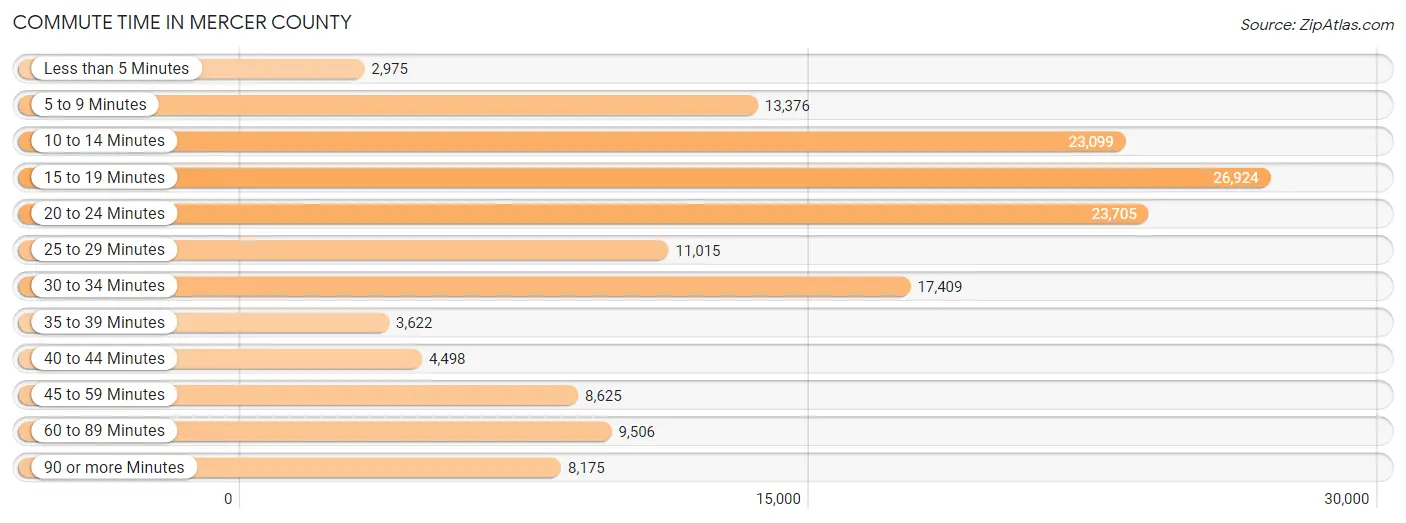
| Commute Time | # Commuters | % Commuters |
| Less than 5 Minutes | 2,975 | 1.9% |
| 5 to 9 Minutes | 13,376 | 8.7% |
| 10 to 14 Minutes | 23,099 | 15.1% |
| 15 to 19 Minutes | 26,924 | 17.6% |
| 20 to 24 Minutes | 23,705 | 15.5% |
| 25 to 29 Minutes | 11,015 | 7.2% |
| 30 to 34 Minutes | 17,409 | 11.4% |
| 35 to 39 Minutes | 3,622 | 2.4% |
| 40 to 44 Minutes | 4,498 | 2.9% |
| 45 to 59 Minutes | 8,625 | 5.6% |
| 60 to 89 Minutes | 9,506 | 6.2% |
| 90 or more Minutes | 8,175 | 5.3% |
Commute Time by Sex in Mercer County
The most common commute times in Mercer County are 15 to 19 minutes (13,752 commuters, 16.9%) for males and 15 to 19 minutes (13,172 commuters, 18.4%) for females.
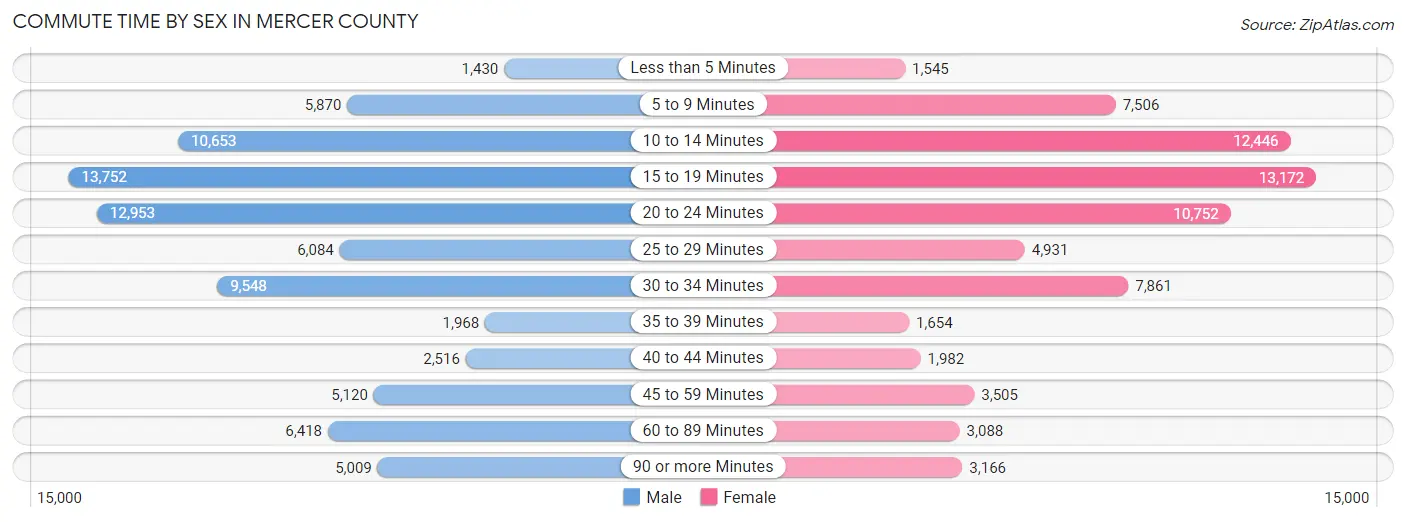
| Commute Time | Male | Female |
| Less than 5 Minutes | 1,430 (1.8%) | 1,545 (2.2%) |
| 5 to 9 Minutes | 5,870 (7.2%) | 7,506 (10.5%) |
| 10 to 14 Minutes | 10,653 (13.1%) | 12,446 (17.4%) |
| 15 to 19 Minutes | 13,752 (16.9%) | 13,172 (18.4%) |
| 20 to 24 Minutes | 12,953 (15.9%) | 10,752 (15.0%) |
| 25 to 29 Minutes | 6,084 (7.5%) | 4,931 (6.9%) |
| 30 to 34 Minutes | 9,548 (11.7%) | 7,861 (11.0%) |
| 35 to 39 Minutes | 1,968 (2.4%) | 1,654 (2.3%) |
| 40 to 44 Minutes | 2,516 (3.1%) | 1,982 (2.8%) |
| 45 to 59 Minutes | 5,120 (6.3%) | 3,505 (4.9%) |
| 60 to 89 Minutes | 6,418 (7.9%) | 3,088 (4.3%) |
| 90 or more Minutes | 5,009 (6.2%) | 3,166 (4.4%) |
Time of Departure to Work by Sex in Mercer County
The most frequent times of departure to work in Mercer County are 7:00 AM to 7:29 AM (12,363, 15.2%) for males and 8:00 AM to 8:29 AM (12,916, 18.0%) for females.
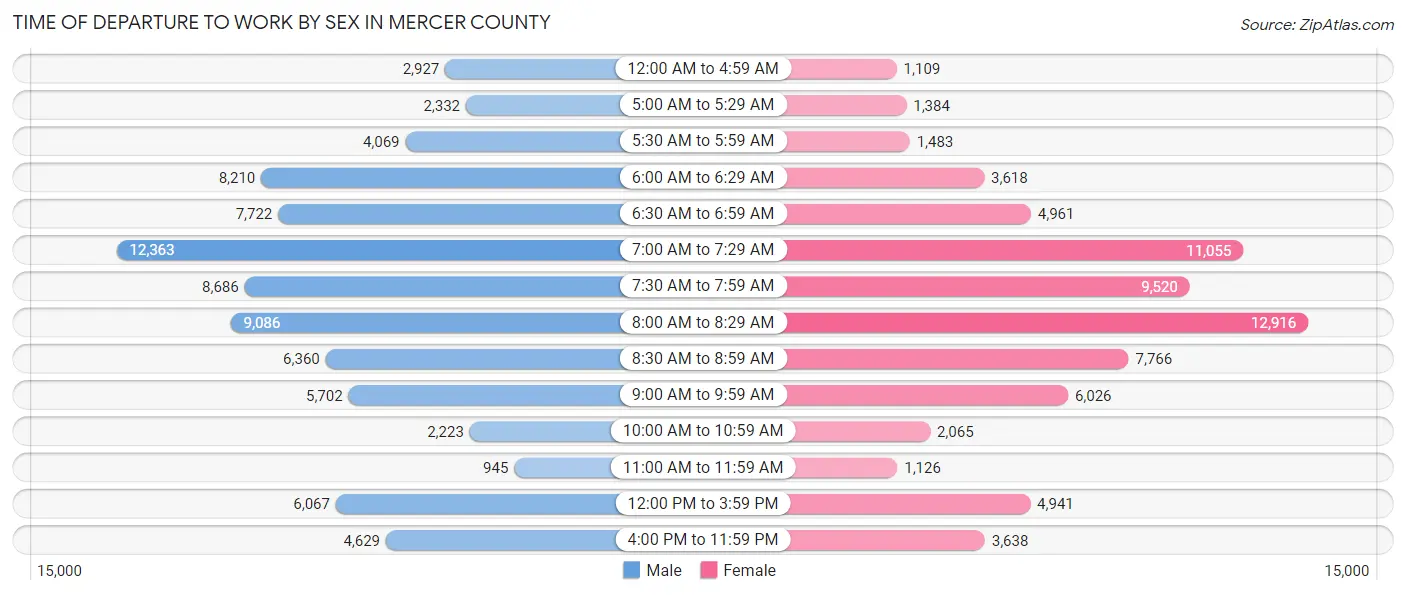
| Time of Departure | Male | Female |
| 12:00 AM to 4:59 AM | 2,927 (3.6%) | 1,109 (1.5%) |
| 5:00 AM to 5:29 AM | 2,332 (2.9%) | 1,384 (1.9%) |
| 5:30 AM to 5:59 AM | 4,069 (5.0%) | 1,483 (2.1%) |
| 6:00 AM to 6:29 AM | 8,210 (10.1%) | 3,618 (5.1%) |
| 6:30 AM to 6:59 AM | 7,722 (9.5%) | 4,961 (6.9%) |
| 7:00 AM to 7:29 AM | 12,363 (15.2%) | 11,055 (15.4%) |
| 7:30 AM to 7:59 AM | 8,686 (10.7%) | 9,520 (13.3%) |
| 8:00 AM to 8:29 AM | 9,086 (11.2%) | 12,916 (18.0%) |
| 8:30 AM to 8:59 AM | 6,360 (7.8%) | 7,766 (10.8%) |
| 9:00 AM to 9:59 AM | 5,702 (7.0%) | 6,026 (8.4%) |
| 10:00 AM to 10:59 AM | 2,223 (2.7%) | 2,065 (2.9%) |
| 11:00 AM to 11:59 AM | 945 (1.2%) | 1,126 (1.6%) |
| 12:00 PM to 3:59 PM | 6,067 (7.5%) | 4,941 (6.9%) |
| 4:00 PM to 11:59 PM | 4,629 (5.7%) | 3,638 (5.1%) |
| Total | 81,321 (100.0%) | 71,608 (100.0%) |
Housing Occupancy in Mercer County
Occupancy by Ownership in Mercer County
Of the total 139,549 dwellings in Mercer County, owner-occupied units account for 87,635 (62.8%), while renter-occupied units make up 51,914 (37.2%).
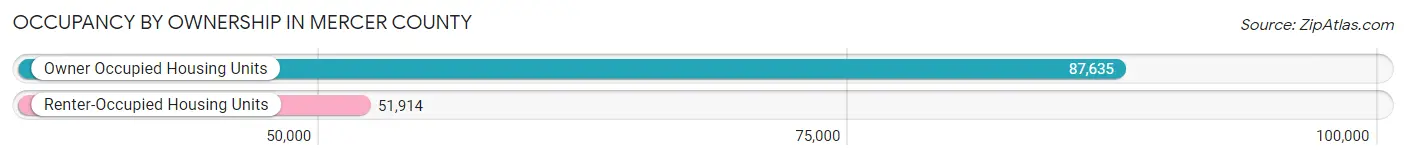
| Occupancy | # Housing Units | % Housing Units |
| Owner Occupied Housing Units | 87,635 | 62.8% |
| Renter-Occupied Housing Units | 51,914 | 37.2% |
| Total Occupied Housing Units | 139,549 | 100.0% |
Occupancy by Household Size in Mercer County
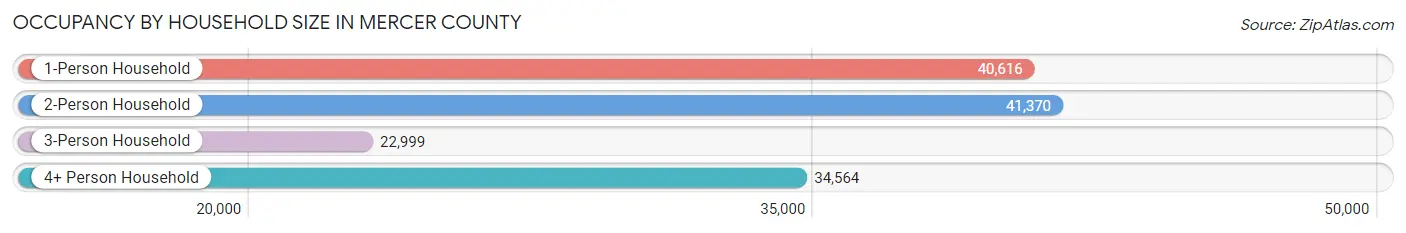
| Household Size | # Housing Units | % Housing Units |
| 1-Person Household | 40,616 | 29.1% |
| 2-Person Household | 41,370 | 29.6% |
| 3-Person Household | 22,999 | 16.5% |
| 4+ Person Household | 34,564 | 24.8% |
| Total Housing Units | 139,549 | 100.0% |
Occupancy by Ownership by Household Size in Mercer County
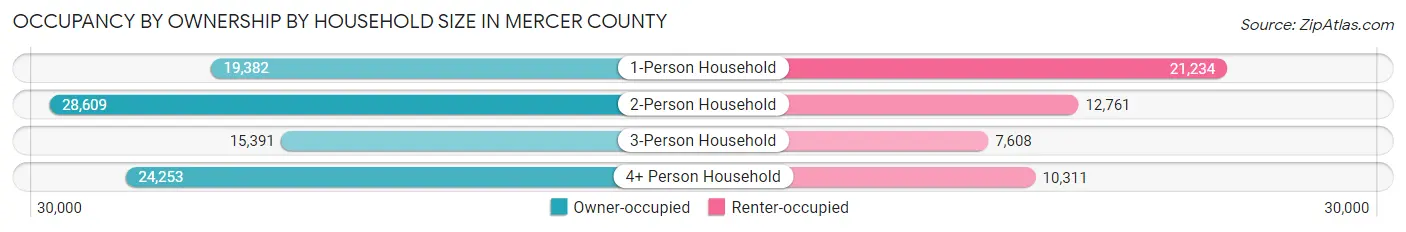
| Household Size | Owner-occupied | Renter-occupied |
| 1-Person Household | 19,382 (47.7%) | 21,234 (52.3%) |
| 2-Person Household | 28,609 (69.2%) | 12,761 (30.8%) |
| 3-Person Household | 15,391 (66.9%) | 7,608 (33.1%) |
| 4+ Person Household | 24,253 (70.2%) | 10,311 (29.8%) |
| Total Housing Units | 87,635 (62.8%) | 51,914 (37.2%) |
Occupancy by Educational Attainment in Mercer County
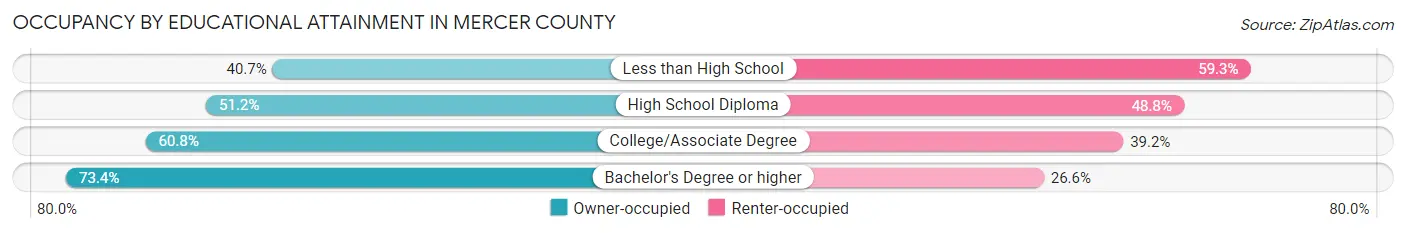
| Household Size | Owner-occupied | Renter-occupied |
| Less than High School | 4,969 (40.7%) | 7,250 (59.3%) |
| High School Diploma | 16,361 (51.2%) | 15,582 (48.8%) |
| College/Associate Degree | 17,984 (60.8%) | 11,587 (39.2%) |
| Bachelor's Degree or higher | 48,321 (73.4%) | 17,495 (26.6%) |
Occupancy by Age of Householder in Mercer County
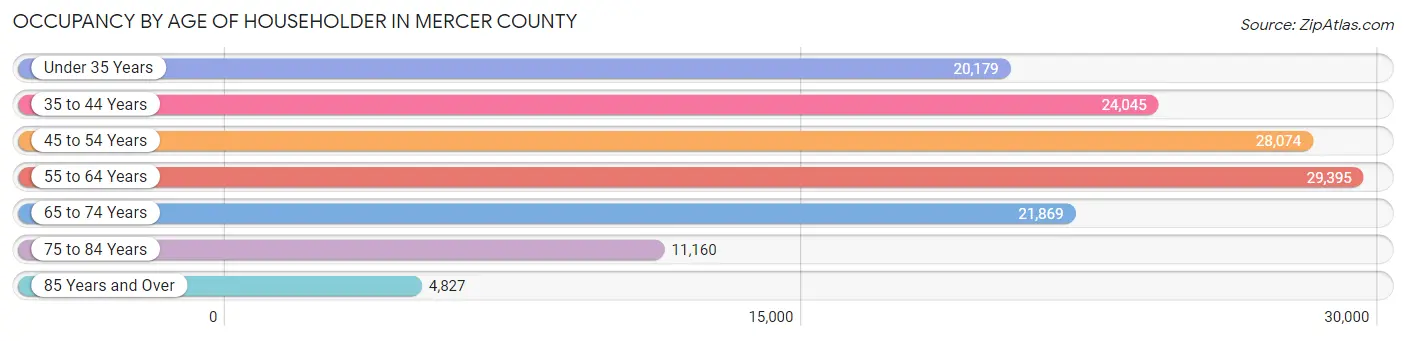
| Age Bracket | # Households | % Households |
| Under 35 Years | 20,179 | 14.5% |
| 35 to 44 Years | 24,045 | 17.2% |
| 45 to 54 Years | 28,074 | 20.1% |
| 55 to 64 Years | 29,395 | 21.1% |
| 65 to 74 Years | 21,869 | 15.7% |
| 75 to 84 Years | 11,160 | 8.0% |
| 85 Years and Over | 4,827 | 3.5% |
| Total | 139,549 | 100.0% |
Housing Finances in Mercer County
Median Income by Occupancy in Mercer County
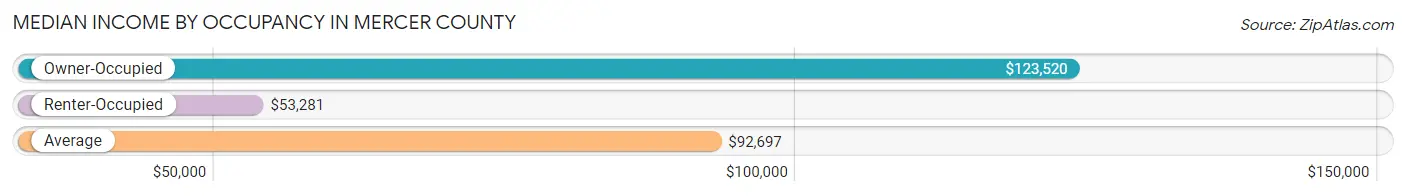
| Occupancy Type | # Households | Median Income |
| Owner-Occupied | 87,635 (62.8%) | $123,520 |
| Renter-Occupied | 51,914 (37.2%) | $53,281 |
| Average | 139,549 (100.0%) | $92,697 |
Occupancy by Householder Income Bracket in Mercer County
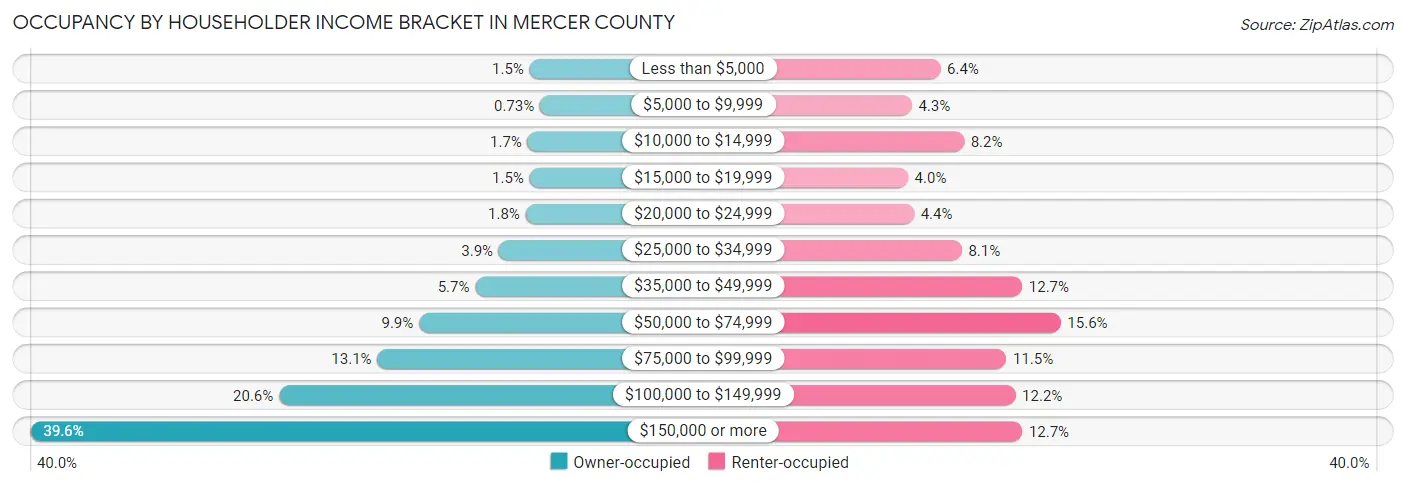
| Income Bracket | Owner-occupied | Renter-occupied |
| Less than $5,000 | 1,328 (1.5%) | 3,345 (6.4%) |
| $5,000 to $9,999 | 644 (0.7%) | 2,213 (4.3%) |
| $10,000 to $14,999 | 1,460 (1.7%) | 4,276 (8.2%) |
| $15,000 to $19,999 | 1,329 (1.5%) | 2,063 (4.0%) |
| $20,000 to $24,999 | 1,593 (1.8%) | 2,300 (4.4%) |
| $25,000 to $34,999 | 3,382 (3.9%) | 4,187 (8.1%) |
| $35,000 to $49,999 | 4,963 (5.7%) | 6,577 (12.7%) |
| $50,000 to $74,999 | 8,711 (9.9%) | 8,106 (15.6%) |
| $75,000 to $99,999 | 11,499 (13.1%) | 5,952 (11.5%) |
| $100,000 to $149,999 | 18,058 (20.6%) | 6,311 (12.2%) |
| $150,000 or more | 34,668 (39.6%) | 6,584 (12.7%) |
| Total | 87,635 (100.0%) | 51,914 (100.0%) |
Monthly Housing Cost Tiers in Mercer County
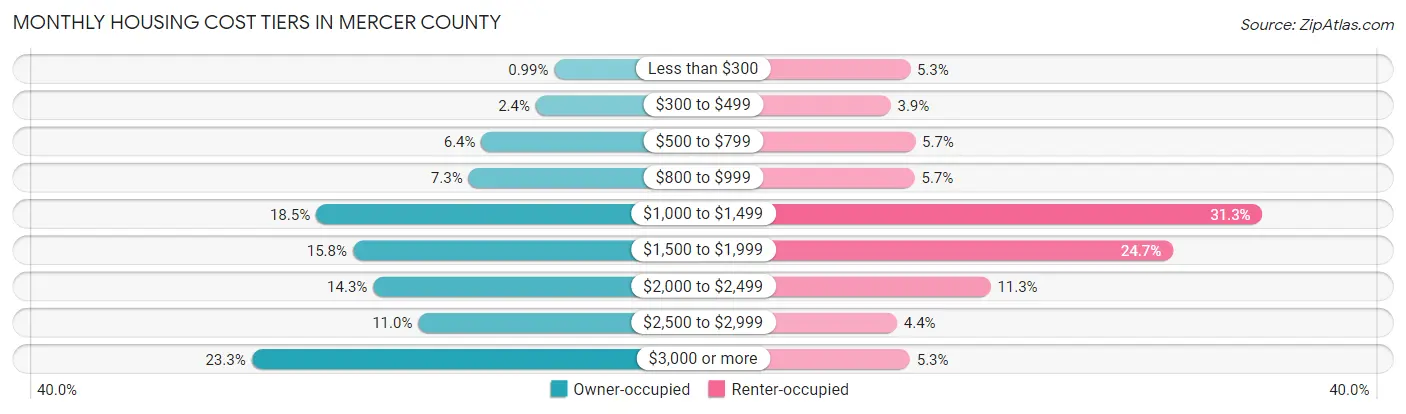
| Monthly Cost | Owner-occupied | Renter-occupied |
| Less than $300 | 870 (1.0%) | 2,773 (5.3%) |
| $300 to $499 | 2,058 (2.4%) | 2,028 (3.9%) |
| $500 to $799 | 5,570 (6.4%) | 2,971 (5.7%) |
| $800 to $999 | 6,405 (7.3%) | 2,951 (5.7%) |
| $1,000 to $1,499 | 16,246 (18.5%) | 16,249 (31.3%) |
| $1,500 to $1,999 | 13,869 (15.8%) | 12,831 (24.7%) |
| $2,000 to $2,499 | 12,558 (14.3%) | 5,852 (11.3%) |
| $2,500 to $2,999 | 9,649 (11.0%) | 2,272 (4.4%) |
| $3,000 or more | 20,410 (23.3%) | 2,765 (5.3%) |
| Total | 87,635 (100.0%) | 51,914 (100.0%) |
Physical Housing Characteristics in Mercer County
Housing Structures in Mercer County
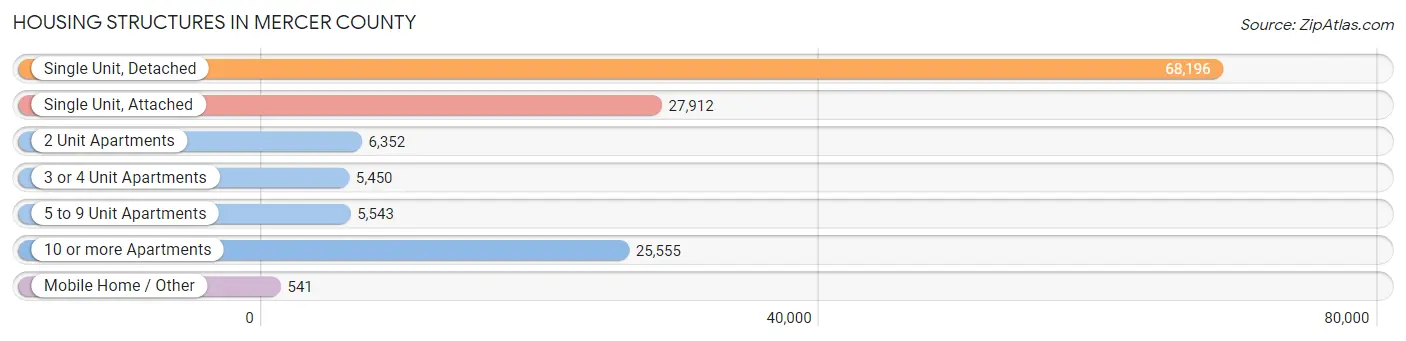
| Structure Type | # Housing Units | % Housing Units |
| Single Unit, Detached | 68,196 | 48.9% |
| Single Unit, Attached | 27,912 | 20.0% |
| 2 Unit Apartments | 6,352 | 4.5% |
| 3 or 4 Unit Apartments | 5,450 | 3.9% |
| 5 to 9 Unit Apartments | 5,543 | 4.0% |
| 10 or more Apartments | 25,555 | 18.3% |
| Mobile Home / Other | 541 | 0.4% |
| Total | 139,549 | 100.0% |
Housing Structures by Occupancy in Mercer County
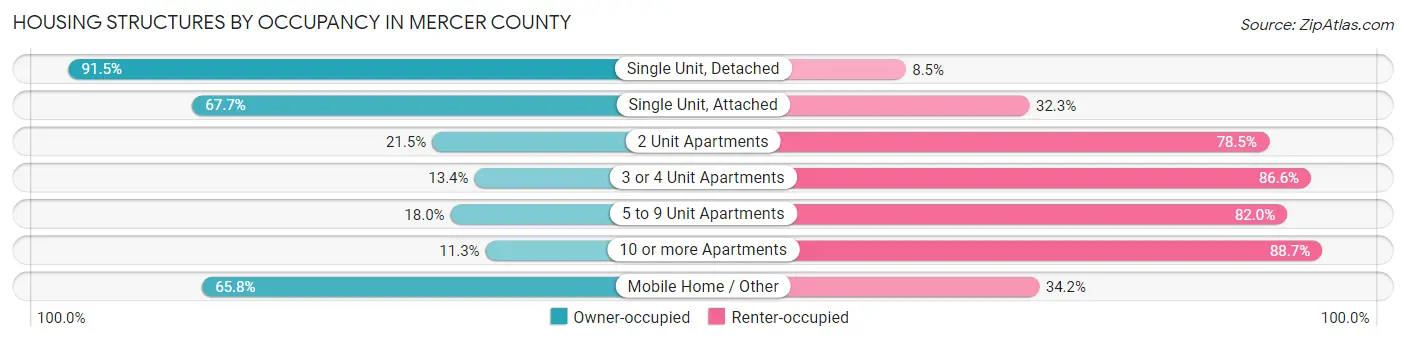
| Structure Type | Owner-occupied | Renter-occupied |
| Single Unit, Detached | 62,408 (91.5%) | 5,788 (8.5%) |
| Single Unit, Attached | 18,891 (67.7%) | 9,021 (32.3%) |
| 2 Unit Apartments | 1,368 (21.5%) | 4,984 (78.5%) |
| 3 or 4 Unit Apartments | 731 (13.4%) | 4,719 (86.6%) |
| 5 to 9 Unit Apartments | 999 (18.0%) | 4,544 (82.0%) |
| 10 or more Apartments | 2,882 (11.3%) | 22,673 (88.7%) |
| Mobile Home / Other | 356 (65.8%) | 185 (34.2%) |
| Total | 87,635 (62.8%) | 51,914 (37.2%) |
Housing Structures by Number of Rooms in Mercer County
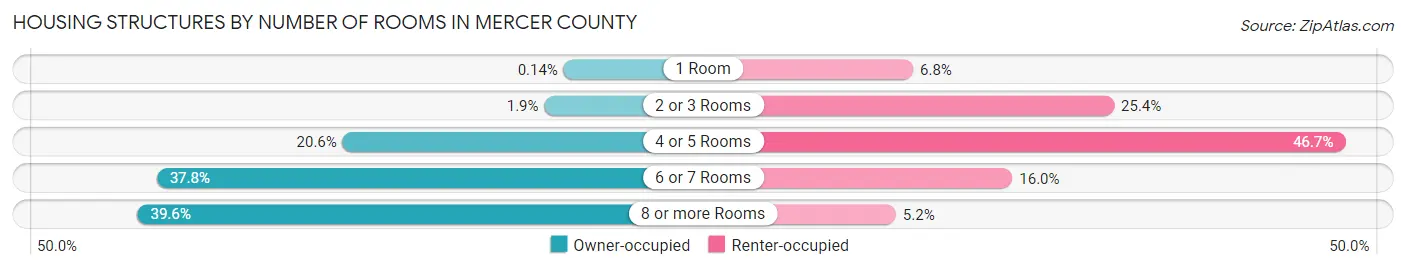
| Number of Rooms | Owner-occupied | Renter-occupied |
| 1 Room | 126 (0.1%) | 3,516 (6.8%) |
| 2 or 3 Rooms | 1,695 (1.9%) | 13,167 (25.4%) |
| 4 or 5 Rooms | 18,047 (20.6%) | 24,262 (46.7%) |
| 6 or 7 Rooms | 33,109 (37.8%) | 8,280 (16.0%) |
| 8 or more Rooms | 34,658 (39.6%) | 2,689 (5.2%) |
| Total | 87,635 (100.0%) | 51,914 (100.0%) |
Housing Structure by Heating Type in Mercer County
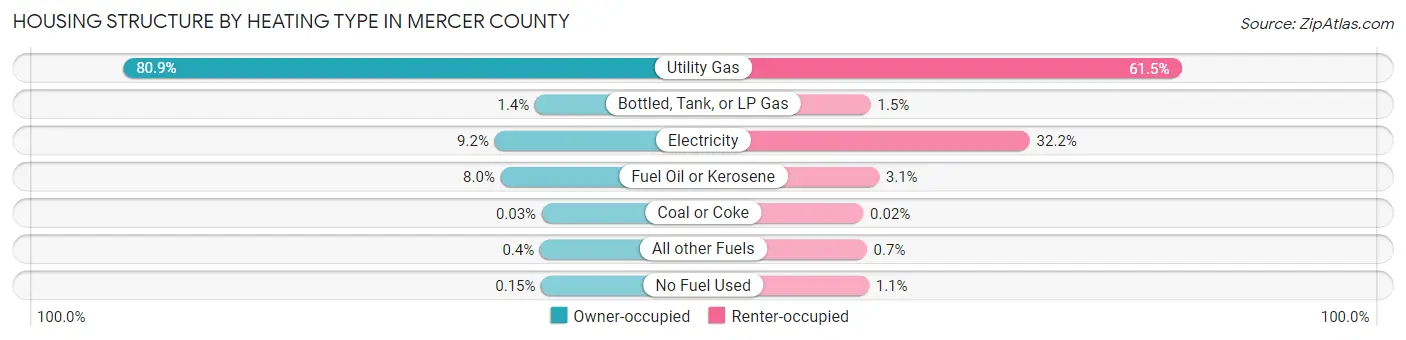
| Heating Type | Owner-occupied | Renter-occupied |
| Utility Gas | 70,928 (80.9%) | 31,916 (61.5%) |
| Bottled, Tank, or LP Gas | 1,180 (1.3%) | 757 (1.5%) |
| Electricity | 8,015 (9.1%) | 16,713 (32.2%) |
| Fuel Oil or Kerosene | 6,999 (8.0%) | 1,584 (3.0%) |
| Coal or Coke | 26 (0.0%) | 8 (0.0%) |
| All other Fuels | 352 (0.4%) | 362 (0.7%) |
| No Fuel Used | 135 (0.2%) | 574 (1.1%) |
| Total | 87,635 (100.0%) | 51,914 (100.0%) |
Household Vehicle Usage in Mercer County
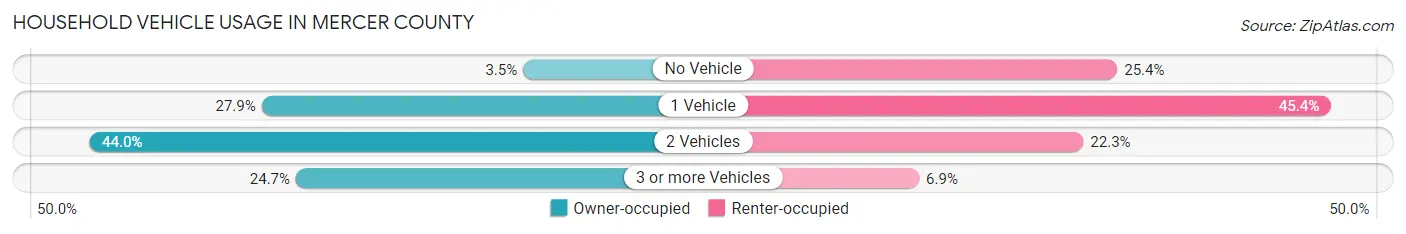
| Vehicles per Household | Owner-occupied | Renter-occupied |
| No Vehicle | 3,045 (3.5%) | 13,204 (25.4%) |
| 1 Vehicle | 24,433 (27.9%) | 23,552 (45.4%) |
| 2 Vehicles | 38,531 (44.0%) | 11,558 (22.3%) |
| 3 or more Vehicles | 21,626 (24.7%) | 3,600 (6.9%) |
| Total | 87,635 (100.0%) | 51,914 (100.0%) |
Real Estate & Mortgages in Mercer County
Real Estate and Mortgage Overview in Mercer County
| Characteristic | Without Mortgage | With Mortgage |
| Housing Units | 31,811 | 55,824 |
| Median Property Value | $301,700 | $340,700 |
| Median Household Income | $94,265 | $25,020 |
| Monthly Housing Costs | $1,085 | $19,636 |
| Real Estate Taxes | $8,366 | $656 |
Property Value by Mortgage Status in Mercer County
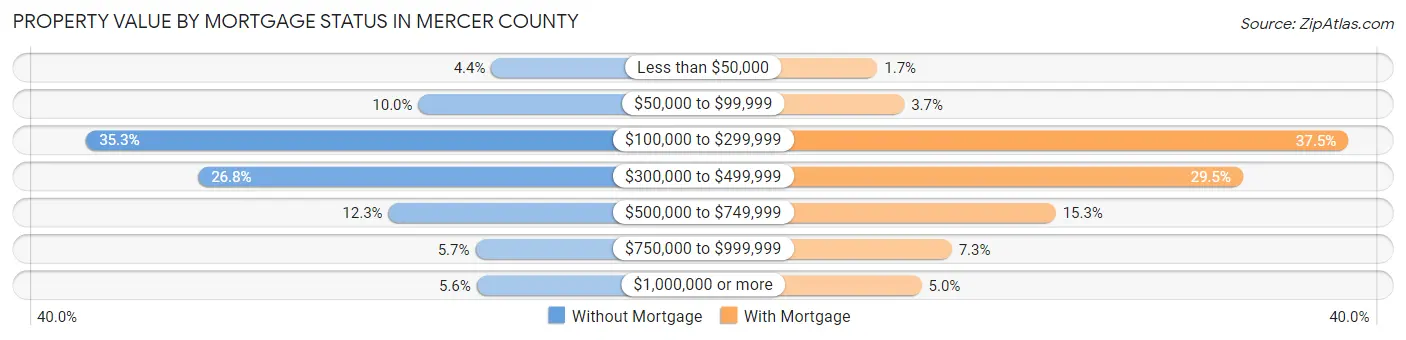
| Property Value | Without Mortgage | With Mortgage |
| Less than $50,000 | 1,411 (4.4%) | 925 (1.7%) |
| $50,000 to $99,999 | 3,180 (10.0%) | 2,071 (3.7%) |
| $100,000 to $299,999 | 11,230 (35.3%) | 20,949 (37.5%) |
| $300,000 to $499,999 | 8,515 (26.8%) | 16,466 (29.5%) |
| $500,000 to $749,999 | 3,906 (12.3%) | 8,514 (15.2%) |
| $750,000 to $999,999 | 1,799 (5.7%) | 4,092 (7.3%) |
| $1,000,000 or more | 1,770 (5.6%) | 2,807 (5.0%) |
| Total | 31,811 (100.0%) | 55,824 (100.0%) |
Household Income by Mortgage Status in Mercer County
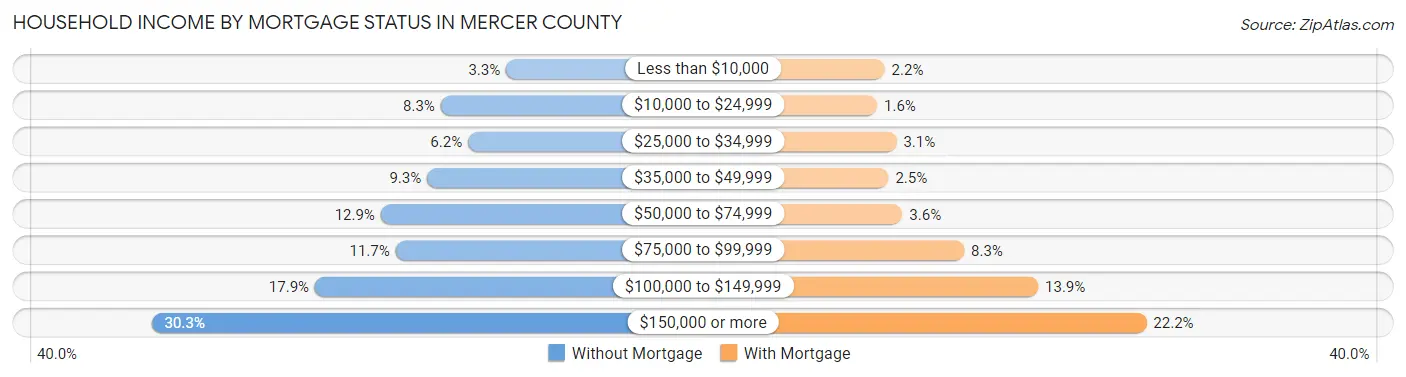
| Household Income | Without Mortgage | With Mortgage |
| Less than $10,000 | 1,056 (3.3%) | 1,242 (2.2%) |
| $10,000 to $24,999 | 2,640 (8.3%) | 916 (1.6%) |
| $25,000 to $34,999 | 1,979 (6.2%) | 1,742 (3.1%) |
| $35,000 to $49,999 | 2,972 (9.3%) | 1,403 (2.5%) |
| $50,000 to $74,999 | 4,094 (12.9%) | 1,991 (3.6%) |
| $75,000 to $99,999 | 3,734 (11.7%) | 4,617 (8.3%) |
| $100,000 to $149,999 | 5,688 (17.9%) | 7,765 (13.9%) |
| $150,000 or more | 9,648 (30.3%) | 12,370 (22.2%) |
| Total | 31,811 (100.0%) | 55,824 (100.0%) |
Property Value to Household Income Ratio in Mercer County
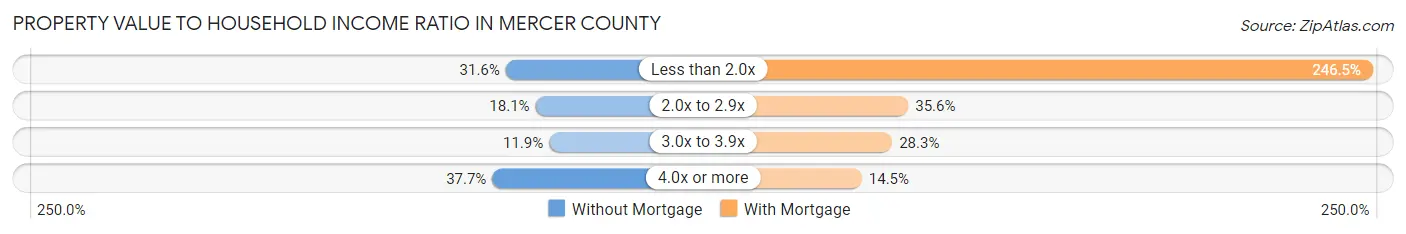
| Value-to-Income Ratio | Without Mortgage | With Mortgage |
| Less than 2.0x | 10,057 (31.6%) | 137,598 (246.5%) |
| 2.0x to 2.9x | 5,754 (18.1%) | 19,859 (35.6%) |
| 3.0x to 3.9x | 3,787 (11.9%) | 15,798 (28.3%) |
| 4.0x or more | 11,989 (37.7%) | 8,088 (14.5%) |
| Total | 31,811 (100.0%) | 55,824 (100.0%) |
Real Estate Taxes by Mortgage Status in Mercer County
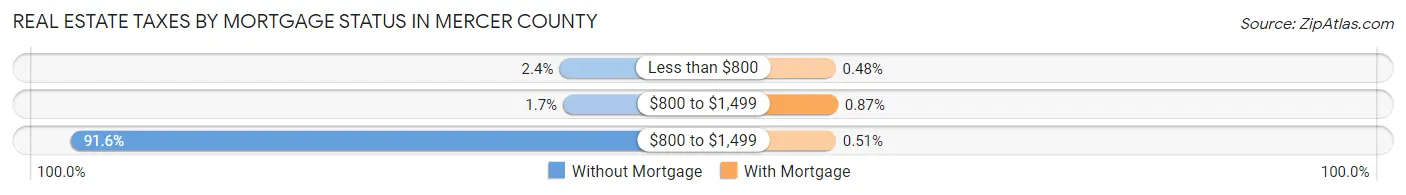
| Property Taxes | Without Mortgage | With Mortgage |
| Less than $800 | 746 (2.4%) | 269 (0.5%) |
| $800 to $1,499 | 533 (1.7%) | 487 (0.9%) |
| $800 to $1,499 | 29,128 (91.6%) | 282 (0.5%) |
| Total | 31,811 (100.0%) | 55,824 (100.0%) |
Health & Disability in Mercer County
Health Insurance Coverage by Age in Mercer County
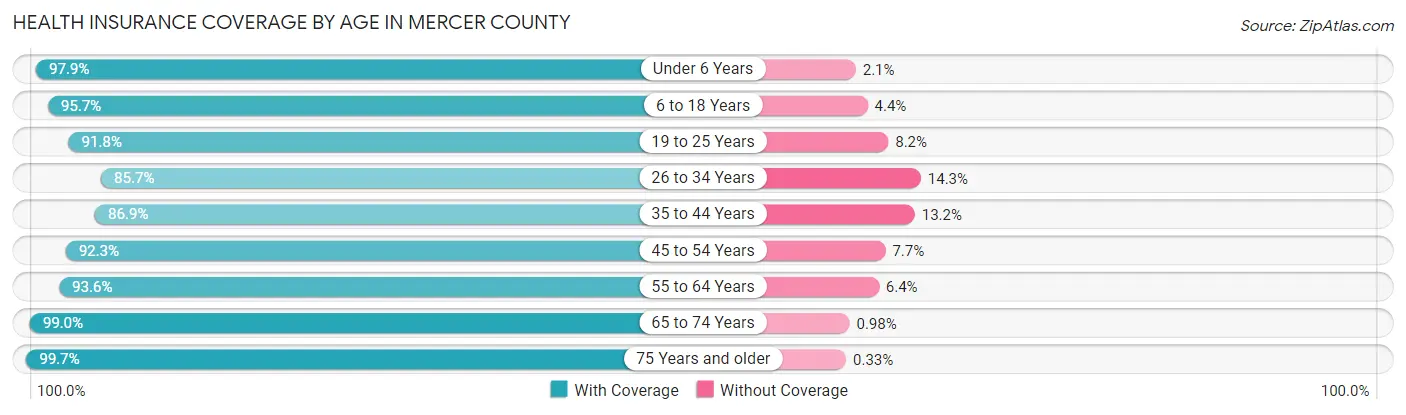
| Age Bracket | With Coverage | Without Coverage |
| Under 6 Years | 25,088 (97.9%) | 548 (2.1%) |
| 6 to 18 Years | 60,708 (95.7%) | 2,764 (4.3%) |
| 19 to 25 Years | 36,100 (91.8%) | 3,225 (8.2%) |
| 26 to 34 Years | 35,528 (85.7%) | 5,918 (14.3%) |
| 35 to 44 Years | 42,154 (86.9%) | 6,385 (13.2%) |
| 45 to 54 Years | 47,853 (92.3%) | 3,982 (7.7%) |
| 55 to 64 Years | 47,063 (93.6%) | 3,239 (6.4%) |
| 65 to 74 Years | 33,972 (99.0%) | 336 (1.0%) |
| 75 Years and older | 23,907 (99.7%) | 80 (0.3%) |
| Total | 352,373 (93.0%) | 26,477 (7.0%) |
Health Insurance Coverage by Citizenship Status in Mercer County
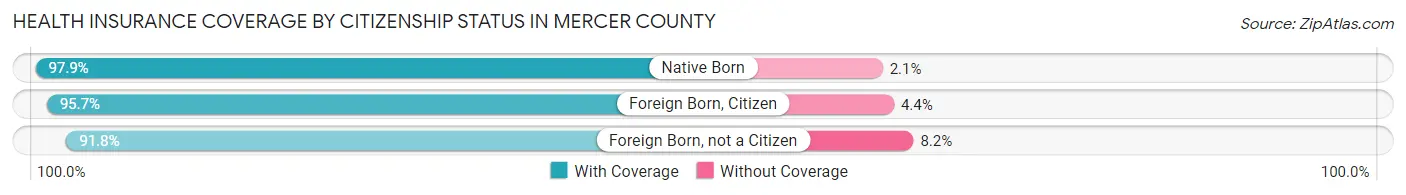
| Citizenship Status | With Coverage | Without Coverage |
| Native Born | 25,088 (97.9%) | 548 (2.1%) |
| Foreign Born, Citizen | 60,708 (95.7%) | 2,764 (4.3%) |
| Foreign Born, not a Citizen | 36,100 (91.8%) | 3,225 (8.2%) |
Health Insurance Coverage by Household Income in Mercer County
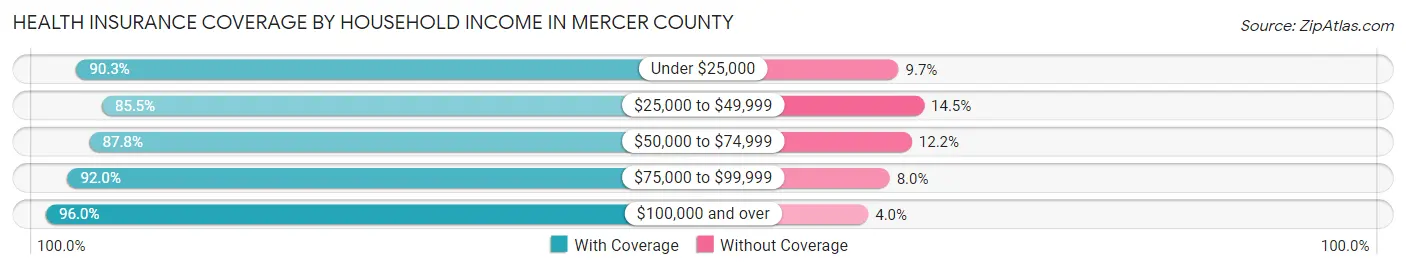
| Household Income | With Coverage | Without Coverage |
| Under $25,000 | 32,013 (90.3%) | 3,441 (9.7%) |
| $25,000 to $49,999 | 34,473 (85.5%) | 5,837 (14.5%) |
| $50,000 to $74,999 | 35,381 (87.8%) | 4,913 (12.2%) |
| $75,000 to $99,999 | 40,182 (92.0%) | 3,513 (8.0%) |
| $100,000 and over | 196,835 (96.0%) | 8,258 (4.0%) |
Public vs Private Health Insurance Coverage by Age in Mercer County
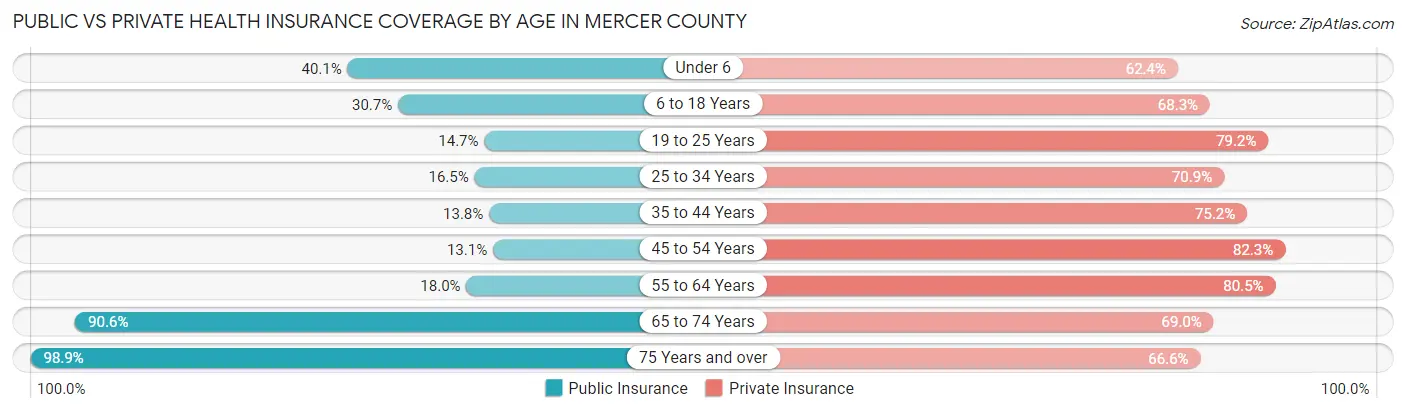
| Age Bracket | Public Insurance | Private Insurance |
| Under 6 | 10,271 (40.1%) | 15,986 (62.4%) |
| 6 to 18 Years | 19,473 (30.7%) | 43,361 (68.3%) |
| 19 to 25 Years | 5,765 (14.7%) | 31,126 (79.1%) |
| 25 to 34 Years | 6,836 (16.5%) | 29,398 (70.9%) |
| 35 to 44 Years | 6,687 (13.8%) | 36,518 (75.2%) |
| 45 to 54 Years | 6,772 (13.1%) | 42,643 (82.3%) |
| 55 to 64 Years | 9,049 (18.0%) | 40,484 (80.5%) |
| 65 to 74 Years | 31,091 (90.6%) | 23,678 (69.0%) |
| 75 Years and over | 23,726 (98.9%) | 15,966 (66.6%) |
| Total | 119,670 (31.6%) | 279,160 (73.7%) |
Disability Status by Sex by Age in Mercer County
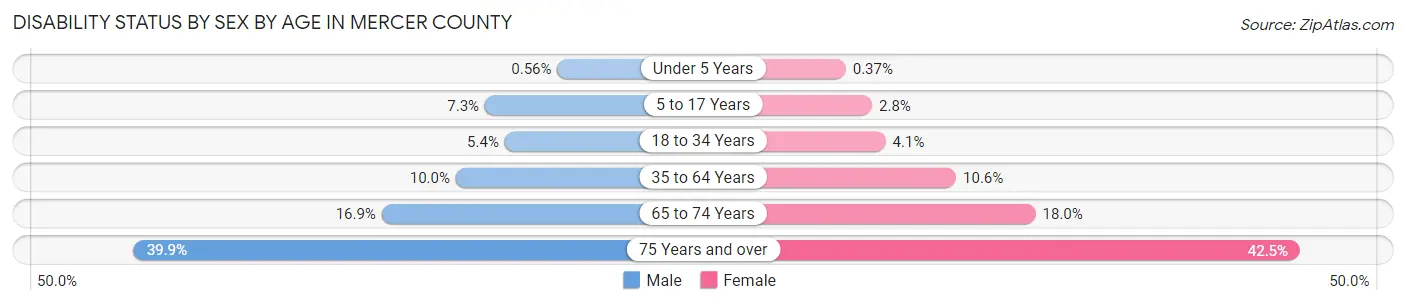
| Age Bracket | Male | Female |
| Under 5 Years | 61 (0.6%) | 38 (0.4%) |
| 5 to 17 Years | 2,282 (7.3%) | 833 (2.8%) |
| 18 to 34 Years | 2,395 (5.4%) | 1,776 (4.1%) |
| 35 to 64 Years | 7,423 (10.0%) | 8,093 (10.6%) |
| 65 to 74 Years | 2,680 (16.9%) | 3,310 (18.0%) |
| 75 Years and over | 3,825 (39.9%) | 6,119 (42.5%) |
Disability Class by Sex by Age in Mercer County
Disability Class: Hearing Difficulty
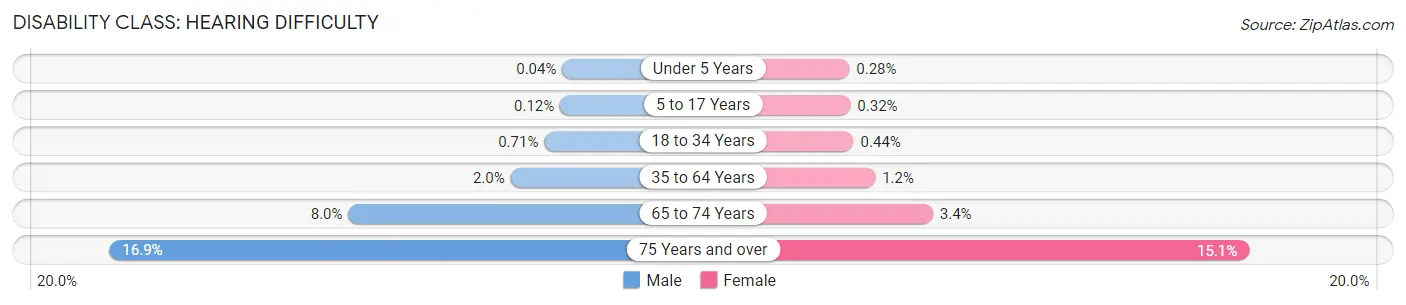
| Age Bracket | Male | Female |
| Under 5 Years | 4 (0.0%) | 29 (0.3%) |
| 5 to 17 Years | 37 (0.1%) | 96 (0.3%) |
| 18 to 34 Years | 312 (0.7%) | 194 (0.4%) |
| 35 to 64 Years | 1,459 (2.0%) | 945 (1.2%) |
| 65 to 74 Years | 1,269 (8.0%) | 623 (3.4%) |
| 75 Years and over | 1,617 (16.9%) | 2,176 (15.1%) |
Disability Class: Vision Difficulty
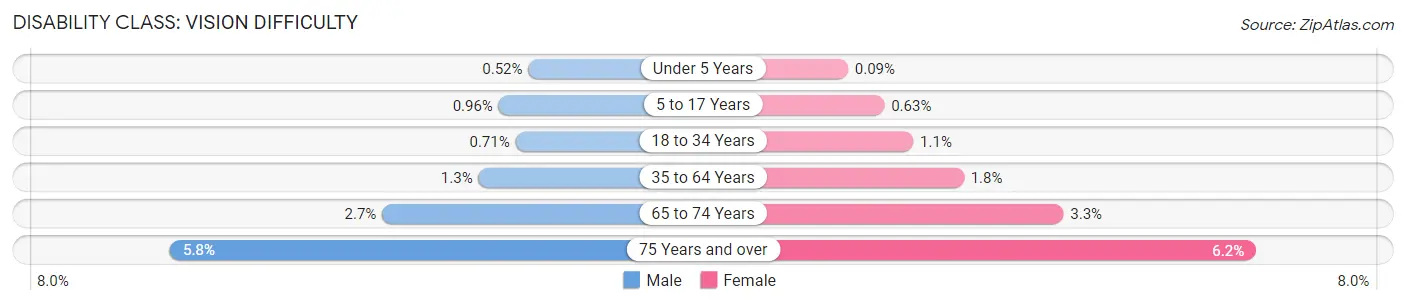
| Age Bracket | Male | Female |
| Under 5 Years | 57 (0.5%) | 9 (0.1%) |
| 5 to 17 Years | 300 (1.0%) | 187 (0.6%) |
| 18 to 34 Years | 313 (0.7%) | 461 (1.1%) |
| 35 to 64 Years | 938 (1.3%) | 1,380 (1.8%) |
| 65 to 74 Years | 427 (2.7%) | 606 (3.3%) |
| 75 Years and over | 560 (5.8%) | 885 (6.1%) |
Disability Class: Cognitive Difficulty
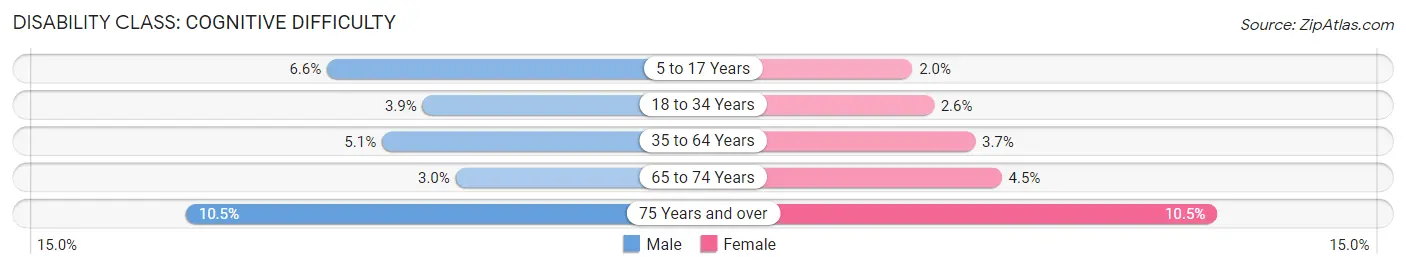
| Age Bracket | Male | Female |
| 5 to 17 Years | 2,063 (6.6%) | 581 (2.0%) |
| 18 to 34 Years | 1,727 (3.9%) | 1,119 (2.6%) |
| 35 to 64 Years | 3,760 (5.1%) | 2,833 (3.7%) |
| 65 to 74 Years | 477 (3.0%) | 819 (4.4%) |
| 75 Years and over | 1,008 (10.5%) | 1,504 (10.4%) |
Disability Class: Ambulatory Difficulty
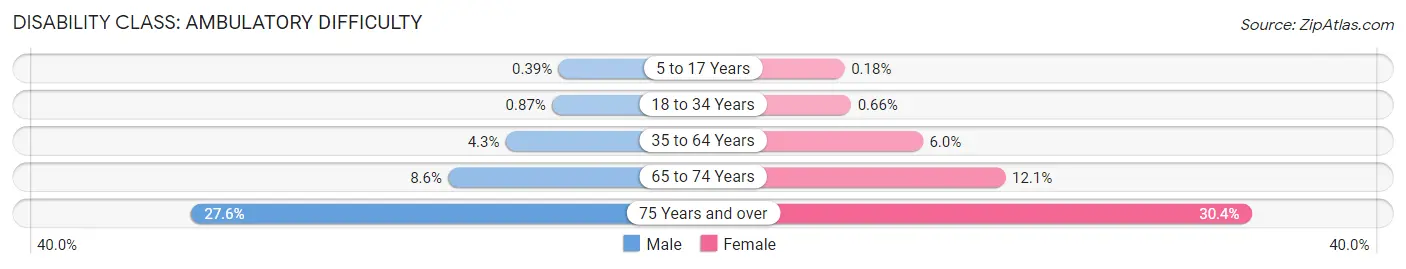
| Age Bracket | Male | Female |
| 5 to 17 Years | 123 (0.4%) | 52 (0.2%) |
| 18 to 34 Years | 383 (0.9%) | 289 (0.7%) |
| 35 to 64 Years | 3,204 (4.3%) | 4,570 (6.0%) |
| 65 to 74 Years | 1,363 (8.6%) | 2,232 (12.1%) |
| 75 Years and over | 2,650 (27.6%) | 4,376 (30.4%) |
Disability Class: Self-Care Difficulty
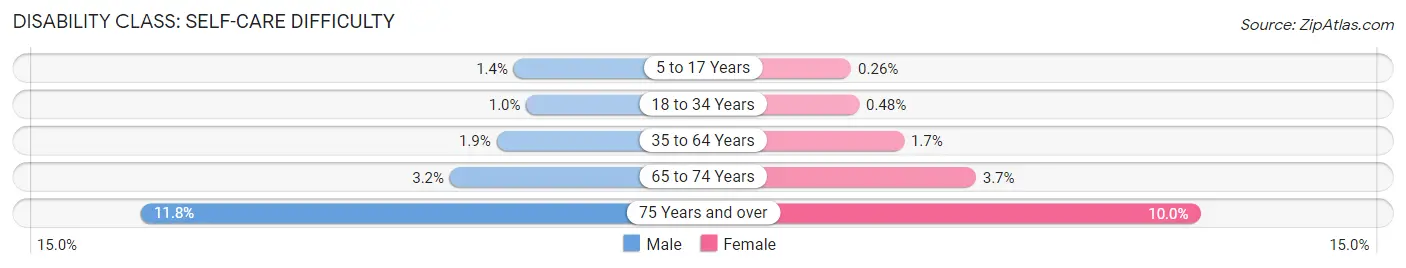
| Age Bracket | Male | Female |
| 5 to 17 Years | 432 (1.4%) | 78 (0.3%) |
| 18 to 34 Years | 452 (1.0%) | 208 (0.5%) |
| 35 to 64 Years | 1,386 (1.9%) | 1,322 (1.7%) |
| 65 to 74 Years | 502 (3.2%) | 687 (3.7%) |
| 75 Years and over | 1,128 (11.8%) | 1,436 (10.0%) |
Technology Access in Mercer County
Computing Device Access in Mercer County
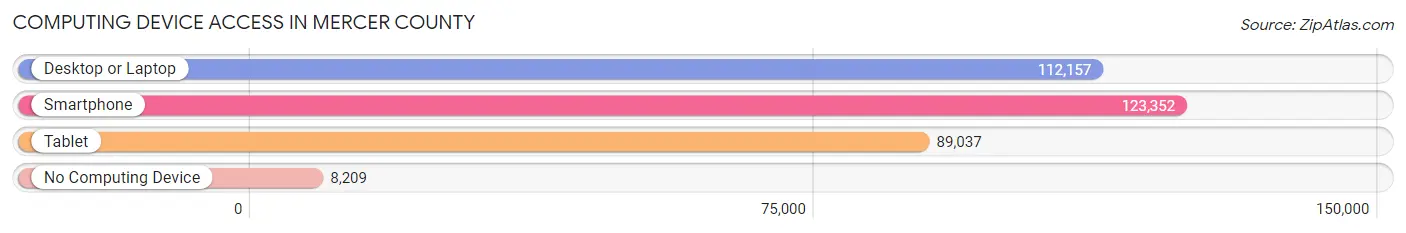
| Device Type | # Households | % Households |
| Desktop or Laptop | 112,157 | 80.4% |
| Smartphone | 123,352 | 88.4% |
| Tablet | 89,037 | 63.8% |
| No Computing Device | 8,209 | 5.9% |
| Total | 139,549 | 100.0% |
Internet Access in Mercer County
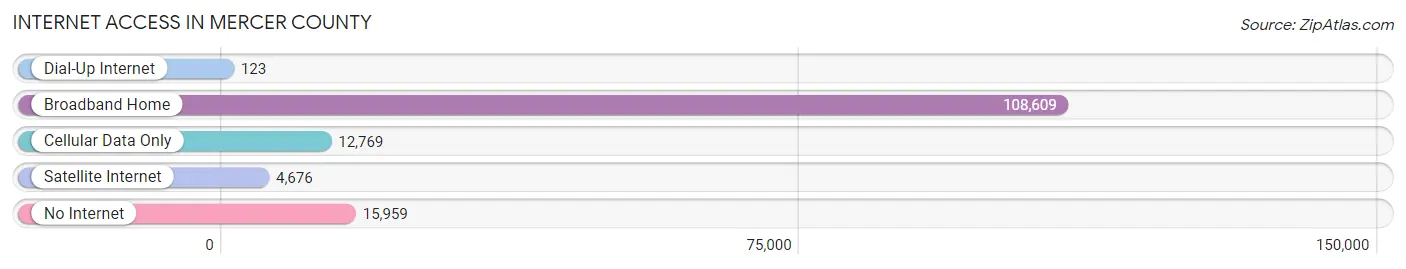
| Internet Type | # Households | % Households |
| Dial-Up Internet | 123 | 0.1% |
| Broadband Home | 108,609 | 77.8% |
| Cellular Data Only | 12,769 | 9.1% |
| Satellite Internet | 4,676 | 3.4% |
| No Internet | 15,959 | 11.4% |
| Total | 139,549 | 100.0% |
Mercer County Summary
Mercer County, New Jersey is located in the central part of the state and is part of the New York metropolitan area. It is bordered by Burlington County to the north, Middlesex County to the east, Monmouth County to the south, and Bucks County, Pennsylvania to the west. The county seat is Trenton, the state capital. Mercer County is home to a diverse population of over 375,000 people, making it the 12th most populous county in New Jersey.
Geography
Mercer County covers an area of 228 square miles, making it the smallest county in New Jersey. The terrain is mostly flat, with some rolling hills in the northern and western parts of the county. The highest point in the county is located in the Sourland Mountains, which reach an elevation of 545 feet. The county is drained by the Delaware River and its tributaries, including the Assunpink Creek, Crosswicks Creek, and Millstone River.
The county is home to several parks and recreational areas, including the Delaware and Raritan Canal State Park, Mercer Meadows, and Washington Crossing State Park. The county also contains several historic sites, including the Princeton Battlefield, the Trenton Battle Monument, and the Old Barracks Museum.
Economy
Mercer County has a diverse economy, with a mix of manufacturing, retail, and service industries. The county is home to several major employers, including Bristol-Myers Squibb, Church & Dwight, and the State of New Jersey. The county is also home to several educational institutions, including Princeton University, Rider University, and The College of New Jersey.
The county has a strong agricultural sector, with a variety of crops grown in the area, including corn, soybeans, and wheat. The county is also home to several wineries and breweries, including Terhune Orchards and Hopewell Valley Vineyards.
Demographics
As of the 2010 census, Mercer County had a population of 375,395 people. The racial makeup of the county was 73.3% White, 15.2% African American, 0.3% Native American, 5.2% Asian, 0.1% Pacific Islander, and 5.9% from other races. Hispanic or Latino of any race made up 13.2% of the population.
The median household income in the county was $76,824, and the median family income was $90,890. The per capita income was $37,837. About 8.3% of the population was below the poverty line.
Mercer County is home to a diverse population, with a variety of ethnic and religious backgrounds. The largest religious group in the county is Roman Catholic, followed by Protestant, Jewish, and Muslim.
Conclusion
Mercer County, New Jersey is a diverse and vibrant county located in the central part of the state. It is home to a population of over 375,000 people, with a mix of manufacturing, retail, and service industries. The county is home to several parks and recreational areas, as well as several historic sites. The county has a strong agricultural sector, and is home to several wineries and breweries. The population of the county is diverse, with a variety of ethnic and religious backgrounds.
Common Questions
What is the Total Population of Mercer County?
Total Population of Mercer County is 383,732.
What is the Total Male Population of Mercer County?
Total Male Population of Mercer County is 189,495.
What is the Total Female Population of Mercer County?
Total Female Population of Mercer County is 194,237.
What is the Ratio of Males per 100 Females in Mercer County?
There are 97.56 Males per 100 Females in Mercer County.
What is the Ratio of Females per 100 Males in Mercer County?
There are 102.50 Females per 100 Males in Mercer County.
What is the Median Population Age in Mercer County?
Median Population Age in Mercer County is 39.3 Years.
What is the Average Family Size in Mercer County
Average Family Size in Mercer County is 3.3 People.
What is the Average Household Size in Mercer County
Average Household Size in Mercer County is 2.6 People.
What is Per Capita Income in Mercer County?
Per Capita income in Mercer County is $50,053.
What is the Median Family Income in Mercer County?
Median Family Income in Mercer County is $120,093.
What is the Median Household income in Mercer County?
Median Household Income in Mercer County is $92,697.
What is Income or Wage Gap in Mercer County?
Income or Wage Gap in Mercer County is 22.3%.
Women in Mercer County earn 77.7 cents for every dollar earned by a man.
What is Family Income Deficit in Mercer County?
Family Income Deficit in Mercer County is $10,935.
Families that are below poverty line in Mercer County earn $10,935 less on average than the poverty threshold level.
What is Inequality or Gini Index in Mercer County?
Inequality or Gini Index in Mercer County is 0.50.
How Large is the Labor Force in Mercer County?
There are 198,759 People in the Labor Forcein in Mercer County.
What is the Percentage of People in the Labor Force in Mercer County?
63.8% of People are in the Labor Force in Mercer County.
What is the Unemployment Rate in Mercer County?
Unemployment Rate in Mercer County is 6.1%.