Hunterdon County, NJ
Hunterdon County Map
Hunterdon County Overview
129,099
TOTAL POPULATION
63,792
MALE POPULATION
65,307
FEMALE POPULATION
97.68
MALES / 100 FEMALES
102.37
FEMALES / 100 MALES
46.4
MEDIAN AGE
3.0
AVG FAMILY SIZE
2.5
AVG HOUSEHOLD SIZE
$68,112
PER CAPITA INCOME
$161,440
AVG FAMILY INCOME
$133,534
AVG HOUSEHOLD INCOME
35.5%
WAGE / INCOME GAP [ % ]
64.5¢/ $1
WAGE / INCOME GAP [ $ ]
$9,761
FAMILY INCOME DEFICIT
0.44
INEQUALITY / GINI INDEX
70,932
LABOR FORCE [ PEOPLE ]
65.4%
PERCENT IN LABOR FORCE
4.6%
UNEMPLOYMENT RATE
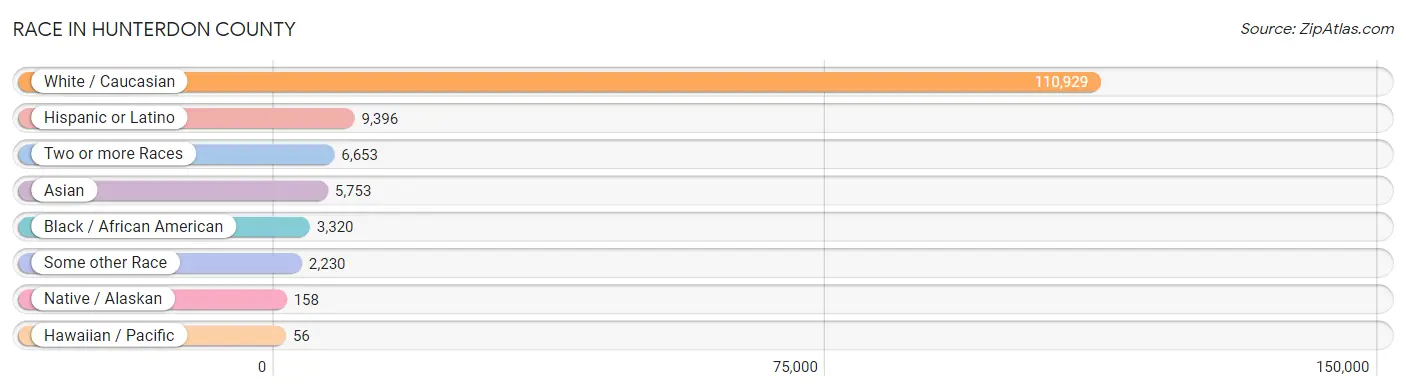
Race in Hunterdon County
The most populous races in Hunterdon County are White / Caucasian (110,929 | 85.9%), Hispanic or Latino (9,396 | 7.3%), and Two or more Races (6,653 | 5.1%).
| Race | # Population | % Population |
| Asian | 5,753 | 4.5% |
| Black / African American | 3,320 | 2.6% |
| Hawaiian / Pacific | 56 | 0.0% |
| Hispanic or Latino | 9,396 | 7.3% |
| Native / Alaskan | 158 | 0.1% |
| White / Caucasian | 110,929 | 85.9% |
| Two or more Races | 6,653 | 5.1% |
| Some other Race | 2,230 | 1.7% |
| Total | 129,099 | 100.0% |
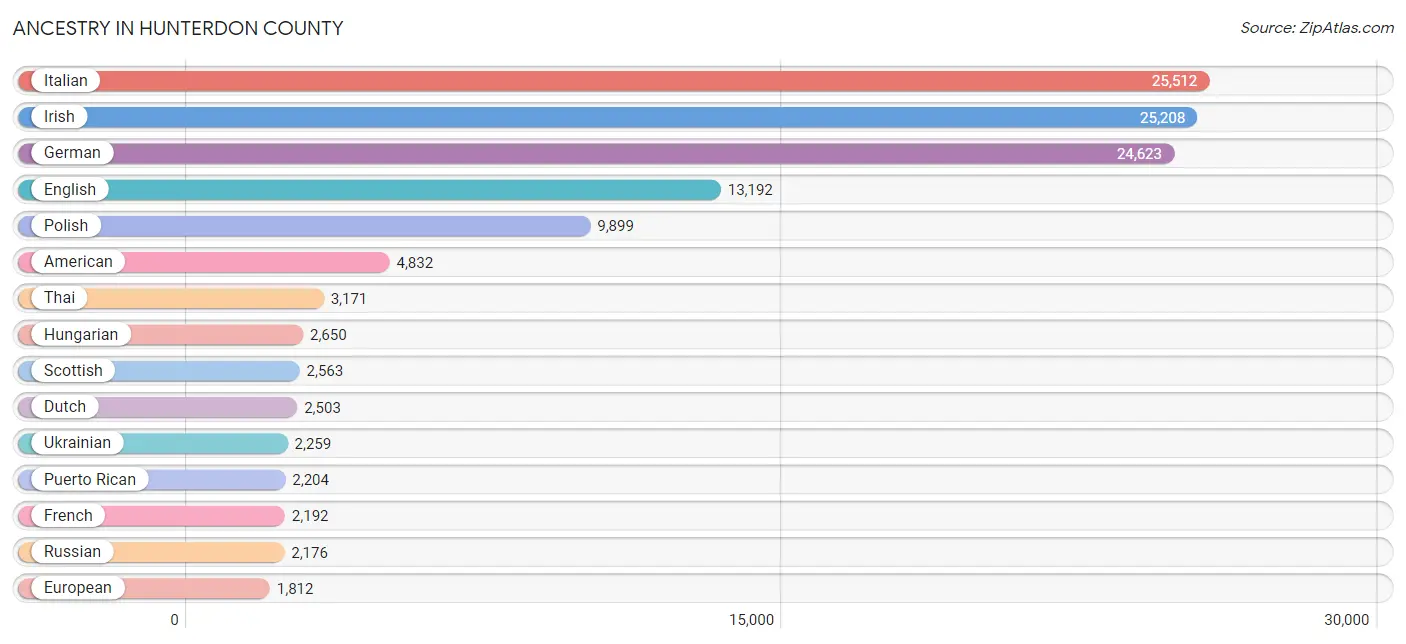
Ancestry in Hunterdon County
The most populous ancestries reported in Hunterdon County are Italian (25,512 | 19.8%), Irish (25,208 | 19.5%), German (24,623 | 19.1%), English (13,192 | 10.2%), and Polish (9,899 | 7.7%), together accounting for 76.2% of all Hunterdon County residents.
| Ancestry | # Population | % Population |
| African | 64 | 0.1% |
| Alaskan Athabascan | 5 | 0.0% |
| Albanian | 123 | 0.1% |
| Alsatian | 9 | 0.0% |
| American | 4,832 | 3.7% |
| Arab | 1,161 | 0.9% |
| Argentinean | 102 | 0.1% |
| Armenian | 293 | 0.2% |
| Assyrian / Chaldean / Syriac | 4 | 0.0% |
| Australian | 42 | 0.0% |
| Austrian | 1,171 | 0.9% |
| Barbadian | 3 | 0.0% |
| Belgian | 210 | 0.2% |
| Bhutanese | 183 | 0.1% |
| Blackfeet | 9 | 0.0% |
| Bolivian | 98 | 0.1% |
| Brazilian | 401 | 0.3% |
| British | 904 | 0.7% |
| Bulgarian | 33 | 0.0% |
| Burmese | 302 | 0.2% |
| Cambodian | 108 | 0.1% |
| Canadian | 136 | 0.1% |
| Carpatho Rusyn | 27 | 0.0% |
| Celtic | 15 | 0.0% |
| Central American | 1,764 | 1.4% |
| Central American Indian | 125 | 0.1% |
| Cherokee | 79 | 0.1% |
| Chilean | 13 | 0.0% |
| Colombian | 723 | 0.6% |
| Costa Rican | 304 | 0.2% |
| Creek | 3 | 0.0% |
| Croatian | 394 | 0.3% |
| Cuban | 1,024 | 0.8% |
| Cypriot | 48 | 0.0% |
| Czech | 600 | 0.5% |
| Czechoslovakian | 282 | 0.2% |
| Danish | 558 | 0.4% |
| Delaware | 25 | 0.0% |
| Dominican | 411 | 0.3% |
| Dutch | 2,503 | 1.9% |
| Eastern European | 916 | 0.7% |
| Ecuadorian | 658 | 0.5% |
| Egyptian | 88 | 0.1% |
| English | 13,192 | 10.2% |
| Estonian | 37 | 0.0% |
| European | 1,812 | 1.4% |
| Filipino | 254 | 0.2% |
| Finnish | 90 | 0.1% |
| French | 2,192 | 1.7% |
| French Canadian | 574 | 0.4% |
| German | 24,623 | 19.1% |
| Ghanaian | 25 | 0.0% |
| Greek | 1,391 | 1.1% |
| Guamanian / Chamorro | 25 | 0.0% |
| Guatemalan | 472 | 0.4% |
| Guyanese | 3 | 0.0% |
| Haitian | 63 | 0.1% |
| Honduran | 287 | 0.2% |
| Hungarian | 2,650 | 2.1% |
| Icelander | 3 | 0.0% |
| Indian (Asian) | 1,355 | 1.1% |
| Inupiat | 33 | 0.0% |
| Iranian | 2 | 0.0% |
| Iraqi | 202 | 0.2% |
| Irish | 25,208 | 19.5% |
| Iroquois | 4 | 0.0% |
| Israeli | 13 | 0.0% |
| Italian | 25,512 | 19.8% |
| Jamaican | 516 | 0.4% |
| Jordanian | 102 | 0.1% |
| Korean | 828 | 0.6% |
| Laotian | 21 | 0.0% |
| Latvian | 32 | 0.0% |
| Lebanese | 319 | 0.3% |
| Lithuanian | 652 | 0.5% |
| Luxembourger | 3 | 0.0% |
| Macedonian | 72 | 0.1% |
| Malaysian | 34 | 0.0% |
| Maltese | 9 | 0.0% |
| Mexican | 1,491 | 1.1% |
| Mexican American Indian | 3 | 0.0% |
| Moroccan | 40 | 0.0% |
| Nicaraguan | 131 | 0.1% |
| Nigerian | 80 | 0.1% |
| Northern European | 183 | 0.1% |
| Norwegian | 1,303 | 1.0% |
| Pakistani | 14 | 0.0% |
| Palestinian | 218 | 0.2% |
| Panamanian | 36 | 0.0% |
| Paraguayan | 22 | 0.0% |
| Pennsylvania German | 89 | 0.1% |
| Peruvian | 62 | 0.1% |
| Polish | 9,899 | 7.7% |
| Portuguese | 1,567 | 1.2% |
| Puerto Rican | 2,204 | 1.7% |
| Romanian | 324 | 0.3% |
| Russian | 2,176 | 1.7% |
| Salvadoran | 534 | 0.4% |
| Scandinavian | 227 | 0.2% |
| Scotch-Irish | 775 | 0.6% |
| Scottish | 2,563 | 2.0% |
| Serbian | 44 | 0.0% |
| Slavic | 160 | 0.1% |
| Slovak | 824 | 0.6% |
| Slovene | 112 | 0.1% |
| South African | 79 | 0.1% |
| South American | 1,805 | 1.4% |
| South American Indian | 19 | 0.0% |
| Spaniard | 323 | 0.3% |
| Spanish | 137 | 0.1% |
| Spanish American | 21 | 0.0% |
| Sri Lankan | 232 | 0.2% |
| Subsaharan African | 330 | 0.3% |
| Sudanese | 36 | 0.0% |
| Swedish | 1,163 | 0.9% |
| Swiss | 475 | 0.4% |
| Syrian | 147 | 0.1% |
| Thai | 3,171 | 2.5% |
| Trinidadian and Tobagonian | 13 | 0.0% |
| Turkish | 94 | 0.1% |
| Ukrainian | 2,259 | 1.8% |
| Uruguayan | 98 | 0.1% |
| Venezuelan | 28 | 0.0% |
| Vietnamese | 256 | 0.2% |
| Welsh | 832 | 0.6% |
| West Indian | 118 | 0.1% |
| Yugoslavian | 37 | 0.0% |
| Zimbabwean | 1 | 0.0% | View All 128 Rows |
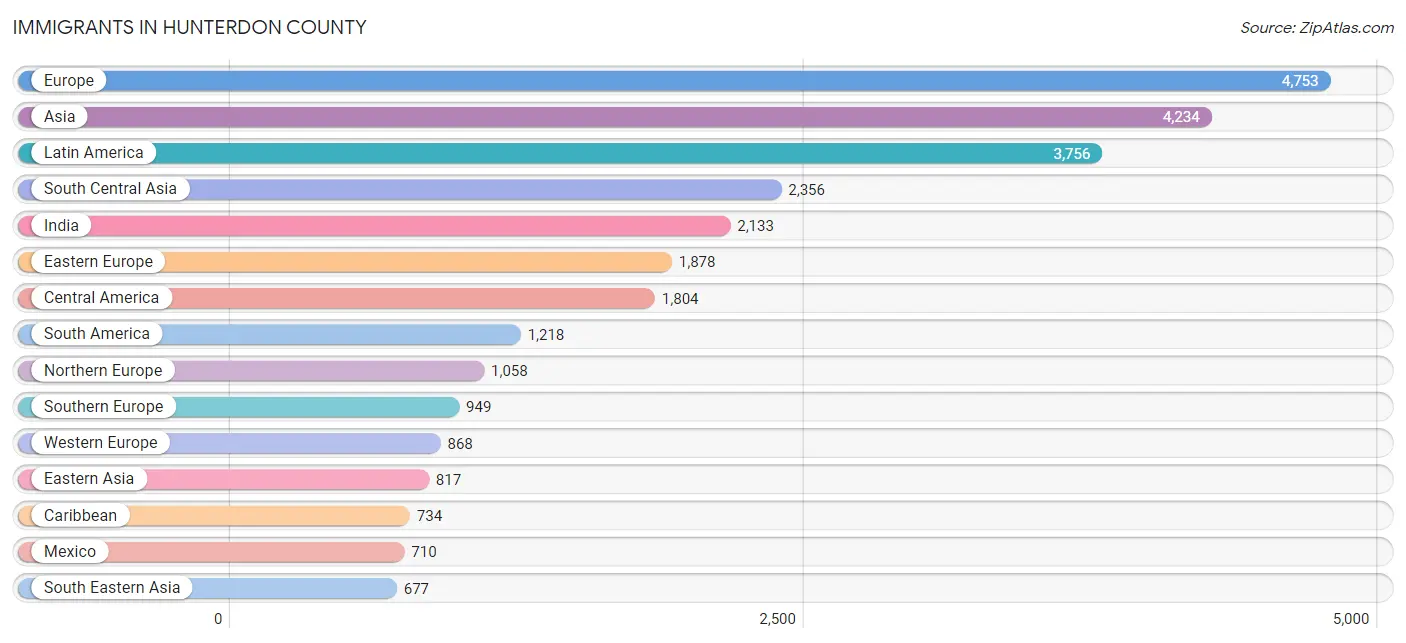
Immigrants in Hunterdon County
The most numerous immigrant groups reported in Hunterdon County came from Europe (4,753 | 3.7%), Asia (4,234 | 3.3%), Latin America (3,756 | 2.9%), South Central Asia (2,356 | 1.8%), and India (2,133 | 1.7%), together accounting for 13.3% of all Hunterdon County residents.
| Immigration Origin | # Population | % Population |
| Africa | 354 | 0.3% |
| Argentina | 56 | 0.0% |
| Asia | 4,234 | 3.3% |
| Australia | 89 | 0.1% |
| Austria | 12 | 0.0% |
| Bangladesh | 126 | 0.1% |
| Barbados | 3 | 0.0% |
| Belarus | 30 | 0.0% |
| Belgium | 34 | 0.0% |
| Bolivia | 33 | 0.0% |
| Brazil | 281 | 0.2% |
| Bulgaria | 20 | 0.0% |
| Cameroon | 13 | 0.0% |
| Canada | 233 | 0.2% |
| Caribbean | 734 | 0.6% |
| Central America | 1,804 | 1.4% |
| Chile | 13 | 0.0% |
| China | 561 | 0.4% |
| Colombia | 344 | 0.3% |
| Costa Rica | 202 | 0.2% |
| Croatia | 43 | 0.0% |
| Cuba | 379 | 0.3% |
| Czechoslovakia | 109 | 0.1% |
| Denmark | 55 | 0.0% |
| Dominican Republic | 139 | 0.1% |
| Eastern Africa | 63 | 0.1% |
| Eastern Asia | 817 | 0.6% |
| Eastern Europe | 1,878 | 1.5% |
| Ecuador | 404 | 0.3% |
| Egypt | 27 | 0.0% |
| El Salvador | 370 | 0.3% |
| England | 388 | 0.3% |
| Europe | 4,753 | 3.7% |
| Fiji | 10 | 0.0% |
| France | 117 | 0.1% |
| Germany | 580 | 0.4% |
| Ghana | 41 | 0.0% |
| Greece | 137 | 0.1% |
| Guatemala | 256 | 0.2% |
| Guyana | 3 | 0.0% |
| Haiti | 33 | 0.0% |
| Honduras | 210 | 0.2% |
| Hong Kong | 1 | 0.0% |
| Hungary | 245 | 0.2% |
| India | 2,133 | 1.7% |
| Iraq | 69 | 0.1% |
| Ireland | 118 | 0.1% |
| Israel | 64 | 0.1% |
| Italy | 226 | 0.2% |
| Jamaica | 178 | 0.1% |
| Japan | 26 | 0.0% |
| Jordan | 13 | 0.0% |
| Kenya | 15 | 0.0% |
| Korea | 230 | 0.2% |
| Laos | 24 | 0.0% |
| Latin America | 3,756 | 2.9% |
| Latvia | 11 | 0.0% |
| Lebanon | 69 | 0.1% |
| Mexico | 710 | 0.5% |
| Middle Africa | 16 | 0.0% |
| Moldova | 28 | 0.0% |
| Morocco | 55 | 0.0% |
| Netherlands | 88 | 0.1% |
| Nicaragua | 47 | 0.0% |
| Nigeria | 59 | 0.1% |
| Northern Africa | 115 | 0.1% |
| Northern Europe | 1,058 | 0.8% |
| Norway | 2 | 0.0% |
| Oceania | 102 | 0.1% |
| Pakistan | 69 | 0.1% |
| Panama | 9 | 0.0% |
| Peru | 19 | 0.0% |
| Philippines | 491 | 0.4% |
| Poland | 672 | 0.5% |
| Portugal | 482 | 0.4% |
| Romania | 48 | 0.0% |
| Russia | 174 | 0.1% |
| Scotland | 39 | 0.0% |
| Serbia | 4 | 0.0% |
| Singapore | 47 | 0.0% |
| South Africa | 60 | 0.1% |
| South America | 1,218 | 0.9% |
| South Central Asia | 2,356 | 1.8% |
| South Eastern Asia | 677 | 0.5% |
| Southern Europe | 949 | 0.7% |
| Spain | 104 | 0.1% |
| Sri Lanka | 28 | 0.0% |
| Sudan | 33 | 0.0% |
| Sweden | 55 | 0.0% |
| Switzerland | 37 | 0.0% |
| Syria | 42 | 0.0% |
| Taiwan | 178 | 0.1% |
| Thailand | 14 | 0.0% |
| Trinidad and Tobago | 2 | 0.0% |
| Turkey | 60 | 0.1% |
| Ukraine | 376 | 0.3% |
| Uruguay | 31 | 0.0% |
| Venezuela | 26 | 0.0% |
| Vietnam | 101 | 0.1% |
| Western Africa | 100 | 0.1% |
| Western Asia | 377 | 0.3% |
| Western Europe | 868 | 0.7% |
| Zimbabwe | 1 | 0.0% | View All 103 Rows |
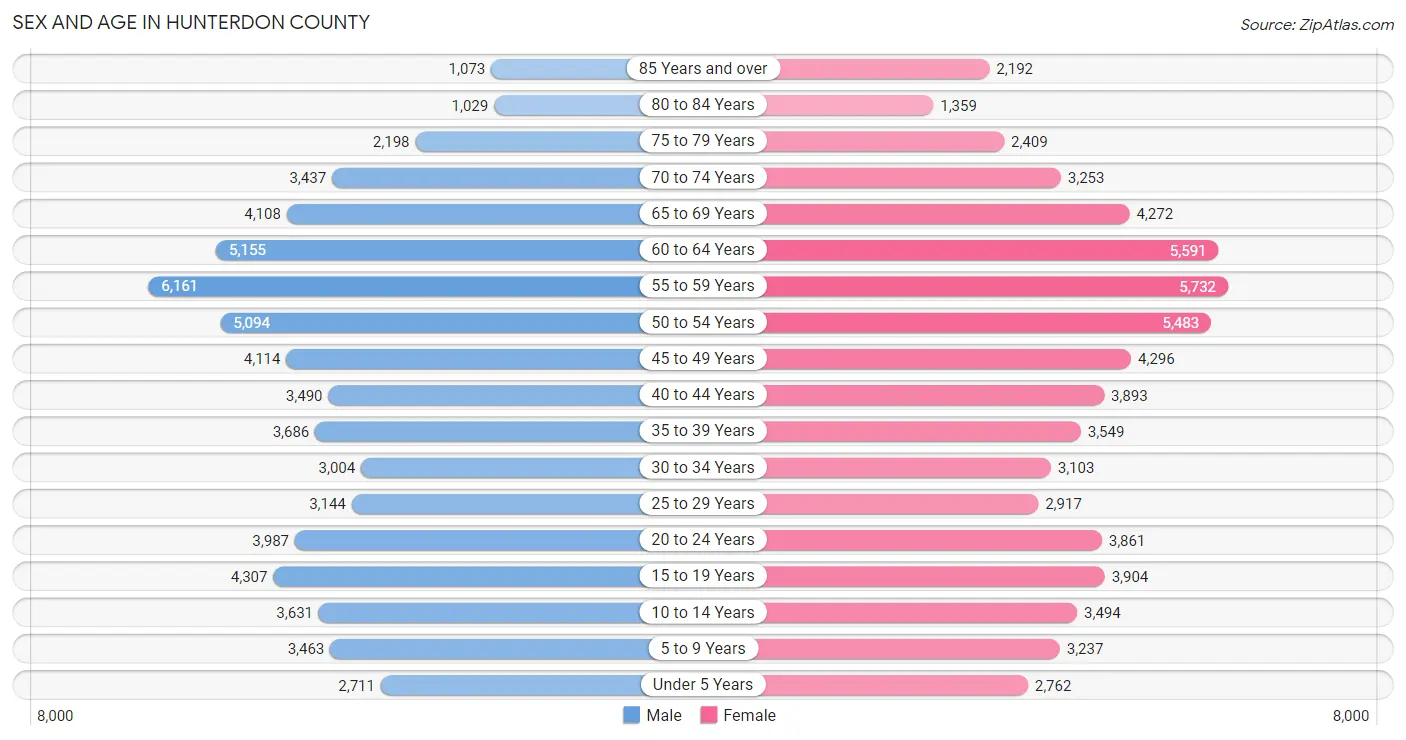
Sex and Age in Hunterdon County
Sex and Age in Hunterdon County
The most populous age groups in Hunterdon County are 55 to 59 Years (6,161 | 9.7%) for men and 55 to 59 Years (5,732 | 8.8%) for women.
| Age Bracket | Male | Female |
| Under 5 Years | 2,711 (4.3%) | 2,762 (4.2%) |
| 5 to 9 Years | 3,463 (5.4%) | 3,237 (5.0%) |
| 10 to 14 Years | 3,631 (5.7%) | 3,494 (5.3%) |
| 15 to 19 Years | 4,307 (6.8%) | 3,904 (6.0%) |
| 20 to 24 Years | 3,987 (6.2%) | 3,861 (5.9%) |
| 25 to 29 Years | 3,144 (4.9%) | 2,917 (4.5%) |
| 30 to 34 Years | 3,004 (4.7%) | 3,103 (4.8%) |
| 35 to 39 Years | 3,686 (5.8%) | 3,549 (5.4%) |
| 40 to 44 Years | 3,490 (5.5%) | 3,893 (6.0%) |
| 45 to 49 Years | 4,114 (6.5%) | 4,296 (6.6%) |
| 50 to 54 Years | 5,094 (8.0%) | 5,483 (8.4%) |
| 55 to 59 Years | 6,161 (9.7%) | 5,732 (8.8%) |
| 60 to 64 Years | 5,155 (8.1%) | 5,591 (8.6%) |
| 65 to 69 Years | 4,108 (6.4%) | 4,272 (6.5%) |
| 70 to 74 Years | 3,437 (5.4%) | 3,253 (5.0%) |
| 75 to 79 Years | 2,198 (3.5%) | 2,409 (3.7%) |
| 80 to 84 Years | 1,029 (1.6%) | 1,359 (2.1%) |
| 85 Years and over | 1,073 (1.7%) | 2,192 (3.4%) |
| Total | 63,792 (100.0%) | 65,307 (100.0%) |
Families and Households in Hunterdon County
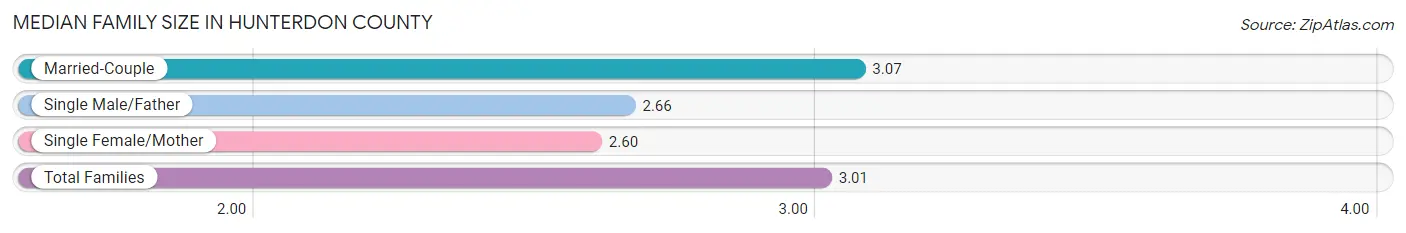
Median Family Size in Hunterdon County
The median family size in Hunterdon County is 3.01 persons per family, with married-couple families (31,029 | 85.9%) accounting for the largest median family size of 3.07 persons per family. On the other hand, single female/mother families (3,519 | 9.7%) represent the smallest median family size with 2.60 persons per family.
| Family Type | # Families | Family Size |
| Married-Couple | 31,029 (85.9%) | 3.07 |
| Single Male/Father | 1,590 (4.4%) | 2.66 |
| Single Female/Mother | 3,519 (9.7%) | 2.60 |
| Total Families | 36,138 (100.0%) | 3.01 |
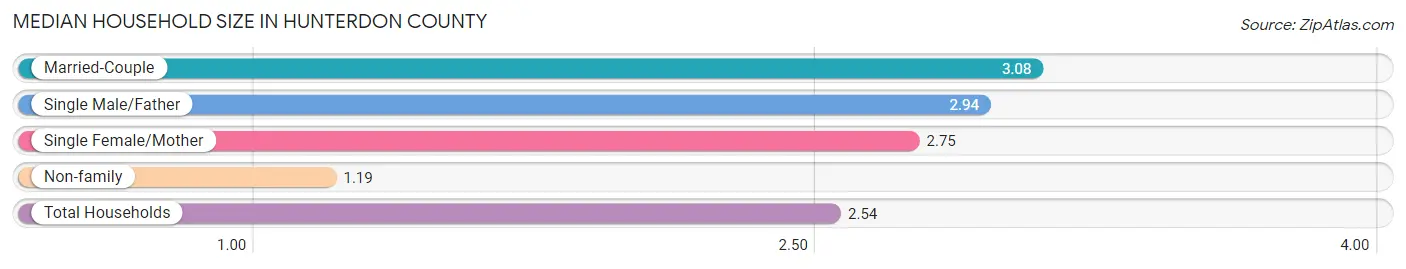
Median Household Size in Hunterdon County
The median household size in Hunterdon County is 2.54 persons per household, with married-couple households (31,029 | 62.5%) accounting for the largest median household size of 3.08 persons per household. non-family households (13,538 | 27.3%) represent the smallest median household size with 1.19 persons per household.
| Household Type | # Households | Household Size |
| Married-Couple | 31,029 (62.5%) | 3.08 |
| Single Male/Father | 1,590 (3.2%) | 2.94 |
| Single Female/Mother | 3,519 (7.1%) | 2.75 |
| Non-family | 13,538 (27.3%) | 1.19 |
| Total Households | 49,676 (100.0%) | 2.54 |
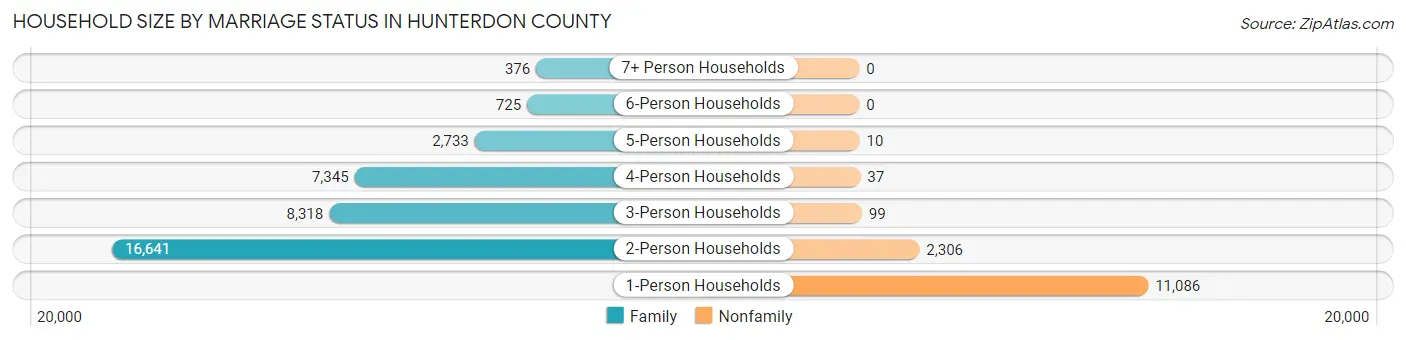
Household Size by Marriage Status in Hunterdon County
Out of a total of 49,676 households in Hunterdon County, 36,138 (72.8%) are family households, while 13,538 (27.3%) are nonfamily households. The most numerous type of family households are 2-person households, comprising 16,641, and the most common type of nonfamily households are 1-person households, comprising 11,086.
| Household Size | Family Households | Nonfamily Households |
| 1-Person Households | - | 11,086 (22.3%) |
| 2-Person Households | 16,641 (33.5%) | 2,306 (4.6%) |
| 3-Person Households | 8,318 (16.7%) | 99 (0.2%) |
| 4-Person Households | 7,345 (14.8%) | 37 (0.1%) |
| 5-Person Households | 2,733 (5.5%) | 10 (0.0%) |
| 6-Person Households | 725 (1.5%) | 0 (0.0%) |
| 7+ Person Households | 376 (0.8%) | 0 (0.0%) |
| Total | 36,138 (72.8%) | 13,538 (27.3%) |
Female Fertility in Hunterdon County
Fertility by Age in Hunterdon County
Average fertility rate in Hunterdon County is 43.0 births per 1,000 women. Women in the age bracket of 20 to 34 years have the highest fertility rate with 65.0 births per 1,000 women. Women in the age bracket of 20 to 34 years acount for 55.7% of all women with births.
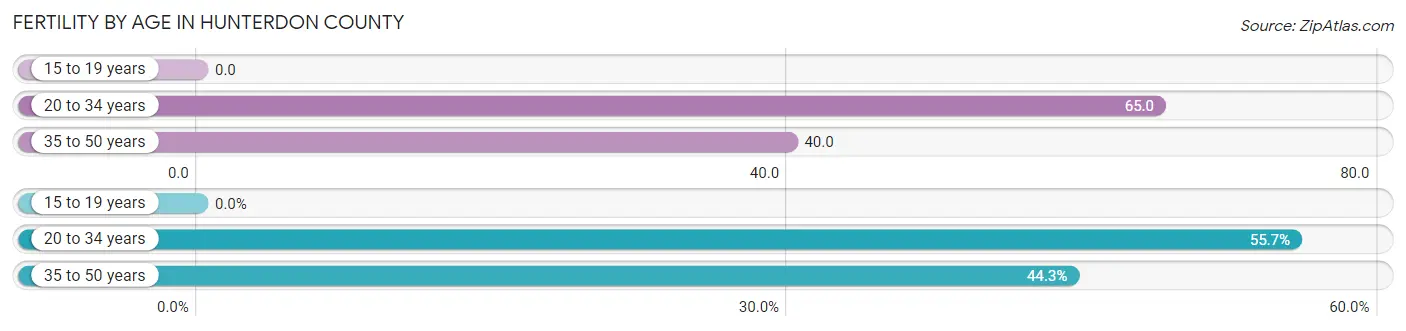
| Age Bracket | Women with Births | Births / 1,000 Women |
| 15 to 19 years | 0 (0.0%) | 0.0 |
| 20 to 34 years | 638 (55.7%) | 65.0 |
| 35 to 50 years | 508 (44.3%) | 40.0 |
| Total | 1,146 (100.0%) | 43.0 |
Fertility by Age by Marriage Status in Hunterdon County
94.3% of women with births (1,146) in Hunterdon County are married. The highest percentage of unmarried women with births falls into 20 to 34 years age bracket with 7.5% of them unmarried at the time of birth, while the lowest percentage of unmarried women with births belong to 35 to 50 years age bracket with 3.3% of them unmarried.
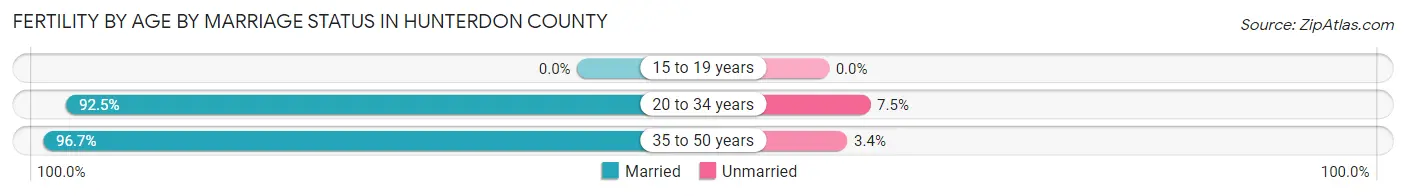
| Age Bracket | Married | Unmarried |
| 15 to 19 years | 0 (0.0%) | 0 (0.0%) |
| 20 to 34 years | 590 (92.5%) | 48 (7.5%) |
| 35 to 50 years | 491 (96.7%) | 17 (3.4%) |
| Total | 1,081 (94.3%) | 65 (5.7%) |
Fertility by Education in Hunterdon County
Average fertility rate in Hunterdon County is 43.0 births per 1,000 women. Women with the education attainment of graduate degree have the highest fertility rate of 67.0 births per 1,000 women, while women with the education attainment of less than high school have the lowest fertility at 2.0 births per 1,000 women. Women with the education attainment of graduate degree represent 33.9% of all women with births.
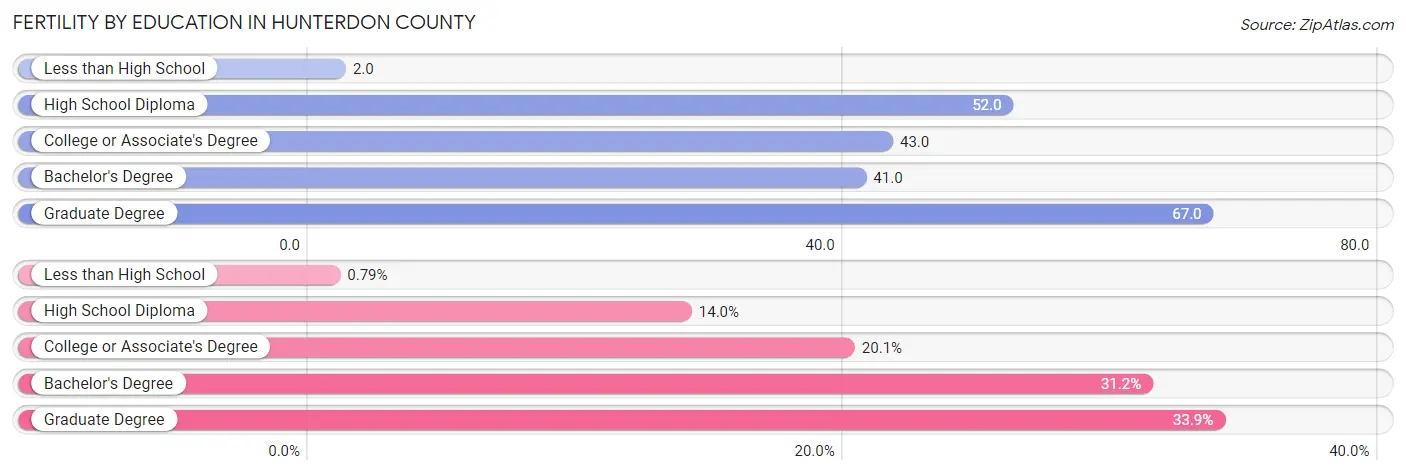
| Educational Attainment | Women with Births | Births / 1,000 Women |
| Less than High School | 9 (0.8%) | 2.0 |
| High School Diploma | 160 (14.0%) | 52.0 |
| College or Associate's Degree | 230 (20.1%) | 43.0 |
| Bachelor's Degree | 358 (31.2%) | 41.0 |
| Graduate Degree | 389 (33.9%) | 67.0 |
| Total | 1,146 (100.0%) | 43.0 |
Fertility by Education by Marriage Status in Hunterdon County
5.7% of women with births in Hunterdon County are unmarried. Women with the educational attainment of less than high school are most likely to be married with 100.0% of them married at childbirth, while women with the educational attainment of high school diploma are least likely to be married with 30.6% of them unmarried at childbirth.
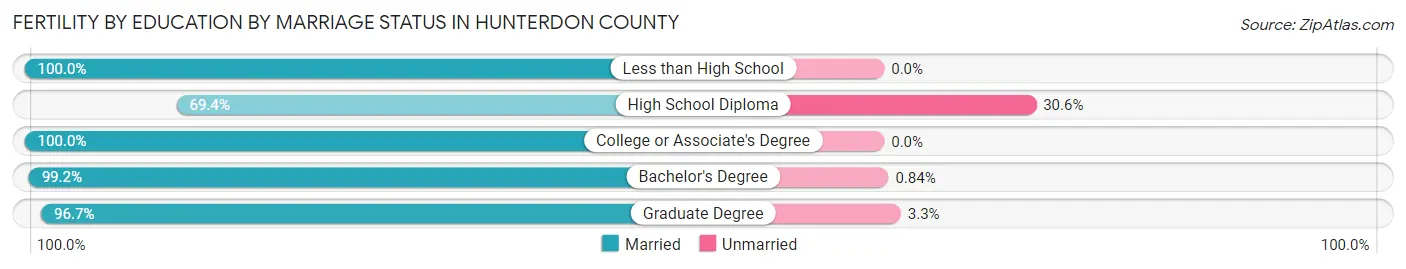
| Educational Attainment | Married | Unmarried |
| Less than High School | 9 (100.0%) | 0 (0.0%) |
| High School Diploma | 111 (69.4%) | 49 (30.6%) |
| College or Associate's Degree | 230 (100.0%) | 0 (0.0%) |
| Bachelor's Degree | 355 (99.2%) | 3 (0.8%) |
| Graduate Degree | 376 (96.7%) | 13 (3.3%) |
| Total | 1,081 (94.3%) | 65 (5.7%) |
Income in Hunterdon County
Income Overview in Hunterdon County
Per Capita Income in Hunterdon County is $68,112, while median incomes of families and households are $161,440 and $133,534 respectively.
| Characteristic | Number | Measure |
| Per Capita Income | 129,099 | $68,112 |
| Median Family Income | 36,138 | $161,440 |
| Mean Family Income | 36,138 | $202,019 |
| Median Household Income | 49,676 | $133,534 |
| Mean Household Income | 49,676 | $176,392 |
| Income Deficit | 36,138 | $9,761 |
| Wage / Income Gap (%) | 129,099 | 35.47% |
| Wage / Income Gap ($) | 129,099 | 64.53¢ per $1 |
| Gini / Inequality Index | 129,099 | 0.44 |
Earnings by Sex in Hunterdon County
Average Earnings in Hunterdon County are $66,739, $81,112 for men and $52,344 for women, a difference of 35.5%.
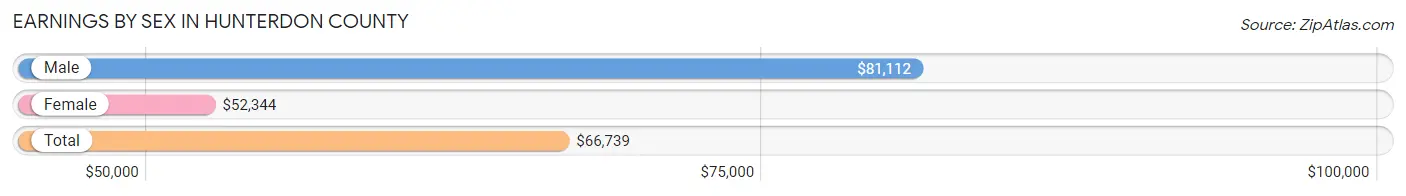
| Sex | Number | Average Earnings |
| Male | 38,532 (52.0%) | $81,112 |
| Female | 35,587 (48.0%) | $52,344 |
| Total | 74,119 (100.0%) | $66,739 |
Earnings by Sex by Income Bracket in Hunterdon County
The most common earnings brackets in Hunterdon County are $100,000+ for men (15,630 | 40.6%) and $100,000+ for women (8,699 | 24.4%).
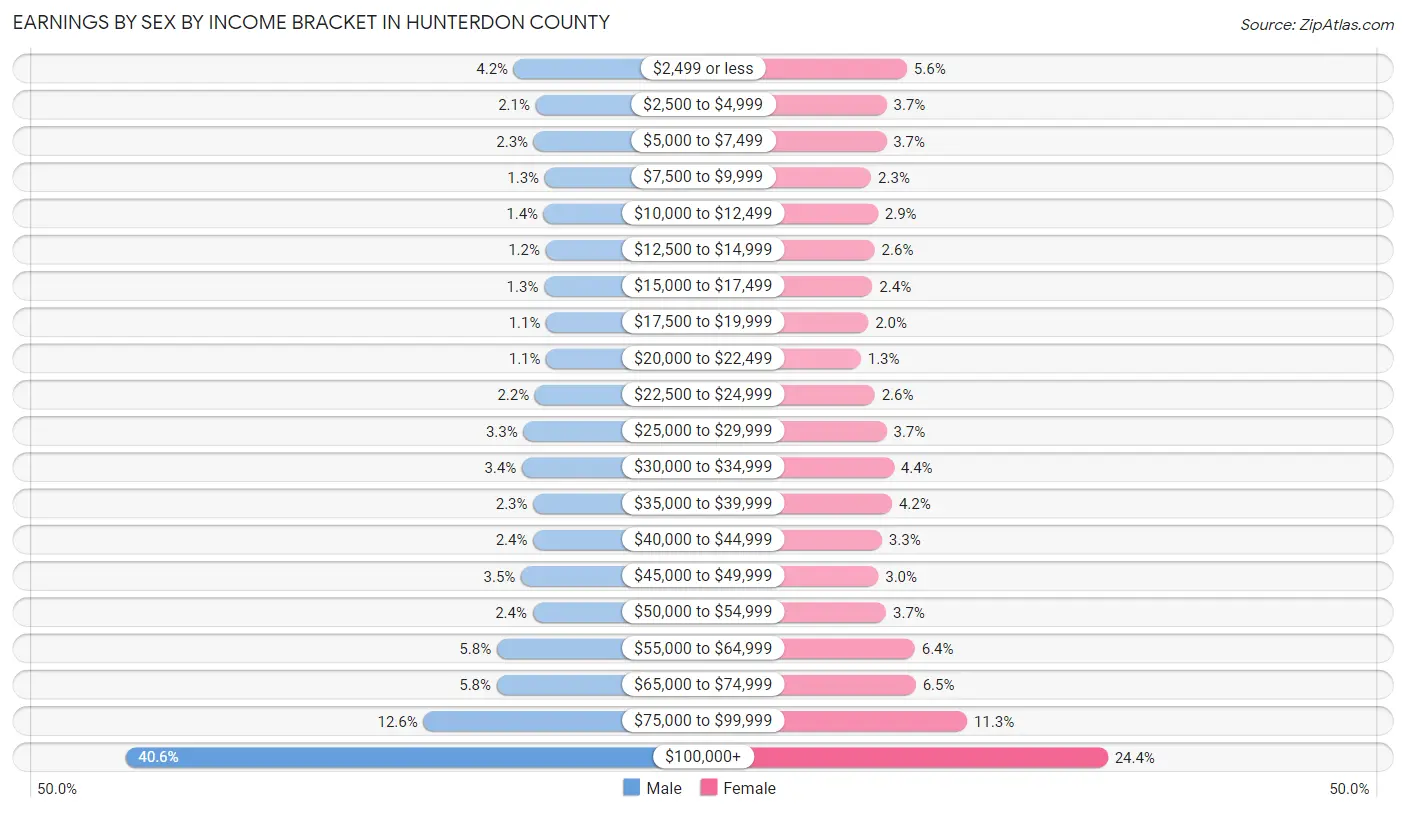
| Income | Male | Female |
| $2,499 or less | 1,603 (4.2%) | 2,004 (5.6%) |
| $2,500 to $4,999 | 812 (2.1%) | 1,323 (3.7%) |
| $5,000 to $7,499 | 884 (2.3%) | 1,312 (3.7%) |
| $7,500 to $9,999 | 485 (1.3%) | 811 (2.3%) |
| $10,000 to $12,499 | 519 (1.3%) | 1,037 (2.9%) |
| $12,500 to $14,999 | 456 (1.2%) | 929 (2.6%) |
| $15,000 to $17,499 | 507 (1.3%) | 853 (2.4%) |
| $17,500 to $19,999 | 434 (1.1%) | 717 (2.0%) |
| $20,000 to $22,499 | 430 (1.1%) | 467 (1.3%) |
| $22,500 to $24,999 | 839 (2.2%) | 931 (2.6%) |
| $25,000 to $29,999 | 1,256 (3.3%) | 1,323 (3.7%) |
| $30,000 to $34,999 | 1,310 (3.4%) | 1,571 (4.4%) |
| $35,000 to $39,999 | 902 (2.3%) | 1,506 (4.2%) |
| $40,000 to $44,999 | 905 (2.4%) | 1,171 (3.3%) |
| $45,000 to $49,999 | 1,339 (3.5%) | 1,049 (2.9%) |
| $50,000 to $54,999 | 919 (2.4%) | 1,310 (3.7%) |
| $55,000 to $64,999 | 2,214 (5.8%) | 2,268 (6.4%) |
| $65,000 to $74,999 | 2,220 (5.8%) | 2,298 (6.5%) |
| $75,000 to $99,999 | 4,868 (12.6%) | 4,008 (11.3%) |
| $100,000+ | 15,630 (40.6%) | 8,699 (24.4%) |
| Total | 38,532 (100.0%) | 35,587 (100.0%) |
Earnings by Sex by Educational Attainment in Hunterdon County
Average earnings in Hunterdon County are $90,804 for men and $62,726 for women, a difference of 30.9%. Men with an educational attainment of graduate degree enjoy the highest average annual earnings of $141,024, while those with less than high school education earn the least with $39,766. Women with an educational attainment of graduate degree earn the most with the average annual earnings of $93,372, while those with less than high school education have the smallest earnings of $18,309.
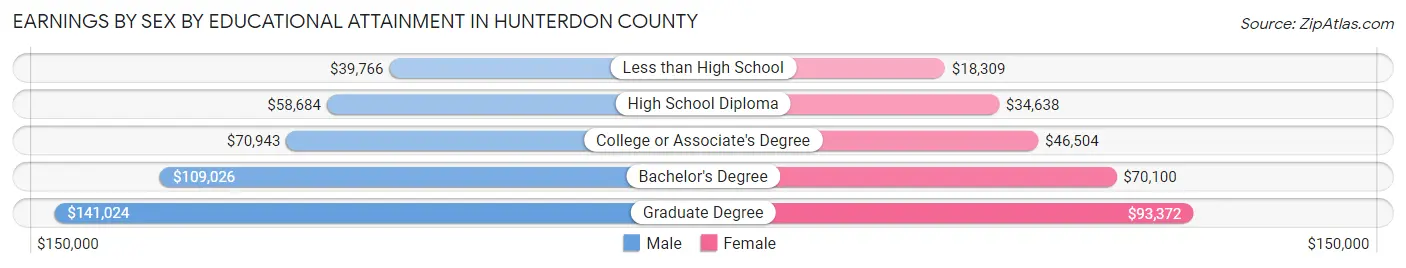
| Educational Attainment | Male Income | Female Income |
| Less than High School | $39,766 | $18,309 |
| High School Diploma | $58,684 | $34,638 |
| College or Associate's Degree | $70,943 | $46,504 |
| Bachelor's Degree | $109,026 | $70,100 |
| Graduate Degree | $141,024 | $93,372 |
| Total | $90,804 | $62,726 |
Family Income in Hunterdon County
Family Income Brackets in Hunterdon County
According to the Hunterdon County family income data, there are 13,046 families falling into the $200,000+ income range, which is the most common income bracket and makes up 36.1% of all families. Conversely, the $10,000 to $14,999 income bracket is the least frequent group with only 72 families (0.2%) belonging to this category.
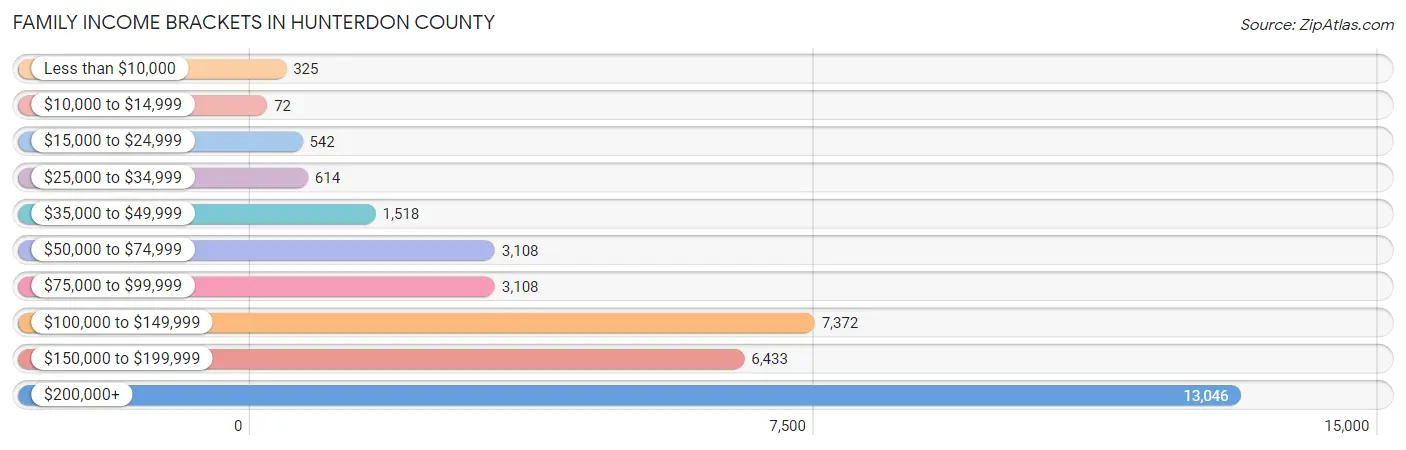
| Income Bracket | # Families | % Families |
| Less than $10,000 | 325 | 0.9% |
| $10,000 to $14,999 | 72 | 0.2% |
| $15,000 to $24,999 | 542 | 1.5% |
| $25,000 to $34,999 | 614 | 1.7% |
| $35,000 to $49,999 | 1,518 | 4.2% |
| $50,000 to $74,999 | 3,108 | 8.6% |
| $75,000 to $99,999 | 3,108 | 8.6% |
| $100,000 to $149,999 | 7,372 | 20.4% |
| $150,000 to $199,999 | 6,433 | 17.8% |
| $200,000+ | 13,046 | 36.1% |
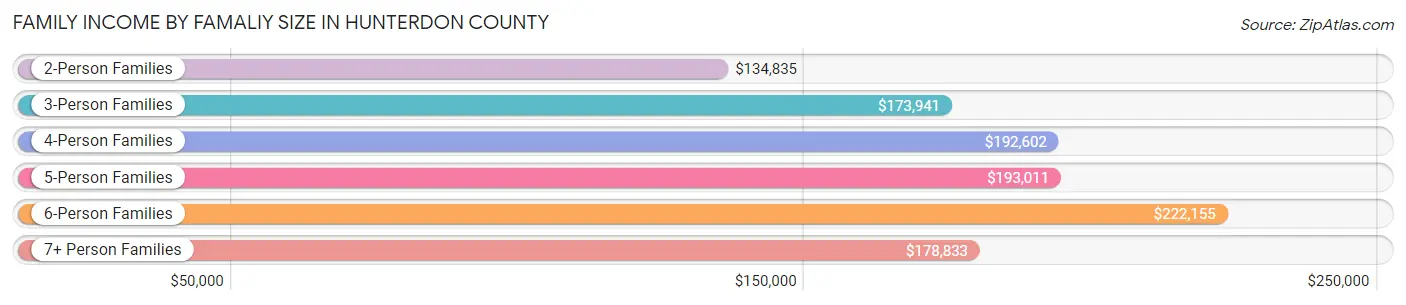
Family Income by Famaliy Size in Hunterdon County
6-person families (716 | 2.0%) account for the highest median family income in Hunterdon County with $222,155 per family, while 2-person families (17,298 | 47.9%) have the highest median income of $67,418 per family member.
| Income Bracket | # Families | Median Income |
| 2-Person Families | 17,298 (47.9%) | $134,835 |
| 3-Person Families | 7,957 (22.0%) | $173,941 |
| 4-Person Families | 7,389 (20.4%) | $192,602 |
| 5-Person Families | 2,470 (6.8%) | $193,011 |
| 6-Person Families | 716 (2.0%) | $222,155 |
| 7+ Person Families | 308 (0.9%) | $178,833 |
| Total | 36,138 (100.0%) | $161,440 |
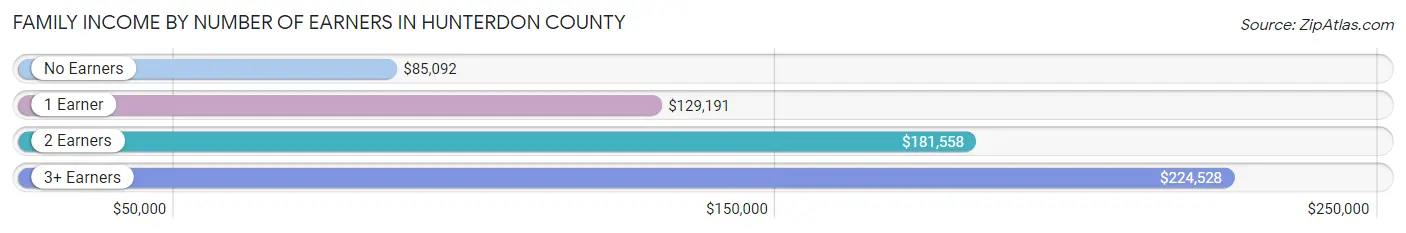
Family Income by Number of Earners in Hunterdon County
The median family income in Hunterdon County is $161,440, with families comprising 3+ earners (5,216) having the highest median family income of $224,528, while families with no earners (4,627) have the lowest median family income of $85,092, accounting for 14.4% and 12.8% of families, respectively.
| Number of Earners | # Families | Median Income |
| No Earners | 4,627 (12.8%) | $85,092 |
| 1 Earner | 9,611 (26.6%) | $129,191 |
| 2 Earners | 16,684 (46.2%) | $181,558 |
| 3+ Earners | 5,216 (14.4%) | $224,528 |
| Total | 36,138 (100.0%) | $161,440 |
Household Income in Hunterdon County
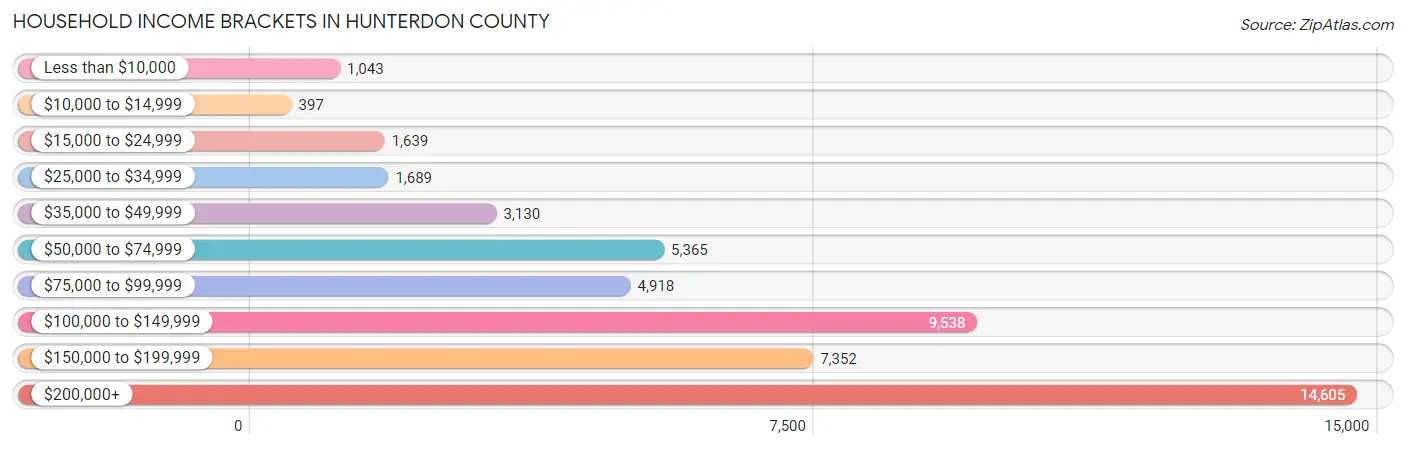
Household Income Brackets in Hunterdon County
With 14,605 households falling in the category, the $200,000+ income range is the most frequent in Hunterdon County, accounting for 29.4% of all households. In contrast, only 397 households (0.8%) fall into the $10,000 to $14,999 income bracket, making it the least populous group.
| Income Bracket | # Households | % Households |
| Less than $10,000 | 1,043 | 2.1% |
| $10,000 to $14,999 | 397 | 0.8% |
| $15,000 to $24,999 | 1,639 | 3.3% |
| $25,000 to $34,999 | 1,689 | 3.4% |
| $35,000 to $49,999 | 3,130 | 6.3% |
| $50,000 to $74,999 | 5,365 | 10.8% |
| $75,000 to $99,999 | 4,918 | 9.9% |
| $100,000 to $149,999 | 9,538 | 19.2% |
| $150,000 to $199,999 | 7,352 | 14.8% |
| $200,000+ | 14,605 | 29.4% |
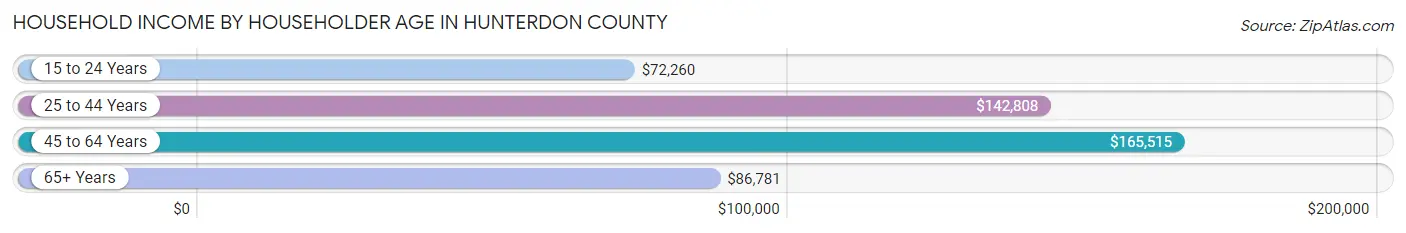
Household Income by Householder Age in Hunterdon County
The median household income in Hunterdon County is $133,534, with the highest median household income of $165,515 found in the 45 to 64 years age bracket for the primary householder. A total of 23,327 households (47.0%) fall into this category. Meanwhile, the 15 to 24 years age bracket for the primary householder has the lowest median household income of $72,260, with 229 households (0.5%) in this group.
| Income Bracket | # Households | Median Income |
| 15 to 24 Years | 229 (0.5%) | $72,260 |
| 25 to 44 Years | 11,419 (23.0%) | $142,808 |
| 45 to 64 Years | 23,327 (47.0%) | $165,515 |
| 65+ Years | 14,701 (29.6%) | $86,781 |
| Total | 49,676 (100.0%) | $133,534 |
Poverty in Hunterdon County
Income Below Poverty by Sex and Age in Hunterdon County
With 3.2% poverty level for males and 4.1% for females among the residents of Hunterdon County, 12 to 14 year old males and 15 year old females are the most vulnerable to poverty, with 145 males (6.4%) and 62 females (10.0%) in their respective age groups living below the poverty level.
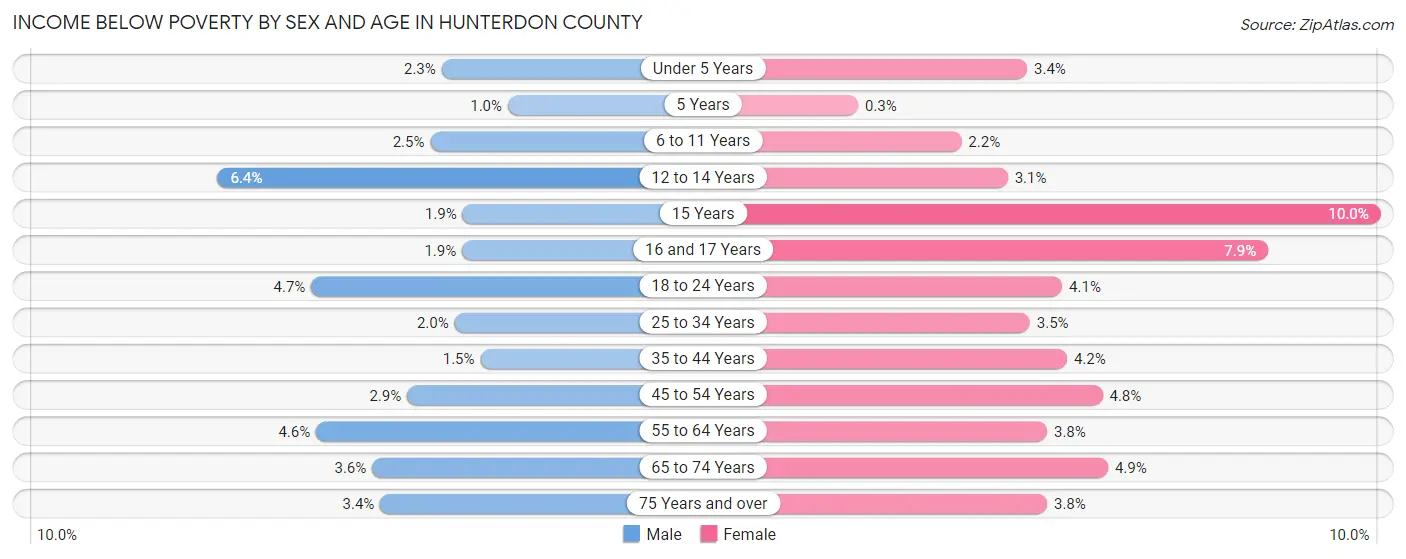
| Age Bracket | Male | Female |
| Under 5 Years | 61 (2.3%) | 95 (3.4%) |
| 5 Years | 7 (1.0%) | 2 (0.3%) |
| 6 to 11 Years | 101 (2.5%) | 88 (2.2%) |
| 12 to 14 Years | 145 (6.4%) | 64 (3.1%) |
| 15 Years | 13 (1.9%) | 62 (10.0%) |
| 16 and 17 Years | 36 (1.9%) | 153 (7.9%) |
| 18 to 24 Years | 235 (4.7%) | 206 (4.1%) |
| 25 to 34 Years | 117 (2.0%) | 204 (3.5%) |
| 35 to 44 Years | 108 (1.5%) | 307 (4.2%) |
| 45 to 54 Years | 266 (2.9%) | 472 (4.8%) |
| 55 to 64 Years | 517 (4.6%) | 429 (3.8%) |
| 65 to 74 Years | 266 (3.5%) | 368 (4.9%) |
| 75 Years and over | 144 (3.4%) | 219 (3.8%) |
| Total | 2,016 (3.2%) | 2,669 (4.1%) |
Income Above Poverty by Sex and Age in Hunterdon County
According to the poverty statistics in Hunterdon County, males aged 5 years and females aged 5 years are the age groups that are most secure financially, with 99.0% of males and 99.7% of females in these age groups living above the poverty line.
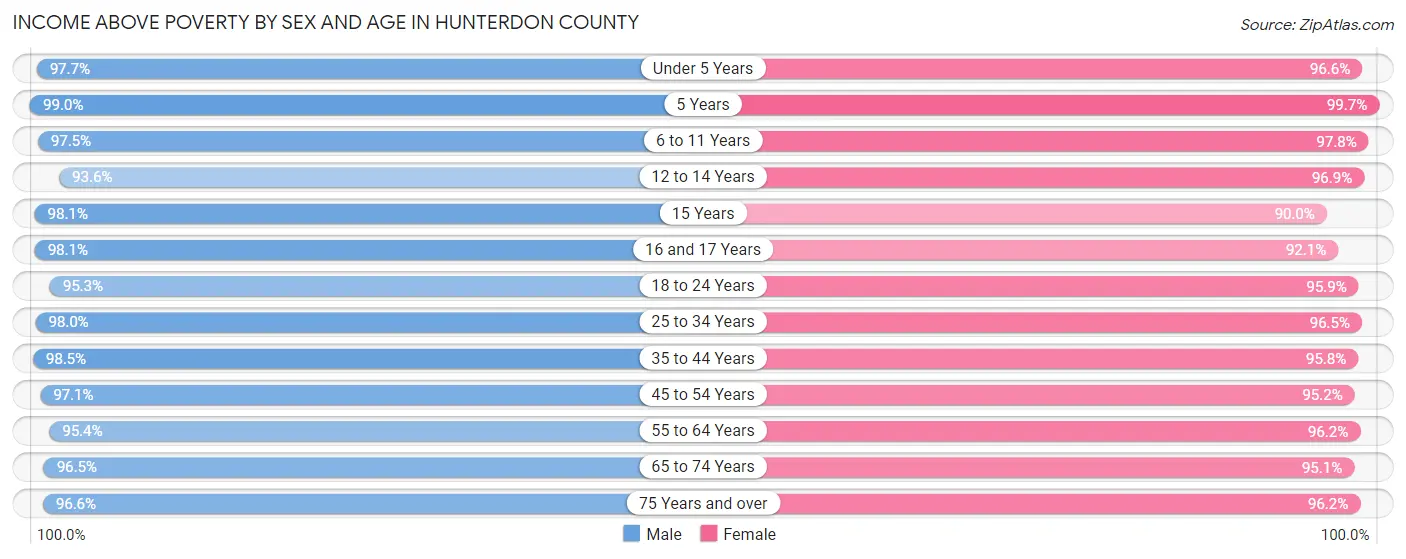
| Age Bracket | Male | Female |
| Under 5 Years | 2,643 (97.7%) | 2,666 (96.6%) |
| 5 Years | 675 (99.0%) | 673 (99.7%) |
| 6 to 11 Years | 3,981 (97.5%) | 3,879 (97.8%) |
| 12 to 14 Years | 2,115 (93.6%) | 2,012 (96.9%) |
| 15 Years | 684 (98.1%) | 558 (90.0%) |
| 16 and 17 Years | 1,880 (98.1%) | 1,781 (92.1%) |
| 18 to 24 Years | 4,787 (95.3%) | 4,833 (95.9%) |
| 25 to 34 Years | 5,673 (98.0%) | 5,634 (96.5%) |
| 35 to 44 Years | 6,919 (98.5%) | 7,038 (95.8%) |
| 45 to 54 Years | 8,916 (97.1%) | 9,275 (95.2%) |
| 55 to 64 Years | 10,736 (95.4%) | 10,841 (96.2%) |
| 65 to 74 Years | 7,217 (96.5%) | 7,079 (95.1%) |
| 75 Years and over | 4,097 (96.6%) | 5,532 (96.2%) |
| Total | 60,323 (96.8%) | 61,801 (95.9%) |
Income Below Poverty Among Married-Couple Families in Hunterdon County
The poverty statistics for married-couple families in Hunterdon County show that 1.1% or 353 of the total 31,029 families live below the poverty line. Families with 1 or 2 children have the highest poverty rate of 1.8%, comprising of 173 families. On the other hand, families with 5 or more children have the lowest poverty rate of 0.0%, which includes 0 families.
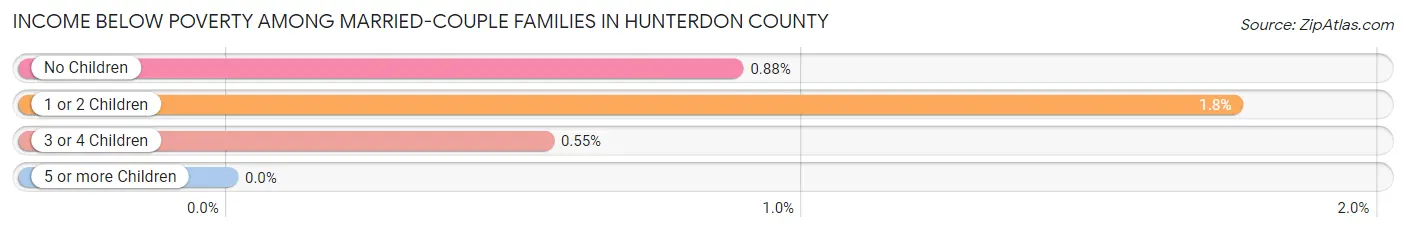
| Children | Above Poverty | Below Poverty |
| No Children | 19,065 (99.1%) | 170 (0.9%) |
| 1 or 2 Children | 9,712 (98.3%) | 173 (1.8%) |
| 3 or 4 Children | 1,800 (99.5%) | 10 (0.5%) |
| 5 or more Children | 99 (100.0%) | 0 (0.0%) |
| Total | 30,676 (98.9%) | 353 (1.1%) |
Income Below Poverty Among Single-Parent Households in Hunterdon County
According to the poverty data in Hunterdon County, 2.8% or 44 single-father households and 10.1% or 356 single-mother households are living below the poverty line. Among single-father households, those with 1 or 2 children have the highest poverty rate, with 44 households (5.4%) experiencing poverty. Likewise, among single-mother households, those with 3 or 4 children have the highest poverty rate, with 62 households (37.8%) falling below the poverty line.
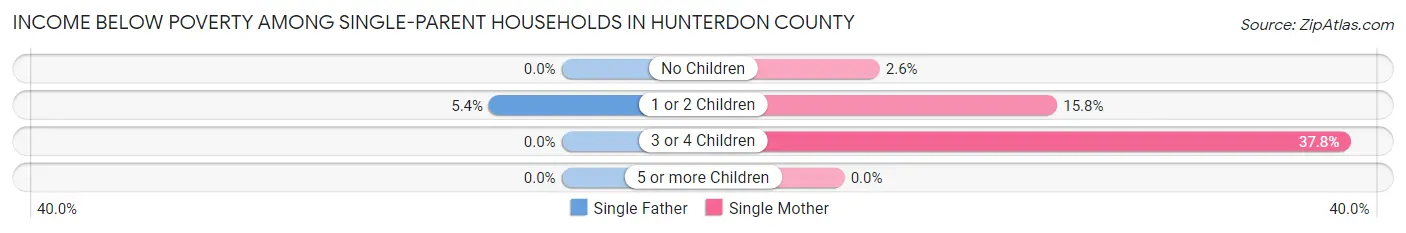
| Children | Single Father | Single Mother |
| No Children | 0 (0.0%) | 47 (2.6%) |
| 1 or 2 Children | 44 (5.4%) | 247 (15.8%) |
| 3 or 4 Children | 0 (0.0%) | 62 (37.8%) |
| 5 or more Children | 0 (0.0%) | 0 (0.0%) |
| Total | 44 (2.8%) | 356 (10.1%) |
Income Below Poverty Among Married-Couple vs Single-Parent Households in Hunterdon County
The poverty data for Hunterdon County shows that 353 of the married-couple family households (1.1%) and 400 of the single-parent households (7.8%) are living below the poverty level. Within the married-couple family households, those with 1 or 2 children have the highest poverty rate, with 173 households (1.8%) falling below the poverty line. Among the single-parent households, those with 3 or 4 children have the highest poverty rate, with 62 household (21.7%) living below poverty.
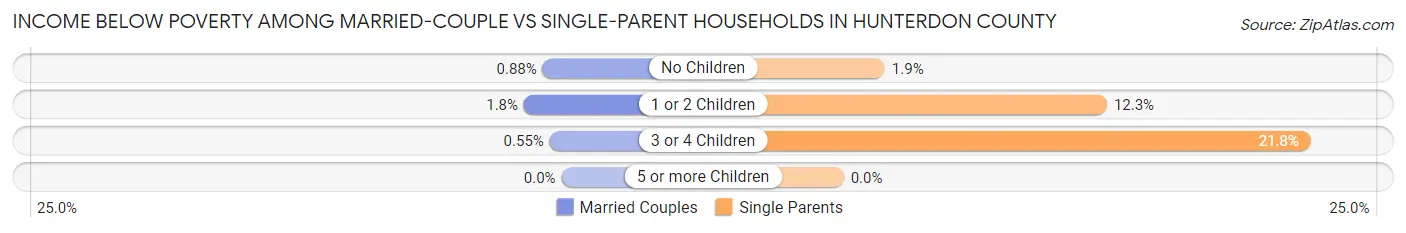
| Children | Married-Couple Families | Single-Parent Households |
| No Children | 170 (0.9%) | 47 (1.9%) |
| 1 or 2 Children | 173 (1.8%) | 291 (12.3%) |
| 3 or 4 Children | 10 (0.5%) | 62 (21.7%) |
| 5 or more Children | 0 (0.0%) | 0 (0.0%) |
| Total | 353 (1.1%) | 400 (7.8%) |
Employment Characteristics in Hunterdon County
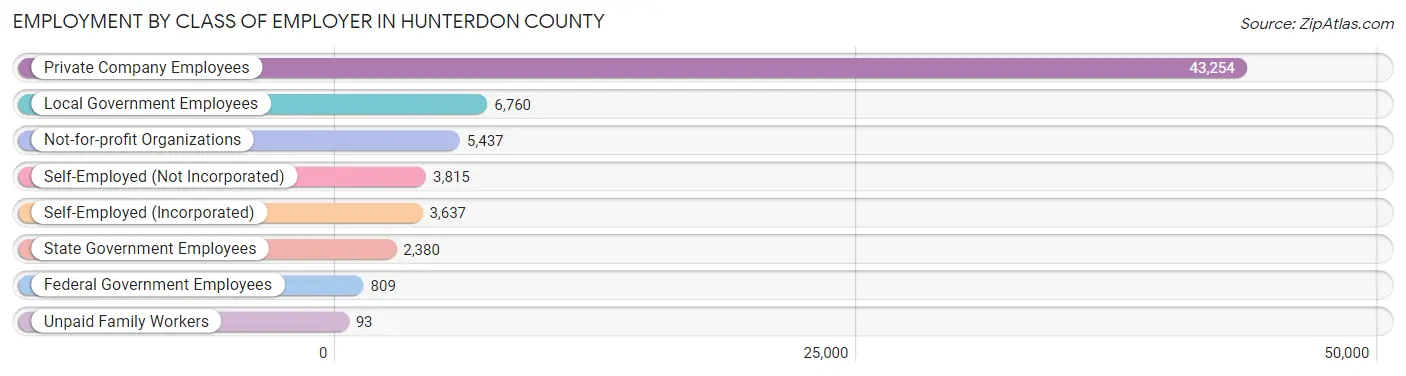
Employment by Class of Employer in Hunterdon County
Among the 66,185 employed individuals in Hunterdon County, private company employees (43,254 | 65.3%), local government employees (6,760 | 10.2%), and not-for-profit organizations (5,437 | 8.2%) make up the most common classes of employment.
| Employer Class | # Employees | % Employees |
| Private Company Employees | 43,254 | 65.3% |
| Self-Employed (Incorporated) | 3,637 | 5.5% |
| Self-Employed (Not Incorporated) | 3,815 | 5.8% |
| Not-for-profit Organizations | 5,437 | 8.2% |
| Local Government Employees | 6,760 | 10.2% |
| State Government Employees | 2,380 | 3.6% |
| Federal Government Employees | 809 | 1.2% |
| Unpaid Family Workers | 93 | 0.1% |
| Total | 66,185 | 100.0% |
Employment Status by Age in Hunterdon County
According to the labor force statistics for Hunterdon County, out of the total population over 16 years of age (108,459), 65.4% or 70,932 individuals are in the labor force, with 4.6% or 3,263 of them unemployed. The age group with the highest labor force participation rate is 45 to 54 years, with 88.1% or 16,728 individuals in the labor force. Within the labor force, the 16 to 19 years age range has the highest percentage of unemployed individuals, with 16.4% or 465 of them being unemployed.
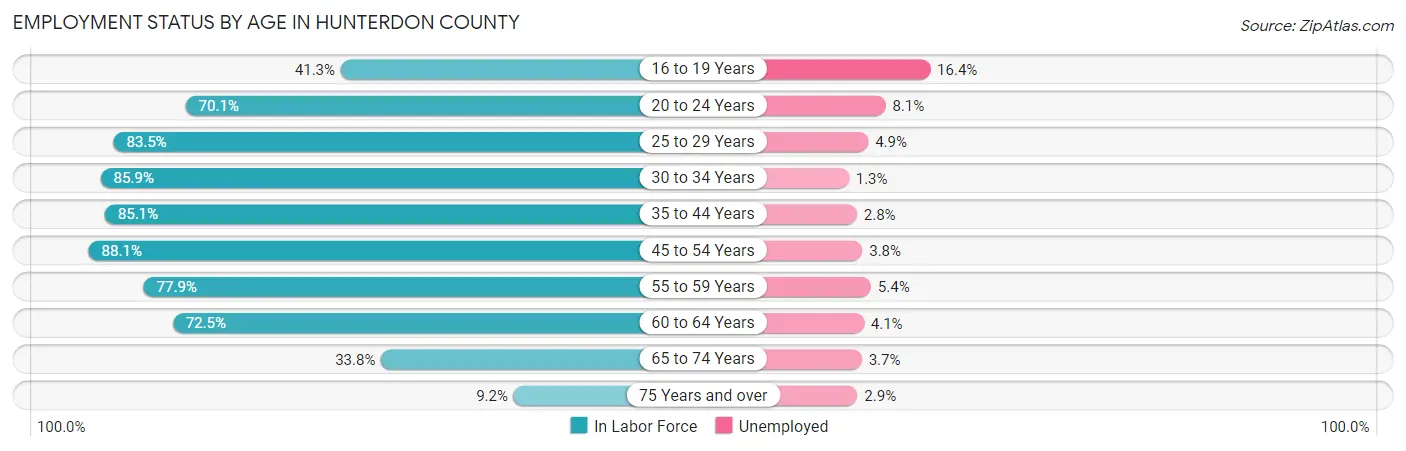
| Age Bracket | In Labor Force | Unemployed |
| 16 to 19 Years | 2,837 (41.3%) | 465 (16.4%) |
| 20 to 24 Years | 5,501 (70.1%) | 446 (8.1%) |
| 25 to 29 Years | 5,061 (83.5%) | 248 (4.9%) |
| 30 to 34 Years | 5,246 (85.9%) | 68 (1.3%) |
| 35 to 44 Years | 12,440 (85.1%) | 348 (2.8%) |
| 45 to 54 Years | 16,728 (88.1%) | 636 (3.8%) |
| 55 to 59 Years | 9,265 (77.9%) | 500 (5.4%) |
| 60 to 64 Years | 7,791 (72.5%) | 319 (4.1%) |
| 65 to 74 Years | 5,094 (33.8%) | 188 (3.7%) |
| 75 Years and over | 944 (9.2%) | 27 (2.9%) |
| Total | 70,932 (65.4%) | 3,263 (4.6%) |
Employment Status by Educational Attainment in Hunterdon County
According to labor force statistics for Hunterdon County, 82.6% of individuals (56,508) out of the total population between 25 and 64 years of age (68,412) are in the labor force, with 3.8% or 2,147 of them being unemployed. The group with the highest labor force participation rate are those with the educational attainment of bachelor's degree or higher, with 87.7% or 35,839 individuals in the labor force. Within the labor force, individuals with less than high school education have the highest percentage of unemployment, with 5.7% or 90 of them being unemployed.
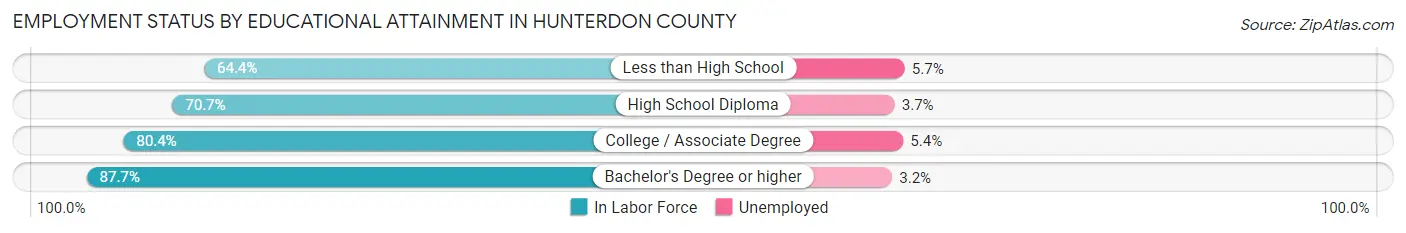
| Educational Attainment | In Labor Force | Unemployed |
| Less than High School | 1,586 (64.4%) | 140 (5.7%) |
| High School Diploma | 7,680 (70.7%) | 402 (3.7%) |
| College / Associate Degree | 11,434 (80.4%) | 768 (5.4%) |
| Bachelor's Degree or higher | 35,839 (87.7%) | 1,308 (3.2%) |
| Total | 56,508 (82.6%) | 2,600 (3.8%) |
Employment Occupations by Sex in Hunterdon County
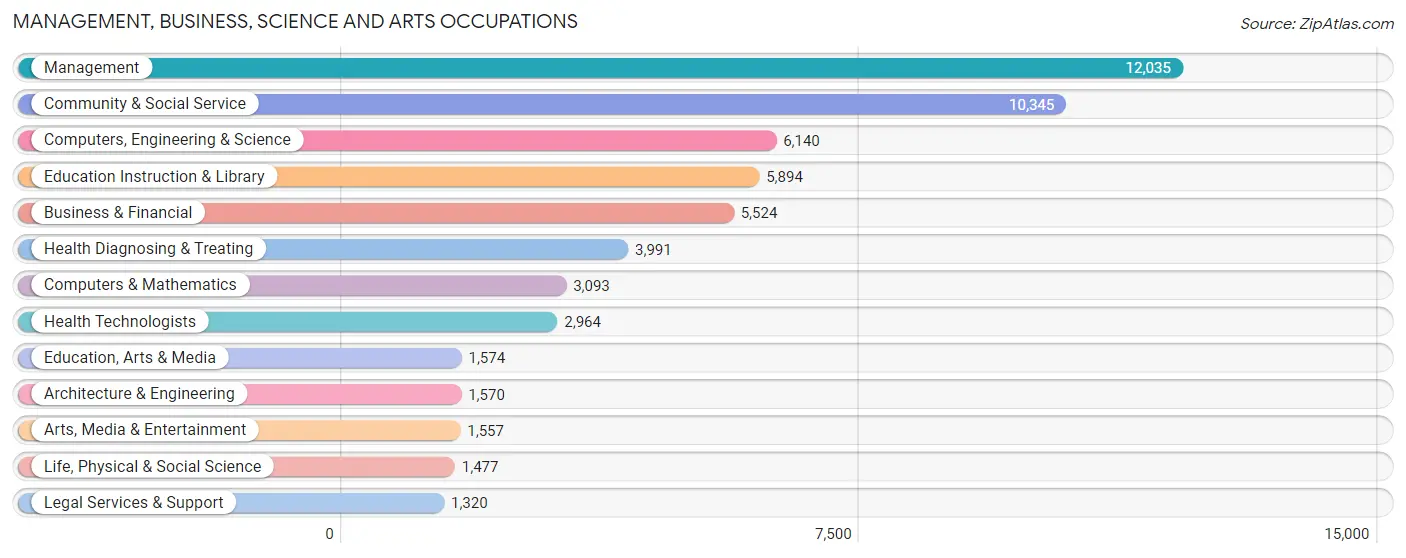
Management, Business, Science and Arts Occupations
The most common Management, Business, Science and Arts occupations in Hunterdon County are Management (12,035 | 17.8%), Community & Social Service (10,345 | 15.3%), Computers, Engineering & Science (6,140 | 9.1%), Education Instruction & Library (5,894 | 8.7%), and Business & Financial (5,524 | 8.2%).
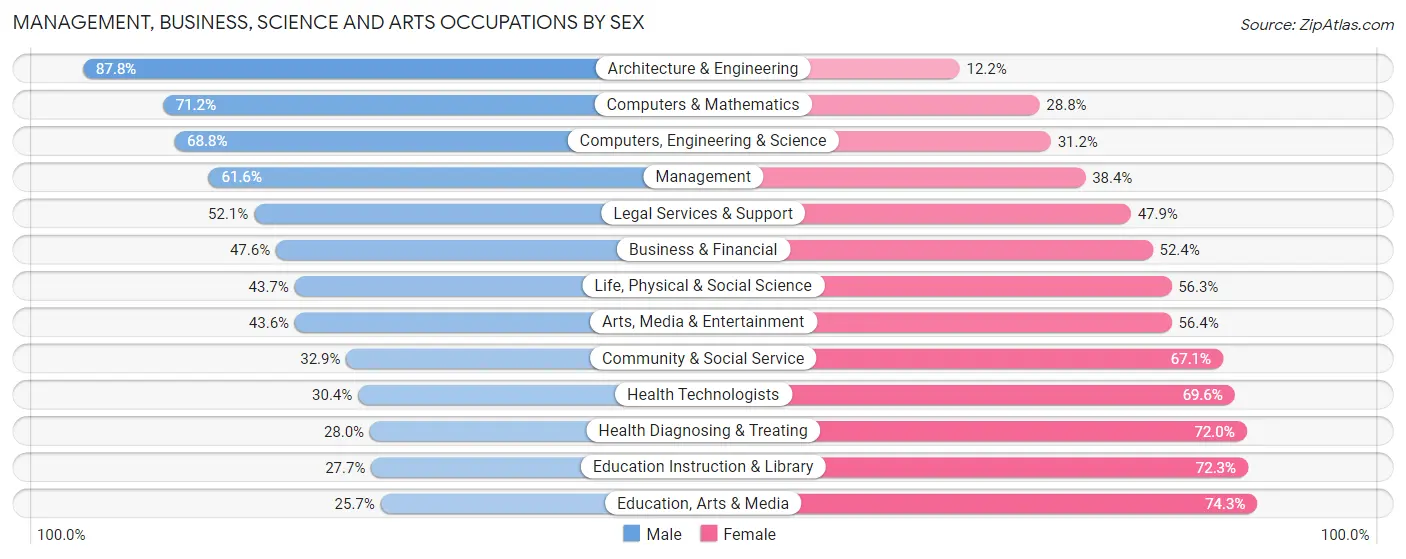
Management, Business, Science and Arts Occupations by Sex
Within the Management, Business, Science and Arts occupations in Hunterdon County, the most male-oriented occupations are Architecture & Engineering (87.8%), Computers & Mathematics (71.2%), and Computers, Engineering & Science (68.8%), while the most female-oriented occupations are Education, Arts & Media (74.3%), Education Instruction & Library (72.3%), and Health Diagnosing & Treating (72.0%).
| Occupation | Male | Female |
| Management | 7,415 (61.6%) | 4,620 (38.4%) |
| Business & Financial | 2,627 (47.6%) | 2,897 (52.4%) |
| Computers, Engineering & Science | 4,225 (68.8%) | 1,915 (31.2%) |
| Computers & Mathematics | 2,201 (71.2%) | 892 (28.8%) |
| Architecture & Engineering | 1,379 (87.8%) | 191 (12.2%) |
| Life, Physical & Social Science | 645 (43.7%) | 832 (56.3%) |
| Community & Social Service | 3,404 (32.9%) | 6,941 (67.1%) |
| Education, Arts & Media | 405 (25.7%) | 1,169 (74.3%) |
| Legal Services & Support | 688 (52.1%) | 632 (47.9%) |
| Education Instruction & Library | 1,632 (27.7%) | 4,262 (72.3%) |
| Arts, Media & Entertainment | 679 (43.6%) | 878 (56.4%) |
| Health Diagnosing & Treating | 1,116 (28.0%) | 2,875 (72.0%) |
| Health Technologists | 902 (30.4%) | 2,062 (69.6%) |
| Total (Category) | 18,787 (49.4%) | 19,248 (50.6%) |
| Total (Overall) | 35,221 (52.1%) | 32,411 (47.9%) |
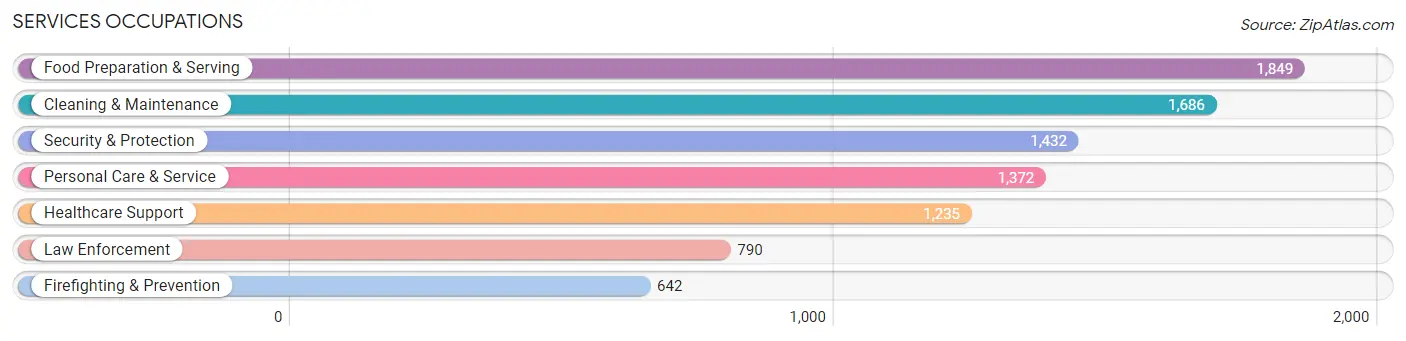
Services Occupations
The most common Services occupations in Hunterdon County are Food Preparation & Serving (1,849 | 2.7%), Cleaning & Maintenance (1,686 | 2.5%), Security & Protection (1,432 | 2.1%), Personal Care & Service (1,372 | 2.0%), and Healthcare Support (1,235 | 1.8%).
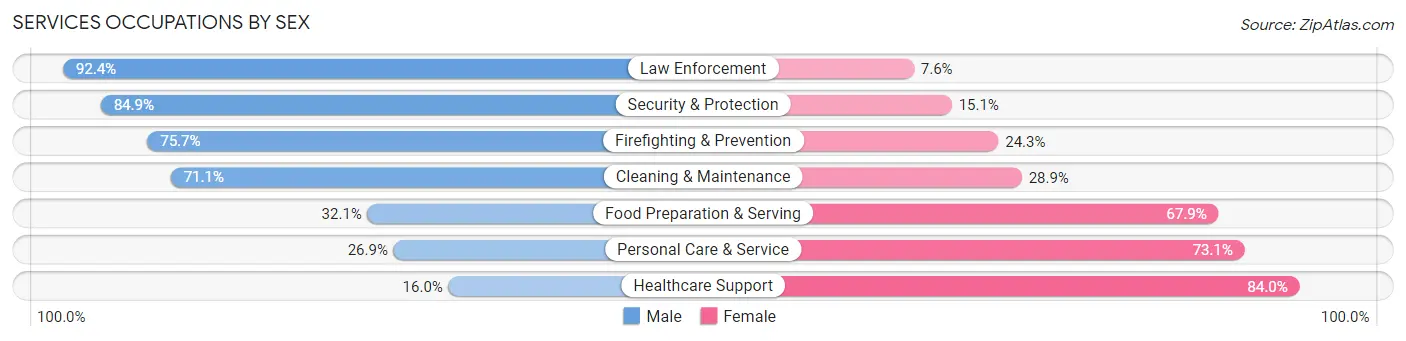
Services Occupations by Sex
Within the Services occupations in Hunterdon County, the most male-oriented occupations are Law Enforcement (92.4%), Security & Protection (84.9%), and Firefighting & Prevention (75.7%), while the most female-oriented occupations are Healthcare Support (84.0%), Personal Care & Service (73.1%), and Food Preparation & Serving (67.9%).
| Occupation | Male | Female |
| Healthcare Support | 198 (16.0%) | 1,037 (84.0%) |
| Security & Protection | 1,216 (84.9%) | 216 (15.1%) |
| Firefighting & Prevention | 486 (75.7%) | 156 (24.3%) |
| Law Enforcement | 730 (92.4%) | 60 (7.6%) |
| Food Preparation & Serving | 593 (32.1%) | 1,256 (67.9%) |
| Cleaning & Maintenance | 1,198 (71.1%) | 488 (28.9%) |
| Personal Care & Service | 369 (26.9%) | 1,003 (73.1%) |
| Total (Category) | 3,574 (47.2%) | 4,000 (52.8%) |
| Total (Overall) | 35,221 (52.1%) | 32,411 (47.9%) |
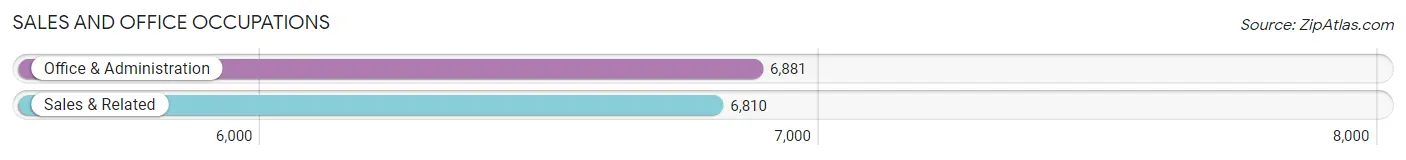
Sales and Office Occupations
The most common Sales and Office occupations in Hunterdon County are Office & Administration (6,881 | 10.2%), and Sales & Related (6,810 | 10.1%).
Sales and Office Occupations by Sex
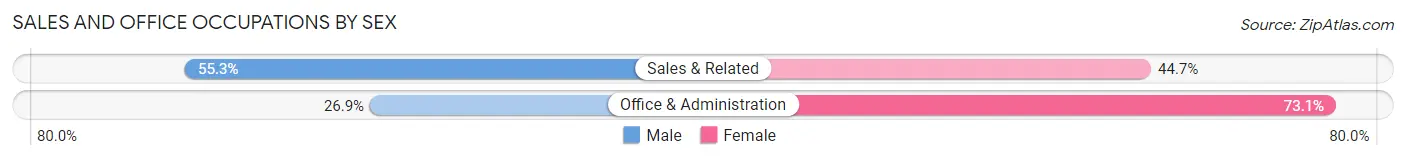
| Occupation | Male | Female |
| Sales & Related | 3,766 (55.3%) | 3,044 (44.7%) |
| Office & Administration | 1,849 (26.9%) | 5,032 (73.1%) |
| Total (Category) | 5,615 (41.0%) | 8,076 (59.0%) |
| Total (Overall) | 35,221 (52.1%) | 32,411 (47.9%) |
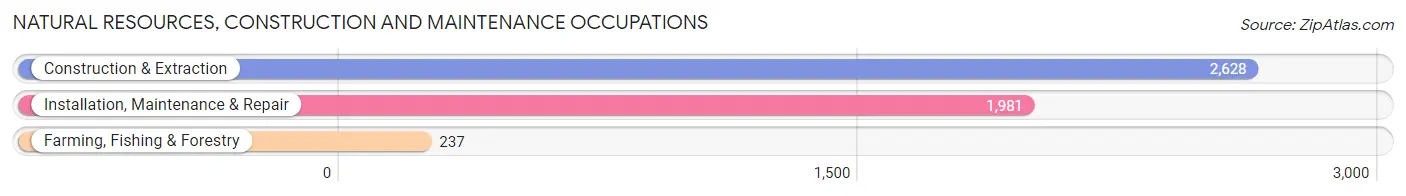
Natural Resources, Construction and Maintenance Occupations
The most common Natural Resources, Construction and Maintenance occupations in Hunterdon County are Construction & Extraction (2,628 | 3.9%), Installation, Maintenance & Repair (1,981 | 2.9%), and Farming, Fishing & Forestry (237 | 0.4%).
Natural Resources, Construction and Maintenance Occupations by Sex
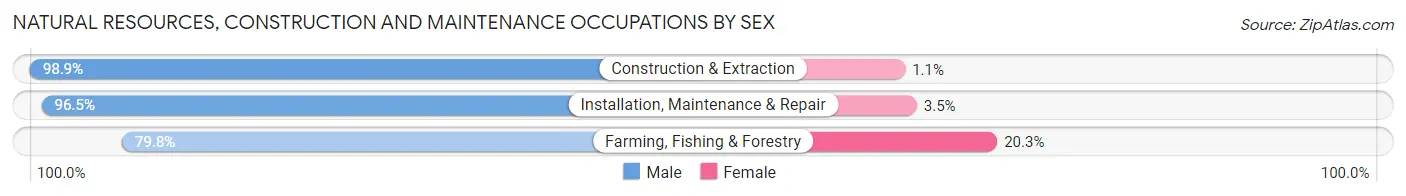
| Occupation | Male | Female |
| Farming, Fishing & Forestry | 189 (79.7%) | 48 (20.3%) |
| Construction & Extraction | 2,599 (98.9%) | 29 (1.1%) |
| Installation, Maintenance & Repair | 1,911 (96.5%) | 70 (3.5%) |
| Total (Category) | 4,699 (97.0%) | 147 (3.0%) |
| Total (Overall) | 35,221 (52.1%) | 32,411 (47.9%) |
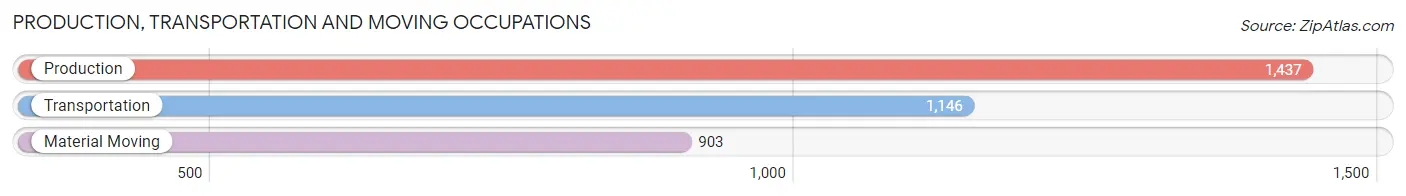
Production, Transportation and Moving Occupations
The most common Production, Transportation and Moving occupations in Hunterdon County are Production (1,437 | 2.1%), Transportation (1,146 | 1.7%), and Material Moving (903 | 1.3%).
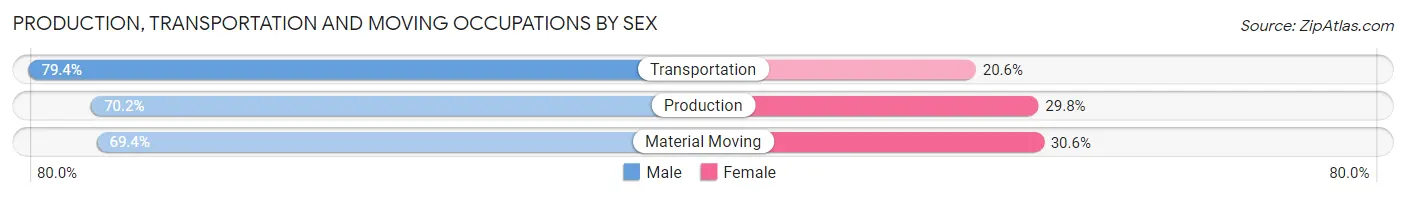
Production, Transportation and Moving Occupations by Sex
| Occupation | Male | Female |
| Production | 1,009 (70.2%) | 428 (29.8%) |
| Transportation | 910 (79.4%) | 236 (20.6%) |
| Material Moving | 627 (69.4%) | 276 (30.6%) |
| Total (Category) | 2,546 (73.0%) | 940 (27.0%) |
| Total (Overall) | 35,221 (52.1%) | 32,411 (47.9%) |
Employment Industries by Sex in Hunterdon County
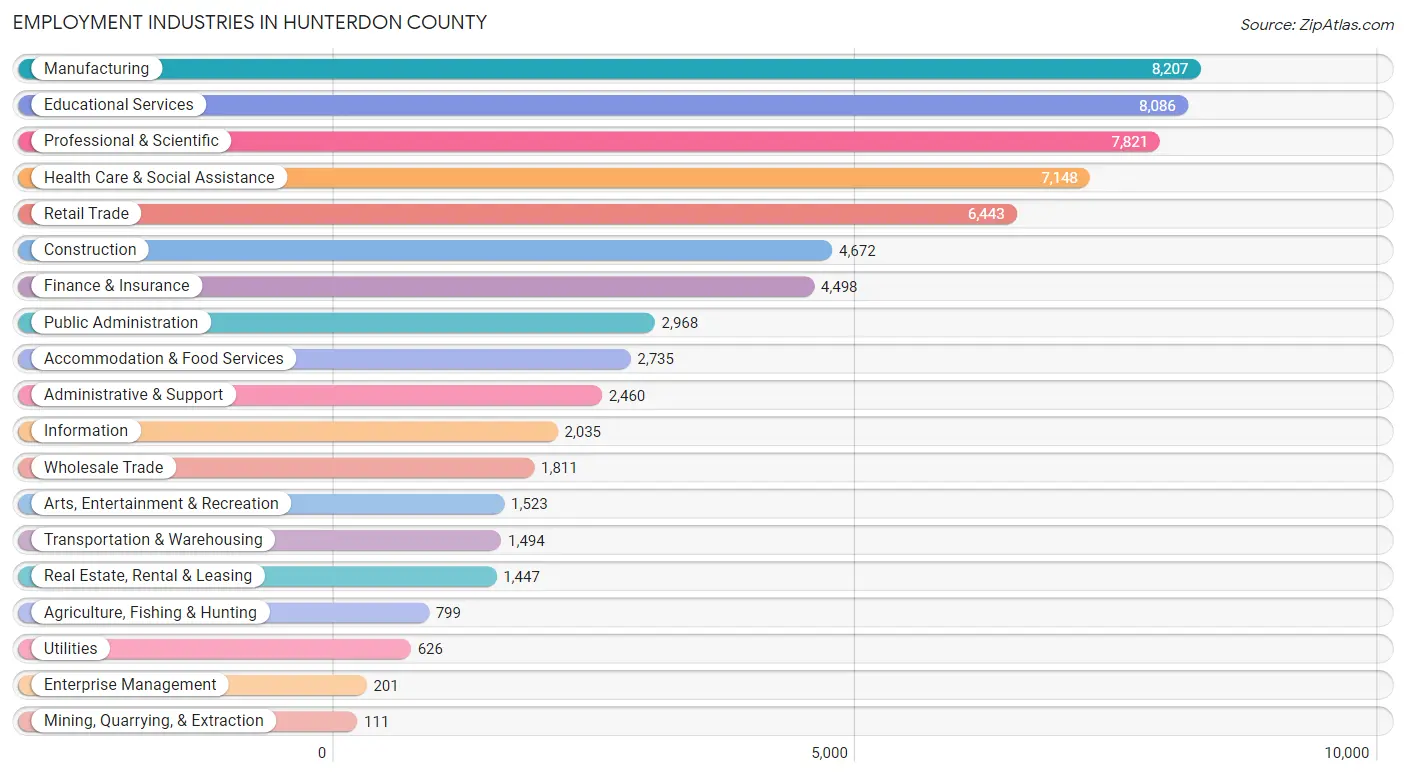
Employment Industries in Hunterdon County
The major employment industries in Hunterdon County include Manufacturing (8,207 | 12.1%), Educational Services (8,086 | 12.0%), Professional & Scientific (7,821 | 11.6%), Health Care & Social Assistance (7,148 | 10.6%), and Retail Trade (6,443 | 9.5%).
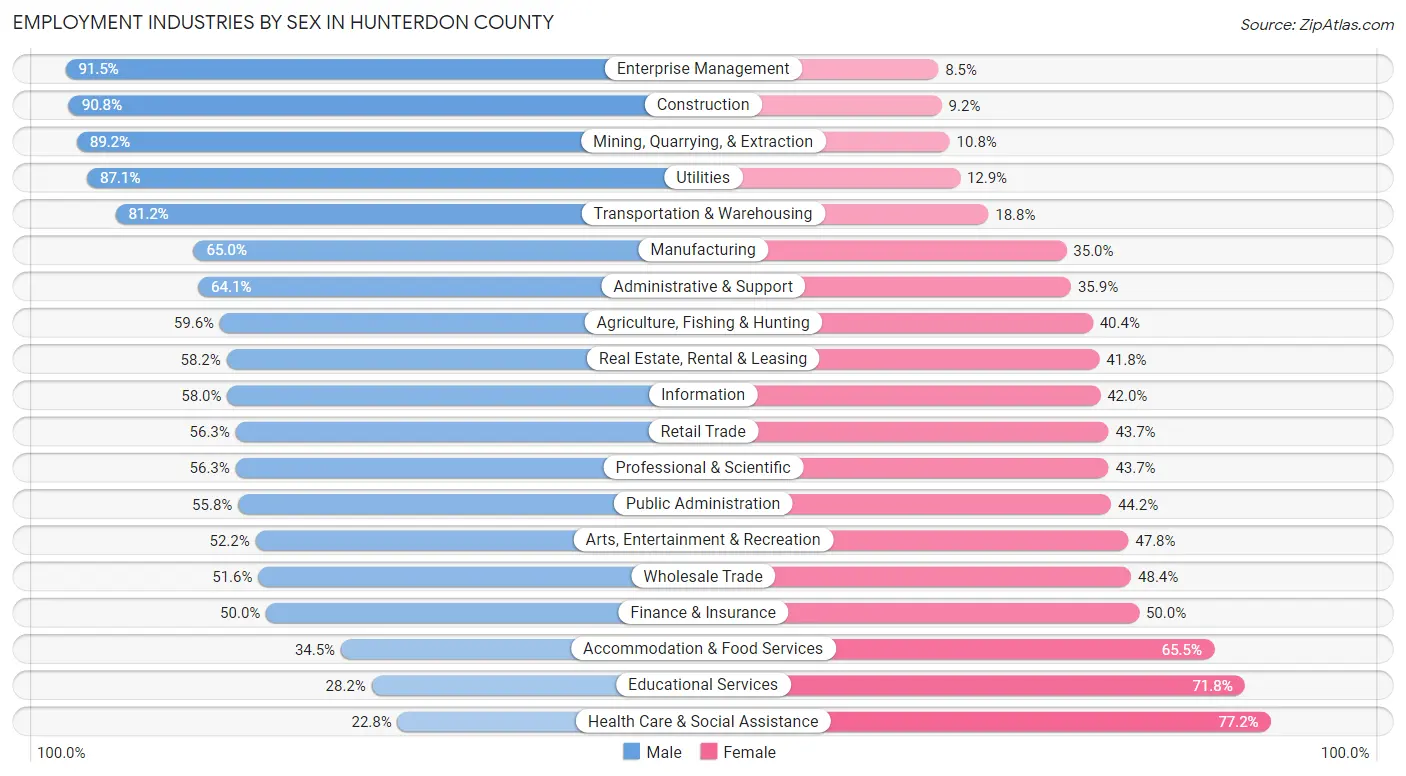
Employment Industries by Sex in Hunterdon County
The Hunterdon County industries that see more men than women are Enterprise Management (91.5%), Construction (90.8%), and Mining, Quarrying, & Extraction (89.2%), whereas the industries that tend to have a higher number of women are Health Care & Social Assistance (77.2%), Educational Services (71.8%), and Accommodation & Food Services (65.5%).
| Industry | Male | Female |
| Agriculture, Fishing & Hunting | 476 (59.6%) | 323 (40.4%) |
| Mining, Quarrying, & Extraction | 99 (89.2%) | 12 (10.8%) |
| Construction | 4,244 (90.8%) | 428 (9.2%) |
| Manufacturing | 5,337 (65.0%) | 2,870 (35.0%) |
| Wholesale Trade | 935 (51.6%) | 876 (48.4%) |
| Retail Trade | 3,629 (56.3%) | 2,814 (43.7%) |
| Transportation & Warehousing | 1,213 (81.2%) | 281 (18.8%) |
| Utilities | 545 (87.1%) | 81 (12.9%) |
| Information | 1,181 (58.0%) | 854 (42.0%) |
| Finance & Insurance | 2,249 (50.0%) | 2,249 (50.0%) |
| Real Estate, Rental & Leasing | 842 (58.2%) | 605 (41.8%) |
| Professional & Scientific | 4,405 (56.3%) | 3,416 (43.7%) |
| Enterprise Management | 184 (91.5%) | 17 (8.5%) |
| Administrative & Support | 1,576 (64.1%) | 884 (35.9%) |
| Educational Services | 2,278 (28.2%) | 5,808 (71.8%) |
| Health Care & Social Assistance | 1,630 (22.8%) | 5,518 (77.2%) |
| Arts, Entertainment & Recreation | 795 (52.2%) | 728 (47.8%) |
| Accommodation & Food Services | 944 (34.5%) | 1,791 (65.5%) |
| Public Administration | 1,656 (55.8%) | 1,312 (44.2%) |
| Total | 35,221 (52.1%) | 32,411 (47.9%) |
Education in Hunterdon County
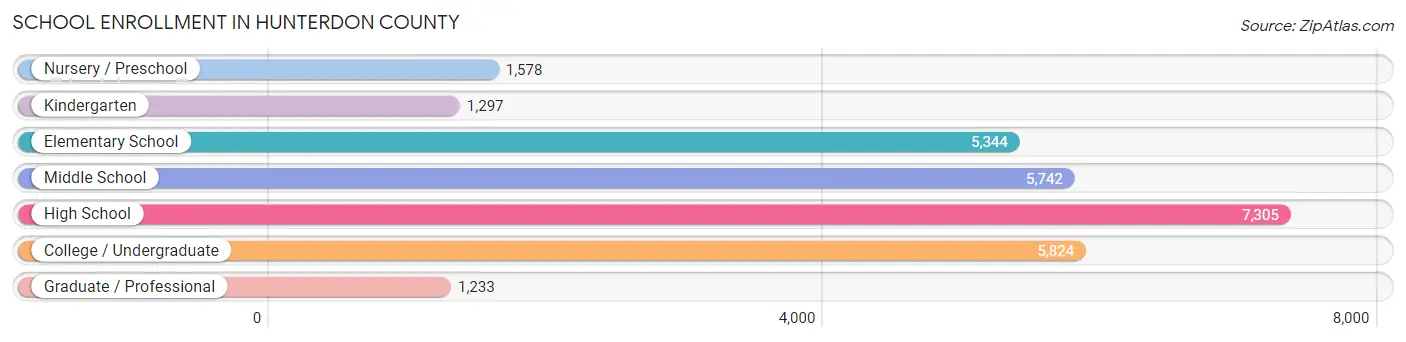
School Enrollment in Hunterdon County
The most common levels of schooling among the 28,323 students in Hunterdon County are high school (7,305 | 25.8%), college / undergraduate (5,824 | 20.6%), and middle school (5,742 | 20.3%).
| School Level | # Students | % Students |
| Nursery / Preschool | 1,578 | 5.6% |
| Kindergarten | 1,297 | 4.6% |
| Elementary School | 5,344 | 18.9% |
| Middle School | 5,742 | 20.3% |
| High School | 7,305 | 25.8% |
| College / Undergraduate | 5,824 | 20.6% |
| Graduate / Professional | 1,233 | 4.3% |
| Total | 28,323 | 100.0% |
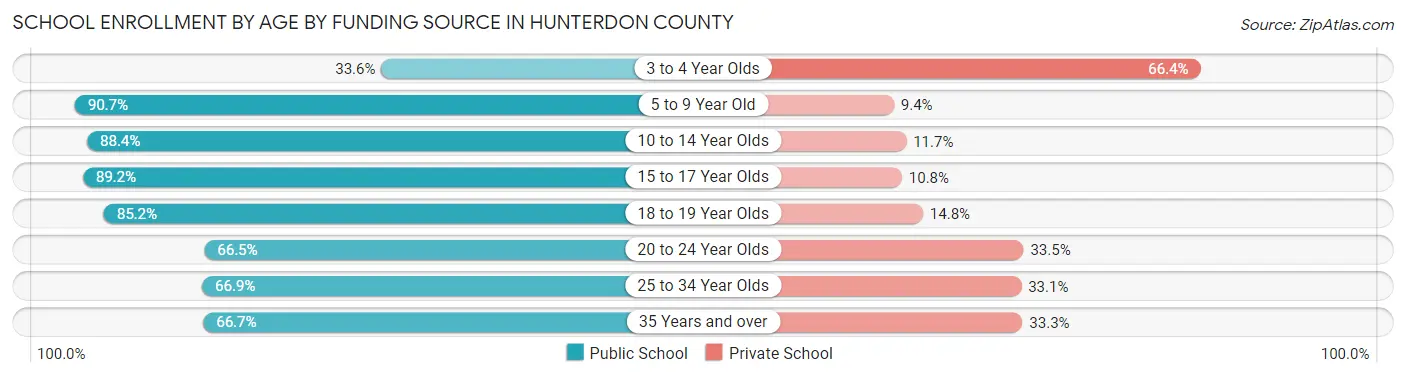
School Enrollment by Age by Funding Source in Hunterdon County
Out of a total of 28,323 students who are enrolled in schools in Hunterdon County, 5,155 (18.2%) attend a private institution, while the remaining 23,168 (81.8%) are enrolled in public schools. The age group of 3 to 4 year olds has the highest likelihood of being enrolled in private schools, with 776 (66.4% in the age bracket) enrolled. Conversely, the age group of 5 to 9 year old has the lowest likelihood of being enrolled in a private school, with 5,789 (90.6% in the age bracket) attending a public institution.
| Age Bracket | Public School | Private School |
| 3 to 4 Year Olds | 392 (33.6%) | 776 (66.4%) |
| 5 to 9 Year Old | 5,789 (90.6%) | 597 (9.3%) |
| 10 to 14 Year Olds | 6,205 (88.3%) | 818 (11.7%) |
| 15 to 17 Year Olds | 4,612 (89.2%) | 561 (10.8%) |
| 18 to 19 Year Olds | 2,068 (85.2%) | 358 (14.8%) |
| 20 to 24 Year Olds | 2,322 (66.5%) | 1,169 (33.5%) |
| 25 to 34 Year Olds | 666 (66.9%) | 329 (33.1%) |
| 35 Years and over | 1,108 (66.7%) | 553 (33.3%) |
| Total | 23,168 (81.8%) | 5,155 (18.2%) |
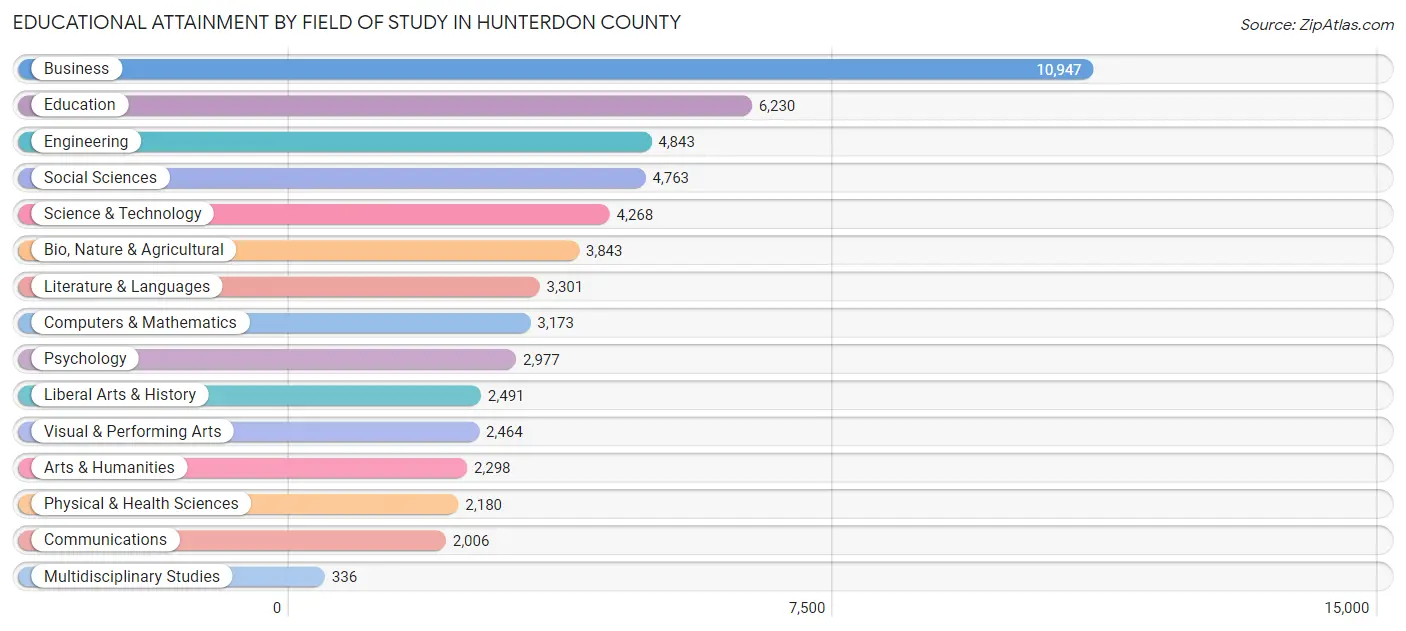
Educational Attainment by Field of Study in Hunterdon County
Business (10,947 | 19.5%), education (6,230 | 11.1%), engineering (4,843 | 8.6%), social sciences (4,763 | 8.5%), and science & technology (4,268 | 7.6%) are the most common fields of study among 56,120 individuals in Hunterdon County who have obtained a bachelor's degree or higher.
| Field of Study | # Graduates | % Graduates |
| Computers & Mathematics | 3,173 | 5.7% |
| Bio, Nature & Agricultural | 3,843 | 6.9% |
| Physical & Health Sciences | 2,180 | 3.9% |
| Psychology | 2,977 | 5.3% |
| Social Sciences | 4,763 | 8.5% |
| Engineering | 4,843 | 8.6% |
| Multidisciplinary Studies | 336 | 0.6% |
| Science & Technology | 4,268 | 7.6% |
| Business | 10,947 | 19.5% |
| Education | 6,230 | 11.1% |
| Literature & Languages | 3,301 | 5.9% |
| Liberal Arts & History | 2,491 | 4.4% |
| Visual & Performing Arts | 2,464 | 4.4% |
| Communications | 2,006 | 3.6% |
| Arts & Humanities | 2,298 | 4.1% |
| Total | 56,120 | 100.0% |
Transportation & Commute in Hunterdon County
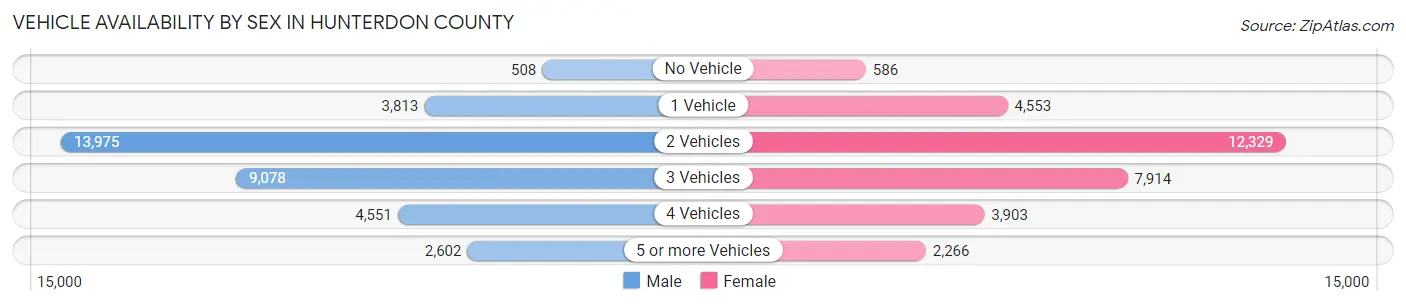
Vehicle Availability by Sex in Hunterdon County
The most prevalent vehicle ownership categories in Hunterdon County are males with 2 vehicles (13,975, accounting for 40.5%) and females with 2 vehicles (12,329, making up 44.3%).
| Vehicles Available | Male | Female |
| No Vehicle | 508 (1.5%) | 586 (1.9%) |
| 1 Vehicle | 3,813 (11.0%) | 4,553 (14.4%) |
| 2 Vehicles | 13,975 (40.5%) | 12,329 (39.1%) |
| 3 Vehicles | 9,078 (26.3%) | 7,914 (25.1%) |
| 4 Vehicles | 4,551 (13.2%) | 3,903 (12.4%) |
| 5 or more Vehicles | 2,602 (7.5%) | 2,266 (7.2%) |
| Total | 34,527 (100.0%) | 31,551 (100.0%) |
Commute Time in Hunterdon County
The most frequently occuring commute durations in Hunterdon County are 45 to 59 minutes (7,090 commuters, 13.0%), 30 to 34 minutes (7,089 commuters, 13.0%), and 60 to 89 minutes (6,182 commuters, 11.4%).
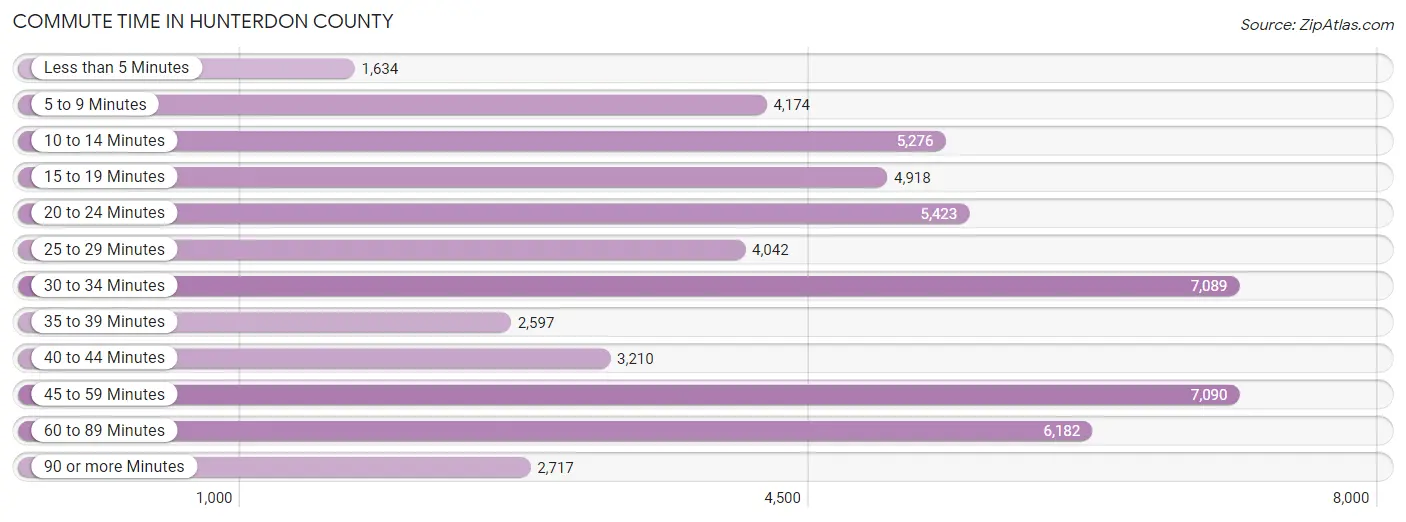
| Commute Time | # Commuters | % Commuters |
| Less than 5 Minutes | 1,634 | 3.0% |
| 5 to 9 Minutes | 4,174 | 7.7% |
| 10 to 14 Minutes | 5,276 | 9.7% |
| 15 to 19 Minutes | 4,918 | 9.0% |
| 20 to 24 Minutes | 5,423 | 10.0% |
| 25 to 29 Minutes | 4,042 | 7.4% |
| 30 to 34 Minutes | 7,089 | 13.0% |
| 35 to 39 Minutes | 2,597 | 4.8% |
| 40 to 44 Minutes | 3,210 | 5.9% |
| 45 to 59 Minutes | 7,090 | 13.0% |
| 60 to 89 Minutes | 6,182 | 11.4% |
| 90 or more Minutes | 2,717 | 5.0% |
Commute Time by Sex in Hunterdon County
The most common commute times in Hunterdon County are 45 to 59 minutes (4,196 commuters, 14.8%) for males and 30 to 34 minutes (3,358 commuters, 12.9%) for females.
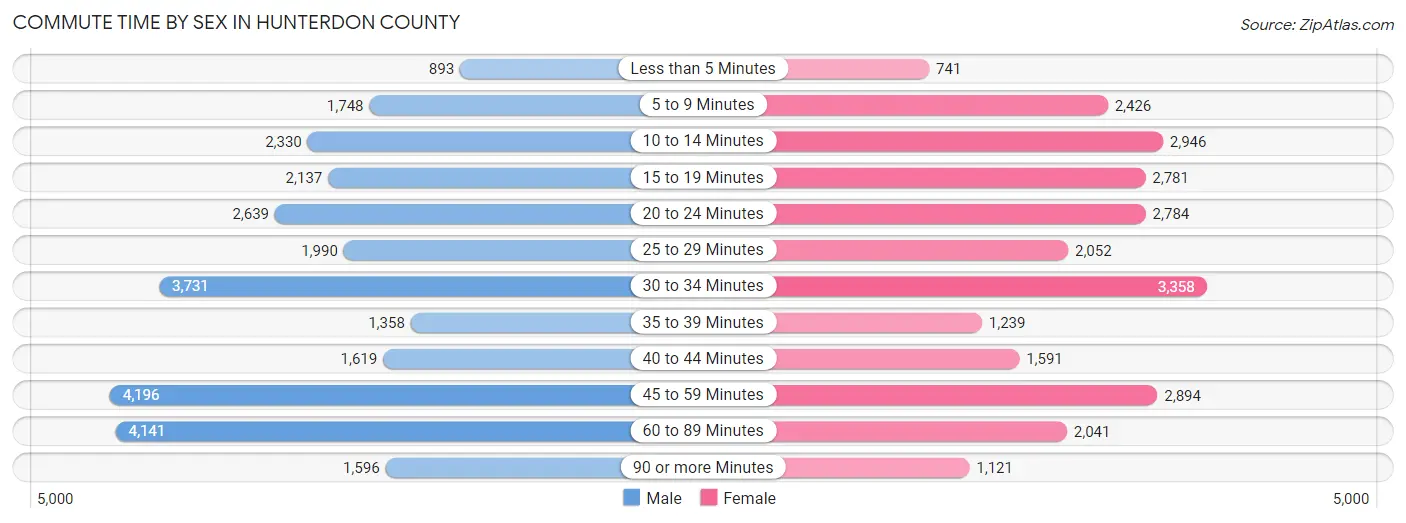
| Commute Time | Male | Female |
| Less than 5 Minutes | 893 (3.2%) | 741 (2.9%) |
| 5 to 9 Minutes | 1,748 (6.2%) | 2,426 (9.3%) |
| 10 to 14 Minutes | 2,330 (8.2%) | 2,946 (11.3%) |
| 15 to 19 Minutes | 2,137 (7.5%) | 2,781 (10.7%) |
| 20 to 24 Minutes | 2,639 (9.3%) | 2,784 (10.7%) |
| 25 to 29 Minutes | 1,990 (7.0%) | 2,052 (7.9%) |
| 30 to 34 Minutes | 3,731 (13.2%) | 3,358 (12.9%) |
| 35 to 39 Minutes | 1,358 (4.8%) | 1,239 (4.8%) |
| 40 to 44 Minutes | 1,619 (5.7%) | 1,591 (6.1%) |
| 45 to 59 Minutes | 4,196 (14.8%) | 2,894 (11.1%) |
| 60 to 89 Minutes | 4,141 (14.6%) | 2,041 (7.9%) |
| 90 or more Minutes | 1,596 (5.6%) | 1,121 (4.3%) |
Time of Departure to Work by Sex in Hunterdon County
The most frequent times of departure to work in Hunterdon County are 7:00 AM to 7:29 AM (4,767, 16.8%) for males and 8:00 AM to 8:29 AM (4,595, 17.7%) for females.
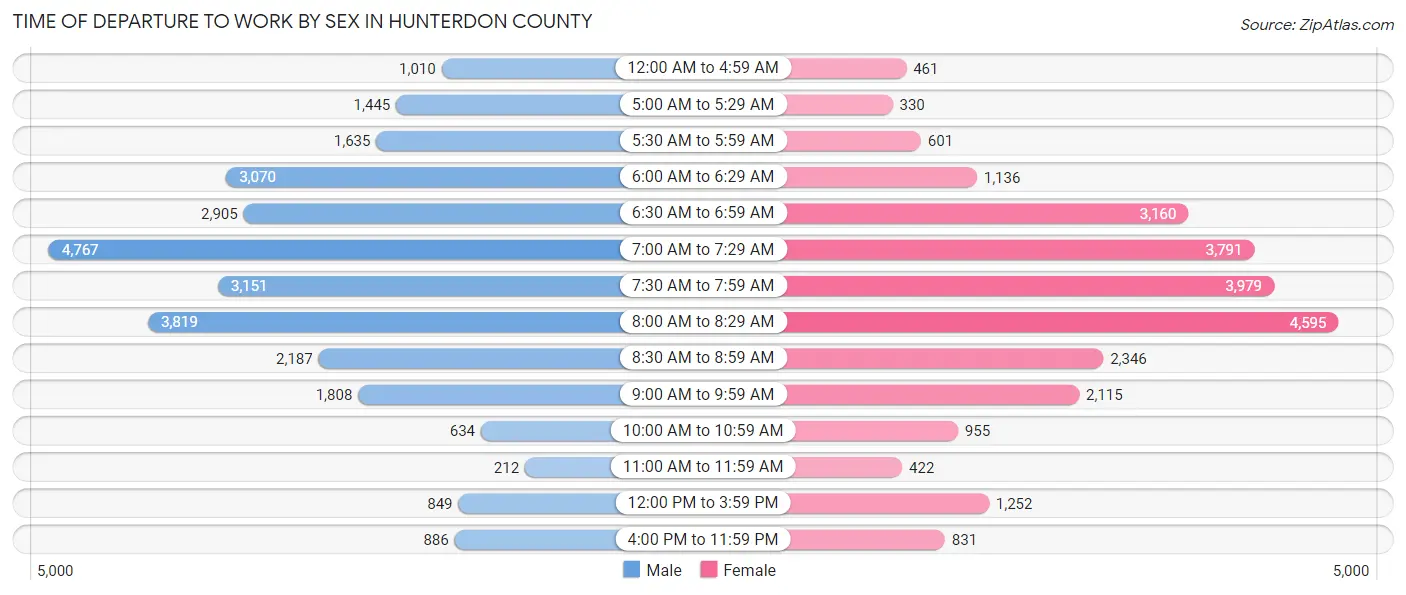
| Time of Departure | Male | Female |
| 12:00 AM to 4:59 AM | 1,010 (3.6%) | 461 (1.8%) |
| 5:00 AM to 5:29 AM | 1,445 (5.1%) | 330 (1.3%) |
| 5:30 AM to 5:59 AM | 1,635 (5.8%) | 601 (2.3%) |
| 6:00 AM to 6:29 AM | 3,070 (10.8%) | 1,136 (4.4%) |
| 6:30 AM to 6:59 AM | 2,905 (10.2%) | 3,160 (12.2%) |
| 7:00 AM to 7:29 AM | 4,767 (16.8%) | 3,791 (14.6%) |
| 7:30 AM to 7:59 AM | 3,151 (11.1%) | 3,979 (15.3%) |
| 8:00 AM to 8:29 AM | 3,819 (13.5%) | 4,595 (17.7%) |
| 8:30 AM to 8:59 AM | 2,187 (7.7%) | 2,346 (9.0%) |
| 9:00 AM to 9:59 AM | 1,808 (6.4%) | 2,115 (8.1%) |
| 10:00 AM to 10:59 AM | 634 (2.2%) | 955 (3.7%) |
| 11:00 AM to 11:59 AM | 212 (0.7%) | 422 (1.6%) |
| 12:00 PM to 3:59 PM | 849 (3.0%) | 1,252 (4.8%) |
| 4:00 PM to 11:59 PM | 886 (3.1%) | 831 (3.2%) |
| Total | 28,378 (100.0%) | 25,974 (100.0%) |
Housing Occupancy in Hunterdon County
Occupancy by Ownership in Hunterdon County
Of the total 49,676 dwellings in Hunterdon County, owner-occupied units account for 41,967 (84.5%), while renter-occupied units make up 7,709 (15.5%).
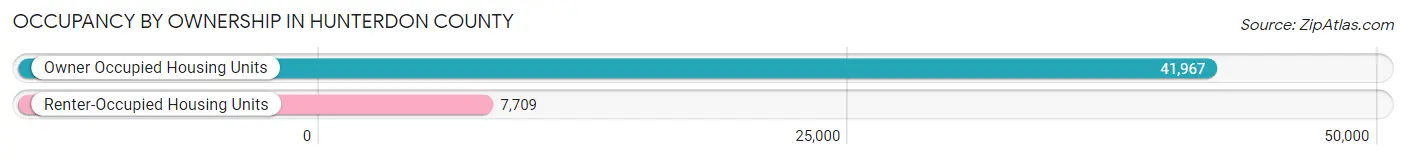
| Occupancy | # Housing Units | % Housing Units |
| Owner Occupied Housing Units | 41,967 | 84.5% |
| Renter-Occupied Housing Units | 7,709 | 15.5% |
| Total Occupied Housing Units | 49,676 | 100.0% |
Occupancy by Household Size in Hunterdon County
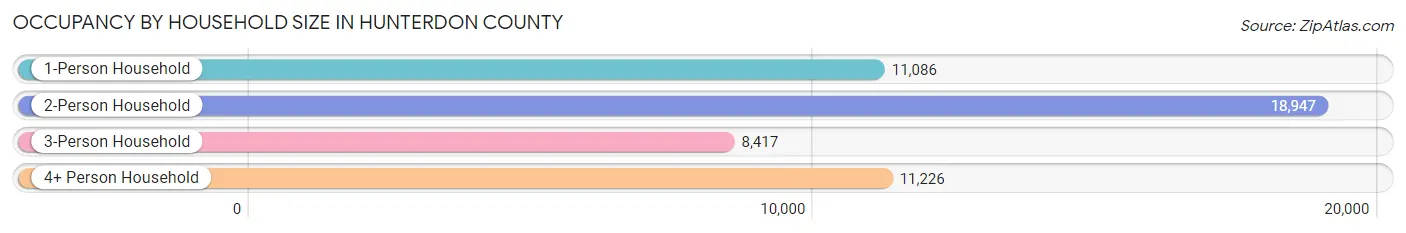
| Household Size | # Housing Units | % Housing Units |
| 1-Person Household | 11,086 | 22.3% |
| 2-Person Household | 18,947 | 38.1% |
| 3-Person Household | 8,417 | 16.9% |
| 4+ Person Household | 11,226 | 22.6% |
| Total Housing Units | 49,676 | 100.0% |
Occupancy by Ownership by Household Size in Hunterdon County
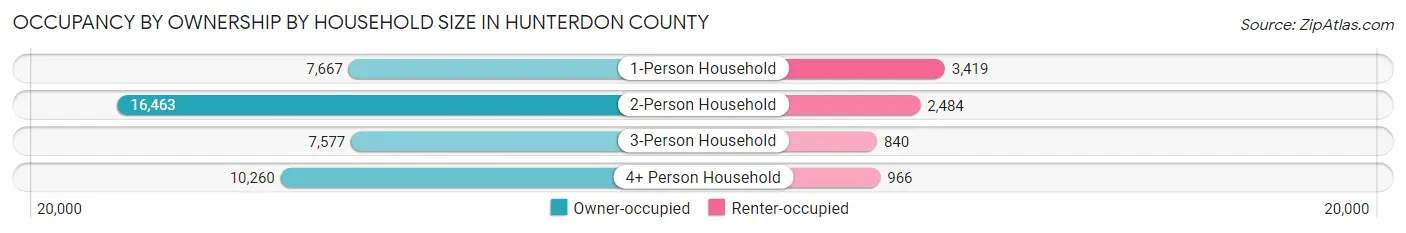
| Household Size | Owner-occupied | Renter-occupied |
| 1-Person Household | 7,667 (69.2%) | 3,419 (30.8%) |
| 2-Person Household | 16,463 (86.9%) | 2,484 (13.1%) |
| 3-Person Household | 7,577 (90.0%) | 840 (10.0%) |
| 4+ Person Household | 10,260 (91.4%) | 966 (8.6%) |
| Total Housing Units | 41,967 (84.5%) | 7,709 (15.5%) |
Occupancy by Educational Attainment in Hunterdon County
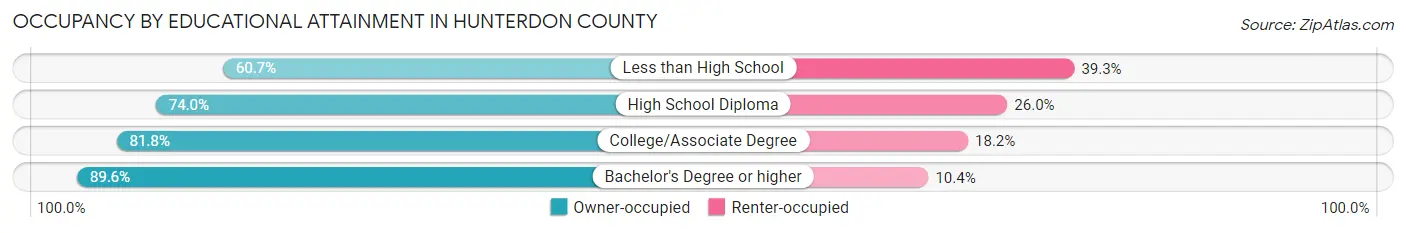
| Household Size | Owner-occupied | Renter-occupied |
| Less than High School | 968 (60.7%) | 627 (39.3%) |
| High School Diploma | 6,184 (74.0%) | 2,175 (26.0%) |
| College/Associate Degree | 8,197 (81.8%) | 1,828 (18.2%) |
| Bachelor's Degree or higher | 26,618 (89.6%) | 3,079 (10.4%) |
Occupancy by Age of Householder in Hunterdon County
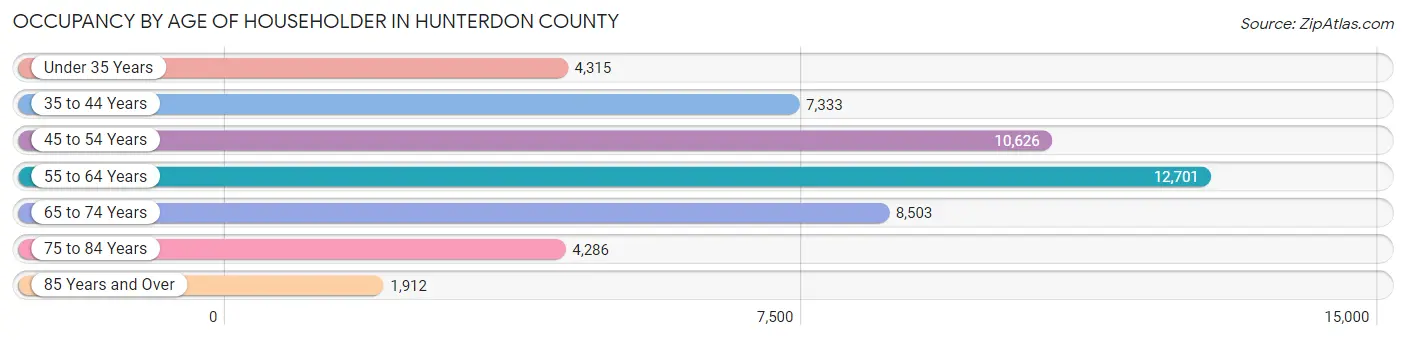
| Age Bracket | # Households | % Households |
| Under 35 Years | 4,315 | 8.7% |
| 35 to 44 Years | 7,333 | 14.8% |
| 45 to 54 Years | 10,626 | 21.4% |
| 55 to 64 Years | 12,701 | 25.6% |
| 65 to 74 Years | 8,503 | 17.1% |
| 75 to 84 Years | 4,286 | 8.6% |
| 85 Years and Over | 1,912 | 3.8% |
| Total | 49,676 | 100.0% |
Housing Finances in Hunterdon County
Median Income by Occupancy in Hunterdon County
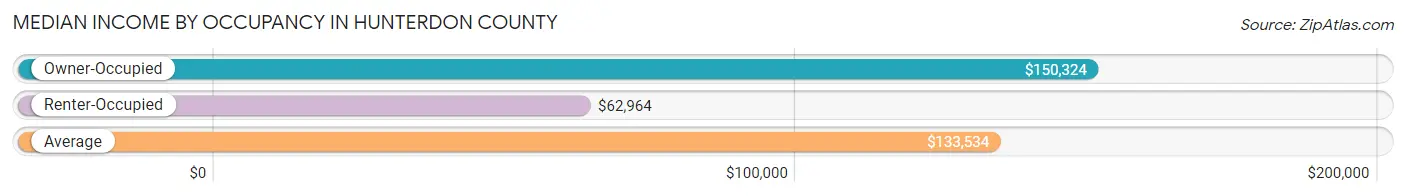
| Occupancy Type | # Households | Median Income |
| Owner-Occupied | 41,967 (84.5%) | $150,324 |
| Renter-Occupied | 7,709 (15.5%) | $62,964 |
| Average | 49,676 (100.0%) | $133,534 |
Occupancy by Householder Income Bracket in Hunterdon County
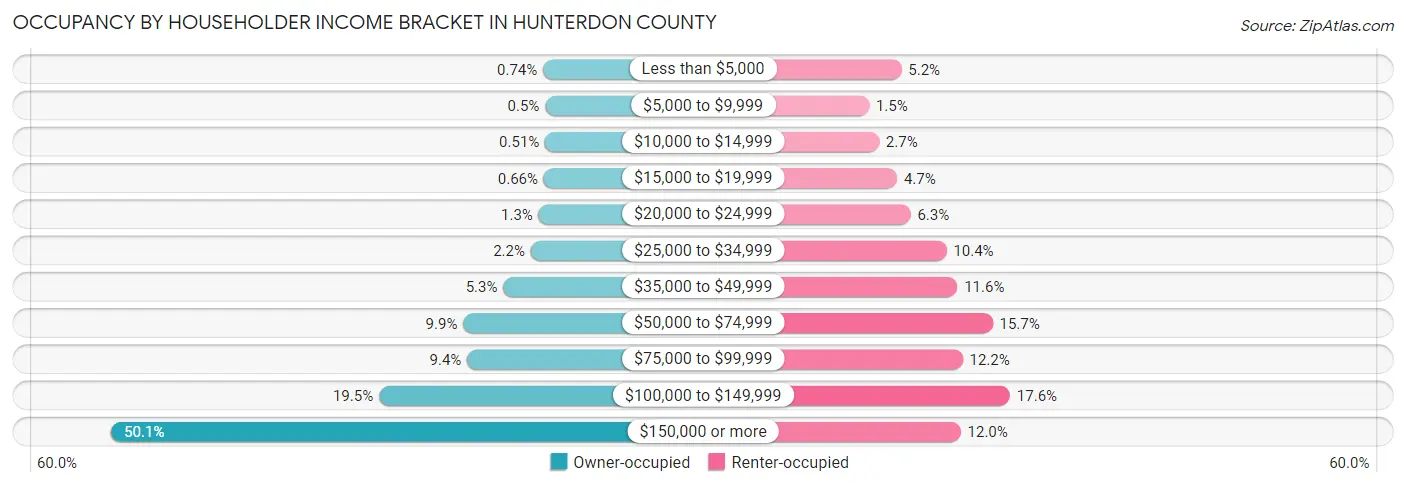
| Income Bracket | Owner-occupied | Renter-occupied |
| Less than $5,000 | 311 (0.7%) | 403 (5.2%) |
| $5,000 to $9,999 | 211 (0.5%) | 118 (1.5%) |
| $10,000 to $14,999 | 212 (0.5%) | 206 (2.7%) |
| $15,000 to $19,999 | 275 (0.7%) | 365 (4.7%) |
| $20,000 to $24,999 | 525 (1.3%) | 484 (6.3%) |
| $25,000 to $34,999 | 903 (2.1%) | 801 (10.4%) |
| $35,000 to $49,999 | 2,219 (5.3%) | 896 (11.6%) |
| $50,000 to $74,999 | 4,143 (9.9%) | 1,207 (15.7%) |
| $75,000 to $99,999 | 3,952 (9.4%) | 943 (12.2%) |
| $100,000 to $149,999 | 8,182 (19.5%) | 1,360 (17.6%) |
| $150,000 or more | 21,034 (50.1%) | 926 (12.0%) |
| Total | 41,967 (100.0%) | 7,709 (100.0%) |
Monthly Housing Cost Tiers in Hunterdon County
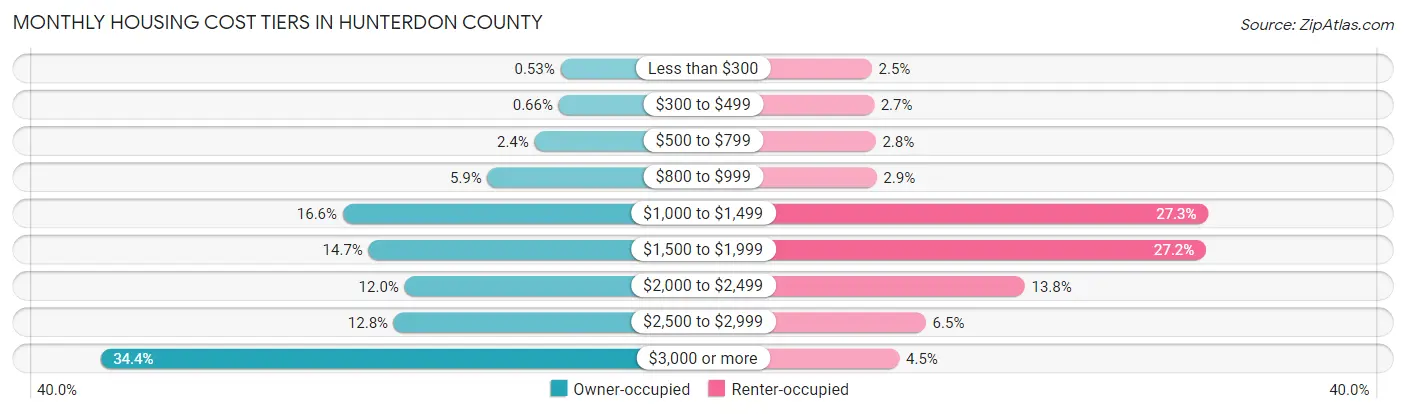
| Monthly Cost | Owner-occupied | Renter-occupied |
| Less than $300 | 223 (0.5%) | 194 (2.5%) |
| $300 to $499 | 277 (0.7%) | 206 (2.7%) |
| $500 to $799 | 1,026 (2.4%) | 216 (2.8%) |
| $800 to $999 | 2,477 (5.9%) | 221 (2.9%) |
| $1,000 to $1,499 | 6,951 (16.6%) | 2,105 (27.3%) |
| $1,500 to $1,999 | 6,152 (14.7%) | 2,093 (27.2%) |
| $2,000 to $2,499 | 5,042 (12.0%) | 1,062 (13.8%) |
| $2,500 to $2,999 | 5,371 (12.8%) | 501 (6.5%) |
| $3,000 or more | 14,448 (34.4%) | 350 (4.5%) |
| Total | 41,967 (100.0%) | 7,709 (100.0%) |
Physical Housing Characteristics in Hunterdon County
Housing Structures in Hunterdon County
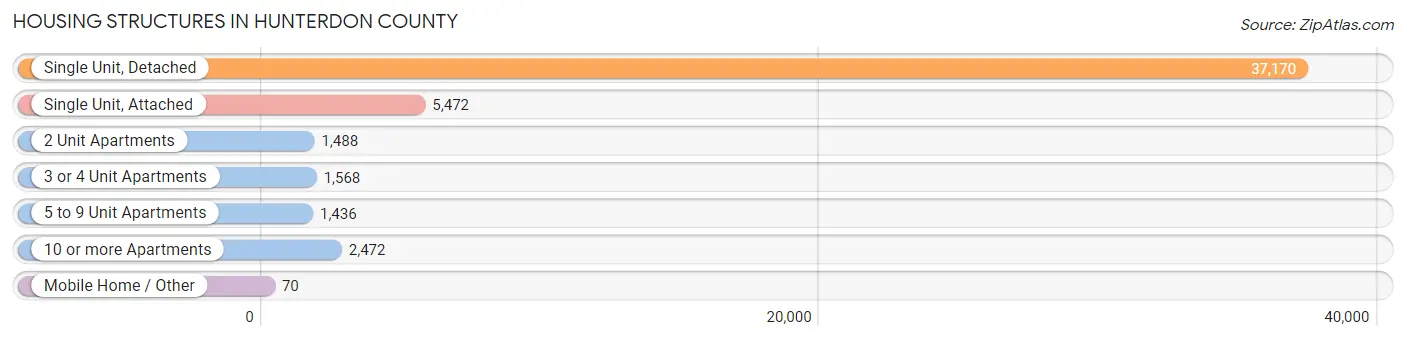
| Structure Type | # Housing Units | % Housing Units |
| Single Unit, Detached | 37,170 | 74.8% |
| Single Unit, Attached | 5,472 | 11.0% |
| 2 Unit Apartments | 1,488 | 3.0% |
| 3 or 4 Unit Apartments | 1,568 | 3.2% |
| 5 to 9 Unit Apartments | 1,436 | 2.9% |
| 10 or more Apartments | 2,472 | 5.0% |
| Mobile Home / Other | 70 | 0.1% |
| Total | 49,676 | 100.0% |
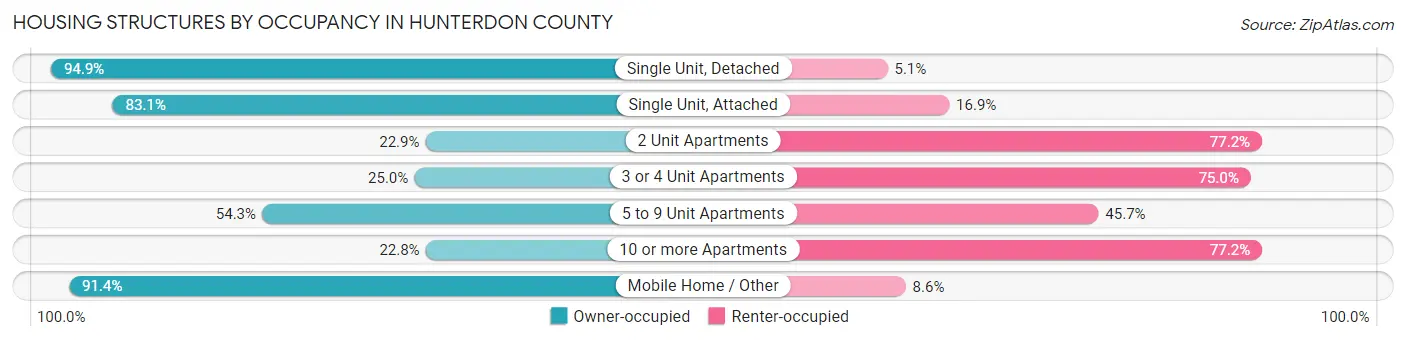
Housing Structures by Occupancy in Hunterdon County
| Structure Type | Owner-occupied | Renter-occupied |
| Single Unit, Detached | 35,282 (94.9%) | 1,888 (5.1%) |
| Single Unit, Attached | 4,545 (83.1%) | 927 (16.9%) |
| 2 Unit Apartments | 340 (22.9%) | 1,148 (77.1%) |
| 3 or 4 Unit Apartments | 392 (25.0%) | 1,176 (75.0%) |
| 5 to 9 Unit Apartments | 780 (54.3%) | 656 (45.7%) |
| 10 or more Apartments | 564 (22.8%) | 1,908 (77.2%) |
| Mobile Home / Other | 64 (91.4%) | 6 (8.6%) |
| Total | 41,967 (84.5%) | 7,709 (15.5%) |
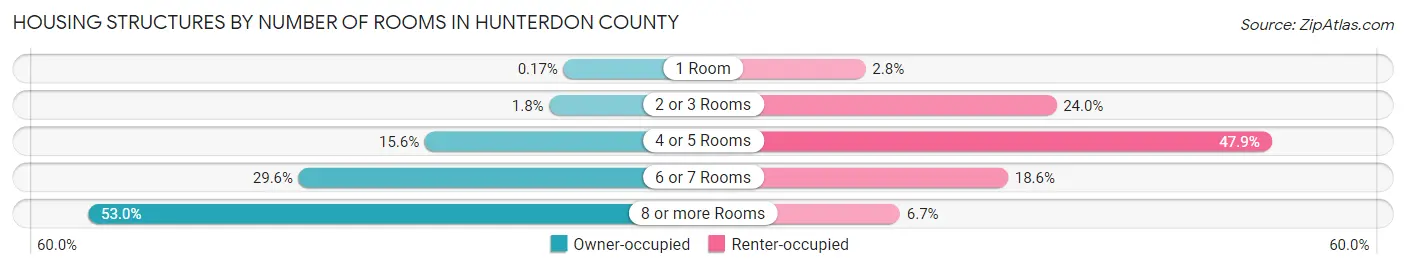
Housing Structures by Number of Rooms in Hunterdon County
| Number of Rooms | Owner-occupied | Renter-occupied |
| 1 Room | 73 (0.2%) | 218 (2.8%) |
| 2 or 3 Rooms | 735 (1.8%) | 1,850 (24.0%) |
| 4 or 5 Rooms | 6,530 (15.6%) | 3,692 (47.9%) |
| 6 or 7 Rooms | 12,406 (29.6%) | 1,436 (18.6%) |
| 8 or more Rooms | 22,223 (52.9%) | 513 (6.7%) |
| Total | 41,967 (100.0%) | 7,709 (100.0%) |
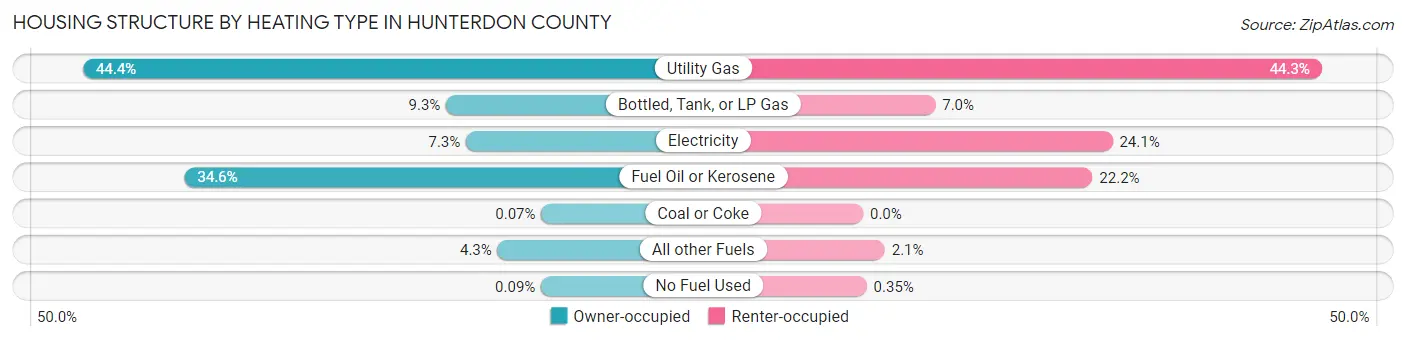
Housing Structure by Heating Type in Hunterdon County
| Heating Type | Owner-occupied | Renter-occupied |
| Utility Gas | 18,618 (44.4%) | 3,416 (44.3%) |
| Bottled, Tank, or LP Gas | 3,891 (9.3%) | 538 (7.0%) |
| Electricity | 3,081 (7.3%) | 1,858 (24.1%) |
| Fuel Oil or Kerosene | 14,503 (34.6%) | 1,708 (22.2%) |
| Coal or Coke | 29 (0.1%) | 0 (0.0%) |
| All other Fuels | 1,806 (4.3%) | 162 (2.1%) |
| No Fuel Used | 39 (0.1%) | 27 (0.4%) |
| Total | 41,967 (100.0%) | 7,709 (100.0%) |
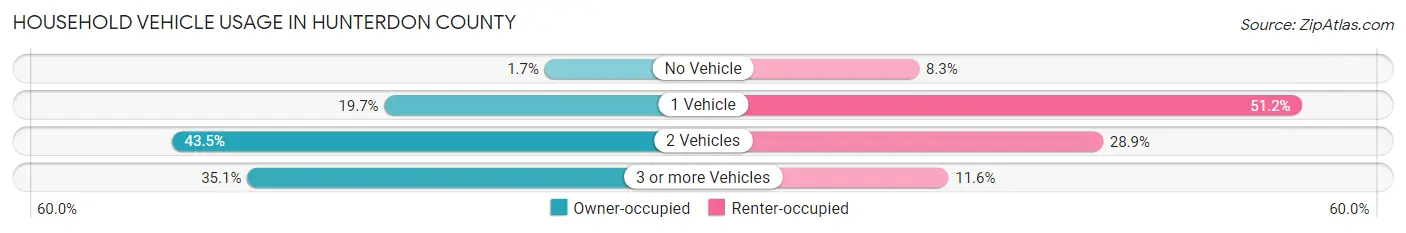
Household Vehicle Usage in Hunterdon County
| Vehicles per Household | Owner-occupied | Renter-occupied |
| No Vehicle | 724 (1.7%) | 639 (8.3%) |
| 1 Vehicle | 8,262 (19.7%) | 3,950 (51.2%) |
| 2 Vehicles | 18,267 (43.5%) | 2,227 (28.9%) |
| 3 or more Vehicles | 14,714 (35.1%) | 893 (11.6%) |
| Total | 41,967 (100.0%) | 7,709 (100.0%) |
Real Estate & Mortgages in Hunterdon County
Real Estate and Mortgage Overview in Hunterdon County
| Characteristic | Without Mortgage | With Mortgage |
| Housing Units | 14,036 | 27,931 |
| Median Property Value | $449,700 | $493,500 |
| Median Household Income | $114,185 | $16,057 |
| Monthly Housing Costs | $1,299 | $14,273 |
| Real Estate Taxes | $10,001 | $268 |
Property Value by Mortgage Status in Hunterdon County
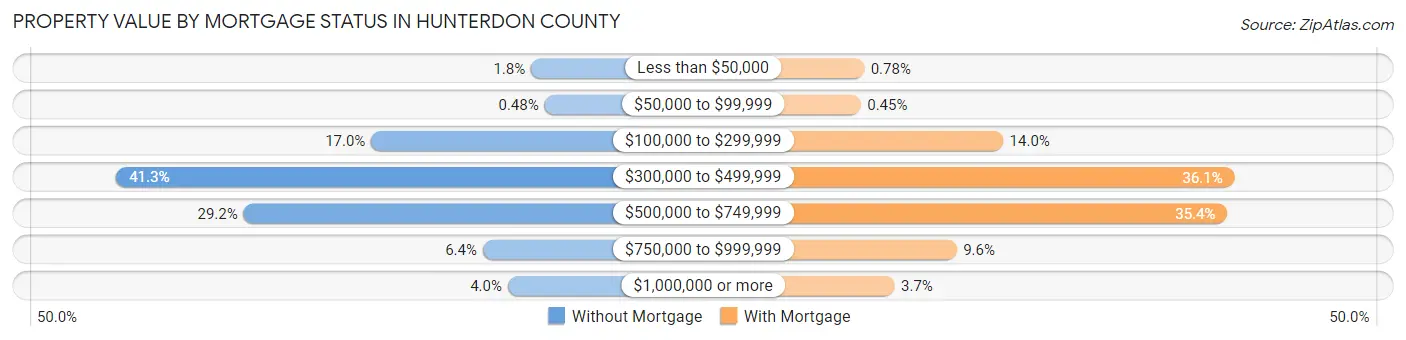
| Property Value | Without Mortgage | With Mortgage |
| Less than $50,000 | 248 (1.8%) | 217 (0.8%) |
| $50,000 to $99,999 | 68 (0.5%) | 125 (0.4%) |
| $100,000 to $299,999 | 2,385 (17.0%) | 3,914 (14.0%) |
| $300,000 to $499,999 | 5,793 (41.3%) | 10,080 (36.1%) |
| $500,000 to $749,999 | 4,091 (29.1%) | 9,891 (35.4%) |
| $750,000 to $999,999 | 893 (6.4%) | 2,679 (9.6%) |
| $1,000,000 or more | 558 (4.0%) | 1,025 (3.7%) |
| Total | 14,036 (100.0%) | 27,931 (100.0%) |
Household Income by Mortgage Status in Hunterdon County
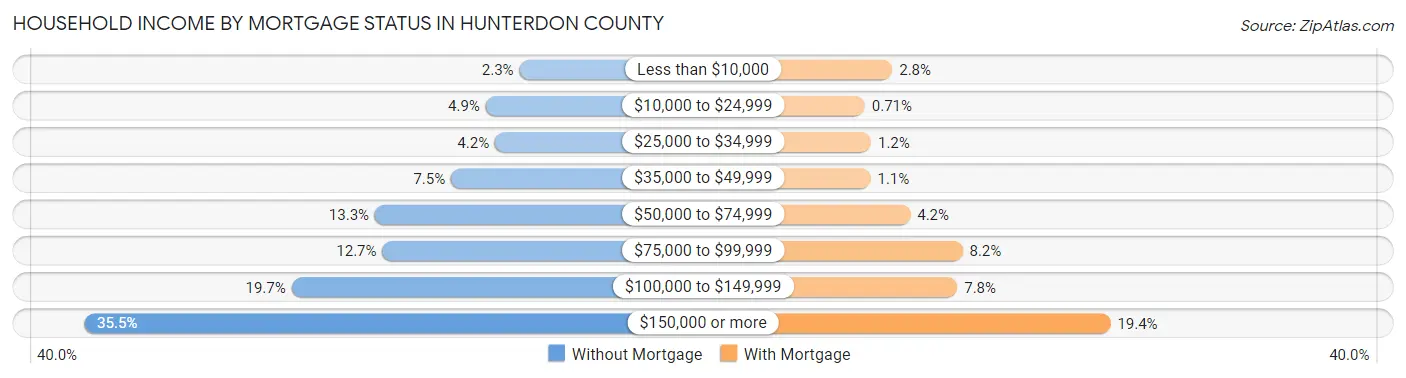
| Household Income | Without Mortgage | With Mortgage |
| Less than $10,000 | 323 (2.3%) | 781 (2.8%) |
| $10,000 to $24,999 | 683 (4.9%) | 199 (0.7%) |
| $25,000 to $34,999 | 584 (4.2%) | 329 (1.2%) |
| $35,000 to $49,999 | 1,054 (7.5%) | 319 (1.1%) |
| $50,000 to $74,999 | 1,868 (13.3%) | 1,165 (4.2%) |
| $75,000 to $99,999 | 1,788 (12.7%) | 2,275 (8.2%) |
| $100,000 to $149,999 | 2,759 (19.7%) | 2,164 (7.7%) |
| $150,000 or more | 4,977 (35.5%) | 5,423 (19.4%) |
| Total | 14,036 (100.0%) | 27,931 (100.0%) |
Property Value to Household Income Ratio in Hunterdon County
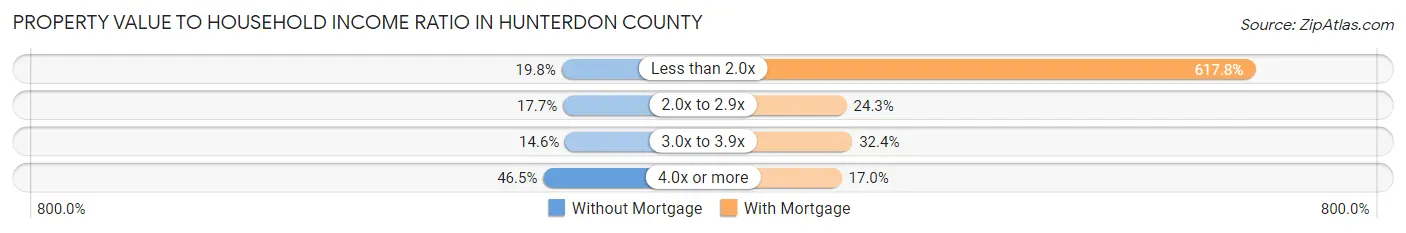
| Value-to-Income Ratio | Without Mortgage | With Mortgage |
| Less than 2.0x | 2,777 (19.8%) | 172,555 (617.8%) |
| 2.0x to 2.9x | 2,490 (17.7%) | 6,776 (24.3%) |
| 3.0x to 3.9x | 2,053 (14.6%) | 9,047 (32.4%) |
| 4.0x or more | 6,522 (46.5%) | 4,738 (17.0%) |
| Total | 14,036 (100.0%) | 27,931 (100.0%) |
Real Estate Taxes by Mortgage Status in Hunterdon County
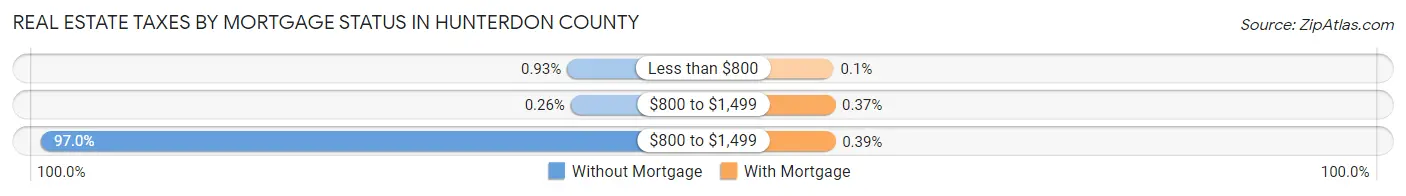
| Property Taxes | Without Mortgage | With Mortgage |
| Less than $800 | 131 (0.9%) | 27 (0.1%) |
| $800 to $1,499 | 36 (0.3%) | 102 (0.4%) |
| $800 to $1,499 | 13,614 (97.0%) | 108 (0.4%) |
| Total | 14,036 (100.0%) | 27,931 (100.0%) |
Health & Disability in Hunterdon County
Health Insurance Coverage by Age in Hunterdon County
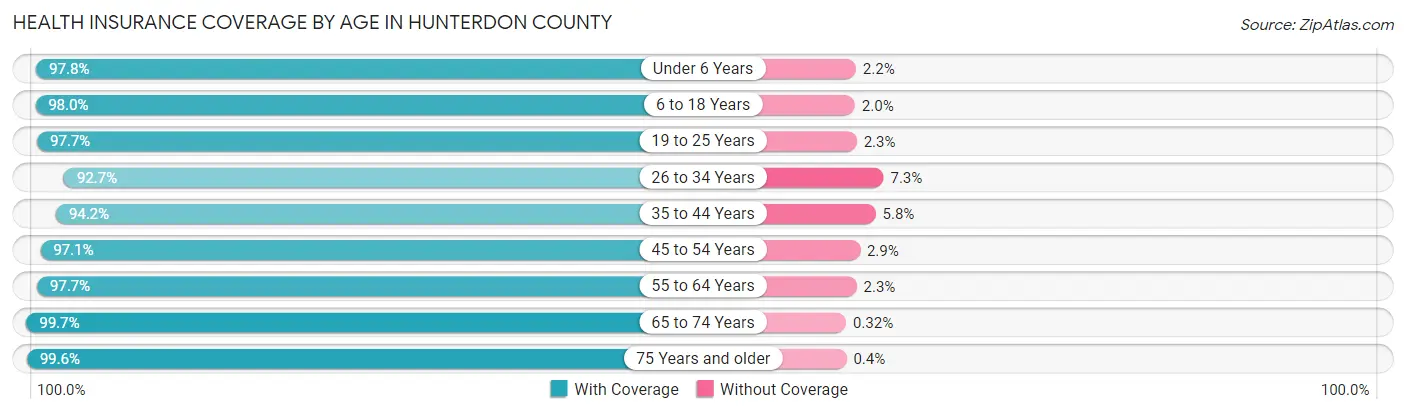
| Age Bracket | With Coverage | Without Coverage |
| Under 6 Years | 6,690 (97.8%) | 148 (2.2%) |
| 6 to 18 Years | 18,901 (98.0%) | 382 (2.0%) |
| 19 to 25 Years | 9,085 (97.7%) | 215 (2.3%) |
| 26 to 34 Years | 9,895 (92.7%) | 781 (7.3%) |
| 35 to 44 Years | 13,523 (94.2%) | 838 (5.8%) |
| 45 to 54 Years | 18,376 (97.1%) | 553 (2.9%) |
| 55 to 64 Years | 22,007 (97.7%) | 516 (2.3%) |
| 65 to 74 Years | 14,882 (99.7%) | 48 (0.3%) |
| 75 Years and older | 9,952 (99.6%) | 40 (0.4%) |
| Total | 123,311 (97.2%) | 3,521 (2.8%) |
Health Insurance Coverage by Citizenship Status in Hunterdon County
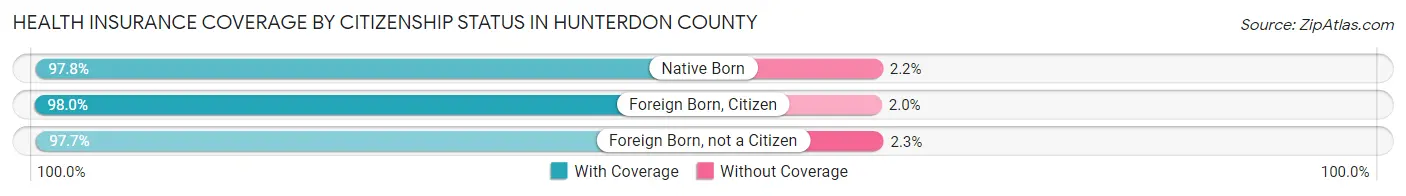
| Citizenship Status | With Coverage | Without Coverage |
| Native Born | 6,690 (97.8%) | 148 (2.2%) |
| Foreign Born, Citizen | 18,901 (98.0%) | 382 (2.0%) |
| Foreign Born, not a Citizen | 9,085 (97.7%) | 215 (2.3%) |
Health Insurance Coverage by Household Income in Hunterdon County
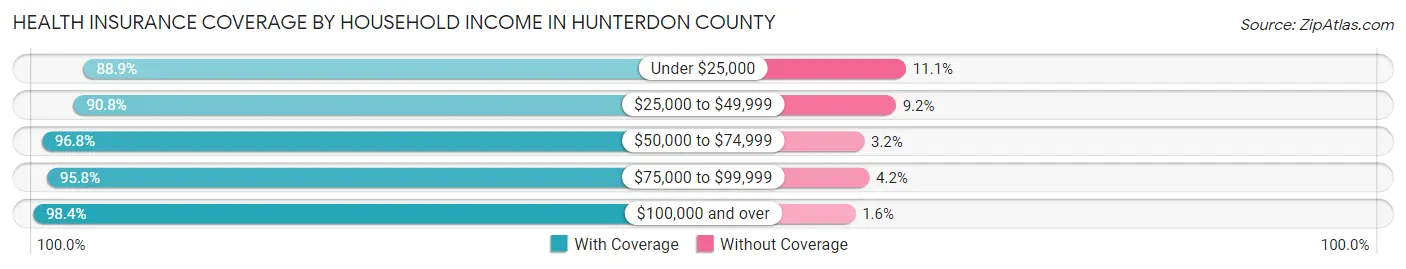
| Household Income | With Coverage | Without Coverage |
| Under $25,000 | 3,822 (88.9%) | 476 (11.1%) |
| $25,000 to $49,999 | 7,860 (90.8%) | 793 (9.2%) |
| $50,000 to $74,999 | 10,036 (96.8%) | 335 (3.2%) |
| $75,000 to $99,999 | 9,922 (95.8%) | 433 (4.2%) |
| $100,000 and over | 91,016 (98.4%) | 1,461 (1.6%) |
Public vs Private Health Insurance Coverage by Age in Hunterdon County
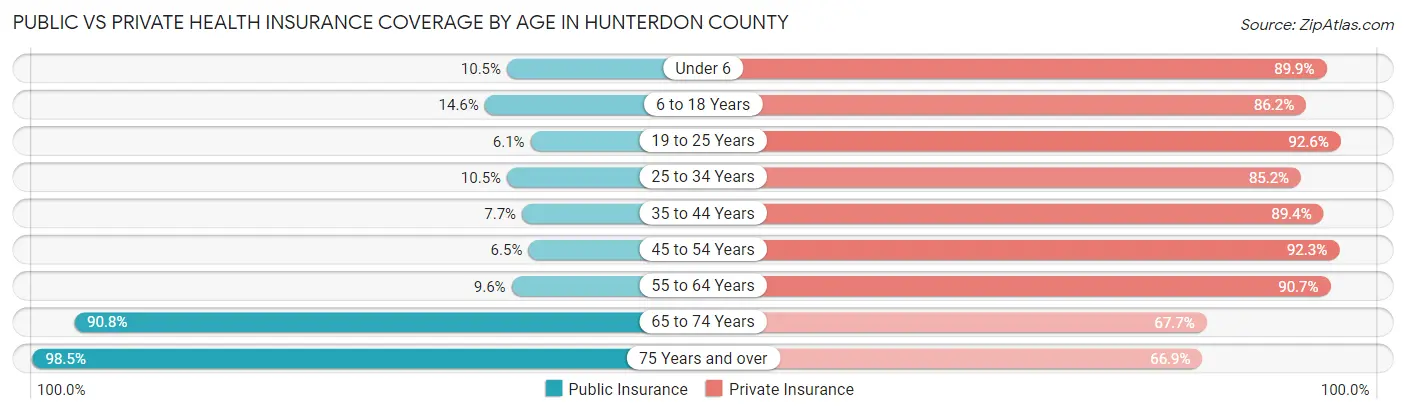
| Age Bracket | Public Insurance | Private Insurance |
| Under 6 | 717 (10.5%) | 6,149 (89.9%) |
| 6 to 18 Years | 2,817 (14.6%) | 16,616 (86.2%) |
| 19 to 25 Years | 568 (6.1%) | 8,611 (92.6%) |
| 25 to 34 Years | 1,119 (10.5%) | 9,098 (85.2%) |
| 35 to 44 Years | 1,105 (7.7%) | 12,840 (89.4%) |
| 45 to 54 Years | 1,235 (6.5%) | 17,467 (92.3%) |
| 55 to 64 Years | 2,169 (9.6%) | 20,422 (90.7%) |
| 65 to 74 Years | 13,559 (90.8%) | 10,108 (67.7%) |
| 75 Years and over | 9,845 (98.5%) | 6,686 (66.9%) |
| Total | 33,134 (26.1%) | 107,997 (85.2%) |
Disability Status by Sex by Age in Hunterdon County
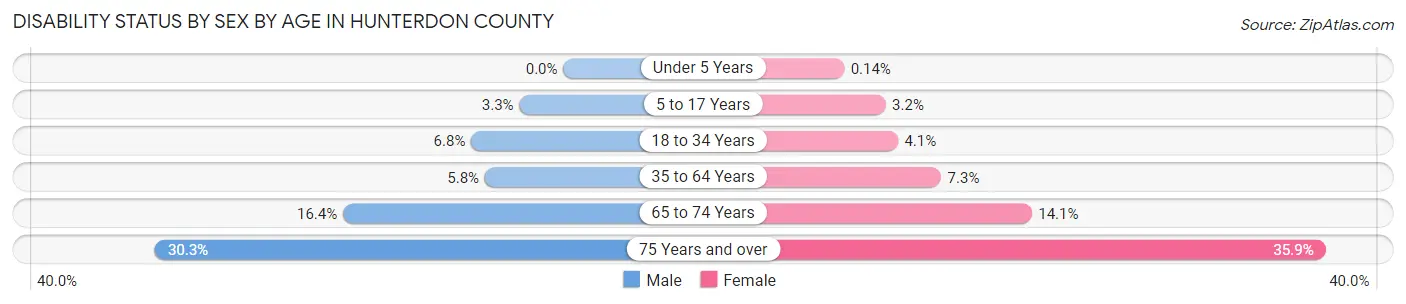
| Age Bracket | Male | Female |
| Under 5 Years | 0 (0.0%) | 4 (0.1%) |
| 5 to 17 Years | 315 (3.3%) | 299 (3.2%) |
| 18 to 34 Years | 739 (6.8%) | 449 (4.1%) |
| 35 to 64 Years | 1,597 (5.8%) | 2,082 (7.3%) |
| 65 to 74 Years | 1,224 (16.4%) | 1,048 (14.1%) |
| 75 Years and over | 1,286 (30.3%) | 2,065 (35.9%) |
Disability Class by Sex by Age in Hunterdon County
Disability Class: Hearing Difficulty
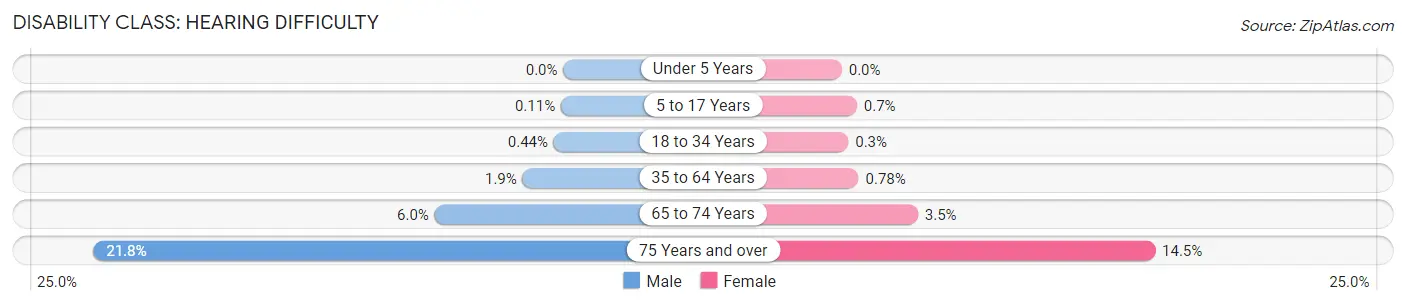
| Age Bracket | Male | Female |
| Under 5 Years | 0 (0.0%) | 0 (0.0%) |
| 5 to 17 Years | 11 (0.1%) | 65 (0.7%) |
| 18 to 34 Years | 47 (0.4%) | 33 (0.3%) |
| 35 to 64 Years | 520 (1.9%) | 220 (0.8%) |
| 65 to 74 Years | 447 (6.0%) | 263 (3.5%) |
| 75 Years and over | 925 (21.8%) | 836 (14.5%) |
Disability Class: Vision Difficulty
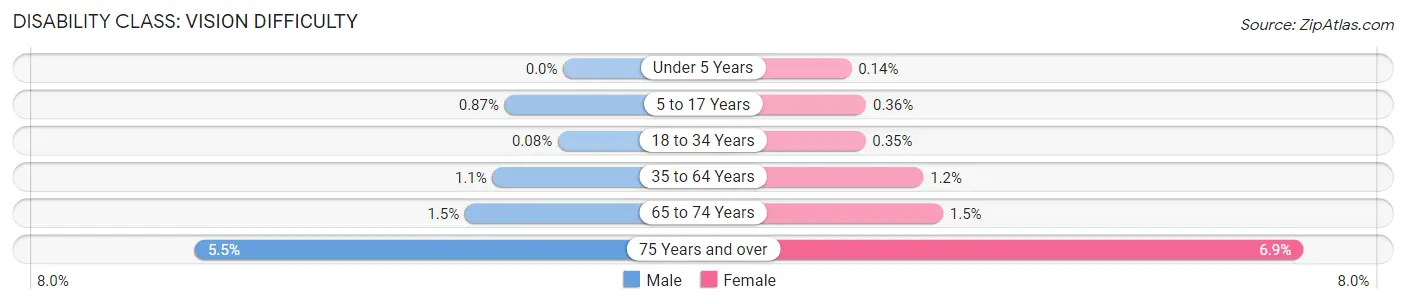
| Age Bracket | Male | Female |
| Under 5 Years | 0 (0.0%) | 4 (0.1%) |
| 5 to 17 Years | 84 (0.9%) | 33 (0.4%) |
| 18 to 34 Years | 9 (0.1%) | 38 (0.4%) |
| 35 to 64 Years | 289 (1.1%) | 342 (1.2%) |
| 65 to 74 Years | 109 (1.5%) | 112 (1.5%) |
| 75 Years and over | 232 (5.5%) | 394 (6.9%) |
Disability Class: Cognitive Difficulty
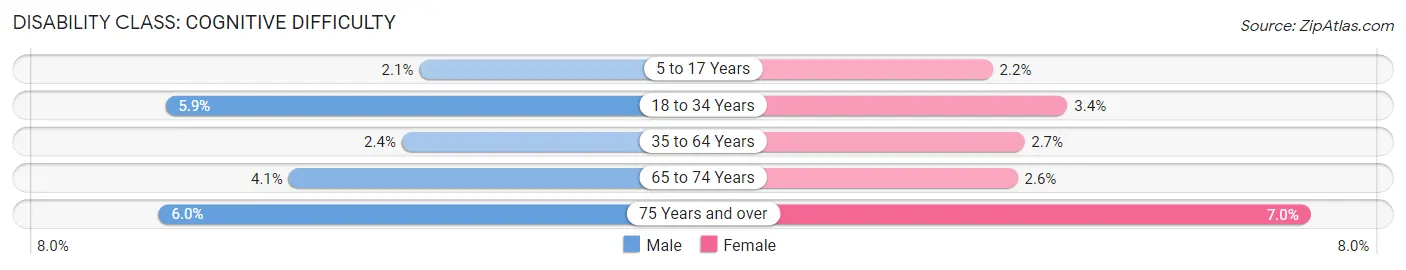
| Age Bracket | Male | Female |
| 5 to 17 Years | 207 (2.1%) | 208 (2.2%) |
| 18 to 34 Years | 638 (5.9%) | 364 (3.4%) |
| 35 to 64 Years | 658 (2.4%) | 769 (2.7%) |
| 65 to 74 Years | 305 (4.1%) | 194 (2.6%) |
| 75 Years and over | 255 (6.0%) | 400 (7.0%) |
Disability Class: Ambulatory Difficulty
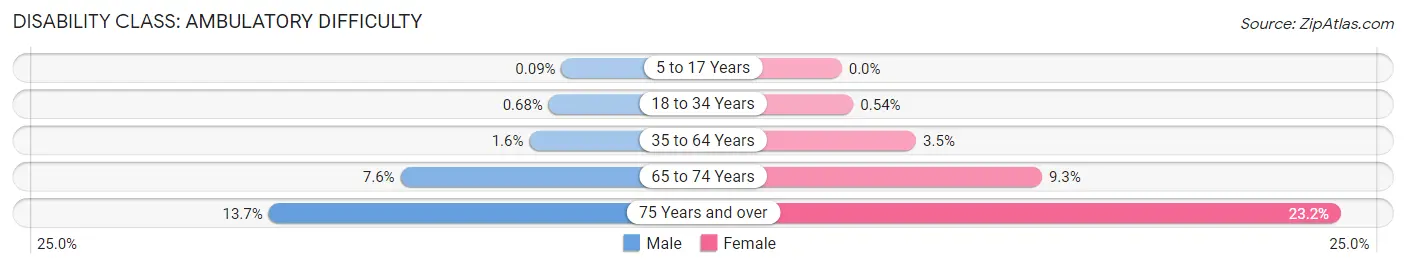
| Age Bracket | Male | Female |
| 5 to 17 Years | 9 (0.1%) | 0 (0.0%) |
| 18 to 34 Years | 73 (0.7%) | 59 (0.5%) |
| 35 to 64 Years | 435 (1.6%) | 978 (3.5%) |
| 65 to 74 Years | 566 (7.6%) | 692 (9.3%) |
| 75 Years and over | 580 (13.7%) | 1,332 (23.2%) |
Disability Class: Self-Care Difficulty
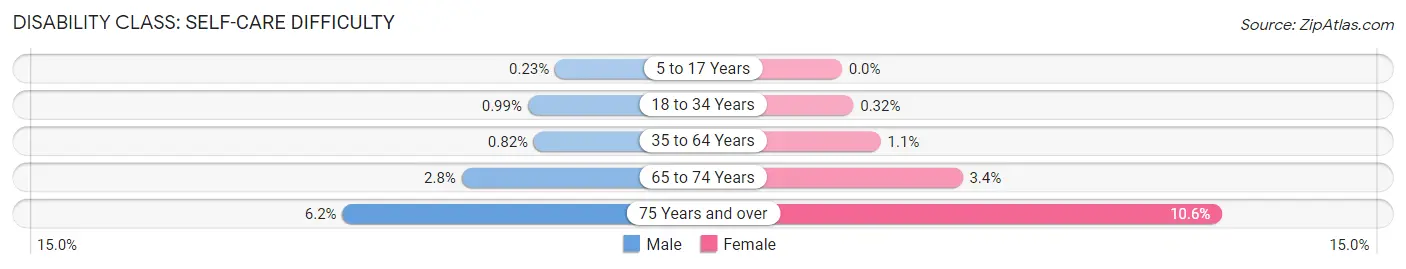
| Age Bracket | Male | Female |
| 5 to 17 Years | 22 (0.2%) | 0 (0.0%) |
| 18 to 34 Years | 107 (1.0%) | 35 (0.3%) |
| 35 to 64 Years | 226 (0.8%) | 305 (1.1%) |
| 65 to 74 Years | 212 (2.8%) | 250 (3.4%) |
| 75 Years and over | 261 (6.1%) | 609 (10.6%) |
Technology Access in Hunterdon County
Computing Device Access in Hunterdon County
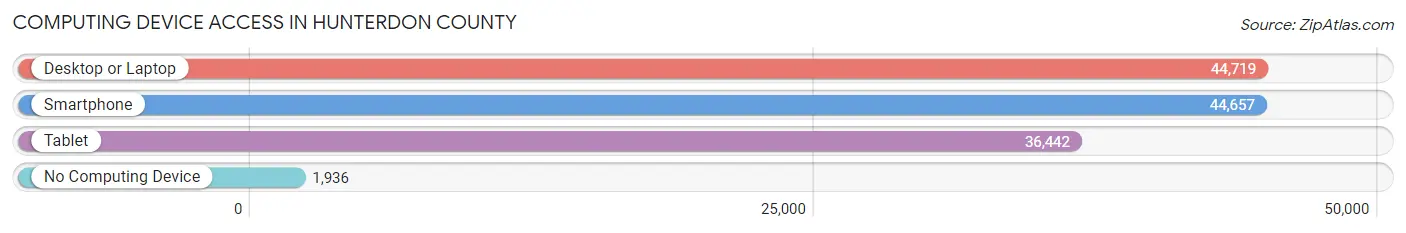
| Device Type | # Households | % Households |
| Desktop or Laptop | 44,719 | 90.0% |
| Smartphone | 44,657 | 89.9% |
| Tablet | 36,442 | 73.4% |
| No Computing Device | 1,936 | 3.9% |
| Total | 49,676 | 100.0% |
Internet Access in Hunterdon County
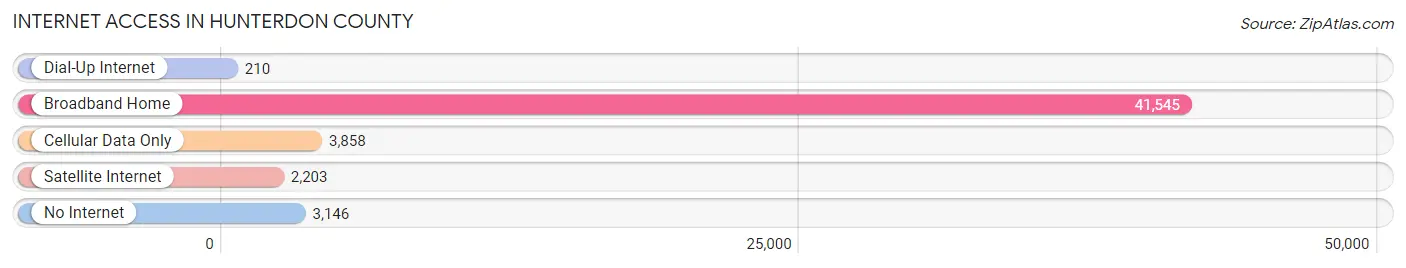
| Internet Type | # Households | % Households |
| Dial-Up Internet | 210 | 0.4% |
| Broadband Home | 41,545 | 83.6% |
| Cellular Data Only | 3,858 | 7.8% |
| Satellite Internet | 2,203 | 4.4% |
| No Internet | 3,146 | 6.3% |
| Total | 49,676 | 100.0% |
Hunterdon County Summary
Hunterdon County, NJ is located in the northwest corner of the state and is part of the New York metropolitan area. It is bordered by Warren County to the north, Somerset County to the east, Mercer County to the south, and Bucks County, Pennsylvania to the west. The county seat is Flemington.
History
Hunterdon County was formed in 1714 from portions of Burlington County. It was named for Robert Hunter, the colonial governor of New Jersey from 1710 to 1720. The county was originally divided into three townships: Amwell, Hunterdon, and Lebanon. In 1739, the townships of Kingwood and Hopewell were created from portions of Amwell and Hunterdon. In 1798, the townships of Alexandria, Bethlehem, and Franklin were created from portions of Kingwood and Hopewell.
The county was an important center of the iron industry in the 18th and 19th centuries. The county was also home to several prominent families, including the Van Dorens, the Van Syckles, and the Van Horns.
Geography
Hunterdon County covers an area of 437 square miles and is located in the northwest corner of the state. It is bordered by Warren County to the north, Somerset County to the east, Mercer County to the south, and Bucks County, Pennsylvania to the west. The county is divided into 24 municipalities, including the townships of Alexandria, Bethlehem, Franklin, Kingwood, and Hopewell, and the boroughs of Flemington, Clinton, High Bridge, Lambertville, and Stockton.
The terrain of Hunterdon County is mostly rolling hills and valleys, with the highest point being the summit of Musconetcong Mountain at 1,067 feet. The county is home to several rivers, including the Delaware River, the Musconetcong River, and the Raritan River.
Economy
Hunterdon County has a diverse economy, with a mix of agriculture, manufacturing, and services. The county is home to several large employers, including Merck & Co., Johnson & Johnson, and Novo Nordisk.
Agriculture is an important part of the county's economy, with dairy farming and livestock production being the primary agricultural activities. The county is also home to several wineries and vineyards.
Manufacturing is also an important part of the county's economy, with companies such as Hunterdon Brewing Company, Hunterdon Polymers, and Hunterdon Plastics located in the county.
The county is also home to several service-based businesses, including financial services, healthcare, and education.
Demographics
As of the 2010 census, Hunterdon County had a population of 128,349. The population was spread out with 24.3% under the age of 18, 8.2% from 18 to 24, 28.2% from 25 to 44, 28.2% from 45 to 64, and 11.1% who were 65 years of age or older. The median age was 39.7 years.
The racial makeup of the county was 90.2% White, 4.2% Hispanic or Latino, 2.3% Asian, 1.2% African American, 0.3% Native American, 0.1% Pacific Islander, and 1.8% from two or more races.
The median household income in the county was $97,817 and the median family income was $117,817. The per capita income was $45,817. About 4.2% of the population was below the poverty line.
Common Questions
What is the Total Population of Hunterdon County?
Total Population of Hunterdon County is 129,099.
What is the Total Male Population of Hunterdon County?
Total Male Population of Hunterdon County is 63,792.
What is the Total Female Population of Hunterdon County?
Total Female Population of Hunterdon County is 65,307.
What is the Ratio of Males per 100 Females in Hunterdon County?
There are 97.68 Males per 100 Females in Hunterdon County.
What is the Ratio of Females per 100 Males in Hunterdon County?
There are 102.37 Females per 100 Males in Hunterdon County.
What is the Median Population Age in Hunterdon County?
Median Population Age in Hunterdon County is 46.4 Years.
What is the Average Family Size in Hunterdon County
Average Family Size in Hunterdon County is 3.0 People.
What is the Average Household Size in Hunterdon County
Average Household Size in Hunterdon County is 2.5 People.
What is Per Capita Income in Hunterdon County?
Per Capita income in Hunterdon County is $68,112.
What is the Median Family Income in Hunterdon County?
Median Family Income in Hunterdon County is $161,440.
What is the Median Household income in Hunterdon County?
Median Household Income in Hunterdon County is $133,534.
What is Income or Wage Gap in Hunterdon County?
Income or Wage Gap in Hunterdon County is 35.5%.
Women in Hunterdon County earn 64.5 cents for every dollar earned by a man.
What is Family Income Deficit in Hunterdon County?
Family Income Deficit in Hunterdon County is $9,761.
Families that are below poverty line in Hunterdon County earn $9,761 less on average than the poverty threshold level.
What is Inequality or Gini Index in Hunterdon County?
Inequality or Gini Index in Hunterdon County is 0.44.
How Large is the Labor Force in Hunterdon County?
There are 70,932 People in the Labor Forcein in Hunterdon County.
What is the Percentage of People in the Labor Force in Hunterdon County?
65.4% of People are in the Labor Force in Hunterdon County.
What is the Unemployment Rate in Hunterdon County?
Unemployment Rate in Hunterdon County is 4.6%.