Hudson County, NJ
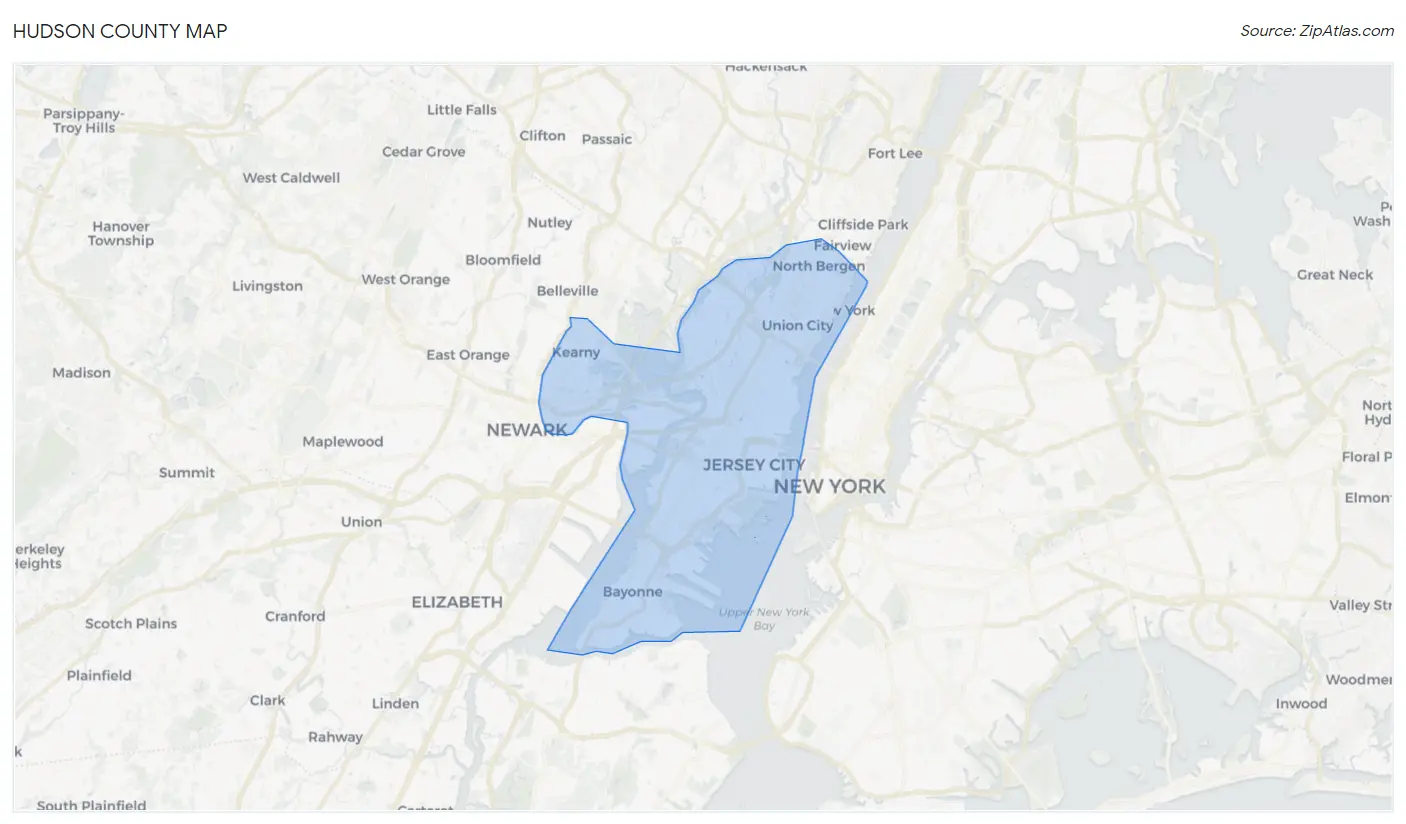
Hudson County Map
Hudson County Overview
712,029
TOTAL POPULATION
356,520
MALE POPULATION
355,509
FEMALE POPULATION
100.28
MALES / 100 FEMALES
99.72
FEMALES / 100 MALES
35.6
MEDIAN AGE
3.1
AVG FAMILY SIZE
2.4
AVG HOUSEHOLD SIZE
$51,277
PER CAPITA INCOME
$96,221
AVG FAMILY INCOME
$86,854
AVG HOUSEHOLD INCOME
26.0%
WAGE / INCOME GAP [ % ]
74.0¢/ $1
WAGE / INCOME GAP [ $ ]
$10,508
FAMILY INCOME DEFICIT
0.50
INEQUALITY / GINI INDEX
406,698
LABOR FORCE [ PEOPLE ]
69.9%
PERCENT IN LABOR FORCE
5.8%
UNEMPLOYMENT RATE
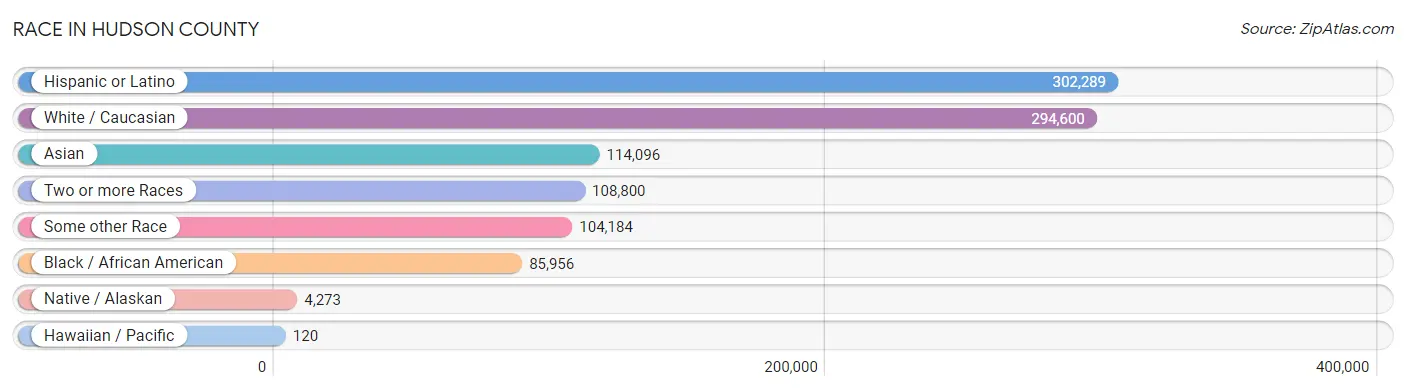
Race in Hudson County
The most populous races in Hudson County are Hispanic or Latino (302,289 | 42.4%), White / Caucasian (294,600 | 41.4%), and Asian (114,096 | 16.0%).
| Race | # Population | % Population |
| Asian | 114,096 | 16.0% |
| Black / African American | 85,956 | 12.1% |
| Hawaiian / Pacific | 120 | 0.0% |
| Hispanic or Latino | 302,289 | 42.4% |
| Native / Alaskan | 4,273 | 0.6% |
| White / Caucasian | 294,600 | 41.4% |
| Two or more Races | 108,800 | 15.3% |
| Some other Race | 104,184 | 14.6% |
| Total | 712,029 | 100.0% |
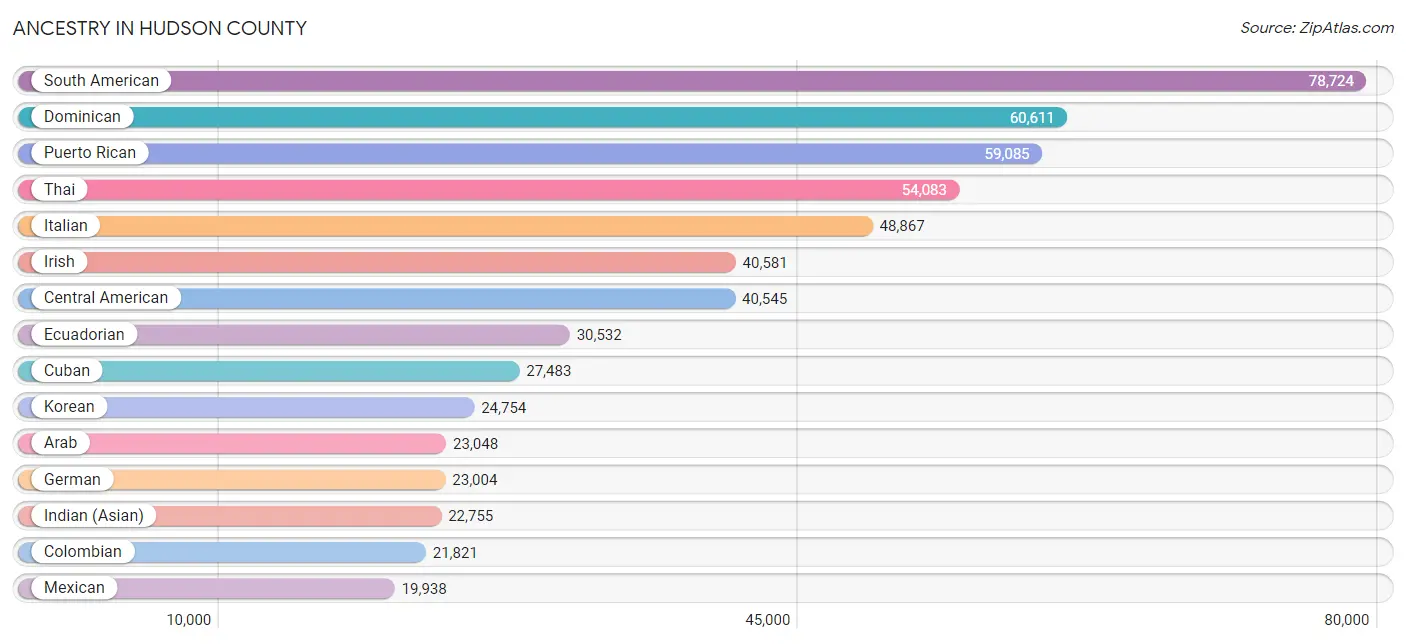
Ancestry in Hudson County
The most populous ancestries reported in Hudson County are South American (78,724 | 11.1%), Dominican (60,611 | 8.5%), Puerto Rican (59,085 | 8.3%), Thai (54,083 | 7.6%), and Italian (48,867 | 6.9%), together accounting for 42.3% of all Hudson County residents.
| Ancestry | # Population | % Population |
| Afghan | 77 | 0.0% |
| African | 4,513 | 0.6% |
| Albanian | 324 | 0.1% |
| Alsatian | 58 | 0.0% |
| American | 17,031 | 2.4% |
| Apache | 98 | 0.0% |
| Arab | 23,048 | 3.2% |
| Argentinean | 3,082 | 0.4% |
| Armenian | 533 | 0.1% |
| Assyrian / Chaldean / Syriac | 27 | 0.0% |
| Australian | 318 | 0.0% |
| Austrian | 876 | 0.1% |
| Bahamian | 104 | 0.0% |
| Barbadian | 253 | 0.0% |
| Basque | 61 | 0.0% |
| Belgian | 356 | 0.1% |
| Belizean | 100 | 0.0% |
| Bermudan | 134 | 0.0% |
| Bhutanese | 2,632 | 0.4% |
| Blackfeet | 204 | 0.0% |
| Bolivian | 1,339 | 0.2% |
| Brazilian | 4,213 | 0.6% |
| British | 1,637 | 0.2% |
| British West Indian | 849 | 0.1% |
| Bulgarian | 624 | 0.1% |
| Burmese | 5,956 | 0.8% |
| Cambodian | 17 | 0.0% |
| Canadian | 933 | 0.1% |
| Cape Verdean | 18 | 0.0% |
| Carpatho Rusyn | 96 | 0.0% |
| Celtic | 9 | 0.0% |
| Central American | 40,545 | 5.7% |
| Central American Indian | 2,602 | 0.4% |
| Cherokee | 579 | 0.1% |
| Chilean | 2,554 | 0.4% |
| Chippewa | 28 | 0.0% |
| Choctaw | 18 | 0.0% |
| Colombian | 21,821 | 3.1% |
| Costa Rican | 1,262 | 0.2% |
| Cree | 7 | 0.0% |
| Creek | 1 | 0.0% |
| Croatian | 613 | 0.1% |
| Cuban | 27,483 | 3.9% |
| Cypriot | 52 | 0.0% |
| Czech | 494 | 0.1% |
| Czechoslovakian | 158 | 0.0% |
| Danish | 540 | 0.1% |
| Delaware | 181 | 0.0% |
| Dominican | 60,611 | 8.5% |
| Dutch | 1,978 | 0.3% |
| Dutch West Indian | 36 | 0.0% |
| Eastern European | 2,097 | 0.3% |
| Ecuadorian | 30,532 | 4.3% |
| Egyptian | 12,357 | 1.7% |
| English | 12,613 | 1.8% |
| Estonian | 127 | 0.0% |
| Ethiopian | 358 | 0.1% |
| European | 3,544 | 0.5% |
| Filipino | 1,129 | 0.2% |
| Finnish | 333 | 0.1% |
| French | 4,846 | 0.7% |
| French American Indian | 18 | 0.0% |
| French Canadian | 695 | 0.1% |
| German | 23,004 | 3.2% |
| Ghanaian | 1,029 | 0.1% |
| Greek | 2,662 | 0.4% |
| Guamanian / Chamorro | 230 | 0.0% |
| Guatemalan | 8,437 | 1.2% |
| Guyanese | 4,225 | 0.6% |
| Haitian | 2,707 | 0.4% |
| Honduran | 9,958 | 1.4% |
| Hungarian | 1,739 | 0.2% |
| Icelander | 38 | 0.0% |
| Indian (Asian) | 22,755 | 3.2% |
| Indonesian | 72 | 0.0% |
| Inupiat | 1 | 0.0% |
| Iranian | 840 | 0.1% |
| Iraqi | 122 | 0.0% |
| Irish | 40,581 | 5.7% |
| Iroquois | 68 | 0.0% |
| Israeli | 737 | 0.1% |
| Italian | 48,867 | 6.9% |
| Jamaican | 3,880 | 0.5% |
| Japanese | 86 | 0.0% |
| Jordanian | 574 | 0.1% |
| Kenyan | 1,286 | 0.2% |
| Korean | 24,754 | 3.5% |
| Laotian | 243 | 0.0% |
| Latvian | 131 | 0.0% |
| Lebanese | 1,640 | 0.2% |
| Liberian | 190 | 0.0% |
| Lithuanian | 1,042 | 0.2% |
| Luxembourger | 11 | 0.0% |
| Macedonian | 213 | 0.0% |
| Maltese | 71 | 0.0% |
| Mexican | 19,938 | 2.8% |
| Mexican American Indian | 1,107 | 0.2% |
| Mongolian | 61 | 0.0% |
| Moroccan | 3,290 | 0.5% |
| Native Hawaiian | 100 | 0.0% |
| Navajo | 19 | 0.0% |
| New Zealander | 70 | 0.0% |
| Nicaraguan | 1,445 | 0.2% |
| Nigerian | 1,670 | 0.2% |
| Northern European | 120 | 0.0% |
| Norwegian | 1,240 | 0.2% |
| Okinawan | 94 | 0.0% |
| Pakistani | 767 | 0.1% |
| Palestinian | 399 | 0.1% |
| Panamanian | 1,186 | 0.2% |
| Paraguayan | 141 | 0.0% |
| Pennsylvania German | 45 | 0.0% |
| Peruvian | 13,058 | 1.8% |
| Pima | 11 | 0.0% |
| Polish | 18,082 | 2.5% |
| Portuguese | 6,375 | 0.9% |
| Potawatomi | 46 | 0.0% |
| Puerto Rican | 59,085 | 8.3% |
| Romanian | 1,266 | 0.2% |
| Russian | 7,388 | 1.0% |
| Salvadoran | 18,105 | 2.5% |
| Scandinavian | 298 | 0.0% |
| Scotch-Irish | 746 | 0.1% |
| Scottish | 2,893 | 0.4% |
| Seminole | 37 | 0.0% |
| Senegalese | 253 | 0.0% |
| Serbian | 562 | 0.1% |
| Sierra Leonean | 48 | 0.0% |
| Sioux | 45 | 0.0% |
| Slavic | 596 | 0.1% |
| Slovak | 831 | 0.1% |
| Slovene | 43 | 0.0% |
| Somali | 19 | 0.0% |
| South African | 195 | 0.0% |
| South American | 78,724 | 11.1% |
| South American Indian | 995 | 0.1% |
| Soviet Union | 7 | 0.0% |
| Spaniard | 4,581 | 0.6% |
| Spanish | 1,045 | 0.2% |
| Spanish American Indian | 237 | 0.0% |
| Sri Lankan | 2,942 | 0.4% |
| Subsaharan African | 10,519 | 1.5% |
| Sudanese | 101 | 0.0% |
| Swedish | 1,711 | 0.2% |
| Swiss | 486 | 0.1% |
| Syrian | 247 | 0.0% |
| Thai | 54,083 | 7.6% |
| Tlingit-Haida | 24 | 0.0% |
| Tohono O'Odham | 9 | 0.0% |
| Trinidadian and Tobagonian | 2,221 | 0.3% |
| Turkish | 1,124 | 0.2% |
| U.S. Virgin Islander | 228 | 0.0% |
| Ugandan | 21 | 0.0% |
| Ukrainian | 3,011 | 0.4% |
| Uruguayan | 1,660 | 0.2% |
| Venezuelan | 4,298 | 0.6% |
| Vietnamese | 700 | 0.1% |
| Welsh | 939 | 0.1% |
| West Indian | 1,244 | 0.2% |
| Yaqui | 174 | 0.0% |
| Yugoslavian | 317 | 0.0% |
| Zimbabwean | 103 | 0.0% | View All 162 Rows |
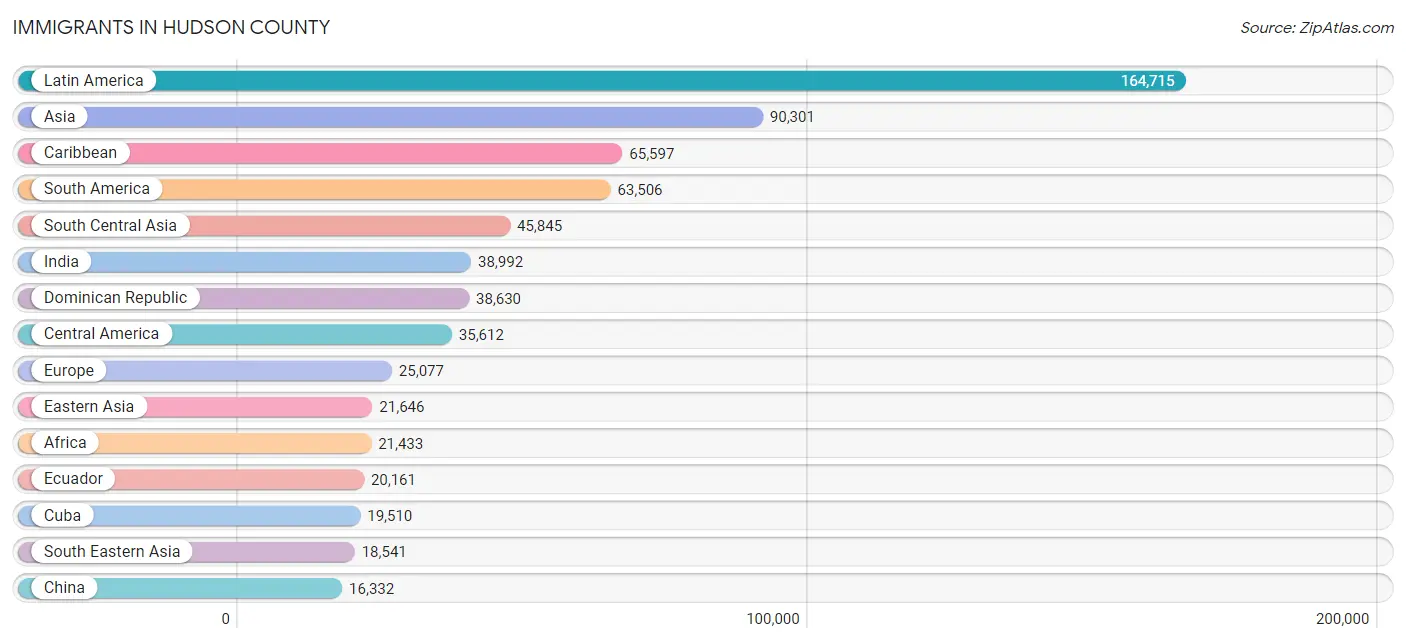
Immigrants in Hudson County
The most numerous immigrant groups reported in Hudson County came from Latin America (164,715 | 23.1%), Asia (90,301 | 12.7%), Caribbean (65,597 | 9.2%), South America (63,506 | 8.9%), and South Central Asia (45,845 | 6.4%), together accounting for 60.4% of all Hudson County residents.
| Immigration Origin | # Population | % Population |
| Afghanistan | 26 | 0.0% |
| Africa | 21,433 | 3.0% |
| Albania | 158 | 0.0% |
| Argentina | 1,719 | 0.2% |
| Armenia | 47 | 0.0% |
| Asia | 90,301 | 12.7% |
| Australia | 447 | 0.1% |
| Austria | 30 | 0.0% |
| Bahamas | 34 | 0.0% |
| Bangladesh | 669 | 0.1% |
| Barbados | 144 | 0.0% |
| Belarus | 448 | 0.1% |
| Belgium | 69 | 0.0% |
| Belize | 173 | 0.0% |
| Bolivia | 1,027 | 0.1% |
| Bosnia and Herzegovina | 102 | 0.0% |
| Brazil | 4,780 | 0.7% |
| Bulgaria | 683 | 0.1% |
| Cabo Verde | 21 | 0.0% |
| Cambodia | 35 | 0.0% |
| Cameroon | 348 | 0.1% |
| Canada | 2,015 | 0.3% |
| Caribbean | 65,597 | 9.2% |
| Central America | 35,612 | 5.0% |
| Chile | 2,199 | 0.3% |
| China | 16,332 | 2.3% |
| Colombia | 15,608 | 2.2% |
| Congo | 9 | 0.0% |
| Costa Rica | 730 | 0.1% |
| Croatia | 185 | 0.0% |
| Cuba | 19,510 | 2.7% |
| Czechoslovakia | 83 | 0.0% |
| Denmark | 91 | 0.0% |
| Dominica | 229 | 0.0% |
| Dominican Republic | 38,630 | 5.4% |
| Eastern Africa | 2,276 | 0.3% |
| Eastern Asia | 21,646 | 3.0% |
| Eastern Europe | 10,008 | 1.4% |
| Ecuador | 20,161 | 2.8% |
| Egypt | 10,391 | 1.5% |
| El Salvador | 11,108 | 1.6% |
| England | 548 | 0.1% |
| Ethiopia | 295 | 0.0% |
| Europe | 25,077 | 3.5% |
| France | 1,537 | 0.2% |
| Germany | 1,203 | 0.2% |
| Ghana | 966 | 0.1% |
| Greece | 383 | 0.1% |
| Guatemala | 5,675 | 0.8% |
| Guyana | 3,434 | 0.5% |
| Haiti | 2,008 | 0.3% |
| Honduras | 7,187 | 1.0% |
| Hong Kong | 1,216 | 0.2% |
| Hungary | 429 | 0.1% |
| India | 38,992 | 5.5% |
| Indonesia | 184 | 0.0% |
| Iran | 508 | 0.1% |
| Iraq | 38 | 0.0% |
| Ireland | 752 | 0.1% |
| Israel | 946 | 0.1% |
| Italy | 2,626 | 0.4% |
| Jamaica | 1,980 | 0.3% |
| Japan | 1,368 | 0.2% |
| Jordan | 411 | 0.1% |
| Kazakhstan | 97 | 0.0% |
| Kenya | 1,385 | 0.2% |
| Korea | 3,935 | 0.5% |
| Kuwait | 215 | 0.0% |
| Laos | 55 | 0.0% |
| Latin America | 164,715 | 23.1% |
| Latvia | 16 | 0.0% |
| Lebanon | 383 | 0.1% |
| Liberia | 190 | 0.0% |
| Lithuania | 48 | 0.0% |
| Malaysia | 114 | 0.0% |
| Mexico | 9,254 | 1.3% |
| Middle Africa | 644 | 0.1% |
| Moldova | 116 | 0.0% |
| Morocco | 2,832 | 0.4% |
| Nepal | 566 | 0.1% |
| Netherlands | 195 | 0.0% |
| Nicaragua | 585 | 0.1% |
| Nigeria | 1,068 | 0.2% |
| North Macedonia | 183 | 0.0% |
| Northern Africa | 14,537 | 2.0% |
| Northern Europe | 3,539 | 0.5% |
| Norway | 17 | 0.0% |
| Oceania | 596 | 0.1% |
| Pakistan | 4,488 | 0.6% |
| Panama | 900 | 0.1% |
| Peru | 9,229 | 1.3% |
| Philippines | 15,500 | 2.2% |
| Poland | 2,652 | 0.4% |
| Portugal | 2,813 | 0.4% |
| Romania | 469 | 0.1% |
| Russia | 2,278 | 0.3% |
| Saudi Arabia | 305 | 0.0% |
| Scotland | 133 | 0.0% |
| Senegal | 511 | 0.1% |
| Serbia | 356 | 0.1% |
| Sierra Leone | 49 | 0.0% |
| Singapore | 200 | 0.0% |
| South Africa | 454 | 0.1% |
| South America | 63,506 | 8.9% |
| South Central Asia | 45,845 | 6.4% |
| South Eastern Asia | 18,541 | 2.6% |
| Southern Europe | 8,172 | 1.1% |
| Spain | 2,303 | 0.3% |
| Sri Lanka | 168 | 0.0% |
| St. Vincent and the Grenadines | 80 | 0.0% |
| Sudan | 102 | 0.0% |
| Sweden | 55 | 0.0% |
| Switzerland | 213 | 0.0% |
| Syria | 93 | 0.0% |
| Taiwan | 1,378 | 0.2% |
| Thailand | 357 | 0.1% |
| Trinidad and Tobago | 2,089 | 0.3% |
| Turkey | 1,005 | 0.1% |
| Uganda | 96 | 0.0% |
| Ukraine | 1,545 | 0.2% |
| Uruguay | 1,025 | 0.1% |
| Uzbekistan | 168 | 0.0% |
| Venezuela | 3,849 | 0.5% |
| Vietnam | 2,024 | 0.3% |
| West Indies | 20 | 0.0% |
| Western Africa | 3,366 | 0.5% |
| Western Asia | 4,005 | 0.6% |
| Western Europe | 3,247 | 0.5% |
| Yemen | 126 | 0.0% |
| Zaire | 7 | 0.0% |
| Zimbabwe | 129 | 0.0% | View All 131 Rows |
Sex and Age in Hudson County
Sex and Age in Hudson County
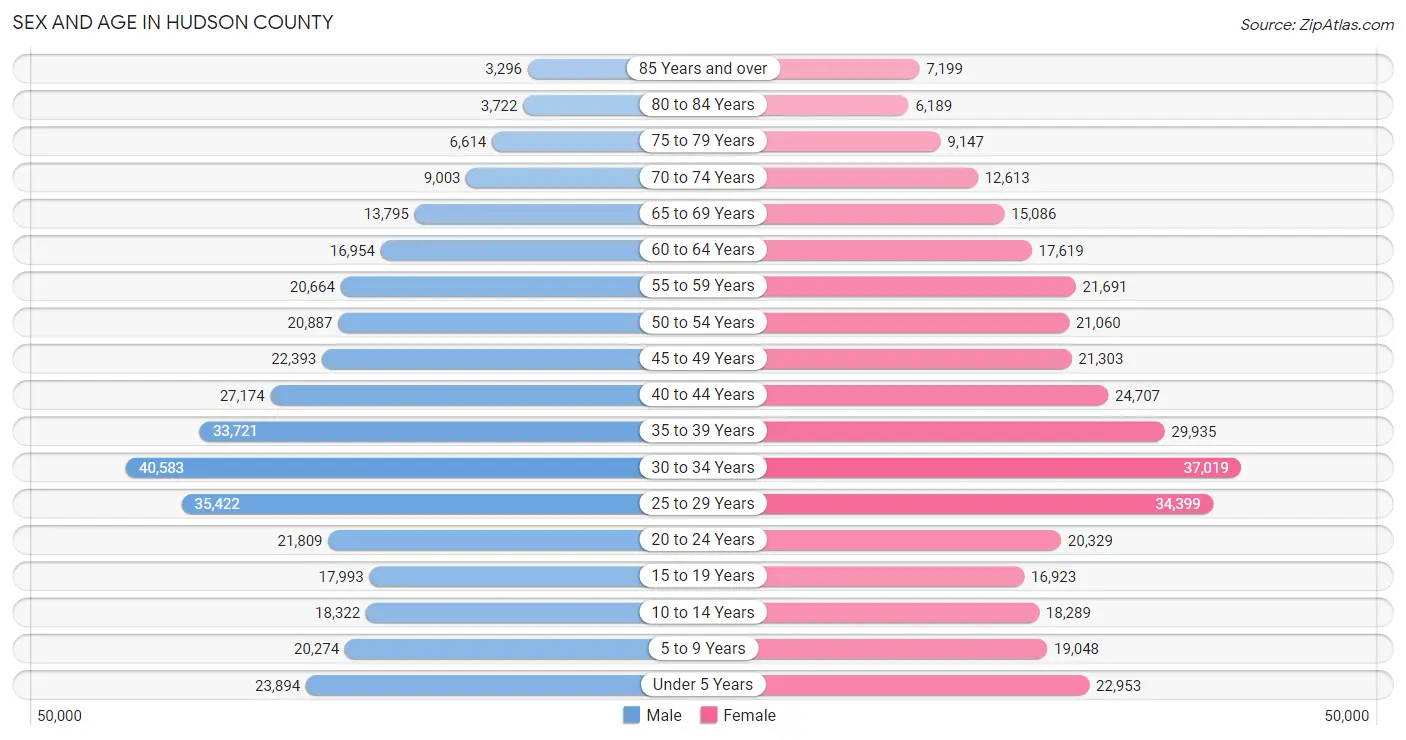
The most populous age groups in Hudson County are 30 to 34 Years (40,583 | 11.4%) for men and 30 to 34 Years (37,019 | 10.4%) for women.
| Age Bracket | Male | Female |
| Under 5 Years | 23,894 (6.7%) | 22,953 (6.5%) |
| 5 to 9 Years | 20,274 (5.7%) | 19,048 (5.4%) |
| 10 to 14 Years | 18,322 (5.1%) | 18,289 (5.1%) |
| 15 to 19 Years | 17,993 (5.1%) | 16,923 (4.8%) |
| 20 to 24 Years | 21,809 (6.1%) | 20,329 (5.7%) |
| 25 to 29 Years | 35,422 (9.9%) | 34,399 (9.7%) |
| 30 to 34 Years | 40,583 (11.4%) | 37,019 (10.4%) |
| 35 to 39 Years | 33,721 (9.5%) | 29,935 (8.4%) |
| 40 to 44 Years | 27,174 (7.6%) | 24,707 (7.0%) |
| 45 to 49 Years | 22,393 (6.3%) | 21,303 (6.0%) |
| 50 to 54 Years | 20,887 (5.9%) | 21,060 (5.9%) |
| 55 to 59 Years | 20,664 (5.8%) | 21,691 (6.1%) |
| 60 to 64 Years | 16,954 (4.8%) | 17,619 (5.0%) |
| 65 to 69 Years | 13,795 (3.9%) | 15,086 (4.2%) |
| 70 to 74 Years | 9,003 (2.5%) | 12,613 (3.5%) |
| 75 to 79 Years | 6,614 (1.9%) | 9,147 (2.6%) |
| 80 to 84 Years | 3,722 (1.0%) | 6,189 (1.7%) |
| 85 Years and over | 3,296 (0.9%) | 7,199 (2.0%) |
| Total | 356,520 (100.0%) | 355,509 (100.0%) |
Families and Households in Hudson County
Median Family Size in Hudson County
The median family size in Hudson County is 3.07 persons per family, with married-couple families (115,196 | 66.8%) accounting for the largest median family size of 3.18 persons per family. On the other hand, single male/father families (16,467 | 9.6%) represent the smallest median family size with 2.63 persons per family.

| Family Type | # Families | Family Size |
| Married-Couple | 115,196 (66.8%) | 3.18 |
| Single Male/Father | 16,467 (9.6%) | 2.63 |
| Single Female/Mother | 40,734 (23.6%) | 2.95 |
| Total Families | 172,397 (100.0%) | 3.07 |
Median Household Size in Hudson County
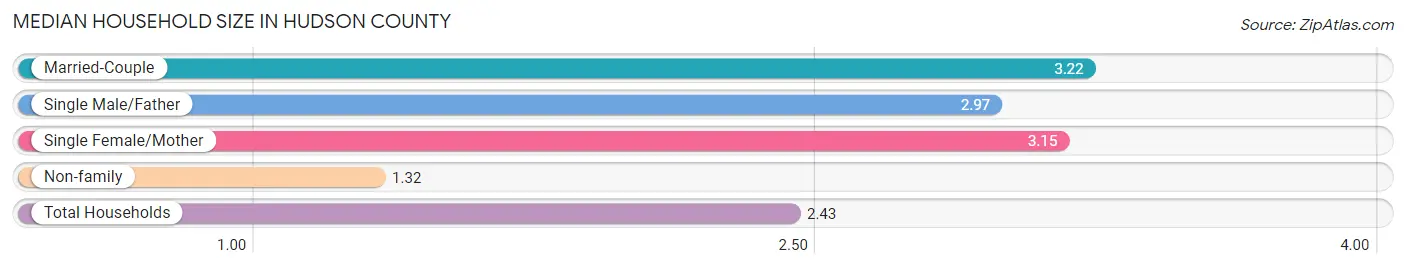
The median household size in Hudson County is 2.43 persons per household, with married-couple households (115,196 | 39.7%) accounting for the largest median household size of 3.22 persons per household. non-family households (117,657 | 40.6%) represent the smallest median household size with 1.32 persons per household.
| Household Type | # Households | Household Size |
| Married-Couple | 115,196 (39.7%) | 3.22 |
| Single Male/Father | 16,467 (5.7%) | 2.97 |
| Single Female/Mother | 40,734 (14.0%) | 3.15 |
| Non-family | 117,657 (40.6%) | 1.32 |
| Total Households | 290,054 (100.0%) | 2.43 |
Household Size by Marriage Status in Hudson County
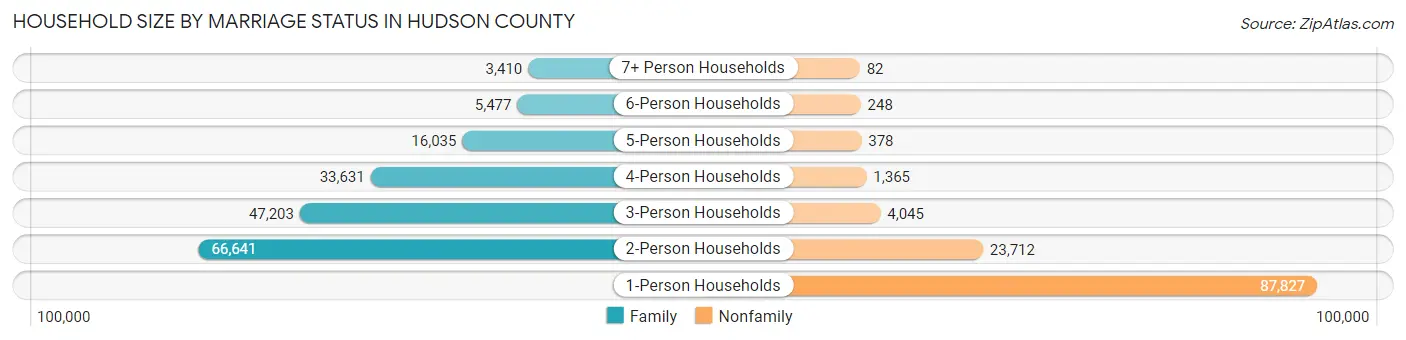
Out of a total of 290,054 households in Hudson County, 172,397 (59.4%) are family households, while 117,657 (40.6%) are nonfamily households. The most numerous type of family households are 2-person households, comprising 66,641, and the most common type of nonfamily households are 1-person households, comprising 87,827.
| Household Size | Family Households | Nonfamily Households |
| 1-Person Households | - | 87,827 (30.3%) |
| 2-Person Households | 66,641 (23.0%) | 23,712 (8.2%) |
| 3-Person Households | 47,203 (16.3%) | 4,045 (1.4%) |
| 4-Person Households | 33,631 (11.6%) | 1,365 (0.5%) |
| 5-Person Households | 16,035 (5.5%) | 378 (0.1%) |
| 6-Person Households | 5,477 (1.9%) | 248 (0.1%) |
| 7+ Person Households | 3,410 (1.2%) | 82 (0.0%) |
| Total | 172,397 (59.4%) | 117,657 (40.6%) |
Female Fertility in Hudson County
Fertility by Age in Hudson County
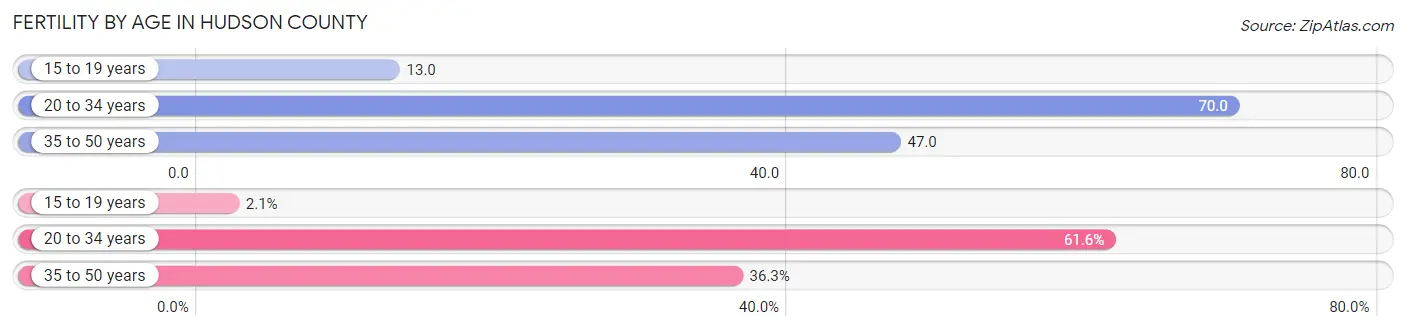
Average fertility rate in Hudson County is 55.0 births per 1,000 women. Women in the age bracket of 20 to 34 years have the highest fertility rate with 70.0 births per 1,000 women. Women in the age bracket of 20 to 34 years acount for 61.6% of all women with births.
| Age Bracket | Women with Births | Births / 1,000 Women |
| 15 to 19 years | 219 (2.1%) | 13.0 |
| 20 to 34 years | 6,444 (61.6%) | 70.0 |
| 35 to 50 years | 3,794 (36.3%) | 47.0 |
| Total | 10,457 (100.0%) | 55.0 |
Fertility by Age by Marriage Status in Hudson County
73.8% of women with births (10,457) in Hudson County are married. The highest percentage of unmarried women with births falls into 15 to 19 years age bracket with 100.0% of them unmarried at the time of birth, while the lowest percentage of unmarried women with births belong to 35 to 50 years age bracket with 17.2% of them unmarried.
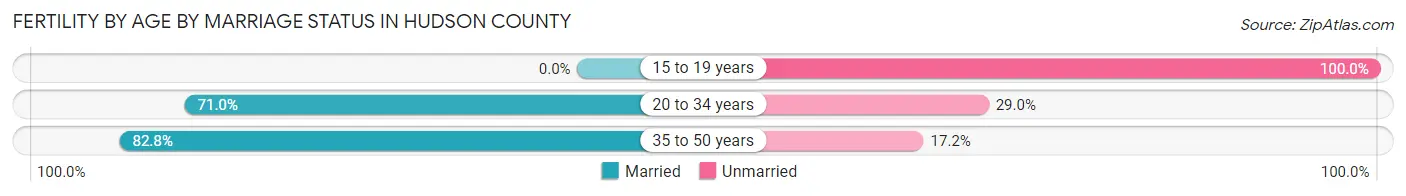
| Age Bracket | Married | Unmarried |
| 15 to 19 years | 0 (0.0%) | 219 (100.0%) |
| 20 to 34 years | 4,575 (71.0%) | 1,869 (29.0%) |
| 35 to 50 years | 3,141 (82.8%) | 653 (17.2%) |
| Total | 7,717 (73.8%) | 2,740 (26.2%) |
Fertility by Education in Hudson County
Average fertility rate in Hudson County is 55.0 births per 1,000 women. Women with the education attainment of graduate degree have the highest fertility rate of 75.0 births per 1,000 women, while women with the education attainment of less than high school have the lowest fertility at 37.0 births per 1,000 women. Women with the education attainment of bachelor's degree represent 32.0% of all women with births.
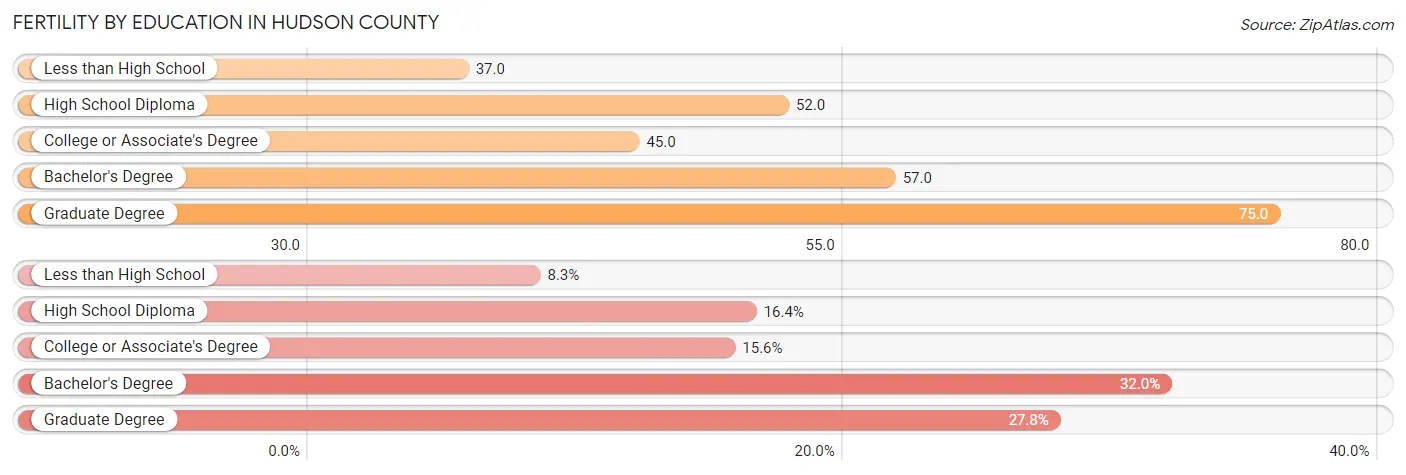
| Educational Attainment | Women with Births | Births / 1,000 Women |
| Less than High School | 867 (8.3%) | 37.0 |
| High School Diploma | 1,714 (16.4%) | 52.0 |
| College or Associate's Degree | 1,630 (15.6%) | 45.0 |
| Bachelor's Degree | 3,341 (32.0%) | 57.0 |
| Graduate Degree | 2,905 (27.8%) | 75.0 |
| Total | 10,457 (100.0%) | 55.0 |
Fertility by Education by Marriage Status in Hudson County
26.2% of women with births in Hudson County are unmarried. Women with the educational attainment of graduate degree are most likely to be married with 87.6% of them married at childbirth, while women with the educational attainment of less than high school are least likely to be married with 53.2% of them unmarried at childbirth.

| Educational Attainment | Married | Unmarried |
| Less than High School | 406 (46.8%) | 461 (53.2%) |
| High School Diploma | 1,022 (59.6%) | 692 (40.4%) |
| College or Associate's Degree | 852 (52.3%) | 778 (47.7%) |
| Bachelor's Degree | 2,890 (86.5%) | 451 (13.5%) |
| Graduate Degree | 2,545 (87.6%) | 360 (12.4%) |
| Total | 7,717 (73.8%) | 2,740 (26.2%) |
Income in Hudson County
Income Overview in Hudson County
Per Capita Income in Hudson County is $51,277, while median incomes of families and households are $96,221 and $86,854 respectively.
| Characteristic | Number | Measure |
| Per Capita Income | 712,029 | $51,277 |
| Median Family Income | 172,397 | $96,221 |
| Mean Family Income | 172,397 | $139,620 |
| Median Household Income | 290,054 | $86,854 |
| Mean Household Income | 290,054 | $126,531 |
| Income Deficit | 172,397 | $10,508 |
| Wage / Income Gap (%) | 712,029 | 25.99% |
| Wage / Income Gap ($) | 712,029 | 74.01¢ per $1 |
| Gini / Inequality Index | 712,029 | 0.50 |
Earnings by Sex in Hudson County
Average Earnings in Hudson County are $54,467, $61,904 for men and $45,816 for women, a difference of 26.0%.
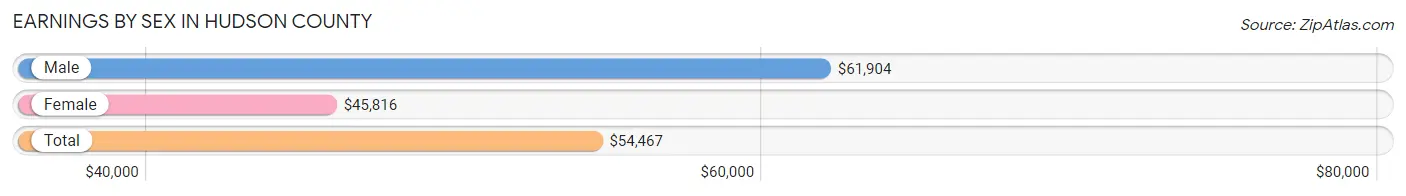
| Sex | Number | Average Earnings |
| Male | 224,141 (54.5%) | $61,904 |
| Female | 187,286 (45.5%) | $45,816 |
| Total | 411,427 (100.0%) | $54,467 |
Earnings by Sex by Income Bracket in Hudson County
The most common earnings brackets in Hudson County are $100,000+ for men (67,819 | 30.3%) and $100,000+ for women (37,433 | 20.0%).
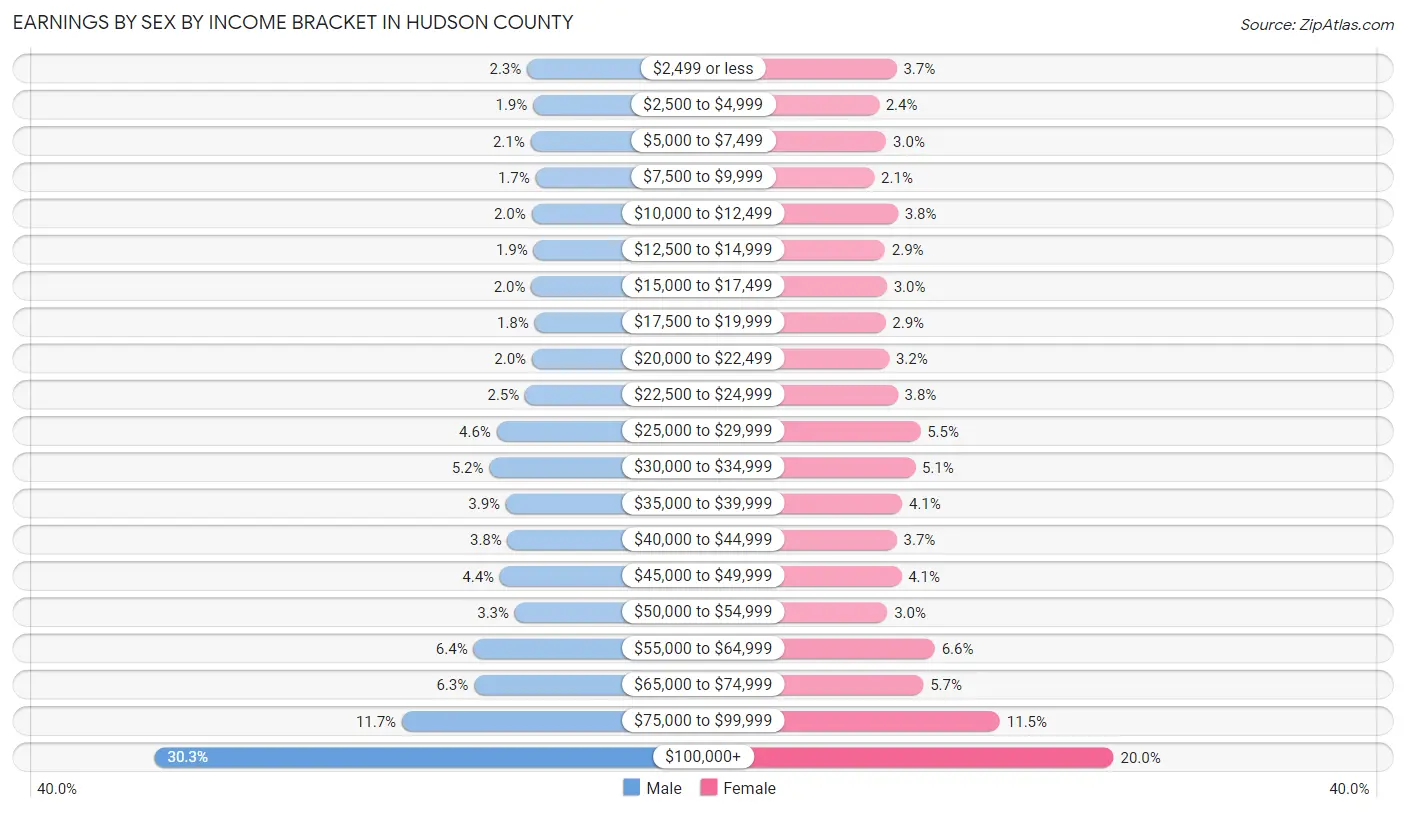
| Income | Male | Female |
| $2,499 or less | 5,238 (2.3%) | 6,973 (3.7%) |
| $2,500 to $4,999 | 4,247 (1.9%) | 4,482 (2.4%) |
| $5,000 to $7,499 | 4,652 (2.1%) | 5,524 (2.9%) |
| $7,500 to $9,999 | 3,830 (1.7%) | 3,837 (2.1%) |
| $10,000 to $12,499 | 4,501 (2.0%) | 7,153 (3.8%) |
| $12,500 to $14,999 | 4,180 (1.9%) | 5,331 (2.9%) |
| $15,000 to $17,499 | 4,555 (2.0%) | 5,600 (3.0%) |
| $17,500 to $19,999 | 3,998 (1.8%) | 5,412 (2.9%) |
| $20,000 to $22,499 | 4,444 (2.0%) | 5,919 (3.2%) |
| $22,500 to $24,999 | 5,589 (2.5%) | 7,132 (3.8%) |
| $25,000 to $29,999 | 10,352 (4.6%) | 10,305 (5.5%) |
| $30,000 to $34,999 | 11,588 (5.2%) | 9,575 (5.1%) |
| $35,000 to $39,999 | 8,810 (3.9%) | 7,755 (4.1%) |
| $40,000 to $44,999 | 8,513 (3.8%) | 6,977 (3.7%) |
| $45,000 to $49,999 | 9,811 (4.4%) | 7,643 (4.1%) |
| $50,000 to $54,999 | 7,316 (3.3%) | 5,669 (3.0%) |
| $55,000 to $64,999 | 14,263 (6.4%) | 12,344 (6.6%) |
| $65,000 to $74,999 | 14,157 (6.3%) | 10,738 (5.7%) |
| $75,000 to $99,999 | 26,278 (11.7%) | 21,484 (11.5%) |
| $100,000+ | 67,819 (30.3%) | 37,433 (20.0%) |
| Total | 224,141 (100.0%) | 187,286 (100.0%) |
Earnings by Sex by Educational Attainment in Hudson County
Average earnings in Hudson County are $67,903 for men and $51,158 for women, a difference of 24.7%. Men with an educational attainment of graduate degree enjoy the highest average annual earnings of $124,559, while those with less than high school education earn the least with $33,944. Women with an educational attainment of graduate degree earn the most with the average annual earnings of $91,192, while those with less than high school education have the smallest earnings of $21,963.
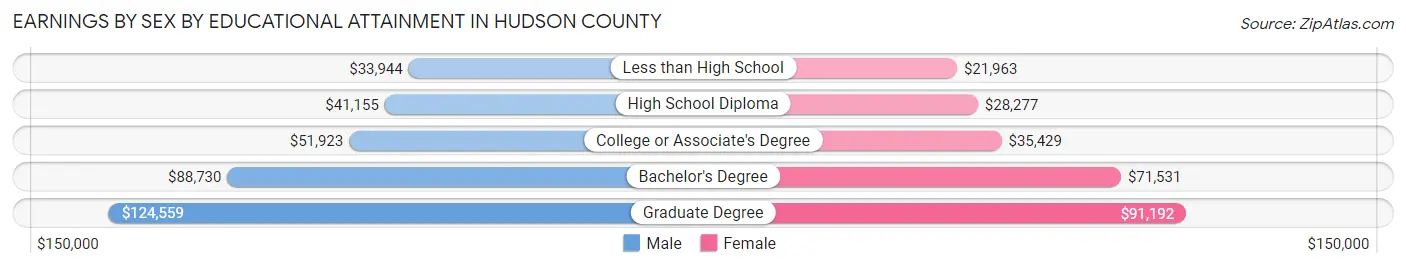
| Educational Attainment | Male Income | Female Income |
| Less than High School | $33,944 | $21,963 |
| High School Diploma | $41,155 | $28,277 |
| College or Associate's Degree | $51,923 | $35,429 |
| Bachelor's Degree | $88,730 | $71,531 |
| Graduate Degree | $124,559 | $91,192 |
| Total | $67,903 | $51,158 |
Family Income in Hudson County
Family Income Brackets in Hudson County
According to the Hudson County family income data, there are 35,686 families falling into the $200,000+ income range, which is the most common income bracket and makes up 20.7% of all families. Conversely, the $10,000 to $14,999 income bracket is the least frequent group with only 3,448 families (2.0%) belonging to this category.

| Income Bracket | # Families | % Families |
| Less than $10,000 | 5,861 | 3.4% |
| $10,000 to $14,999 | 3,448 | 2.0% |
| $15,000 to $24,999 | 9,999 | 5.8% |
| $25,000 to $34,999 | 11,206 | 6.5% |
| $35,000 to $49,999 | 14,999 | 8.7% |
| $50,000 to $74,999 | 23,963 | 13.9% |
| $75,000 to $99,999 | 19,136 | 11.1% |
| $100,000 to $149,999 | 30,859 | 17.9% |
| $150,000 to $199,999 | 17,412 | 10.1% |
| $200,000+ | 35,686 | 20.7% |
Family Income by Famaliy Size in Hudson County
7+ person families (2,723 | 1.6%) account for the highest median family income in Hudson County with $121,099 per family, while 2-person families (73,725 | 42.8%) have the highest median income of $44,129 per family member.
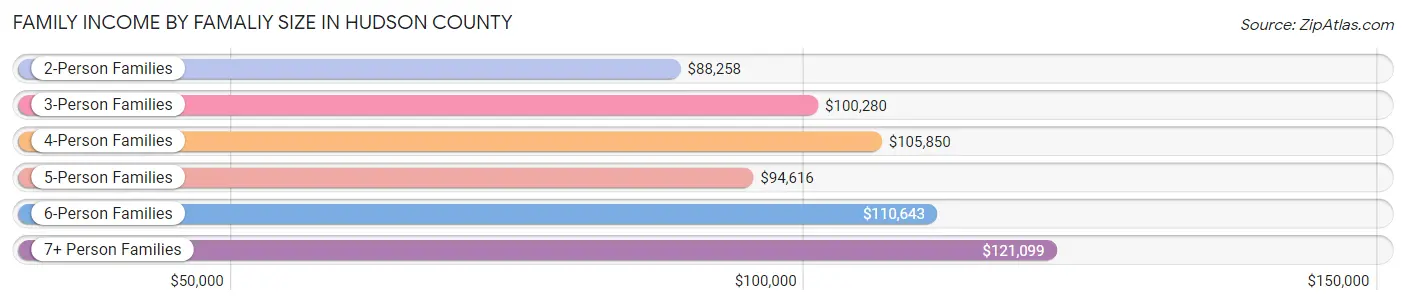
| Income Bracket | # Families | Median Income |
| 2-Person Families | 73,725 (42.8%) | $88,258 |
| 3-Person Families | 45,213 (26.2%) | $100,280 |
| 4-Person Families | 32,151 (18.6%) | $105,850 |
| 5-Person Families | 14,049 (8.2%) | $94,616 |
| 6-Person Families | 4,536 (2.6%) | $110,643 |
| 7+ Person Families | 2,723 (1.6%) | $121,099 |
| Total | 172,397 (100.0%) | $96,221 |
Family Income by Number of Earners in Hudson County
The median family income in Hudson County is $96,221, with families comprising 3+ earners (22,201) having the highest median family income of $134,539, while families with no earners (14,843) have the lowest median family income of $27,336, accounting for 12.9% and 8.6% of families, respectively.

| Number of Earners | # Families | Median Income |
| No Earners | 14,843 (8.6%) | $27,336 |
| 1 Earner | 58,132 (33.7%) | $62,433 |
| 2 Earners | 77,221 (44.8%) | $132,184 |
| 3+ Earners | 22,201 (12.9%) | $134,539 |
| Total | 172,397 (100.0%) | $96,221 |
Household Income in Hudson County
Household Income Brackets in Hudson County
With 52,790 households falling in the category, the $200,000+ income range is the most frequent in Hudson County, accounting for 18.2% of all households. In contrast, only 13,052 households (4.5%) fall into the $10,000 to $14,999 income bracket, making it the least populous group.
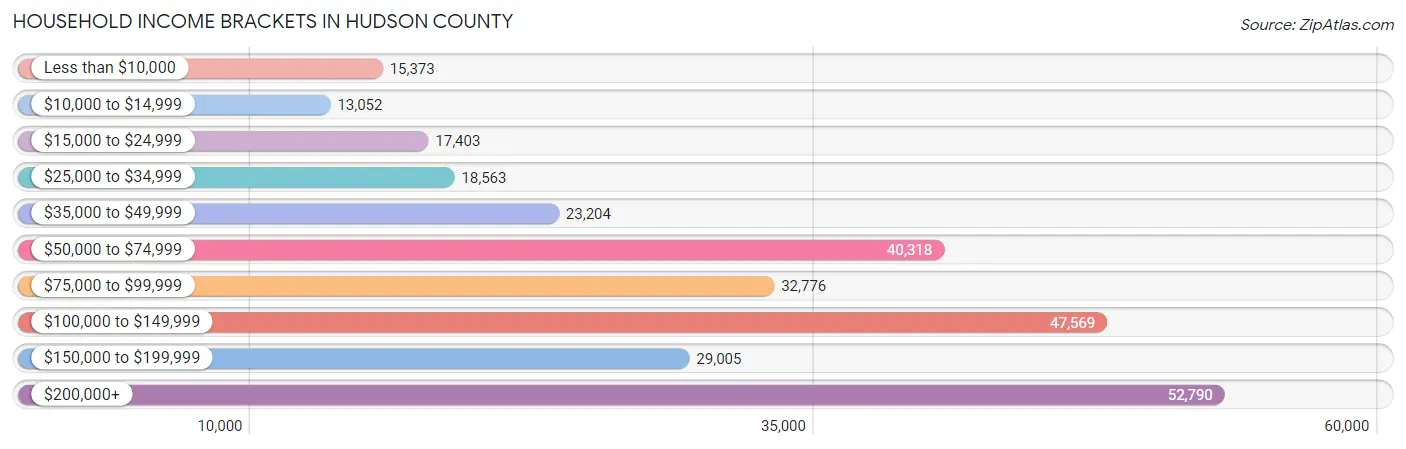
| Income Bracket | # Households | % Households |
| Less than $10,000 | 15,373 | 5.3% |
| $10,000 to $14,999 | 13,052 | 4.5% |
| $15,000 to $24,999 | 17,403 | 6.0% |
| $25,000 to $34,999 | 18,563 | 6.4% |
| $35,000 to $49,999 | 23,204 | 8.0% |
| $50,000 to $74,999 | 40,318 | 13.9% |
| $75,000 to $99,999 | 32,776 | 11.3% |
| $100,000 to $149,999 | 47,569 | 16.4% |
| $150,000 to $199,999 | 29,005 | 10.0% |
| $200,000+ | 52,790 | 18.2% |
Household Income by Householder Age in Hudson County
The median household income in Hudson County is $86,854, with the highest median household income of $113,315 found in the 25 to 44 years age bracket for the primary householder. A total of 132,943 households (45.8%) fall into this category. Meanwhile, the 65+ years age bracket for the primary householder has the lowest median household income of $42,265, with 53,031 households (18.3%) in this group.
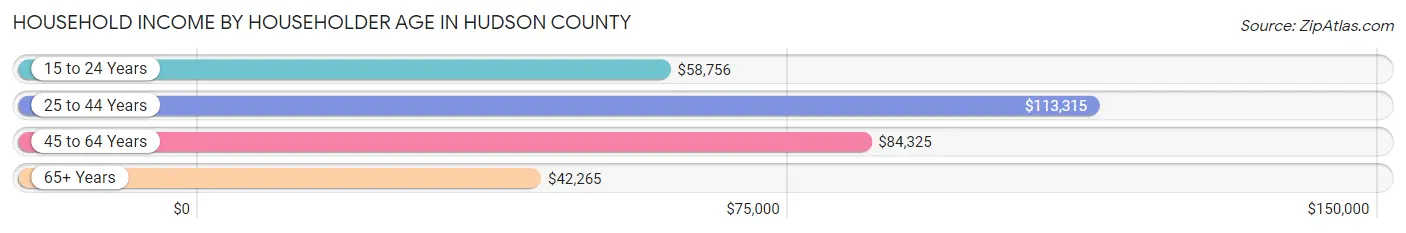
| Income Bracket | # Households | Median Income |
| 15 to 24 Years | 8,209 (2.8%) | $58,756 |
| 25 to 44 Years | 132,943 (45.8%) | $113,315 |
| 45 to 64 Years | 95,871 (33.1%) | $84,325 |
| 65+ Years | 53,031 (18.3%) | $42,265 |
| Total | 290,054 (100.0%) | $86,854 |
Poverty in Hudson County
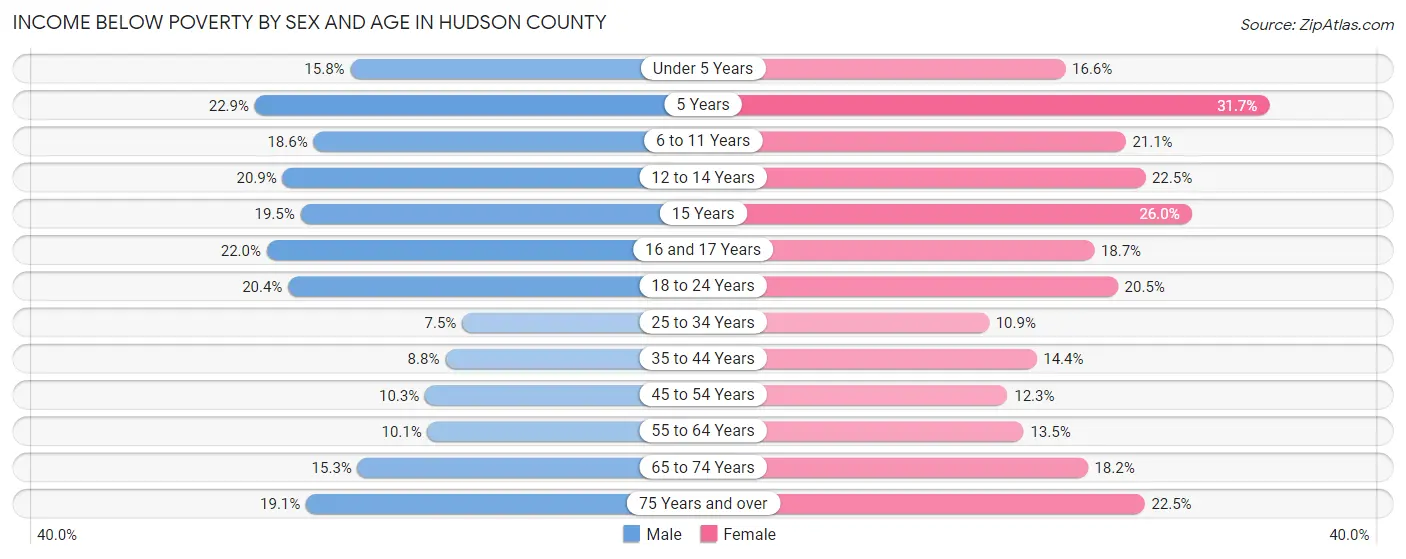
Income Below Poverty by Sex and Age in Hudson County
With 12.6% poverty level for males and 15.8% for females among the residents of Hudson County, 5 year old males and 5 year old females are the most vulnerable to poverty, with 882 males (22.9%) and 1,036 females (31.7%) in their respective age groups living below the poverty level.
| Age Bracket | Male | Female |
| Under 5 Years | 3,745 (15.8%) | 3,741 (16.6%) |
| 5 Years | 882 (22.9%) | 1,036 (31.7%) |
| 6 to 11 Years | 4,332 (18.5%) | 4,617 (21.1%) |
| 12 to 14 Years | 2,228 (20.8%) | 2,539 (22.5%) |
| 15 Years | 713 (19.5%) | 976 (26.0%) |
| 16 and 17 Years | 1,511 (22.0%) | 1,217 (18.7%) |
| 18 to 24 Years | 5,614 (20.4%) | 5,287 (20.5%) |
| 25 to 34 Years | 5,667 (7.5%) | 7,784 (10.9%) |
| 35 to 44 Years | 5,295 (8.8%) | 7,886 (14.4%) |
| 45 to 54 Years | 4,414 (10.3%) | 5,200 (12.3%) |
| 55 to 64 Years | 3,768 (10.1%) | 5,282 (13.5%) |
| 65 to 74 Years | 3,447 (15.3%) | 5,020 (18.2%) |
| 75 Years and over | 2,550 (19.1%) | 4,795 (22.5%) |
| Total | 44,166 (12.6%) | 55,380 (15.8%) |
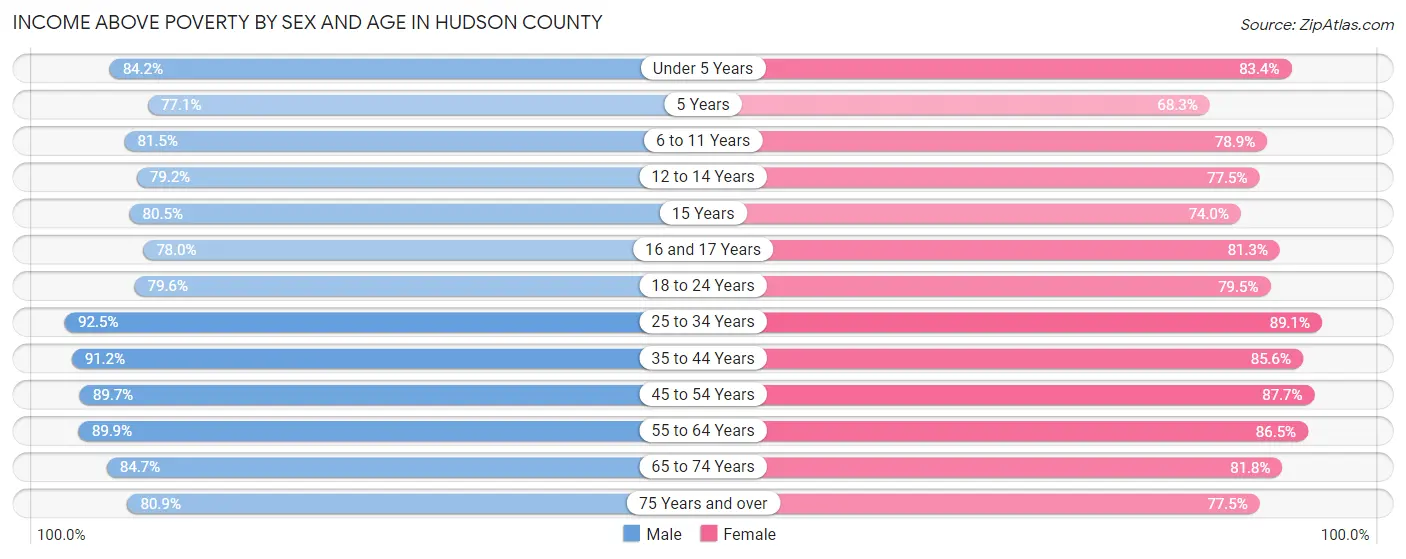
Income Above Poverty by Sex and Age in Hudson County
According to the poverty statistics in Hudson County, males aged 25 to 34 years and females aged 25 to 34 years are the age groups that are most secure financially, with 92.5% of males and 89.1% of females in these age groups living above the poverty line.
| Age Bracket | Male | Female |
| Under 5 Years | 19,950 (84.2%) | 18,826 (83.4%) |
| 5 Years | 2,968 (77.1%) | 2,229 (68.3%) |
| 6 to 11 Years | 19,019 (81.5%) | 17,303 (78.9%) |
| 12 to 14 Years | 8,457 (79.1%) | 8,739 (77.5%) |
| 15 Years | 2,942 (80.5%) | 2,784 (74.0%) |
| 16 and 17 Years | 5,351 (78.0%) | 5,283 (81.3%) |
| 18 to 24 Years | 21,859 (79.6%) | 20,533 (79.5%) |
| 25 to 34 Years | 69,758 (92.5%) | 63,589 (89.1%) |
| 35 to 44 Years | 55,084 (91.2%) | 46,737 (85.6%) |
| 45 to 54 Years | 38,578 (89.7%) | 37,122 (87.7%) |
| 55 to 64 Years | 33,595 (89.9%) | 33,881 (86.5%) |
| 65 to 74 Years | 19,132 (84.7%) | 22,504 (81.8%) |
| 75 Years and over | 10,799 (80.9%) | 16,549 (77.5%) |
| Total | 307,492 (87.4%) | 296,079 (84.2%) |
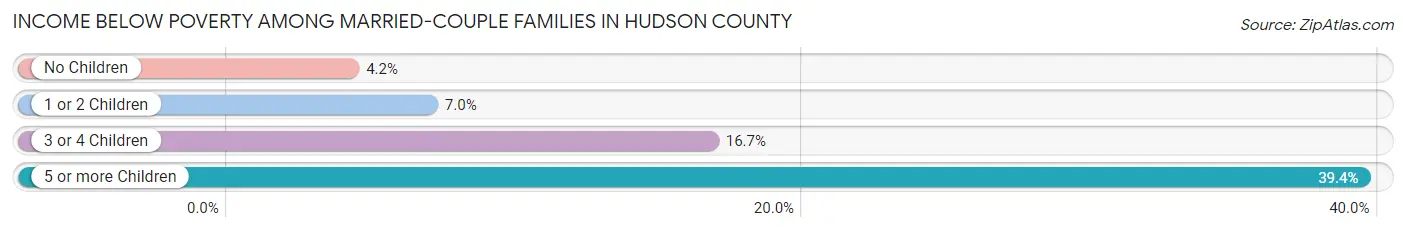
Income Below Poverty Among Married-Couple Families in Hudson County
The poverty statistics for married-couple families in Hudson County show that 6.2% or 7,113 of the total 115,196 families live below the poverty line. Families with 5 or more children have the highest poverty rate of 39.4%, comprising of 177 families. On the other hand, families with no children have the lowest poverty rate of 4.2%, which includes 2,622 families.
| Children | Above Poverty | Below Poverty |
| No Children | 59,516 (95.8%) | 2,622 (4.2%) |
| 1 or 2 Children | 42,760 (93.0%) | 3,201 (7.0%) |
| 3 or 4 Children | 5,535 (83.3%) | 1,113 (16.7%) |
| 5 or more Children | 272 (60.6%) | 177 (39.4%) |
| Total | 108,083 (93.8%) | 7,113 (6.2%) |
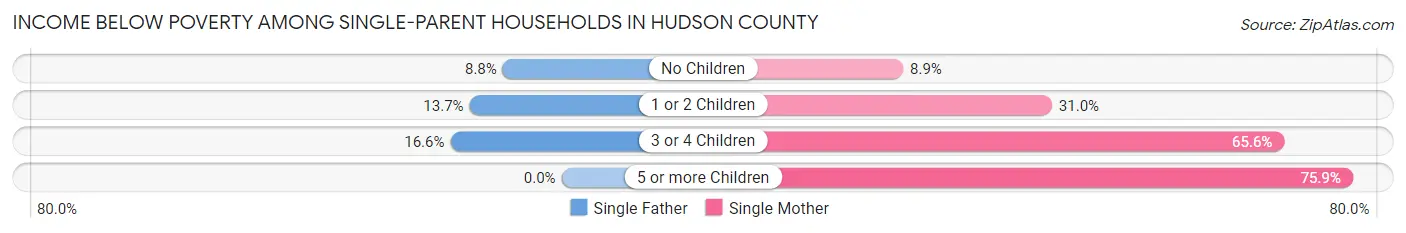
Income Below Poverty Among Single-Parent Households in Hudson County
According to the poverty data in Hudson County, 10.9% or 1,791 single-father households and 22.6% or 9,191 single-mother households are living below the poverty line. Among single-father households, those with 3 or 4 children have the highest poverty rate, with 150 households (16.6%) experiencing poverty. Likewise, among single-mother households, those with 5 or more children have the highest poverty rate, with 157 households (75.8%) falling below the poverty line.
| Children | Single Father | Single Mother |
| No Children | 874 (8.8%) | 1,690 (8.9%) |
| 1 or 2 Children | 767 (13.7%) | 6,036 (31.0%) |
| 3 or 4 Children | 150 (16.6%) | 1,308 (65.6%) |
| 5 or more Children | 0 (0.0%) | 157 (75.8%) |
| Total | 1,791 (10.9%) | 9,191 (22.6%) |
Income Below Poverty Among Married-Couple vs Single-Parent Households in Hudson County
The poverty data for Hudson County shows that 7,113 of the married-couple family households (6.2%) and 10,982 of the single-parent households (19.2%) are living below the poverty level. Within the married-couple family households, those with 5 or more children have the highest poverty rate, with 177 households (39.4%) falling below the poverty line. Among the single-parent households, those with 5 or more children have the highest poverty rate, with 157 household (75.8%) living below poverty.
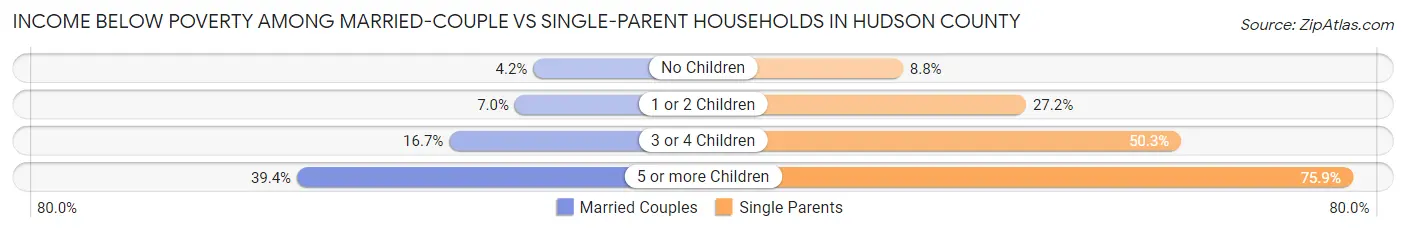
| Children | Married-Couple Families | Single-Parent Households |
| No Children | 2,622 (4.2%) | 2,564 (8.8%) |
| 1 or 2 Children | 3,201 (7.0%) | 6,803 (27.2%) |
| 3 or 4 Children | 1,113 (16.7%) | 1,458 (50.3%) |
| 5 or more Children | 177 (39.4%) | 157 (75.8%) |
| Total | 7,113 (6.2%) | 10,982 (19.2%) |
Employment Characteristics in Hudson County
Employment by Class of Employer in Hudson County
Among the 375,393 employed individuals in Hudson County, private company employees (283,256 | 75.5%), local government employees (24,198 | 6.5%), and not-for-profit organizations (23,990 | 6.4%) make up the most common classes of employment.
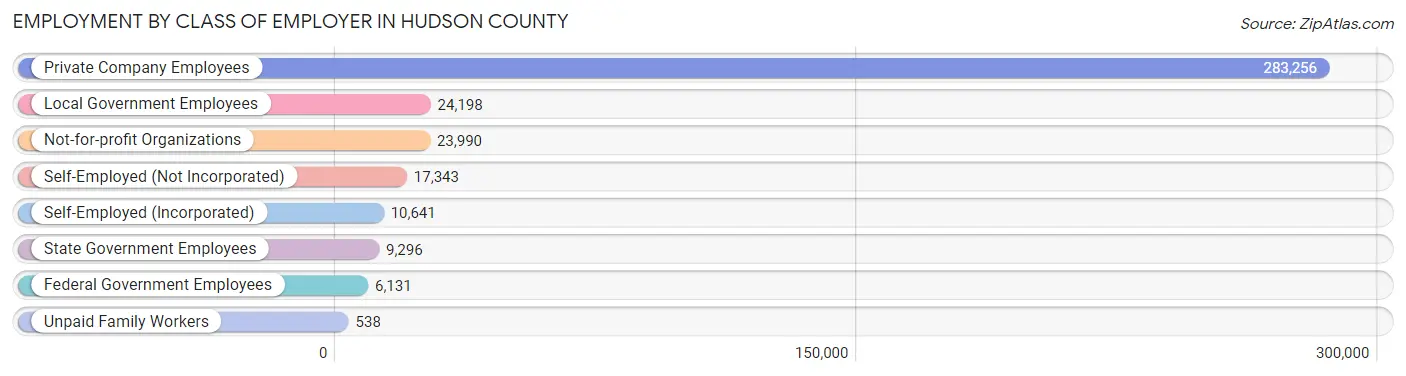
| Employer Class | # Employees | % Employees |
| Private Company Employees | 283,256 | 75.5% |
| Self-Employed (Incorporated) | 10,641 | 2.8% |
| Self-Employed (Not Incorporated) | 17,343 | 4.6% |
| Not-for-profit Organizations | 23,990 | 6.4% |
| Local Government Employees | 24,198 | 6.5% |
| State Government Employees | 9,296 | 2.5% |
| Federal Government Employees | 6,131 | 1.6% |
| Unpaid Family Workers | 538 | 0.1% |
| Total | 375,393 | 100.0% |
Employment Status by Age in Hudson County
According to the labor force statistics for Hudson County, out of the total population over 16 years of age (581,829), 69.9% or 406,698 individuals are in the labor force, with 5.8% or 23,588 of them unemployed. The age group with the highest labor force participation rate is 30 to 34 years, with 87.4% or 67,824 individuals in the labor force. Within the labor force, the 16 to 19 years age range has the highest percentage of unemployed individuals, with 16.8% or 1,113 of them being unemployed.
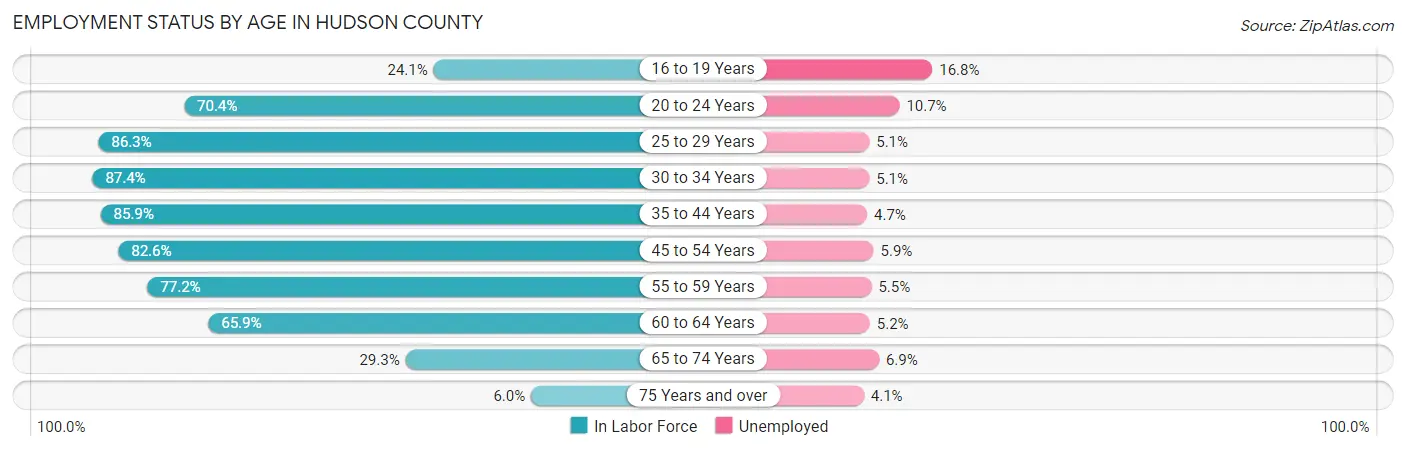
| Age Bracket | In Labor Force | Unemployed |
| 16 to 19 Years | 6,627 (24.1%) | 1,113 (16.8%) |
| 20 to 24 Years | 29,665 (70.4%) | 3,174 (10.7%) |
| 25 to 29 Years | 60,256 (86.3%) | 3,073 (5.1%) |
| 30 to 34 Years | 67,824 (87.4%) | 3,459 (5.1%) |
| 35 to 44 Years | 99,246 (85.9%) | 4,665 (4.7%) |
| 45 to 54 Years | 70,741 (82.6%) | 4,174 (5.9%) |
| 55 to 59 Years | 32,698 (77.2%) | 1,798 (5.5%) |
| 60 to 64 Years | 22,784 (65.9%) | 1,185 (5.2%) |
| 65 to 74 Years | 14,796 (29.3%) | 1,021 (6.9%) |
| 75 Years and over | 2,170 (6.0%) | 89 (4.1%) |
| Total | 406,698 (69.9%) | 23,588 (5.8%) |
Employment Status by Educational Attainment in Hudson County
According to labor force statistics for Hudson County, 83.1% of individuals (353,616) out of the total population between 25 and 64 years of age (425,531) are in the labor force, with 5.2% or 18,388 of them being unemployed. The group with the highest labor force participation rate are those with the educational attainment of bachelor's degree or higher, with 89.3% or 194,934 individuals in the labor force. Within the labor force, individuals with high school diploma education have the highest percentage of unemployment, with 7.7% or 5,321 of them being unemployed.
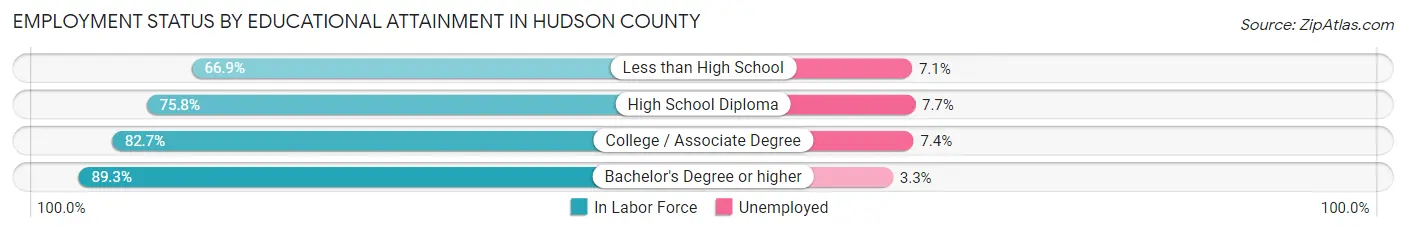
| Educational Attainment | In Labor Force | Unemployed |
| Less than High School | 27,470 (66.9%) | 2,915 (7.1%) |
| High School Diploma | 69,103 (75.8%) | 7,020 (7.7%) |
| College / Associate Degree | 62,037 (82.7%) | 5,551 (7.4%) |
| Bachelor's Degree or higher | 194,934 (89.3%) | 7,204 (3.3%) |
| Total | 353,616 (83.1%) | 22,128 (5.2%) |
Employment Occupations by Sex in Hudson County
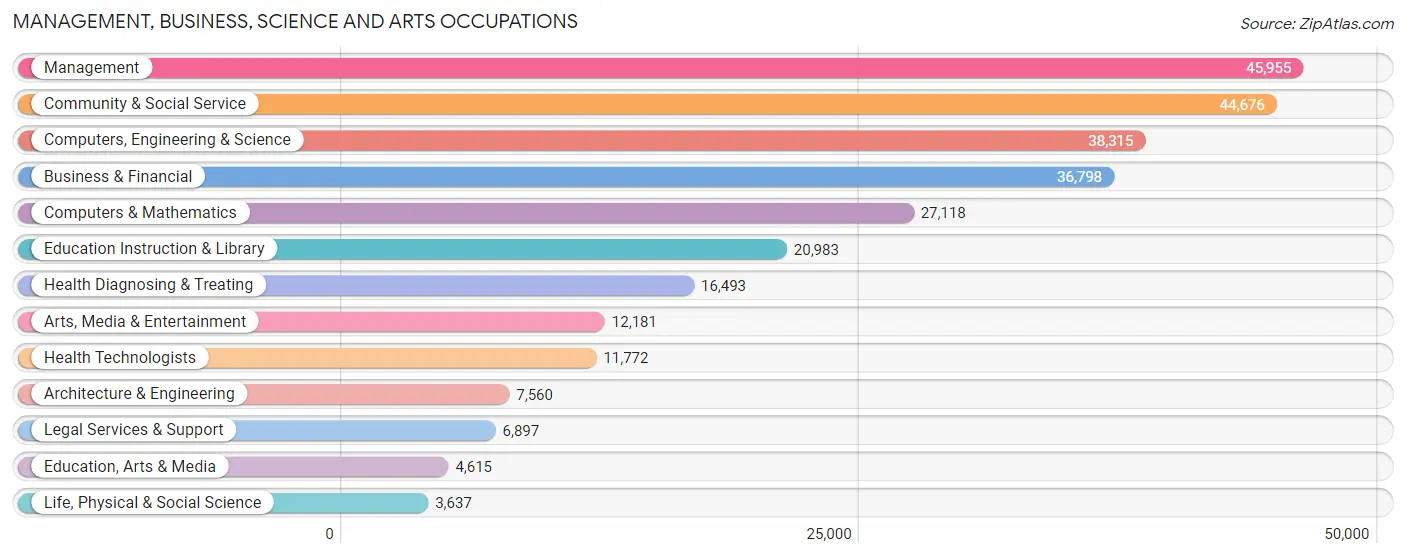
Management, Business, Science and Arts Occupations
The most common Management, Business, Science and Arts occupations in Hudson County are Management (45,955 | 12.0%), Community & Social Service (44,676 | 11.7%), Computers, Engineering & Science (38,315 | 10.0%), Business & Financial (36,798 | 9.6%), and Computers & Mathematics (27,118 | 7.1%).
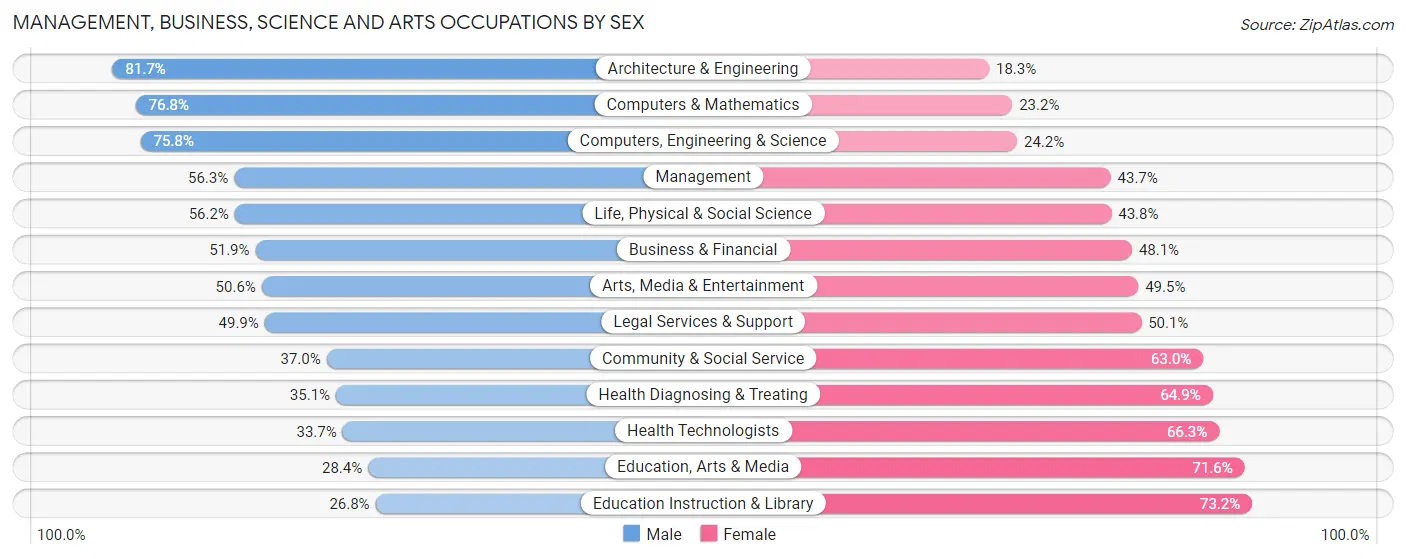
Management, Business, Science and Arts Occupations by Sex
Within the Management, Business, Science and Arts occupations in Hudson County, the most male-oriented occupations are Architecture & Engineering (81.7%), Computers & Mathematics (76.8%), and Computers, Engineering & Science (75.8%), while the most female-oriented occupations are Education Instruction & Library (73.2%), Education, Arts & Media (71.6%), and Health Technologists (66.3%).
| Occupation | Male | Female |
| Management | 25,879 (56.3%) | 20,076 (43.7%) |
| Business & Financial | 19,085 (51.9%) | 17,713 (48.1%) |
| Computers, Engineering & Science | 29,051 (75.8%) | 9,264 (24.2%) |
| Computers & Mathematics | 20,834 (76.8%) | 6,284 (23.2%) |
| Architecture & Engineering | 6,174 (81.7%) | 1,386 (18.3%) |
| Life, Physical & Social Science | 2,043 (56.2%) | 1,594 (43.8%) |
| Community & Social Service | 16,536 (37.0%) | 28,140 (63.0%) |
| Education, Arts & Media | 1,309 (28.4%) | 3,306 (71.6%) |
| Legal Services & Support | 3,444 (49.9%) | 3,453 (50.1%) |
| Education Instruction & Library | 5,626 (26.8%) | 15,357 (73.2%) |
| Arts, Media & Entertainment | 6,157 (50.5%) | 6,024 (49.4%) |
| Health Diagnosing & Treating | 5,782 (35.1%) | 10,711 (64.9%) |
| Health Technologists | 3,965 (33.7%) | 7,807 (66.3%) |
| Total (Category) | 96,333 (52.9%) | 85,904 (47.1%) |
| Total (Overall) | 209,301 (54.7%) | 173,242 (45.3%) |
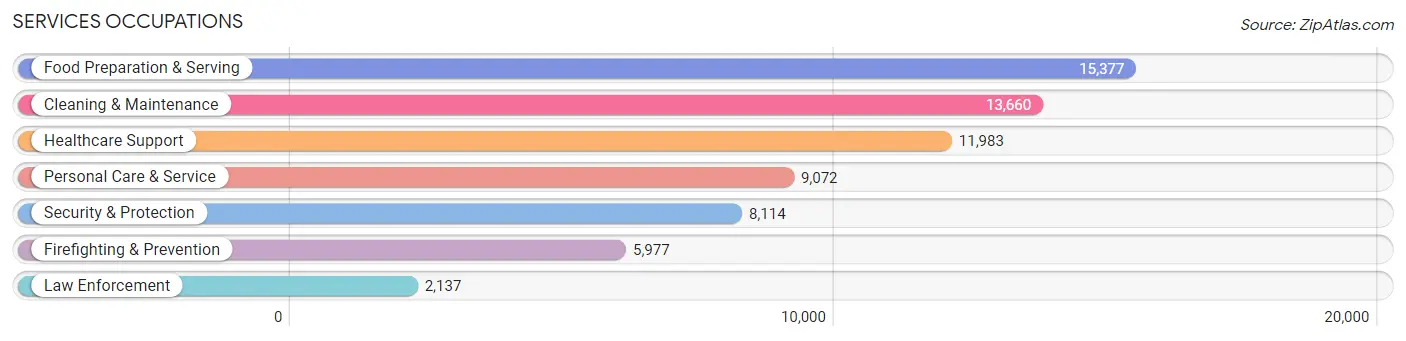
Services Occupations
The most common Services occupations in Hudson County are Food Preparation & Serving (15,377 | 4.0%), Cleaning & Maintenance (13,660 | 3.6%), Healthcare Support (11,983 | 3.1%), Personal Care & Service (9,072 | 2.4%), and Security & Protection (8,114 | 2.1%).
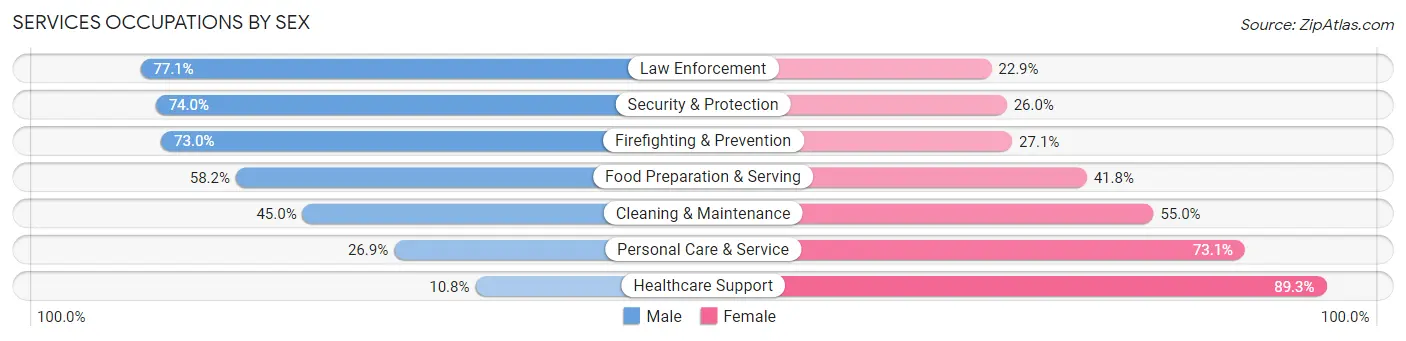
Services Occupations by Sex
Within the Services occupations in Hudson County, the most male-oriented occupations are Law Enforcement (77.1%), Security & Protection (74.0%), and Firefighting & Prevention (73.0%), while the most female-oriented occupations are Healthcare Support (89.2%), Personal Care & Service (73.1%), and Cleaning & Maintenance (55.0%).
| Occupation | Male | Female |
| Healthcare Support | 1,288 (10.7%) | 10,695 (89.2%) |
| Security & Protection | 6,007 (74.0%) | 2,107 (26.0%) |
| Firefighting & Prevention | 4,360 (73.0%) | 1,617 (27.1%) |
| Law Enforcement | 1,647 (77.1%) | 490 (22.9%) |
| Food Preparation & Serving | 8,946 (58.2%) | 6,431 (41.8%) |
| Cleaning & Maintenance | 6,143 (45.0%) | 7,517 (55.0%) |
| Personal Care & Service | 2,437 (26.9%) | 6,635 (73.1%) |
| Total (Category) | 24,821 (42.6%) | 33,385 (57.4%) |
| Total (Overall) | 209,301 (54.7%) | 173,242 (45.3%) |
Sales and Office Occupations
The most common Sales and Office occupations in Hudson County are Office & Administration (38,486 | 10.1%), and Sales & Related (31,792 | 8.3%).

Sales and Office Occupations by Sex
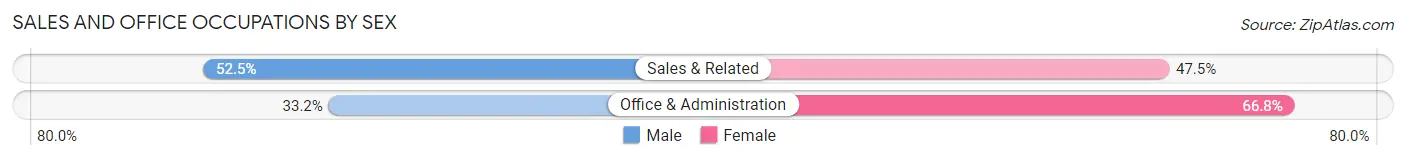
| Occupation | Male | Female |
| Sales & Related | 16,704 (52.5%) | 15,088 (47.5%) |
| Office & Administration | 12,788 (33.2%) | 25,698 (66.8%) |
| Total (Category) | 29,492 (42.0%) | 40,786 (58.0%) |
| Total (Overall) | 209,301 (54.7%) | 173,242 (45.3%) |
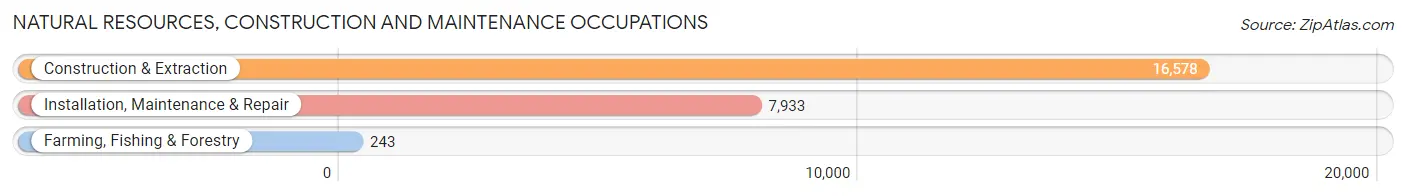
Natural Resources, Construction and Maintenance Occupations
The most common Natural Resources, Construction and Maintenance occupations in Hudson County are Construction & Extraction (16,578 | 4.3%), Installation, Maintenance & Repair (7,933 | 2.1%), and Farming, Fishing & Forestry (243 | 0.1%).
Natural Resources, Construction and Maintenance Occupations by Sex
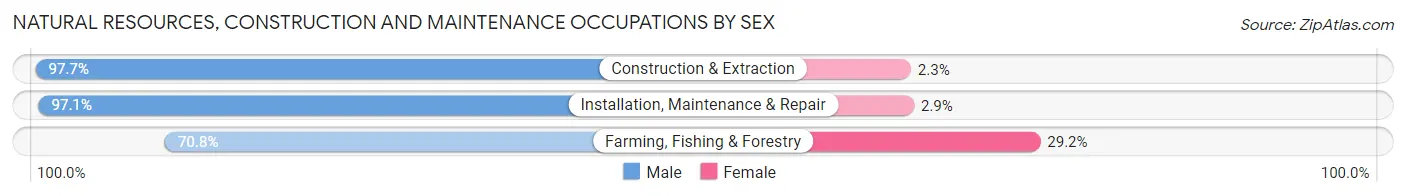
| Occupation | Male | Female |
| Farming, Fishing & Forestry | 172 (70.8%) | 71 (29.2%) |
| Construction & Extraction | 16,199 (97.7%) | 379 (2.3%) |
| Installation, Maintenance & Repair | 7,701 (97.1%) | 232 (2.9%) |
| Total (Category) | 24,072 (97.2%) | 682 (2.8%) |
| Total (Overall) | 209,301 (54.7%) | 173,242 (45.3%) |
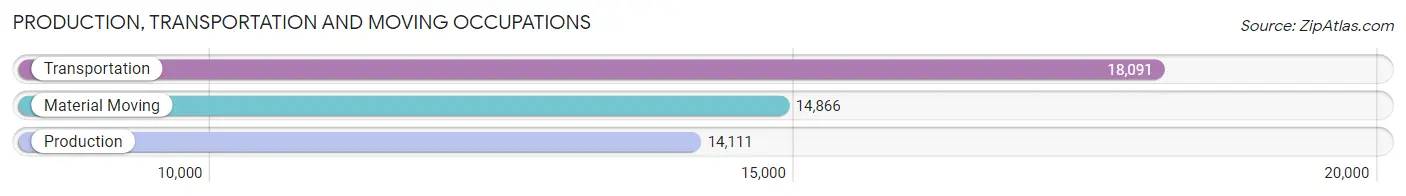
Production, Transportation and Moving Occupations
The most common Production, Transportation and Moving occupations in Hudson County are Transportation (18,091 | 4.7%), Material Moving (14,866 | 3.9%), and Production (14,111 | 3.7%).
Production, Transportation and Moving Occupations by Sex
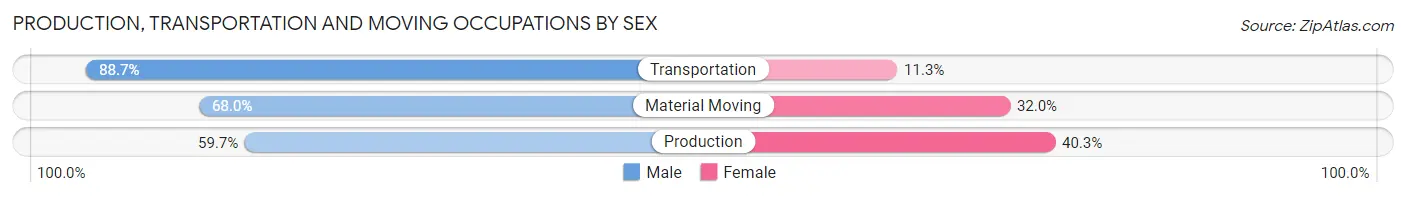
| Occupation | Male | Female |
| Production | 8,427 (59.7%) | 5,684 (40.3%) |
| Transportation | 16,047 (88.7%) | 2,044 (11.3%) |
| Material Moving | 10,109 (68.0%) | 4,757 (32.0%) |
| Total (Category) | 34,583 (73.5%) | 12,485 (26.5%) |
| Total (Overall) | 209,301 (54.7%) | 173,242 (45.3%) |
Employment Industries by Sex in Hudson County
Employment Industries in Hudson County
The major employment industries in Hudson County include Professional & Scientific (49,470 | 12.9%), Health Care & Social Assistance (42,060 | 11.0%), Finance & Insurance (40,490 | 10.6%), Retail Trade (35,463 | 9.3%), and Educational Services (29,995 | 7.8%).
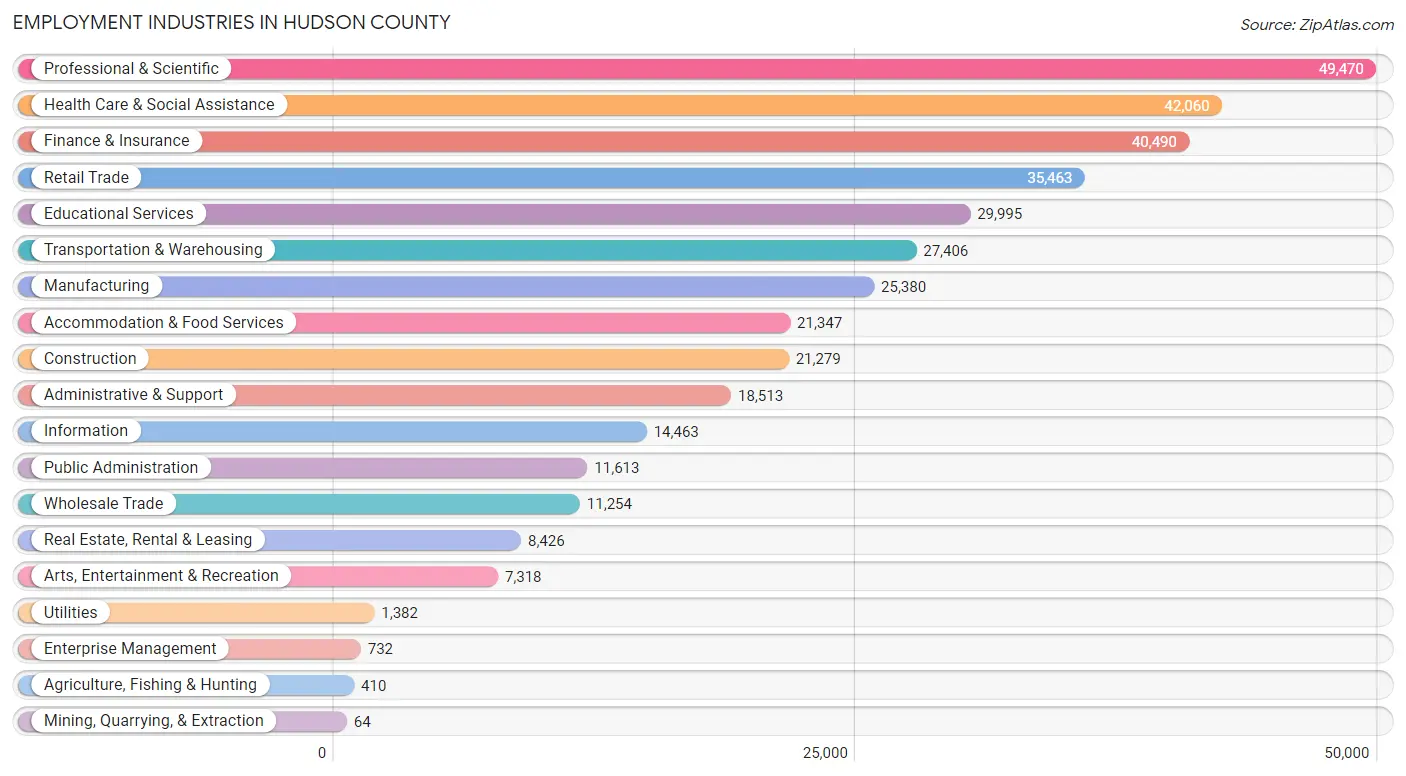
Employment Industries by Sex in Hudson County
The Hudson County industries that see more men than women are Mining, Quarrying, & Extraction (100.0%), Construction (93.0%), and Agriculture, Fishing & Hunting (79.3%), whereas the industries that tend to have a higher number of women are Health Care & Social Assistance (75.9%), Educational Services (67.3%), and Enterprise Management (66.9%).

| Industry | Male | Female |
| Agriculture, Fishing & Hunting | 325 (79.3%) | 85 (20.7%) |
| Mining, Quarrying, & Extraction | 64 (100.0%) | 0 (0.0%) |
| Construction | 19,789 (93.0%) | 1,490 (7.0%) |
| Manufacturing | 15,112 (59.5%) | 10,268 (40.5%) |
| Wholesale Trade | 6,582 (58.5%) | 4,672 (41.5%) |
| Retail Trade | 18,139 (51.1%) | 17,324 (48.8%) |
| Transportation & Warehousing | 21,413 (78.1%) | 5,993 (21.9%) |
| Utilities | 1,006 (72.8%) | 376 (27.2%) |
| Information | 8,088 (55.9%) | 6,375 (44.1%) |
| Finance & Insurance | 24,556 (60.7%) | 15,934 (39.4%) |
| Real Estate, Rental & Leasing | 4,956 (58.8%) | 3,470 (41.2%) |
| Professional & Scientific | 29,218 (59.1%) | 20,252 (40.9%) |
| Enterprise Management | 242 (33.1%) | 490 (66.9%) |
| Administrative & Support | 10,448 (56.4%) | 8,065 (43.6%) |
| Educational Services | 9,807 (32.7%) | 20,188 (67.3%) |
| Health Care & Social Assistance | 10,128 (24.1%) | 31,932 (75.9%) |
| Arts, Entertainment & Recreation | 4,478 (61.2%) | 2,840 (38.8%) |
| Accommodation & Food Services | 11,979 (56.1%) | 9,368 (43.9%) |
| Public Administration | 6,573 (56.6%) | 5,040 (43.4%) |
| Total | 209,301 (54.7%) | 173,242 (45.3%) |
Education in Hudson County
School Enrollment in Hudson County
The most common levels of schooling among the 157,310 students in Hudson County are college / undergraduate (31,973 | 20.3%), middle school (30,884 | 19.6%), and elementary school (30,245 | 19.2%).
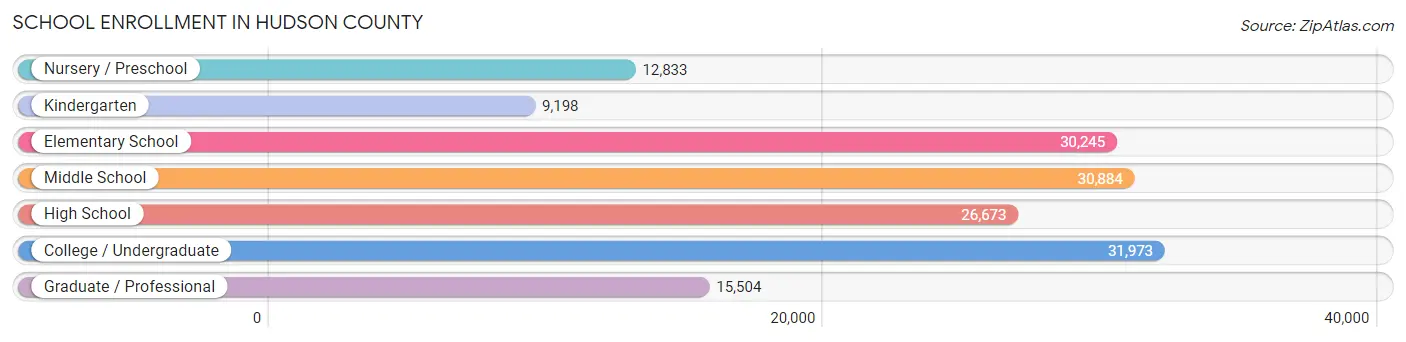
| School Level | # Students | % Students |
| Nursery / Preschool | 12,833 | 8.2% |
| Kindergarten | 9,198 | 5.9% |
| Elementary School | 30,245 | 19.2% |
| Middle School | 30,884 | 19.6% |
| High School | 26,673 | 17.0% |
| College / Undergraduate | 31,973 | 20.3% |
| Graduate / Professional | 15,504 | 9.9% |
| Total | 157,310 | 100.0% |
School Enrollment by Age by Funding Source in Hudson County
Out of a total of 157,310 students who are enrolled in schools in Hudson County, 30,204 (19.2%) attend a private institution, while the remaining 127,106 (80.8%) are enrolled in public schools. The age group of 35 years and over has the highest likelihood of being enrolled in private schools, with 3,835 (47.2% in the age bracket) enrolled. Conversely, the age group of 10 to 14 year olds has the lowest likelihood of being enrolled in a private school, with 33,058 (92.1% in the age bracket) attending a public institution.
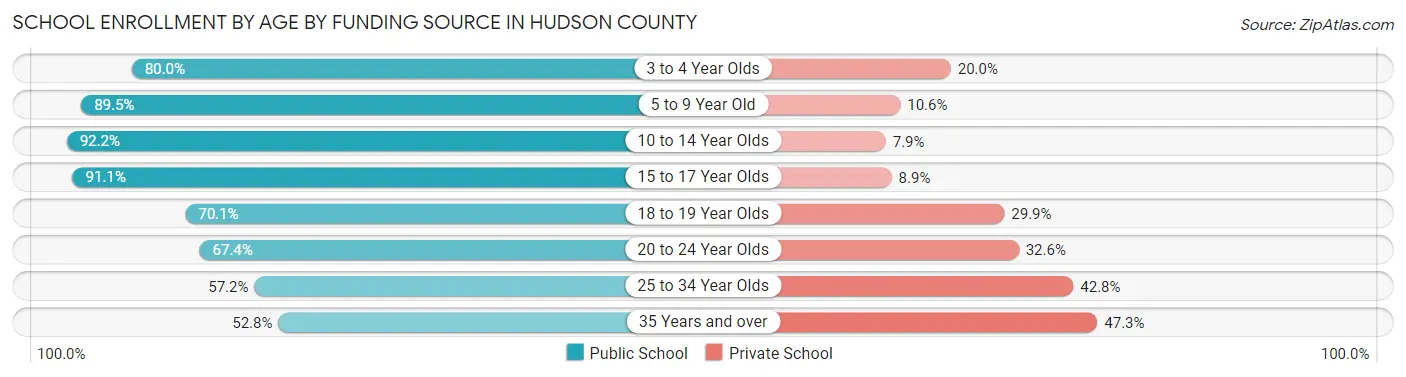
| Age Bracket | Public School | Private School |
| 3 to 4 Year Olds | 9,806 (80.0%) | 2,445 (20.0%) |
| 5 to 9 Year Old | 33,499 (89.4%) | 3,951 (10.5%) |
| 10 to 14 Year Olds | 33,058 (92.1%) | 2,817 (7.9%) |
| 15 to 17 Year Olds | 18,456 (91.1%) | 1,811 (8.9%) |
| 18 to 19 Year Olds | 7,717 (70.1%) | 3,296 (29.9%) |
| 20 to 24 Year Olds | 12,163 (67.4%) | 5,886 (32.6%) |
| 25 to 34 Year Olds | 8,176 (57.2%) | 6,112 (42.8%) |
| 35 Years and over | 4,282 (52.7%) | 3,835 (47.2%) |
| Total | 127,106 (80.8%) | 30,204 (19.2%) |
Educational Attainment by Field of Study in Hudson County
Business (60,015 | 23.2%), engineering (27,543 | 10.6%), social sciences (23,948 | 9.2%), computers & mathematics (23,618 | 9.1%), and science & technology (19,199 | 7.4%) are the most common fields of study among 258,818 individuals in Hudson County who have obtained a bachelor's degree or higher.
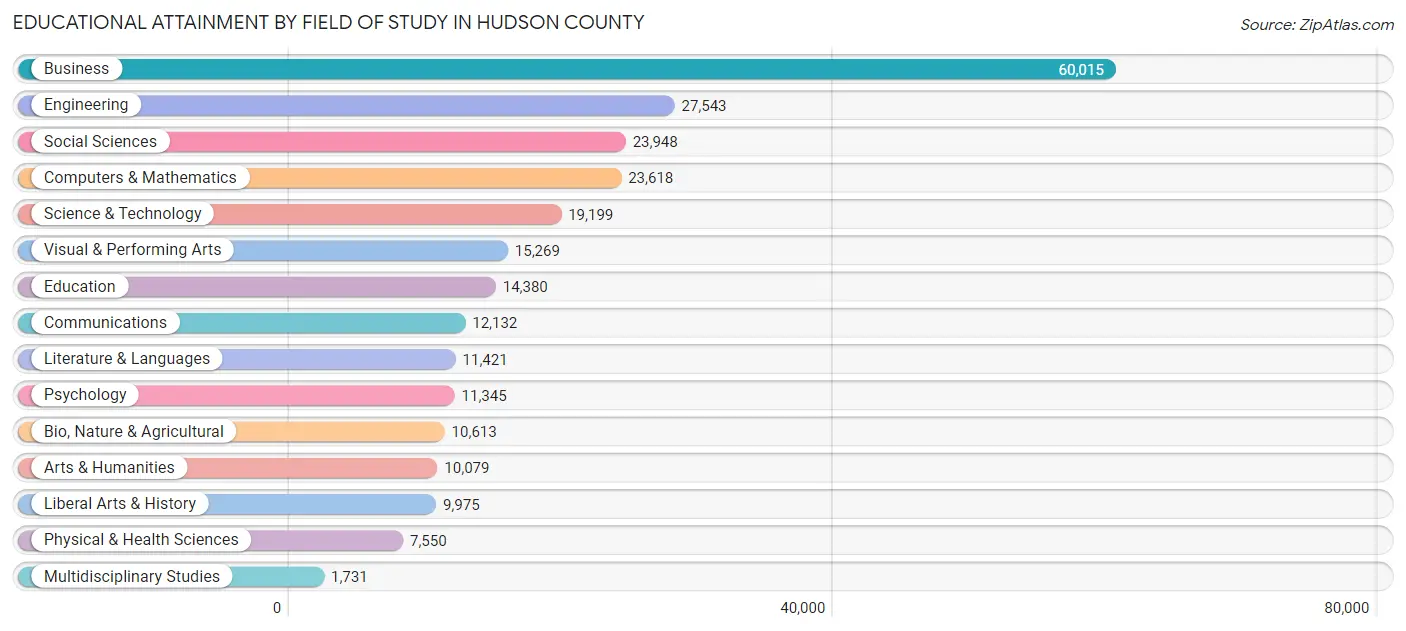
| Field of Study | # Graduates | % Graduates |
| Computers & Mathematics | 23,618 | 9.1% |
| Bio, Nature & Agricultural | 10,613 | 4.1% |
| Physical & Health Sciences | 7,550 | 2.9% |
| Psychology | 11,345 | 4.4% |
| Social Sciences | 23,948 | 9.2% |
| Engineering | 27,543 | 10.6% |
| Multidisciplinary Studies | 1,731 | 0.7% |
| Science & Technology | 19,199 | 7.4% |
| Business | 60,015 | 23.2% |
| Education | 14,380 | 5.6% |
| Literature & Languages | 11,421 | 4.4% |
| Liberal Arts & History | 9,975 | 3.8% |
| Visual & Performing Arts | 15,269 | 5.9% |
| Communications | 12,132 | 4.7% |
| Arts & Humanities | 10,079 | 3.9% |
| Total | 258,818 | 100.0% |
Transportation & Commute in Hudson County
Vehicle Availability by Sex in Hudson County
The most prevalent vehicle ownership categories in Hudson County are males with 1 vehicle (89,229, accounting for 43.3%) and females with 1 vehicle (75,149, making up 52.9%).
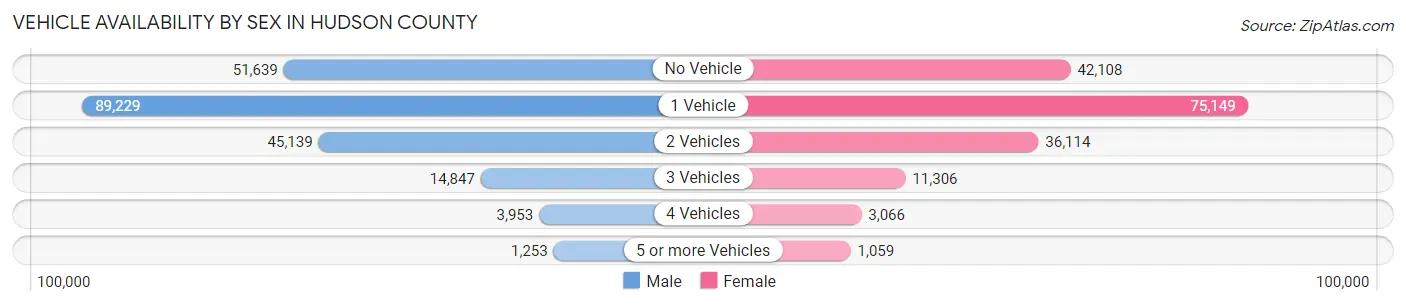
| Vehicles Available | Male | Female |
| No Vehicle | 51,639 (25.1%) | 42,108 (24.9%) |
| 1 Vehicle | 89,229 (43.3%) | 75,149 (44.5%) |
| 2 Vehicles | 45,139 (21.9%) | 36,114 (21.4%) |
| 3 Vehicles | 14,847 (7.2%) | 11,306 (6.7%) |
| 4 Vehicles | 3,953 (1.9%) | 3,066 (1.8%) |
| 5 or more Vehicles | 1,253 (0.6%) | 1,059 (0.6%) |
| Total | 206,060 (100.0%) | 168,802 (100.0%) |
Commute Time in Hudson County
The most frequently occuring commute durations in Hudson County are 45 to 59 minutes (53,794 commuters, 17.0%), 30 to 34 minutes (52,639 commuters, 16.6%), and 60 to 89 minutes (43,586 commuters, 13.7%).
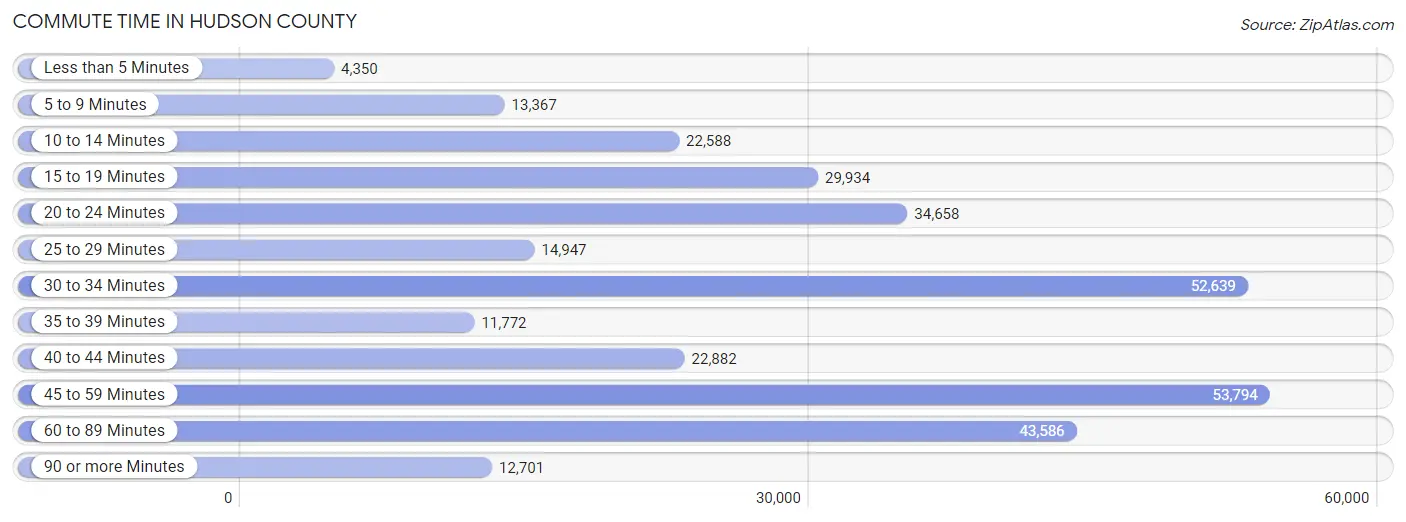
| Commute Time | # Commuters | % Commuters |
| Less than 5 Minutes | 4,350 | 1.4% |
| 5 to 9 Minutes | 13,367 | 4.2% |
| 10 to 14 Minutes | 22,588 | 7.1% |
| 15 to 19 Minutes | 29,934 | 9.4% |
| 20 to 24 Minutes | 34,658 | 10.9% |
| 25 to 29 Minutes | 14,947 | 4.7% |
| 30 to 34 Minutes | 52,639 | 16.6% |
| 35 to 39 Minutes | 11,772 | 3.7% |
| 40 to 44 Minutes | 22,882 | 7.2% |
| 45 to 59 Minutes | 53,794 | 17.0% |
| 60 to 89 Minutes | 43,586 | 13.7% |
| 90 or more Minutes | 12,701 | 4.0% |
Commute Time by Sex in Hudson County
The most common commute times in Hudson County are 45 to 59 minutes (31,724 commuters, 18.0%) for males and 30 to 34 minutes (22,330 commuters, 15.8%) for females.
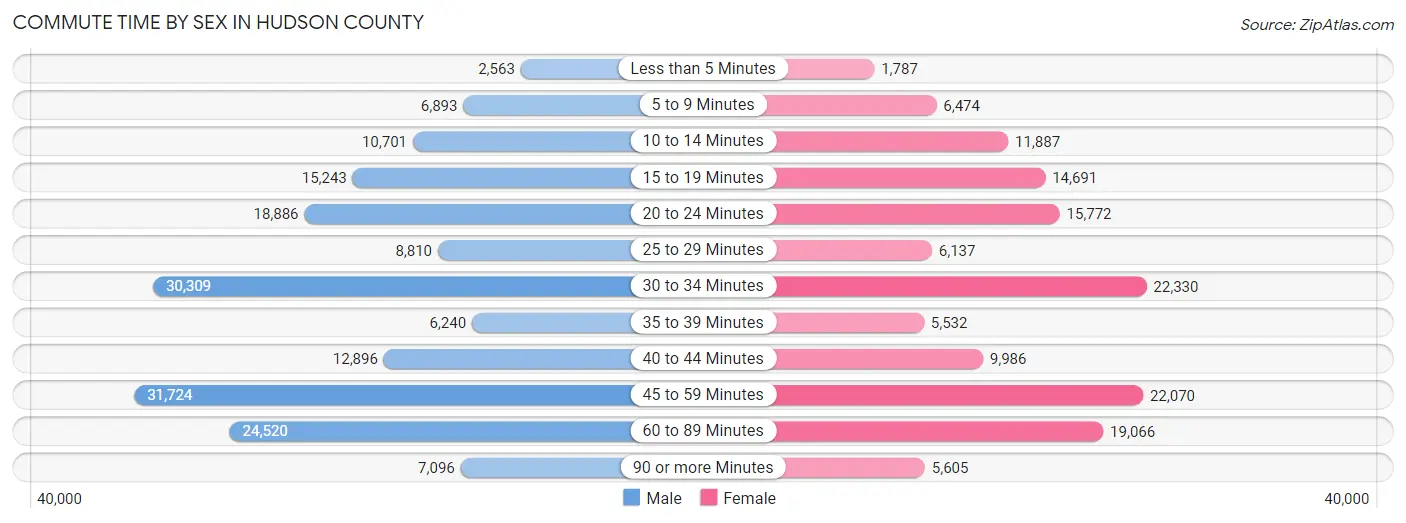
| Commute Time | Male | Female |
| Less than 5 Minutes | 2,563 (1.5%) | 1,787 (1.3%) |
| 5 to 9 Minutes | 6,893 (3.9%) | 6,474 (4.6%) |
| 10 to 14 Minutes | 10,701 (6.1%) | 11,887 (8.4%) |
| 15 to 19 Minutes | 15,243 (8.7%) | 14,691 (10.4%) |
| 20 to 24 Minutes | 18,886 (10.7%) | 15,772 (11.2%) |
| 25 to 29 Minutes | 8,810 (5.0%) | 6,137 (4.3%) |
| 30 to 34 Minutes | 30,309 (17.2%) | 22,330 (15.8%) |
| 35 to 39 Minutes | 6,240 (3.5%) | 5,532 (3.9%) |
| 40 to 44 Minutes | 12,896 (7.3%) | 9,986 (7.1%) |
| 45 to 59 Minutes | 31,724 (18.0%) | 22,070 (15.6%) |
| 60 to 89 Minutes | 24,520 (13.9%) | 19,066 (13.5%) |
| 90 or more Minutes | 7,096 (4.0%) | 5,605 (4.0%) |
Time of Departure to Work by Sex in Hudson County
The most frequent times of departure to work in Hudson County are 8:00 AM to 8:29 AM (33,473, 19.0%) for males and 8:00 AM to 8:29 AM (31,599, 22.4%) for females.
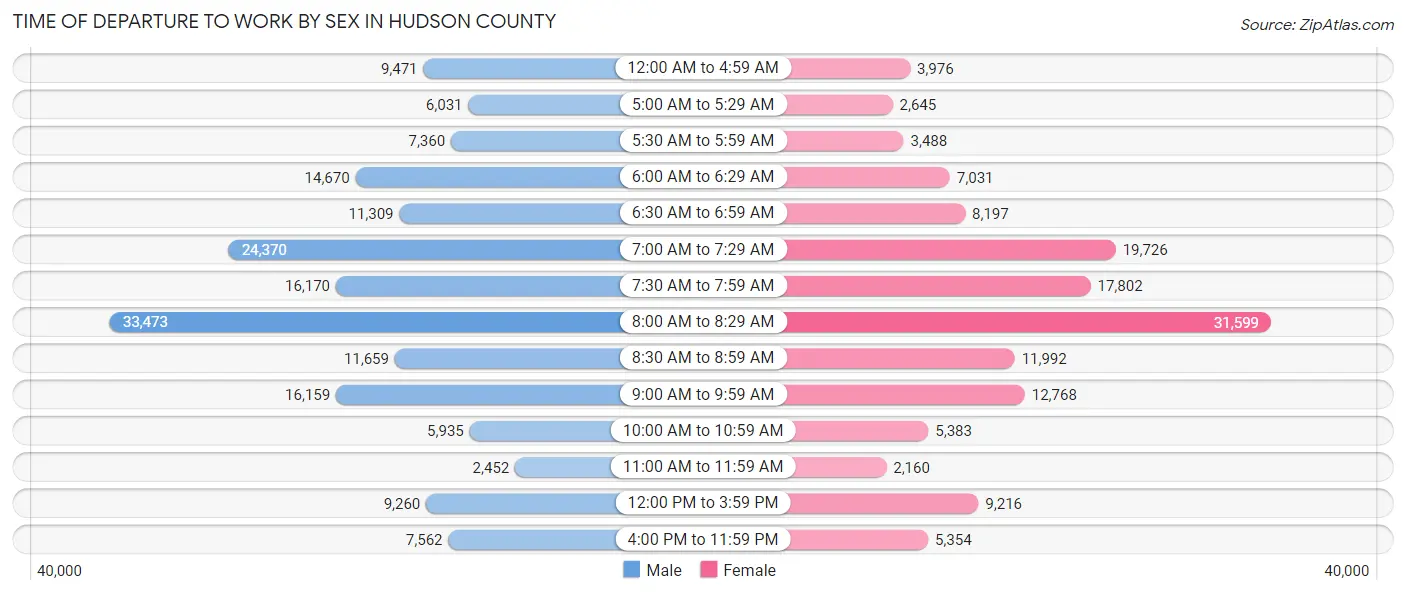
| Time of Departure | Male | Female |
| 12:00 AM to 4:59 AM | 9,471 (5.4%) | 3,976 (2.8%) |
| 5:00 AM to 5:29 AM | 6,031 (3.4%) | 2,645 (1.9%) |
| 5:30 AM to 5:59 AM | 7,360 (4.2%) | 3,488 (2.5%) |
| 6:00 AM to 6:29 AM | 14,670 (8.3%) | 7,031 (5.0%) |
| 6:30 AM to 6:59 AM | 11,309 (6.4%) | 8,197 (5.8%) |
| 7:00 AM to 7:29 AM | 24,370 (13.9%) | 19,726 (14.0%) |
| 7:30 AM to 7:59 AM | 16,170 (9.2%) | 17,802 (12.6%) |
| 8:00 AM to 8:29 AM | 33,473 (19.0%) | 31,599 (22.4%) |
| 8:30 AM to 8:59 AM | 11,659 (6.6%) | 11,992 (8.5%) |
| 9:00 AM to 9:59 AM | 16,159 (9.2%) | 12,768 (9.0%) |
| 10:00 AM to 10:59 AM | 5,935 (3.4%) | 5,383 (3.8%) |
| 11:00 AM to 11:59 AM | 2,452 (1.4%) | 2,160 (1.5%) |
| 12:00 PM to 3:59 PM | 9,260 (5.3%) | 9,216 (6.5%) |
| 4:00 PM to 11:59 PM | 7,562 (4.3%) | 5,354 (3.8%) |
| Total | 175,881 (100.0%) | 141,337 (100.0%) |
Housing Occupancy in Hudson County
Occupancy by Ownership in Hudson County
Of the total 290,054 dwellings in Hudson County, owner-occupied units account for 93,531 (32.3%), while renter-occupied units make up 196,523 (67.7%).
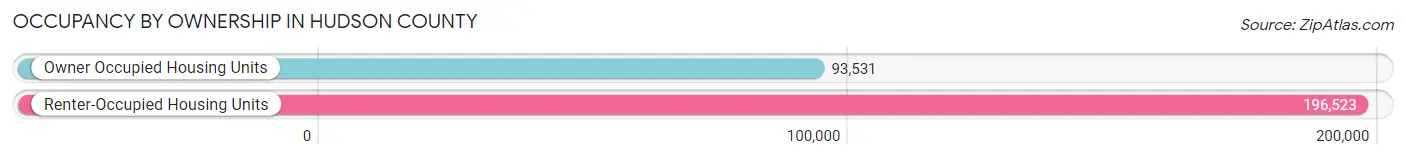
| Occupancy | # Housing Units | % Housing Units |
| Owner Occupied Housing Units | 93,531 | 32.3% |
| Renter-Occupied Housing Units | 196,523 | 67.7% |
| Total Occupied Housing Units | 290,054 | 100.0% |
Occupancy by Household Size in Hudson County
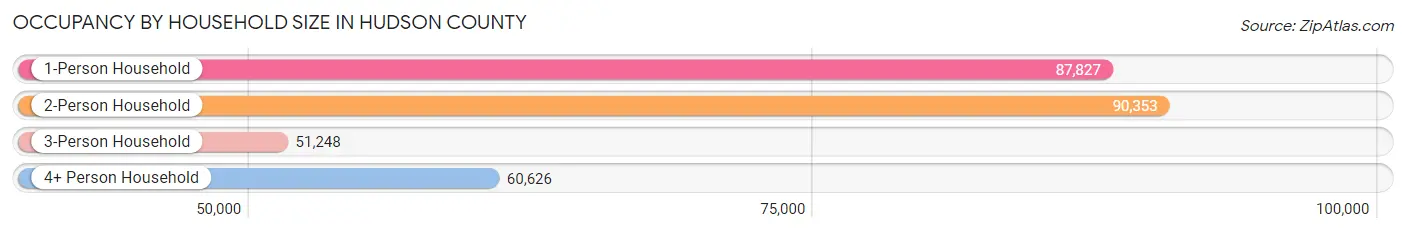
| Household Size | # Housing Units | % Housing Units |
| 1-Person Household | 87,827 | 30.3% |
| 2-Person Household | 90,353 | 31.1% |
| 3-Person Household | 51,248 | 17.7% |
| 4+ Person Household | 60,626 | 20.9% |
| Total Housing Units | 290,054 | 100.0% |
Occupancy by Ownership by Household Size in Hudson County
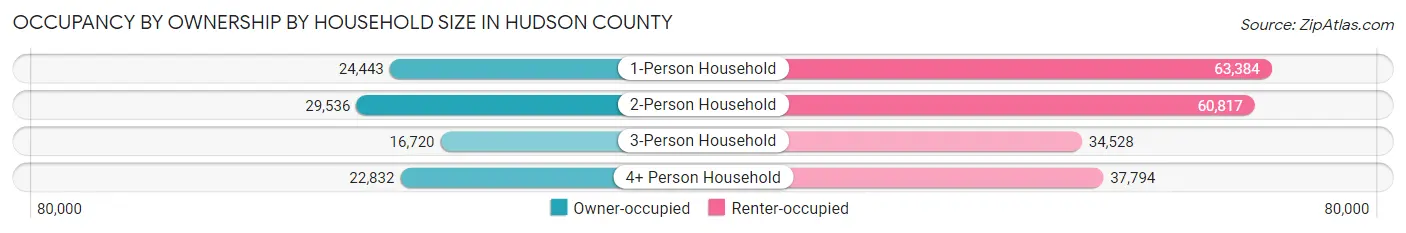
| Household Size | Owner-occupied | Renter-occupied |
| 1-Person Household | 24,443 (27.8%) | 63,384 (72.2%) |
| 2-Person Household | 29,536 (32.7%) | 60,817 (67.3%) |
| 3-Person Household | 16,720 (32.6%) | 34,528 (67.4%) |
| 4+ Person Household | 22,832 (37.7%) | 37,794 (62.3%) |
| Total Housing Units | 93,531 (32.3%) | 196,523 (67.7%) |
Occupancy by Educational Attainment in Hudson County
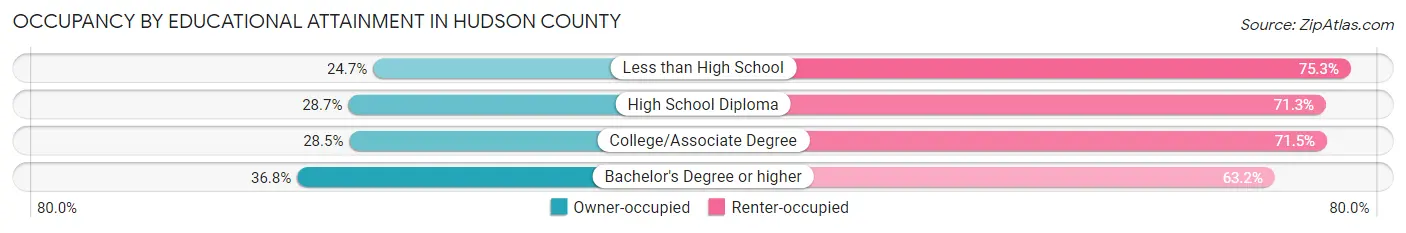
| Household Size | Owner-occupied | Renter-occupied |
| Less than High School | 8,240 (24.7%) | 25,081 (75.3%) |
| High School Diploma | 17,187 (28.7%) | 42,754 (71.3%) |
| College/Associate Degree | 14,795 (28.5%) | 37,092 (71.5%) |
| Bachelor's Degree or higher | 53,309 (36.8%) | 91,596 (63.2%) |
Occupancy by Age of Householder in Hudson County
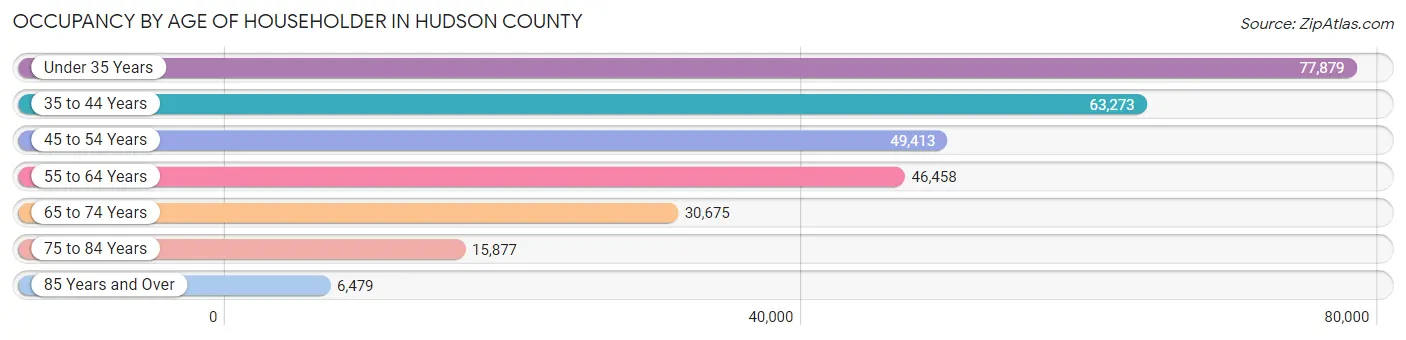
| Age Bracket | # Households | % Households |
| Under 35 Years | 77,879 | 26.9% |
| 35 to 44 Years | 63,273 | 21.8% |
| 45 to 54 Years | 49,413 | 17.0% |
| 55 to 64 Years | 46,458 | 16.0% |
| 65 to 74 Years | 30,675 | 10.6% |
| 75 to 84 Years | 15,877 | 5.5% |
| 85 Years and Over | 6,479 | 2.2% |
| Total | 290,054 | 100.0% |
Housing Finances in Hudson County
Median Income by Occupancy in Hudson County
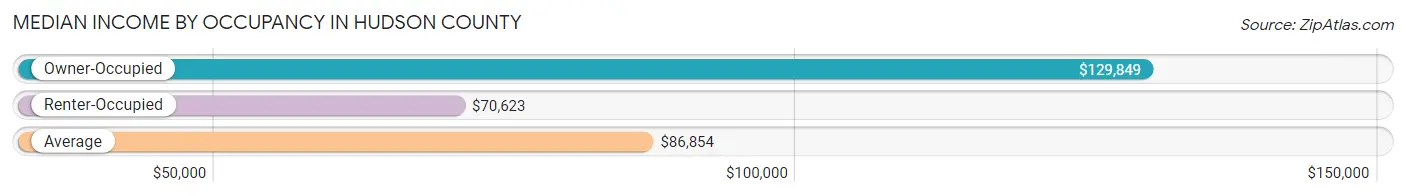
| Occupancy Type | # Households | Median Income |
| Owner-Occupied | 93,531 (32.3%) | $129,849 |
| Renter-Occupied | 196,523 (67.7%) | $70,623 |
| Average | 290,054 (100.0%) | $86,854 |
Occupancy by Householder Income Bracket in Hudson County
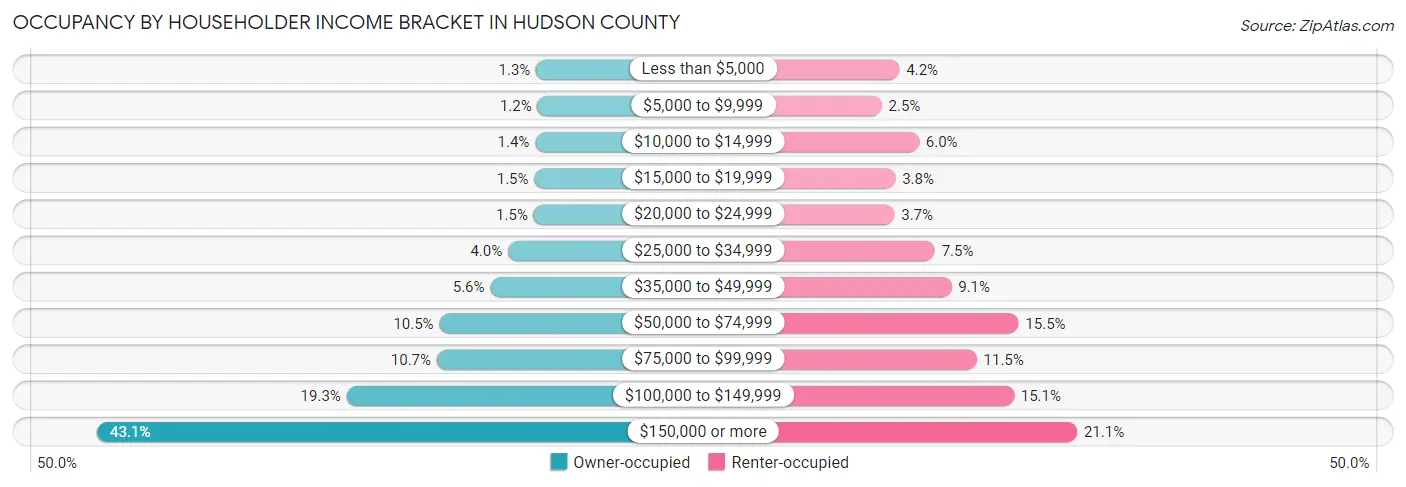
| Income Bracket | Owner-occupied | Renter-occupied |
| Less than $5,000 | 1,198 (1.3%) | 8,186 (4.2%) |
| $5,000 to $9,999 | 1,071 (1.1%) | 4,873 (2.5%) |
| $10,000 to $14,999 | 1,277 (1.4%) | 11,850 (6.0%) |
| $15,000 to $19,999 | 1,355 (1.5%) | 7,424 (3.8%) |
| $20,000 to $24,999 | 1,411 (1.5%) | 7,258 (3.7%) |
| $25,000 to $34,999 | 3,694 (4.0%) | 14,826 (7.5%) |
| $35,000 to $49,999 | 5,272 (5.6%) | 17,920 (9.1%) |
| $50,000 to $74,999 | 9,815 (10.5%) | 30,472 (15.5%) |
| $75,000 to $99,999 | 10,044 (10.7%) | 22,652 (11.5%) |
| $100,000 to $149,999 | 18,079 (19.3%) | 29,616 (15.1%) |
| $150,000 or more | 40,315 (43.1%) | 41,446 (21.1%) |
| Total | 93,531 (100.0%) | 196,523 (100.0%) |
Monthly Housing Cost Tiers in Hudson County
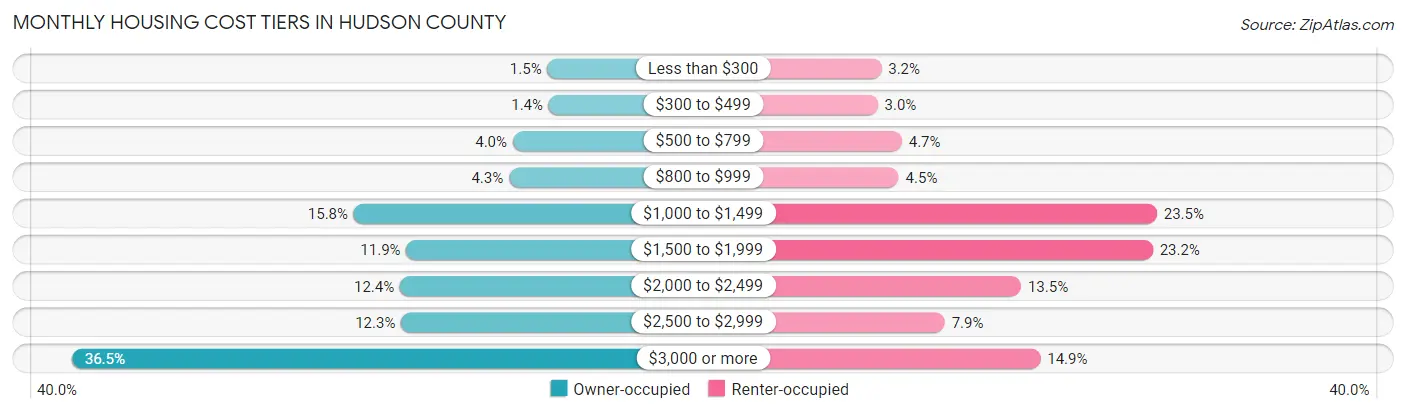
| Monthly Cost | Owner-occupied | Renter-occupied |
| Less than $300 | 1,396 (1.5%) | 6,339 (3.2%) |
| $300 to $499 | 1,298 (1.4%) | 5,818 (3.0%) |
| $500 to $799 | 3,777 (4.0%) | 9,321 (4.7%) |
| $800 to $999 | 4,043 (4.3%) | 8,858 (4.5%) |
| $1,000 to $1,499 | 14,727 (15.8%) | 46,232 (23.5%) |
| $1,500 to $1,999 | 11,116 (11.9%) | 45,634 (23.2%) |
| $2,000 to $2,499 | 11,549 (12.3%) | 26,564 (13.5%) |
| $2,500 to $2,999 | 11,468 (12.3%) | 15,534 (7.9%) |
| $3,000 or more | 34,157 (36.5%) | 29,355 (14.9%) |
| Total | 93,531 (100.0%) | 196,523 (100.0%) |
Physical Housing Characteristics in Hudson County
Housing Structures in Hudson County

| Structure Type | # Housing Units | % Housing Units |
| Single Unit, Detached | 28,031 | 9.7% |
| Single Unit, Attached | 17,116 | 5.9% |
| 2 Unit Apartments | 59,252 | 20.4% |
| 3 or 4 Unit Apartments | 35,341 | 12.2% |
| 5 to 9 Unit Apartments | 30,824 | 10.6% |
| 10 or more Apartments | 119,122 | 41.1% |
| Mobile Home / Other | 368 | 0.1% |
| Total | 290,054 | 100.0% |
Housing Structures by Occupancy in Hudson County
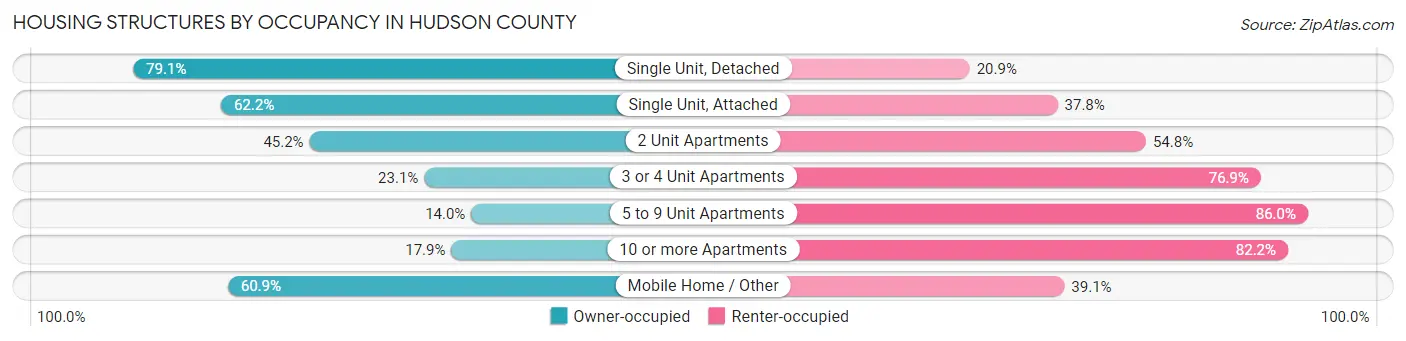
| Structure Type | Owner-occupied | Renter-occupied |
| Single Unit, Detached | 22,172 (79.1%) | 5,859 (20.9%) |
| Single Unit, Attached | 10,643 (62.2%) | 6,473 (37.8%) |
| 2 Unit Apartments | 26,758 (45.2%) | 32,494 (54.8%) |
| 3 or 4 Unit Apartments | 8,152 (23.1%) | 27,189 (76.9%) |
| 5 to 9 Unit Apartments | 4,319 (14.0%) | 26,505 (86.0%) |
| 10 or more Apartments | 21,263 (17.8%) | 97,859 (82.2%) |
| Mobile Home / Other | 224 (60.9%) | 144 (39.1%) |
| Total | 93,531 (32.3%) | 196,523 (67.7%) |
Housing Structures by Number of Rooms in Hudson County
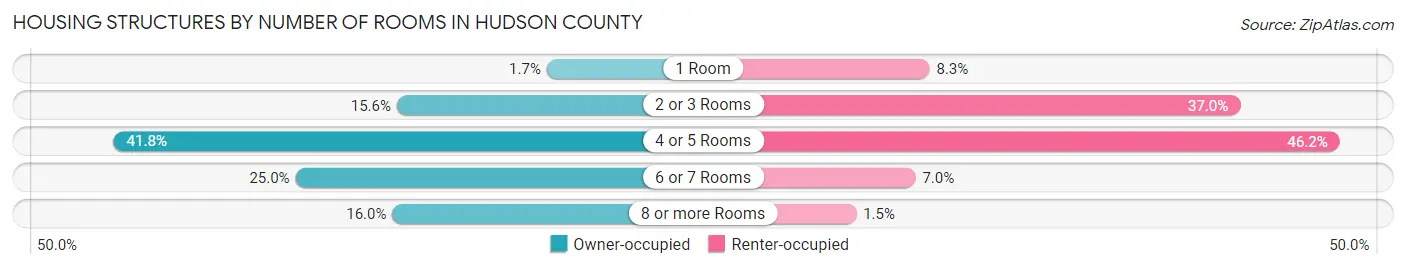
| Number of Rooms | Owner-occupied | Renter-occupied |
| 1 Room | 1,597 (1.7%) | 16,286 (8.3%) |
| 2 or 3 Rooms | 14,575 (15.6%) | 72,708 (37.0%) |
| 4 or 5 Rooms | 39,061 (41.8%) | 90,816 (46.2%) |
| 6 or 7 Rooms | 23,339 (24.9%) | 13,740 (7.0%) |
| 8 or more Rooms | 14,959 (16.0%) | 2,973 (1.5%) |
| Total | 93,531 (100.0%) | 196,523 (100.0%) |
Housing Structure by Heating Type in Hudson County
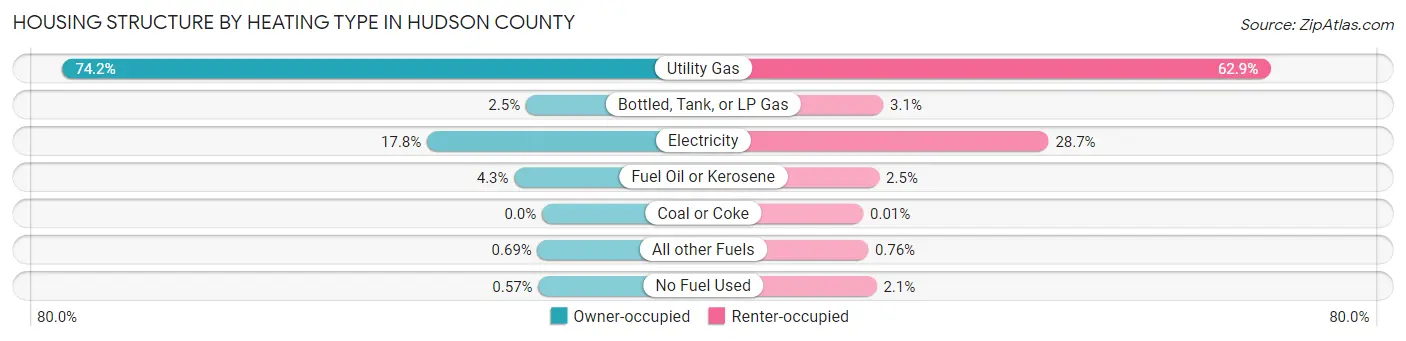
| Heating Type | Owner-occupied | Renter-occupied |
| Utility Gas | 69,369 (74.2%) | 123,615 (62.9%) |
| Bottled, Tank, or LP Gas | 2,331 (2.5%) | 6,113 (3.1%) |
| Electricity | 16,629 (17.8%) | 56,316 (28.7%) |
| Fuel Oil or Kerosene | 4,017 (4.3%) | 4,902 (2.5%) |
| Coal or Coke | 0 (0.0%) | 13 (0.0%) |
| All other Fuels | 650 (0.7%) | 1,494 (0.8%) |
| No Fuel Used | 535 (0.6%) | 4,070 (2.1%) |
| Total | 93,531 (100.0%) | 196,523 (100.0%) |
Household Vehicle Usage in Hudson County
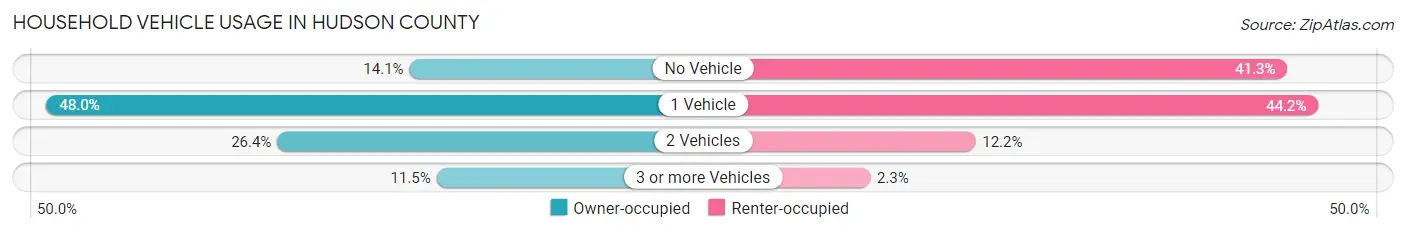
| Vehicles per Household | Owner-occupied | Renter-occupied |
| No Vehicle | 13,171 (14.1%) | 81,146 (41.3%) |
| 1 Vehicle | 44,854 (48.0%) | 86,848 (44.2%) |
| 2 Vehicles | 24,714 (26.4%) | 23,922 (12.2%) |
| 3 or more Vehicles | 10,792 (11.5%) | 4,607 (2.3%) |
| Total | 93,531 (100.0%) | 196,523 (100.0%) |
Real Estate & Mortgages in Hudson County
Real Estate and Mortgage Overview in Hudson County
| Characteristic | Without Mortgage | With Mortgage |
| Housing Units | 31,063 | 62,468 |
| Median Property Value | $432,700 | $521,800 |
| Median Household Income | $93,216 | $31,916 |
| Monthly Housing Costs | $1,257 | $33,718 |
| Real Estate Taxes | $9,069 | $1,250 |
Property Value by Mortgage Status in Hudson County
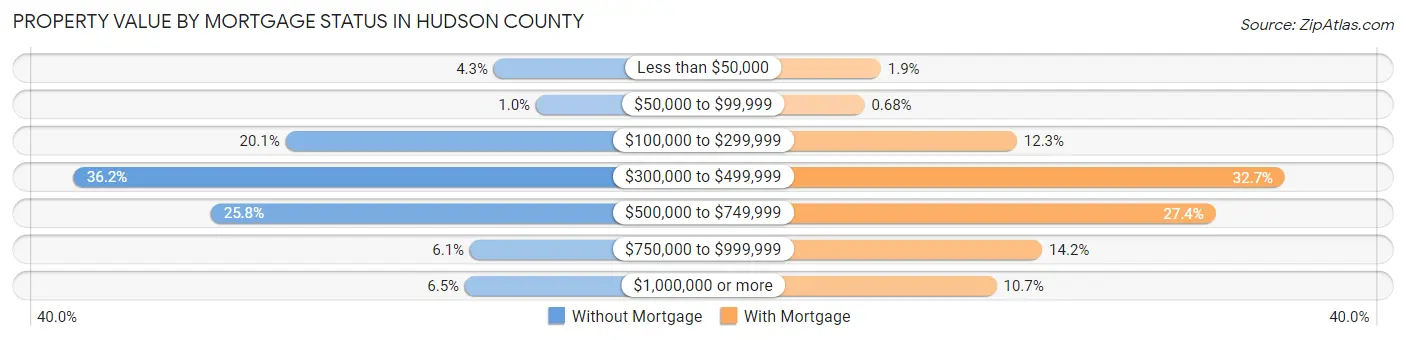
| Property Value | Without Mortgage | With Mortgage |
| Less than $50,000 | 1,321 (4.3%) | 1,206 (1.9%) |
| $50,000 to $99,999 | 324 (1.0%) | 427 (0.7%) |
| $100,000 to $299,999 | 6,250 (20.1%) | 7,675 (12.3%) |
| $300,000 to $499,999 | 11,258 (36.2%) | 20,434 (32.7%) |
| $500,000 to $749,999 | 8,018 (25.8%) | 17,134 (27.4%) |
| $750,000 to $999,999 | 1,887 (6.1%) | 8,880 (14.2%) |
| $1,000,000 or more | 2,005 (6.5%) | 6,712 (10.7%) |
| Total | 31,063 (100.0%) | 62,468 (100.0%) |
Household Income by Mortgage Status in Hudson County
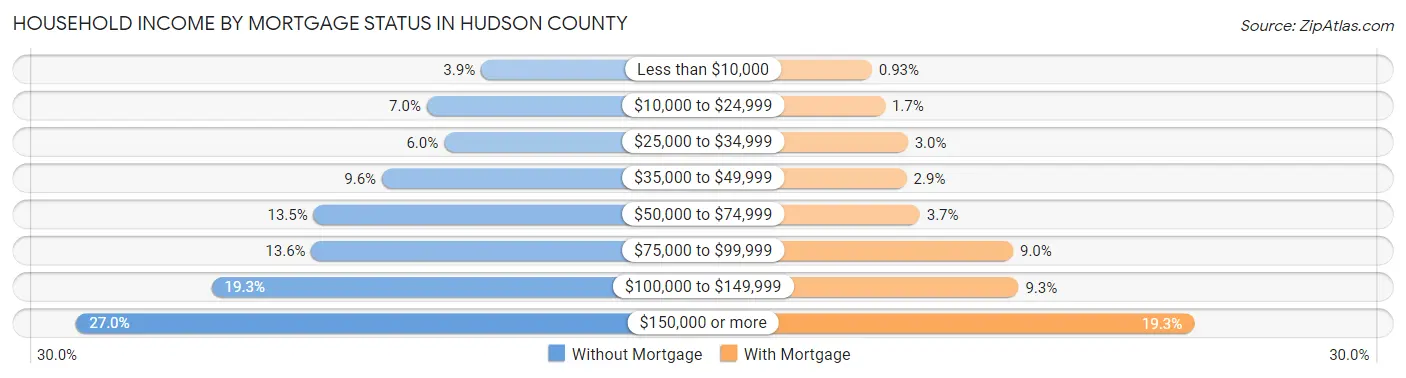
| Household Income | Without Mortgage | With Mortgage |
| Less than $10,000 | 1,219 (3.9%) | 582 (0.9%) |
| $10,000 to $24,999 | 2,181 (7.0%) | 1,050 (1.7%) |
| $25,000 to $34,999 | 1,872 (6.0%) | 1,862 (3.0%) |
| $35,000 to $49,999 | 2,977 (9.6%) | 1,822 (2.9%) |
| $50,000 to $74,999 | 4,190 (13.5%) | 2,295 (3.7%) |
| $75,000 to $99,999 | 4,227 (13.6%) | 5,625 (9.0%) |
| $100,000 to $149,999 | 5,998 (19.3%) | 5,817 (9.3%) |
| $150,000 or more | 8,399 (27.0%) | 12,081 (19.3%) |
| Total | 31,063 (100.0%) | 62,468 (100.0%) |
Property Value to Household Income Ratio in Hudson County

| Value-to-Income Ratio | Without Mortgage | With Mortgage |
| Less than 2.0x | 5,938 (19.1%) | 153,427 (245.6%) |
| 2.0x to 2.9x | 4,296 (13.8%) | 13,674 (21.9%) |
| 3.0x to 3.9x | 3,636 (11.7%) | 13,975 (22.4%) |
| 4.0x or more | 16,807 (54.1%) | 10,201 (16.3%) |
| Total | 31,063 (100.0%) | 62,468 (100.0%) |
Real Estate Taxes by Mortgage Status in Hudson County

| Property Taxes | Without Mortgage | With Mortgage |
| Less than $800 | 469 (1.5%) | 229 (0.4%) |
| $800 to $1,499 | 491 (1.6%) | 401 (0.6%) |
| $800 to $1,499 | 27,835 (89.6%) | 486 (0.8%) |
| Total | 31,063 (100.0%) | 62,468 (100.0%) |
Health & Disability in Hudson County
Health Insurance Coverage by Age in Hudson County
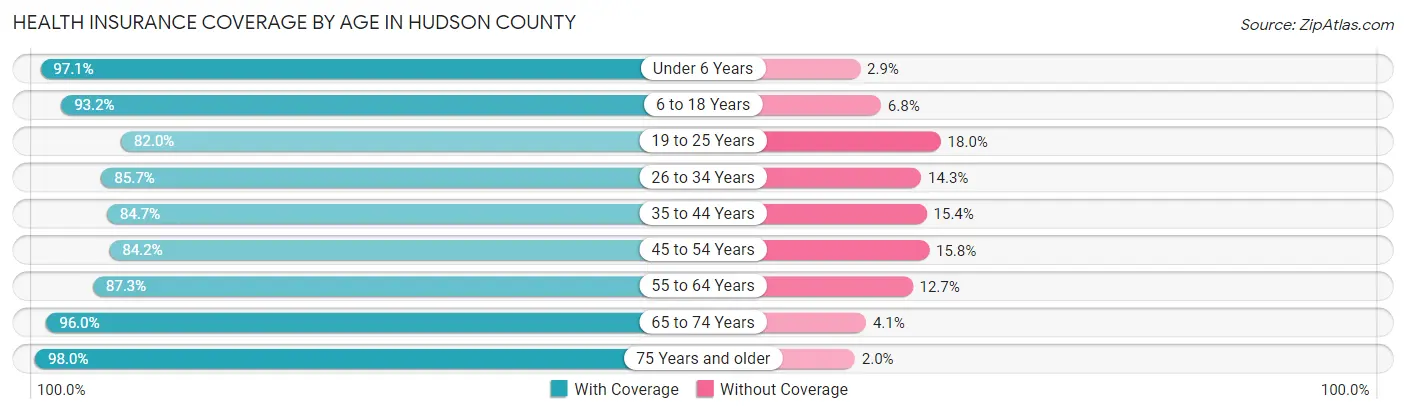
| Age Bracket | With Coverage | Without Coverage |
| Under 6 Years | 52,524 (97.1%) | 1,589 (2.9%) |
| 6 to 18 Years | 90,299 (93.2%) | 6,615 (6.8%) |
| 19 to 25 Years | 50,214 (82.0%) | 10,999 (18.0%) |
| 26 to 34 Years | 114,756 (85.7%) | 19,198 (14.3%) |
| 35 to 44 Years | 97,068 (84.7%) | 17,606 (15.3%) |
| 45 to 54 Years | 71,747 (84.2%) | 13,466 (15.8%) |
| 55 to 64 Years | 66,784 (87.3%) | 9,742 (12.7%) |
| 65 to 74 Years | 48,075 (96.0%) | 2,028 (4.1%) |
| 75 Years and older | 34,014 (98.0%) | 679 (2.0%) |
| Total | 625,481 (88.4%) | 81,922 (11.6%) |
Health Insurance Coverage by Citizenship Status in Hudson County
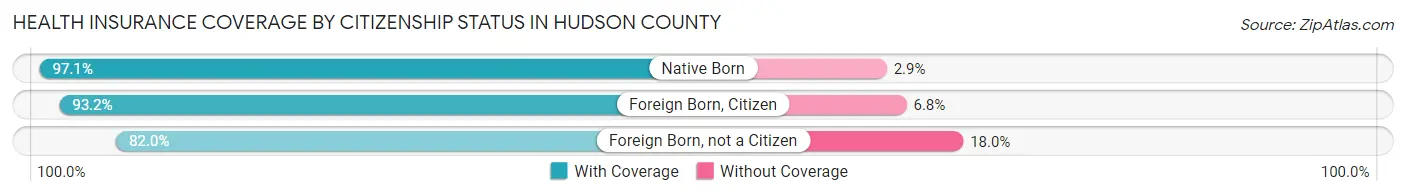
| Citizenship Status | With Coverage | Without Coverage |
| Native Born | 52,524 (97.1%) | 1,589 (2.9%) |
| Foreign Born, Citizen | 90,299 (93.2%) | 6,615 (6.8%) |
| Foreign Born, not a Citizen | 50,214 (82.0%) | 10,999 (18.0%) |
Health Insurance Coverage by Household Income in Hudson County
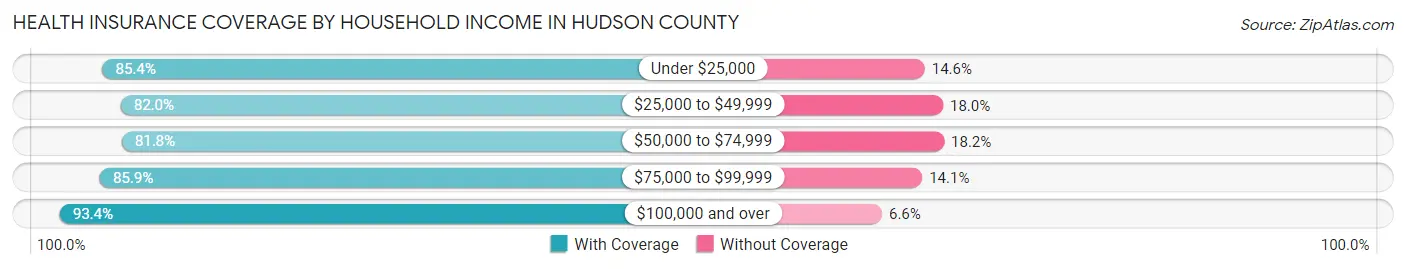
| Household Income | With Coverage | Without Coverage |
| Under $25,000 | 71,096 (85.4%) | 12,163 (14.6%) |
| $25,000 to $49,999 | 78,433 (82.0%) | 17,248 (18.0%) |
| $50,000 to $74,999 | 81,709 (81.8%) | 18,214 (18.2%) |
| $75,000 to $99,999 | 67,312 (85.9%) | 11,072 (14.1%) |
| $100,000 and over | 323,084 (93.4%) | 22,830 (6.6%) |
Public vs Private Health Insurance Coverage by Age in Hudson County
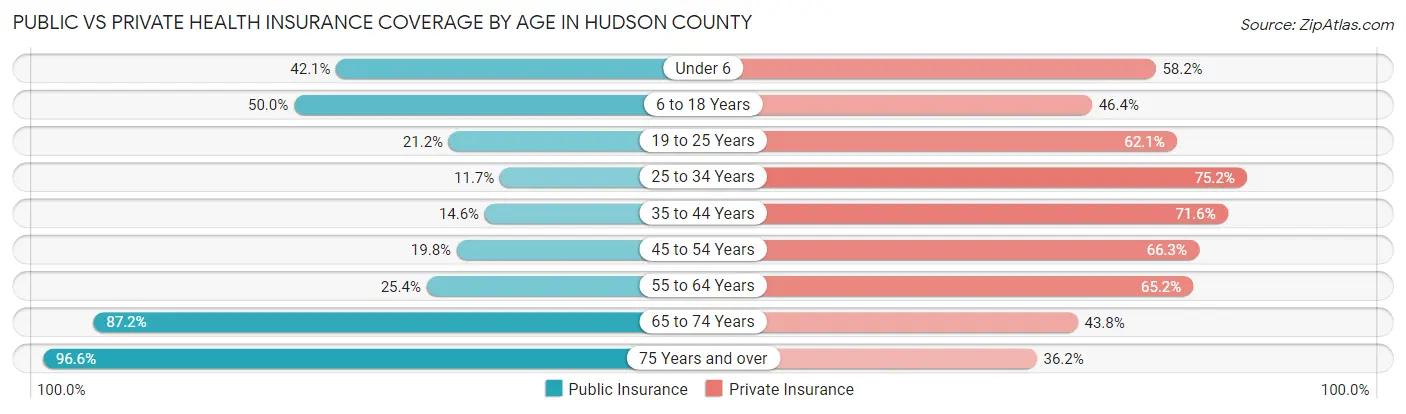
| Age Bracket | Public Insurance | Private Insurance |
| Under 6 | 22,799 (42.1%) | 31,503 (58.2%) |
| 6 to 18 Years | 48,447 (50.0%) | 44,960 (46.4%) |
| 19 to 25 Years | 13,000 (21.2%) | 38,027 (62.1%) |
| 25 to 34 Years | 15,722 (11.7%) | 100,660 (75.1%) |
| 35 to 44 Years | 16,689 (14.5%) | 82,079 (71.6%) |
| 45 to 54 Years | 16,842 (19.8%) | 56,460 (66.3%) |
| 55 to 64 Years | 19,404 (25.4%) | 49,895 (65.2%) |
| 65 to 74 Years | 43,704 (87.2%) | 21,924 (43.8%) |
| 75 Years and over | 33,522 (96.6%) | 12,540 (36.1%) |
| Total | 230,129 (32.5%) | 438,048 (61.9%) |
Disability Status by Sex by Age in Hudson County
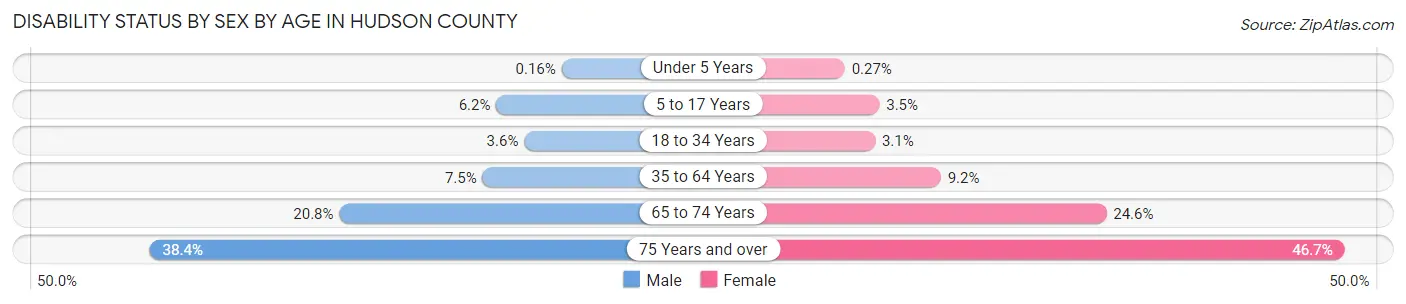
| Age Bracket | Male | Female |
| Under 5 Years | 38 (0.2%) | 63 (0.3%) |
| 5 to 17 Years | 3,056 (6.2%) | 1,654 (3.5%) |
| 18 to 34 Years | 3,786 (3.6%) | 3,024 (3.1%) |
| 35 to 64 Years | 10,527 (7.5%) | 12,493 (9.2%) |
| 65 to 74 Years | 4,694 (20.8%) | 6,756 (24.5%) |
| 75 Years and over | 5,125 (38.4%) | 9,958 (46.7%) |
Disability Class by Sex by Age in Hudson County
Disability Class: Hearing Difficulty
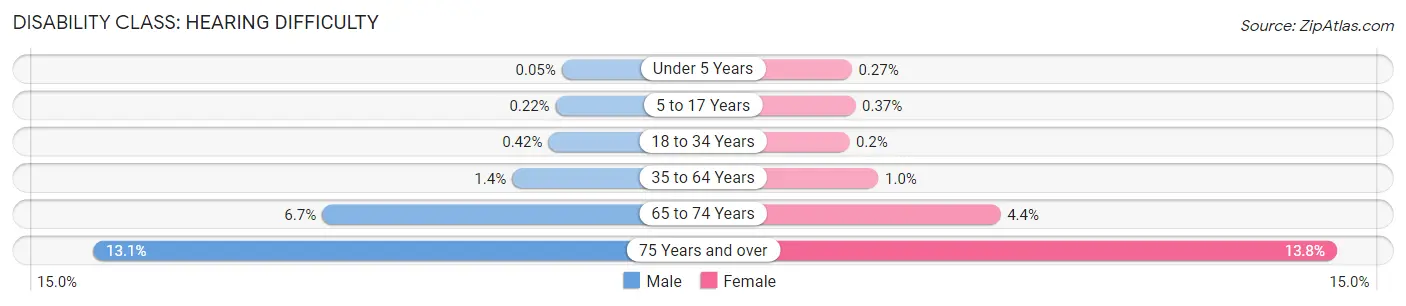
| Age Bracket | Male | Female |
| Under 5 Years | 11 (0.1%) | 63 (0.3%) |
| 5 to 17 Years | 106 (0.2%) | 178 (0.4%) |
| 18 to 34 Years | 437 (0.4%) | 195 (0.2%) |
| 35 to 64 Years | 2,013 (1.4%) | 1,377 (1.0%) |
| 65 to 74 Years | 1,518 (6.7%) | 1,213 (4.4%) |
| 75 Years and over | 1,748 (13.1%) | 2,941 (13.8%) |
Disability Class: Vision Difficulty
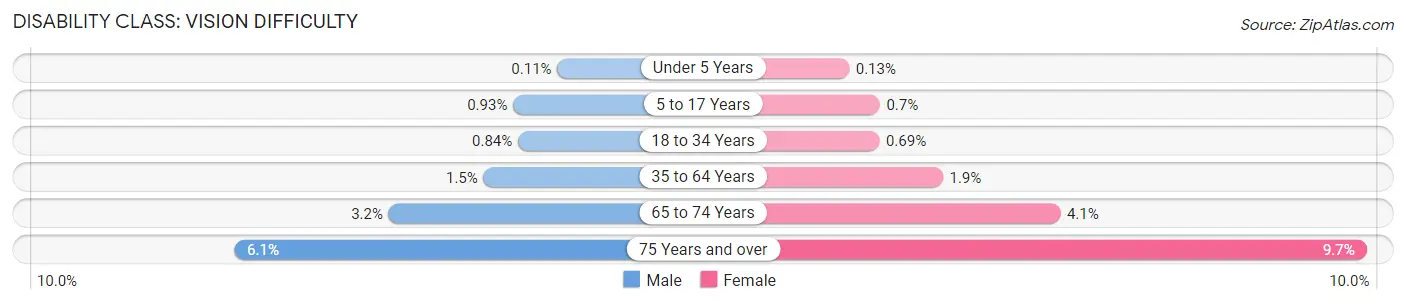
| Age Bracket | Male | Female |
| Under 5 Years | 27 (0.1%) | 29 (0.1%) |
| 5 to 17 Years | 457 (0.9%) | 332 (0.7%) |
| 18 to 34 Years | 879 (0.8%) | 676 (0.7%) |
| 35 to 64 Years | 2,075 (1.5%) | 2,539 (1.9%) |
| 65 to 74 Years | 731 (3.2%) | 1,115 (4.1%) |
| 75 Years and over | 816 (6.1%) | 2,078 (9.7%) |
Disability Class: Cognitive Difficulty
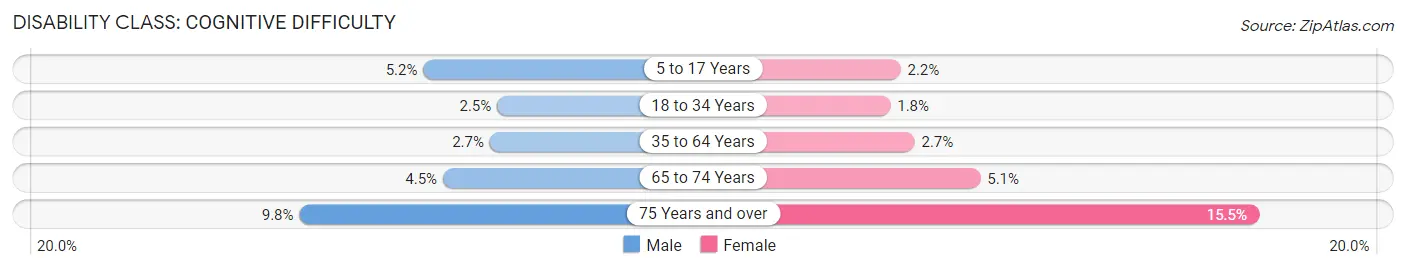
| Age Bracket | Male | Female |
| 5 to 17 Years | 2,556 (5.2%) | 1,036 (2.2%) |
| 18 to 34 Years | 2,568 (2.5%) | 1,774 (1.8%) |
| 35 to 64 Years | 3,835 (2.7%) | 3,678 (2.7%) |
| 65 to 74 Years | 1,009 (4.5%) | 1,414 (5.1%) |
| 75 Years and over | 1,308 (9.8%) | 3,303 (15.5%) |
Disability Class: Ambulatory Difficulty
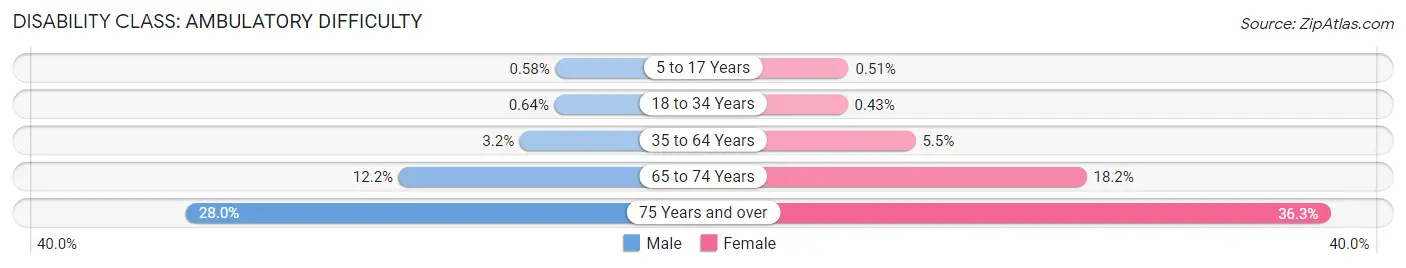
| Age Bracket | Male | Female |
| 5 to 17 Years | 285 (0.6%) | 245 (0.5%) |
| 18 to 34 Years | 669 (0.6%) | 421 (0.4%) |
| 35 to 64 Years | 4,526 (3.2%) | 7,435 (5.5%) |
| 65 to 74 Years | 2,756 (12.2%) | 5,000 (18.2%) |
| 75 Years and over | 3,740 (28.0%) | 7,740 (36.3%) |
Disability Class: Self-Care Difficulty
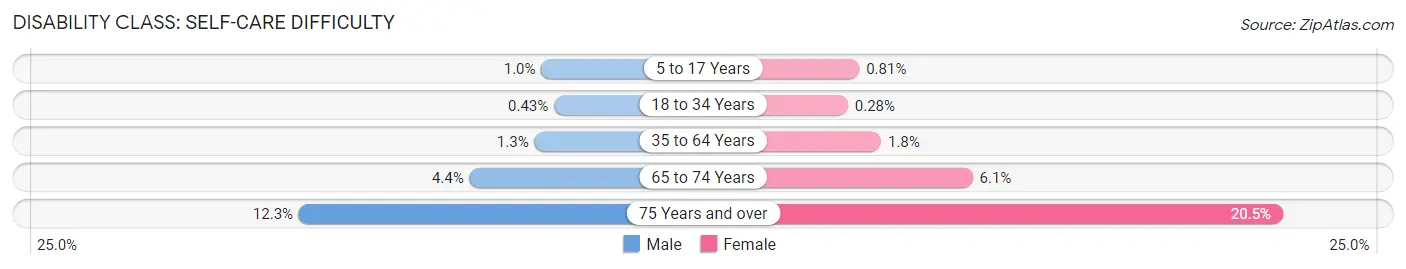
| Age Bracket | Male | Female |
| 5 to 17 Years | 503 (1.0%) | 384 (0.8%) |
| 18 to 34 Years | 444 (0.4%) | 271 (0.3%) |
| 35 to 64 Years | 1,880 (1.3%) | 2,477 (1.8%) |
| 65 to 74 Years | 982 (4.3%) | 1,670 (6.1%) |
| 75 Years and over | 1,638 (12.3%) | 4,370 (20.5%) |
Technology Access in Hudson County
Computing Device Access in Hudson County
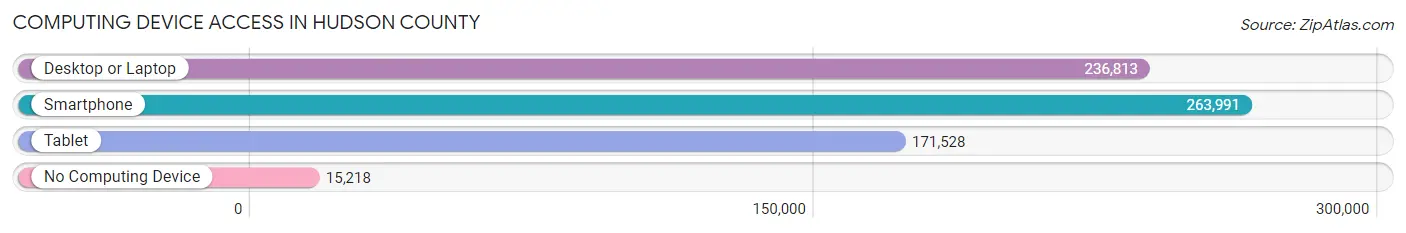
| Device Type | # Households | % Households |
| Desktop or Laptop | 236,813 | 81.6% |
| Smartphone | 263,991 | 91.0% |
| Tablet | 171,528 | 59.1% |
| No Computing Device | 15,218 | 5.2% |
| Total | 290,054 | 100.0% |
Internet Access in Hudson County
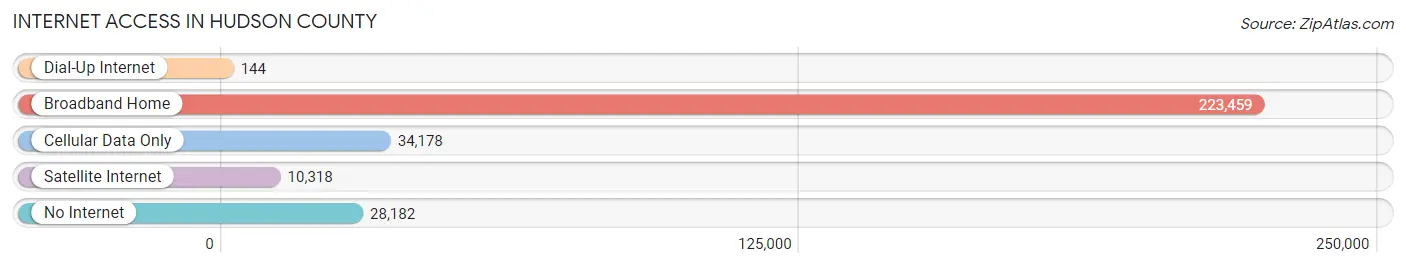
| Internet Type | # Households | % Households |
| Dial-Up Internet | 144 | 0.1% |
| Broadband Home | 223,459 | 77.0% |
| Cellular Data Only | 34,178 | 11.8% |
| Satellite Internet | 10,318 | 3.6% |
| No Internet | 28,182 | 9.7% |
| Total | 290,054 | 100.0% |
Hudson County Summary
Hudson County, New Jersey is located in the northeastern corner of the state, just west of New York City. It is bordered by the Hudson River to the east, the Hackensack River to the west, and the Passaic River to the south. The county is home to a diverse population of over 690,000 people, making it the fourth most populous county in New Jersey.
History
Hudson County was originally inhabited by the Lenape Native Americans, who were later displaced by Dutch settlers in the 1600s. The area was part of Bergen County until 1840, when it was established as its own county. The county was named after Henry Hudson, the English explorer who sailed up the river that now bears his name in 1609.
In the 19th century, Hudson County became an important industrial center, with the development of the railroads and the growth of the port of Jersey City. The county was also home to a large number of immigrants, particularly from Ireland and Italy.
Geography
Hudson County covers an area of 62 square miles, making it the smallest county in New Jersey. The county is divided into 12 municipalities, including Bayonne, Hoboken, Jersey City, North Bergen, Union City, and Weehawken. The county is located on the west bank of the Hudson River, and is connected to New York City by the Hudson-Bergen Light Rail, the PATH train, and several bridges and tunnels.
The county is mostly flat, with some hills in the northern part of the county. The highest point in the county is the Palisades, a ridge of cliffs along the Hudson River. The county is home to several parks, including Liberty State Park, which offers views of the Manhattan skyline.
Economy
Hudson County has a diverse economy, with a mix of manufacturing, retail, and service industries. The county is home to several major corporations, including Panasonic, Goldman Sachs, and Prudential Financial. The Port of Jersey City is one of the busiest ports on the East Coast, and is a major hub for shipping and logistics.
The county is also home to a large number of small businesses, including restaurants, bars, and shops. Tourism is also an important part of the economy, with many visitors coming to the county to visit the Statue of Liberty and Ellis Island.
Demographics
Hudson County is home to a diverse population of over 690,000 people. The population is predominantly white (54%), followed by Hispanic (25%), African American (14%), and Asian (7%). The median household income is $63,000, and the poverty rate is 11%.
The county is home to a large number of immigrants, particularly from Latin America and Asia. The largest immigrant groups are from the Dominican Republic, Mexico, India, and China.
Conclusion
Hudson County, New Jersey is a diverse and vibrant county located in the northeastern corner of the state. The county has a rich history, and is home to a diverse population of over 690,000 people. The county has a diverse economy, with a mix of manufacturing, retail, and service industries. The county is also home to a large number of immigrants, particularly from Latin America and Asia.
Common Questions
What is the Total Population of Hudson County?
Total Population of Hudson County is 712,029.
What is the Total Male Population of Hudson County?
Total Male Population of Hudson County is 356,520.
What is the Total Female Population of Hudson County?
Total Female Population of Hudson County is 355,509.
What is the Ratio of Males per 100 Females in Hudson County?
There are 100.28 Males per 100 Females in Hudson County.
What is the Ratio of Females per 100 Males in Hudson County?
There are 99.72 Females per 100 Males in Hudson County.
What is the Median Population Age in Hudson County?
Median Population Age in Hudson County is 35.6 Years.
What is the Average Family Size in Hudson County
Average Family Size in Hudson County is 3.1 People.
What is the Average Household Size in Hudson County
Average Household Size in Hudson County is 2.4 People.
What is Per Capita Income in Hudson County?
Per Capita income in Hudson County is $51,277.
What is the Median Family Income in Hudson County?
Median Family Income in Hudson County is $96,221.
What is the Median Household income in Hudson County?
Median Household Income in Hudson County is $86,854.
What is Income or Wage Gap in Hudson County?
Income or Wage Gap in Hudson County is 26.0%.
Women in Hudson County earn 74.0 cents for every dollar earned by a man.
What is Family Income Deficit in Hudson County?
Family Income Deficit in Hudson County is $10,508.
Families that are below poverty line in Hudson County earn $10,508 less on average than the poverty threshold level.
What is Inequality or Gini Index in Hudson County?
Inequality or Gini Index in Hudson County is 0.50.
How Large is the Labor Force in Hudson County?
There are 406,698 People in the Labor Forcein in Hudson County.
What is the Percentage of People in the Labor Force in Hudson County?
69.9% of People are in the Labor Force in Hudson County.
What is the Unemployment Rate in Hudson County?
Unemployment Rate in Hudson County is 5.8%.