Gloucester County, NJ
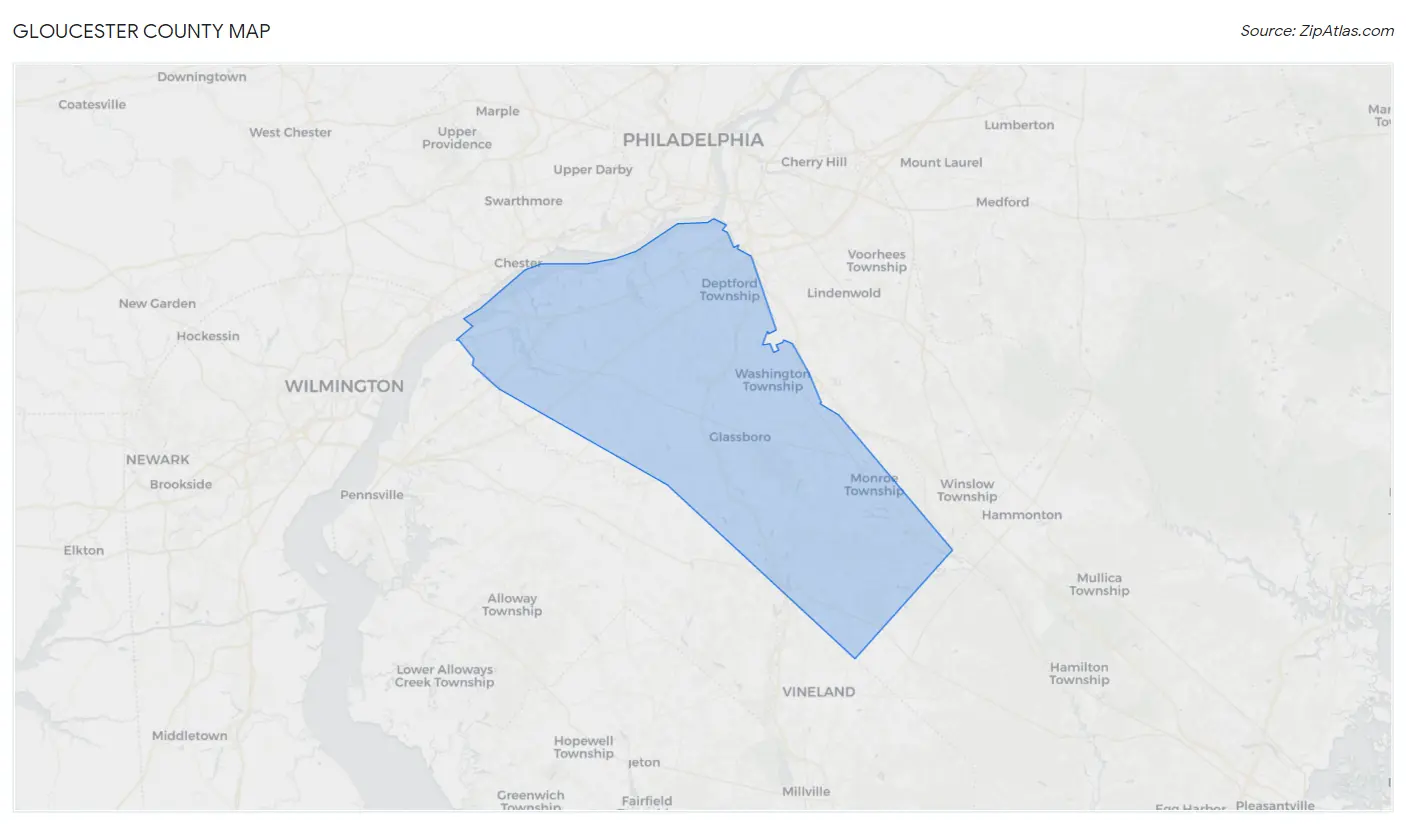
Gloucester County Map
Gloucester County Overview
302,621
TOTAL POPULATION
148,499
MALE POPULATION
154,122
FEMALE POPULATION
96.35
MALES / 100 FEMALES
103.79
FEMALES / 100 MALES
40.2
MEDIAN AGE
3.2
AVG FAMILY SIZE
2.7
AVG HOUSEHOLD SIZE
$45,933
PER CAPITA INCOME
$121,675
AVG FAMILY INCOME
$99,668
AVG HOUSEHOLD INCOME
32.9%
WAGE / INCOME GAP [ % ]
67.1¢/ $1
WAGE / INCOME GAP [ $ ]
$9,998
FAMILY INCOME DEFICIT
0.42
INEQUALITY / GINI INDEX
164,573
LABOR FORCE [ PEOPLE ]
66.8%
PERCENT IN LABOR FORCE
5.2%
UNEMPLOYMENT RATE
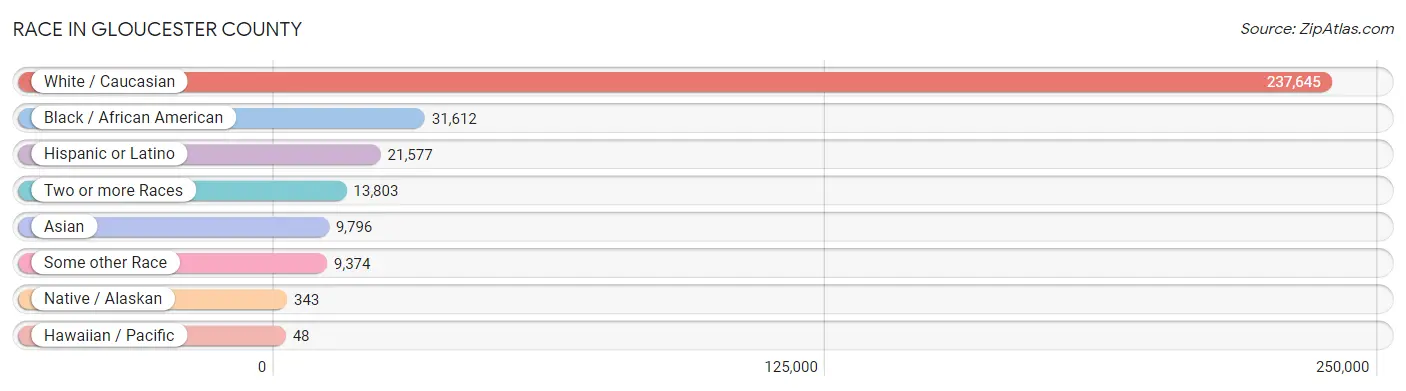
Race in Gloucester County
The most populous races in Gloucester County are White / Caucasian (237,645 | 78.5%), Black / African American (31,612 | 10.4%), and Hispanic or Latino (21,577 | 7.1%).
| Race | # Population | % Population |
| Asian | 9,796 | 3.2% |
| Black / African American | 31,612 | 10.4% |
| Hawaiian / Pacific | 48 | 0.0% |
| Hispanic or Latino | 21,577 | 7.1% |
| Native / Alaskan | 343 | 0.1% |
| White / Caucasian | 237,645 | 78.5% |
| Two or more Races | 13,803 | 4.6% |
| Some other Race | 9,374 | 3.1% |
| Total | 302,621 | 100.0% |
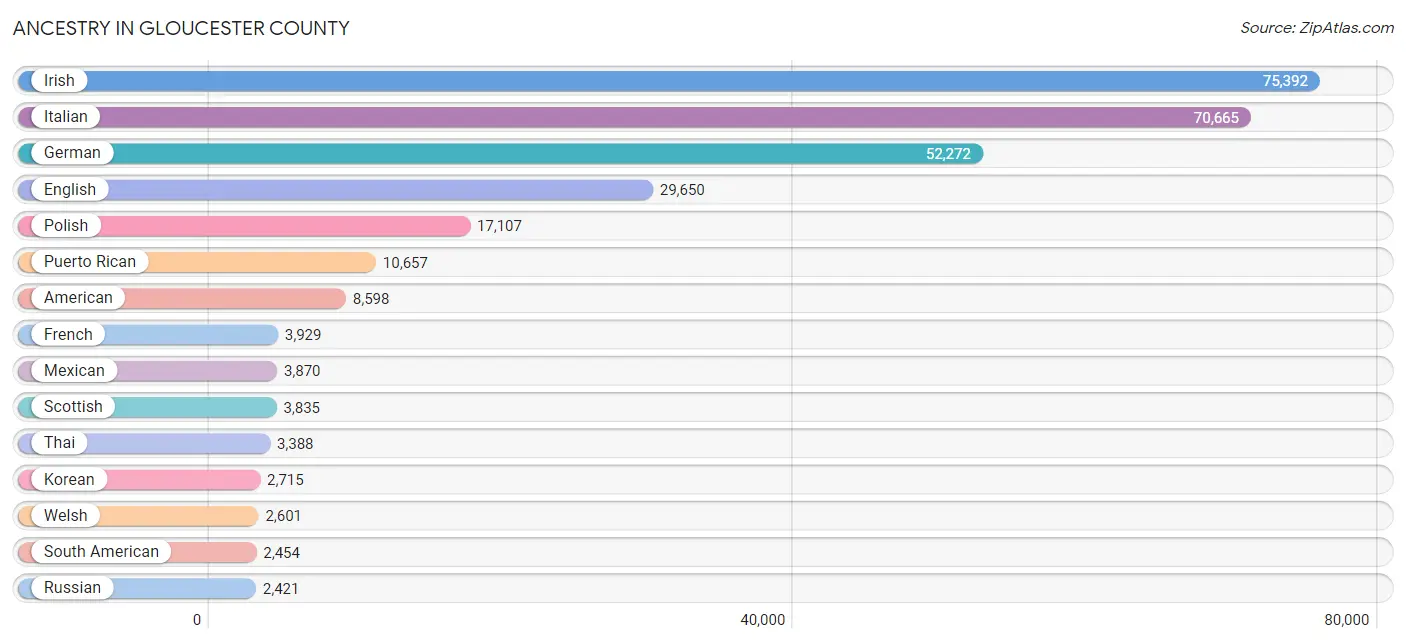
Ancestry in Gloucester County
The most populous ancestries reported in Gloucester County are Irish (75,392 | 24.9%), Italian (70,665 | 23.4%), German (52,272 | 17.3%), English (29,650 | 9.8%), and Polish (17,107 | 5.7%), together accounting for 81.0% of all Gloucester County residents.
| Ancestry | # Population | % Population |
| Afghan | 35 | 0.0% |
| African | 1,092 | 0.4% |
| Albanian | 80 | 0.0% |
| Alsatian | 23 | 0.0% |
| American | 8,598 | 2.8% |
| Apache | 186 | 0.1% |
| Arab | 1,363 | 0.4% |
| Arapaho | 7 | 0.0% |
| Argentinean | 197 | 0.1% |
| Armenian | 407 | 0.1% |
| Australian | 17 | 0.0% |
| Austrian | 480 | 0.2% |
| Belgian | 153 | 0.1% |
| Bermudan | 9 | 0.0% |
| Bhutanese | 487 | 0.2% |
| Blackfeet | 78 | 0.0% |
| Bolivian | 454 | 0.2% |
| Brazilian | 337 | 0.1% |
| British | 1,113 | 0.4% |
| British West Indian | 110 | 0.0% |
| Bulgarian | 10 | 0.0% |
| Burmese | 1,106 | 0.4% |
| Cajun | 9 | 0.0% |
| Canadian | 214 | 0.1% |
| Carpatho Rusyn | 3 | 0.0% |
| Celtic | 7 | 0.0% |
| Central American | 1,574 | 0.5% |
| Central American Indian | 132 | 0.0% |
| Cherokee | 399 | 0.1% |
| Chickasaw | 84 | 0.0% |
| Chilean | 105 | 0.0% |
| Choctaw | 9 | 0.0% |
| Colombian | 873 | 0.3% |
| Costa Rican | 30 | 0.0% |
| Creek | 10 | 0.0% |
| Croatian | 339 | 0.1% |
| Cuban | 596 | 0.2% |
| Czech | 462 | 0.2% |
| Czechoslovakian | 361 | 0.1% |
| Danish | 311 | 0.1% |
| Delaware | 5 | 0.0% |
| Dominican | 1,432 | 0.5% |
| Dutch | 2,047 | 0.7% |
| Eastern European | 1,092 | 0.4% |
| Ecuadorian | 233 | 0.1% |
| Egyptian | 35 | 0.0% |
| English | 29,650 | 9.8% |
| Ethiopian | 44 | 0.0% |
| European | 2,333 | 0.8% |
| Filipino | 52 | 0.0% |
| Finnish | 297 | 0.1% |
| French | 3,929 | 1.3% |
| French Canadian | 614 | 0.2% |
| German | 52,272 | 17.3% |
| German Russian | 11 | 0.0% |
| Ghanaian | 233 | 0.1% |
| Greek | 1,395 | 0.5% |
| Guamanian / Chamorro | 55 | 0.0% |
| Guatemalan | 984 | 0.3% |
| Guyanese | 100 | 0.0% |
| Haitian | 712 | 0.2% |
| Honduran | 76 | 0.0% |
| Hungarian | 2,348 | 0.8% |
| Indian (Asian) | 1,750 | 0.6% |
| Indonesian | 8 | 0.0% |
| Inupiat | 9 | 0.0% |
| Iranian | 203 | 0.1% |
| Iraqi | 91 | 0.0% |
| Irish | 75,392 | 24.9% |
| Iroquois | 3 | 0.0% |
| Israeli | 21 | 0.0% |
| Italian | 70,665 | 23.4% |
| Jamaican | 1,052 | 0.4% |
| Japanese | 398 | 0.1% |
| Jordanian | 166 | 0.1% |
| Korean | 2,715 | 0.9% |
| Latvian | 61 | 0.0% |
| Lebanese | 236 | 0.1% |
| Lithuanian | 1,932 | 0.6% |
| Malaysian | 57 | 0.0% |
| Maltese | 25 | 0.0% |
| Mexican | 3,870 | 1.3% |
| Mexican American Indian | 18 | 0.0% |
| Moroccan | 191 | 0.1% |
| Native Hawaiian | 20 | 0.0% |
| Navajo | 47 | 0.0% |
| New Zealander | 22 | 0.0% |
| Nicaraguan | 112 | 0.0% |
| Nigerian | 415 | 0.1% |
| Northern European | 86 | 0.0% |
| Norwegian | 1,214 | 0.4% |
| Paiute | 5 | 0.0% |
| Pakistani | 138 | 0.1% |
| Palestinian | 100 | 0.0% |
| Panamanian | 110 | 0.0% |
| Pennsylvania German | 386 | 0.1% |
| Peruvian | 172 | 0.1% |
| Polish | 17,107 | 5.7% |
| Portuguese | 639 | 0.2% |
| Puerto Rican | 10,657 | 3.5% |
| Romanian | 365 | 0.1% |
| Russian | 2,421 | 0.8% |
| Salvadoran | 262 | 0.1% |
| Samoan | 15 | 0.0% |
| Scandinavian | 511 | 0.2% |
| Scotch-Irish | 1,900 | 0.6% |
| Scottish | 3,835 | 1.3% |
| Senegalese | 1 | 0.0% |
| Serbian | 83 | 0.0% |
| Sioux | 1 | 0.0% |
| Slavic | 186 | 0.1% |
| Slovak | 1,046 | 0.4% |
| Slovene | 69 | 0.0% |
| Somali | 105 | 0.0% |
| South African | 27 | 0.0% |
| South American | 2,454 | 0.8% |
| South American Indian | 45 | 0.0% |
| Spaniard | 349 | 0.1% |
| Spanish | 360 | 0.1% |
| Sri Lankan | 1,004 | 0.3% |
| Subsaharan African | 1,945 | 0.6% |
| Swedish | 1,754 | 0.6% |
| Swiss | 363 | 0.1% |
| Syrian | 217 | 0.1% |
| Thai | 3,388 | 1.1% |
| Trinidadian and Tobagonian | 210 | 0.1% |
| Turkish | 534 | 0.2% |
| U.S. Virgin Islander | 9 | 0.0% |
| Ukrainian | 1,828 | 0.6% |
| Uruguayan | 17 | 0.0% |
| Venezuelan | 403 | 0.1% |
| Vietnamese | 249 | 0.1% |
| Welsh | 2,601 | 0.9% |
| West Indian | 163 | 0.1% |
| Yugoslavian | 76 | 0.0% | View All 135 Rows |
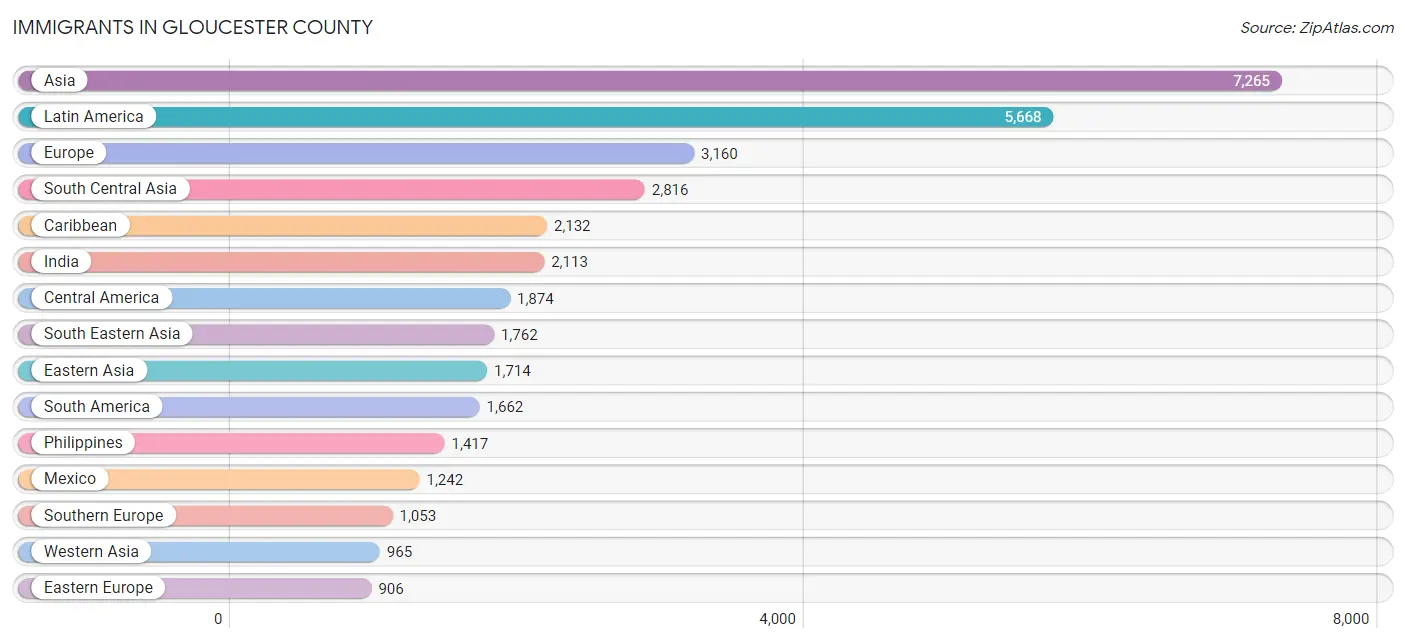
Immigrants in Gloucester County
The most numerous immigrant groups reported in Gloucester County came from Asia (7,265 | 2.4%), Latin America (5,668 | 1.9%), Europe (3,160 | 1.0%), South Central Asia (2,816 | 0.9%), and Caribbean (2,132 | 0.7%), together accounting for 6.9% of all Gloucester County residents.
| Immigration Origin | # Population | % Population |
| Afghanistan | 23 | 0.0% |
| Africa | 898 | 0.3% |
| Argentina | 216 | 0.1% |
| Asia | 7,265 | 2.4% |
| Australia | 12 | 0.0% |
| Austria | 8 | 0.0% |
| Bangladesh | 163 | 0.1% |
| Belarus | 17 | 0.0% |
| Belgium | 5 | 0.0% |
| Belize | 6 | 0.0% |
| Bolivia | 260 | 0.1% |
| Brazil | 182 | 0.1% |
| Bulgaria | 10 | 0.0% |
| Cambodia | 73 | 0.0% |
| Cameroon | 13 | 0.0% |
| Canada | 590 | 0.2% |
| Caribbean | 2,132 | 0.7% |
| Central America | 1,874 | 0.6% |
| Chile | 30 | 0.0% |
| China | 708 | 0.2% |
| Colombia | 281 | 0.1% |
| Costa Rica | 9 | 0.0% |
| Croatia | 80 | 0.0% |
| Cuba | 108 | 0.0% |
| Czechoslovakia | 58 | 0.0% |
| Dominican Republic | 564 | 0.2% |
| Eastern Africa | 131 | 0.0% |
| Eastern Asia | 1,714 | 0.6% |
| Eastern Europe | 906 | 0.3% |
| Ecuador | 117 | 0.0% |
| Egypt | 59 | 0.0% |
| El Salvador | 128 | 0.0% |
| England | 252 | 0.1% |
| Ethiopia | 37 | 0.0% |
| Europe | 3,160 | 1.0% |
| France | 157 | 0.1% |
| Germany | 426 | 0.1% |
| Ghana | 162 | 0.1% |
| Greece | 188 | 0.1% |
| Grenada | 40 | 0.0% |
| Guatemala | 489 | 0.2% |
| Guyana | 144 | 0.1% |
| Haiti | 517 | 0.2% |
| Hong Kong | 73 | 0.0% |
| Hungary | 49 | 0.0% |
| India | 2,113 | 0.7% |
| Iran | 64 | 0.0% |
| Iraq | 78 | 0.0% |
| Ireland | 85 | 0.0% |
| Israel | 18 | 0.0% |
| Italy | 738 | 0.2% |
| Jamaica | 726 | 0.2% |
| Japan | 178 | 0.1% |
| Jordan | 210 | 0.1% |
| Kazakhstan | 79 | 0.0% |
| Korea | 828 | 0.3% |
| Kuwait | 47 | 0.0% |
| Laos | 15 | 0.0% |
| Latin America | 5,668 | 1.9% |
| Lebanon | 18 | 0.0% |
| Liberia | 25 | 0.0% |
| Lithuania | 12 | 0.0% |
| Malaysia | 6 | 0.0% |
| Mexico | 1,242 | 0.4% |
| Middle Africa | 13 | 0.0% |
| Moldova | 43 | 0.0% |
| Morocco | 77 | 0.0% |
| Netherlands | 66 | 0.0% |
| Nigeria | 123 | 0.0% |
| Northern Africa | 141 | 0.1% |
| Northern Europe | 499 | 0.2% |
| Oceania | 17 | 0.0% |
| Pakistan | 371 | 0.1% |
| Peru | 65 | 0.0% |
| Philippines | 1,417 | 0.5% |
| Poland | 249 | 0.1% |
| Portugal | 30 | 0.0% |
| Romania | 50 | 0.0% |
| Russia | 184 | 0.1% |
| Saudi Arabia | 22 | 0.0% |
| Scotland | 6 | 0.0% |
| Senegal | 1 | 0.0% |
| Serbia | 20 | 0.0% |
| Sierra Leone | 40 | 0.0% |
| Somalia | 49 | 0.0% |
| South Africa | 37 | 0.0% |
| South America | 1,662 | 0.5% |
| South Central Asia | 2,816 | 0.9% |
| South Eastern Asia | 1,762 | 0.6% |
| Southern Europe | 1,053 | 0.4% |
| Spain | 97 | 0.0% |
| Switzerland | 40 | 0.0% |
| Syria | 77 | 0.0% |
| Taiwan | 39 | 0.0% |
| Thailand | 36 | 0.0% |
| Trinidad and Tobago | 133 | 0.0% |
| Turkey | 395 | 0.1% |
| Ukraine | 81 | 0.0% |
| Uruguay | 6 | 0.0% |
| Venezuela | 361 | 0.1% |
| Vietnam | 215 | 0.1% |
| Western Africa | 576 | 0.2% |
| Western Asia | 965 | 0.3% |
| Western Europe | 702 | 0.2% | View All 104 Rows |
Sex and Age in Gloucester County
Sex and Age in Gloucester County
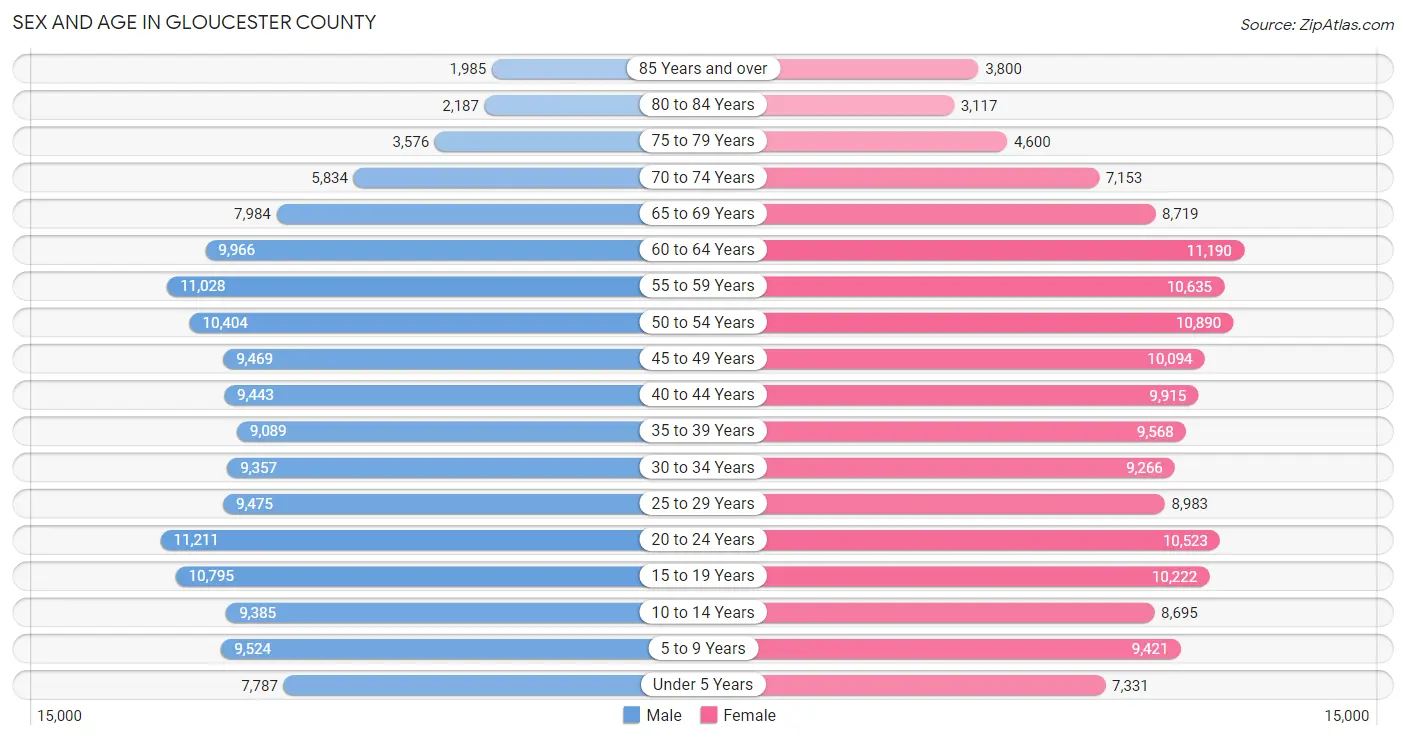
The most populous age groups in Gloucester County are 20 to 24 Years (11,211 | 7.5%) for men and 60 to 64 Years (11,190 | 7.3%) for women.
| Age Bracket | Male | Female |
| Under 5 Years | 7,787 (5.2%) | 7,331 (4.8%) |
| 5 to 9 Years | 9,524 (6.4%) | 9,421 (6.1%) |
| 10 to 14 Years | 9,385 (6.3%) | 8,695 (5.6%) |
| 15 to 19 Years | 10,795 (7.3%) | 10,222 (6.6%) |
| 20 to 24 Years | 11,211 (7.5%) | 10,523 (6.8%) |
| 25 to 29 Years | 9,475 (6.4%) | 8,983 (5.8%) |
| 30 to 34 Years | 9,357 (6.3%) | 9,266 (6.0%) |
| 35 to 39 Years | 9,089 (6.1%) | 9,568 (6.2%) |
| 40 to 44 Years | 9,443 (6.4%) | 9,915 (6.4%) |
| 45 to 49 Years | 9,469 (6.4%) | 10,094 (6.6%) |
| 50 to 54 Years | 10,404 (7.0%) | 10,890 (7.1%) |
| 55 to 59 Years | 11,028 (7.4%) | 10,635 (6.9%) |
| 60 to 64 Years | 9,966 (6.7%) | 11,190 (7.3%) |
| 65 to 69 Years | 7,984 (5.4%) | 8,719 (5.7%) |
| 70 to 74 Years | 5,834 (3.9%) | 7,153 (4.6%) |
| 75 to 79 Years | 3,576 (2.4%) | 4,600 (3.0%) |
| 80 to 84 Years | 2,187 (1.5%) | 3,117 (2.0%) |
| 85 Years and over | 1,985 (1.3%) | 3,800 (2.5%) |
| Total | 148,499 (100.0%) | 154,122 (100.0%) |
Families and Households in Gloucester County
Median Family Size in Gloucester County
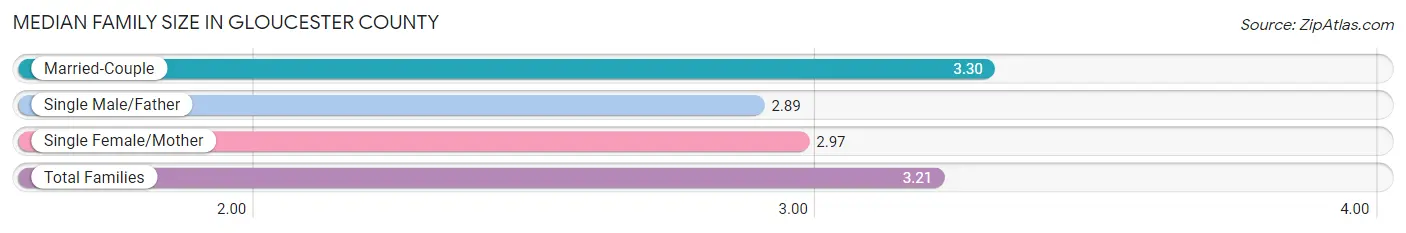
The median family size in Gloucester County is 3.21 persons per family, with married-couple families (58,008 | 75.2%) accounting for the largest median family size of 3.3 persons per family. On the other hand, single male/father families (5,480 | 7.1%) represent the smallest median family size with 2.89 persons per family.
| Family Type | # Families | Family Size |
| Married-Couple | 58,008 (75.2%) | 3.30 |
| Single Male/Father | 5,480 (7.1%) | 2.89 |
| Single Female/Mother | 13,684 (17.7%) | 2.97 |
| Total Families | 77,172 (100.0%) | 3.21 |
Median Household Size in Gloucester County
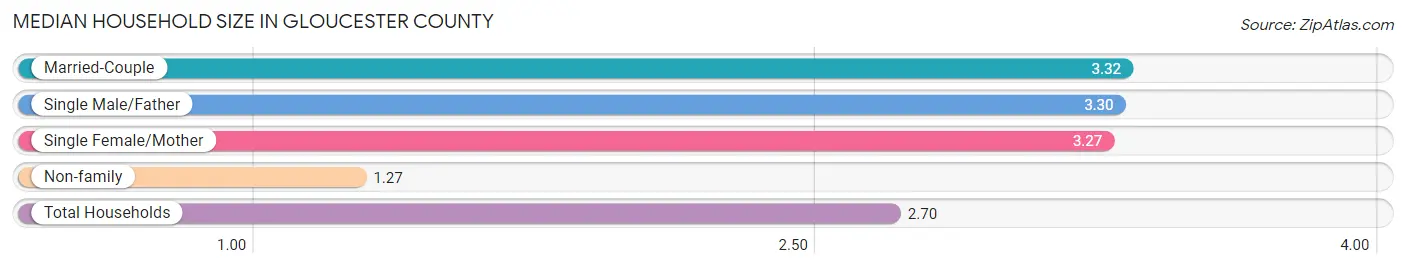
The median household size in Gloucester County is 2.70 persons per household, with married-couple households (58,008 | 52.7%) accounting for the largest median household size of 3.32 persons per household. non-family households (32,824 | 29.8%) represent the smallest median household size with 1.27 persons per household.
| Household Type | # Households | Household Size |
| Married-Couple | 58,008 (52.7%) | 3.32 |
| Single Male/Father | 5,480 (5.0%) | 3.30 |
| Single Female/Mother | 13,684 (12.4%) | 3.27 |
| Non-family | 32,824 (29.8%) | 1.27 |
| Total Households | 109,996 (100.0%) | 2.70 |
Household Size by Marriage Status in Gloucester County
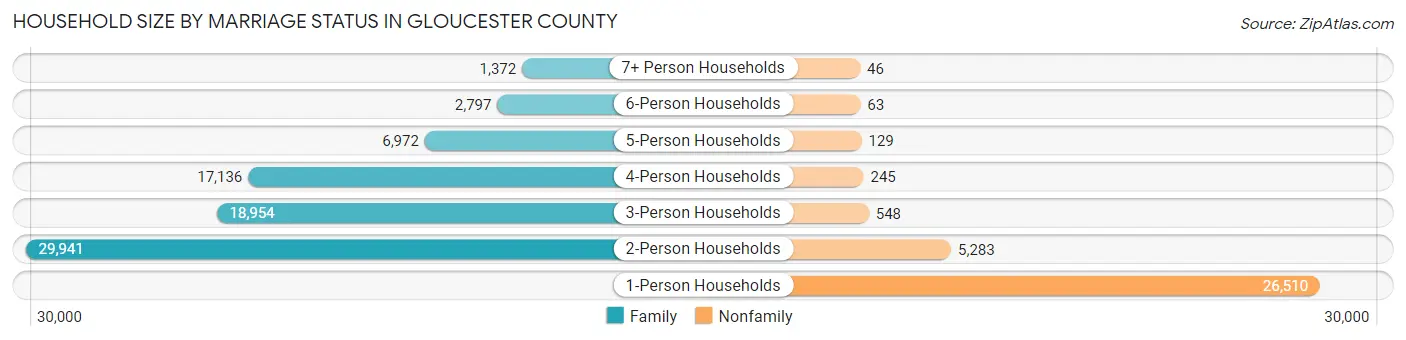
Out of a total of 109,996 households in Gloucester County, 77,172 (70.2%) are family households, while 32,824 (29.8%) are nonfamily households. The most numerous type of family households are 2-person households, comprising 29,941, and the most common type of nonfamily households are 1-person households, comprising 26,510.
| Household Size | Family Households | Nonfamily Households |
| 1-Person Households | - | 26,510 (24.1%) |
| 2-Person Households | 29,941 (27.2%) | 5,283 (4.8%) |
| 3-Person Households | 18,954 (17.2%) | 548 (0.5%) |
| 4-Person Households | 17,136 (15.6%) | 245 (0.2%) |
| 5-Person Households | 6,972 (6.3%) | 129 (0.1%) |
| 6-Person Households | 2,797 (2.5%) | 63 (0.1%) |
| 7+ Person Households | 1,372 (1.3%) | 46 (0.0%) |
| Total | 77,172 (70.2%) | 32,824 (29.8%) |
Female Fertility in Gloucester County
Fertility by Age in Gloucester County
Average fertility rate in Gloucester County is 44.0 births per 1,000 women. Women in the age bracket of 20 to 34 years have the highest fertility rate with 78.0 births per 1,000 women. Women in the age bracket of 20 to 34 years acount for 71.7% of all women with births.
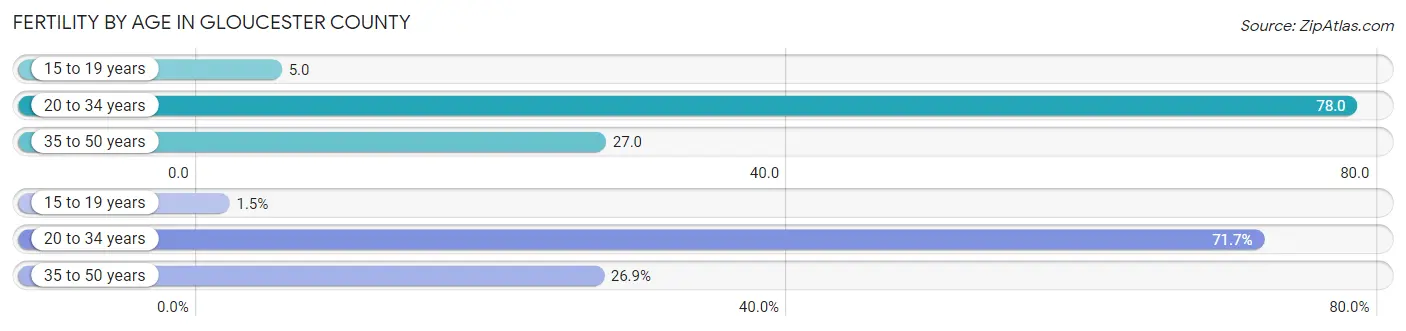
| Age Bracket | Women with Births | Births / 1,000 Women |
| 15 to 19 years | 46 (1.5%) | 5.0 |
| 20 to 34 years | 2,255 (71.7%) | 78.0 |
| 35 to 50 years | 845 (26.9%) | 27.0 |
| Total | 3,146 (100.0%) | 44.0 |
Fertility by Age by Marriage Status in Gloucester County
70.9% of women with births (3,146) in Gloucester County are married. The highest percentage of unmarried women with births falls into 15 to 19 years age bracket with 100.0% of them unmarried at the time of birth, while the lowest percentage of unmarried women with births belong to 35 to 50 years age bracket with 25.8% of them unmarried.
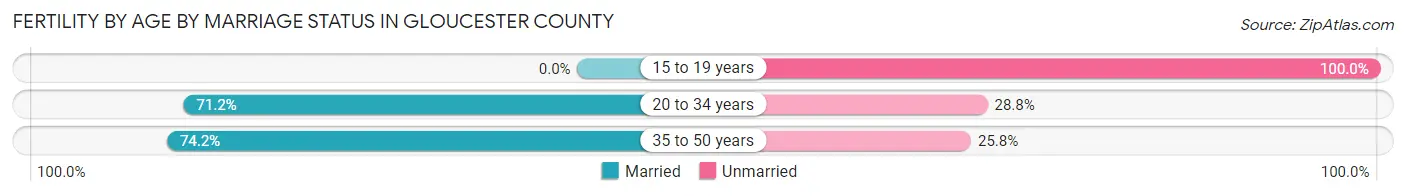
| Age Bracket | Married | Unmarried |
| 15 to 19 years | 0 (0.0%) | 46 (100.0%) |
| 20 to 34 years | 1,606 (71.2%) | 649 (28.8%) |
| 35 to 50 years | 627 (74.2%) | 218 (25.8%) |
| Total | 2,231 (70.9%) | 915 (29.1%) |
Fertility by Education in Gloucester County
Average fertility rate in Gloucester County is 44.0 births per 1,000 women. Women with the education attainment of graduate degree have the highest fertility rate of 60.0 births per 1,000 women, while women with the education attainment of less than high school have the lowest fertility at 15.0 births per 1,000 women. Women with the education attainment of college or associate's degree represent 31.7% of all women with births.
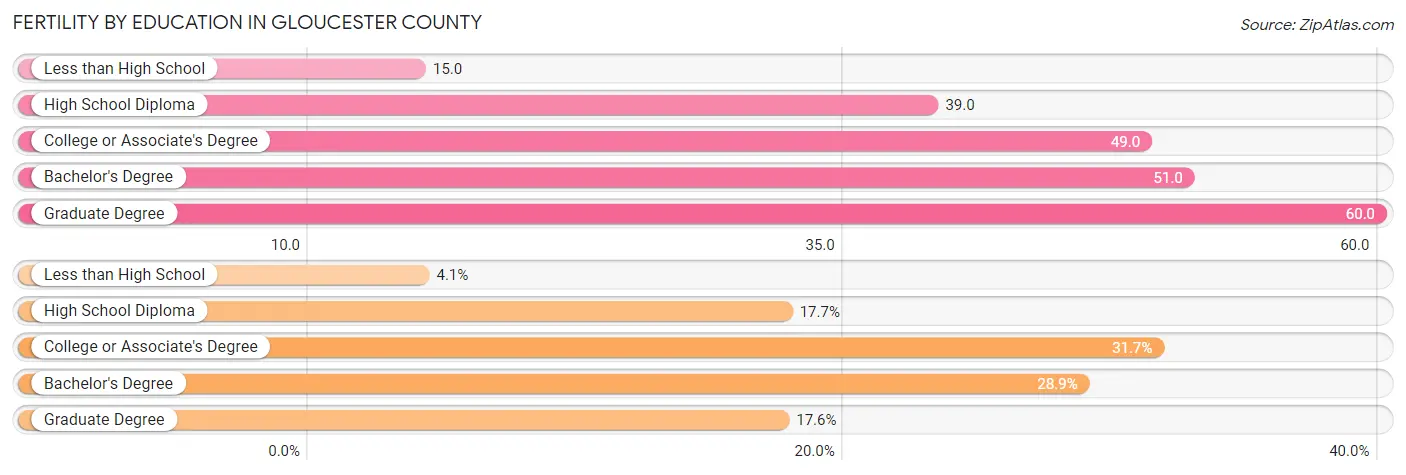
| Educational Attainment | Women with Births | Births / 1,000 Women |
| Less than High School | 130 (4.1%) | 15.0 |
| High School Diploma | 558 (17.7%) | 39.0 |
| College or Associate's Degree | 996 (31.7%) | 49.0 |
| Bachelor's Degree | 908 (28.9%) | 51.0 |
| Graduate Degree | 554 (17.6%) | 60.0 |
| Total | 3,146 (100.0%) | 44.0 |
Fertility by Education by Marriage Status in Gloucester County
29.1% of women with births in Gloucester County are unmarried. Women with the educational attainment of graduate degree are most likely to be married with 98.0% of them married at childbirth, while women with the educational attainment of less than high school are least likely to be married with 62.3% of them unmarried at childbirth.
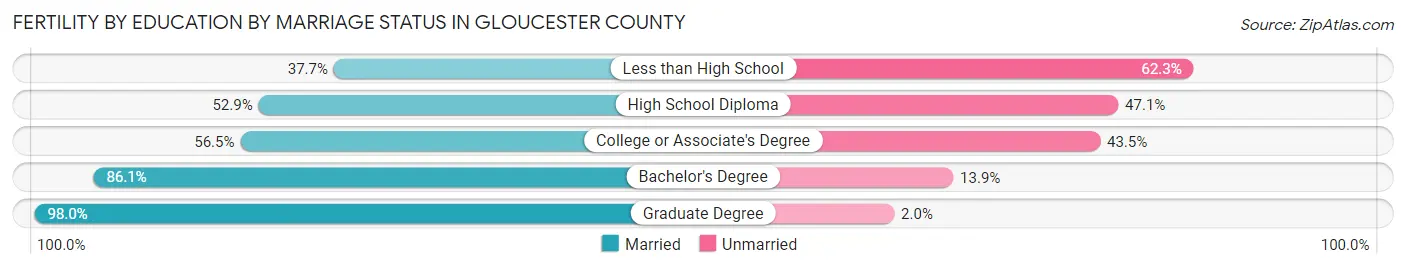
| Educational Attainment | Married | Unmarried |
| Less than High School | 49 (37.7%) | 81 (62.3%) |
| High School Diploma | 295 (52.9%) | 263 (47.1%) |
| College or Associate's Degree | 563 (56.5%) | 433 (43.5%) |
| Bachelor's Degree | 782 (86.1%) | 126 (13.9%) |
| Graduate Degree | 543 (98.0%) | 11 (2.0%) |
| Total | 2,231 (70.9%) | 915 (29.1%) |
Income in Gloucester County
Income Overview in Gloucester County
Per Capita Income in Gloucester County is $45,933, while median incomes of families and households are $121,675 and $99,668 respectively.
| Characteristic | Number | Measure |
| Per Capita Income | 302,621 | $45,933 |
| Median Family Income | 77,172 | $121,675 |
| Mean Family Income | 77,172 | $143,690 |
| Median Household Income | 109,996 | $99,668 |
| Mean Household Income | 109,996 | $122,867 |
| Income Deficit | 77,172 | $9,998 |
| Wage / Income Gap (%) | 302,621 | 32.94% |
| Wage / Income Gap ($) | 302,621 | 67.06¢ per $1 |
| Gini / Inequality Index | 302,621 | 0.42 |
Earnings by Sex in Gloucester County
Average Earnings in Gloucester County are $52,325, $62,632 for men and $42,004 for women, a difference of 32.9%.
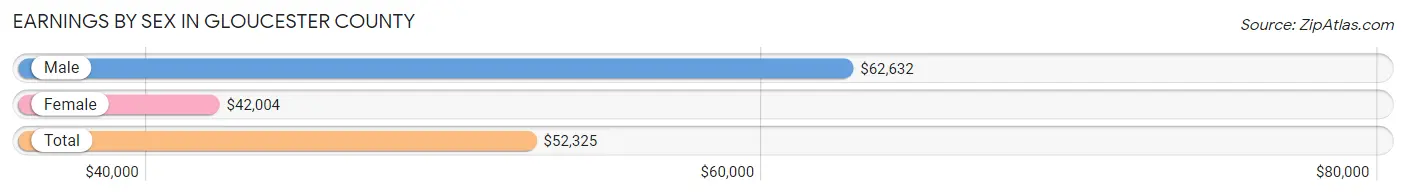
| Sex | Number | Average Earnings |
| Male | 87,541 (51.4%) | $62,632 |
| Female | 82,916 (48.6%) | $42,004 |
| Total | 170,457 (100.0%) | $52,325 |
Earnings by Sex by Income Bracket in Gloucester County
The most common earnings brackets in Gloucester County are $100,000+ for men (22,905 | 26.2%) and $100,000+ for women (10,297 | 12.4%).
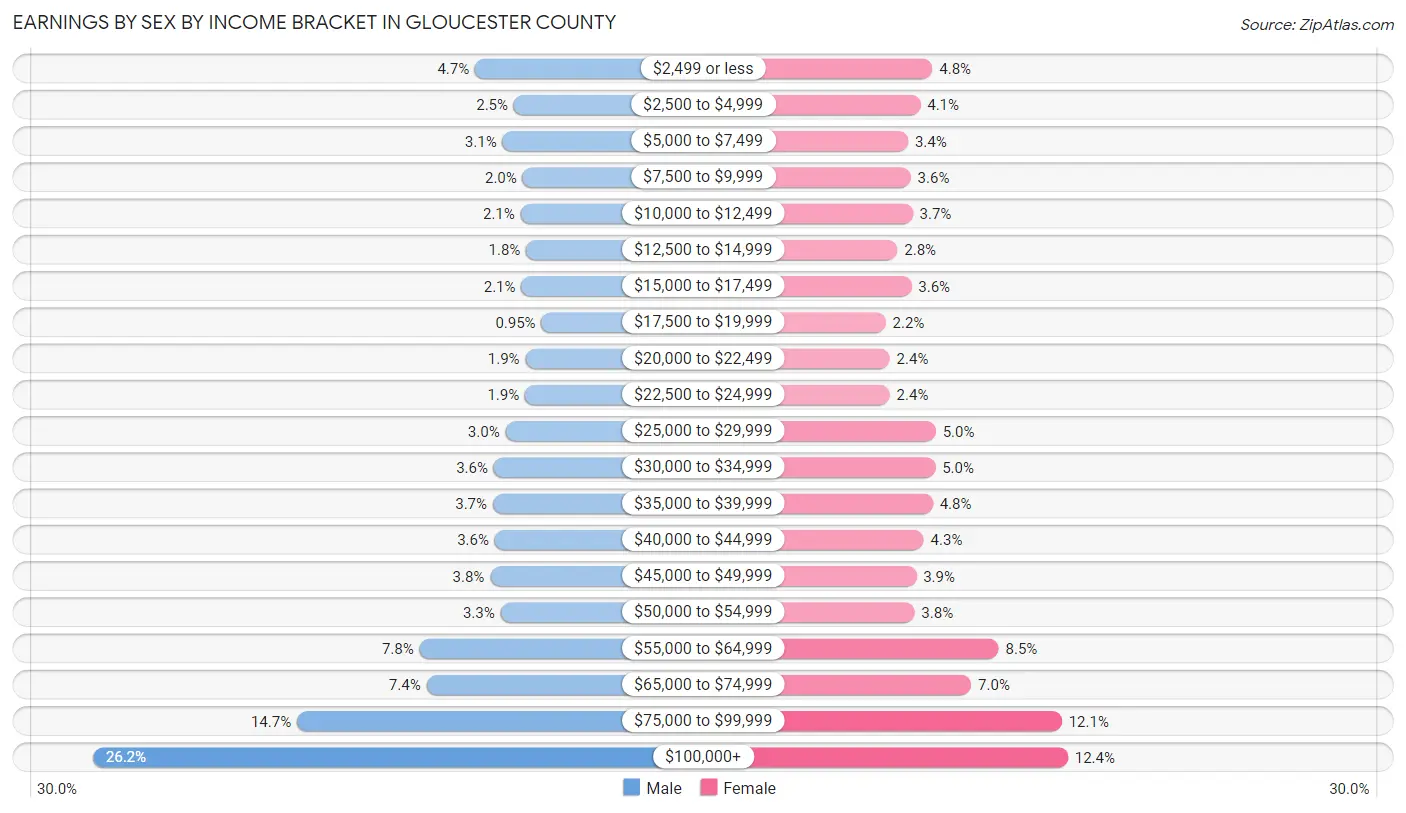
| Income | Male | Female |
| $2,499 or less | 4,095 (4.7%) | 3,986 (4.8%) |
| $2,500 to $4,999 | 2,185 (2.5%) | 3,427 (4.1%) |
| $5,000 to $7,499 | 2,753 (3.1%) | 2,855 (3.4%) |
| $7,500 to $9,999 | 1,758 (2.0%) | 2,974 (3.6%) |
| $10,000 to $12,499 | 1,853 (2.1%) | 3,067 (3.7%) |
| $12,500 to $14,999 | 1,585 (1.8%) | 2,357 (2.8%) |
| $15,000 to $17,499 | 1,818 (2.1%) | 3,009 (3.6%) |
| $17,500 to $19,999 | 831 (0.9%) | 1,807 (2.2%) |
| $20,000 to $22,499 | 1,623 (1.8%) | 1,999 (2.4%) |
| $22,500 to $24,999 | 1,634 (1.9%) | 2,002 (2.4%) |
| $25,000 to $29,999 | 2,601 (3.0%) | 4,147 (5.0%) |
| $30,000 to $34,999 | 3,180 (3.6%) | 4,125 (5.0%) |
| $35,000 to $39,999 | 3,221 (3.7%) | 4,004 (4.8%) |
| $40,000 to $44,999 | 3,129 (3.6%) | 3,586 (4.3%) |
| $45,000 to $49,999 | 3,349 (3.8%) | 3,237 (3.9%) |
| $50,000 to $54,999 | 2,845 (3.3%) | 3,154 (3.8%) |
| $55,000 to $64,999 | 6,825 (7.8%) | 7,071 (8.5%) |
| $65,000 to $74,999 | 6,487 (7.4%) | 5,795 (7.0%) |
| $75,000 to $99,999 | 12,864 (14.7%) | 10,017 (12.1%) |
| $100,000+ | 22,905 (26.2%) | 10,297 (12.4%) |
| Total | 87,541 (100.0%) | 82,916 (100.0%) |
Earnings by Sex by Educational Attainment in Gloucester County
Average earnings in Gloucester County are $72,360 for men and $51,129 for women, a difference of 29.3%. Men with an educational attainment of graduate degree enjoy the highest average annual earnings of $109,651, while those with less than high school education earn the least with $45,819. Women with an educational attainment of graduate degree earn the most with the average annual earnings of $82,579, while those with less than high school education have the smallest earnings of $27,146.
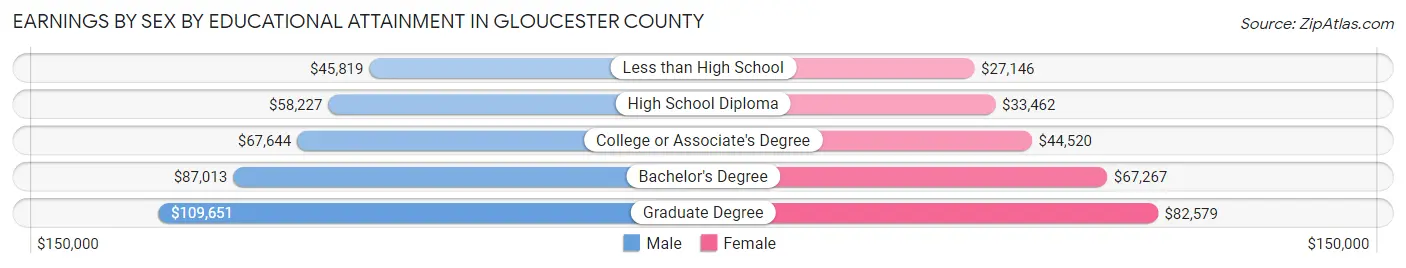
| Educational Attainment | Male Income | Female Income |
| Less than High School | $45,819 | $27,146 |
| High School Diploma | $58,227 | $33,462 |
| College or Associate's Degree | $67,644 | $44,520 |
| Bachelor's Degree | $87,013 | $67,267 |
| Graduate Degree | $109,651 | $82,579 |
| Total | $72,360 | $51,129 |
Family Income in Gloucester County
Family Income Brackets in Gloucester County
According to the Gloucester County family income data, there are 17,750 families falling into the $100,000 to $149,999 income range, which is the most common income bracket and makes up 23.0% of all families. Conversely, the $10,000 to $14,999 income bracket is the least frequent group with only 695 families (0.9%) belonging to this category.
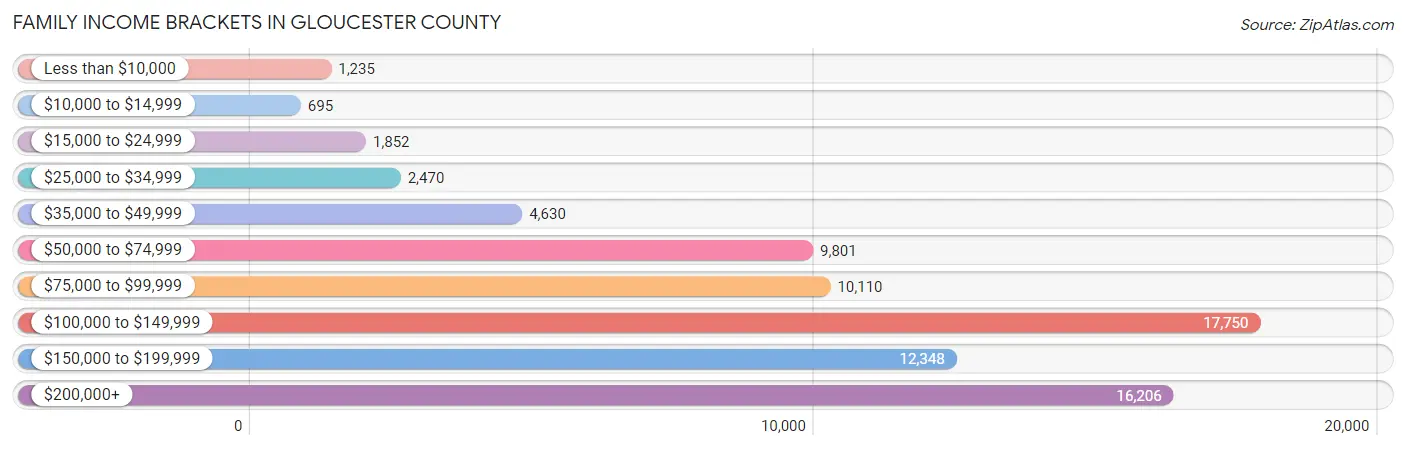
| Income Bracket | # Families | % Families |
| Less than $10,000 | 1,235 | 1.6% |
| $10,000 to $14,999 | 695 | 0.9% |
| $15,000 to $24,999 | 1,852 | 2.4% |
| $25,000 to $34,999 | 2,470 | 3.2% |
| $35,000 to $49,999 | 4,630 | 6.0% |
| $50,000 to $74,999 | 9,801 | 12.7% |
| $75,000 to $99,999 | 10,110 | 13.1% |
| $100,000 to $149,999 | 17,750 | 23.0% |
| $150,000 to $199,999 | 12,348 | 16.0% |
| $200,000+ | 16,206 | 21.0% |
Family Income by Famaliy Size in Gloucester County
6-person families (2,322 | 3.0%) account for the highest median family income in Gloucester County with $178,800 per family, while 2-person families (32,193 | 41.7%) have the highest median income of $47,272 per family member.
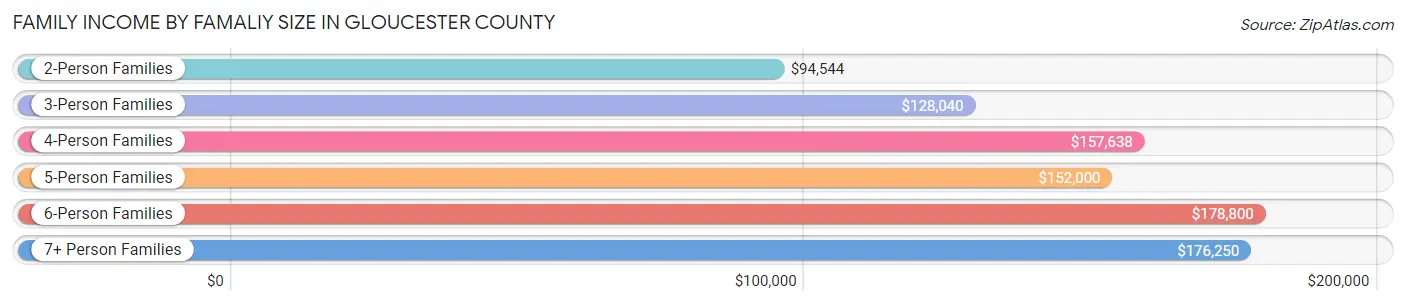
| Income Bracket | # Families | Median Income |
| 2-Person Families | 32,193 (41.7%) | $94,544 |
| 3-Person Families | 18,828 (24.4%) | $128,040 |
| 4-Person Families | 16,102 (20.9%) | $157,638 |
| 5-Person Families | 6,704 (8.7%) | $152,000 |
| 6-Person Families | 2,322 (3.0%) | $178,800 |
| 7+ Person Families | 1,023 (1.3%) | $176,250 |
| Total | 77,172 (100.0%) | $121,675 |
Family Income by Number of Earners in Gloucester County
The median family income in Gloucester County is $121,675, with families comprising 3+ earners (12,228) having the highest median family income of $185,298, while families with no earners (10,088) have the lowest median family income of $60,371, accounting for 15.9% and 13.1% of families, respectively.
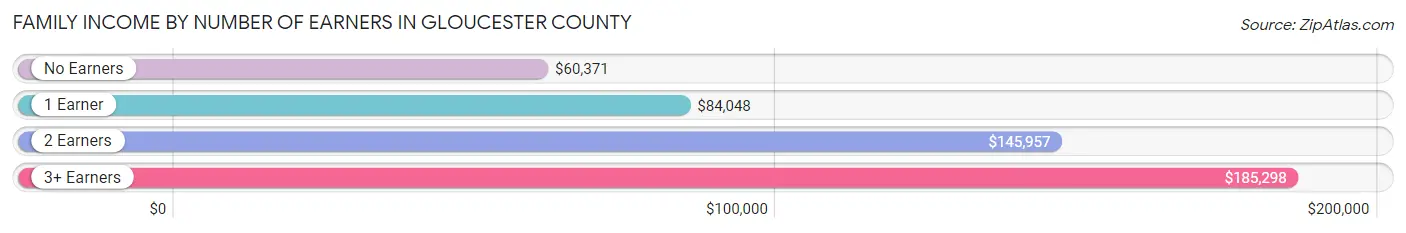
| Number of Earners | # Families | Median Income |
| No Earners | 10,088 (13.1%) | $60,371 |
| 1 Earner | 21,026 (27.3%) | $84,048 |
| 2 Earners | 33,830 (43.8%) | $145,957 |
| 3+ Earners | 12,228 (15.9%) | $185,298 |
| Total | 77,172 (100.0%) | $121,675 |
Household Income in Gloucester County
Household Income Brackets in Gloucester County
With 22,549 households falling in the category, the $100,000 to $149,999 income range is the most frequent in Gloucester County, accounting for 20.5% of all households. In contrast, only 2,640 households (2.4%) fall into the $10,000 to $14,999 income bracket, making it the least populous group.
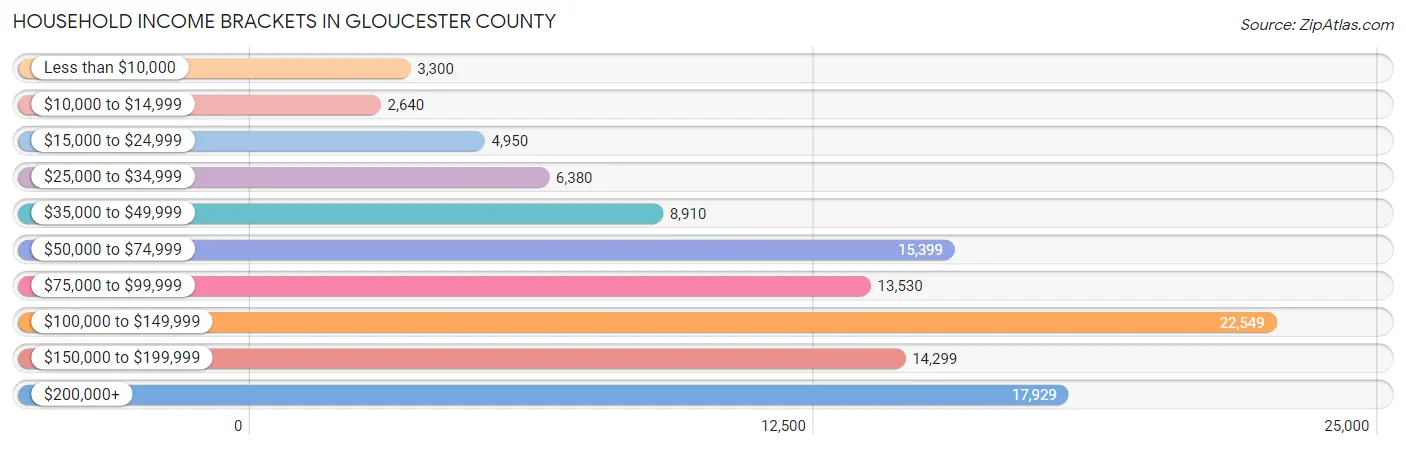
| Income Bracket | # Households | % Households |
| Less than $10,000 | 3,300 | 3.0% |
| $10,000 to $14,999 | 2,640 | 2.4% |
| $15,000 to $24,999 | 4,950 | 4.5% |
| $25,000 to $34,999 | 6,380 | 5.8% |
| $35,000 to $49,999 | 8,910 | 8.1% |
| $50,000 to $74,999 | 15,399 | 14.0% |
| $75,000 to $99,999 | 13,530 | 12.3% |
| $100,000 to $149,999 | 22,549 | 20.5% |
| $150,000 to $199,999 | 14,299 | 13.0% |
| $200,000+ | 17,929 | 16.3% |
Household Income by Householder Age in Gloucester County
The median household income in Gloucester County is $99,668, with the highest median household income of $120,433 found in the 45 to 64 years age bracket for the primary householder. A total of 45,722 households (41.6%) fall into this category. Meanwhile, the 15 to 24 years age bracket for the primary householder has the lowest median household income of $51,818, with 2,094 households (1.9%) in this group.
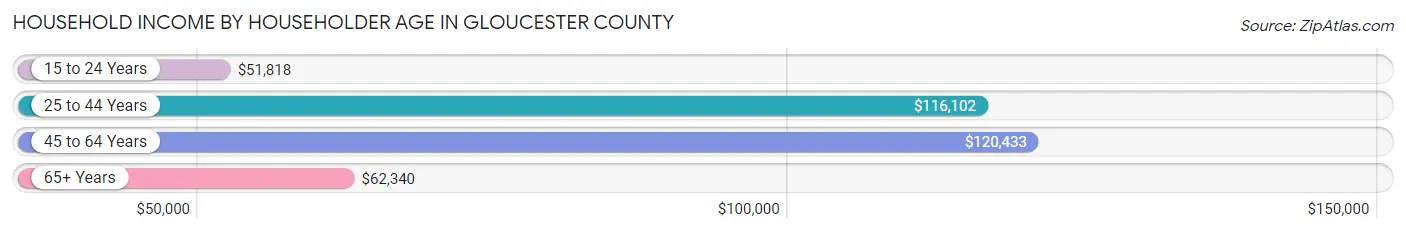
| Income Bracket | # Households | Median Income |
| 15 to 24 Years | 2,094 (1.9%) | $51,818 |
| 25 to 44 Years | 32,367 (29.4%) | $116,102 |
| 45 to 64 Years | 45,722 (41.6%) | $120,433 |
| 65+ Years | 29,813 (27.1%) | $62,340 |
| Total | 109,996 (100.0%) | $99,668 |
Poverty in Gloucester County
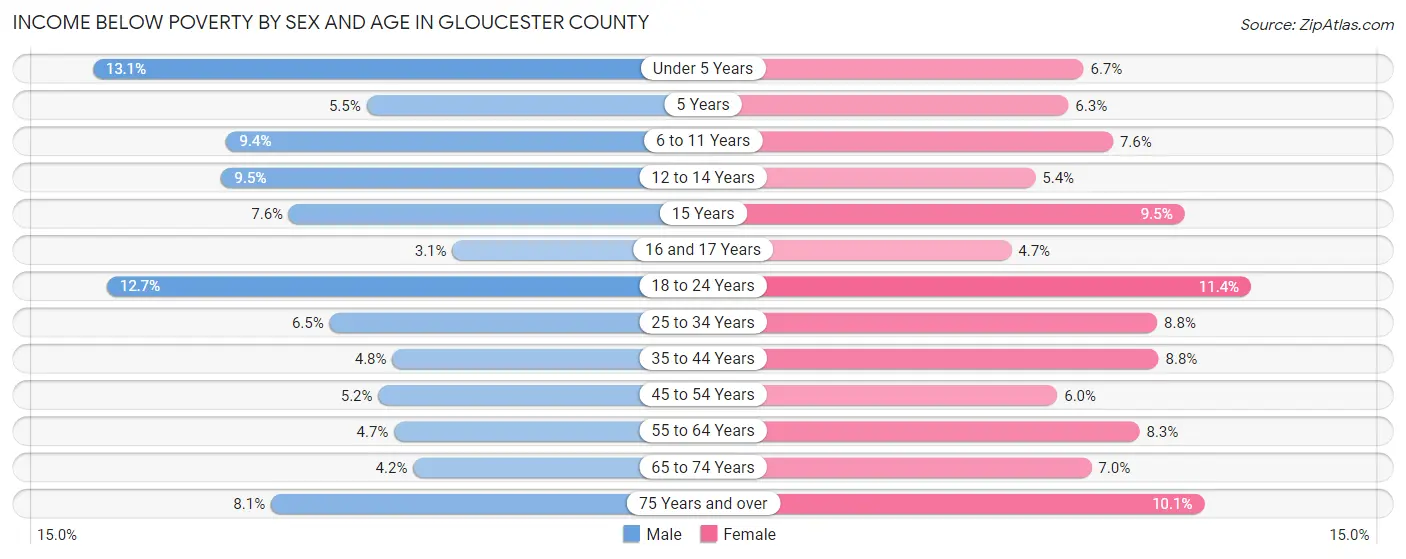
Income Below Poverty by Sex and Age in Gloucester County
With 6.9% poverty level for males and 8.0% for females among the residents of Gloucester County, under 5 year old males and 18 to 24 year old females are the most vulnerable to poverty, with 1,015 males (13.1%) and 1,491 females (11.4%) in their respective age groups living below the poverty level.
| Age Bracket | Male | Female |
| Under 5 Years | 1,015 (13.1%) | 492 (6.7%) |
| 5 Years | 109 (5.5%) | 98 (6.3%) |
| 6 to 11 Years | 1,034 (9.4%) | 833 (7.5%) |
| 12 to 14 Years | 554 (9.5%) | 276 (5.4%) |
| 15 Years | 148 (7.6%) | 207 (9.5%) |
| 16 and 17 Years | 135 (3.1%) | 179 (4.7%) |
| 18 to 24 Years | 1,752 (12.7%) | 1,491 (11.4%) |
| 25 to 34 Years | 1,224 (6.5%) | 1,600 (8.8%) |
| 35 to 44 Years | 882 (4.8%) | 1,719 (8.8%) |
| 45 to 54 Years | 1,022 (5.1%) | 1,258 (6.0%) |
| 55 to 64 Years | 986 (4.7%) | 1,804 (8.3%) |
| 65 to 74 Years | 572 (4.2%) | 1,093 (7.0%) |
| 75 Years and over | 617 (8.1%) | 1,131 (10.1%) |
| Total | 10,050 (6.9%) | 12,181 (8.0%) |
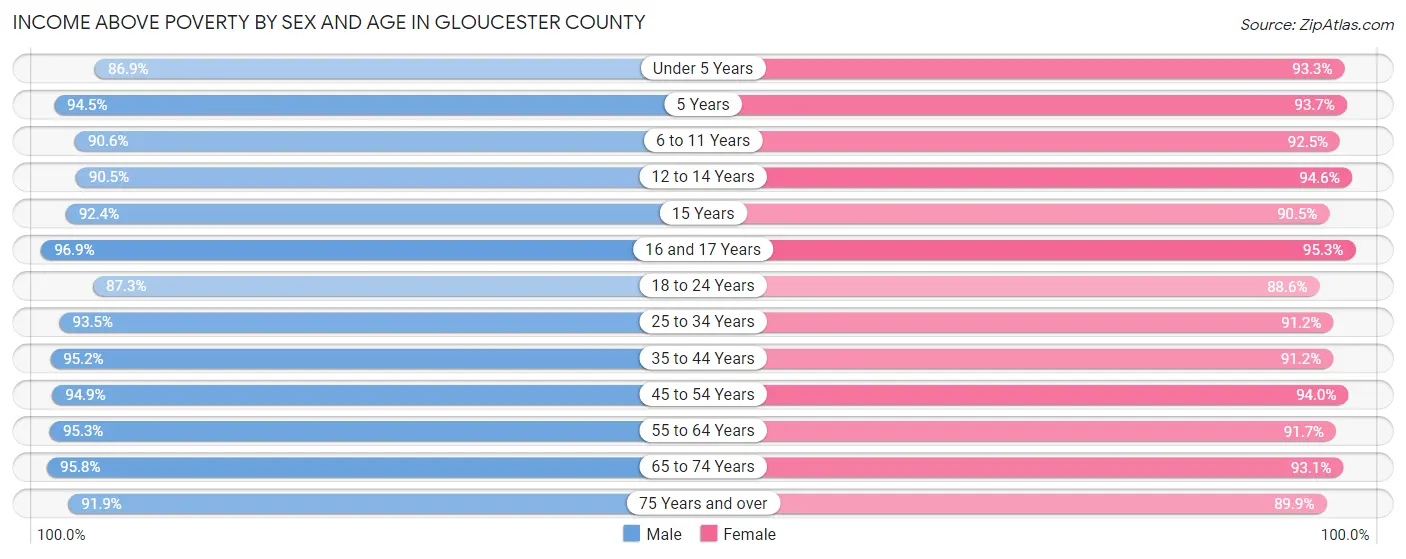
Income Above Poverty by Sex and Age in Gloucester County
According to the poverty statistics in Gloucester County, males aged 16 and 17 years and females aged 16 and 17 years are the age groups that are most secure financially, with 96.9% of males and 95.3% of females in these age groups living above the poverty line.
| Age Bracket | Male | Female |
| Under 5 Years | 6,733 (86.9%) | 6,814 (93.3%) |
| 5 Years | 1,880 (94.5%) | 1,454 (93.7%) |
| 6 to 11 Years | 9,988 (90.6%) | 10,205 (92.4%) |
| 12 to 14 Years | 5,264 (90.5%) | 4,849 (94.6%) |
| 15 Years | 1,789 (92.4%) | 1,963 (90.5%) |
| 16 and 17 Years | 4,235 (96.9%) | 3,611 (95.3%) |
| 18 to 24 Years | 12,036 (87.3%) | 11,601 (88.6%) |
| 25 to 34 Years | 17,579 (93.5%) | 16,629 (91.2%) |
| 35 to 44 Years | 17,650 (95.2%) | 17,764 (91.2%) |
| 45 to 54 Years | 18,822 (94.9%) | 19,719 (94.0%) |
| 55 to 64 Years | 19,933 (95.3%) | 19,951 (91.7%) |
| 65 to 74 Years | 13,125 (95.8%) | 14,634 (93.0%) |
| 75 Years and over | 6,965 (91.9%) | 10,081 (89.9%) |
| Total | 135,999 (93.1%) | 139,275 (92.0%) |
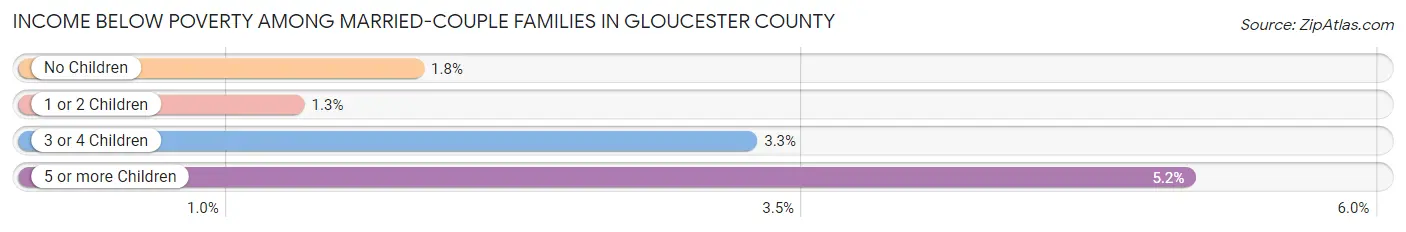
Income Below Poverty Among Married-Couple Families in Gloucester County
The poverty statistics for married-couple families in Gloucester County show that 1.8% or 1,020 of the total 58,008 families live below the poverty line. Families with 5 or more children have the highest poverty rate of 5.2%, comprising of 18 families. On the other hand, families with 1 or 2 children have the lowest poverty rate of 1.3%, which includes 257 families.
| Children | Above Poverty | Below Poverty |
| No Children | 32,759 (98.2%) | 603 (1.8%) |
| 1 or 2 Children | 19,682 (98.7%) | 257 (1.3%) |
| 3 or 4 Children | 4,217 (96.7%) | 142 (3.3%) |
| 5 or more Children | 330 (94.8%) | 18 (5.2%) |
| Total | 56,988 (98.2%) | 1,020 (1.8%) |
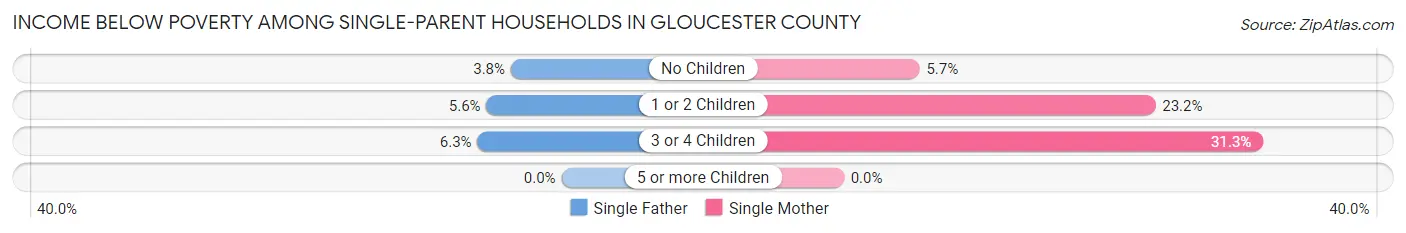
Income Below Poverty Among Single-Parent Households in Gloucester County
According to the poverty data in Gloucester County, 4.7% or 260 single-father households and 16.5% or 2,258 single-mother households are living below the poverty line. Among single-father households, those with 3 or 4 children have the highest poverty rate, with 34 households (6.3%) experiencing poverty. Likewise, among single-mother households, those with 3 or 4 children have the highest poverty rate, with 330 households (31.2%) falling below the poverty line.
| Children | Single Father | Single Mother |
| No Children | 104 (3.8%) | 321 (5.7%) |
| 1 or 2 Children | 122 (5.6%) | 1,607 (23.2%) |
| 3 or 4 Children | 34 (6.3%) | 330 (31.2%) |
| 5 or more Children | 0 (0.0%) | 0 (0.0%) |
| Total | 260 (4.7%) | 2,258 (16.5%) |
Income Below Poverty Among Married-Couple vs Single-Parent Households in Gloucester County
The poverty data for Gloucester County shows that 1,020 of the married-couple family households (1.8%) and 2,518 of the single-parent households (13.1%) are living below the poverty level. Within the married-couple family households, those with 5 or more children have the highest poverty rate, with 18 households (5.2%) falling below the poverty line. Among the single-parent households, those with 3 or 4 children have the highest poverty rate, with 364 household (22.8%) living below poverty.
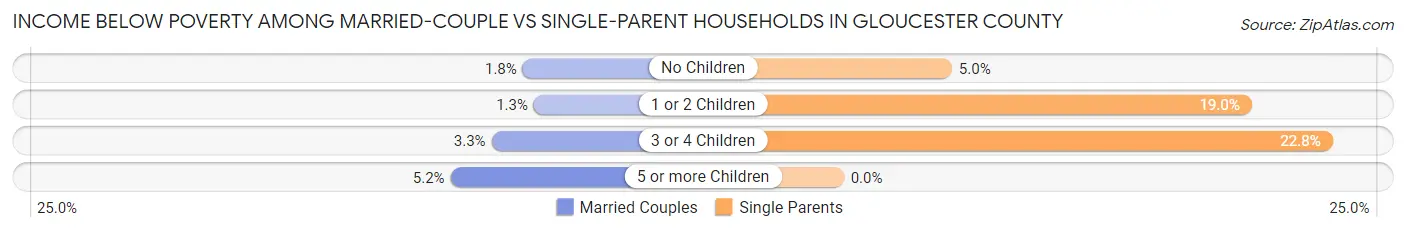
| Children | Married-Couple Families | Single-Parent Households |
| No Children | 603 (1.8%) | 425 (5.0%) |
| 1 or 2 Children | 257 (1.3%) | 1,729 (19.0%) |
| 3 or 4 Children | 142 (3.3%) | 364 (22.8%) |
| 5 or more Children | 18 (5.2%) | 0 (0.0%) |
| Total | 1,020 (1.8%) | 2,518 (13.1%) |
Employment Characteristics in Gloucester County
Employment by Class of Employer in Gloucester County
Among the 152,194 employed individuals in Gloucester County, private company employees (104,223 | 68.5%), local government employees (15,255 | 10.0%), and not-for-profit organizations (12,350 | 8.1%) make up the most common classes of employment.
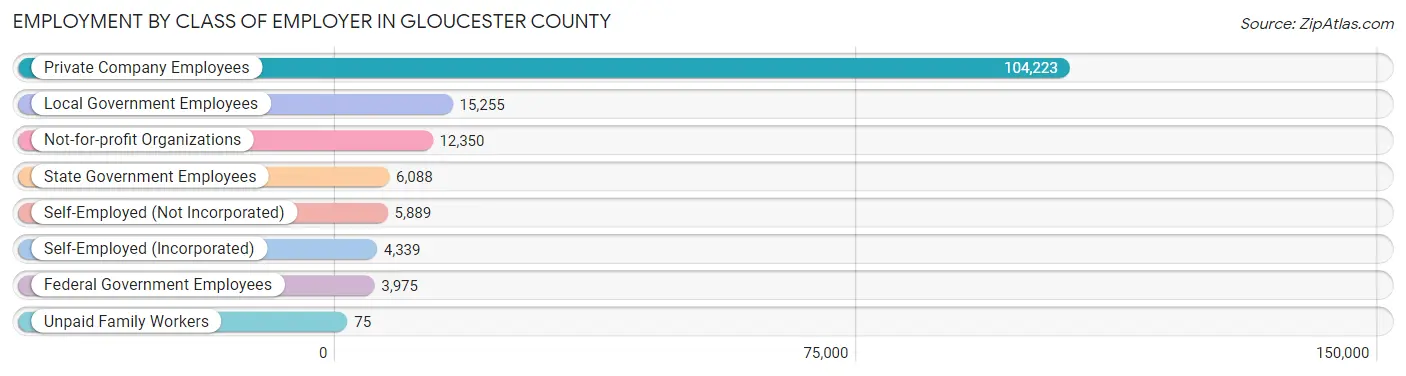
| Employer Class | # Employees | % Employees |
| Private Company Employees | 104,223 | 68.5% |
| Self-Employed (Incorporated) | 4,339 | 2.9% |
| Self-Employed (Not Incorporated) | 5,889 | 3.9% |
| Not-for-profit Organizations | 12,350 | 8.1% |
| Local Government Employees | 15,255 | 10.0% |
| State Government Employees | 6,088 | 4.0% |
| Federal Government Employees | 3,975 | 2.6% |
| Unpaid Family Workers | 75 | 0.1% |
| Total | 152,194 | 100.0% |
Employment Status by Age in Gloucester County
According to the labor force statistics for Gloucester County, out of the total population over 16 years of age (246,367), 66.8% or 164,573 individuals are in the labor force, with 5.2% or 8,558 of them unemployed. The age group with the highest labor force participation rate is 25 to 29 years, with 88.4% or 16,317 individuals in the labor force. Within the labor force, the 16 to 19 years age range has the highest percentage of unemployed individuals, with 17.0% or 1,152 of them being unemployed.
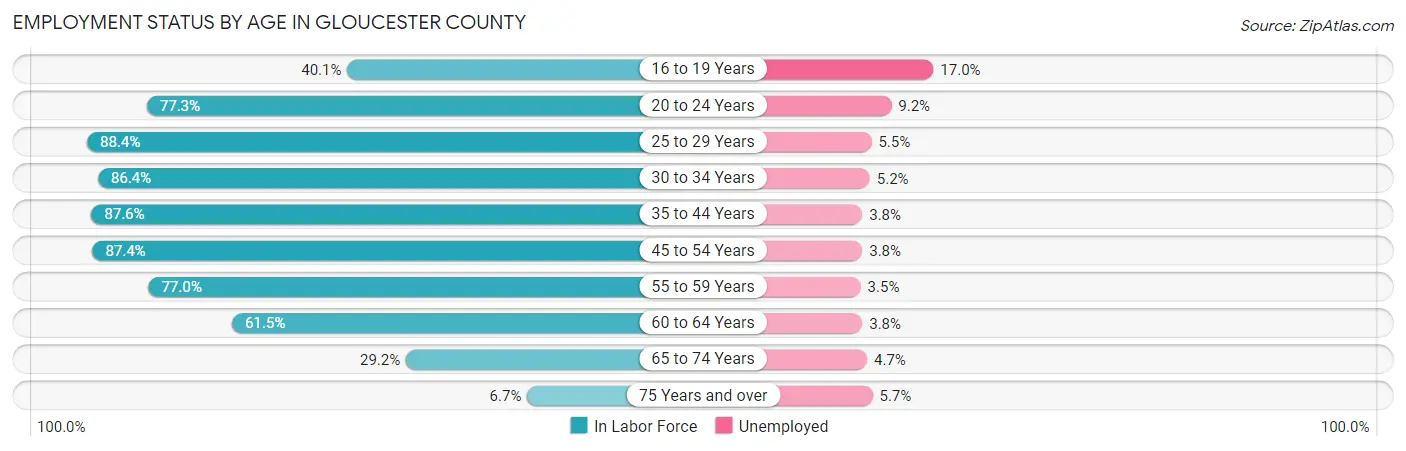
| Age Bracket | In Labor Force | Unemployed |
| 16 to 19 Years | 6,779 (40.1%) | 1,152 (17.0%) |
| 20 to 24 Years | 16,800 (77.3%) | 1,546 (9.2%) |
| 25 to 29 Years | 16,317 (88.4%) | 897 (5.5%) |
| 30 to 34 Years | 16,090 (86.4%) | 837 (5.2%) |
| 35 to 44 Years | 33,301 (87.6%) | 1,265 (3.8%) |
| 45 to 54 Years | 35,709 (87.4%) | 1,357 (3.8%) |
| 55 to 59 Years | 16,681 (77.0%) | 584 (3.5%) |
| 60 to 64 Years | 13,011 (61.5%) | 494 (3.8%) |
| 65 to 74 Years | 8,669 (29.2%) | 407 (4.7%) |
| 75 Years and over | 1,291 (6.7%) | 74 (5.7%) |
| Total | 164,573 (66.8%) | 8,558 (5.2%) |
Employment Status by Educational Attainment in Gloucester County
According to labor force statistics for Gloucester County, 82.6% of individuals (131,146) out of the total population between 25 and 64 years of age (158,772) are in the labor force, with 4.1% or 5,377 of them being unemployed. The group with the highest labor force participation rate are those with the educational attainment of bachelor's degree or higher, with 90.1% or 55,301 individuals in the labor force. Within the labor force, individuals with less than high school education have the highest percentage of unemployment, with 8.7% or 443 of them being unemployed.
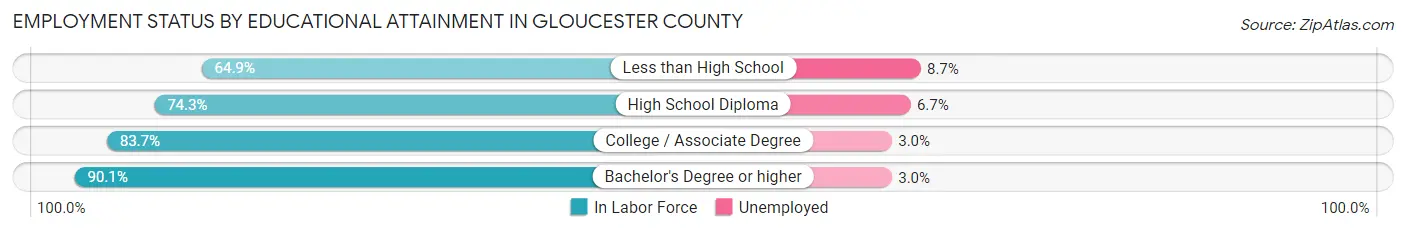
| Educational Attainment | In Labor Force | Unemployed |
| Less than High School | 5,095 (64.9%) | 683 (8.7%) |
| High School Diploma | 33,140 (74.3%) | 2,988 (6.7%) |
| College / Associate Degree | 37,616 (83.7%) | 1,348 (3.0%) |
| Bachelor's Degree or higher | 55,301 (90.1%) | 1,841 (3.0%) |
| Total | 131,146 (82.6%) | 6,510 (4.1%) |
Employment Occupations by Sex in Gloucester County
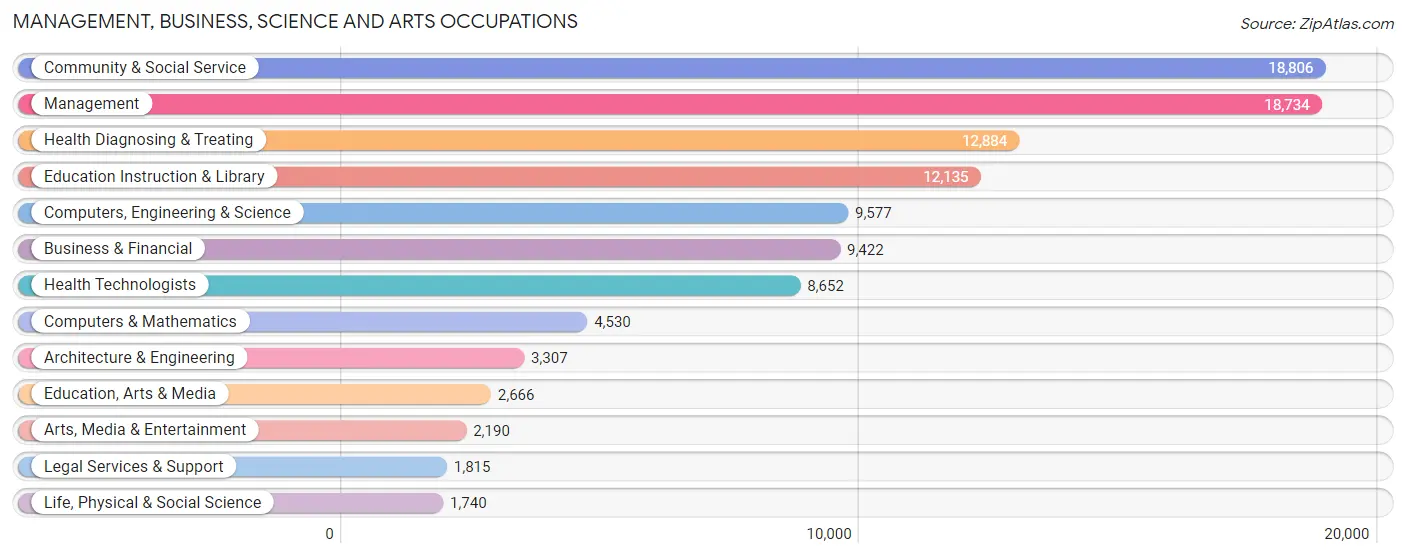
Management, Business, Science and Arts Occupations
The most common Management, Business, Science and Arts occupations in Gloucester County are Community & Social Service (18,806 | 12.1%), Management (18,734 | 12.0%), Health Diagnosing & Treating (12,884 | 8.3%), Education Instruction & Library (12,135 | 7.8%), and Computers, Engineering & Science (9,577 | 6.1%).
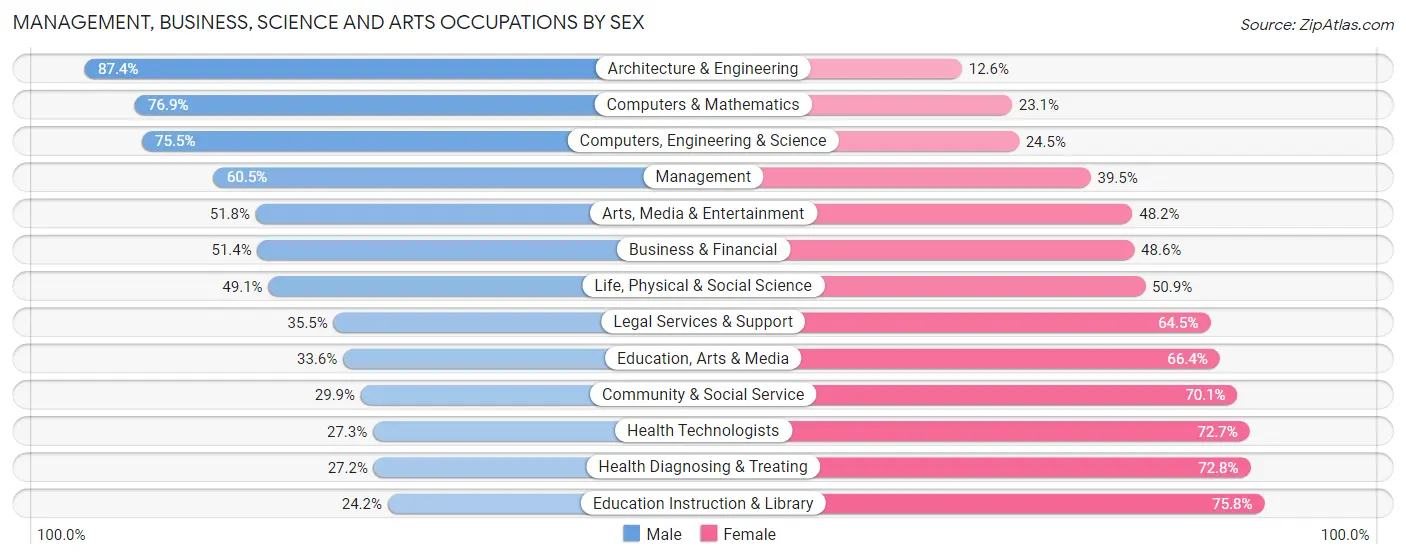
Management, Business, Science and Arts Occupations by Sex
Within the Management, Business, Science and Arts occupations in Gloucester County, the most male-oriented occupations are Architecture & Engineering (87.4%), Computers & Mathematics (76.9%), and Computers, Engineering & Science (75.5%), while the most female-oriented occupations are Education Instruction & Library (75.8%), Health Diagnosing & Treating (72.8%), and Health Technologists (72.7%).
| Occupation | Male | Female |
| Management | 11,334 (60.5%) | 7,400 (39.5%) |
| Business & Financial | 4,843 (51.4%) | 4,579 (48.6%) |
| Computers, Engineering & Science | 7,229 (75.5%) | 2,348 (24.5%) |
| Computers & Mathematics | 3,485 (76.9%) | 1,045 (23.1%) |
| Architecture & Engineering | 2,889 (87.4%) | 418 (12.6%) |
| Life, Physical & Social Science | 855 (49.1%) | 885 (50.9%) |
| Community & Social Service | 5,615 (29.9%) | 13,191 (70.1%) |
| Education, Arts & Media | 895 (33.6%) | 1,771 (66.4%) |
| Legal Services & Support | 645 (35.5%) | 1,170 (64.5%) |
| Education Instruction & Library | 2,941 (24.2%) | 9,194 (75.8%) |
| Arts, Media & Entertainment | 1,134 (51.8%) | 1,056 (48.2%) |
| Health Diagnosing & Treating | 3,500 (27.2%) | 9,384 (72.8%) |
| Health Technologists | 2,364 (27.3%) | 6,288 (72.7%) |
| Total (Category) | 32,521 (46.8%) | 36,902 (53.2%) |
| Total (Overall) | 80,122 (51.4%) | 75,669 (48.6%) |
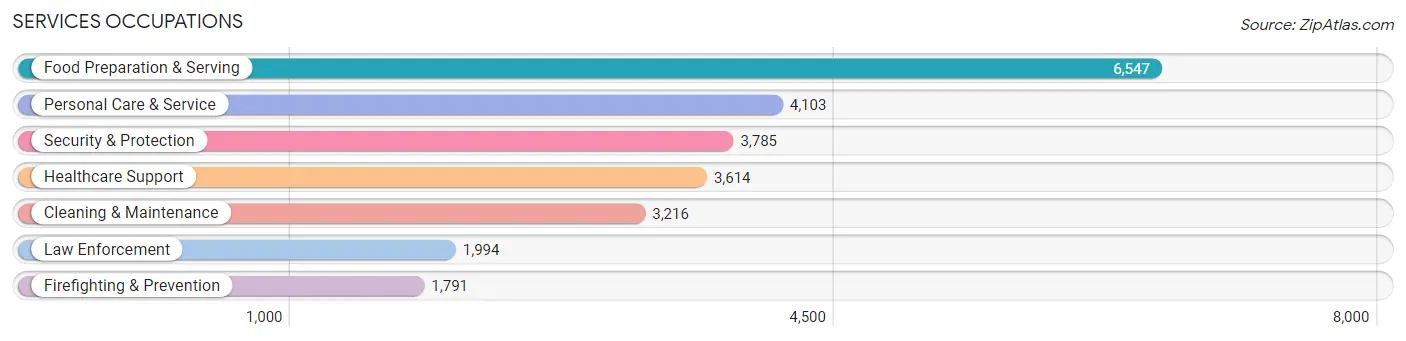
Services Occupations
The most common Services occupations in Gloucester County are Food Preparation & Serving (6,547 | 4.2%), Personal Care & Service (4,103 | 2.6%), Security & Protection (3,785 | 2.4%), Healthcare Support (3,614 | 2.3%), and Cleaning & Maintenance (3,216 | 2.1%).
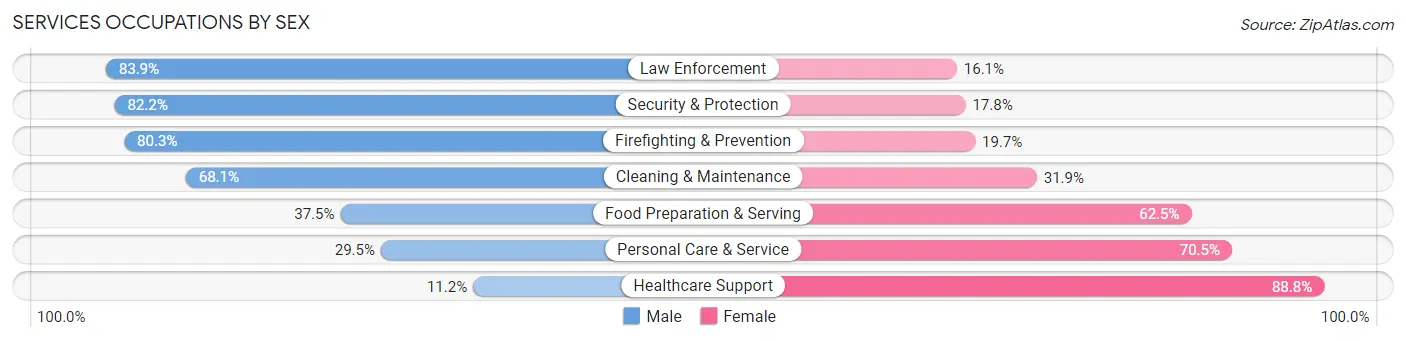
Services Occupations by Sex
Within the Services occupations in Gloucester County, the most male-oriented occupations are Law Enforcement (83.9%), Security & Protection (82.2%), and Firefighting & Prevention (80.3%), while the most female-oriented occupations are Healthcare Support (88.8%), Personal Care & Service (70.5%), and Food Preparation & Serving (62.5%).
| Occupation | Male | Female |
| Healthcare Support | 405 (11.2%) | 3,209 (88.8%) |
| Security & Protection | 3,111 (82.2%) | 674 (17.8%) |
| Firefighting & Prevention | 1,438 (80.3%) | 353 (19.7%) |
| Law Enforcement | 1,673 (83.9%) | 321 (16.1%) |
| Food Preparation & Serving | 2,454 (37.5%) | 4,093 (62.5%) |
| Cleaning & Maintenance | 2,189 (68.1%) | 1,027 (31.9%) |
| Personal Care & Service | 1,209 (29.5%) | 2,894 (70.5%) |
| Total (Category) | 9,368 (44.1%) | 11,897 (55.9%) |
| Total (Overall) | 80,122 (51.4%) | 75,669 (48.6%) |
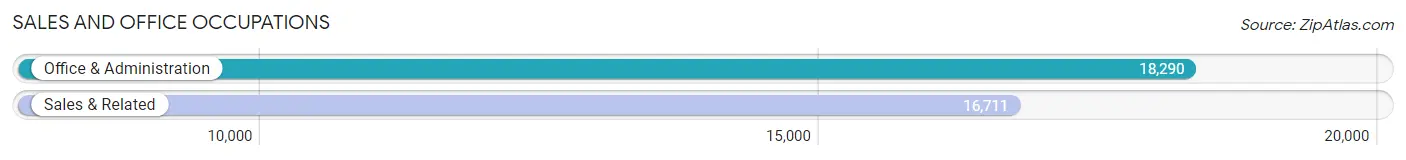
Sales and Office Occupations
The most common Sales and Office occupations in Gloucester County are Office & Administration (18,290 | 11.7%), and Sales & Related (16,711 | 10.7%).
Sales and Office Occupations by Sex
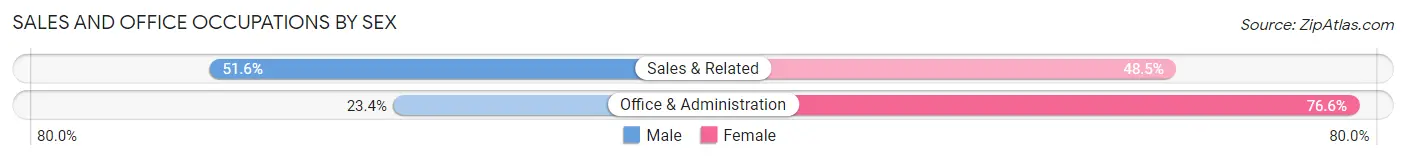
| Occupation | Male | Female |
| Sales & Related | 8,614 (51.5%) | 8,097 (48.4%) |
| Office & Administration | 4,272 (23.4%) | 14,018 (76.6%) |
| Total (Category) | 12,886 (36.8%) | 22,115 (63.2%) |
| Total (Overall) | 80,122 (51.4%) | 75,669 (48.6%) |
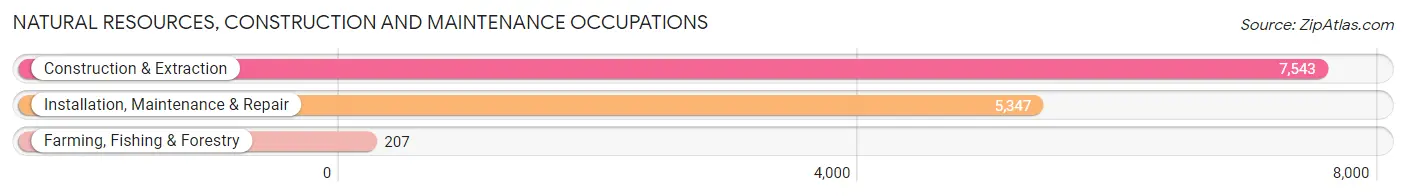
Natural Resources, Construction and Maintenance Occupations
The most common Natural Resources, Construction and Maintenance occupations in Gloucester County are Construction & Extraction (7,543 | 4.8%), Installation, Maintenance & Repair (5,347 | 3.4%), and Farming, Fishing & Forestry (207 | 0.1%).
Natural Resources, Construction and Maintenance Occupations by Sex
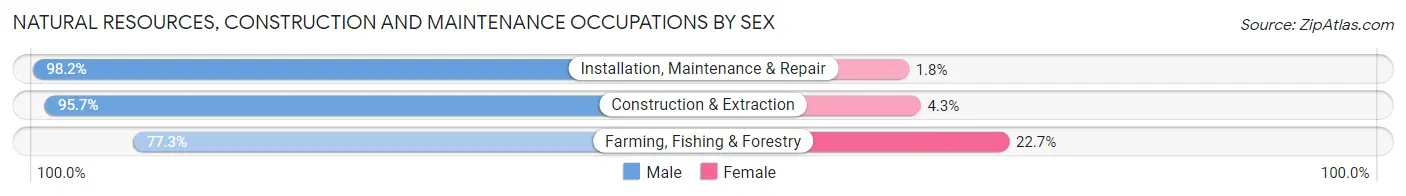
| Occupation | Male | Female |
| Farming, Fishing & Forestry | 160 (77.3%) | 47 (22.7%) |
| Construction & Extraction | 7,221 (95.7%) | 322 (4.3%) |
| Installation, Maintenance & Repair | 5,249 (98.2%) | 98 (1.8%) |
| Total (Category) | 12,630 (96.4%) | 467 (3.6%) |
| Total (Overall) | 80,122 (51.4%) | 75,669 (48.6%) |
Production, Transportation and Moving Occupations
The most common Production, Transportation and Moving occupations in Gloucester County are Transportation (5,961 | 3.8%), Material Moving (5,902 | 3.8%), and Production (5,142 | 3.3%).
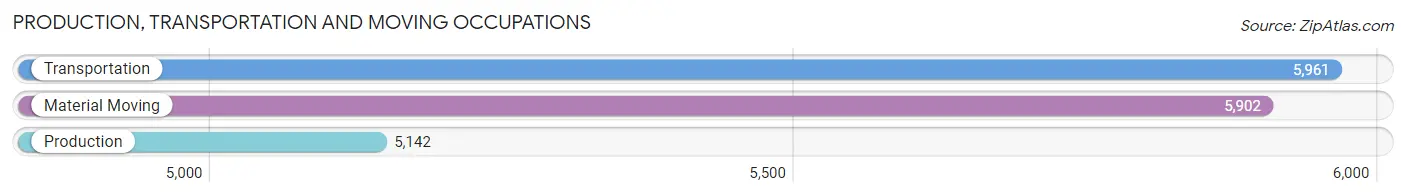
Production, Transportation and Moving Occupations by Sex
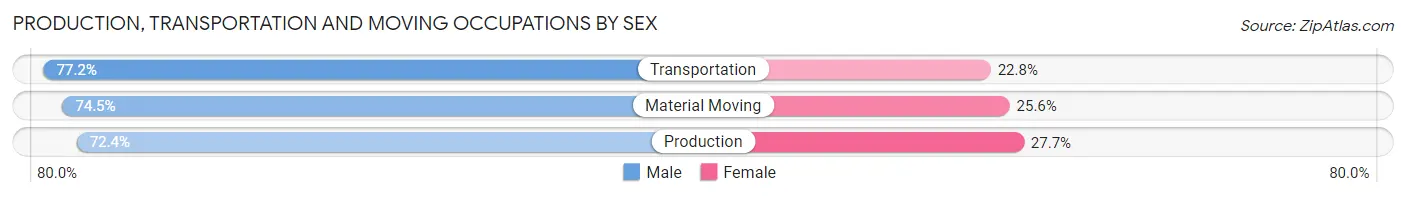
| Occupation | Male | Female |
| Production | 3,720 (72.4%) | 1,422 (27.7%) |
| Transportation | 4,603 (77.2%) | 1,358 (22.8%) |
| Material Moving | 4,394 (74.5%) | 1,508 (25.6%) |
| Total (Category) | 12,717 (74.8%) | 4,288 (25.2%) |
| Total (Overall) | 80,122 (51.4%) | 75,669 (48.6%) |
Employment Industries by Sex in Gloucester County
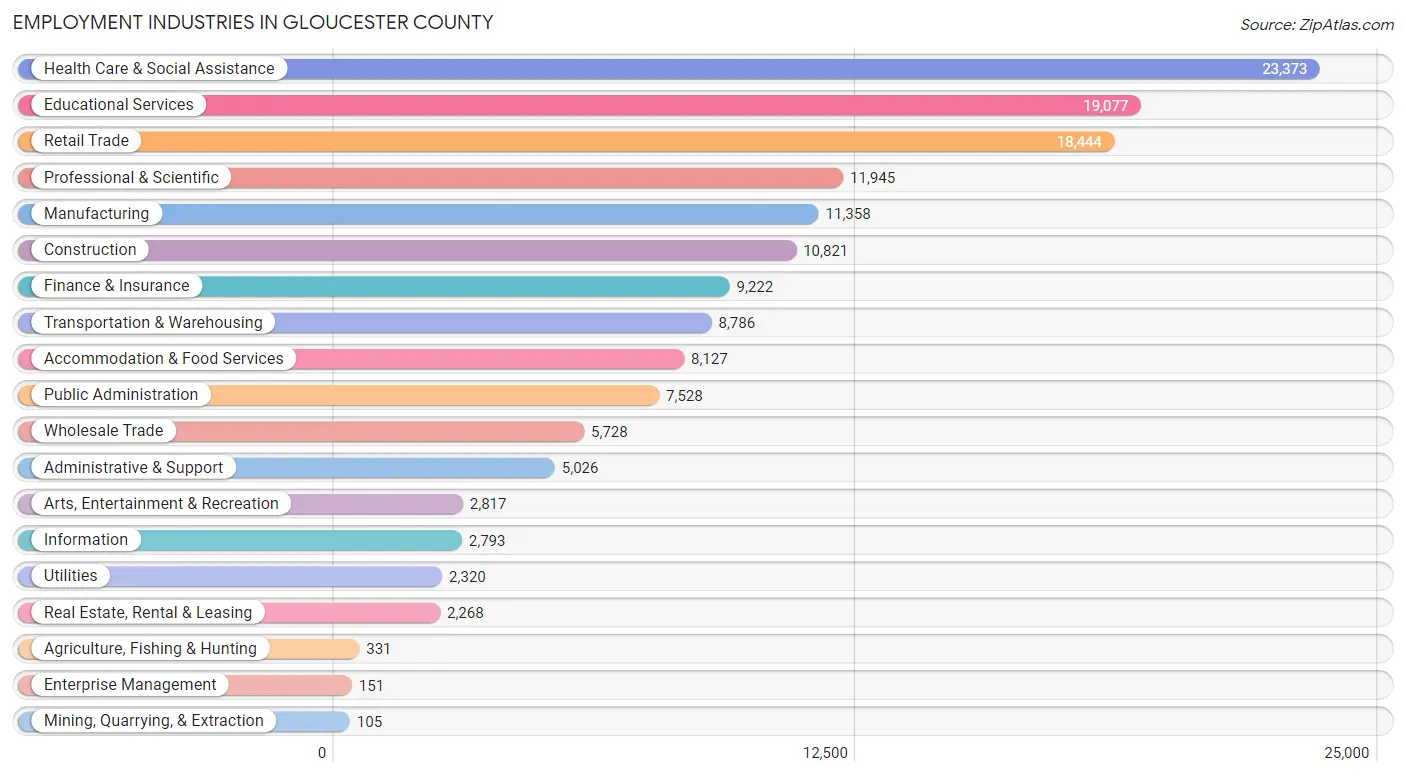
Employment Industries in Gloucester County
The major employment industries in Gloucester County include Health Care & Social Assistance (23,373 | 15.0%), Educational Services (19,077 | 12.2%), Retail Trade (18,444 | 11.8%), Professional & Scientific (11,945 | 7.7%), and Manufacturing (11,358 | 7.3%).
Employment Industries by Sex in Gloucester County
The Gloucester County industries that see more men than women are Construction (90.2%), Mining, Quarrying, & Extraction (83.8%), and Utilities (82.5%), whereas the industries that tend to have a higher number of women are Health Care & Social Assistance (76.0%), Enterprise Management (74.2%), and Educational Services (71.6%).
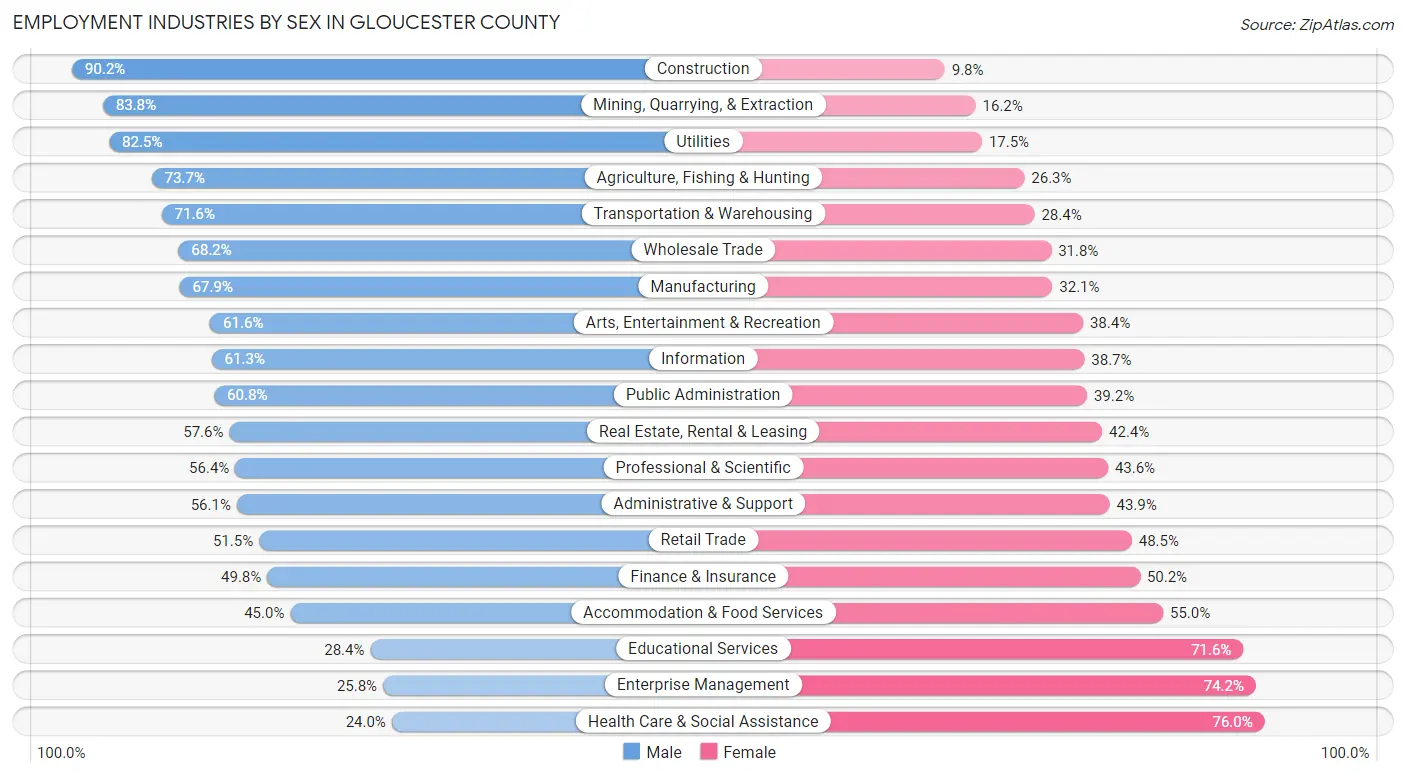
| Industry | Male | Female |
| Agriculture, Fishing & Hunting | 244 (73.7%) | 87 (26.3%) |
| Mining, Quarrying, & Extraction | 88 (83.8%) | 17 (16.2%) |
| Construction | 9,761 (90.2%) | 1,060 (9.8%) |
| Manufacturing | 7,716 (67.9%) | 3,642 (32.1%) |
| Wholesale Trade | 3,905 (68.2%) | 1,823 (31.8%) |
| Retail Trade | 9,495 (51.5%) | 8,949 (48.5%) |
| Transportation & Warehousing | 6,293 (71.6%) | 2,493 (28.4%) |
| Utilities | 1,914 (82.5%) | 406 (17.5%) |
| Information | 1,712 (61.3%) | 1,081 (38.7%) |
| Finance & Insurance | 4,593 (49.8%) | 4,629 (50.2%) |
| Real Estate, Rental & Leasing | 1,307 (57.6%) | 961 (42.4%) |
| Professional & Scientific | 6,739 (56.4%) | 5,206 (43.6%) |
| Enterprise Management | 39 (25.8%) | 112 (74.2%) |
| Administrative & Support | 2,819 (56.1%) | 2,207 (43.9%) |
| Educational Services | 5,425 (28.4%) | 13,652 (71.6%) |
| Health Care & Social Assistance | 5,615 (24.0%) | 17,758 (76.0%) |
| Arts, Entertainment & Recreation | 1,735 (61.6%) | 1,082 (38.4%) |
| Accommodation & Food Services | 3,659 (45.0%) | 4,468 (55.0%) |
| Public Administration | 4,574 (60.8%) | 2,954 (39.2%) |
| Total | 80,122 (51.4%) | 75,669 (48.6%) |
Education in Gloucester County
School Enrollment in Gloucester County
The most common levels of schooling among the 76,082 students in Gloucester County are college / undergraduate (18,871 | 24.8%), high school (15,661 | 20.6%), and middle school (14,890 | 19.6%).
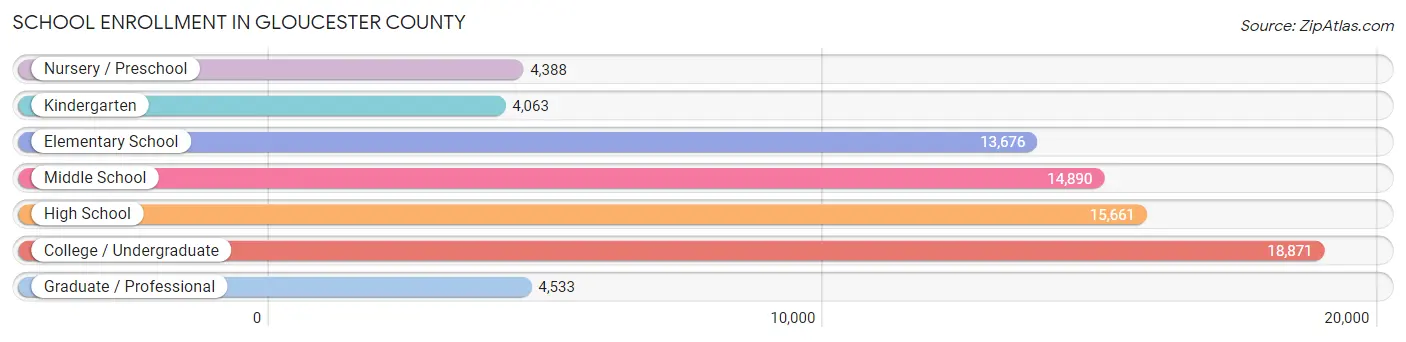
| School Level | # Students | % Students |
| Nursery / Preschool | 4,388 | 5.8% |
| Kindergarten | 4,063 | 5.3% |
| Elementary School | 13,676 | 18.0% |
| Middle School | 14,890 | 19.6% |
| High School | 15,661 | 20.6% |
| College / Undergraduate | 18,871 | 24.8% |
| Graduate / Professional | 4,533 | 6.0% |
| Total | 76,082 | 100.0% |
School Enrollment by Age by Funding Source in Gloucester County
Out of a total of 76,082 students who are enrolled in schools in Gloucester County, 12,173 (16.0%) attend a private institution, while the remaining 63,909 (84.0%) are enrolled in public schools. The age group of 3 to 4 year olds has the highest likelihood of being enrolled in private schools, with 1,364 (44.5% in the age bracket) enrolled. Conversely, the age group of 10 to 14 year olds has the lowest likelihood of being enrolled in a private school, with 15,859 (90.5% in the age bracket) attending a public institution.
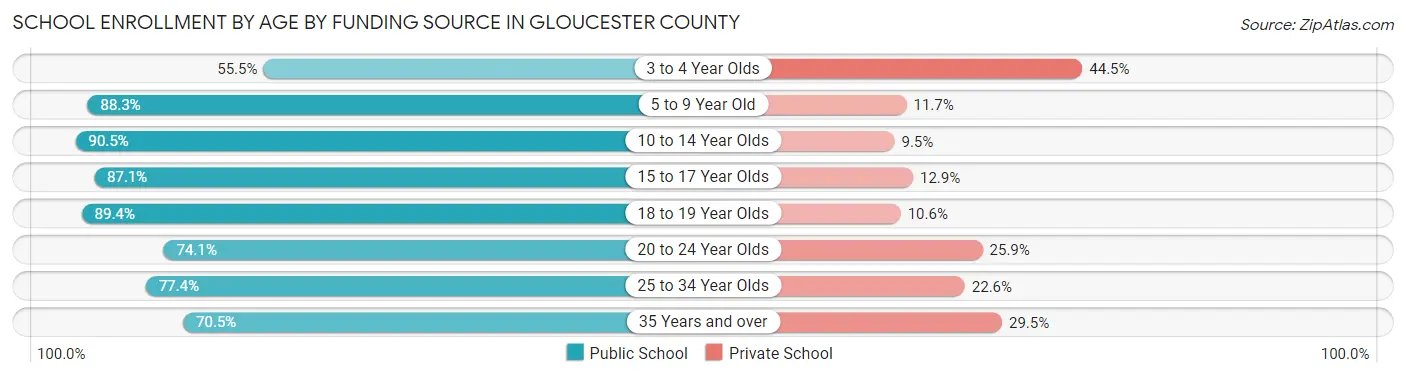
| Age Bracket | Public School | Private School |
| 3 to 4 Year Olds | 1,704 (55.5%) | 1,364 (44.5%) |
| 5 to 9 Year Old | 15,718 (88.3%) | 2,085 (11.7%) |
| 10 to 14 Year Olds | 15,859 (90.5%) | 1,658 (9.5%) |
| 15 to 17 Year Olds | 10,471 (87.1%) | 1,553 (12.9%) |
| 18 to 19 Year Olds | 6,557 (89.4%) | 780 (10.6%) |
| 20 to 24 Year Olds | 8,163 (74.1%) | 2,850 (25.9%) |
| 25 to 34 Year Olds | 3,132 (77.4%) | 913 (22.6%) |
| 35 Years and over | 2,309 (70.5%) | 966 (29.5%) |
| Total | 63,909 (84.0%) | 12,173 (16.0%) |
Educational Attainment by Field of Study in Gloucester County
Business (16,033 | 20.6%), education (11,455 | 14.7%), science & technology (9,553 | 12.2%), social sciences (5,020 | 6.4%), and arts & humanities (4,764 | 6.1%) are the most common fields of study among 77,999 individuals in Gloucester County who have obtained a bachelor's degree or higher.
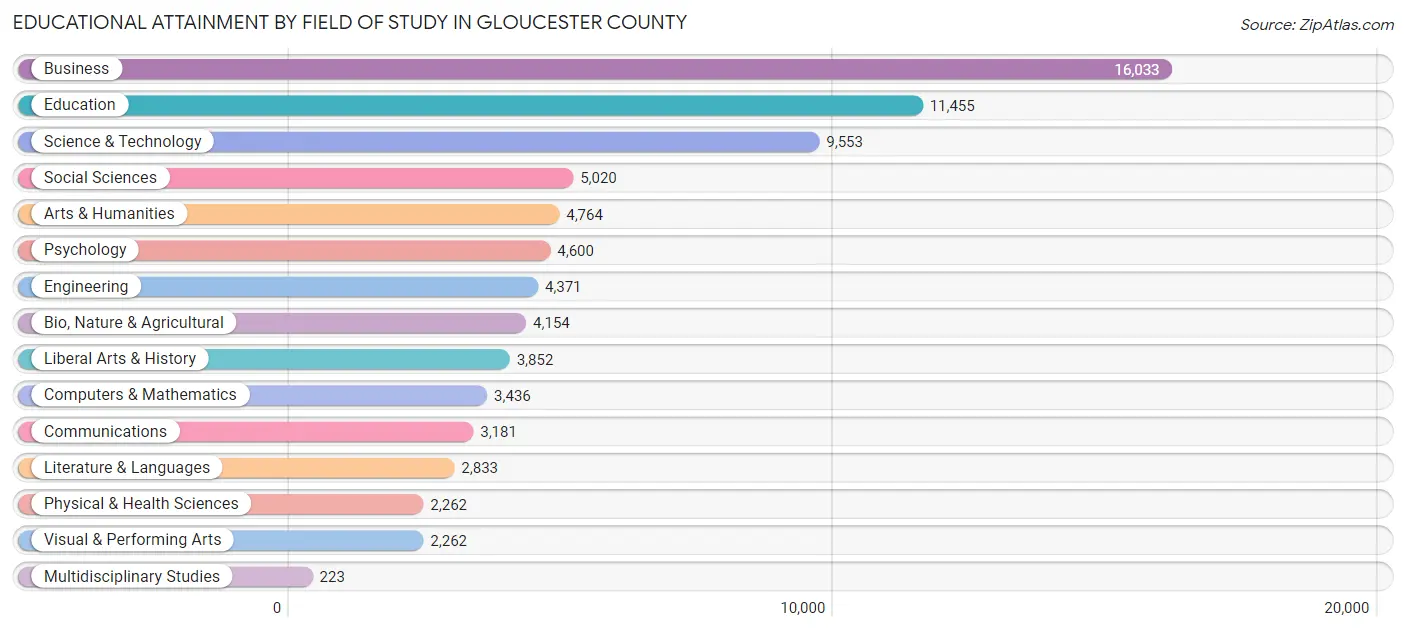
| Field of Study | # Graduates | % Graduates |
| Computers & Mathematics | 3,436 | 4.4% |
| Bio, Nature & Agricultural | 4,154 | 5.3% |
| Physical & Health Sciences | 2,262 | 2.9% |
| Psychology | 4,600 | 5.9% |
| Social Sciences | 5,020 | 6.4% |
| Engineering | 4,371 | 5.6% |
| Multidisciplinary Studies | 223 | 0.3% |
| Science & Technology | 9,553 | 12.2% |
| Business | 16,033 | 20.6% |
| Education | 11,455 | 14.7% |
| Literature & Languages | 2,833 | 3.6% |
| Liberal Arts & History | 3,852 | 4.9% |
| Visual & Performing Arts | 2,262 | 2.9% |
| Communications | 3,181 | 4.1% |
| Arts & Humanities | 4,764 | 6.1% |
| Total | 77,999 | 100.0% |
Transportation & Commute in Gloucester County
Vehicle Availability by Sex in Gloucester County
The most prevalent vehicle ownership categories in Gloucester County are males with 2 vehicles (34,051, accounting for 43.5%) and females with 2 vehicles (31,118, making up 47.0%).
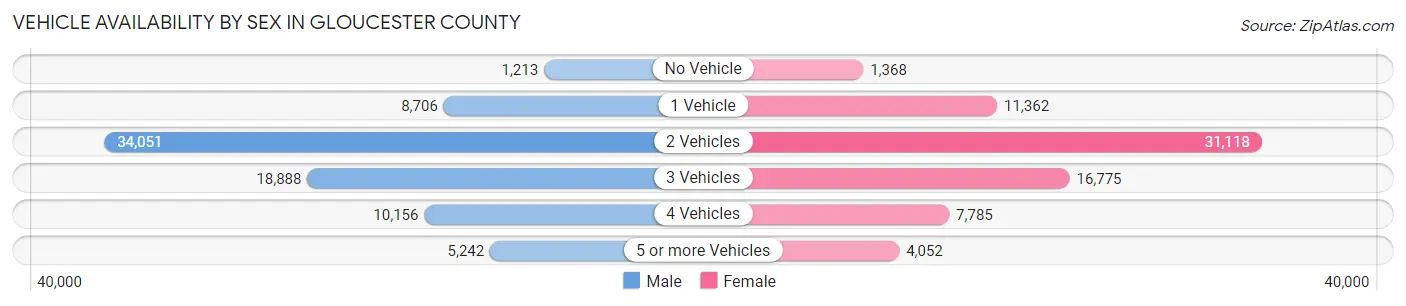
| Vehicles Available | Male | Female |
| No Vehicle | 1,213 (1.5%) | 1,368 (1.9%) |
| 1 Vehicle | 8,706 (11.1%) | 11,362 (15.7%) |
| 2 Vehicles | 34,051 (43.5%) | 31,118 (42.9%) |
| 3 Vehicles | 18,888 (24.1%) | 16,775 (23.2%) |
| 4 Vehicles | 10,156 (13.0%) | 7,785 (10.7%) |
| 5 or more Vehicles | 5,242 (6.7%) | 4,052 (5.6%) |
| Total | 78,256 (100.0%) | 72,460 (100.0%) |
Commute Time in Gloucester County
The most frequently occuring commute durations in Gloucester County are 30 to 34 minutes (18,895 commuters, 14.0%), 20 to 24 minutes (17,121 commuters, 12.7%), and 15 to 19 minutes (16,413 commuters, 12.2%).
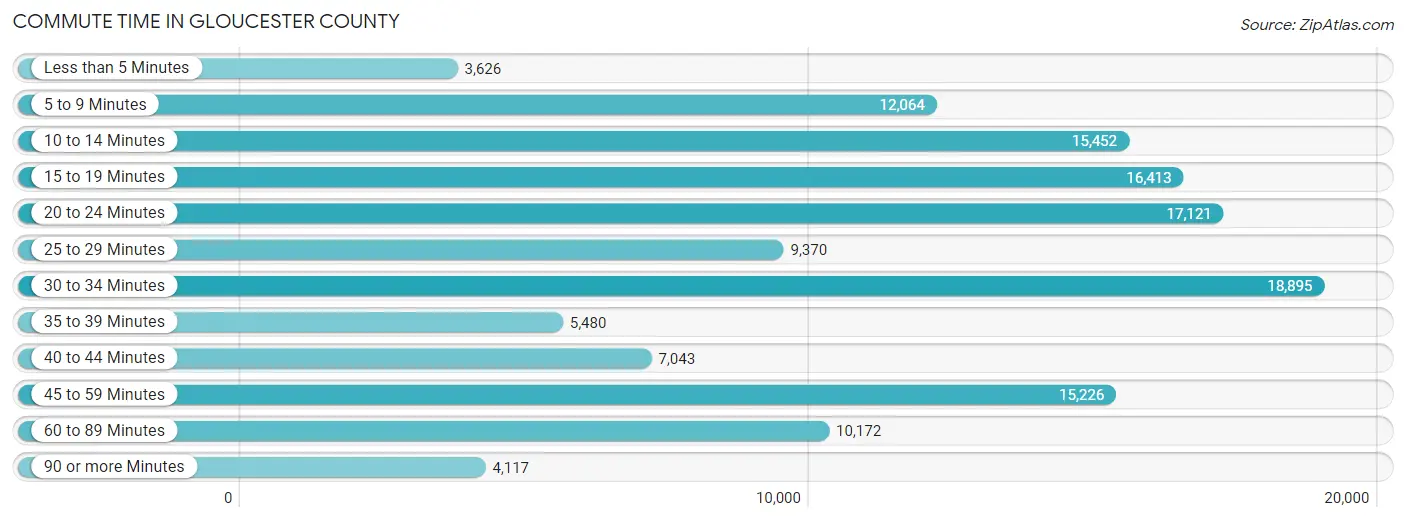
| Commute Time | # Commuters | % Commuters |
| Less than 5 Minutes | 3,626 | 2.7% |
| 5 to 9 Minutes | 12,064 | 8.9% |
| 10 to 14 Minutes | 15,452 | 11.5% |
| 15 to 19 Minutes | 16,413 | 12.2% |
| 20 to 24 Minutes | 17,121 | 12.7% |
| 25 to 29 Minutes | 9,370 | 6.9% |
| 30 to 34 Minutes | 18,895 | 14.0% |
| 35 to 39 Minutes | 5,480 | 4.1% |
| 40 to 44 Minutes | 7,043 | 5.2% |
| 45 to 59 Minutes | 15,226 | 11.3% |
| 60 to 89 Minutes | 10,172 | 7.5% |
| 90 or more Minutes | 4,117 | 3.0% |
Commute Time by Sex in Gloucester County
The most common commute times in Gloucester County are 30 to 34 minutes (10,239 commuters, 14.5%) for males and 15 to 19 minutes (9,162 commuters, 14.2%) for females.
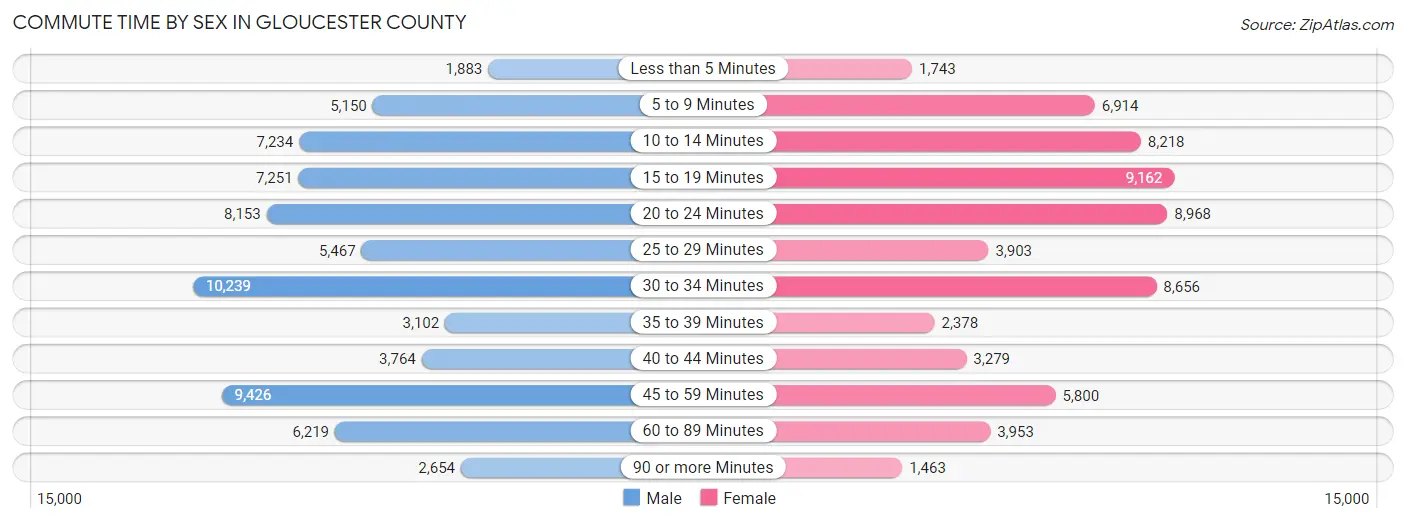
| Commute Time | Male | Female |
| Less than 5 Minutes | 1,883 (2.7%) | 1,743 (2.7%) |
| 5 to 9 Minutes | 5,150 (7.3%) | 6,914 (10.7%) |
| 10 to 14 Minutes | 7,234 (10.2%) | 8,218 (12.8%) |
| 15 to 19 Minutes | 7,251 (10.3%) | 9,162 (14.2%) |
| 20 to 24 Minutes | 8,153 (11.6%) | 8,968 (13.9%) |
| 25 to 29 Minutes | 5,467 (7.7%) | 3,903 (6.1%) |
| 30 to 34 Minutes | 10,239 (14.5%) | 8,656 (13.4%) |
| 35 to 39 Minutes | 3,102 (4.4%) | 2,378 (3.7%) |
| 40 to 44 Minutes | 3,764 (5.3%) | 3,279 (5.1%) |
| 45 to 59 Minutes | 9,426 (13.4%) | 5,800 (9.0%) |
| 60 to 89 Minutes | 6,219 (8.8%) | 3,953 (6.1%) |
| 90 or more Minutes | 2,654 (3.8%) | 1,463 (2.3%) |
Time of Departure to Work by Sex in Gloucester County
The most frequent times of departure to work in Gloucester County are 7:00 AM to 7:29 AM (9,513, 13.5%) for males and 7:00 AM to 7:29 AM (9,875, 15.3%) for females.
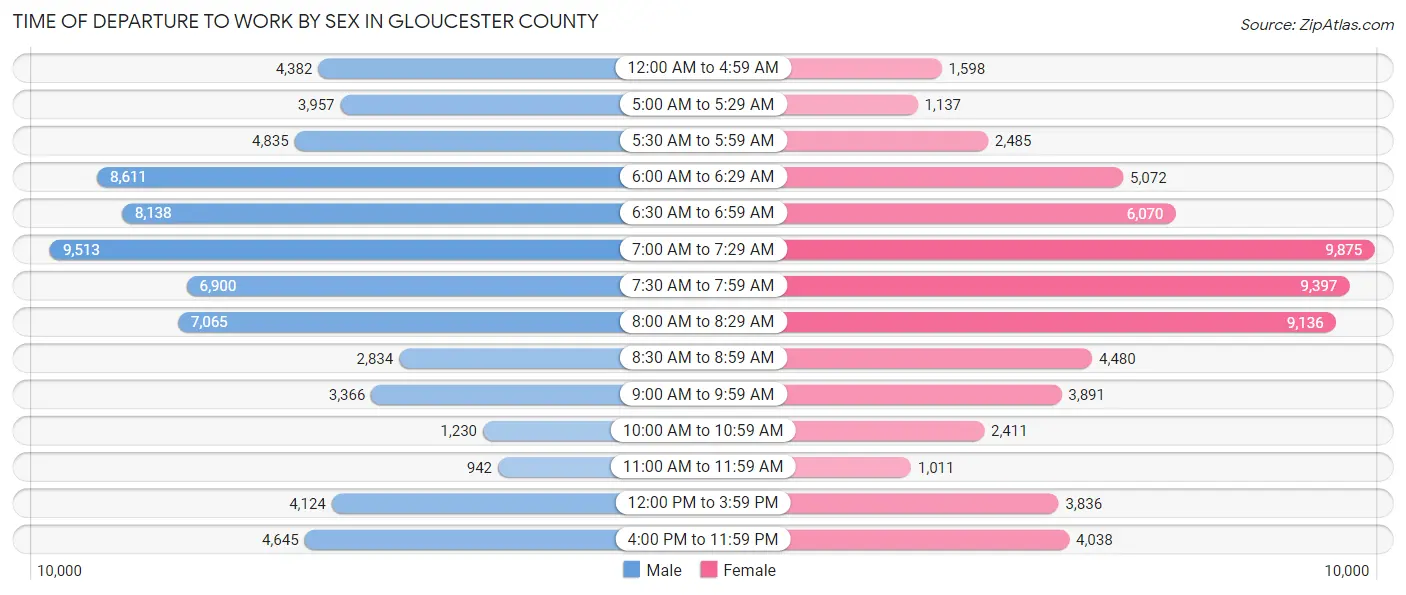
| Time of Departure | Male | Female |
| 12:00 AM to 4:59 AM | 4,382 (6.2%) | 1,598 (2.5%) |
| 5:00 AM to 5:29 AM | 3,957 (5.6%) | 1,137 (1.8%) |
| 5:30 AM to 5:59 AM | 4,835 (6.9%) | 2,485 (3.9%) |
| 6:00 AM to 6:29 AM | 8,611 (12.2%) | 5,072 (7.9%) |
| 6:30 AM to 6:59 AM | 8,138 (11.5%) | 6,070 (9.4%) |
| 7:00 AM to 7:29 AM | 9,513 (13.5%) | 9,875 (15.3%) |
| 7:30 AM to 7:59 AM | 6,900 (9.8%) | 9,397 (14.6%) |
| 8:00 AM to 8:29 AM | 7,065 (10.0%) | 9,136 (14.2%) |
| 8:30 AM to 8:59 AM | 2,834 (4.0%) | 4,480 (7.0%) |
| 9:00 AM to 9:59 AM | 3,366 (4.8%) | 3,891 (6.0%) |
| 10:00 AM to 10:59 AM | 1,230 (1.7%) | 2,411 (3.7%) |
| 11:00 AM to 11:59 AM | 942 (1.3%) | 1,011 (1.6%) |
| 12:00 PM to 3:59 PM | 4,124 (5.9%) | 3,836 (5.9%) |
| 4:00 PM to 11:59 PM | 4,645 (6.6%) | 4,038 (6.3%) |
| Total | 70,542 (100.0%) | 64,437 (100.0%) |
Housing Occupancy in Gloucester County
Occupancy by Ownership in Gloucester County
Of the total 109,996 dwellings in Gloucester County, owner-occupied units account for 87,641 (79.7%), while renter-occupied units make up 22,355 (20.3%).
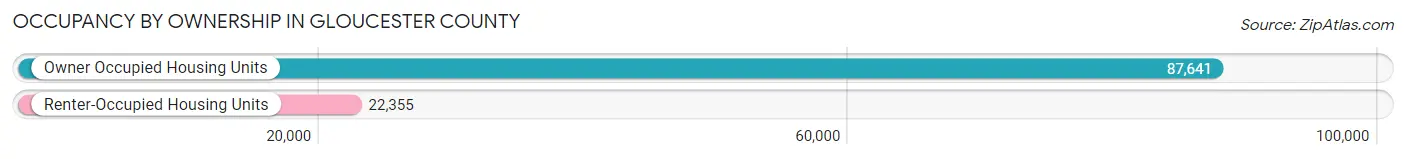
| Occupancy | # Housing Units | % Housing Units |
| Owner Occupied Housing Units | 87,641 | 79.7% |
| Renter-Occupied Housing Units | 22,355 | 20.3% |
| Total Occupied Housing Units | 109,996 | 100.0% |
Occupancy by Household Size in Gloucester County
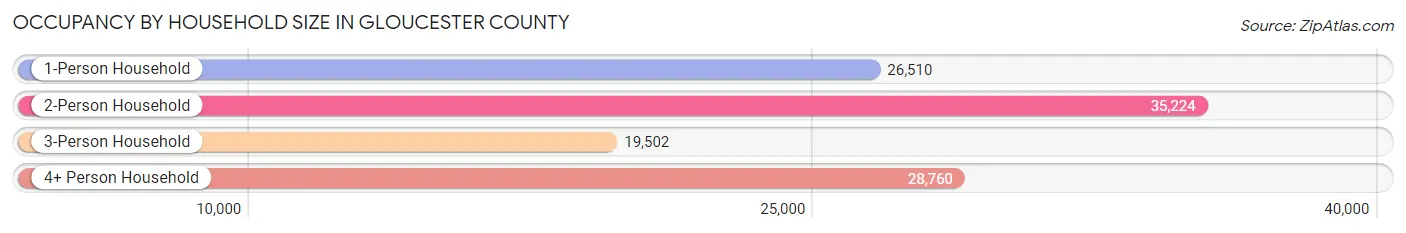
| Household Size | # Housing Units | % Housing Units |
| 1-Person Household | 26,510 | 24.1% |
| 2-Person Household | 35,224 | 32.0% |
| 3-Person Household | 19,502 | 17.7% |
| 4+ Person Household | 28,760 | 26.2% |
| Total Housing Units | 109,996 | 100.0% |
Occupancy by Ownership by Household Size in Gloucester County

| Household Size | Owner-occupied | Renter-occupied |
| 1-Person Household | 17,131 (64.6%) | 9,379 (35.4%) |
| 2-Person Household | 29,635 (84.1%) | 5,589 (15.9%) |
| 3-Person Household | 16,194 (83.0%) | 3,308 (17.0%) |
| 4+ Person Household | 24,681 (85.8%) | 4,079 (14.2%) |
| Total Housing Units | 87,641 (79.7%) | 22,355 (20.3%) |
Occupancy by Educational Attainment in Gloucester County
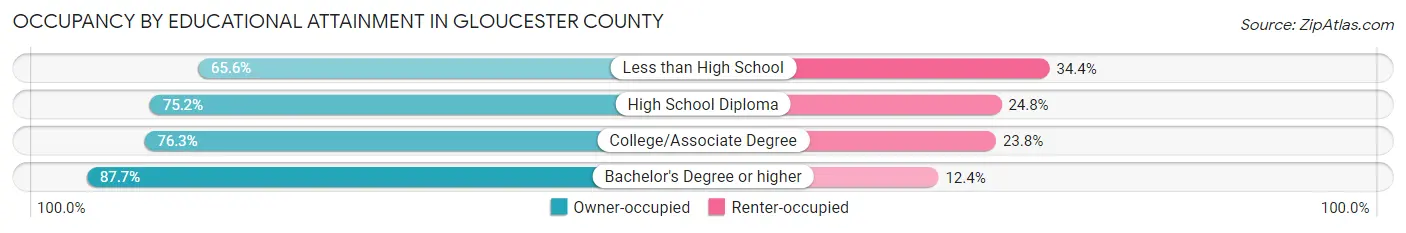
| Household Size | Owner-occupied | Renter-occupied |
| Less than High School | 3,932 (65.6%) | 2,059 (34.4%) |
| High School Diploma | 23,256 (75.2%) | 7,687 (24.8%) |
| College/Associate Degree | 23,990 (76.2%) | 7,471 (23.7%) |
| Bachelor's Degree or higher | 36,463 (87.6%) | 5,138 (12.3%) |
Occupancy by Age of Householder in Gloucester County
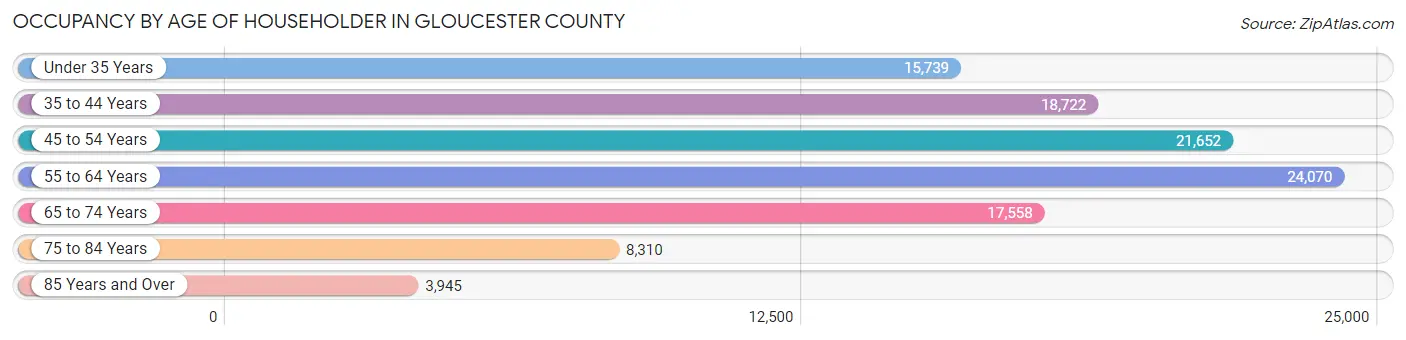
| Age Bracket | # Households | % Households |
| Under 35 Years | 15,739 | 14.3% |
| 35 to 44 Years | 18,722 | 17.0% |
| 45 to 54 Years | 21,652 | 19.7% |
| 55 to 64 Years | 24,070 | 21.9% |
| 65 to 74 Years | 17,558 | 16.0% |
| 75 to 84 Years | 8,310 | 7.5% |
| 85 Years and Over | 3,945 | 3.6% |
| Total | 109,996 | 100.0% |
Housing Finances in Gloucester County
Median Income by Occupancy in Gloucester County
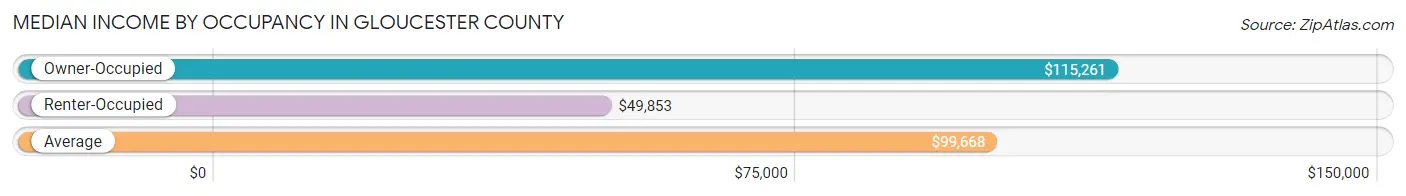
| Occupancy Type | # Households | Median Income |
| Owner-Occupied | 87,641 (79.7%) | $115,261 |
| Renter-Occupied | 22,355 (20.3%) | $49,853 |
| Average | 109,996 (100.0%) | $99,668 |
Occupancy by Householder Income Bracket in Gloucester County
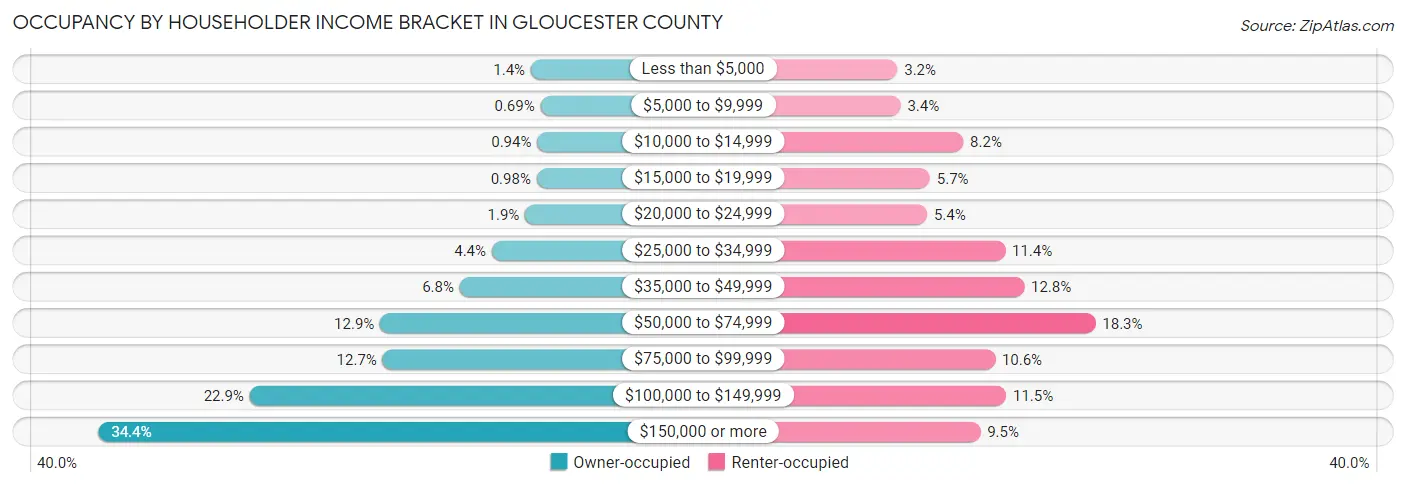
| Income Bracket | Owner-occupied | Renter-occupied |
| Less than $5,000 | 1,246 (1.4%) | 712 (3.2%) |
| $5,000 to $9,999 | 605 (0.7%) | 765 (3.4%) |
| $10,000 to $14,999 | 821 (0.9%) | 1,832 (8.2%) |
| $15,000 to $19,999 | 855 (1.0%) | 1,265 (5.7%) |
| $20,000 to $24,999 | 1,632 (1.9%) | 1,217 (5.4%) |
| $25,000 to $34,999 | 3,859 (4.4%) | 2,546 (11.4%) |
| $35,000 to $49,999 | 5,999 (6.8%) | 2,871 (12.8%) |
| $50,000 to $74,999 | 11,318 (12.9%) | 4,084 (18.3%) |
| $75,000 to $99,999 | 11,150 (12.7%) | 2,375 (10.6%) |
| $100,000 to $149,999 | 20,024 (22.9%) | 2,564 (11.5%) |
| $150,000 or more | 30,132 (34.4%) | 2,124 (9.5%) |
| Total | 87,641 (100.0%) | 22,355 (100.0%) |
Monthly Housing Cost Tiers in Gloucester County
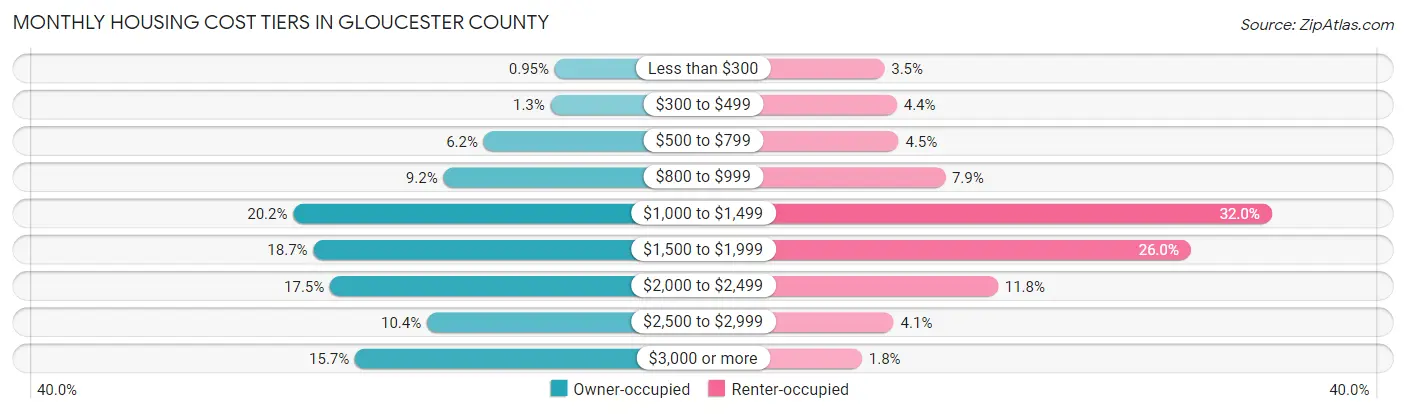
| Monthly Cost | Owner-occupied | Renter-occupied |
| Less than $300 | 831 (0.9%) | 771 (3.5%) |
| $300 to $499 | 1,103 (1.3%) | 976 (4.4%) |
| $500 to $799 | 5,418 (6.2%) | 1,007 (4.5%) |
| $800 to $999 | 8,015 (9.1%) | 1,771 (7.9%) |
| $1,000 to $1,499 | 17,715 (20.2%) | 7,149 (32.0%) |
| $1,500 to $1,999 | 16,417 (18.7%) | 5,817 (26.0%) |
| $2,000 to $2,499 | 15,337 (17.5%) | 2,641 (11.8%) |
| $2,500 to $2,999 | 9,080 (10.4%) | 925 (4.1%) |
| $3,000 or more | 13,725 (15.7%) | 402 (1.8%) |
| Total | 87,641 (100.0%) | 22,355 (100.0%) |
Physical Housing Characteristics in Gloucester County
Housing Structures in Gloucester County
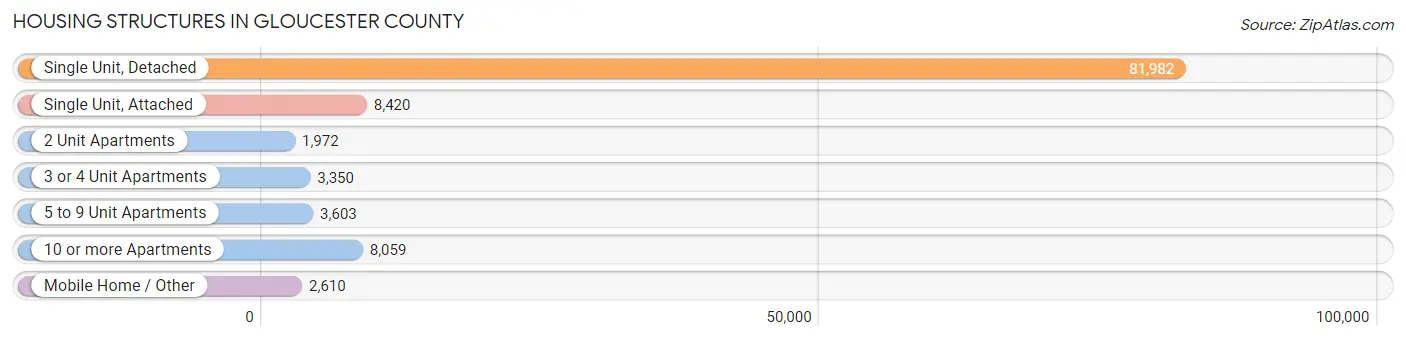
| Structure Type | # Housing Units | % Housing Units |
| Single Unit, Detached | 81,982 | 74.5% |
| Single Unit, Attached | 8,420 | 7.6% |
| 2 Unit Apartments | 1,972 | 1.8% |
| 3 or 4 Unit Apartments | 3,350 | 3.0% |
| 5 to 9 Unit Apartments | 3,603 | 3.3% |
| 10 or more Apartments | 8,059 | 7.3% |
| Mobile Home / Other | 2,610 | 2.4% |
| Total | 109,996 | 100.0% |
Housing Structures by Occupancy in Gloucester County
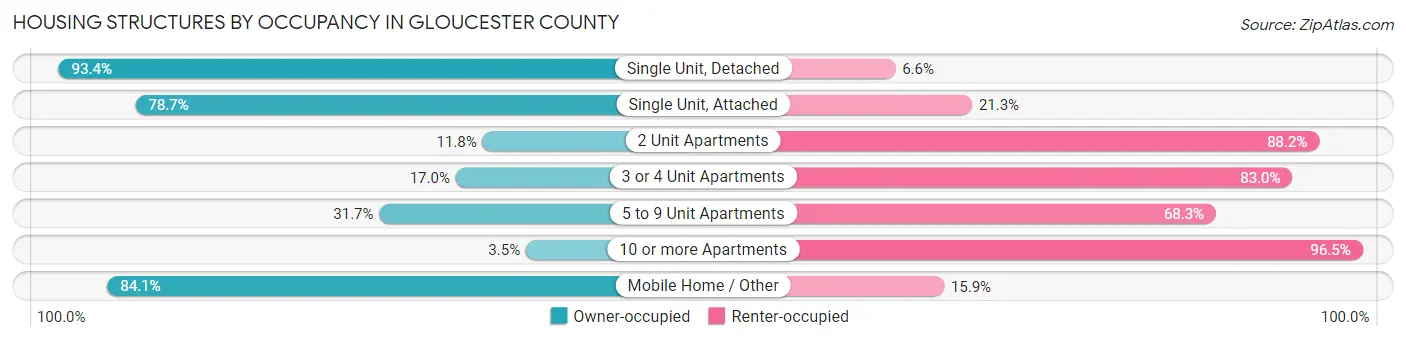
| Structure Type | Owner-occupied | Renter-occupied |
| Single Unit, Detached | 76,600 (93.4%) | 5,382 (6.6%) |
| Single Unit, Attached | 6,624 (78.7%) | 1,796 (21.3%) |
| 2 Unit Apartments | 233 (11.8%) | 1,739 (88.2%) |
| 3 or 4 Unit Apartments | 569 (17.0%) | 2,781 (83.0%) |
| 5 to 9 Unit Apartments | 1,142 (31.7%) | 2,461 (68.3%) |
| 10 or more Apartments | 279 (3.5%) | 7,780 (96.5%) |
| Mobile Home / Other | 2,194 (84.1%) | 416 (15.9%) |
| Total | 87,641 (79.7%) | 22,355 (20.3%) |
Housing Structures by Number of Rooms in Gloucester County
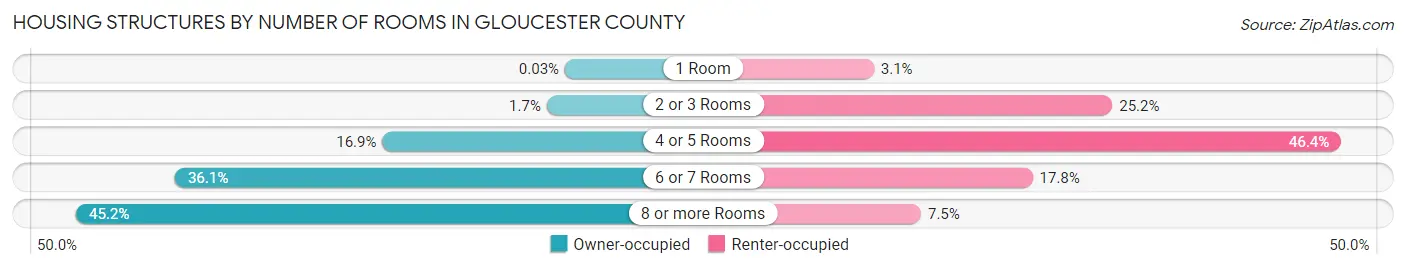
| Number of Rooms | Owner-occupied | Renter-occupied |
| 1 Room | 28 (0.0%) | 701 (3.1%) |
| 2 or 3 Rooms | 1,501 (1.7%) | 5,632 (25.2%) |
| 4 or 5 Rooms | 14,826 (16.9%) | 10,361 (46.4%) |
| 6 or 7 Rooms | 31,634 (36.1%) | 3,984 (17.8%) |
| 8 or more Rooms | 39,652 (45.2%) | 1,677 (7.5%) |
| Total | 87,641 (100.0%) | 22,355 (100.0%) |
Housing Structure by Heating Type in Gloucester County
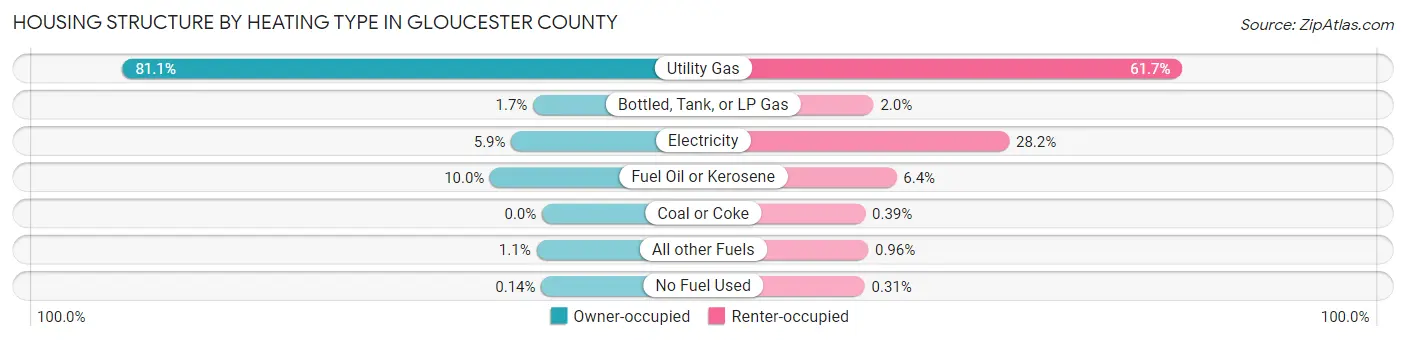
| Heating Type | Owner-occupied | Renter-occupied |
| Utility Gas | 71,056 (81.1%) | 13,790 (61.7%) |
| Bottled, Tank, or LP Gas | 1,518 (1.7%) | 450 (2.0%) |
| Electricity | 5,208 (5.9%) | 6,306 (28.2%) |
| Fuel Oil or Kerosene | 8,791 (10.0%) | 1,437 (6.4%) |
| Coal or Coke | 0 (0.0%) | 88 (0.4%) |
| All other Fuels | 948 (1.1%) | 214 (1.0%) |
| No Fuel Used | 120 (0.1%) | 70 (0.3%) |
| Total | 87,641 (100.0%) | 22,355 (100.0%) |
Household Vehicle Usage in Gloucester County
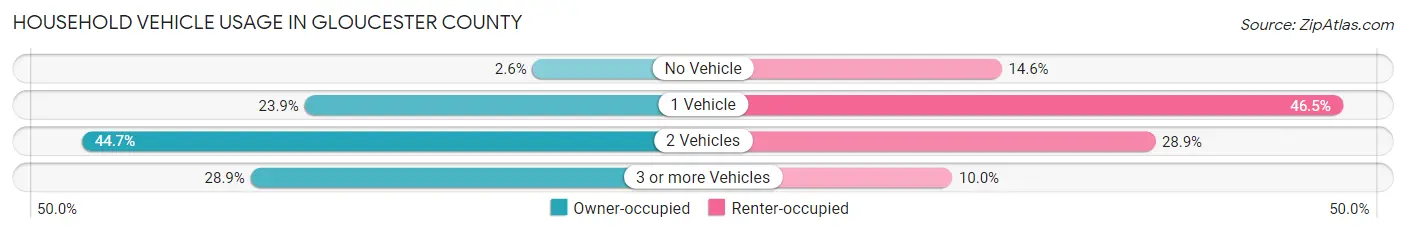
| Vehicles per Household | Owner-occupied | Renter-occupied |
| No Vehicle | 2,269 (2.6%) | 3,267 (14.6%) |
| 1 Vehicle | 20,915 (23.9%) | 10,385 (46.5%) |
| 2 Vehicles | 39,128 (44.7%) | 6,470 (28.9%) |
| 3 or more Vehicles | 25,329 (28.9%) | 2,233 (10.0%) |
| Total | 87,641 (100.0%) | 22,355 (100.0%) |
Real Estate & Mortgages in Gloucester County
Real Estate and Mortgage Overview in Gloucester County
| Characteristic | Without Mortgage | With Mortgage |
| Housing Units | 28,292 | 59,349 |
| Median Property Value | $236,400 | $277,900 |
| Median Household Income | $79,937 | $24,233 |
| Monthly Housing Costs | $1,013 | $13,659 |
| Real Estate Taxes | $7,323 | $1,407 |
Property Value by Mortgage Status in Gloucester County
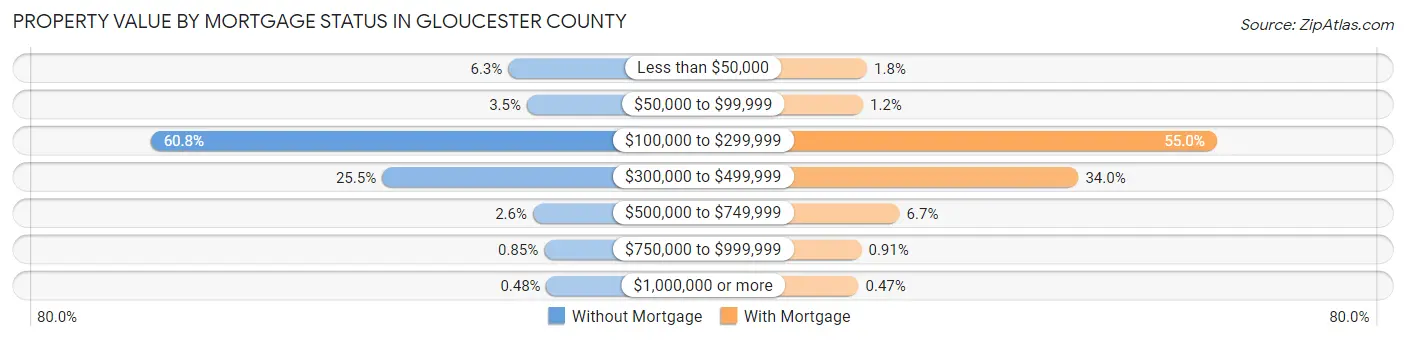
| Property Value | Without Mortgage | With Mortgage |
| Less than $50,000 | 1,789 (6.3%) | 1,052 (1.8%) |
| $50,000 to $99,999 | 981 (3.5%) | 683 (1.1%) |
| $100,000 to $299,999 | 17,197 (60.8%) | 32,651 (55.0%) |
| $300,000 to $499,999 | 7,226 (25.5%) | 20,160 (34.0%) |
| $500,000 to $749,999 | 723 (2.6%) | 3,986 (6.7%) |
| $750,000 to $999,999 | 240 (0.9%) | 541 (0.9%) |
| $1,000,000 or more | 136 (0.5%) | 276 (0.5%) |
| Total | 28,292 (100.0%) | 59,349 (100.0%) |
Household Income by Mortgage Status in Gloucester County
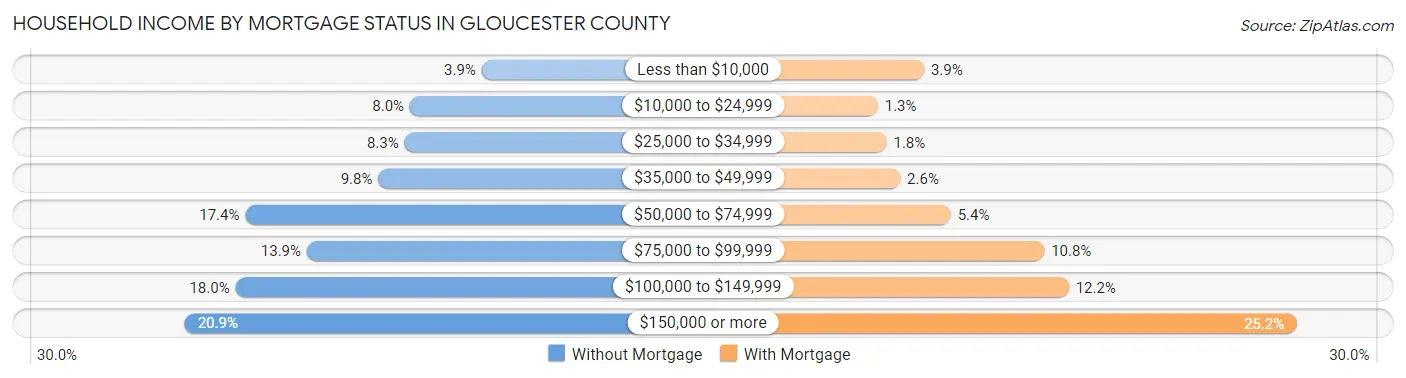
| Household Income | Without Mortgage | With Mortgage |
| Less than $10,000 | 1,098 (3.9%) | 2,318 (3.9%) |
| $10,000 to $24,999 | 2,257 (8.0%) | 753 (1.3%) |
| $25,000 to $34,999 | 2,345 (8.3%) | 1,051 (1.8%) |
| $35,000 to $49,999 | 2,771 (9.8%) | 1,514 (2.5%) |
| $50,000 to $74,999 | 4,920 (17.4%) | 3,228 (5.4%) |
| $75,000 to $99,999 | 3,923 (13.9%) | 6,398 (10.8%) |
| $100,000 to $149,999 | 5,079 (17.9%) | 7,227 (12.2%) |
| $150,000 or more | 5,899 (20.8%) | 14,945 (25.2%) |
| Total | 28,292 (100.0%) | 59,349 (100.0%) |
Property Value to Household Income Ratio in Gloucester County
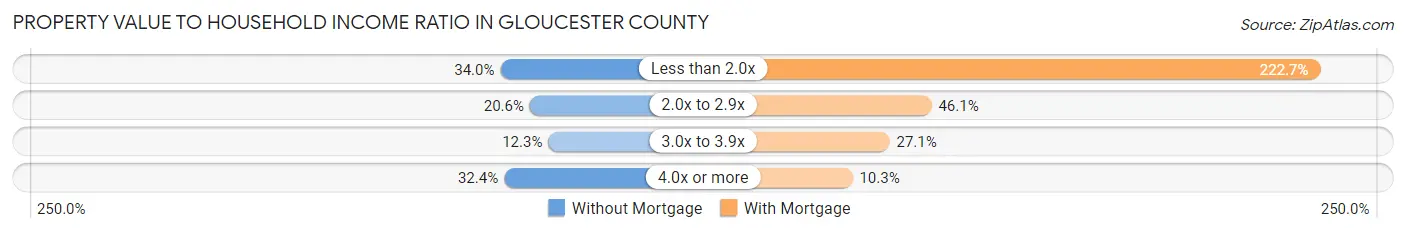
| Value-to-Income Ratio | Without Mortgage | With Mortgage |
| Less than 2.0x | 9,624 (34.0%) | 132,139 (222.7%) |
| 2.0x to 2.9x | 5,837 (20.6%) | 27,365 (46.1%) |
| 3.0x to 3.9x | 3,468 (12.3%) | 16,057 (27.1%) |
| 4.0x or more | 9,153 (32.4%) | 6,085 (10.2%) |
| Total | 28,292 (100.0%) | 59,349 (100.0%) |
Real Estate Taxes by Mortgage Status in Gloucester County
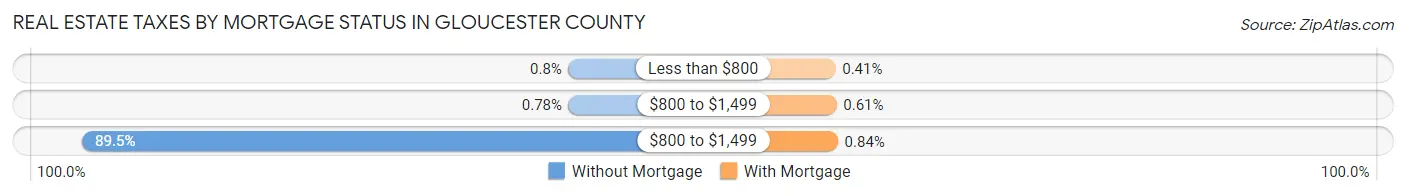
| Property Taxes | Without Mortgage | With Mortgage |
| Less than $800 | 227 (0.8%) | 242 (0.4%) |
| $800 to $1,499 | 221 (0.8%) | 360 (0.6%) |
| $800 to $1,499 | 25,319 (89.5%) | 498 (0.8%) |
| Total | 28,292 (100.0%) | 59,349 (100.0%) |
Health & Disability in Gloucester County
Health Insurance Coverage by Age in Gloucester County
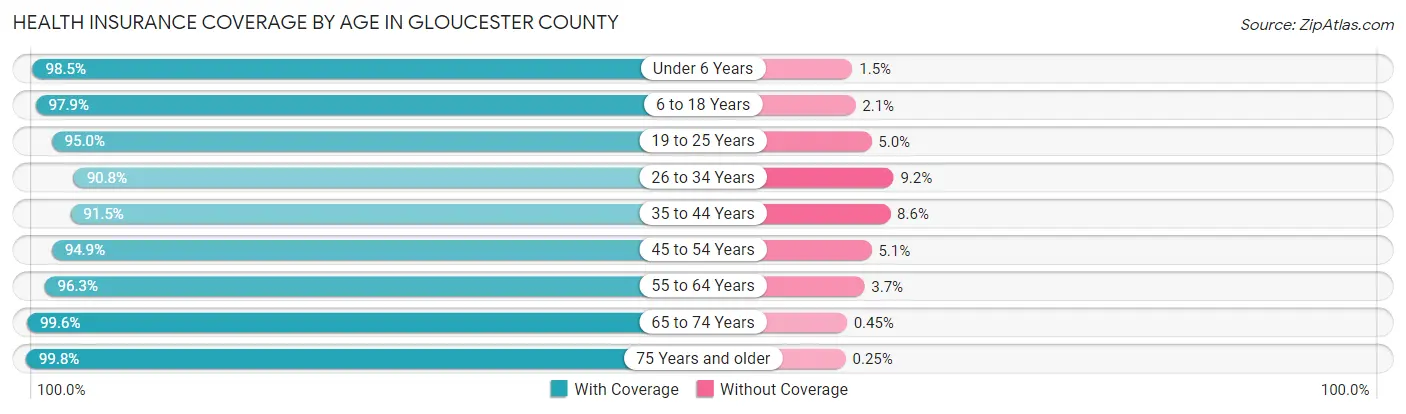
| Age Bracket | With Coverage | Without Coverage |
| Under 6 Years | 18,421 (98.5%) | 281 (1.5%) |
| 6 to 18 Years | 49,682 (97.9%) | 1,045 (2.1%) |
| 19 to 25 Years | 27,718 (95.0%) | 1,472 (5.0%) |
| 26 to 34 Years | 30,146 (90.8%) | 3,042 (9.2%) |
| 35 to 44 Years | 34,722 (91.4%) | 3,248 (8.6%) |
| 45 to 54 Years | 38,684 (94.9%) | 2,066 (5.1%) |
| 55 to 64 Years | 41,079 (96.3%) | 1,595 (3.7%) |
| 65 to 74 Years | 29,291 (99.6%) | 133 (0.4%) |
| 75 Years and older | 18,747 (99.8%) | 47 (0.3%) |
| Total | 288,490 (95.7%) | 12,929 (4.3%) |
Health Insurance Coverage by Citizenship Status in Gloucester County
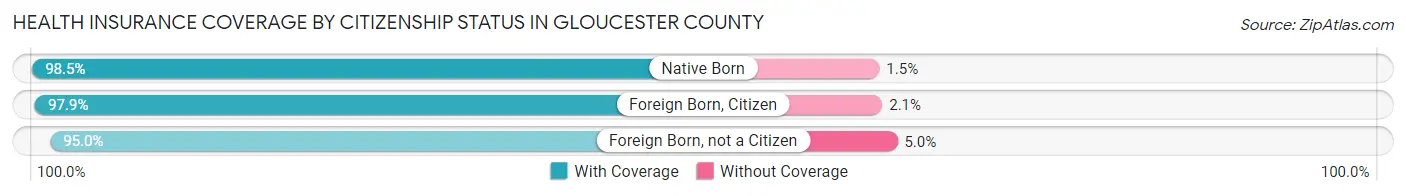
| Citizenship Status | With Coverage | Without Coverage |
| Native Born | 18,421 (98.5%) | 281 (1.5%) |
| Foreign Born, Citizen | 49,682 (97.9%) | 1,045 (2.1%) |
| Foreign Born, not a Citizen | 27,718 (95.0%) | 1,472 (5.0%) |
Health Insurance Coverage by Household Income in Gloucester County
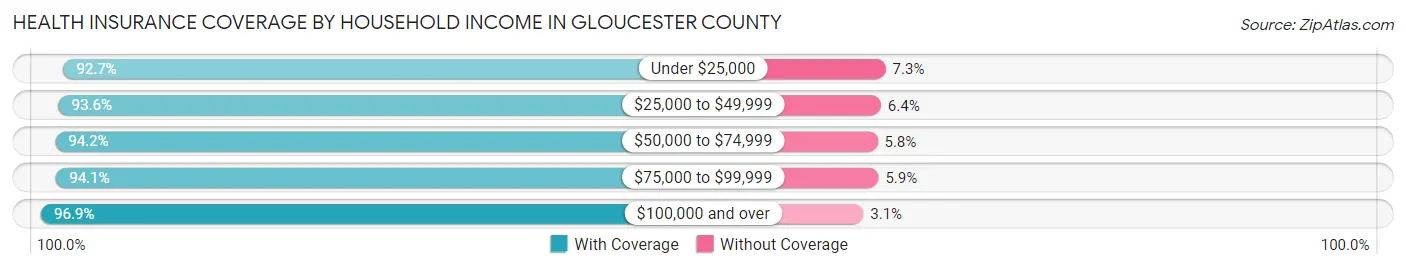
| Household Income | With Coverage | Without Coverage |
| Under $25,000 | 16,839 (92.7%) | 1,323 (7.3%) |
| $25,000 to $49,999 | 27,375 (93.6%) | 1,868 (6.4%) |
| $50,000 to $74,999 | 32,202 (94.2%) | 1,968 (5.8%) |
| $75,000 to $99,999 | 31,607 (94.1%) | 1,995 (5.9%) |
| $100,000 and over | 176,037 (96.9%) | 5,624 (3.1%) |
Public vs Private Health Insurance Coverage by Age in Gloucester County

| Age Bracket | Public Insurance | Private Insurance |
| Under 6 | 5,559 (29.7%) | 13,537 (72.4%) |
| 6 to 18 Years | 12,245 (24.1%) | 39,317 (77.5%) |
| 19 to 25 Years | 4,119 (14.1%) | 24,460 (83.8%) |
| 25 to 34 Years | 5,594 (16.9%) | 25,420 (76.6%) |
| 35 to 44 Years | 4,722 (12.4%) | 30,774 (81.0%) |
| 45 to 54 Years | 5,281 (13.0%) | 34,515 (84.7%) |
| 55 to 64 Years | 8,460 (19.8%) | 35,281 (82.7%) |
| 65 to 74 Years | 27,926 (94.9%) | 19,760 (67.2%) |
| 75 Years and over | 18,459 (98.2%) | 12,549 (66.8%) |
| Total | 92,365 (30.6%) | 235,613 (78.2%) |
Disability Status by Sex by Age in Gloucester County
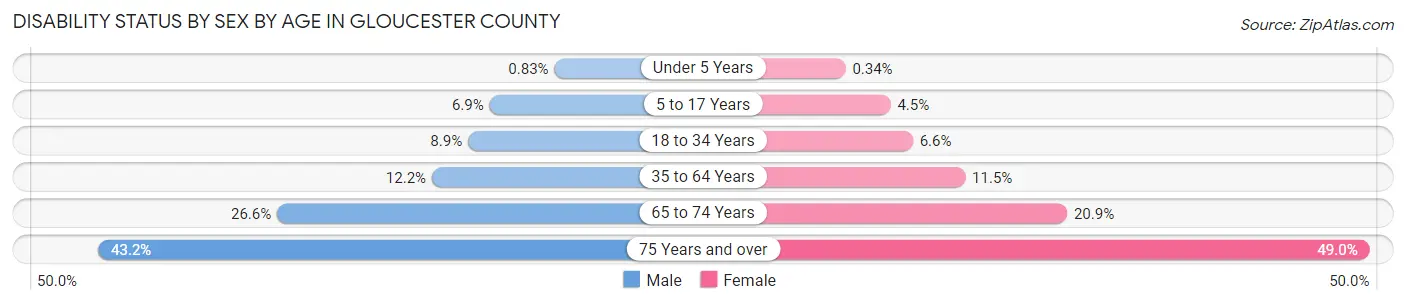
| Age Bracket | Male | Female |
| Under 5 Years | 65 (0.8%) | 25 (0.3%) |
| 5 to 17 Years | 1,728 (6.9%) | 1,090 (4.5%) |
| 18 to 34 Years | 3,047 (8.8%) | 2,169 (6.6%) |
| 35 to 64 Years | 7,222 (12.2%) | 7,121 (11.5%) |
| 65 to 74 Years | 3,639 (26.6%) | 3,287 (20.9%) |
| 75 Years and over | 3,275 (43.2%) | 5,490 (49.0%) |
Disability Class by Sex by Age in Gloucester County
Disability Class: Hearing Difficulty
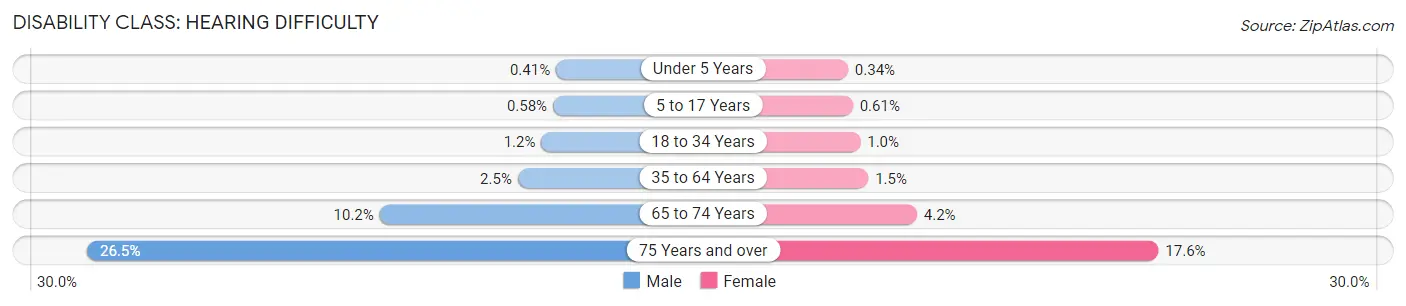
| Age Bracket | Male | Female |
| Under 5 Years | 32 (0.4%) | 25 (0.3%) |
| 5 to 17 Years | 147 (0.6%) | 146 (0.6%) |
| 18 to 34 Years | 424 (1.2%) | 338 (1.0%) |
| 35 to 64 Years | 1,501 (2.5%) | 916 (1.5%) |
| 65 to 74 Years | 1,401 (10.2%) | 658 (4.2%) |
| 75 Years and over | 2,011 (26.5%) | 1,977 (17.6%) |
Disability Class: Vision Difficulty
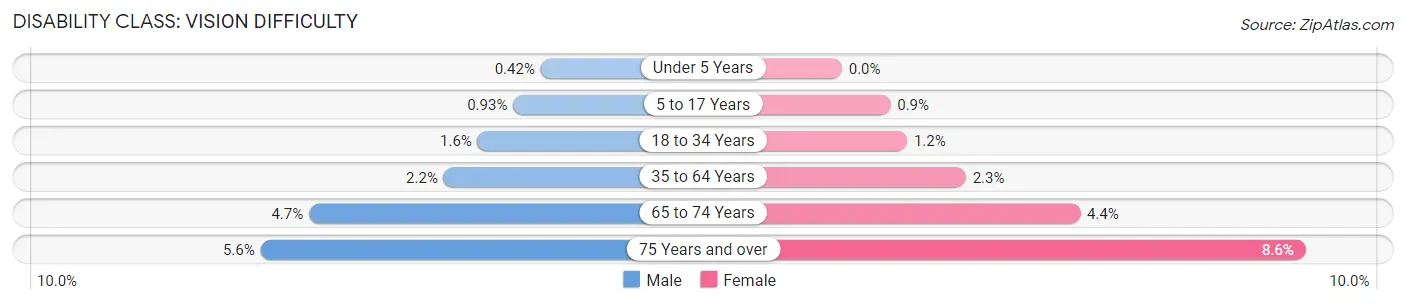
| Age Bracket | Male | Female |
| Under 5 Years | 33 (0.4%) | 0 (0.0%) |
| 5 to 17 Years | 235 (0.9%) | 216 (0.9%) |
| 18 to 34 Years | 548 (1.6%) | 398 (1.2%) |
| 35 to 64 Years | 1,314 (2.2%) | 1,434 (2.3%) |
| 65 to 74 Years | 646 (4.7%) | 695 (4.4%) |
| 75 Years and over | 426 (5.6%) | 965 (8.6%) |
Disability Class: Cognitive Difficulty
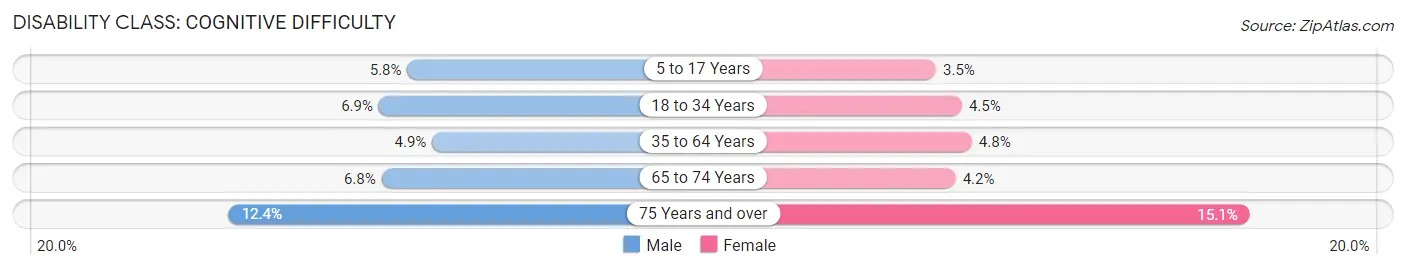
| Age Bracket | Male | Female |
| 5 to 17 Years | 1,460 (5.8%) | 844 (3.5%) |
| 18 to 34 Years | 2,359 (6.9%) | 1,468 (4.5%) |
| 35 to 64 Years | 2,883 (4.9%) | 3,008 (4.8%) |
| 65 to 74 Years | 924 (6.8%) | 666 (4.2%) |
| 75 Years and over | 942 (12.4%) | 1,697 (15.1%) |
Disability Class: Ambulatory Difficulty
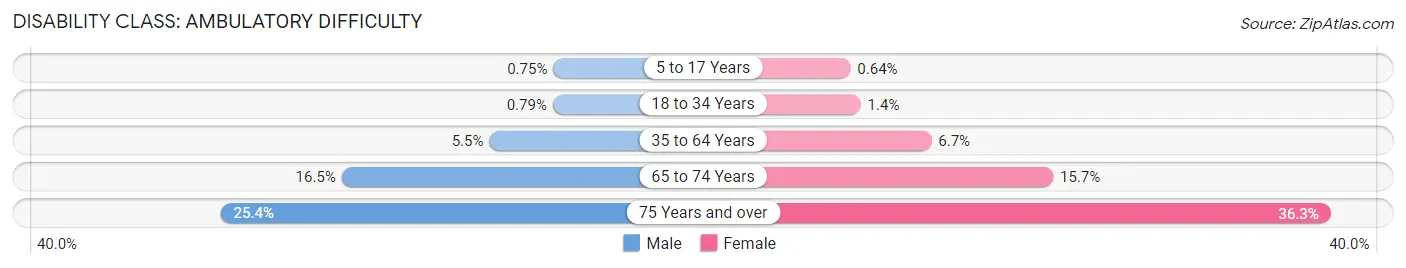
| Age Bracket | Male | Female |
| 5 to 17 Years | 189 (0.7%) | 155 (0.6%) |
| 18 to 34 Years | 273 (0.8%) | 460 (1.4%) |
| 35 to 64 Years | 3,256 (5.5%) | 4,139 (6.7%) |
| 65 to 74 Years | 2,255 (16.5%) | 2,468 (15.7%) |
| 75 Years and over | 1,929 (25.4%) | 4,069 (36.3%) |
Disability Class: Self-Care Difficulty

| Age Bracket | Male | Female |
| 5 to 17 Years | 369 (1.5%) | 214 (0.9%) |
| 18 to 34 Years | 437 (1.3%) | 324 (1.0%) |
| 35 to 64 Years | 1,248 (2.1%) | 1,149 (1.8%) |
| 65 to 74 Years | 680 (5.0%) | 574 (3.6%) |
| 75 Years and over | 864 (11.4%) | 1,741 (15.5%) |
Technology Access in Gloucester County
Computing Device Access in Gloucester County
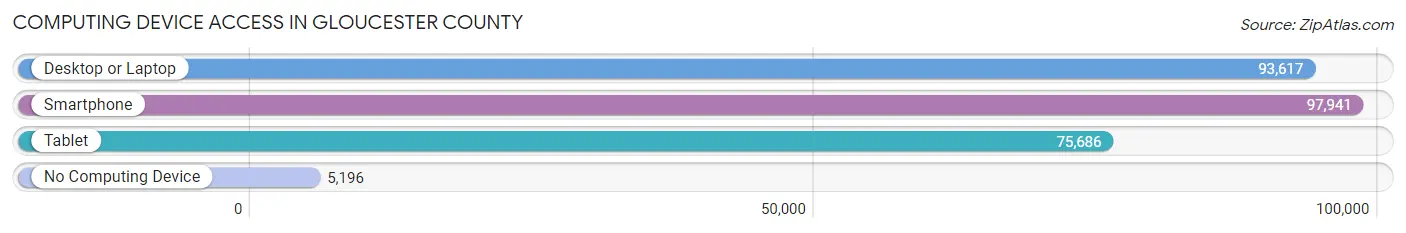
| Device Type | # Households | % Households |
| Desktop or Laptop | 93,617 | 85.1% |
| Smartphone | 97,941 | 89.0% |
| Tablet | 75,686 | 68.8% |
| No Computing Device | 5,196 | 4.7% |
| Total | 109,996 | 100.0% |
Internet Access in Gloucester County
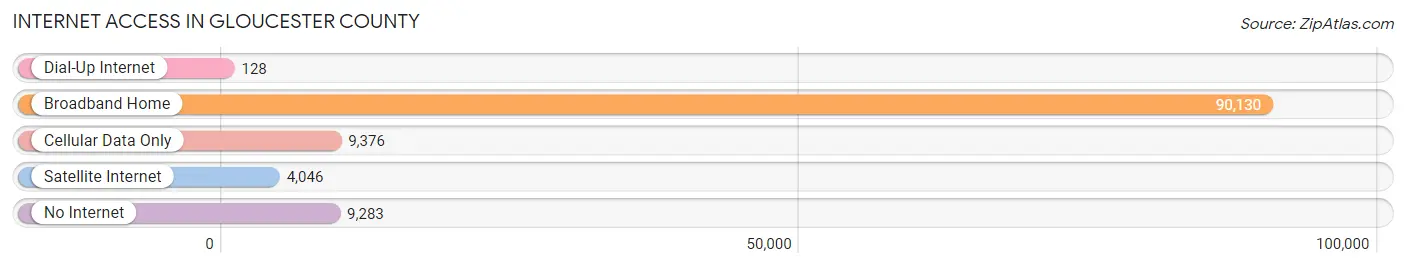
| Internet Type | # Households | % Households |
| Dial-Up Internet | 128 | 0.1% |
| Broadband Home | 90,130 | 81.9% |
| Cellular Data Only | 9,376 | 8.5% |
| Satellite Internet | 4,046 | 3.7% |
| No Internet | 9,283 | 8.4% |
| Total | 109,996 | 100.0% |
Gloucester County Summary
Gloucester County is a county located in the U.S. state of New Jersey. As of the 2010 United States Census, the county's population was 288,288, making it the 14th-most populous of the state's 21 counties. Its county seat is Woodbury. The county is named for Henry Stuart, Duke of Gloucester, who was the third son of King Charles I of England.
History
Gloucester County was formed on May 17, 1686, as part of West Jersey, a proprietary colony of England. It was created from portions of Salem County, which had been established in 1694. The county was named for Henry Stuart, Duke of Gloucester, who was the third son of King Charles I of England.
The county was originally divided into eight townships: Deptford, Gloucester, Greenwich, Woolwich, Franklin, Monroe, Washington, and Woolwich. In 1714, the townships of Franklin and Washington were annexed to Salem County. In 1798, the townships of Monroe and Woolwich were annexed to Salem County. In 1844, the townships of Deptford and Greenwich were annexed to Salem County.
Geography
Gloucester County is located in the southwestern part of New Jersey, in the Delaware Valley region. It is bounded by the Delaware River to the west, the Atlantic Ocean to the east, and the counties of Camden, Burlington, and Salem to the north. The county has a total area of 677 square miles, of which 645 square miles is land and 32 square miles is water.
The highest point in the county is located in the township of Franklin, at an elevation of 180 feet above sea level. The lowest point is located in the township of Woolwich, at an elevation of sea level.
Economy
The economy of Gloucester County is largely based on agriculture, manufacturing, and services. The county is home to a number of large employers, including Lockheed Martin, Boeing, and the U.S. Navy.
Agriculture is an important part of the county's economy. The county is home to a number of farms, including dairy farms, vegetable farms, and fruit farms. The county is also home to a number of wineries and vineyards.
Manufacturing is also an important part of the county's economy. The county is home to a number of manufacturing companies, including chemical companies, pharmaceutical companies, and food processing companies.
Demographics
As of the 2010 United States Census, there were 288,288 people, 106,717 households, and 75,845 families residing in the county. The population density was 447.3 inhabitants per square mile. There were 115,945 housing units at an average density of 179.9 per square mile. The racial makeup of the county was 81.2% White, 11.2% Black or African American, 0.3% Native American, 2.3% Asian, 0.1% Pacific Islander, 2.7% from other races, and 2.3% from two or more races. Hispanic or Latino of any race were 8.2% of the population.
There were 106,717 households, out of which 33.2% had children under the age of 18 living with them, 54.2% were married couples living together, 12.3% had a female householder with no husband present, and 28.7% were non-families. 22.7% of all households were made up of individuals, and 8.3% had someone living alone who was 65 years of age or older. The average household size was 2.68 and the average family size was 3.17.
In the county, the population was spread out, with 24.2% under the age of 18, 8.2% from 18 to 24, 28.2% from 25 to 44, 27.2% from 45 to 64, and 12.2% who were 65 years of age or older. The median age was 38.2 years. For every 100 females, there were 97.2 males. For every 100 females age 18 and over, there were 94.2 males.
The median income for a household in the county was $68,845, and the median income for a family was $79,890. Males had a median income of $54,890 versus $41,945 for females. The per capita income for the county was $30,890. About 5.2% of families and 7.2% of the population were below the poverty line, including 9.2% of those under age 18 and 6.2% of those age 65 or over.
Common Questions
What is the Total Population of Gloucester County?
Total Population of Gloucester County is 302,621.
What is the Total Male Population of Gloucester County?
Total Male Population of Gloucester County is 148,499.
What is the Total Female Population of Gloucester County?
Total Female Population of Gloucester County is 154,122.
What is the Ratio of Males per 100 Females in Gloucester County?
There are 96.35 Males per 100 Females in Gloucester County.
What is the Ratio of Females per 100 Males in Gloucester County?
There are 103.79 Females per 100 Males in Gloucester County.
What is the Median Population Age in Gloucester County?
Median Population Age in Gloucester County is 40.2 Years.
What is the Average Family Size in Gloucester County
Average Family Size in Gloucester County is 3.2 People.
What is the Average Household Size in Gloucester County
Average Household Size in Gloucester County is 2.7 People.
What is Per Capita Income in Gloucester County?
Per Capita income in Gloucester County is $45,933.
What is the Median Family Income in Gloucester County?
Median Family Income in Gloucester County is $121,675.
What is the Median Household income in Gloucester County?
Median Household Income in Gloucester County is $99,668.
What is Income or Wage Gap in Gloucester County?
Income or Wage Gap in Gloucester County is 32.9%.
Women in Gloucester County earn 67.1 cents for every dollar earned by a man.
What is Family Income Deficit in Gloucester County?
Family Income Deficit in Gloucester County is $9,998.
Families that are below poverty line in Gloucester County earn $9,998 less on average than the poverty threshold level.
What is Inequality or Gini Index in Gloucester County?
Inequality or Gini Index in Gloucester County is 0.42.
How Large is the Labor Force in Gloucester County?
There are 164,573 People in the Labor Forcein in Gloucester County.
What is the Percentage of People in the Labor Force in Gloucester County?
66.8% of People are in the Labor Force in Gloucester County.
What is the Unemployment Rate in Gloucester County?
Unemployment Rate in Gloucester County is 5.2%.