Essex County, NJ
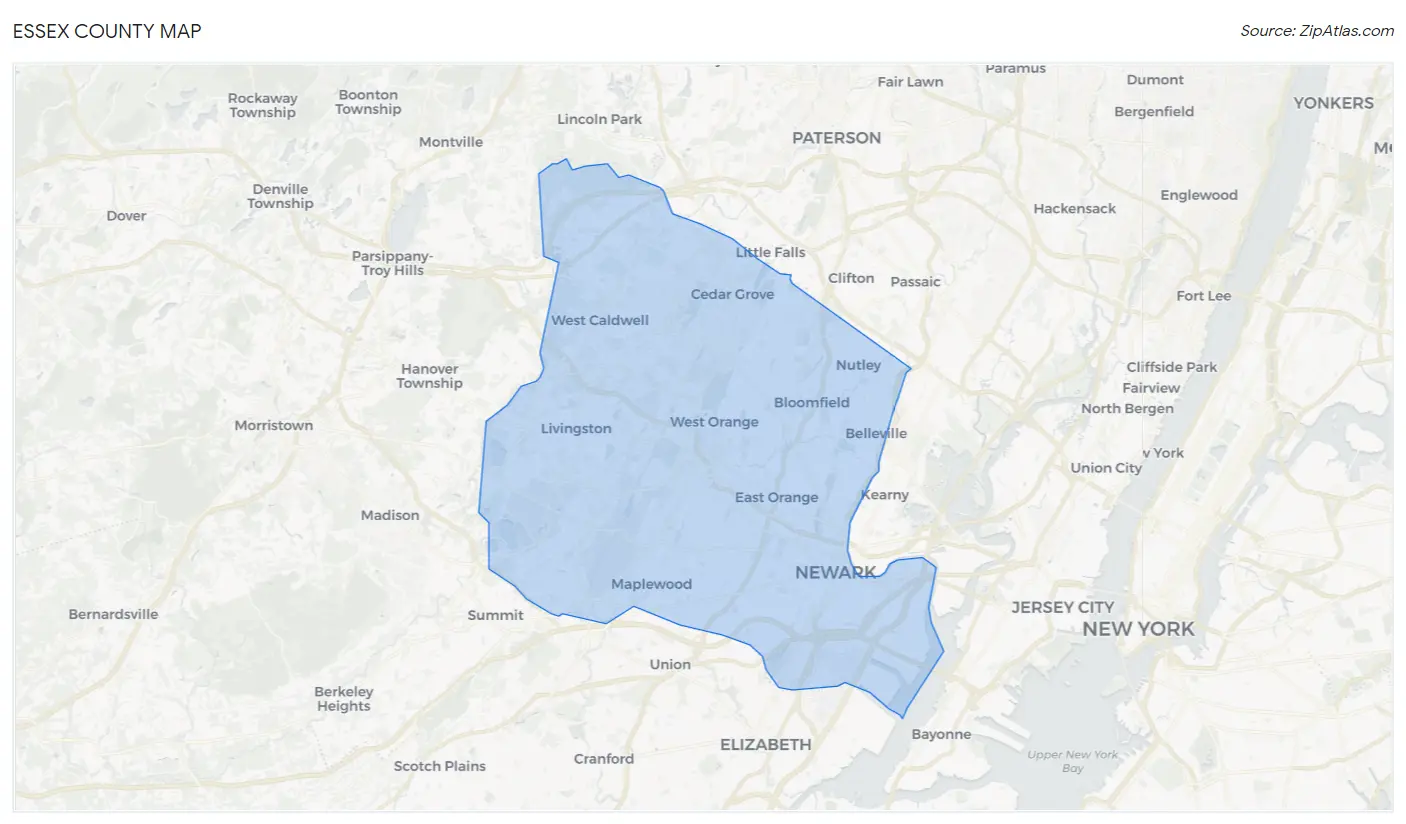
Essex County Map
Essex County Overview
853,374
TOTAL POPULATION
414,982
MALE POPULATION
438,392
FEMALE POPULATION
94.66
MALES / 100 FEMALES
105.64
FEMALES / 100 MALES
37.6
MEDIAN AGE
3.4
AVG FAMILY SIZE
2.7
AVG HOUSEHOLD SIZE
$45,946
PER CAPITA INCOME
$97,380
AVG FAMILY INCOME
$73,785
AVG HOUSEHOLD INCOME
24.5%
WAGE / INCOME GAP [ % ]
75.5¢/ $1
WAGE / INCOME GAP [ $ ]
$11,914
FAMILY INCOME DEFICIT
0.55
INEQUALITY / GINI INDEX
446,307
LABOR FORCE [ PEOPLE ]
66.2%
PERCENT IN LABOR FORCE
8.5%
UNEMPLOYMENT RATE
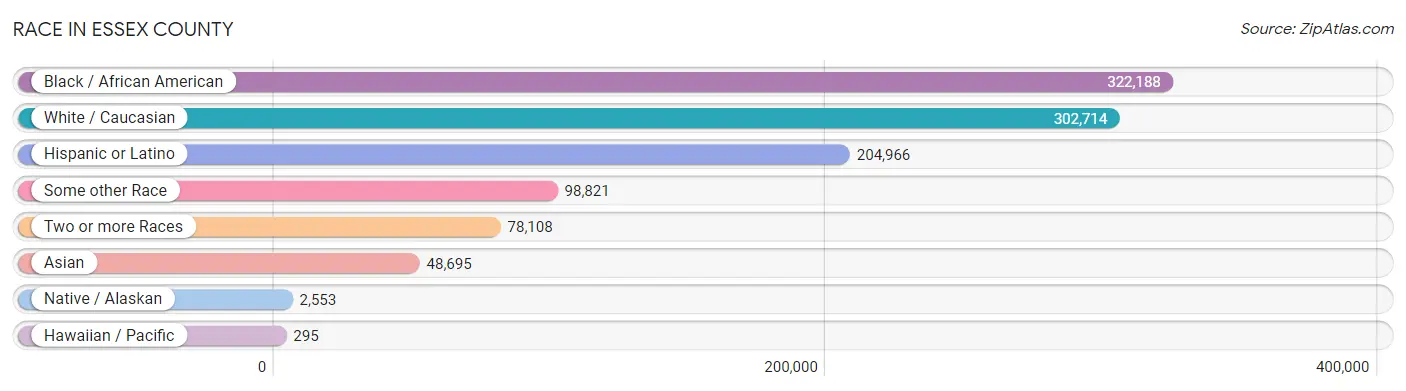
Race in Essex County
The most populous races in Essex County are Black / African American (322,188 | 37.8%), White / Caucasian (302,714 | 35.5%), and Hispanic or Latino (204,966 | 24.0%).
| Race | # Population | % Population |
| Asian | 48,695 | 5.7% |
| Black / African American | 322,188 | 37.8% |
| Hawaiian / Pacific | 295 | 0.0% |
| Hispanic or Latino | 204,966 | 24.0% |
| Native / Alaskan | 2,553 | 0.3% |
| White / Caucasian | 302,714 | 35.5% |
| Two or more Races | 78,108 | 9.1% |
| Some other Race | 98,821 | 11.6% |
| Total | 853,374 | 100.0% |
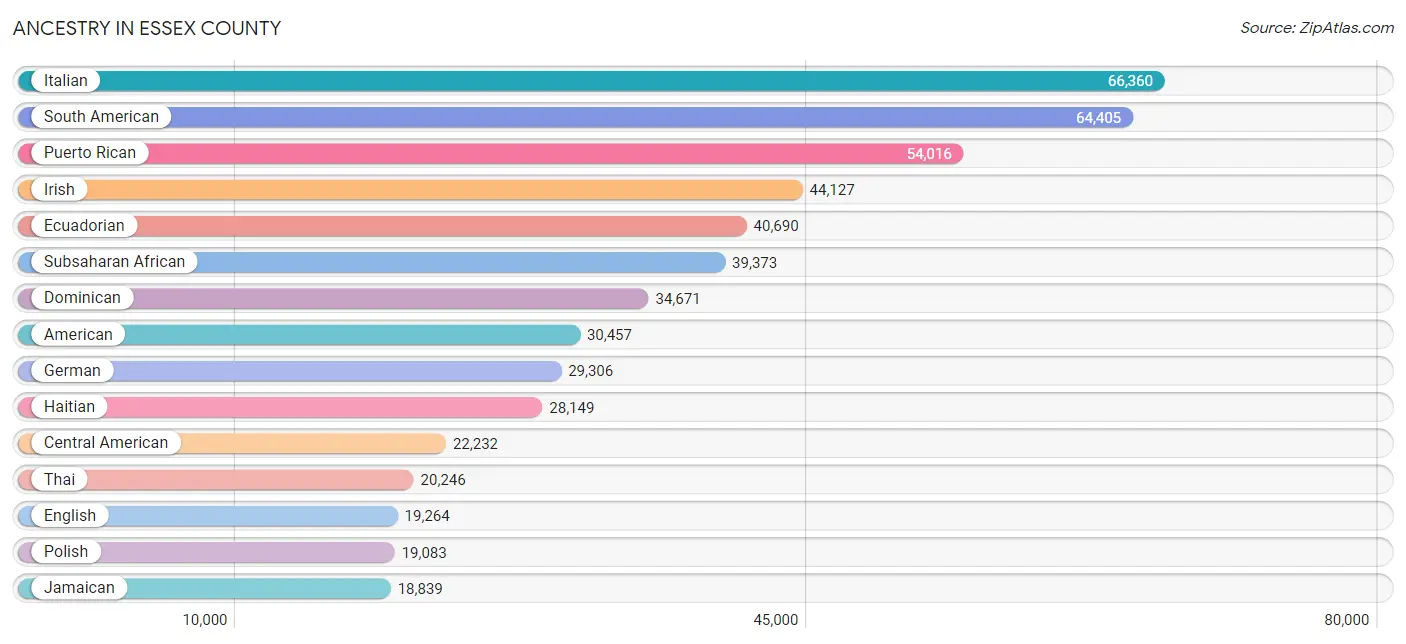
Ancestry in Essex County
The most populous ancestries reported in Essex County are Italian (66,360 | 7.8%), South American (64,405 | 7.5%), Puerto Rican (54,016 | 6.3%), Irish (44,127 | 5.2%), and Ecuadorian (40,690 | 4.8%), together accounting for 31.6% of all Essex County residents.
| Ancestry | # Population | % Population |
| Afghan | 109 | 0.0% |
| African | 12,222 | 1.4% |
| Alaska Native | 25 | 0.0% |
| Albanian | 652 | 0.1% |
| Aleut | 26 | 0.0% |
| Alsatian | 49 | 0.0% |
| American | 30,457 | 3.6% |
| Apache | 40 | 0.0% |
| Arab | 5,673 | 0.7% |
| Argentinean | 2,092 | 0.3% |
| Armenian | 563 | 0.1% |
| Assyrian / Chaldean / Syriac | 9 | 0.0% |
| Australian | 132 | 0.0% |
| Austrian | 2,180 | 0.3% |
| Bahamian | 350 | 0.0% |
| Bangladeshi | 11 | 0.0% |
| Barbadian | 939 | 0.1% |
| Basque | 19 | 0.0% |
| Belgian | 390 | 0.1% |
| Belizean | 218 | 0.0% |
| Bermudan | 248 | 0.0% |
| Bhutanese | 1,389 | 0.2% |
| Blackfeet | 98 | 0.0% |
| Bolivian | 362 | 0.0% |
| Brazilian | 16,193 | 1.9% |
| British | 1,875 | 0.2% |
| British West Indian | 2,237 | 0.3% |
| Bulgarian | 114 | 0.0% |
| Burmese | 4,214 | 0.5% |
| Cajun | 17 | 0.0% |
| Cambodian | 33 | 0.0% |
| Canadian | 1,148 | 0.1% |
| Cape Verdean | 248 | 0.0% |
| Carpatho Rusyn | 58 | 0.0% |
| Celtic | 55 | 0.0% |
| Central American | 22,232 | 2.6% |
| Central American Indian | 1,169 | 0.1% |
| Cherokee | 745 | 0.1% |
| Chilean | 1,239 | 0.2% |
| Choctaw | 163 | 0.0% |
| Colombian | 6,251 | 0.7% |
| Costa Rican | 1,723 | 0.2% |
| Creek | 138 | 0.0% |
| Croatian | 1,066 | 0.1% |
| Cuban | 6,247 | 0.7% |
| Cypriot | 166 | 0.0% |
| Czech | 1,110 | 0.1% |
| Czechoslovakian | 312 | 0.0% |
| Danish | 643 | 0.1% |
| Delaware | 252 | 0.0% |
| Dominican | 34,671 | 4.1% |
| Dutch | 2,261 | 0.3% |
| Dutch West Indian | 120 | 0.0% |
| Eastern European | 6,232 | 0.7% |
| Ecuadorian | 40,690 | 4.8% |
| Egyptian | 2,262 | 0.3% |
| English | 19,264 | 2.3% |
| Estonian | 345 | 0.0% |
| Ethiopian | 1,252 | 0.2% |
| European | 6,320 | 0.7% |
| Fijian | 108 | 0.0% |
| Filipino | 759 | 0.1% |
| Finnish | 169 | 0.0% |
| French | 4,347 | 0.5% |
| French American Indian | 33 | 0.0% |
| French Canadian | 1,012 | 0.1% |
| German | 29,306 | 3.4% |
| German Russian | 352 | 0.0% |
| Ghanaian | 4,920 | 0.6% |
| Greek | 3,259 | 0.4% |
| Guamanian / Chamorro | 64 | 0.0% |
| Guatemalan | 6,650 | 0.8% |
| Guyanese | 9,852 | 1.1% |
| Haitian | 28,149 | 3.3% |
| Hmong | 51 | 0.0% |
| Honduran | 4,647 | 0.5% |
| Hungarian | 3,514 | 0.4% |
| Indian (Asian) | 13,982 | 1.6% |
| Indonesian | 292 | 0.0% |
| Inupiat | 95 | 0.0% |
| Iranian | 929 | 0.1% |
| Iraqi | 70 | 0.0% |
| Irish | 44,127 | 5.2% |
| Iroquois | 117 | 0.0% |
| Israeli | 688 | 0.1% |
| Italian | 66,360 | 7.8% |
| Jamaican | 18,839 | 2.2% |
| Japanese | 17 | 0.0% |
| Jordanian | 111 | 0.0% |
| Kenyan | 864 | 0.1% |
| Korean | 11,429 | 1.3% |
| Laotian | 214 | 0.0% |
| Latvian | 401 | 0.1% |
| Lebanese | 872 | 0.1% |
| Liberian | 1,142 | 0.1% |
| Lithuanian | 1,226 | 0.1% |
| Luxembourger | 24 | 0.0% |
| Macedonian | 138 | 0.0% |
| Maltese | 296 | 0.0% |
| Mexican | 9,378 | 1.1% |
| Mexican American Indian | 314 | 0.0% |
| Mongolian | 59 | 0.0% |
| Moroccan | 685 | 0.1% |
| Native Hawaiian | 263 | 0.0% |
| Navajo | 194 | 0.0% |
| New Zealander | 28 | 0.0% |
| Nicaraguan | 1,026 | 0.1% |
| Nigerian | 14,230 | 1.7% |
| Northern European | 306 | 0.0% |
| Norwegian | 1,357 | 0.2% |
| Pakistani | 549 | 0.1% |
| Palestinian | 319 | 0.0% |
| Panamanian | 866 | 0.1% |
| Paraguayan | 88 | 0.0% |
| Pennsylvania German | 3 | 0.0% |
| Peruvian | 9,482 | 1.1% |
| Polish | 19,083 | 2.2% |
| Portuguese | 11,282 | 1.3% |
| Pueblo | 62 | 0.0% |
| Puerto Rican | 54,016 | 6.3% |
| Puget Sound Salish | 66 | 0.0% |
| Romanian | 1,569 | 0.2% |
| Russian | 10,284 | 1.2% |
| Salvadoran | 7,257 | 0.9% |
| Samoan | 140 | 0.0% |
| Scandinavian | 294 | 0.0% |
| Scotch-Irish | 1,284 | 0.2% |
| Scottish | 4,544 | 0.5% |
| Seminole | 61 | 0.0% |
| Senegalese | 573 | 0.1% |
| Serbian | 193 | 0.0% |
| Sierra Leonean | 82 | 0.0% |
| Sioux | 247 | 0.0% |
| Slavic | 175 | 0.0% |
| Slovak | 631 | 0.1% |
| Slovene | 69 | 0.0% |
| South African | 172 | 0.0% |
| South American | 64,405 | 7.5% |
| South American Indian | 237 | 0.0% |
| Soviet Union | 39 | 0.0% |
| Spaniard | 3,796 | 0.4% |
| Spanish | 1,679 | 0.2% |
| Spanish American Indian | 12 | 0.0% |
| Sri Lankan | 1,139 | 0.1% |
| Subsaharan African | 39,373 | 4.6% |
| Sudanese | 144 | 0.0% |
| Swedish | 2,251 | 0.3% |
| Swiss | 385 | 0.1% |
| Syrian | 741 | 0.1% |
| Taiwanese | 100 | 0.0% |
| Thai | 20,246 | 2.4% |
| Tlingit-Haida | 29 | 0.0% |
| Tongan | 13 | 0.0% |
| Trinidadian and Tobagonian | 4,169 | 0.5% |
| Turkish | 1,344 | 0.2% |
| U.S. Virgin Islander | 182 | 0.0% |
| Ugandan | 192 | 0.0% |
| Ukrainian | 2,615 | 0.3% |
| Uruguayan | 2,169 | 0.3% |
| Venezuelan | 1,295 | 0.2% |
| Vietnamese | 885 | 0.1% |
| Welsh | 995 | 0.1% |
| West Indian | 2,788 | 0.3% |
| Yugoslavian | 295 | 0.0% |
| Zimbabwean | 23 | 0.0% | View All 165 Rows |
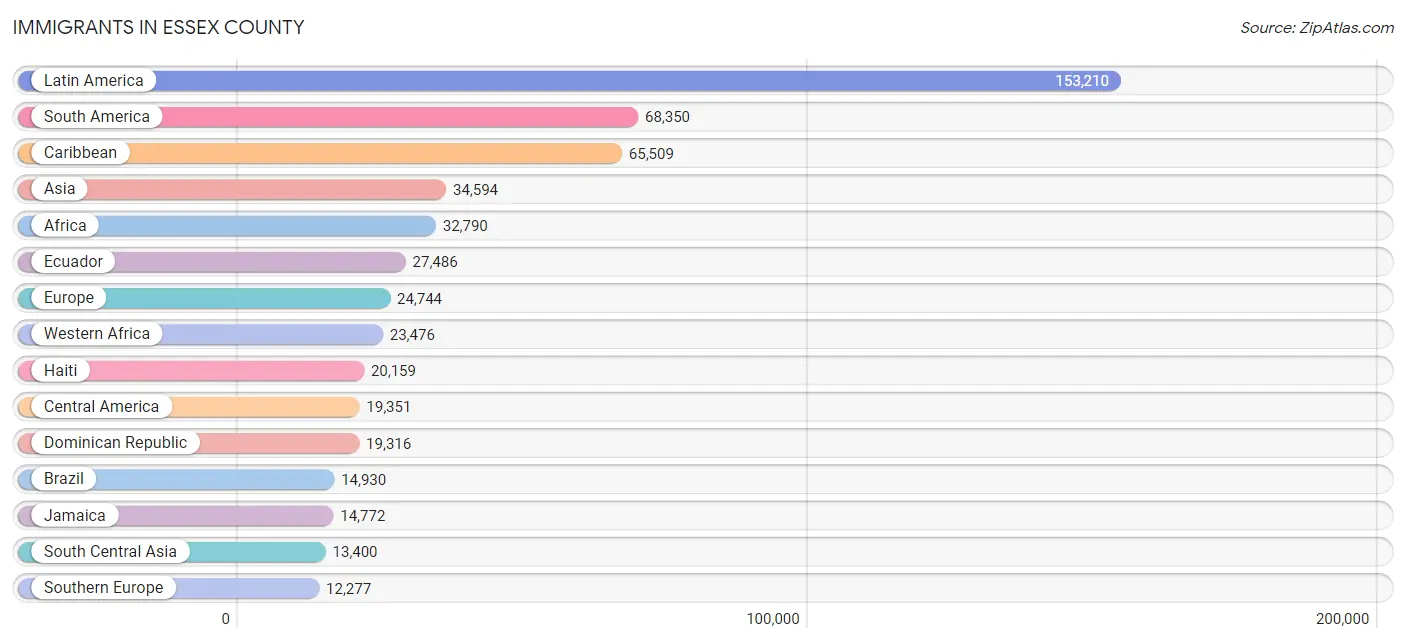
Immigrants in Essex County
The most numerous immigrant groups reported in Essex County came from Latin America (153,210 | 17.9%), South America (68,350 | 8.0%), Caribbean (65,509 | 7.7%), Asia (34,594 | 4.1%), and Africa (32,790 | 3.8%), together accounting for 41.5% of all Essex County residents.
| Immigration Origin | # Population | % Population |
| Afghanistan | 19 | 0.0% |
| Africa | 32,790 | 3.8% |
| Albania | 383 | 0.0% |
| Argentina | 884 | 0.1% |
| Armenia | 26 | 0.0% |
| Asia | 34,594 | 4.1% |
| Australia | 125 | 0.0% |
| Austria | 123 | 0.0% |
| Azores | 102 | 0.0% |
| Bahamas | 272 | 0.0% |
| Bangladesh | 1,178 | 0.1% |
| Barbados | 621 | 0.1% |
| Belarus | 172 | 0.0% |
| Belgium | 156 | 0.0% |
| Belize | 168 | 0.0% |
| Bolivia | 92 | 0.0% |
| Bosnia and Herzegovina | 139 | 0.0% |
| Brazil | 14,930 | 1.8% |
| Bulgaria | 84 | 0.0% |
| Cabo Verde | 58 | 0.0% |
| Cambodia | 20 | 0.0% |
| Cameroon | 841 | 0.1% |
| Canada | 1,531 | 0.2% |
| Caribbean | 65,509 | 7.7% |
| Central America | 19,351 | 2.3% |
| Chile | 693 | 0.1% |
| China | 7,429 | 0.9% |
| Colombia | 3,494 | 0.4% |
| Congo | 141 | 0.0% |
| Costa Rica | 1,256 | 0.2% |
| Croatia | 51 | 0.0% |
| Cuba | 2,089 | 0.2% |
| Czechoslovakia | 142 | 0.0% |
| Denmark | 112 | 0.0% |
| Dominica | 745 | 0.1% |
| Dominican Republic | 19,316 | 2.3% |
| Eastern Africa | 3,061 | 0.4% |
| Eastern Asia | 10,026 | 1.2% |
| Eastern Europe | 7,311 | 0.9% |
| Ecuador | 27,486 | 3.2% |
| Egypt | 1,767 | 0.2% |
| El Salvador | 4,671 | 0.5% |
| England | 1,088 | 0.1% |
| Eritrea | 249 | 0.0% |
| Ethiopia | 675 | 0.1% |
| Europe | 24,744 | 2.9% |
| Fiji | 38 | 0.0% |
| France | 545 | 0.1% |
| Germany | 626 | 0.1% |
| Ghana | 6,175 | 0.7% |
| Greece | 238 | 0.0% |
| Grenada | 519 | 0.1% |
| Guatemala | 4,626 | 0.5% |
| Guyana | 11,022 | 1.3% |
| Haiti | 20,159 | 2.4% |
| Honduras | 3,222 | 0.4% |
| Hong Kong | 709 | 0.1% |
| Hungary | 260 | 0.0% |
| India | 9,979 | 1.2% |
| Indonesia | 115 | 0.0% |
| Iran | 593 | 0.1% |
| Iraq | 6 | 0.0% |
| Ireland | 446 | 0.1% |
| Israel | 690 | 0.1% |
| Italy | 2,885 | 0.3% |
| Jamaica | 14,772 | 1.7% |
| Japan | 534 | 0.1% |
| Jordan | 164 | 0.0% |
| Kazakhstan | 50 | 0.0% |
| Kenya | 1,312 | 0.2% |
| Korea | 2,055 | 0.2% |
| Kuwait | 88 | 0.0% |
| Latin America | 153,210 | 17.9% |
| Latvia | 48 | 0.0% |
| Lebanon | 221 | 0.0% |
| Liberia | 1,460 | 0.2% |
| Malaysia | 144 | 0.0% |
| Mexico | 4,780 | 0.6% |
| Middle Africa | 1,281 | 0.2% |
| Moldova | 91 | 0.0% |
| Morocco | 263 | 0.0% |
| Nepal | 97 | 0.0% |
| Netherlands | 162 | 0.0% |
| Nicaragua | 279 | 0.0% |
| Nigeria | 12,057 | 1.4% |
| North Macedonia | 55 | 0.0% |
| Northern Africa | 2,144 | 0.3% |
| Northern Europe | 3,412 | 0.4% |
| Norway | 13 | 0.0% |
| Oceania | 191 | 0.0% |
| Pakistan | 1,168 | 0.1% |
| Panama | 349 | 0.0% |
| Peru | 6,468 | 0.8% |
| Philippines | 6,160 | 0.7% |
| Poland | 2,457 | 0.3% |
| Portugal | 6,932 | 0.8% |
| Romania | 471 | 0.1% |
| Russia | 1,191 | 0.1% |
| Saudi Arabia | 46 | 0.0% |
| Scotland | 238 | 0.0% |
| Senegal | 657 | 0.1% |
| Serbia | 114 | 0.0% |
| Sierra Leone | 229 | 0.0% |
| Singapore | 108 | 0.0% |
| Somalia | 11 | 0.0% |
| South Africa | 325 | 0.0% |
| South America | 68,350 | 8.0% |
| South Central Asia | 13,400 | 1.6% |
| South Eastern Asia | 7,661 | 0.9% |
| Southern Europe | 12,277 | 1.4% |
| Spain | 2,060 | 0.2% |
| Sri Lanka | 195 | 0.0% |
| St. Vincent and the Grenadines | 497 | 0.1% |
| Sudan | 64 | 0.0% |
| Sweden | 131 | 0.0% |
| Switzerland | 99 | 0.0% |
| Syria | 245 | 0.0% |
| Taiwan | 976 | 0.1% |
| Thailand | 314 | 0.0% |
| Trinidad and Tobago | 4,603 | 0.5% |
| Turkey | 996 | 0.1% |
| Uganda | 249 | 0.0% |
| Ukraine | 1,275 | 0.2% |
| Uruguay | 1,828 | 0.2% |
| Uzbekistan | 48 | 0.0% |
| Venezuela | 1,012 | 0.1% |
| Vietnam | 643 | 0.1% |
| West Indies | 165 | 0.0% |
| Western Africa | 23,476 | 2.8% |
| Western Asia | 3,230 | 0.4% |
| Western Europe | 1,711 | 0.2% |
| Zaire | 43 | 0.0% |
| Zimbabwe | 346 | 0.0% | View All 133 Rows |
Sex and Age in Essex County
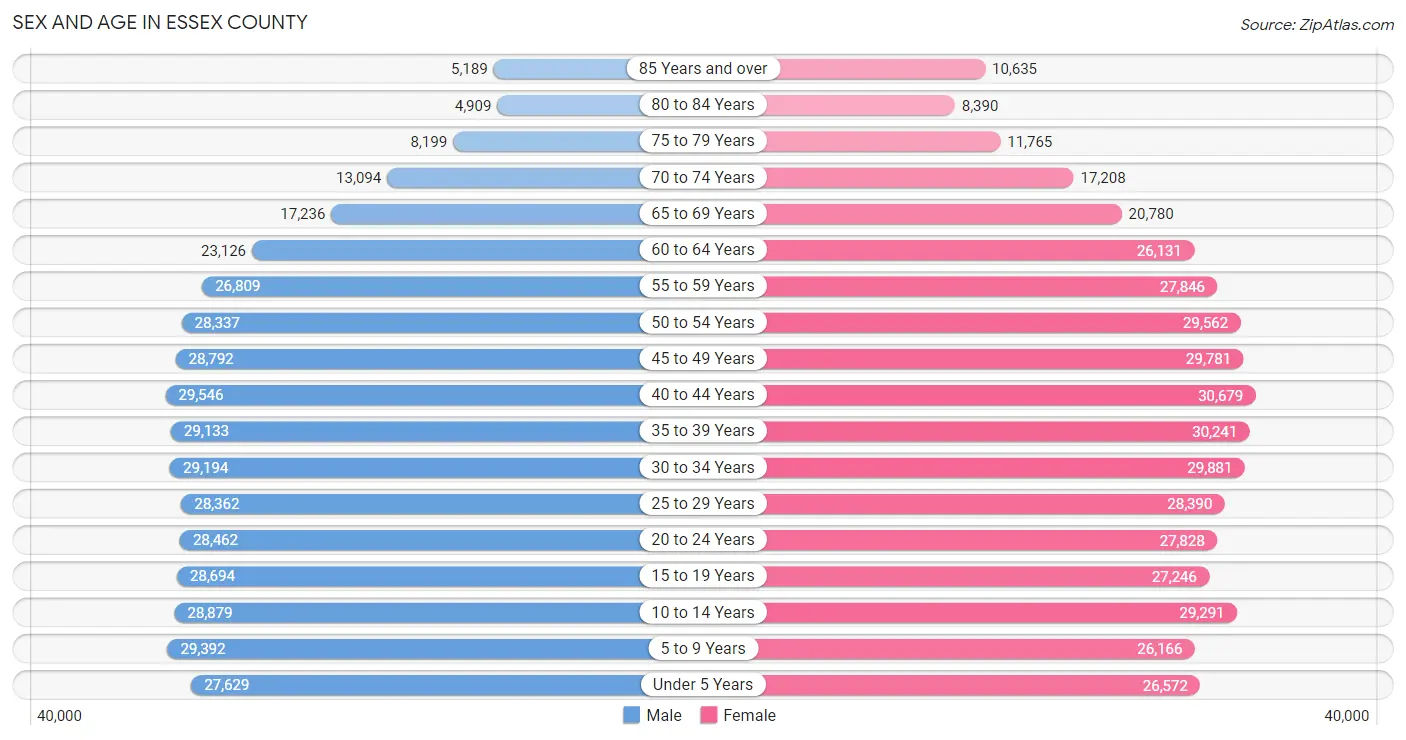
Sex and Age in Essex County
The most populous age groups in Essex County are 40 to 44 Years (29,546 | 7.1%) for men and 40 to 44 Years (30,679 | 7.0%) for women.
| Age Bracket | Male | Female |
| Under 5 Years | 27,629 (6.7%) | 26,572 (6.1%) |
| 5 to 9 Years | 29,392 (7.1%) | 26,166 (6.0%) |
| 10 to 14 Years | 28,879 (7.0%) | 29,291 (6.7%) |
| 15 to 19 Years | 28,694 (6.9%) | 27,246 (6.2%) |
| 20 to 24 Years | 28,462 (6.9%) | 27,828 (6.4%) |
| 25 to 29 Years | 28,362 (6.8%) | 28,390 (6.5%) |
| 30 to 34 Years | 29,194 (7.0%) | 29,881 (6.8%) |
| 35 to 39 Years | 29,133 (7.0%) | 30,241 (6.9%) |
| 40 to 44 Years | 29,546 (7.1%) | 30,679 (7.0%) |
| 45 to 49 Years | 28,792 (6.9%) | 29,781 (6.8%) |
| 50 to 54 Years | 28,337 (6.8%) | 29,562 (6.7%) |
| 55 to 59 Years | 26,809 (6.5%) | 27,846 (6.4%) |
| 60 to 64 Years | 23,126 (5.6%) | 26,131 (6.0%) |
| 65 to 69 Years | 17,236 (4.2%) | 20,780 (4.7%) |
| 70 to 74 Years | 13,094 (3.2%) | 17,208 (3.9%) |
| 75 to 79 Years | 8,199 (2.0%) | 11,765 (2.7%) |
| 80 to 84 Years | 4,909 (1.2%) | 8,390 (1.9%) |
| 85 Years and over | 5,189 (1.3%) | 10,635 (2.4%) |
| Total | 414,982 (100.0%) | 438,392 (100.0%) |
Families and Households in Essex County
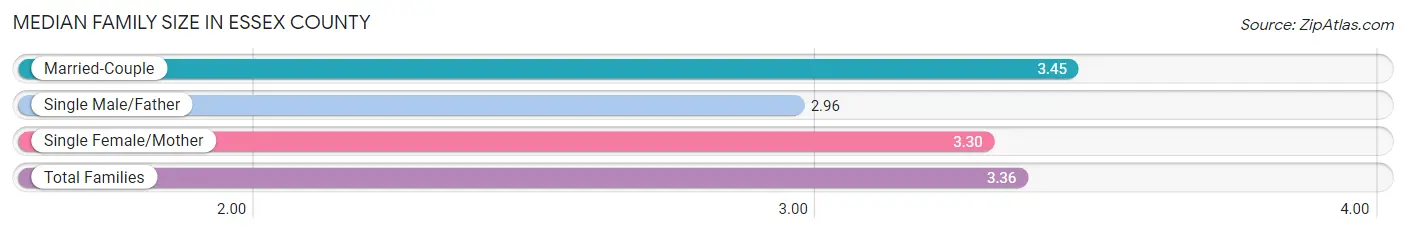
Median Family Size in Essex County
The median family size in Essex County is 3.36 persons per family, with married-couple families (126,219 | 62.5%) accounting for the largest median family size of 3.45 persons per family. On the other hand, single male/father families (19,507 | 9.7%) represent the smallest median family size with 2.96 persons per family.
| Family Type | # Families | Family Size |
| Married-Couple | 126,219 (62.5%) | 3.45 |
| Single Male/Father | 19,507 (9.7%) | 2.96 |
| Single Female/Mother | 56,086 (27.8%) | 3.30 |
| Total Families | 201,812 (100.0%) | 3.36 |
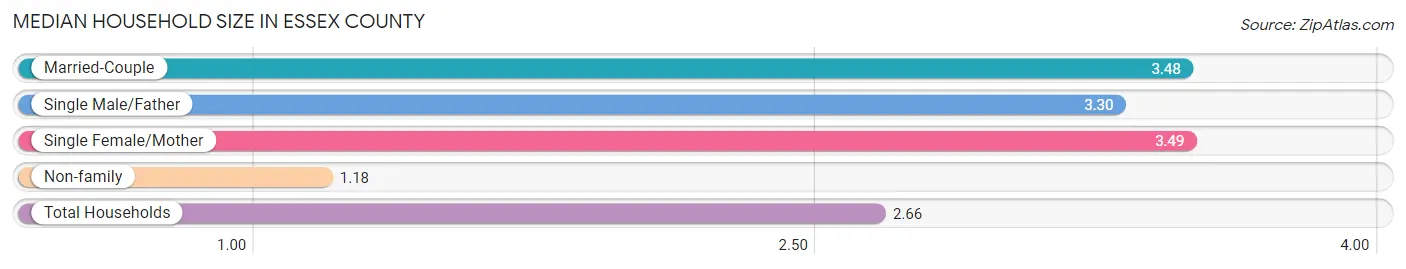
Median Household Size in Essex County
The median household size in Essex County is 2.66 persons per household, with single female/mother households (56,086 | 17.9%) accounting for the largest median household size of 3.49 persons per household. non-family households (111,130 | 35.5%) represent the smallest median household size with 1.18 persons per household.
| Household Type | # Households | Household Size |
| Married-Couple | 126,219 (40.3%) | 3.48 |
| Single Male/Father | 19,507 (6.2%) | 3.30 |
| Single Female/Mother | 56,086 (17.9%) | 3.49 |
| Non-family | 111,130 (35.5%) | 1.18 |
| Total Households | 312,942 (100.0%) | 2.66 |
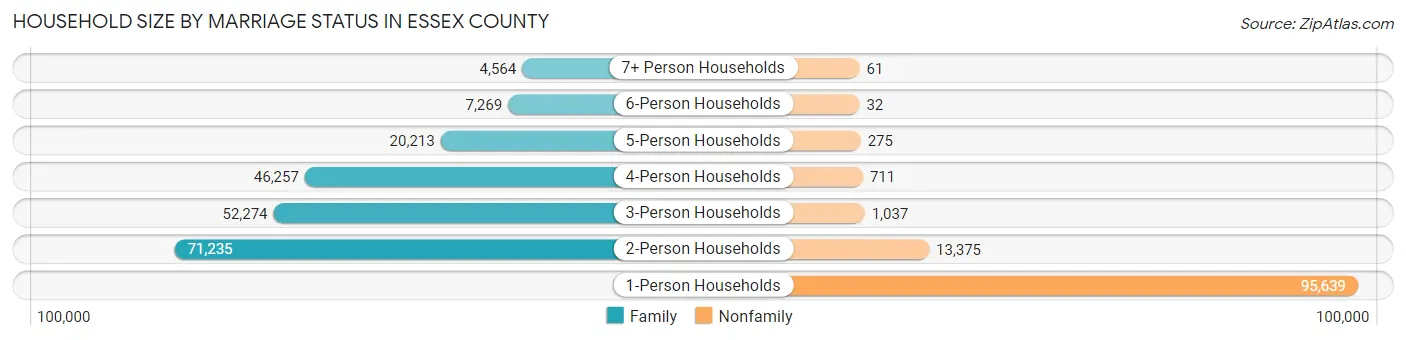
Household Size by Marriage Status in Essex County
Out of a total of 312,942 households in Essex County, 201,812 (64.5%) are family households, while 111,130 (35.5%) are nonfamily households. The most numerous type of family households are 2-person households, comprising 71,235, and the most common type of nonfamily households are 1-person households, comprising 95,639.
| Household Size | Family Households | Nonfamily Households |
| 1-Person Households | - | 95,639 (30.6%) |
| 2-Person Households | 71,235 (22.8%) | 13,375 (4.3%) |
| 3-Person Households | 52,274 (16.7%) | 1,037 (0.3%) |
| 4-Person Households | 46,257 (14.8%) | 711 (0.2%) |
| 5-Person Households | 20,213 (6.5%) | 275 (0.1%) |
| 6-Person Households | 7,269 (2.3%) | 32 (0.0%) |
| 7+ Person Households | 4,564 (1.5%) | 61 (0.0%) |
| Total | 201,812 (64.5%) | 111,130 (35.5%) |
Female Fertility in Essex County
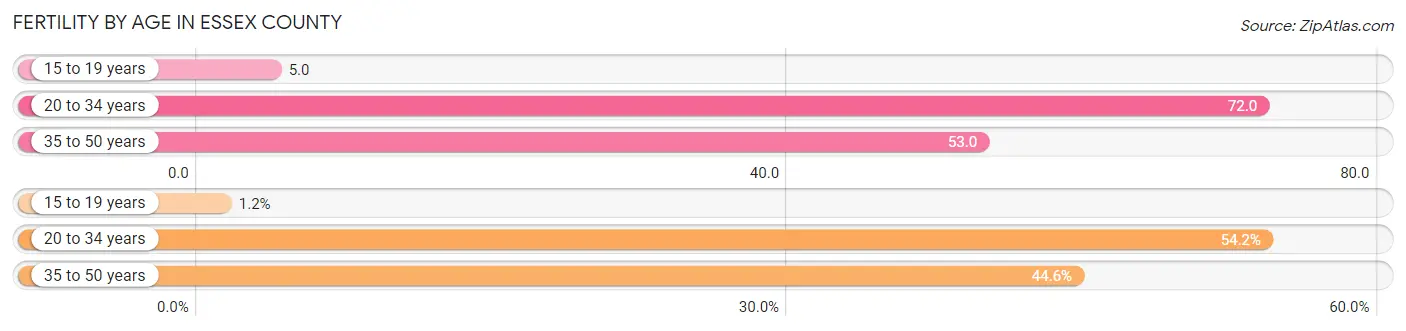
Fertility by Age in Essex County
Average fertility rate in Essex County is 55.0 births per 1,000 women. Women in the age bracket of 20 to 34 years have the highest fertility rate with 72.0 births per 1,000 women. Women in the age bracket of 20 to 34 years acount for 54.2% of all women with births.
| Age Bracket | Women with Births | Births / 1,000 Women |
| 15 to 19 years | 139 (1.2%) | 5.0 |
| 20 to 34 years | 6,220 (54.2%) | 72.0 |
| 35 to 50 years | 5,116 (44.6%) | 53.0 |
| Total | 11,475 (100.0%) | 55.0 |
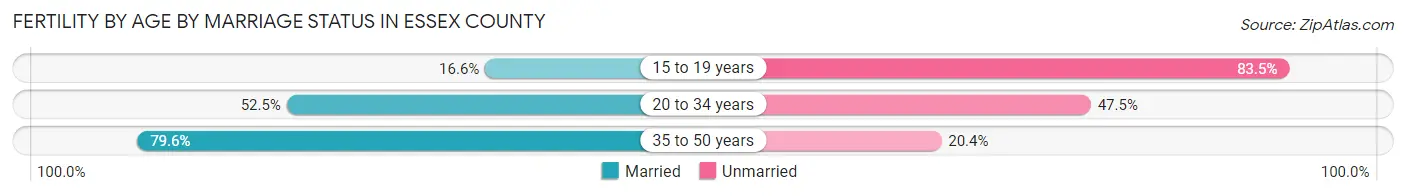
Fertility by Age by Marriage Status in Essex County
64.2% of women with births (11,475) in Essex County are married. The highest percentage of unmarried women with births falls into 15 to 19 years age bracket with 83.5% of them unmarried at the time of birth, while the lowest percentage of unmarried women with births belong to 35 to 50 years age bracket with 20.4% of them unmarried.
| Age Bracket | Married | Unmarried |
| 15 to 19 years | 23 (16.6%) | 116 (83.5%) |
| 20 to 34 years | 3,266 (52.5%) | 2,954 (47.5%) |
| 35 to 50 years | 4,072 (79.6%) | 1,044 (20.4%) |
| Total | 7,367 (64.2%) | 4,108 (35.8%) |
Fertility by Education in Essex County
Average fertility rate in Essex County is 55.0 births per 1,000 women. Women with the education attainment of graduate degree have the highest fertility rate of 66.0 births per 1,000 women, while women with the education attainment of less than high school have the lowest fertility at 42.0 births per 1,000 women. Women with the education attainment of high school diploma represent 27.1% of all women with births.

| Educational Attainment | Women with Births | Births / 1,000 Women |
| Less than High School | 1,420 (12.4%) | 42.0 |
| High School Diploma | 3,113 (27.1%) | 64.0 |
| College or Associate's Degree | 2,793 (24.3%) | 53.0 |
| Bachelor's Degree | 2,324 (20.3%) | 50.0 |
| Graduate Degree | 1,825 (15.9%) | 66.0 |
| Total | 11,475 (100.0%) | 55.0 |
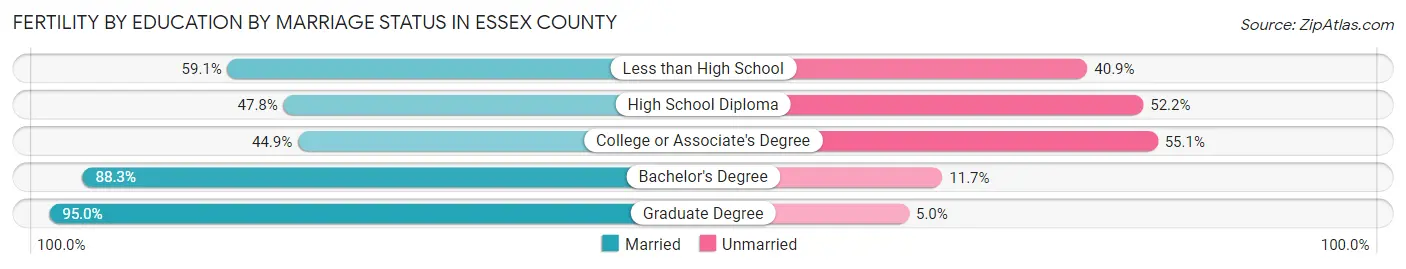
Fertility by Education by Marriage Status in Essex County
35.8% of women with births in Essex County are unmarried. Women with the educational attainment of graduate degree are most likely to be married with 95.0% of them married at childbirth, while women with the educational attainment of college or associate's degree are least likely to be married with 55.1% of them unmarried at childbirth.
| Educational Attainment | Married | Unmarried |
| Less than High School | 839 (59.1%) | 581 (40.9%) |
| High School Diploma | 1,488 (47.8%) | 1,625 (52.2%) |
| College or Associate's Degree | 1,254 (44.9%) | 1,539 (55.1%) |
| Bachelor's Degree | 2,052 (88.3%) | 272 (11.7%) |
| Graduate Degree | 1,734 (95.0%) | 91 (5.0%) |
| Total | 7,367 (64.2%) | 4,108 (35.8%) |
Income in Essex County
Income Overview in Essex County
Per Capita Income in Essex County is $45,946, while median incomes of families and households are $97,380 and $73,785 respectively.
| Characteristic | Number | Measure |
| Per Capita Income | 853,374 | $45,946 |
| Median Family Income | 201,812 | $97,380 |
| Mean Family Income | 201,812 | $151,022 |
| Median Household Income | 312,942 | $73,785 |
| Mean Household Income | 312,942 | $122,134 |
| Income Deficit | 201,812 | $11,914 |
| Wage / Income Gap (%) | 853,374 | 24.46% |
| Wage / Income Gap ($) | 853,374 | 75.54¢ per $1 |
| Gini / Inequality Index | 853,374 | 0.55 |
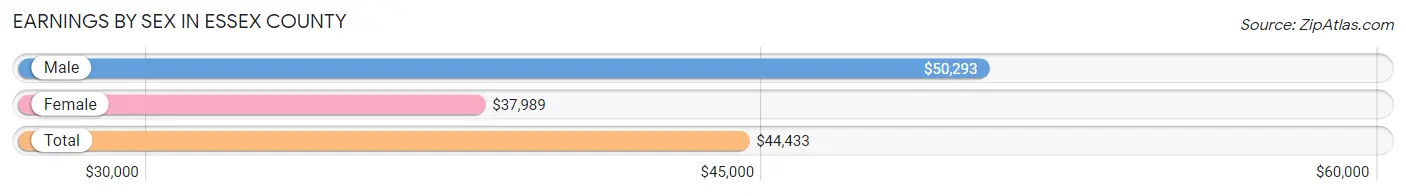
Earnings by Sex in Essex County
Average Earnings in Essex County are $44,433, $50,293 for men and $37,989 for women, a difference of 24.5%.
| Sex | Number | Average Earnings |
| Male | 230,239 (51.3%) | $50,293 |
| Female | 218,663 (48.7%) | $37,989 |
| Total | 448,902 (100.0%) | $44,433 |
Earnings by Sex by Income Bracket in Essex County
The most common earnings brackets in Essex County are $100,000+ for men (55,760 | 24.2%) and $100,000+ for women (33,383 | 15.3%).

| Income | Male | Female |
| $2,499 or less | 9,445 (4.1%) | 12,760 (5.8%) |
| $2,500 to $4,999 | 5,117 (2.2%) | 7,961 (3.6%) |
| $5,000 to $7,499 | 6,262 (2.7%) | 7,459 (3.4%) |
| $7,500 to $9,999 | 3,968 (1.7%) | 6,436 (2.9%) |
| $10,000 to $12,499 | 5,622 (2.4%) | 7,550 (3.5%) |
| $12,500 to $14,999 | 5,031 (2.2%) | 5,484 (2.5%) |
| $15,000 to $17,499 | 4,479 (1.9%) | 7,856 (3.6%) |
| $17,500 to $19,999 | 4,307 (1.9%) | 5,593 (2.6%) |
| $20,000 to $22,499 | 5,057 (2.2%) | 6,443 (2.9%) |
| $22,500 to $24,999 | 6,875 (3.0%) | 8,038 (3.7%) |
| $25,000 to $29,999 | 12,992 (5.6%) | 13,316 (6.1%) |
| $30,000 to $34,999 | 12,850 (5.6%) | 13,650 (6.2%) |
| $35,000 to $39,999 | 11,167 (4.9%) | 10,514 (4.8%) |
| $40,000 to $44,999 | 11,049 (4.8%) | 9,030 (4.1%) |
| $45,000 to $49,999 | 10,371 (4.5%) | 8,900 (4.1%) |
| $50,000 to $54,999 | 8,131 (3.5%) | 6,619 (3.0%) |
| $55,000 to $64,999 | 16,412 (7.1%) | 15,233 (7.0%) |
| $65,000 to $74,999 | 13,701 (5.9%) | 13,040 (6.0%) |
| $75,000 to $99,999 | 21,643 (9.4%) | 19,398 (8.9%) |
| $100,000+ | 55,760 (24.2%) | 33,383 (15.3%) |
| Total | 230,239 (100.0%) | 218,663 (100.0%) |
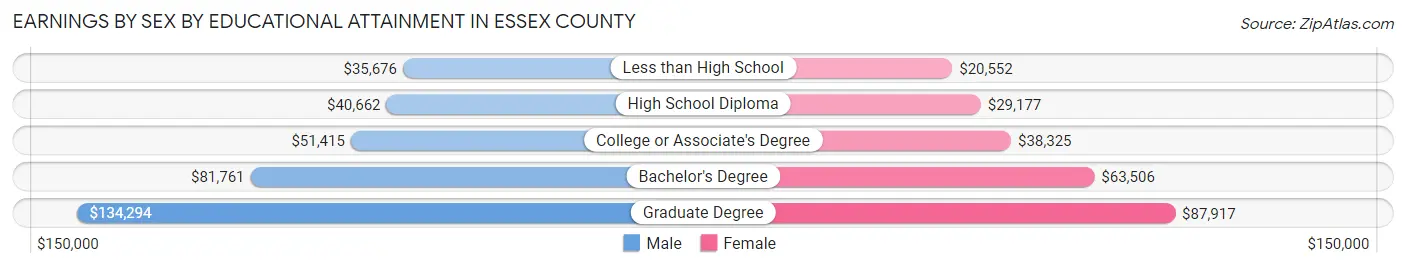
Earnings by Sex by Educational Attainment in Essex County
Average earnings in Essex County are $57,249 for men and $43,874 for women, a difference of 23.4%. Men with an educational attainment of graduate degree enjoy the highest average annual earnings of $134,294, while those with less than high school education earn the least with $35,676. Women with an educational attainment of graduate degree earn the most with the average annual earnings of $87,917, while those with less than high school education have the smallest earnings of $20,552.
| Educational Attainment | Male Income | Female Income |
| Less than High School | $35,676 | $20,552 |
| High School Diploma | $40,662 | $29,177 |
| College or Associate's Degree | $51,415 | $38,325 |
| Bachelor's Degree | $81,761 | $63,506 |
| Graduate Degree | $134,294 | $87,917 |
| Total | $57,249 | $43,874 |
Family Income in Essex County
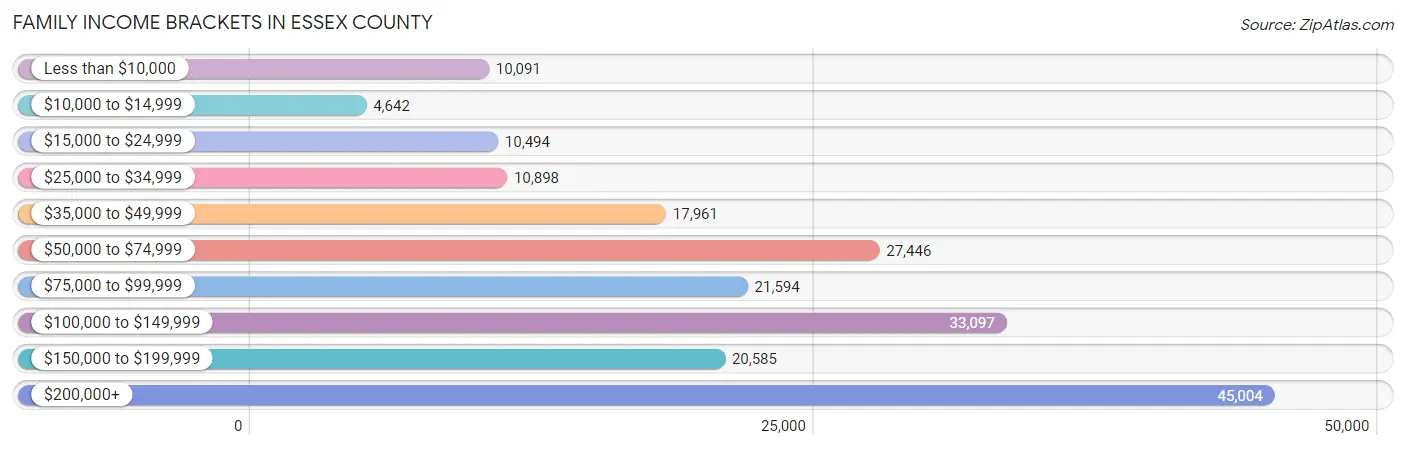
Family Income Brackets in Essex County
According to the Essex County family income data, there are 45,004 families falling into the $200,000+ income range, which is the most common income bracket and makes up 22.3% of all families. Conversely, the $10,000 to $14,999 income bracket is the least frequent group with only 4,642 families (2.3%) belonging to this category.
| Income Bracket | # Families | % Families |
| Less than $10,000 | 10,091 | 5.0% |
| $10,000 to $14,999 | 4,642 | 2.3% |
| $15,000 to $24,999 | 10,494 | 5.2% |
| $25,000 to $34,999 | 10,898 | 5.4% |
| $35,000 to $49,999 | 17,961 | 8.9% |
| $50,000 to $74,999 | 27,446 | 13.6% |
| $75,000 to $99,999 | 21,594 | 10.7% |
| $100,000 to $149,999 | 33,097 | 16.4% |
| $150,000 to $199,999 | 20,585 | 10.2% |
| $200,000+ | 45,004 | 22.3% |
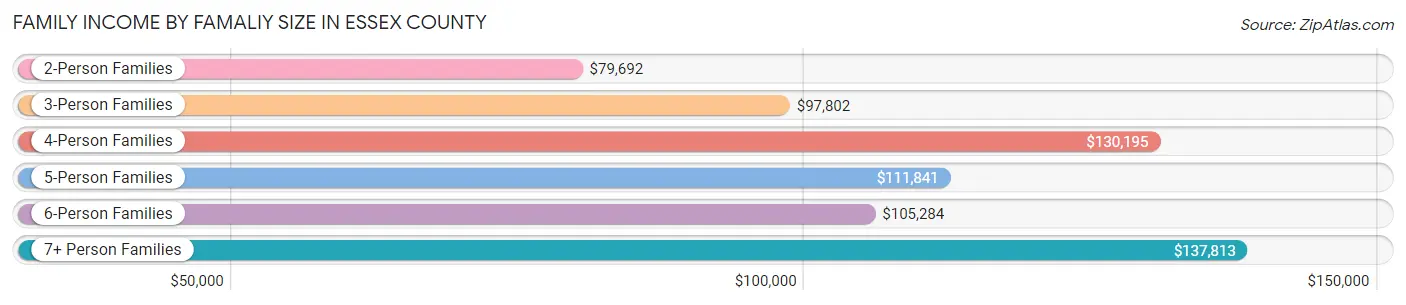
Family Income by Famaliy Size in Essex County
7+ person families (3,587 | 1.8%) account for the highest median family income in Essex County with $137,813 per family, while 2-person families (77,671 | 38.5%) have the highest median income of $39,846 per family member.
| Income Bracket | # Families | Median Income |
| 2-Person Families | 77,671 (38.5%) | $79,692 |
| 3-Person Families | 52,248 (25.9%) | $97,802 |
| 4-Person Families | 43,516 (21.6%) | $130,195 |
| 5-Person Families | 18,440 (9.1%) | $111,841 |
| 6-Person Families | 6,350 (3.2%) | $105,284 |
| 7+ Person Families | 3,587 (1.8%) | $137,813 |
| Total | 201,812 (100.0%) | $97,380 |
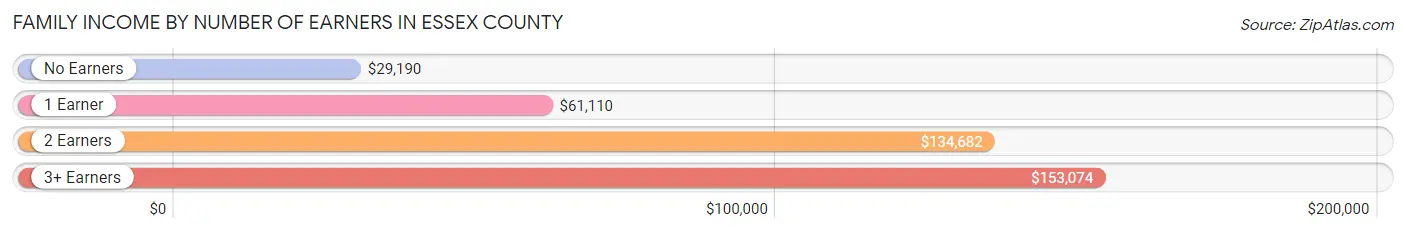
Family Income by Number of Earners in Essex County
The median family income in Essex County is $97,380, with families comprising 3+ earners (27,351) having the highest median family income of $153,074, while families with no earners (21,629) have the lowest median family income of $29,190, accounting for 13.6% and 10.7% of families, respectively.
| Number of Earners | # Families | Median Income |
| No Earners | 21,629 (10.7%) | $29,190 |
| 1 Earner | 68,459 (33.9%) | $61,110 |
| 2 Earners | 84,373 (41.8%) | $134,682 |
| 3+ Earners | 27,351 (13.6%) | $153,074 |
| Total | 201,812 (100.0%) | $97,380 |
Household Income in Essex County
Household Income Brackets in Essex County
With 50,697 households falling in the category, the $200,000+ income range is the most frequent in Essex County, accounting for 16.2% of all households. In contrast, only 14,708 households (4.7%) fall into the $10,000 to $14,999 income bracket, making it the least populous group.
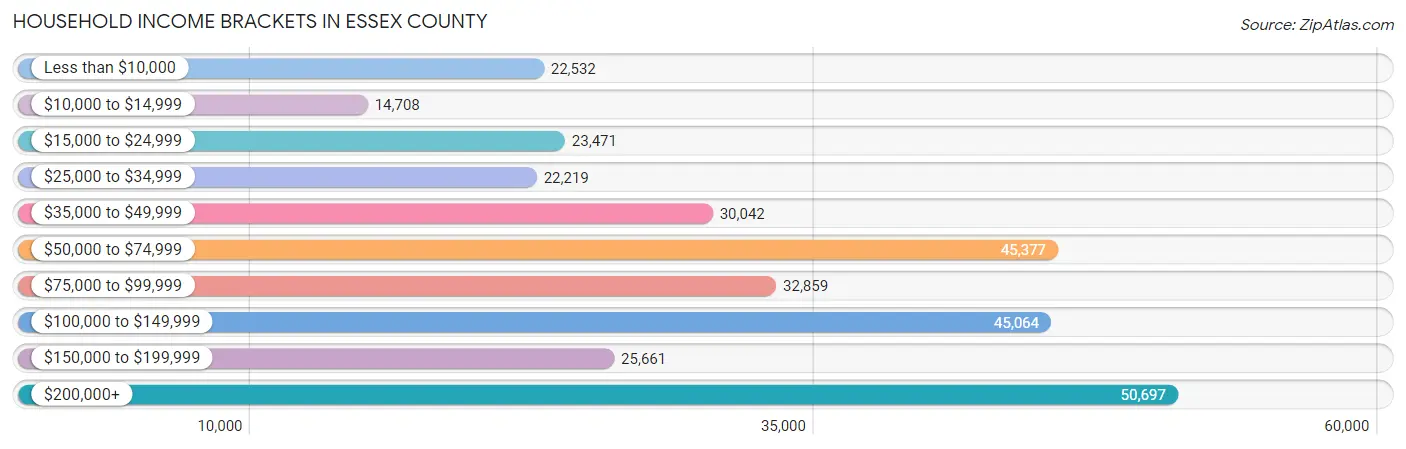
| Income Bracket | # Households | % Households |
| Less than $10,000 | 22,532 | 7.2% |
| $10,000 to $14,999 | 14,708 | 4.7% |
| $15,000 to $24,999 | 23,471 | 7.5% |
| $25,000 to $34,999 | 22,219 | 7.1% |
| $35,000 to $49,999 | 30,042 | 9.6% |
| $50,000 to $74,999 | 45,377 | 14.5% |
| $75,000 to $99,999 | 32,859 | 10.5% |
| $100,000 to $149,999 | 45,064 | 14.4% |
| $150,000 to $199,999 | 25,661 | 8.2% |
| $200,000+ | 50,697 | 16.2% |
Household Income by Householder Age in Essex County
The median household income in Essex County is $73,785, with the highest median household income of $88,945 found in the 45 to 64 years age bracket for the primary householder. A total of 125,222 households (40.0%) fall into this category. Meanwhile, the 15 to 24 years age bracket for the primary householder has the lowest median household income of $38,469, with 7,029 households (2.2%) in this group.
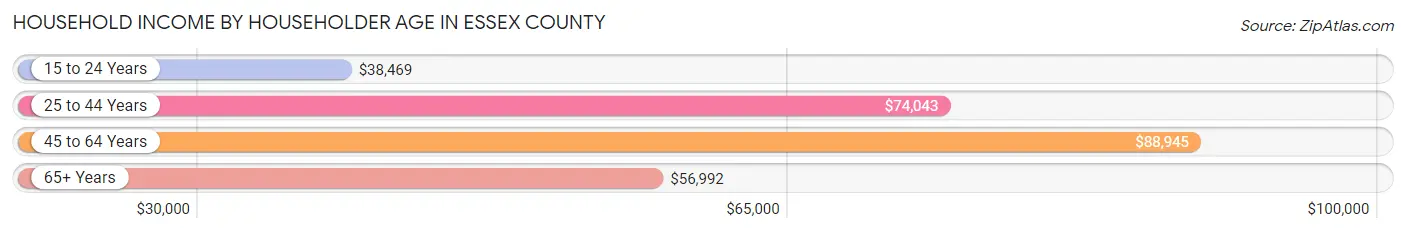
| Income Bracket | # Households | Median Income |
| 15 to 24 Years | 7,029 (2.2%) | $38,469 |
| 25 to 44 Years | 106,987 (34.2%) | $74,043 |
| 45 to 64 Years | 125,222 (40.0%) | $88,945 |
| 65+ Years | 73,704 (23.5%) | $56,992 |
| Total | 312,942 (100.0%) | $73,785 |
Poverty in Essex County
Income Below Poverty by Sex and Age in Essex County
With 13.2% poverty level for males and 16.7% for females among the residents of Essex County, 5 year old males and 16 and 17 year old females are the most vulnerable to poverty, with 1,604 males (27.0%) and 2,283 females (20.7%) in their respective age groups living below the poverty level.
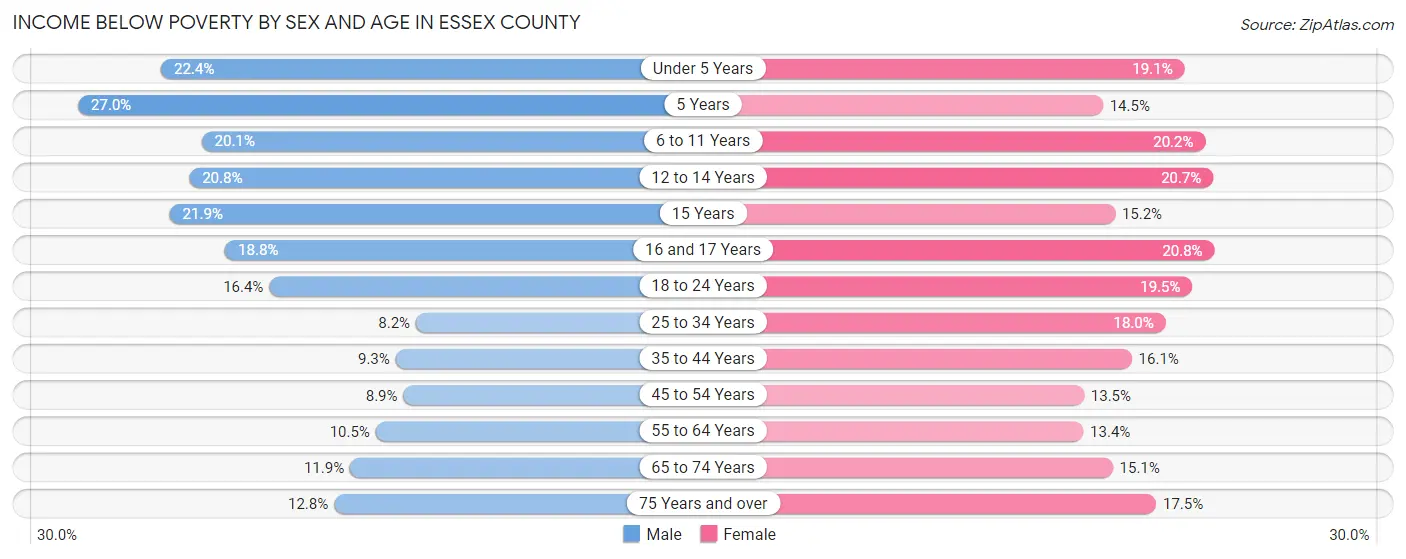
| Age Bracket | Male | Female |
| Under 5 Years | 6,086 (22.4%) | 4,992 (19.1%) |
| 5 Years | 1,604 (27.0%) | 783 (14.5%) |
| 6 to 11 Years | 6,921 (20.1%) | 6,526 (20.2%) |
| 12 to 14 Years | 3,588 (20.8%) | 3,531 (20.7%) |
| 15 Years | 1,322 (21.9%) | 794 (15.2%) |
| 16 and 17 Years | 2,037 (18.8%) | 2,283 (20.7%) |
| 18 to 24 Years | 5,876 (16.4%) | 6,866 (19.5%) |
| 25 to 34 Years | 4,554 (8.2%) | 10,460 (18.0%) |
| 35 to 44 Years | 5,347 (9.3%) | 9,816 (16.1%) |
| 45 to 54 Years | 4,999 (8.9%) | 7,973 (13.5%) |
| 55 to 64 Years | 5,098 (10.4%) | 7,221 (13.4%) |
| 65 to 74 Years | 3,513 (11.9%) | 5,675 (15.1%) |
| 75 Years and over | 2,247 (12.8%) | 5,116 (17.5%) |
| Total | 53,192 (13.2%) | 72,036 (16.7%) |
Income Above Poverty by Sex and Age in Essex County
According to the poverty statistics in Essex County, males aged 25 to 34 years and females aged 55 to 64 years are the age groups that are most secure financially, with 91.8% of males and 86.6% of females in these age groups living above the poverty line.
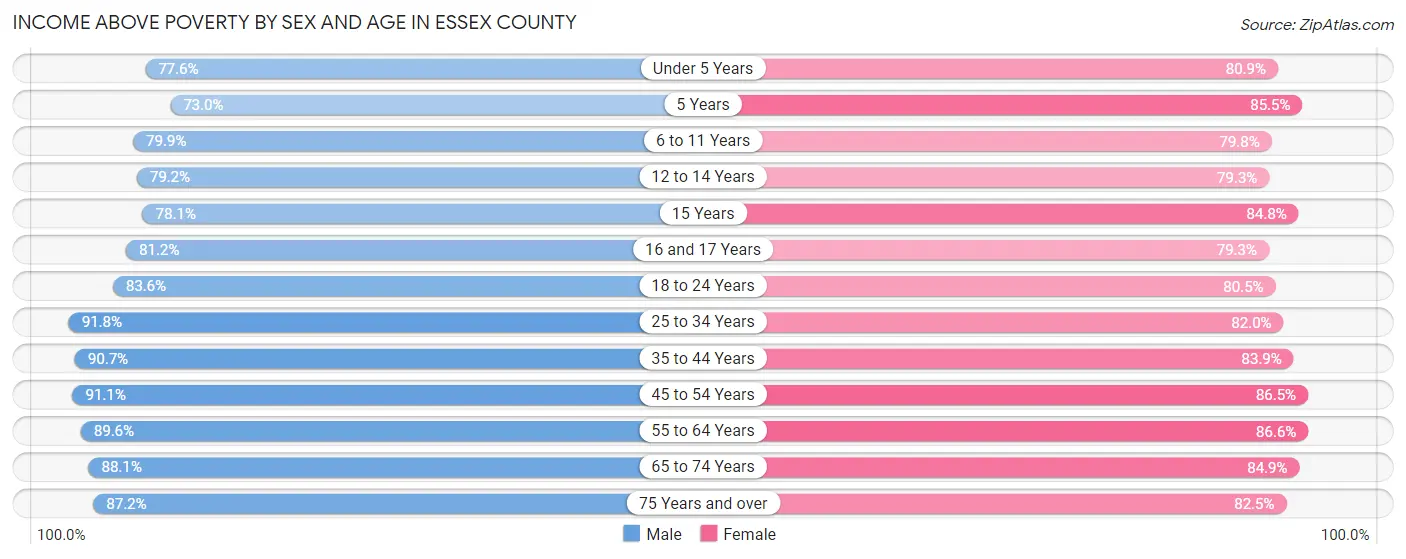
| Age Bracket | Male | Female |
| Under 5 Years | 21,080 (77.6%) | 21,178 (80.9%) |
| 5 Years | 4,331 (73.0%) | 4,606 (85.5%) |
| 6 to 11 Years | 27,436 (79.9%) | 25,718 (79.8%) |
| 12 to 14 Years | 13,640 (79.2%) | 13,543 (79.3%) |
| 15 Years | 4,710 (78.1%) | 4,426 (84.8%) |
| 16 and 17 Years | 8,782 (81.2%) | 8,718 (79.2%) |
| 18 to 24 Years | 29,996 (83.6%) | 28,302 (80.5%) |
| 25 to 34 Years | 50,930 (91.8%) | 47,552 (82.0%) |
| 35 to 44 Years | 51,897 (90.7%) | 51,006 (83.9%) |
| 45 to 54 Years | 51,076 (91.1%) | 51,156 (86.5%) |
| 55 to 64 Years | 43,668 (89.5%) | 46,517 (86.6%) |
| 65 to 74 Years | 26,064 (88.1%) | 31,953 (84.9%) |
| 75 Years and over | 15,346 (87.2%) | 24,114 (82.5%) |
| Total | 348,956 (86.8%) | 358,789 (83.3%) |
Income Below Poverty Among Married-Couple Families in Essex County
The poverty statistics for married-couple families in Essex County show that 4.9% or 6,120 of the total 126,219 families live below the poverty line. Families with 5 or more children have the highest poverty rate of 23.7%, comprising of 102 families. On the other hand, families with no children have the lowest poverty rate of 3.6%, which includes 2,346 families.
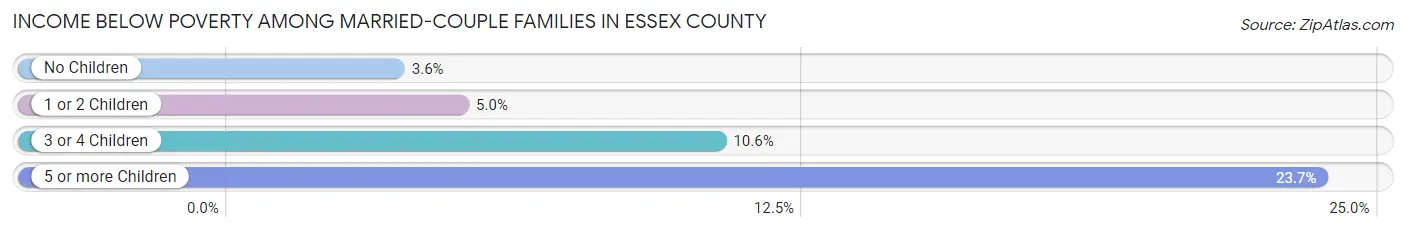
| Children | Above Poverty | Below Poverty |
| No Children | 62,273 (96.4%) | 2,346 (3.6%) |
| 1 or 2 Children | 48,044 (95.0%) | 2,547 (5.0%) |
| 3 or 4 Children | 9,454 (89.4%) | 1,125 (10.6%) |
| 5 or more Children | 328 (76.3%) | 102 (23.7%) |
| Total | 120,099 (95.2%) | 6,120 (4.9%) |
Income Below Poverty Among Single-Parent Households in Essex County
According to the poverty data in Essex County, 14.4% or 2,806 single-father households and 27.0% or 15,155 single-mother households are living below the poverty line. Among single-father households, those with 3 or 4 children have the highest poverty rate, with 666 households (40.7%) experiencing poverty. Likewise, among single-mother households, those with 5 or more children have the highest poverty rate, with 332 households (82.8%) falling below the poverty line.
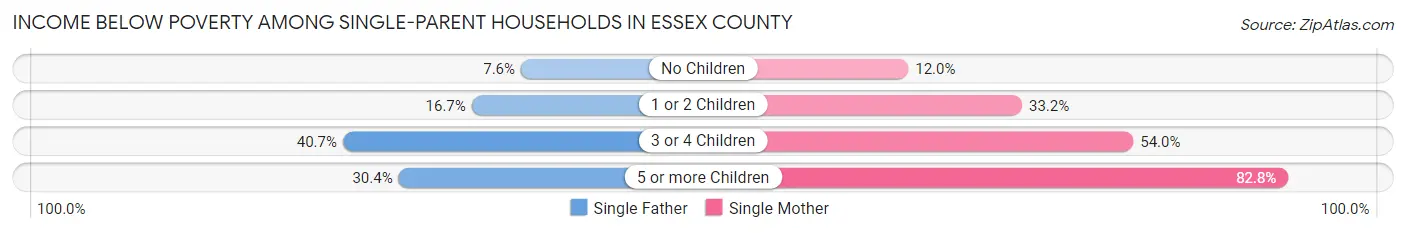
| Children | Single Father | Single Mother |
| No Children | 714 (7.6%) | 2,695 (12.0%) |
| 1 or 2 Children | 1,392 (16.7%) | 9,367 (33.2%) |
| 3 or 4 Children | 666 (40.7%) | 2,761 (53.9%) |
| 5 or more Children | 34 (30.4%) | 332 (82.8%) |
| Total | 2,806 (14.4%) | 15,155 (27.0%) |
Income Below Poverty Among Married-Couple vs Single-Parent Households in Essex County
The poverty data for Essex County shows that 6,120 of the married-couple family households (4.9%) and 17,961 of the single-parent households (23.8%) are living below the poverty level. Within the married-couple family households, those with 5 or more children have the highest poverty rate, with 102 households (23.7%) falling below the poverty line. Among the single-parent households, those with 5 or more children have the highest poverty rate, with 366 household (71.4%) living below poverty.
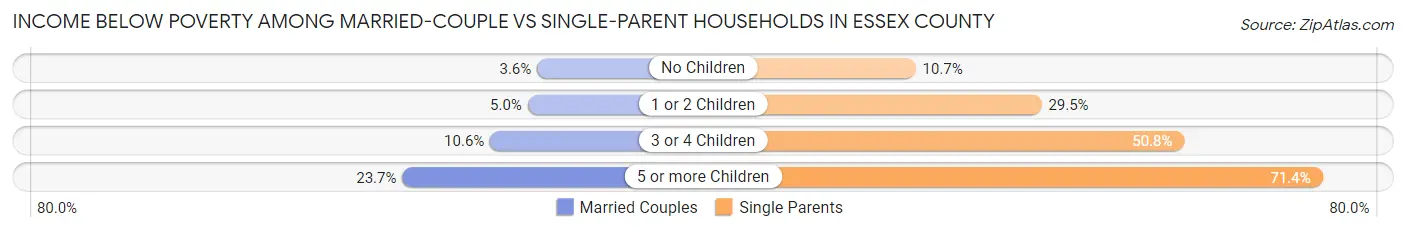
| Children | Married-Couple Families | Single-Parent Households |
| No Children | 2,346 (3.6%) | 3,409 (10.7%) |
| 1 or 2 Children | 2,547 (5.0%) | 10,759 (29.5%) |
| 3 or 4 Children | 1,125 (10.6%) | 3,427 (50.7%) |
| 5 or more Children | 102 (23.7%) | 366 (71.4%) |
| Total | 6,120 (4.9%) | 17,961 (23.8%) |
Employment Characteristics in Essex County
Employment by Class of Employer in Essex County
Among the 396,088 employed individuals in Essex County, private company employees (273,432 | 69.0%), not-for-profit organizations (30,652 | 7.7%), and local government employees (28,987 | 7.3%) make up the most common classes of employment.
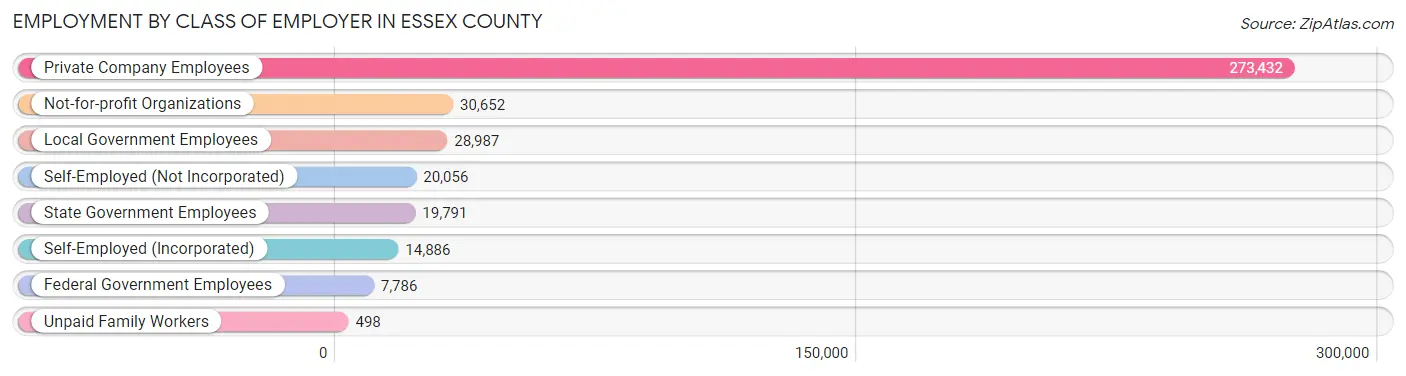
| Employer Class | # Employees | % Employees |
| Private Company Employees | 273,432 | 69.0% |
| Self-Employed (Incorporated) | 14,886 | 3.8% |
| Self-Employed (Not Incorporated) | 20,056 | 5.1% |
| Not-for-profit Organizations | 30,652 | 7.7% |
| Local Government Employees | 28,987 | 7.3% |
| State Government Employees | 19,791 | 5.0% |
| Federal Government Employees | 7,786 | 2.0% |
| Unpaid Family Workers | 498 | 0.1% |
| Total | 396,088 | 100.0% |
Employment Status by Age in Essex County
According to the labor force statistics for Essex County, out of the total population over 16 years of age (674,180), 66.2% or 446,307 individuals are in the labor force, with 8.5% or 37,936 of them unemployed. The age group with the highest labor force participation rate is 35 to 44 years, with 85.8% or 102,616 individuals in the labor force. Within the labor force, the 16 to 19 years age range has the highest percentage of unemployed individuals, with 24.4% or 2,921 of them being unemployed.
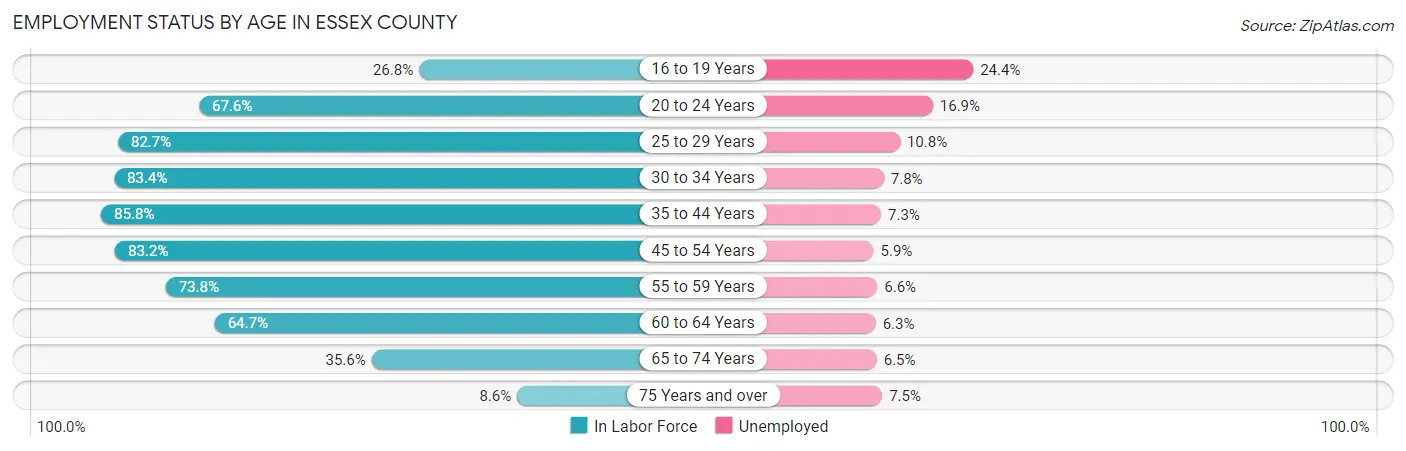
| Age Bracket | In Labor Force | Unemployed |
| 16 to 19 Years | 11,973 (26.8%) | 2,921 (24.4%) |
| 20 to 24 Years | 38,052 (67.6%) | 6,431 (16.9%) |
| 25 to 29 Years | 46,934 (82.7%) | 5,069 (10.8%) |
| 30 to 34 Years | 49,269 (83.4%) | 3,843 (7.8%) |
| 35 to 44 Years | 102,616 (85.8%) | 7,491 (7.3%) |
| 45 to 54 Years | 96,905 (83.2%) | 5,717 (5.9%) |
| 55 to 59 Years | 40,335 (73.8%) | 2,662 (6.6%) |
| 60 to 64 Years | 31,869 (64.7%) | 2,008 (6.3%) |
| 65 to 74 Years | 24,321 (35.6%) | 1,581 (6.5%) |
| 75 Years and over | 4,221 (8.6%) | 317 (7.5%) |
| Total | 446,307 (66.2%) | 37,936 (8.5%) |
Employment Status by Educational Attainment in Essex County
According to labor force statistics for Essex County, 80.7% of individuals (367,839) out of the total population between 25 and 64 years of age (455,810) are in the labor force, with 7.3% or 26,852 of them being unemployed. The group with the highest labor force participation rate are those with the educational attainment of bachelor's degree or higher, with 89.4% or 157,556 individuals in the labor force. Within the labor force, individuals with high school diploma education have the highest percentage of unemployment, with 10.6% or 9,728 of them being unemployed.
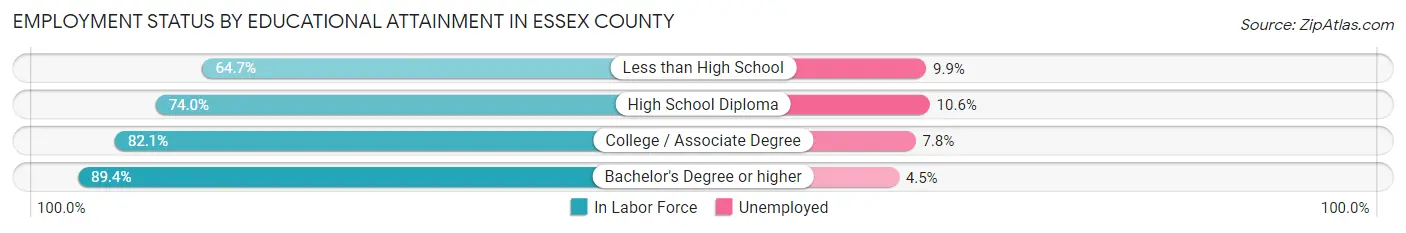
| Educational Attainment | In Labor Force | Unemployed |
| Less than High School | 34,225 (64.7%) | 5,237 (9.9%) |
| High School Diploma | 91,773 (74.0%) | 13,146 (10.6%) |
| College / Associate Degree | 84,282 (82.1%) | 8,007 (7.8%) |
| Bachelor's Degree or higher | 157,556 (89.4%) | 7,931 (4.5%) |
| Total | 367,839 (80.7%) | 33,274 (7.3%) |
Employment Occupations by Sex in Essex County
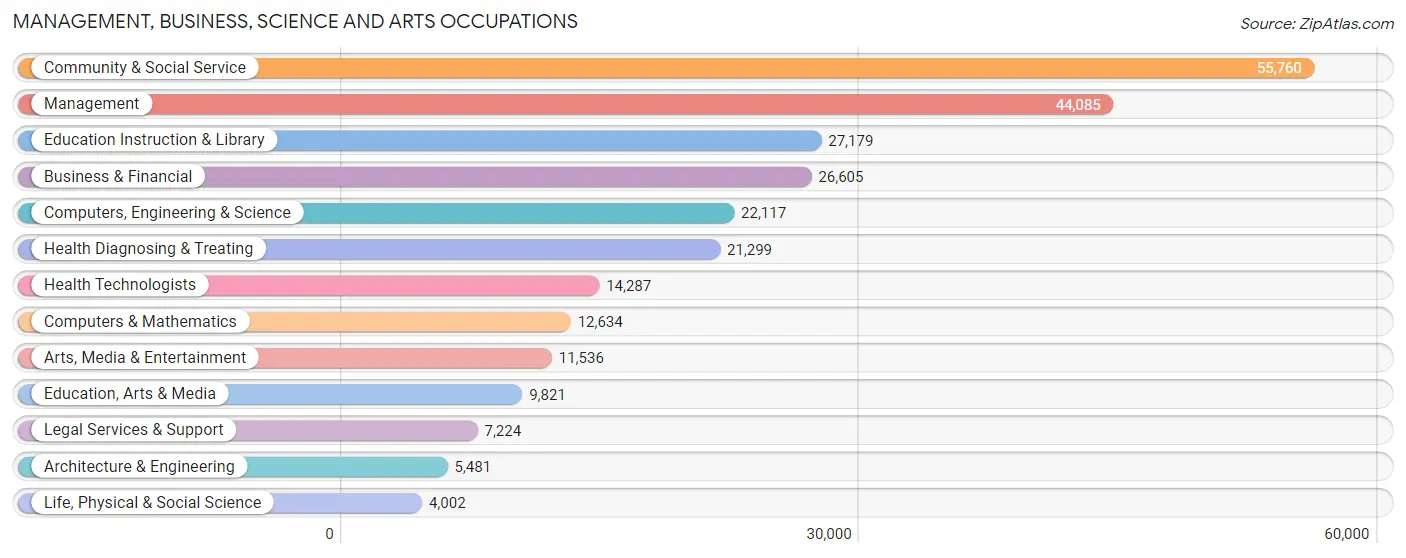
Management, Business, Science and Arts Occupations
The most common Management, Business, Science and Arts occupations in Essex County are Community & Social Service (55,760 | 13.7%), Management (44,085 | 10.8%), Education Instruction & Library (27,179 | 6.7%), Business & Financial (26,605 | 6.5%), and Computers, Engineering & Science (22,117 | 5.4%).
Management, Business, Science and Arts Occupations by Sex
Within the Management, Business, Science and Arts occupations in Essex County, the most male-oriented occupations are Architecture & Engineering (86.8%), Computers & Mathematics (74.3%), and Computers, Engineering & Science (72.9%), while the most female-oriented occupations are Education Instruction & Library (72.9%), Health Diagnosing & Treating (69.6%), and Health Technologists (67.6%).
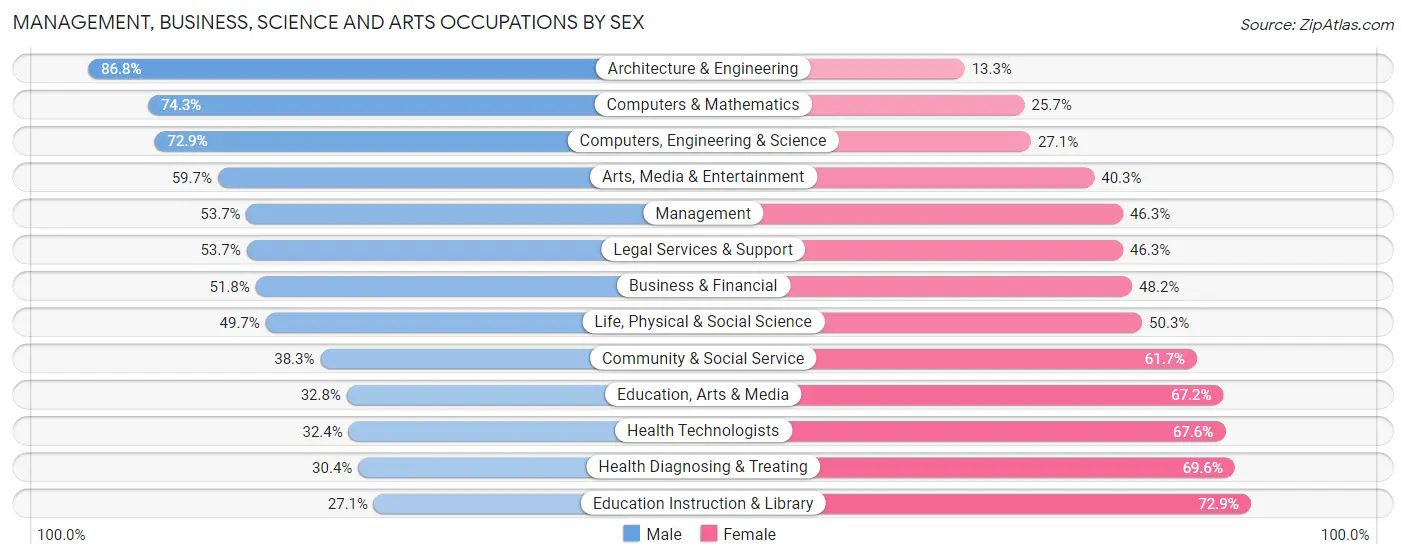
| Occupation | Male | Female |
| Management | 23,687 (53.7%) | 20,398 (46.3%) |
| Business & Financial | 13,788 (51.8%) | 12,817 (48.2%) |
| Computers, Engineering & Science | 16,127 (72.9%) | 5,990 (27.1%) |
| Computers & Mathematics | 9,382 (74.3%) | 3,252 (25.7%) |
| Architecture & Engineering | 4,755 (86.8%) | 726 (13.3%) |
| Life, Physical & Social Science | 1,990 (49.7%) | 2,012 (50.3%) |
| Community & Social Service | 21,366 (38.3%) | 34,394 (61.7%) |
| Education, Arts & Media | 3,222 (32.8%) | 6,599 (67.2%) |
| Legal Services & Support | 3,880 (53.7%) | 3,344 (46.3%) |
| Education Instruction & Library | 7,376 (27.1%) | 19,803 (72.9%) |
| Arts, Media & Entertainment | 6,888 (59.7%) | 4,648 (40.3%) |
| Health Diagnosing & Treating | 6,479 (30.4%) | 14,820 (69.6%) |
| Health Technologists | 4,633 (32.4%) | 9,654 (67.6%) |
| Total (Category) | 81,447 (47.9%) | 88,419 (52.0%) |
| Total (Overall) | 210,777 (51.6%) | 197,305 (48.3%) |
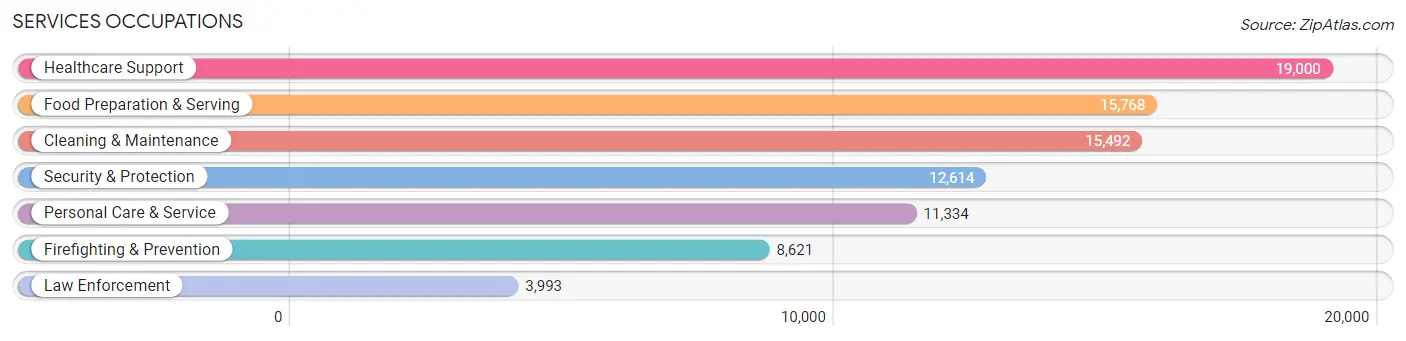
Services Occupations
The most common Services occupations in Essex County are Healthcare Support (19,000 | 4.7%), Food Preparation & Serving (15,768 | 3.9%), Cleaning & Maintenance (15,492 | 3.8%), Security & Protection (12,614 | 3.1%), and Personal Care & Service (11,334 | 2.8%).
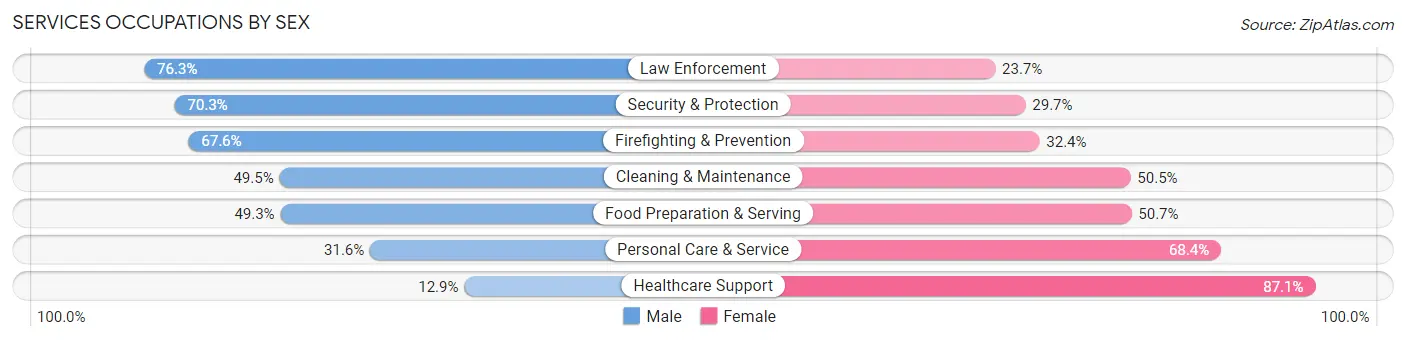
Services Occupations by Sex
Within the Services occupations in Essex County, the most male-oriented occupations are Law Enforcement (76.3%), Security & Protection (70.3%), and Firefighting & Prevention (67.6%), while the most female-oriented occupations are Healthcare Support (87.1%), Personal Care & Service (68.4%), and Food Preparation & Serving (50.7%).
| Occupation | Male | Female |
| Healthcare Support | 2,456 (12.9%) | 16,544 (87.1%) |
| Security & Protection | 8,872 (70.3%) | 3,742 (29.7%) |
| Firefighting & Prevention | 5,824 (67.6%) | 2,797 (32.4%) |
| Law Enforcement | 3,048 (76.3%) | 945 (23.7%) |
| Food Preparation & Serving | 7,780 (49.3%) | 7,988 (50.7%) |
| Cleaning & Maintenance | 7,673 (49.5%) | 7,819 (50.5%) |
| Personal Care & Service | 3,579 (31.6%) | 7,755 (68.4%) |
| Total (Category) | 30,360 (40.9%) | 43,848 (59.1%) |
| Total (Overall) | 210,777 (51.6%) | 197,305 (48.3%) |
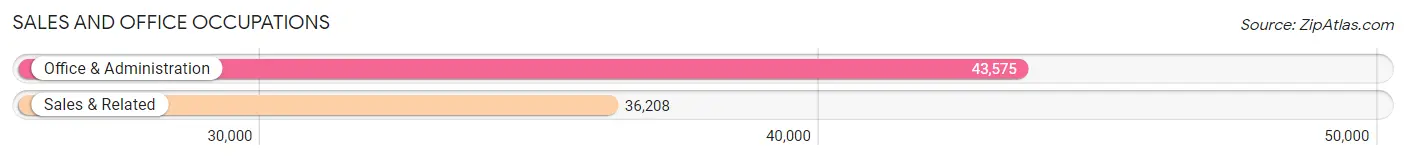
Sales and Office Occupations
The most common Sales and Office occupations in Essex County are Office & Administration (43,575 | 10.7%), and Sales & Related (36,208 | 8.9%).
Sales and Office Occupations by Sex
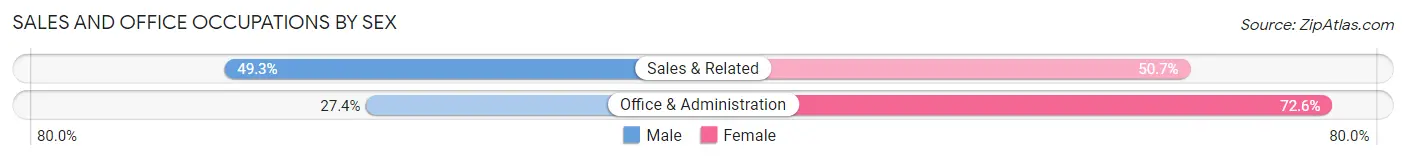
| Occupation | Male | Female |
| Sales & Related | 17,836 (49.3%) | 18,372 (50.7%) |
| Office & Administration | 11,950 (27.4%) | 31,625 (72.6%) |
| Total (Category) | 29,786 (37.3%) | 49,997 (62.7%) |
| Total (Overall) | 210,777 (51.6%) | 197,305 (48.3%) |
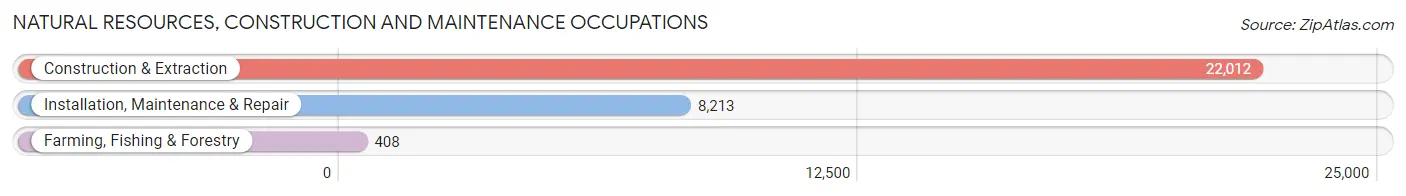
Natural Resources, Construction and Maintenance Occupations
The most common Natural Resources, Construction and Maintenance occupations in Essex County are Construction & Extraction (22,012 | 5.4%), Installation, Maintenance & Repair (8,213 | 2.0%), and Farming, Fishing & Forestry (408 | 0.1%).
Natural Resources, Construction and Maintenance Occupations by Sex
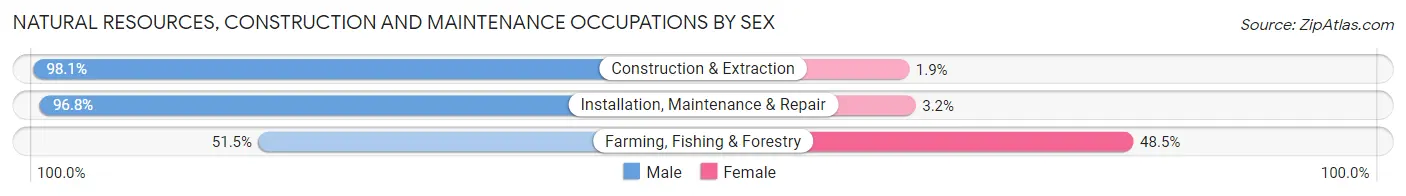
| Occupation | Male | Female |
| Farming, Fishing & Forestry | 210 (51.5%) | 198 (48.5%) |
| Construction & Extraction | 21,603 (98.1%) | 409 (1.9%) |
| Installation, Maintenance & Repair | 7,950 (96.8%) | 263 (3.2%) |
| Total (Category) | 29,763 (97.2%) | 870 (2.8%) |
| Total (Overall) | 210,777 (51.6%) | 197,305 (48.3%) |
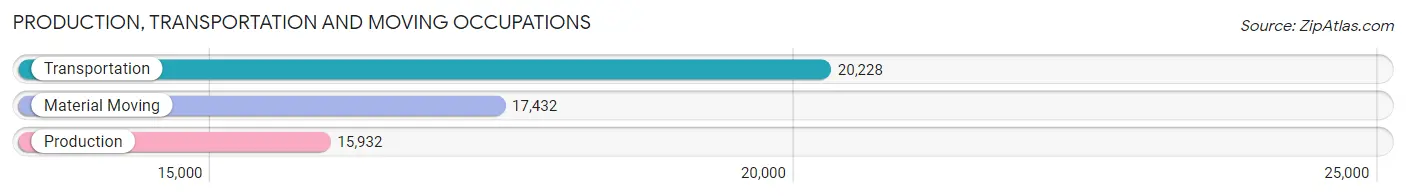
Production, Transportation and Moving Occupations
The most common Production, Transportation and Moving occupations in Essex County are Transportation (20,228 | 5.0%), Material Moving (17,432 | 4.3%), and Production (15,932 | 3.9%).
Production, Transportation and Moving Occupations by Sex

| Occupation | Male | Female |
| Production | 10,132 (63.6%) | 5,800 (36.4%) |
| Transportation | 17,336 (85.7%) | 2,892 (14.3%) |
| Material Moving | 11,953 (68.6%) | 5,479 (31.4%) |
| Total (Category) | 39,421 (73.6%) | 14,171 (26.4%) |
| Total (Overall) | 210,777 (51.6%) | 197,305 (48.3%) |
Employment Industries by Sex in Essex County
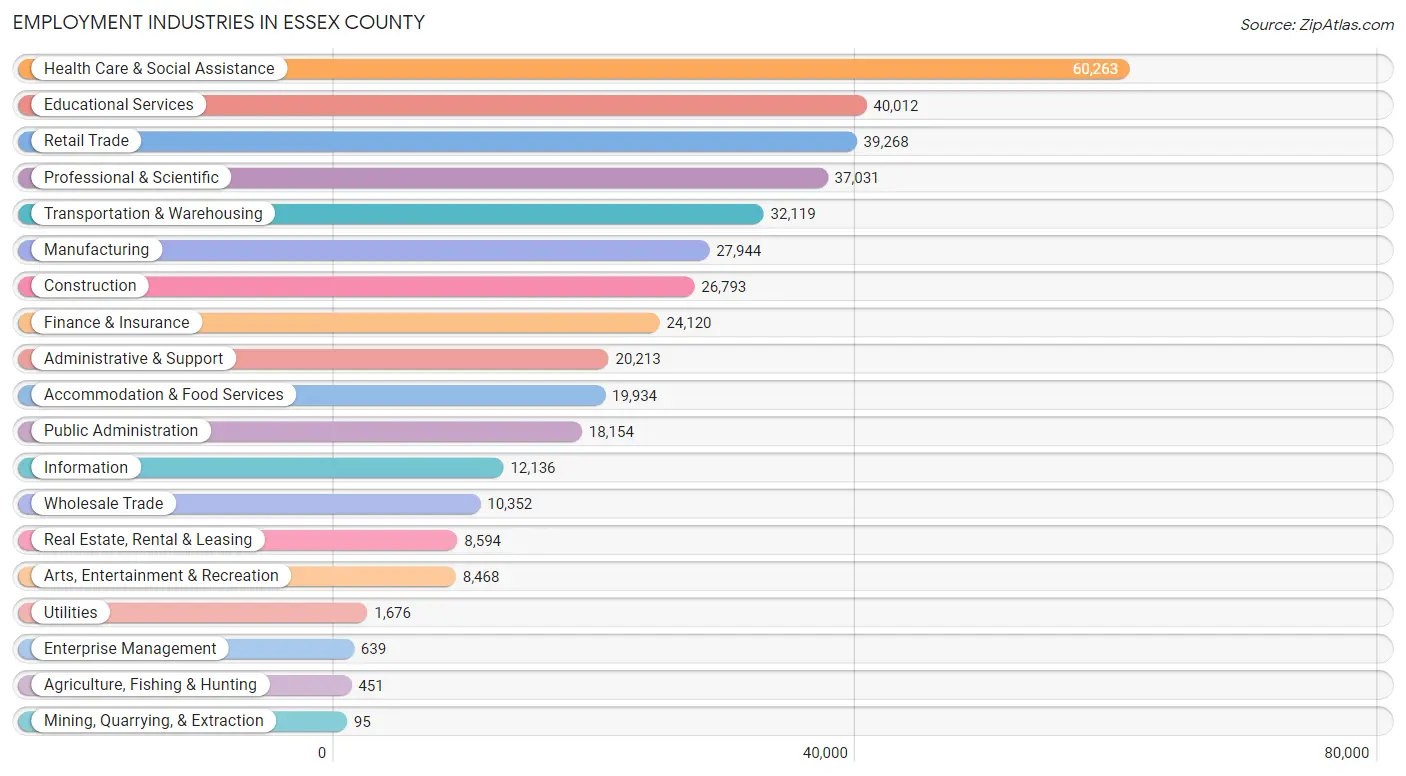
Employment Industries in Essex County
The major employment industries in Essex County include Health Care & Social Assistance (60,263 | 14.8%), Educational Services (40,012 | 9.8%), Retail Trade (39,268 | 9.6%), Professional & Scientific (37,031 | 9.1%), and Transportation & Warehousing (32,119 | 7.9%).
Employment Industries by Sex in Essex County
The Essex County industries that see more men than women are Mining, Quarrying, & Extraction (100.0%), Construction (94.4%), and Utilities (80.3%), whereas the industries that tend to have a higher number of women are Health Care & Social Assistance (75.8%), Educational Services (66.8%), and Enterprise Management (57.9%).
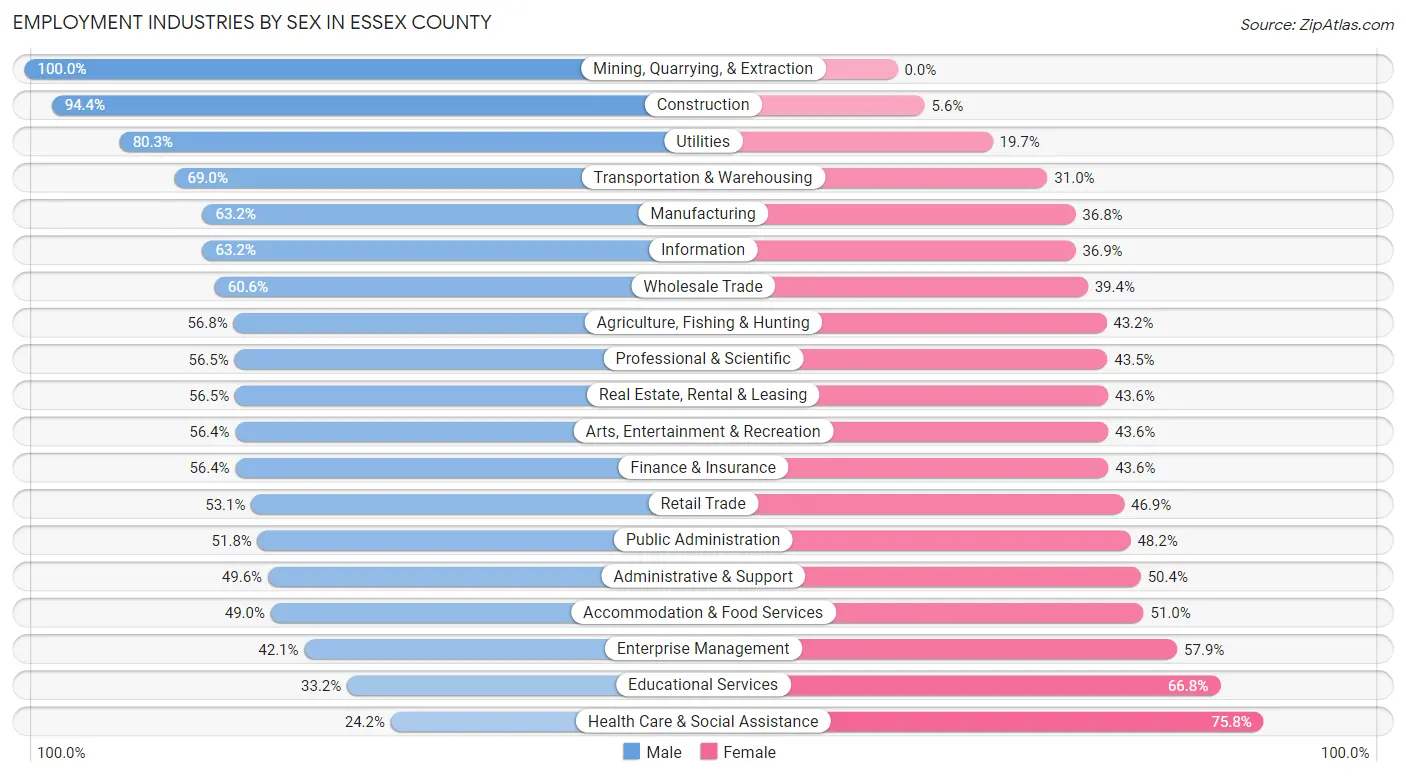
| Industry | Male | Female |
| Agriculture, Fishing & Hunting | 256 (56.8%) | 195 (43.2%) |
| Mining, Quarrying, & Extraction | 95 (100.0%) | 0 (0.0%) |
| Construction | 25,285 (94.4%) | 1,508 (5.6%) |
| Manufacturing | 17,649 (63.2%) | 10,295 (36.8%) |
| Wholesale Trade | 6,274 (60.6%) | 4,078 (39.4%) |
| Retail Trade | 20,844 (53.1%) | 18,424 (46.9%) |
| Transportation & Warehousing | 22,148 (69.0%) | 9,971 (31.0%) |
| Utilities | 1,346 (80.3%) | 330 (19.7%) |
| Information | 7,664 (63.1%) | 4,472 (36.8%) |
| Finance & Insurance | 13,594 (56.4%) | 10,526 (43.6%) |
| Real Estate, Rental & Leasing | 4,851 (56.5%) | 3,743 (43.5%) |
| Professional & Scientific | 20,936 (56.5%) | 16,095 (43.5%) |
| Enterprise Management | 269 (42.1%) | 370 (57.9%) |
| Administrative & Support | 10,034 (49.6%) | 10,179 (50.4%) |
| Educational Services | 13,298 (33.2%) | 26,714 (66.8%) |
| Health Care & Social Assistance | 14,581 (24.2%) | 45,682 (75.8%) |
| Arts, Entertainment & Recreation | 4,774 (56.4%) | 3,694 (43.6%) |
| Accommodation & Food Services | 9,776 (49.0%) | 10,158 (51.0%) |
| Public Administration | 9,396 (51.8%) | 8,758 (48.2%) |
| Total | 210,777 (51.6%) | 197,305 (48.3%) |
Education in Essex County
School Enrollment in Essex County
The most common levels of schooling among the 222,531 students in Essex County are middle school (46,746 | 21.0%), college / undergraduate (45,243 | 20.3%), and high school (45,211 | 20.3%).
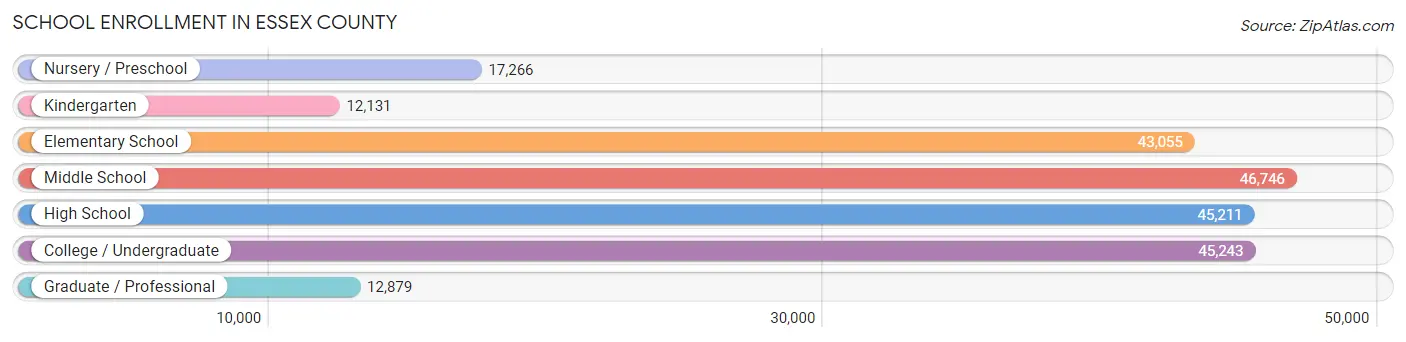
| School Level | # Students | % Students |
| Nursery / Preschool | 17,266 | 7.8% |
| Kindergarten | 12,131 | 5.4% |
| Elementary School | 43,055 | 19.4% |
| Middle School | 46,746 | 21.0% |
| High School | 45,211 | 20.3% |
| College / Undergraduate | 45,243 | 20.3% |
| Graduate / Professional | 12,879 | 5.8% |
| Total | 222,531 | 100.0% |
School Enrollment by Age by Funding Source in Essex County
Out of a total of 222,531 students who are enrolled in schools in Essex County, 39,388 (17.7%) attend a private institution, while the remaining 183,143 (82.3%) are enrolled in public schools. The age group of 35 years and over has the highest likelihood of being enrolled in private schools, with 4,680 (39.6% in the age bracket) enrolled. Conversely, the age group of 5 to 9 year old has the lowest likelihood of being enrolled in a private school, with 48,803 (91.7% in the age bracket) attending a public institution.
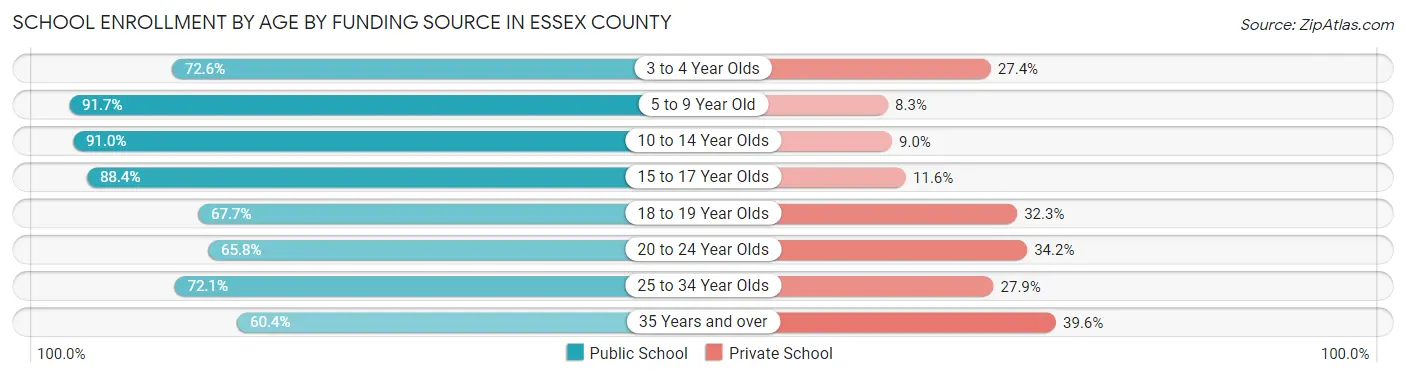
| Age Bracket | Public School | Private School |
| 3 to 4 Year Olds | 11,049 (72.6%) | 4,174 (27.4%) |
| 5 to 9 Year Old | 48,803 (91.7%) | 4,411 (8.3%) |
| 10 to 14 Year Olds | 51,263 (91.0%) | 5,083 (9.0%) |
| 15 to 17 Year Olds | 28,466 (88.4%) | 3,747 (11.6%) |
| 18 to 19 Year Olds | 11,965 (67.7%) | 5,717 (32.3%) |
| 20 to 24 Year Olds | 15,282 (65.8%) | 7,941 (34.2%) |
| 25 to 34 Year Olds | 9,226 (72.1%) | 3,576 (27.9%) |
| 35 Years and over | 7,148 (60.4%) | 4,680 (39.6%) |
| Total | 183,143 (82.3%) | 39,388 (17.7%) |
Educational Attainment by Field of Study in Essex County
Business (45,818 | 19.8%), social sciences (26,600 | 11.5%), education (20,322 | 8.8%), science & technology (18,646 | 8.1%), and engineering (15,850 | 6.9%) are the most common fields of study among 231,272 individuals in Essex County who have obtained a bachelor's degree or higher.
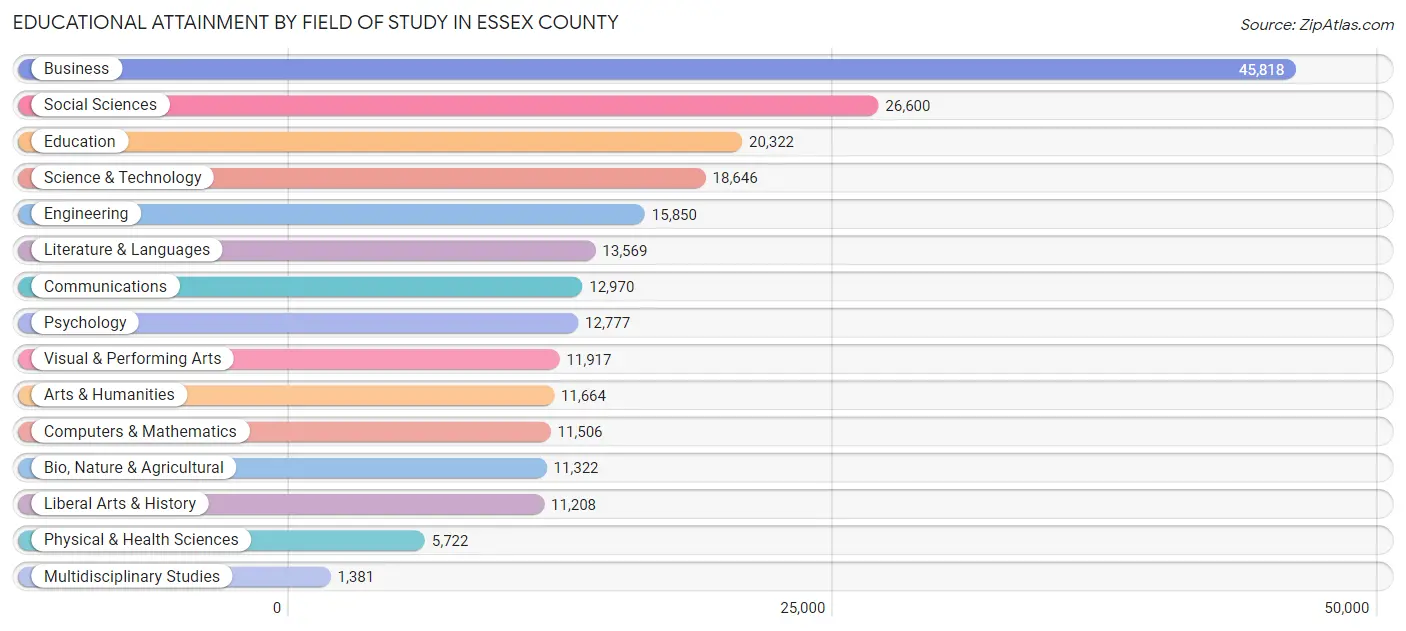
| Field of Study | # Graduates | % Graduates |
| Computers & Mathematics | 11,506 | 5.0% |
| Bio, Nature & Agricultural | 11,322 | 4.9% |
| Physical & Health Sciences | 5,722 | 2.5% |
| Psychology | 12,777 | 5.5% |
| Social Sciences | 26,600 | 11.5% |
| Engineering | 15,850 | 6.9% |
| Multidisciplinary Studies | 1,381 | 0.6% |
| Science & Technology | 18,646 | 8.1% |
| Business | 45,818 | 19.8% |
| Education | 20,322 | 8.8% |
| Literature & Languages | 13,569 | 5.9% |
| Liberal Arts & History | 11,208 | 4.9% |
| Visual & Performing Arts | 11,917 | 5.1% |
| Communications | 12,970 | 5.6% |
| Arts & Humanities | 11,664 | 5.0% |
| Total | 231,272 | 100.0% |
Transportation & Commute in Essex County
Vehicle Availability by Sex in Essex County
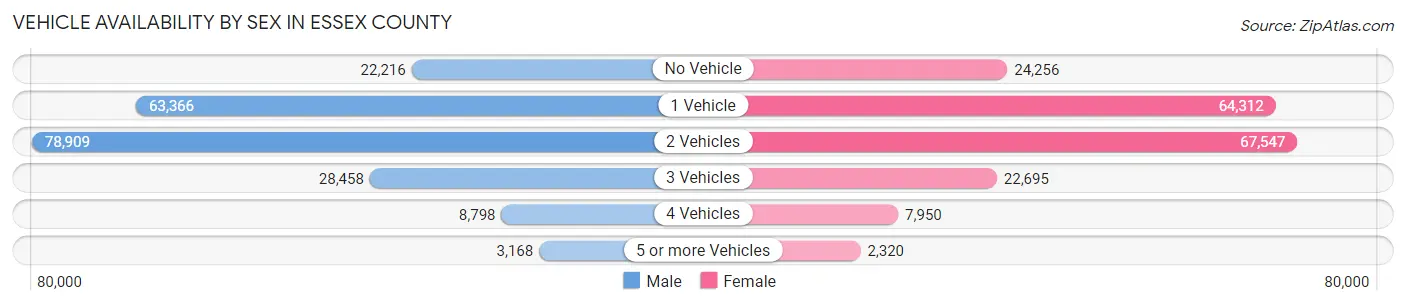
The most prevalent vehicle ownership categories in Essex County are males with 2 vehicles (78,909, accounting for 38.5%) and females with 2 vehicles (67,547, making up 41.7%).
| Vehicles Available | Male | Female |
| No Vehicle | 22,216 (10.8%) | 24,256 (12.8%) |
| 1 Vehicle | 63,366 (30.9%) | 64,312 (34.0%) |
| 2 Vehicles | 78,909 (38.5%) | 67,547 (35.7%) |
| 3 Vehicles | 28,458 (13.9%) | 22,695 (12.0%) |
| 4 Vehicles | 8,798 (4.3%) | 7,950 (4.2%) |
| 5 or more Vehicles | 3,168 (1.5%) | 2,320 (1.2%) |
| Total | 204,915 (100.0%) | 189,080 (100.0%) |
Commute Time in Essex County
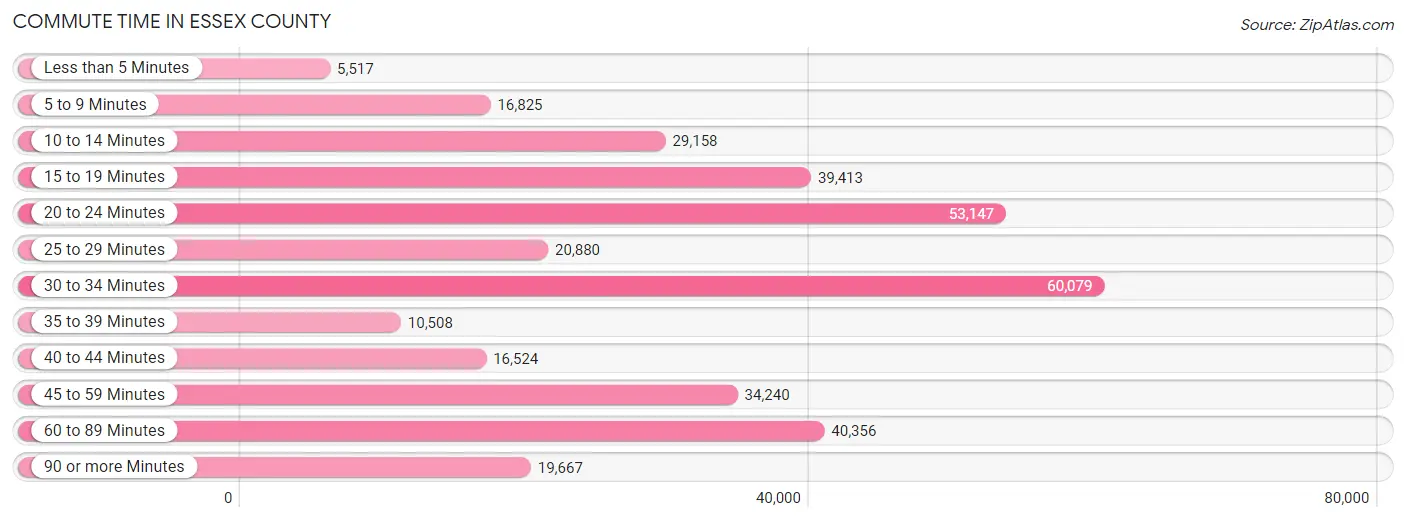
The most frequently occuring commute durations in Essex County are 30 to 34 minutes (60,079 commuters, 17.3%), 20 to 24 minutes (53,147 commuters, 15.3%), and 60 to 89 minutes (40,356 commuters, 11.7%).
| Commute Time | # Commuters | % Commuters |
| Less than 5 Minutes | 5,517 | 1.6% |
| 5 to 9 Minutes | 16,825 | 4.9% |
| 10 to 14 Minutes | 29,158 | 8.4% |
| 15 to 19 Minutes | 39,413 | 11.4% |
| 20 to 24 Minutes | 53,147 | 15.3% |
| 25 to 29 Minutes | 20,880 | 6.0% |
| 30 to 34 Minutes | 60,079 | 17.3% |
| 35 to 39 Minutes | 10,508 | 3.0% |
| 40 to 44 Minutes | 16,524 | 4.8% |
| 45 to 59 Minutes | 34,240 | 9.9% |
| 60 to 89 Minutes | 40,356 | 11.7% |
| 90 or more Minutes | 19,667 | 5.7% |
Commute Time by Sex in Essex County
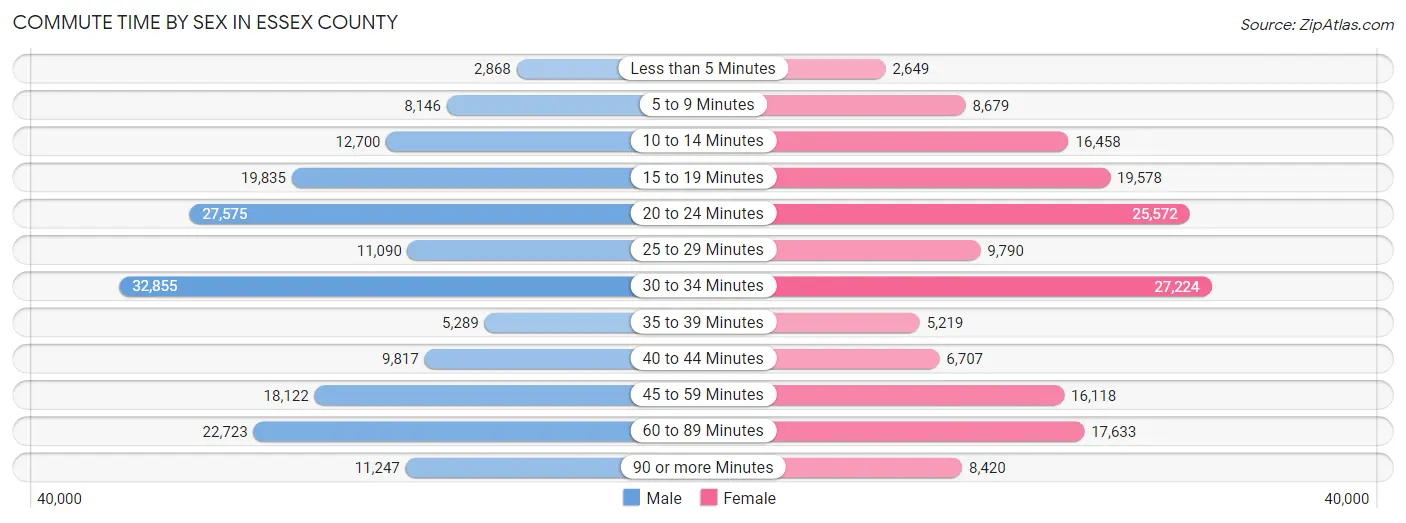
The most common commute times in Essex County are 30 to 34 minutes (32,855 commuters, 18.0%) for males and 30 to 34 minutes (27,224 commuters, 16.6%) for females.
| Commute Time | Male | Female |
| Less than 5 Minutes | 2,868 (1.6%) | 2,649 (1.6%) |
| 5 to 9 Minutes | 8,146 (4.5%) | 8,679 (5.3%) |
| 10 to 14 Minutes | 12,700 (7.0%) | 16,458 (10.0%) |
| 15 to 19 Minutes | 19,835 (10.9%) | 19,578 (11.9%) |
| 20 to 24 Minutes | 27,575 (15.1%) | 25,572 (15.6%) |
| 25 to 29 Minutes | 11,090 (6.1%) | 9,790 (6.0%) |
| 30 to 34 Minutes | 32,855 (18.0%) | 27,224 (16.6%) |
| 35 to 39 Minutes | 5,289 (2.9%) | 5,219 (3.2%) |
| 40 to 44 Minutes | 9,817 (5.4%) | 6,707 (4.1%) |
| 45 to 59 Minutes | 18,122 (9.9%) | 16,118 (9.8%) |
| 60 to 89 Minutes | 22,723 (12.5%) | 17,633 (10.7%) |
| 90 or more Minutes | 11,247 (6.2%) | 8,420 (5.1%) |
Time of Departure to Work by Sex in Essex County
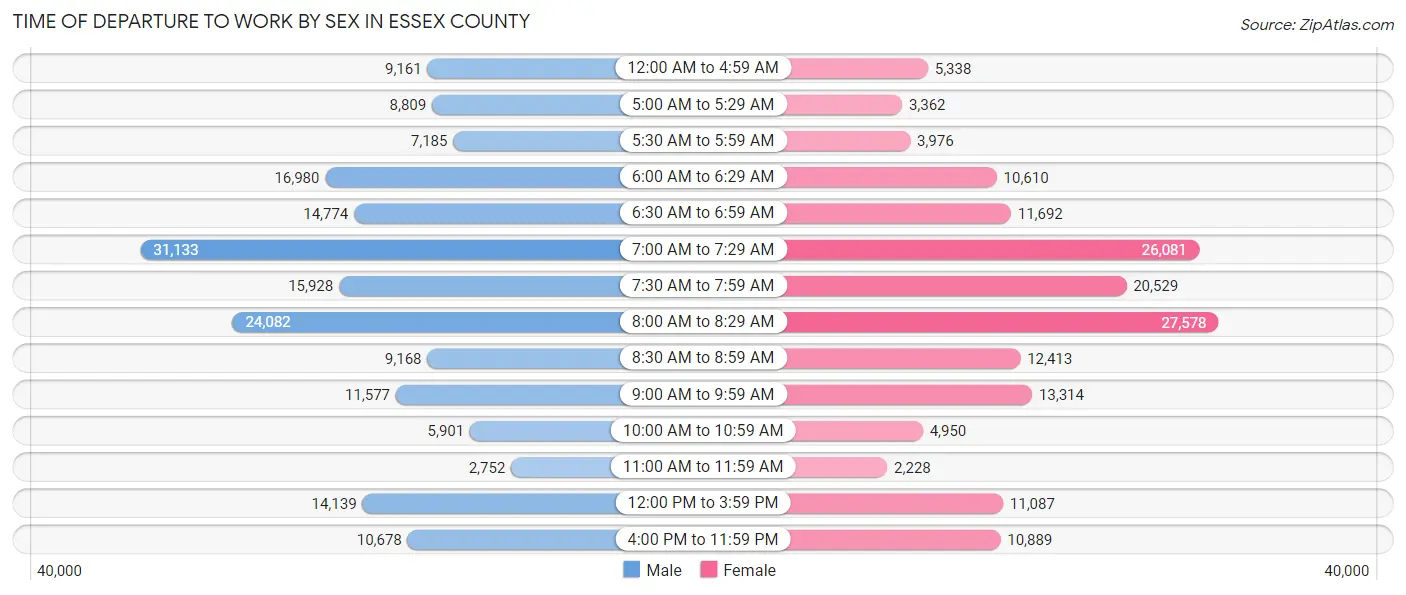
The most frequent times of departure to work in Essex County are 7:00 AM to 7:29 AM (31,133, 17.1%) for males and 8:00 AM to 8:29 AM (27,578, 16.8%) for females.
| Time of Departure | Male | Female |
| 12:00 AM to 4:59 AM | 9,161 (5.0%) | 5,338 (3.3%) |
| 5:00 AM to 5:29 AM | 8,809 (4.8%) | 3,362 (2.1%) |
| 5:30 AM to 5:59 AM | 7,185 (3.9%) | 3,976 (2.4%) |
| 6:00 AM to 6:29 AM | 16,980 (9.3%) | 10,610 (6.5%) |
| 6:30 AM to 6:59 AM | 14,774 (8.1%) | 11,692 (7.1%) |
| 7:00 AM to 7:29 AM | 31,133 (17.1%) | 26,081 (15.9%) |
| 7:30 AM to 7:59 AM | 15,928 (8.7%) | 20,529 (12.5%) |
| 8:00 AM to 8:29 AM | 24,082 (13.2%) | 27,578 (16.8%) |
| 8:30 AM to 8:59 AM | 9,168 (5.0%) | 12,413 (7.6%) |
| 9:00 AM to 9:59 AM | 11,577 (6.4%) | 13,314 (8.1%) |
| 10:00 AM to 10:59 AM | 5,901 (3.2%) | 4,950 (3.0%) |
| 11:00 AM to 11:59 AM | 2,752 (1.5%) | 2,228 (1.4%) |
| 12:00 PM to 3:59 PM | 14,139 (7.8%) | 11,087 (6.8%) |
| 4:00 PM to 11:59 PM | 10,678 (5.9%) | 10,889 (6.6%) |
| Total | 182,267 (100.0%) | 164,047 (100.0%) |
Housing Occupancy in Essex County
Occupancy by Ownership in Essex County
Of the total 312,942 dwellings in Essex County, owner-occupied units account for 139,811 (44.7%), while renter-occupied units make up 173,131 (55.3%).
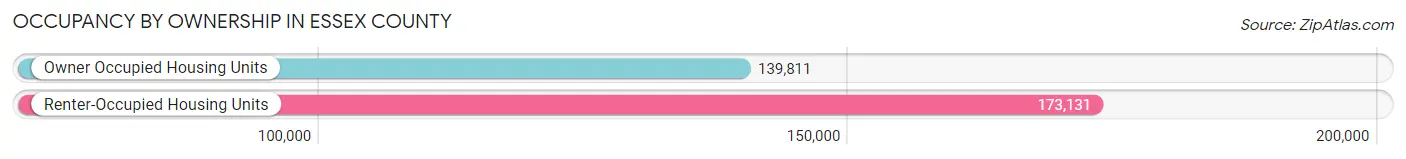
| Occupancy | # Housing Units | % Housing Units |
| Owner Occupied Housing Units | 139,811 | 44.7% |
| Renter-Occupied Housing Units | 173,131 | 55.3% |
| Total Occupied Housing Units | 312,942 | 100.0% |
Occupancy by Household Size in Essex County
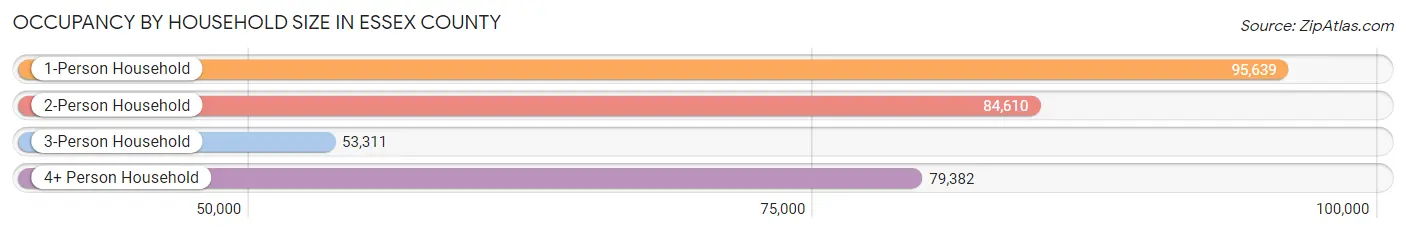
| Household Size | # Housing Units | % Housing Units |
| 1-Person Household | 95,639 | 30.6% |
| 2-Person Household | 84,610 | 27.0% |
| 3-Person Household | 53,311 | 17.0% |
| 4+ Person Household | 79,382 | 25.4% |
| Total Housing Units | 312,942 | 100.0% |
Occupancy by Ownership by Household Size in Essex County
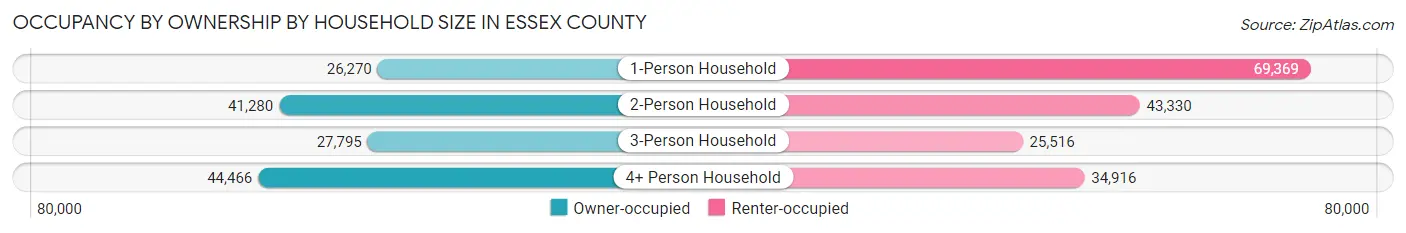
| Household Size | Owner-occupied | Renter-occupied |
| 1-Person Household | 26,270 (27.5%) | 69,369 (72.5%) |
| 2-Person Household | 41,280 (48.8%) | 43,330 (51.2%) |
| 3-Person Household | 27,795 (52.1%) | 25,516 (47.9%) |
| 4+ Person Household | 44,466 (56.0%) | 34,916 (44.0%) |
| Total Housing Units | 139,811 (44.7%) | 173,131 (55.3%) |
Occupancy by Educational Attainment in Essex County
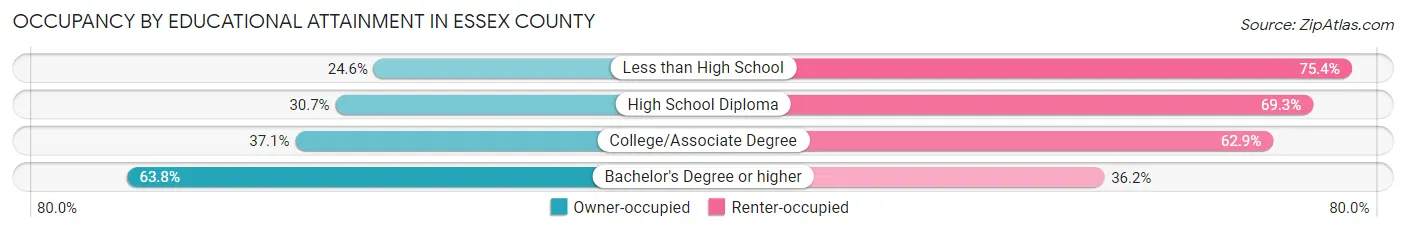
| Household Size | Owner-occupied | Renter-occupied |
| Less than High School | 9,000 (24.6%) | 27,577 (75.4%) |
| High School Diploma | 24,201 (30.7%) | 54,625 (69.3%) |
| College/Associate Degree | 26,972 (37.1%) | 45,810 (62.9%) |
| Bachelor's Degree or higher | 79,638 (63.8%) | 45,119 (36.2%) |
Occupancy by Age of Householder in Essex County

| Age Bracket | # Households | % Households |
| Under 35 Years | 51,317 | 16.4% |
| 35 to 44 Years | 62,699 | 20.0% |
| 45 to 54 Years | 64,956 | 20.8% |
| 55 to 64 Years | 60,266 | 19.3% |
| 65 to 74 Years | 42,461 | 13.6% |
| 75 to 84 Years | 21,061 | 6.7% |
| 85 Years and Over | 10,182 | 3.3% |
| Total | 312,942 | 100.0% |
Housing Finances in Essex County
Median Income by Occupancy in Essex County
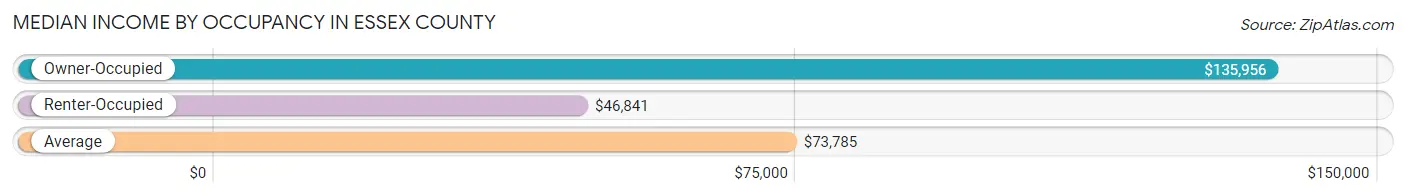
| Occupancy Type | # Households | Median Income |
| Owner-Occupied | 139,811 (44.7%) | $135,956 |
| Renter-Occupied | 173,131 (55.3%) | $46,841 |
| Average | 312,942 (100.0%) | $73,785 |
Occupancy by Householder Income Bracket in Essex County
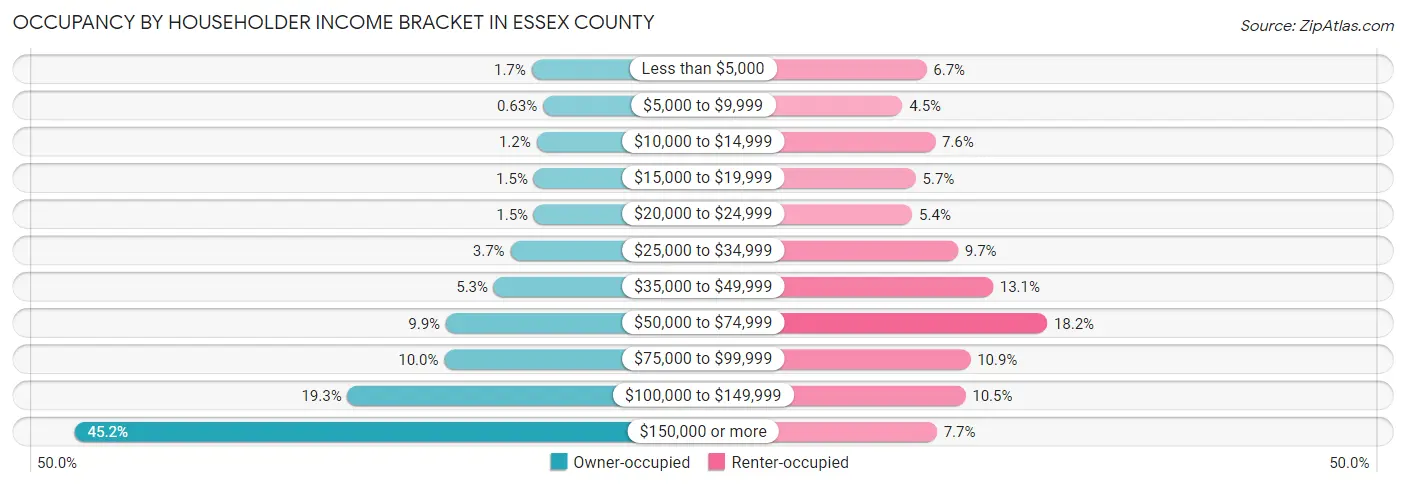
| Income Bracket | Owner-occupied | Renter-occupied |
| Less than $5,000 | 2,386 (1.7%) | 11,668 (6.7%) |
| $5,000 to $9,999 | 884 (0.6%) | 7,716 (4.5%) |
| $10,000 to $14,999 | 1,738 (1.2%) | 13,081 (7.6%) |
| $15,000 to $19,999 | 2,107 (1.5%) | 9,906 (5.7%) |
| $20,000 to $24,999 | 2,080 (1.5%) | 9,333 (5.4%) |
| $25,000 to $34,999 | 5,211 (3.7%) | 16,869 (9.7%) |
| $35,000 to $49,999 | 7,422 (5.3%) | 22,627 (13.1%) |
| $50,000 to $74,999 | 13,803 (9.9%) | 31,557 (18.2%) |
| $75,000 to $99,999 | 14,027 (10.0%) | 18,906 (10.9%) |
| $100,000 to $149,999 | 26,919 (19.3%) | 18,091 (10.4%) |
| $150,000 or more | 63,234 (45.2%) | 13,377 (7.7%) |
| Total | 139,811 (100.0%) | 173,131 (100.0%) |
Monthly Housing Cost Tiers in Essex County
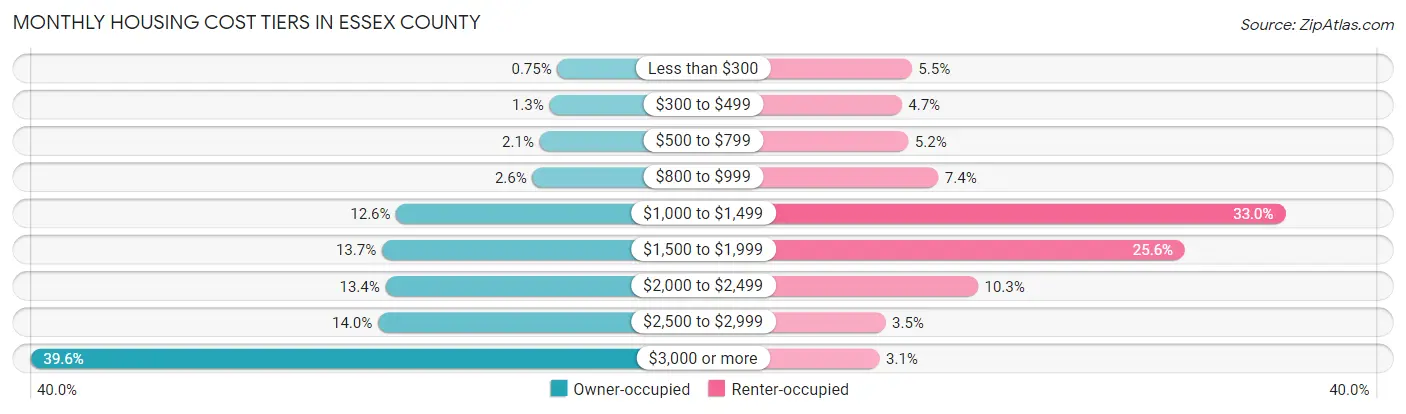
| Monthly Cost | Owner-occupied | Renter-occupied |
| Less than $300 | 1,046 (0.7%) | 9,440 (5.4%) |
| $300 to $499 | 1,876 (1.3%) | 8,146 (4.7%) |
| $500 to $799 | 2,875 (2.1%) | 8,994 (5.2%) |
| $800 to $999 | 3,627 (2.6%) | 12,815 (7.4%) |
| $1,000 to $1,499 | 17,650 (12.6%) | 57,093 (33.0%) |
| $1,500 to $1,999 | 19,120 (13.7%) | 44,301 (25.6%) |
| $2,000 to $2,499 | 18,760 (13.4%) | 17,874 (10.3%) |
| $2,500 to $2,999 | 19,529 (14.0%) | 6,082 (3.5%) |
| $3,000 or more | 55,328 (39.6%) | 5,315 (3.1%) |
| Total | 139,811 (100.0%) | 173,131 (100.0%) |
Physical Housing Characteristics in Essex County
Housing Structures in Essex County
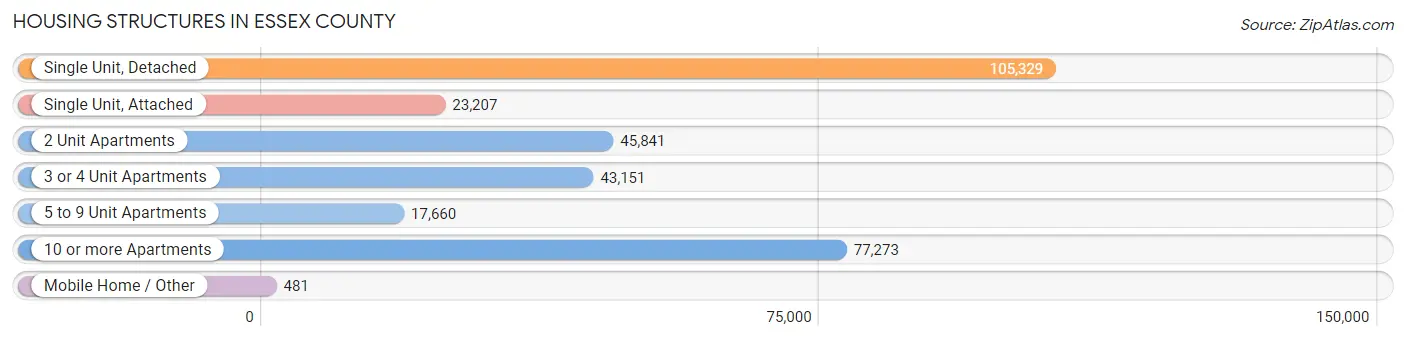
| Structure Type | # Housing Units | % Housing Units |
| Single Unit, Detached | 105,329 | 33.7% |
| Single Unit, Attached | 23,207 | 7.4% |
| 2 Unit Apartments | 45,841 | 14.6% |
| 3 or 4 Unit Apartments | 43,151 | 13.8% |
| 5 to 9 Unit Apartments | 17,660 | 5.6% |
| 10 or more Apartments | 77,273 | 24.7% |
| Mobile Home / Other | 481 | 0.2% |
| Total | 312,942 | 100.0% |
Housing Structures by Occupancy in Essex County

| Structure Type | Owner-occupied | Renter-occupied |
| Single Unit, Detached | 95,405 (90.6%) | 9,924 (9.4%) |
| Single Unit, Attached | 10,134 (43.7%) | 13,073 (56.3%) |
| 2 Unit Apartments | 18,419 (40.2%) | 27,422 (59.8%) |
| 3 or 4 Unit Apartments | 8,749 (20.3%) | 34,402 (79.7%) |
| 5 to 9 Unit Apartments | 1,613 (9.1%) | 16,047 (90.9%) |
| 10 or more Apartments | 5,378 (7.0%) | 71,895 (93.0%) |
| Mobile Home / Other | 113 (23.5%) | 368 (76.5%) |
| Total | 139,811 (44.7%) | 173,131 (55.3%) |
Housing Structures by Number of Rooms in Essex County
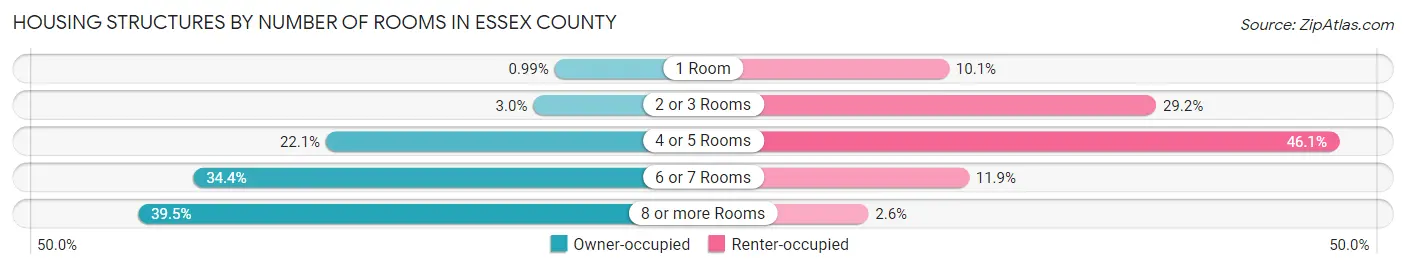
| Number of Rooms | Owner-occupied | Renter-occupied |
| 1 Room | 1,389 (1.0%) | 17,446 (10.1%) |
| 2 or 3 Rooms | 4,140 (3.0%) | 50,613 (29.2%) |
| 4 or 5 Rooms | 30,944 (22.1%) | 79,869 (46.1%) |
| 6 or 7 Rooms | 48,092 (34.4%) | 20,644 (11.9%) |
| 8 or more Rooms | 55,246 (39.5%) | 4,559 (2.6%) |
| Total | 139,811 (100.0%) | 173,131 (100.0%) |
Housing Structure by Heating Type in Essex County
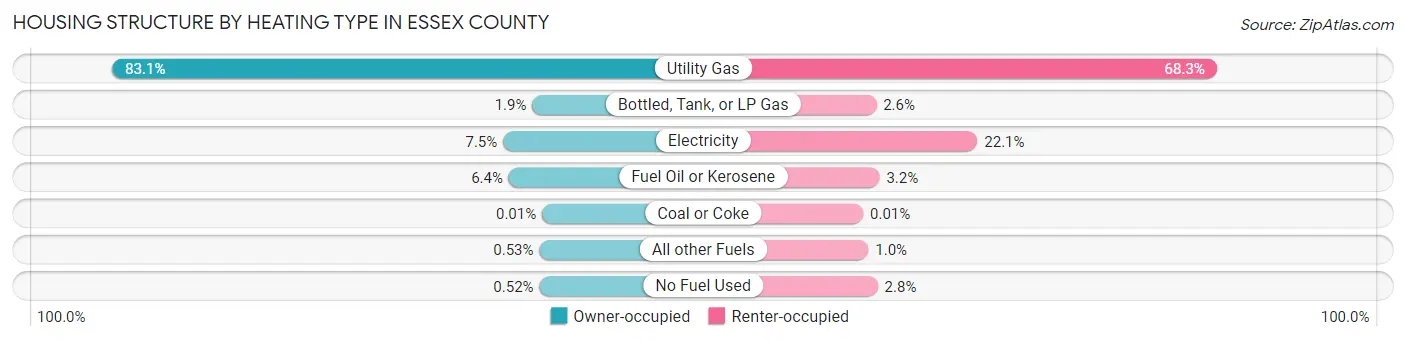
| Heating Type | Owner-occupied | Renter-occupied |
| Utility Gas | 116,167 (83.1%) | 118,275 (68.3%) |
| Bottled, Tank, or LP Gas | 2,647 (1.9%) | 4,420 (2.5%) |
| Electricity | 10,532 (7.5%) | 38,253 (22.1%) |
| Fuel Oil or Kerosene | 8,987 (6.4%) | 5,487 (3.2%) |
| Coal or Coke | 7 (0.0%) | 25 (0.0%) |
| All other Fuels | 739 (0.5%) | 1,781 (1.0%) |
| No Fuel Used | 732 (0.5%) | 4,890 (2.8%) |
| Total | 139,811 (100.0%) | 173,131 (100.0%) |
Household Vehicle Usage in Essex County
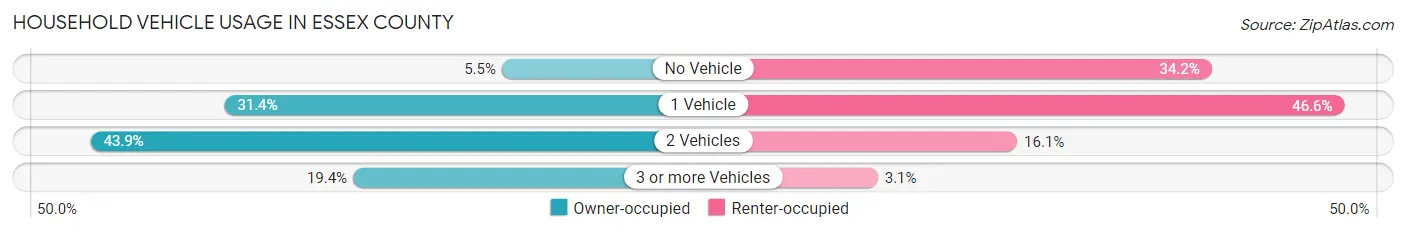
| Vehicles per Household | Owner-occupied | Renter-occupied |
| No Vehicle | 7,622 (5.4%) | 59,263 (34.2%) |
| 1 Vehicle | 43,830 (31.4%) | 80,720 (46.6%) |
| 2 Vehicles | 61,304 (43.9%) | 27,836 (16.1%) |
| 3 or more Vehicles | 27,055 (19.4%) | 5,312 (3.1%) |
| Total | 139,811 (100.0%) | 173,131 (100.0%) |
Real Estate & Mortgages in Essex County
Real Estate and Mortgage Overview in Essex County
| Characteristic | Without Mortgage | With Mortgage |
| Housing Units | 43,237 | 96,574 |
| Median Property Value | $458,200 | $469,900 |
| Median Household Income | $105,546 | $47,971 |
| Monthly Housing Costs | $1,466 | $52,346 |
| Real Estate Taxes | $10,001 | $2,494 |
Property Value by Mortgage Status in Essex County
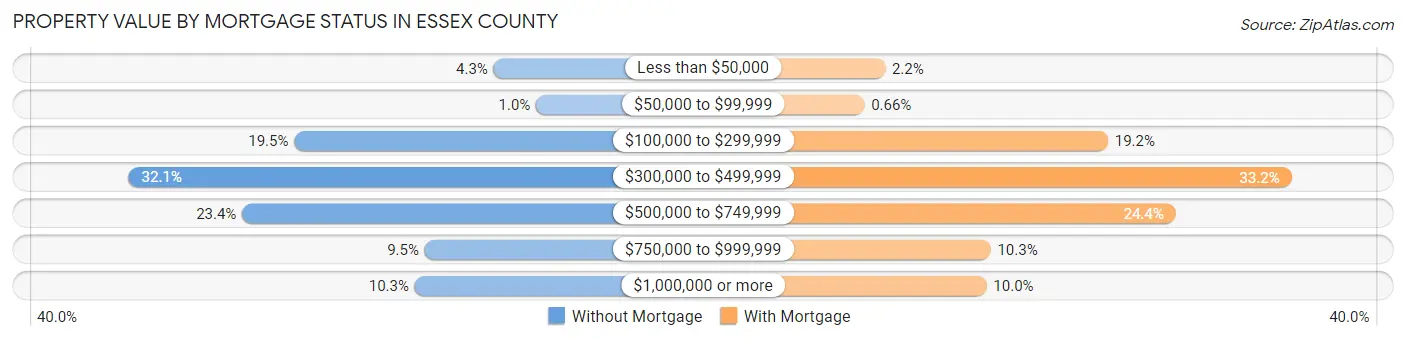
| Property Value | Without Mortgage | With Mortgage |
| Less than $50,000 | 1,843 (4.3%) | 2,167 (2.2%) |
| $50,000 to $99,999 | 439 (1.0%) | 635 (0.7%) |
| $100,000 to $299,999 | 8,408 (19.5%) | 18,563 (19.2%) |
| $300,000 to $499,999 | 13,867 (32.1%) | 32,083 (33.2%) |
| $500,000 to $749,999 | 10,125 (23.4%) | 23,568 (24.4%) |
| $750,000 to $999,999 | 4,113 (9.5%) | 9,927 (10.3%) |
| $1,000,000 or more | 4,442 (10.3%) | 9,631 (10.0%) |
| Total | 43,237 (100.0%) | 96,574 (100.0%) |
Household Income by Mortgage Status in Essex County
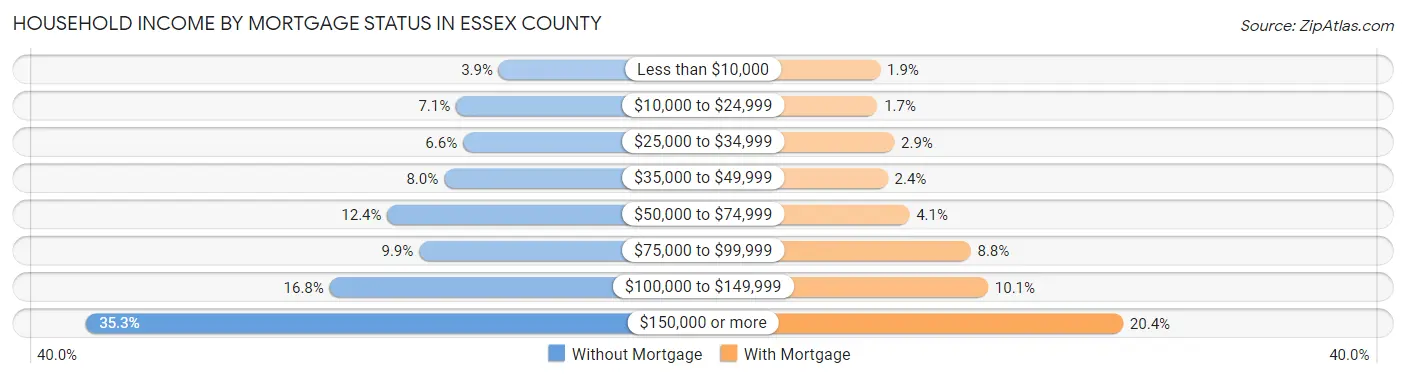
| Household Income | Without Mortgage | With Mortgage |
| Less than $10,000 | 1,675 (3.9%) | 1,802 (1.9%) |
| $10,000 to $24,999 | 3,083 (7.1%) | 1,595 (1.7%) |
| $25,000 to $34,999 | 2,854 (6.6%) | 2,842 (2.9%) |
| $35,000 to $49,999 | 3,476 (8.0%) | 2,357 (2.4%) |
| $50,000 to $74,999 | 5,343 (12.4%) | 3,946 (4.1%) |
| $75,000 to $99,999 | 4,296 (9.9%) | 8,460 (8.8%) |
| $100,000 to $149,999 | 7,247 (16.8%) | 9,731 (10.1%) |
| $150,000 or more | 15,263 (35.3%) | 19,672 (20.4%) |
| Total | 43,237 (100.0%) | 96,574 (100.0%) |
Property Value to Household Income Ratio in Essex County
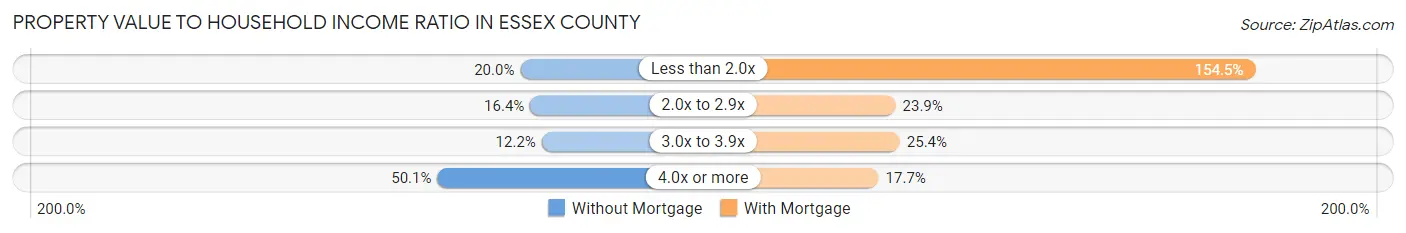
| Value-to-Income Ratio | Without Mortgage | With Mortgage |
| Less than 2.0x | 8,634 (20.0%) | 149,204 (154.5%) |
| 2.0x to 2.9x | 7,081 (16.4%) | 23,052 (23.9%) |
| 3.0x to 3.9x | 5,272 (12.2%) | 24,537 (25.4%) |
| 4.0x or more | 21,656 (50.1%) | 17,097 (17.7%) |
| Total | 43,237 (100.0%) | 96,574 (100.0%) |
Real Estate Taxes by Mortgage Status in Essex County
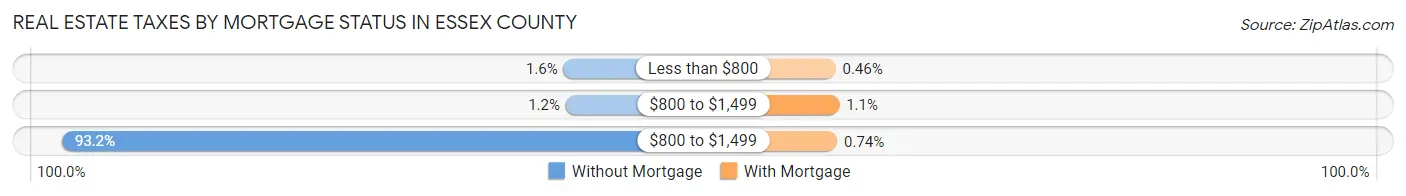
| Property Taxes | Without Mortgage | With Mortgage |
| Less than $800 | 676 (1.6%) | 445 (0.5%) |
| $800 to $1,499 | 496 (1.1%) | 1,088 (1.1%) |
| $800 to $1,499 | 40,299 (93.2%) | 713 (0.7%) |
| Total | 43,237 (100.0%) | 96,574 (100.0%) |
Health & Disability in Essex County
Health Insurance Coverage by Age in Essex County
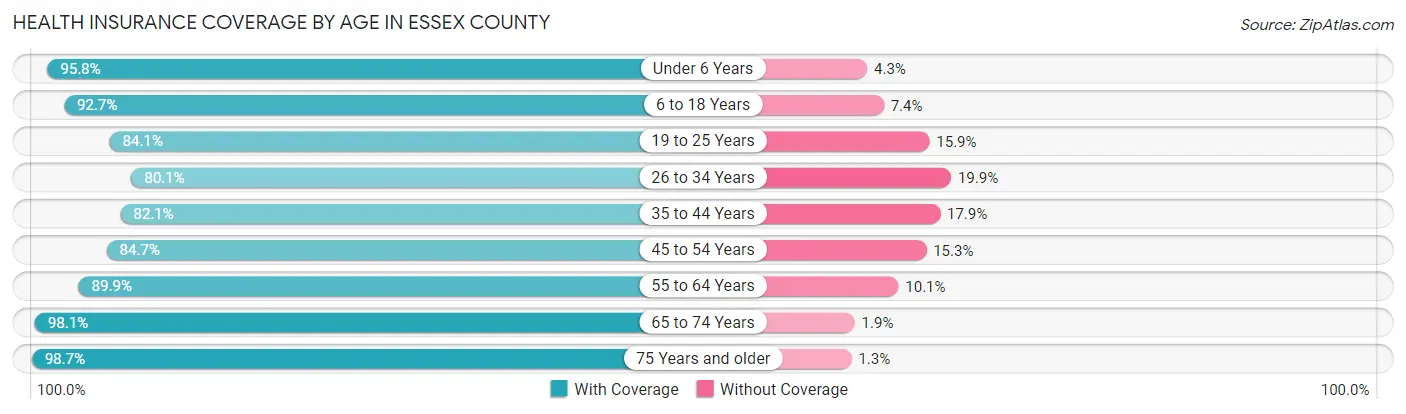
| Age Bracket | With Coverage | Without Coverage |
| Under 6 Years | 62,818 (95.8%) | 2,786 (4.3%) |
| 6 to 18 Years | 136,421 (92.6%) | 10,818 (7.3%) |
| 19 to 25 Years | 64,995 (84.1%) | 12,255 (15.9%) |
| 26 to 34 Years | 82,207 (80.1%) | 20,423 (19.9%) |
| 35 to 44 Years | 96,954 (82.1%) | 21,077 (17.9%) |
| 45 to 54 Years | 97,587 (84.7%) | 17,596 (15.3%) |
| 55 to 64 Years | 92,171 (89.9%) | 10,333 (10.1%) |
| 65 to 74 Years | 65,911 (98.1%) | 1,294 (1.9%) |
| 75 Years and older | 46,197 (98.7%) | 626 (1.3%) |
| Total | 745,261 (88.5%) | 97,208 (11.5%) |
Health Insurance Coverage by Citizenship Status in Essex County
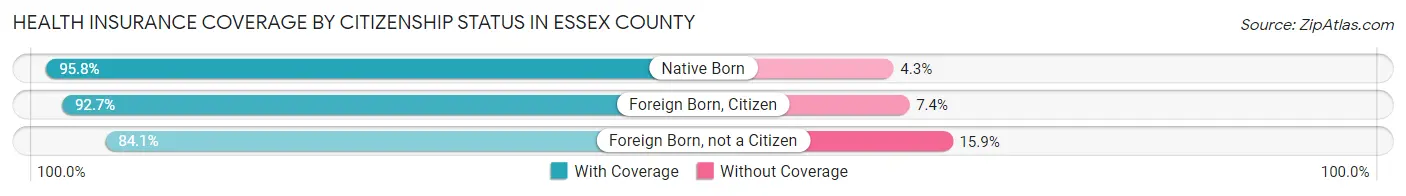
| Citizenship Status | With Coverage | Without Coverage |
| Native Born | 62,818 (95.8%) | 2,786 (4.3%) |
| Foreign Born, Citizen | 136,421 (92.6%) | 10,818 (7.3%) |
| Foreign Born, not a Citizen | 64,995 (84.1%) | 12,255 (15.9%) |
Health Insurance Coverage by Household Income in Essex County
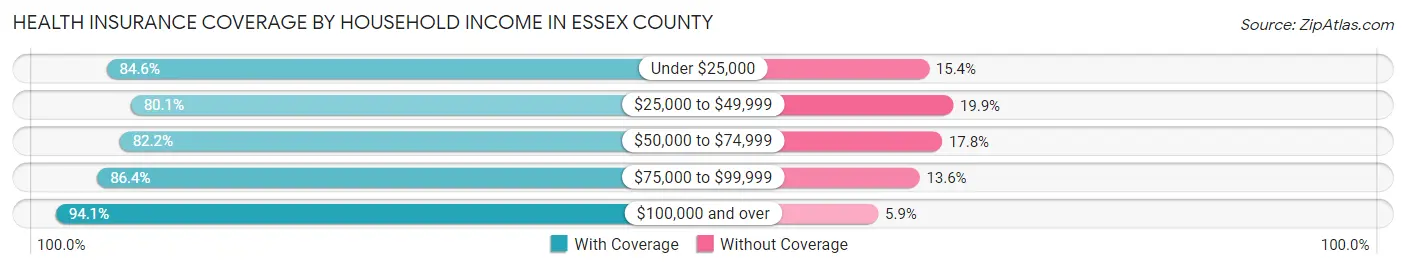
| Household Income | With Coverage | Without Coverage |
| Under $25,000 | 94,046 (84.6%) | 17,085 (15.4%) |
| $25,000 to $49,999 | 95,771 (80.1%) | 23,781 (19.9%) |
| $50,000 to $74,999 | 96,145 (82.2%) | 20,866 (17.8%) |
| $75,000 to $99,999 | 75,145 (86.4%) | 11,842 (13.6%) |
| $100,000 and over | 373,351 (94.1%) | 23,245 (5.9%) |
Public vs Private Health Insurance Coverage by Age in Essex County
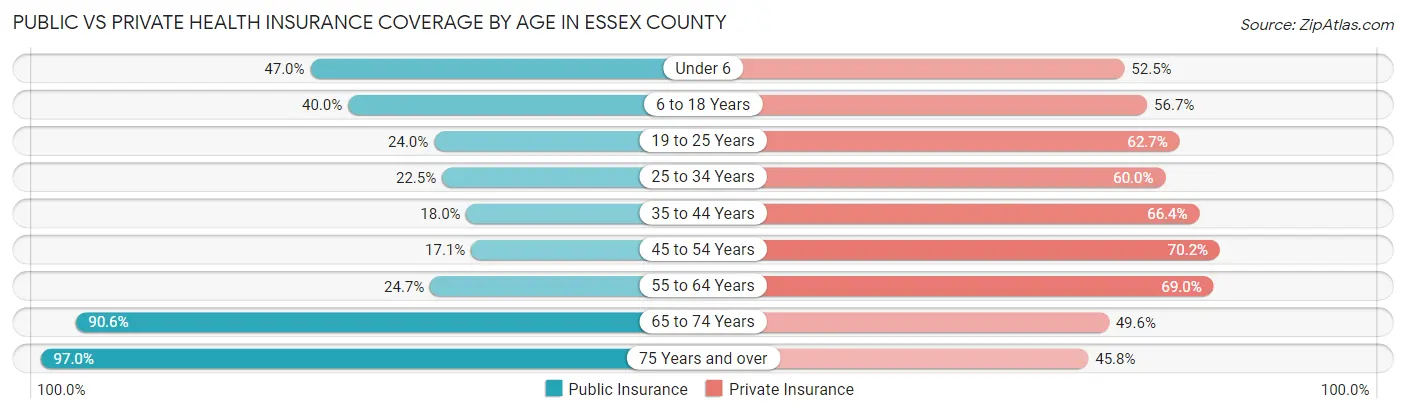
| Age Bracket | Public Insurance | Private Insurance |
| Under 6 | 30,805 (47.0%) | 34,416 (52.5%) |
| 6 to 18 Years | 58,857 (40.0%) | 83,454 (56.7%) |
| 19 to 25 Years | 18,533 (24.0%) | 48,419 (62.7%) |
| 25 to 34 Years | 23,106 (22.5%) | 61,617 (60.0%) |
| 35 to 44 Years | 21,230 (18.0%) | 78,316 (66.3%) |
| 45 to 54 Years | 19,707 (17.1%) | 80,832 (70.2%) |
| 55 to 64 Years | 25,346 (24.7%) | 70,734 (69.0%) |
| 65 to 74 Years | 60,875 (90.6%) | 33,303 (49.5%) |
| 75 Years and over | 45,427 (97.0%) | 21,423 (45.8%) |
| Total | 303,886 (36.1%) | 512,514 (60.8%) |
Disability Status by Sex by Age in Essex County
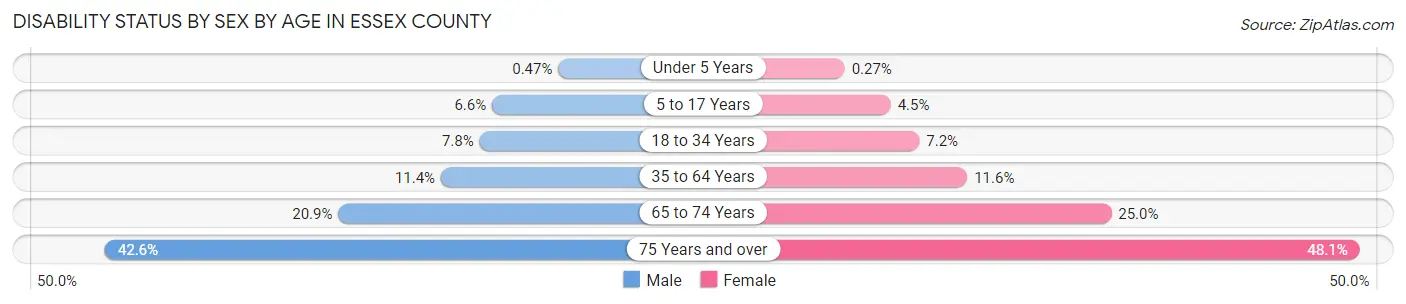
| Age Bracket | Male | Female |
| Under 5 Years | 130 (0.5%) | 71 (0.3%) |
| 5 to 17 Years | 4,983 (6.6%) | 3,266 (4.5%) |
| 18 to 34 Years | 7,365 (7.8%) | 6,967 (7.2%) |
| 35 to 64 Years | 18,403 (11.4%) | 20,218 (11.6%) |
| 65 to 74 Years | 6,179 (20.9%) | 9,411 (25.0%) |
| 75 Years and over | 7,485 (42.5%) | 14,049 (48.1%) |
Disability Class by Sex by Age in Essex County
Disability Class: Hearing Difficulty
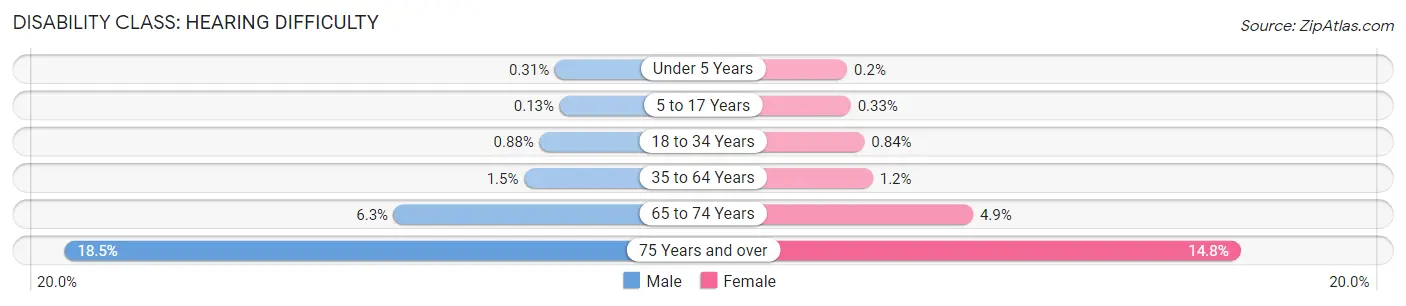
| Age Bracket | Male | Female |
| Under 5 Years | 85 (0.3%) | 52 (0.2%) |
| 5 to 17 Years | 97 (0.1%) | 239 (0.3%) |
| 18 to 34 Years | 832 (0.9%) | 817 (0.8%) |
| 35 to 64 Years | 2,353 (1.5%) | 2,000 (1.1%) |
| 65 to 74 Years | 1,859 (6.3%) | 1,833 (4.9%) |
| 75 Years and over | 3,259 (18.5%) | 4,325 (14.8%) |
Disability Class: Vision Difficulty
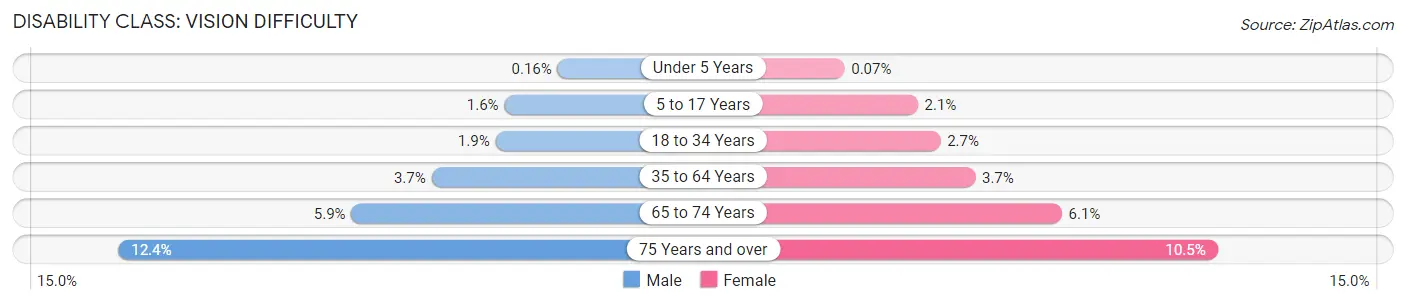
| Age Bracket | Male | Female |
| Under 5 Years | 45 (0.2%) | 19 (0.1%) |
| 5 to 17 Years | 1,234 (1.6%) | 1,519 (2.1%) |
| 18 to 34 Years | 1,788 (1.9%) | 2,653 (2.7%) |
| 35 to 64 Years | 5,949 (3.7%) | 6,441 (3.7%) |
| 65 to 74 Years | 1,745 (5.9%) | 2,303 (6.1%) |
| 75 Years and over | 2,180 (12.4%) | 3,058 (10.5%) |
Disability Class: Cognitive Difficulty
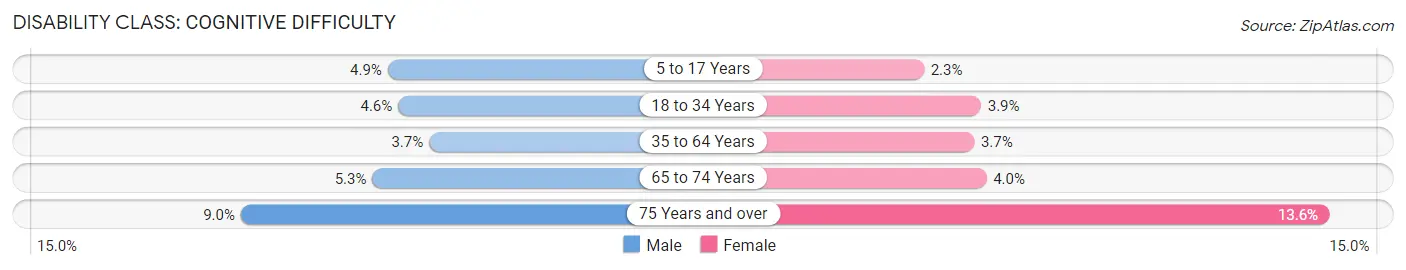
| Age Bracket | Male | Female |
| 5 to 17 Years | 3,676 (4.9%) | 1,638 (2.3%) |
| 18 to 34 Years | 4,361 (4.6%) | 3,741 (3.9%) |
| 35 to 64 Years | 6,066 (3.7%) | 6,395 (3.7%) |
| 65 to 74 Years | 1,573 (5.3%) | 1,513 (4.0%) |
| 75 Years and over | 1,579 (9.0%) | 3,973 (13.6%) |
Disability Class: Ambulatory Difficulty
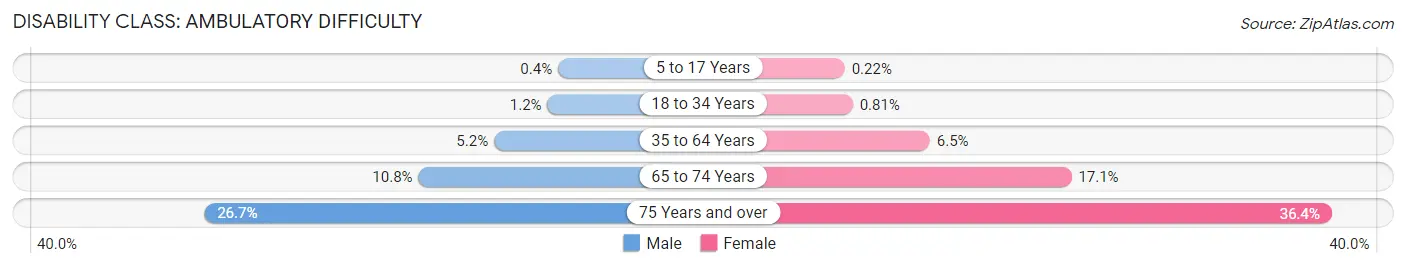
| Age Bracket | Male | Female |
| 5 to 17 Years | 304 (0.4%) | 161 (0.2%) |
| 18 to 34 Years | 1,122 (1.2%) | 787 (0.8%) |
| 35 to 64 Years | 8,346 (5.1%) | 11,349 (6.5%) |
| 65 to 74 Years | 3,182 (10.8%) | 6,416 (17.1%) |
| 75 Years and over | 4,691 (26.7%) | 10,633 (36.4%) |
Disability Class: Self-Care Difficulty
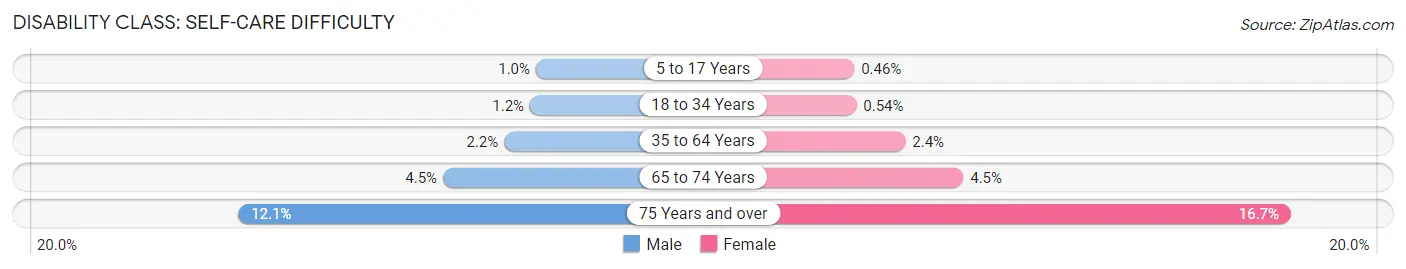
| Age Bracket | Male | Female |
| 5 to 17 Years | 766 (1.0%) | 330 (0.5%) |
| 18 to 34 Years | 1,179 (1.2%) | 526 (0.5%) |
| 35 to 64 Years | 3,565 (2.2%) | 4,095 (2.4%) |
| 65 to 74 Years | 1,323 (4.5%) | 1,698 (4.5%) |
| 75 Years and over | 2,124 (12.1%) | 4,872 (16.7%) |
Technology Access in Essex County
Computing Device Access in Essex County

| Device Type | # Households | % Households |
| Desktop or Laptop | 236,736 | 75.6% |
| Smartphone | 276,473 | 88.3% |
| Tablet | 196,567 | 62.8% |
| No Computing Device | 21,106 | 6.7% |
| Total | 312,942 | 100.0% |
Internet Access in Essex County
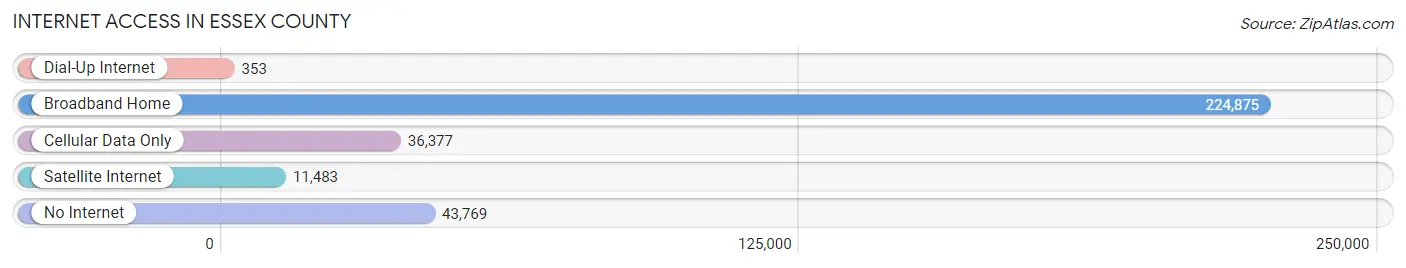
| Internet Type | # Households | % Households |
| Dial-Up Internet | 353 | 0.1% |
| Broadband Home | 224,875 | 71.9% |
| Cellular Data Only | 36,377 | 11.6% |
| Satellite Internet | 11,483 | 3.7% |
| No Internet | 43,769 | 14.0% |
| Total | 312,942 | 100.0% |
Essex County Summary
Essex County, New Jersey is located in the northeastern part of the state and is part of the New York metropolitan area. It is the third most populous county in New Jersey and the largest in terms of land area. The county seat is Newark, the largest city in the state. Essex County is home to a diverse population of over 800,000 people, making it one of the most populous counties in the United States.
History
Essex County was established in 1683 as one of the four original counties in the Province of East Jersey. It was named after the English county of Essex. The county was divided into three townships: Newark, Orange, and Elizabethtown. In 1710, the townships of Newark and Orange were combined to form the Township of Newark. In 1798, the townships of Newark and Elizabethtown were combined to form the Township of Newark and Elizabeth.
In 1837, the Township of Newark and Elizabeth was divided into the Townships of Newark, Belleville, Bloomfield, and Irvington. In 1857, the Townships of Belleville and Bloomfield were combined to form the Township of Belleville and Bloomfield. In 1869, the Townships of Belleville and Bloomfield were combined to form the City of Newark.
In 1878, the City of Newark was divided into the Townships of Newark, East Orange, and West Orange. In 1895, the Townships of East Orange and West Orange were combined to form the City of East Orange. In 1902, the City of East Orange was divided into the Townships of East Orange and South Orange. In 1908, the Townships of East Orange and South Orange were combined to form the City of Orange.
Geography
Essex County is located in the northeastern part of New Jersey and is part of the New York metropolitan area. It is bordered by Passaic County to the north, Hudson County to the east, Union County to the south, and Morris County to the west. The county covers an area of 127 square miles and is the third largest county in New Jersey.
The county is divided into three distinct geographic regions: the Newark Lowlands, the Watchung Mountains, and the Oranges. The Newark Lowlands are located in the northern part of the county and are characterized by flat terrain and urban development. The Watchung Mountains are located in the central part of the county and are characterized by rolling hills and forested areas. The Oranges are located in the southern part of the county and are characterized by flat terrain and suburban development.
Economy
Essex County has a diverse economy that is driven by a variety of industries. The county is home to several major corporations, including Prudential Financial, Panasonic, and PSE&G. The county is also home to several major universities, including Rutgers University, Seton Hall University, and Montclair State University.
The county is also home to several major airports, including Newark Liberty International Airport, Teterboro Airport, and Morristown Municipal Airport. The county is also home to several major highways, including the Garden State Parkway, the New Jersey Turnpike, and Interstate 78.
Demographics
As of the 2010 census, Essex County had a population of 783,969. The population was spread out with 24.3% under the age of 18, 10.2% from 18 to 24, 32.3% from 25 to 44, 22.5% from 45 to 64, and 10.7% who were 65 years of age or older. The median age was 36.4 years.
The racial makeup of the county was 54.2% White, 28.3% African American, 0.3% Native American, 8.2% Asian, 0.1% Pacific Islander, 5.2% from other races, and 3.7% from two or more races. Hispanic or Latino of any race were 15.9% of the population.
The median income for a household in the county was $60,879 and the median income for a family was $72,222. The per capita income for the county was $30,919. About 11.2% of families and 14.3% of the population were below the poverty line, including 19.3% of those under age 18 and 9.2% of those age 65 or over.
Common Questions
What is the Total Population of Essex County?
Total Population of Essex County is 853,374.
What is the Total Male Population of Essex County?
Total Male Population of Essex County is 414,982.
What is the Total Female Population of Essex County?
Total Female Population of Essex County is 438,392.
What is the Ratio of Males per 100 Females in Essex County?
There are 94.66 Males per 100 Females in Essex County.
What is the Ratio of Females per 100 Males in Essex County?
There are 105.64 Females per 100 Males in Essex County.
What is the Median Population Age in Essex County?
Median Population Age in Essex County is 37.6 Years.
What is the Average Family Size in Essex County
Average Family Size in Essex County is 3.4 People.
What is the Average Household Size in Essex County
Average Household Size in Essex County is 2.7 People.
What is Per Capita Income in Essex County?
Per Capita income in Essex County is $45,946.
What is the Median Family Income in Essex County?
Median Family Income in Essex County is $97,380.
What is the Median Household income in Essex County?
Median Household Income in Essex County is $73,785.
What is Income or Wage Gap in Essex County?
Income or Wage Gap in Essex County is 24.5%.
Women in Essex County earn 75.5 cents for every dollar earned by a man.
What is Family Income Deficit in Essex County?
Family Income Deficit in Essex County is $11,914.
Families that are below poverty line in Essex County earn $11,914 less on average than the poverty threshold level.
What is Inequality or Gini Index in Essex County?
Inequality or Gini Index in Essex County is 0.55.
How Large is the Labor Force in Essex County?
There are 446,307 People in the Labor Forcein in Essex County.
What is the Percentage of People in the Labor Force in Essex County?
66.2% of People are in the Labor Force in Essex County.
What is the Unemployment Rate in Essex County?
Unemployment Rate in Essex County is 8.5%.