Cape May County, NJ
Cape May County Map
Cape May County Overview
95,456
TOTAL POPULATION
46,347
MALE POPULATION
49,109
FEMALE POPULATION
94.38
MALES / 100 FEMALES
105.96
FEMALES / 100 MALES
50.9
MEDIAN AGE
2.6
AVG FAMILY SIZE
2.2
AVG HOUSEHOLD SIZE
$51,344
PER CAPITA INCOME
$101,287
AVG FAMILY INCOME
$83,870
AVG HOUSEHOLD INCOME
24.0%
WAGE / INCOME GAP [ % ]
76.0¢/ $1
WAGE / INCOME GAP [ $ ]
$10,386
FAMILY INCOME DEFICIT
0.47
INEQUALITY / GINI INDEX
45,926
LABOR FORCE [ PEOPLE ]
56.8%
PERCENT IN LABOR FORCE
6.5%
UNEMPLOYMENT RATE
Cape May County Area Codes
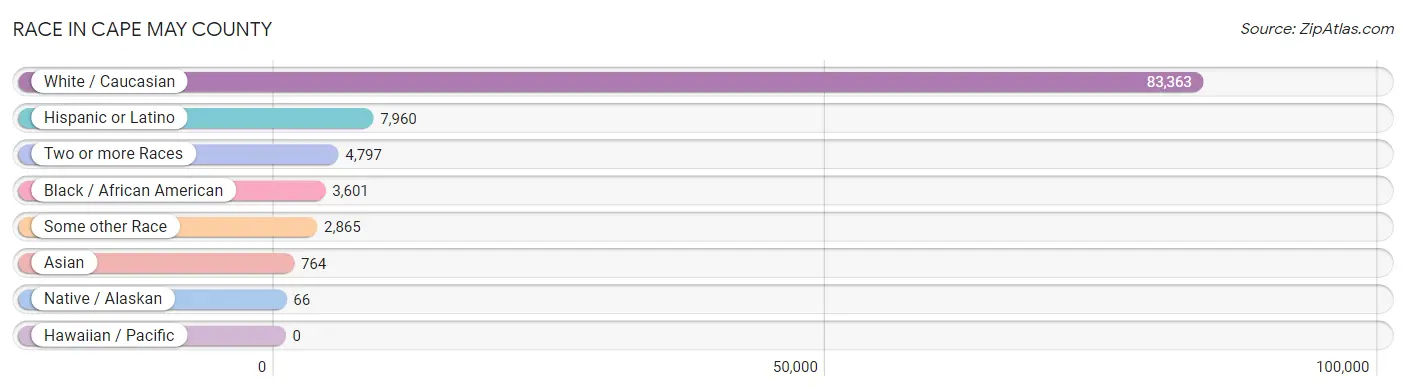
Race in Cape May County
The most populous races in Cape May County are White / Caucasian (83,363 | 87.3%), Hispanic or Latino (7,960 | 8.3%), and Two or more Races (4,797 | 5.0%).
| Race | # Population | % Population |
| Asian | 764 | 0.8% |
| Black / African American | 3,601 | 3.8% |
| Hawaiian / Pacific | 0 | 0.0% |
| Hispanic or Latino | 7,960 | 8.3% |
| Native / Alaskan | 66 | 0.1% |
| White / Caucasian | 83,363 | 87.3% |
| Two or more Races | 4,797 | 5.0% |
| Some other Race | 2,865 | 3.0% |
| Total | 95,456 | 100.0% |
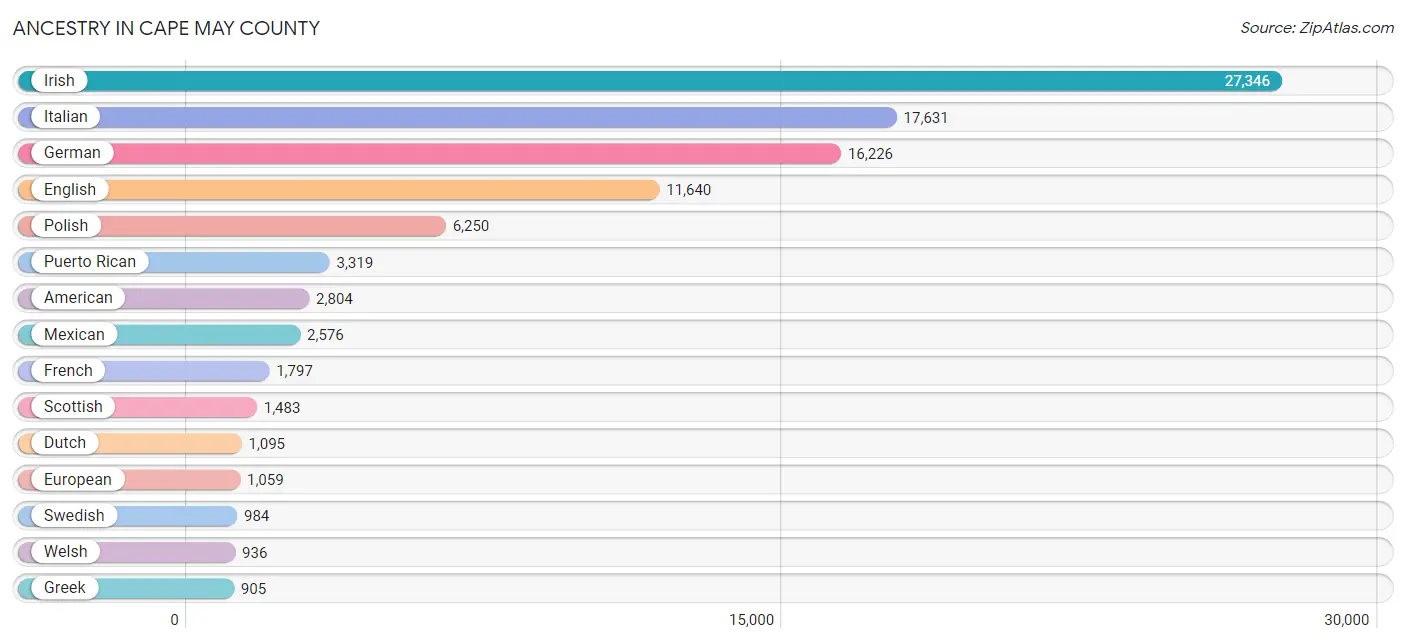
Ancestry in Cape May County
The most populous ancestries reported in Cape May County are Irish (27,346 | 28.6%), Italian (17,631 | 18.5%), German (16,226 | 17.0%), English (11,640 | 12.2%), and Polish (6,250 | 6.6%), together accounting for 82.9% of all Cape May County residents.
| Ancestry | # Population | % Population |
| African | 201 | 0.2% |
| Albanian | 67 | 0.1% |
| Alsatian | 3 | 0.0% |
| American | 2,804 | 2.9% |
| Arab | 480 | 0.5% |
| Armenian | 56 | 0.1% |
| Assyrian / Chaldean / Syriac | 11 | 0.0% |
| Australian | 141 | 0.2% |
| Austrian | 190 | 0.2% |
| Belgian | 34 | 0.0% |
| Bhutanese | 126 | 0.1% |
| Blackfeet | 43 | 0.1% |
| Brazilian | 33 | 0.0% |
| British | 530 | 0.6% |
| Bulgarian | 230 | 0.2% |
| Burmese | 166 | 0.2% |
| Cajun | 64 | 0.1% |
| Canadian | 84 | 0.1% |
| Central American | 643 | 0.7% |
| Central American Indian | 80 | 0.1% |
| Cherokee | 149 | 0.2% |
| Chippewa | 19 | 0.0% |
| Colombian | 224 | 0.2% |
| Costa Rican | 289 | 0.3% |
| Croatian | 51 | 0.1% |
| Cuban | 247 | 0.3% |
| Czech | 176 | 0.2% |
| Czechoslovakian | 84 | 0.1% |
| Danish | 236 | 0.3% |
| Delaware | 34 | 0.0% |
| Dominican | 86 | 0.1% |
| Dutch | 1,095 | 1.1% |
| Eastern European | 417 | 0.4% |
| Ecuadorian | 137 | 0.1% |
| Egyptian | 295 | 0.3% |
| English | 11,640 | 12.2% |
| Estonian | 117 | 0.1% |
| European | 1,059 | 1.1% |
| Filipino | 31 | 0.0% |
| Finnish | 85 | 0.1% |
| French | 1,797 | 1.9% |
| French Canadian | 519 | 0.5% |
| German | 16,226 | 17.0% |
| Greek | 905 | 0.9% |
| Guatemalan | 292 | 0.3% |
| Guyanese | 9 | 0.0% |
| Honduran | 39 | 0.0% |
| Hungarian | 797 | 0.8% |
| Icelander | 3 | 0.0% |
| Indian (Asian) | 282 | 0.3% |
| Iranian | 7 | 0.0% |
| Irish | 27,346 | 28.6% |
| Iroquois | 9 | 0.0% |
| Israeli | 4 | 0.0% |
| Italian | 17,631 | 18.5% |
| Jamaican | 55 | 0.1% |
| Korean | 492 | 0.5% |
| Lebanese | 70 | 0.1% |
| Lithuanian | 542 | 0.6% |
| Luxembourger | 5 | 0.0% |
| Macedonian | 83 | 0.1% |
| Maltese | 17 | 0.0% |
| Mexican | 2,576 | 2.7% |
| Native Hawaiian | 25 | 0.0% |
| New Zealander | 4 | 0.0% |
| Northern European | 122 | 0.1% |
| Norwegian | 765 | 0.8% |
| Okinawan | 19 | 0.0% |
| Osage | 8 | 0.0% |
| Pakistani | 42 | 0.0% |
| Panamanian | 19 | 0.0% |
| Pennsylvania German | 187 | 0.2% |
| Peruvian | 315 | 0.3% |
| Polish | 6,250 | 6.6% |
| Portuguese | 468 | 0.5% |
| Pueblo | 8 | 0.0% |
| Puerto Rican | 3,319 | 3.5% |
| Romanian | 167 | 0.2% |
| Russian | 760 | 0.8% |
| Salvadoran | 4 | 0.0% |
| Samoan | 162 | 0.2% |
| Scandinavian | 246 | 0.3% |
| Scotch-Irish | 569 | 0.6% |
| Scottish | 1,483 | 1.5% |
| Serbian | 36 | 0.0% |
| Slavic | 157 | 0.2% |
| Slovak | 314 | 0.3% |
| Slovene | 9 | 0.0% |
| South African | 27 | 0.0% |
| South American | 676 | 0.7% |
| Spaniard | 220 | 0.2% |
| Spanish | 120 | 0.1% |
| Sri Lankan | 186 | 0.2% |
| Subsaharan African | 265 | 0.3% |
| Swedish | 984 | 1.0% |
| Swiss | 282 | 0.3% |
| Syrian | 21 | 0.0% |
| Thai | 197 | 0.2% |
| Trinidadian and Tobagonian | 12 | 0.0% |
| Turkish | 22 | 0.0% |
| Ukrainian | 773 | 0.8% |
| Vietnamese | 14 | 0.0% |
| Welsh | 936 | 1.0% |
| West Indian | 48 | 0.1% |
| Yugoslavian | 29 | 0.0% | View All 105 Rows |
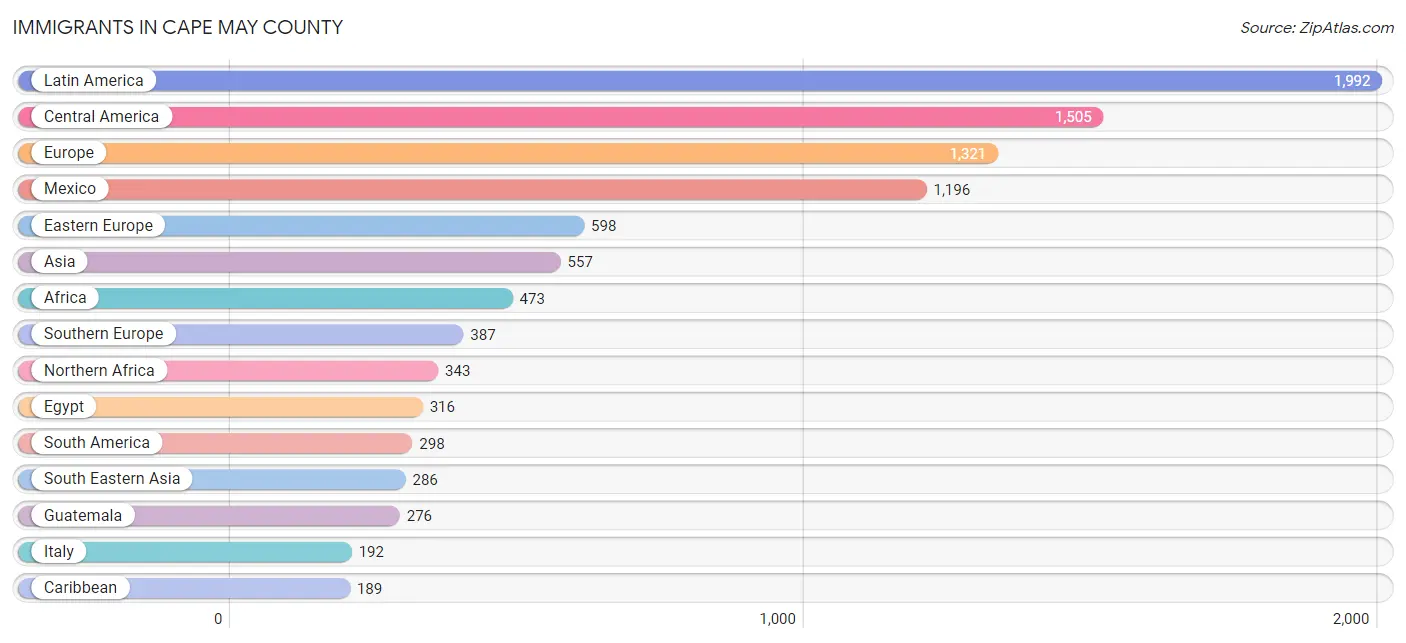
Immigrants in Cape May County
The most numerous immigrant groups reported in Cape May County came from Latin America (1,992 | 2.1%), Central America (1,505 | 1.6%), Europe (1,321 | 1.4%), Mexico (1,196 | 1.3%), and Eastern Europe (598 | 0.6%), together accounting for 6.9% of all Cape May County residents.
| Immigration Origin | # Population | % Population |
| Africa | 473 | 0.5% |
| Asia | 557 | 0.6% |
| Australia | 19 | 0.0% |
| Bahamas | 4 | 0.0% |
| Bangladesh | 24 | 0.0% |
| Belarus | 41 | 0.0% |
| Belgium | 11 | 0.0% |
| Brazil | 48 | 0.1% |
| Bulgaria | 138 | 0.1% |
| Canada | 136 | 0.1% |
| Caribbean | 189 | 0.2% |
| Central America | 1,505 | 1.6% |
| China | 43 | 0.1% |
| Colombia | 43 | 0.1% |
| Costa Rica | 29 | 0.0% |
| Cuba | 6 | 0.0% |
| Czechoslovakia | 10 | 0.0% |
| Dominican Republic | 9 | 0.0% |
| Eastern Africa | 99 | 0.1% |
| Eastern Asia | 107 | 0.1% |
| Eastern Europe | 598 | 0.6% |
| Ecuador | 36 | 0.0% |
| Egypt | 316 | 0.3% |
| El Salvador | 4 | 0.0% |
| England | 93 | 0.1% |
| Europe | 1,321 | 1.4% |
| France | 11 | 0.0% |
| Germany | 135 | 0.1% |
| Ghana | 4 | 0.0% |
| Greece | 50 | 0.1% |
| Guatemala | 276 | 0.3% |
| Guyana | 139 | 0.2% |
| Hungary | 1 | 0.0% |
| India | 139 | 0.2% |
| Ireland | 34 | 0.0% |
| Israel | 1 | 0.0% |
| Italy | 192 | 0.2% |
| Jamaica | 163 | 0.2% |
| Japan | 16 | 0.0% |
| Kenya | 62 | 0.1% |
| Korea | 48 | 0.1% |
| Latin America | 1,992 | 2.1% |
| Latvia | 6 | 0.0% |
| Mexico | 1,196 | 1.3% |
| Moldova | 36 | 0.0% |
| Morocco | 4 | 0.0% |
| North Macedonia | 31 | 0.0% |
| Northern Africa | 343 | 0.4% |
| Northern Europe | 179 | 0.2% |
| Oceania | 55 | 0.1% |
| Peru | 27 | 0.0% |
| Philippines | 187 | 0.2% |
| Poland | 161 | 0.2% |
| Portugal | 44 | 0.1% |
| Romania | 87 | 0.1% |
| Russia | 36 | 0.0% |
| Scotland | 13 | 0.0% |
| Serbia | 7 | 0.0% |
| South Africa | 27 | 0.0% |
| South America | 298 | 0.3% |
| South Central Asia | 163 | 0.2% |
| South Eastern Asia | 286 | 0.3% |
| Southern Europe | 387 | 0.4% |
| Spain | 101 | 0.1% |
| Taiwan | 29 | 0.0% |
| Thailand | 9 | 0.0% |
| Trinidad and Tobago | 7 | 0.0% |
| Ukraine | 10 | 0.0% |
| Venezuela | 5 | 0.0% |
| Vietnam | 90 | 0.1% |
| Western Africa | 4 | 0.0% |
| Western Asia | 1 | 0.0% |
| Western Europe | 157 | 0.2% | View All 73 Rows |
Sex and Age in Cape May County
Sex and Age in Cape May County
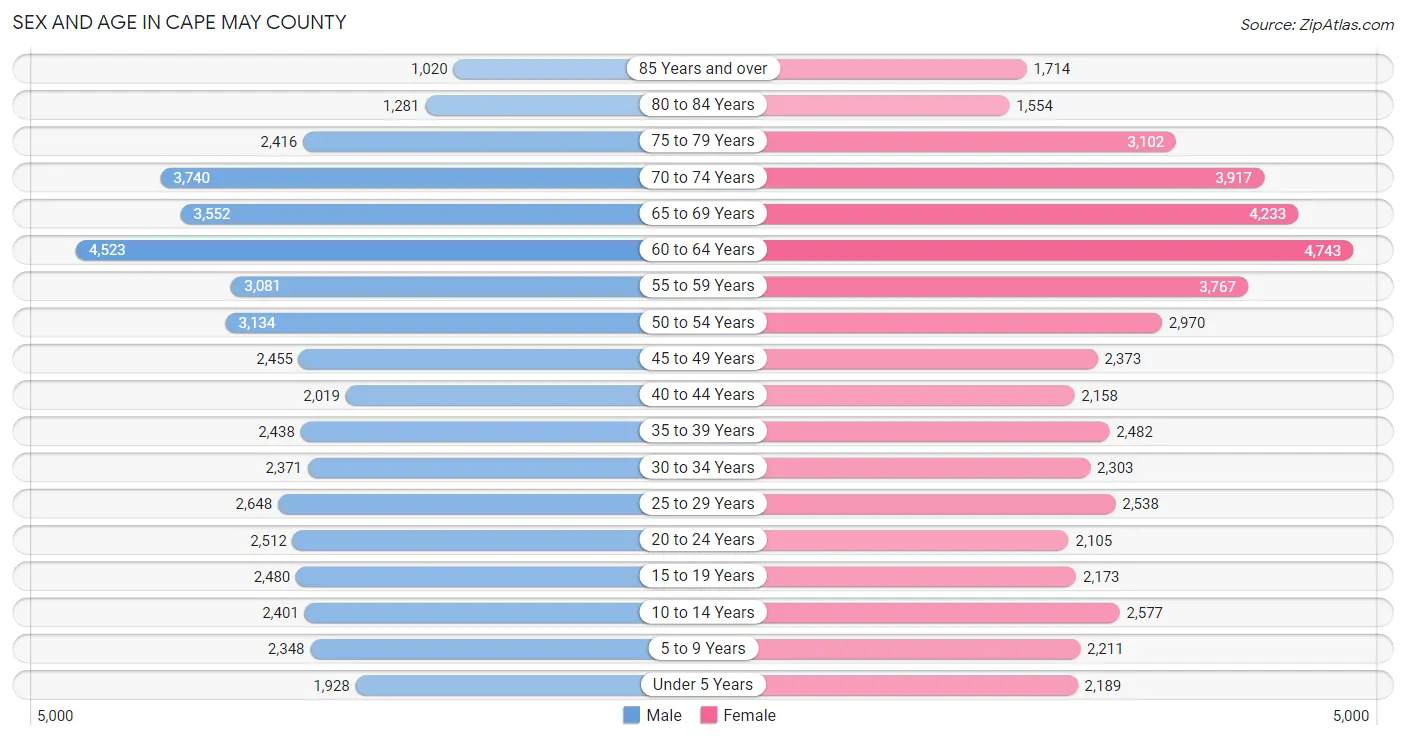
The most populous age groups in Cape May County are 60 to 64 Years (4,523 | 9.8%) for men and 60 to 64 Years (4,743 | 9.7%) for women.
| Age Bracket | Male | Female |
| Under 5 Years | 1,928 (4.2%) | 2,189 (4.5%) |
| 5 to 9 Years | 2,348 (5.1%) | 2,211 (4.5%) |
| 10 to 14 Years | 2,401 (5.2%) | 2,577 (5.2%) |
| 15 to 19 Years | 2,480 (5.3%) | 2,173 (4.4%) |
| 20 to 24 Years | 2,512 (5.4%) | 2,105 (4.3%) |
| 25 to 29 Years | 2,648 (5.7%) | 2,538 (5.2%) |
| 30 to 34 Years | 2,371 (5.1%) | 2,303 (4.7%) |
| 35 to 39 Years | 2,438 (5.3%) | 2,482 (5.1%) |
| 40 to 44 Years | 2,019 (4.4%) | 2,158 (4.4%) |
| 45 to 49 Years | 2,455 (5.3%) | 2,373 (4.8%) |
| 50 to 54 Years | 3,134 (6.8%) | 2,970 (6.0%) |
| 55 to 59 Years | 3,081 (6.7%) | 3,767 (7.7%) |
| 60 to 64 Years | 4,523 (9.8%) | 4,743 (9.7%) |
| 65 to 69 Years | 3,552 (7.7%) | 4,233 (8.6%) |
| 70 to 74 Years | 3,740 (8.1%) | 3,917 (8.0%) |
| 75 to 79 Years | 2,416 (5.2%) | 3,102 (6.3%) |
| 80 to 84 Years | 1,281 (2.8%) | 1,554 (3.2%) |
| 85 Years and over | 1,020 (2.2%) | 1,714 (3.5%) |
| Total | 46,347 (100.0%) | 49,109 (100.0%) |
Families and Households in Cape May County
Median Family Size in Cape May County
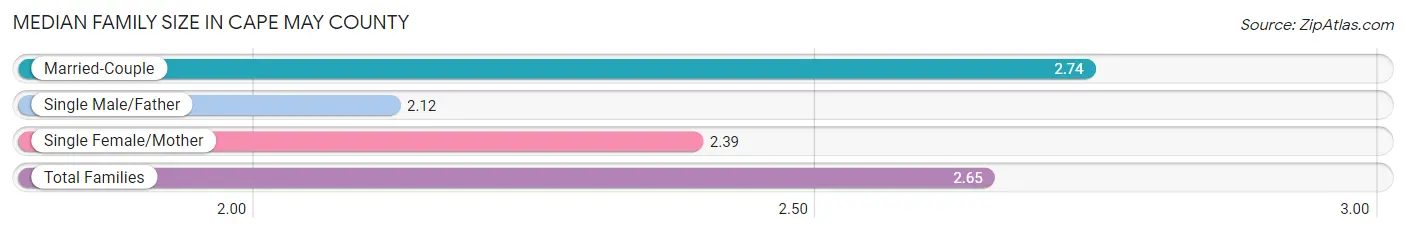
The median family size in Cape May County is 2.65 persons per family, with married-couple families (22,687 | 79.7%) accounting for the largest median family size of 2.74 persons per family. On the other hand, single male/father families (1,587 | 5.6%) represent the smallest median family size with 2.12 persons per family.
| Family Type | # Families | Family Size |
| Married-Couple | 22,687 (79.7%) | 2.74 |
| Single Male/Father | 1,587 (5.6%) | 2.12 |
| Single Female/Mother | 4,174 (14.7%) | 2.39 |
| Total Families | 28,448 (100.0%) | 2.65 |
Median Household Size in Cape May County
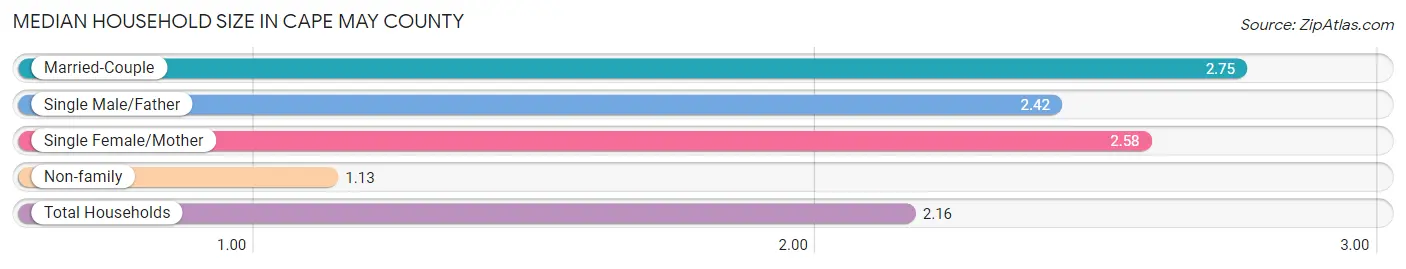
The median household size in Cape May County is 2.16 persons per household, with married-couple households (22,687 | 52.4%) accounting for the largest median household size of 2.75 persons per household. non-family households (14,829 | 34.3%) represent the smallest median household size with 1.13 persons per household.
| Household Type | # Households | Household Size |
| Married-Couple | 22,687 (52.4%) | 2.75 |
| Single Male/Father | 1,587 (3.7%) | 2.42 |
| Single Female/Mother | 4,174 (9.6%) | 2.58 |
| Non-family | 14,829 (34.3%) | 1.13 |
| Total Households | 43,277 (100.0%) | 2.16 |
Household Size by Marriage Status in Cape May County
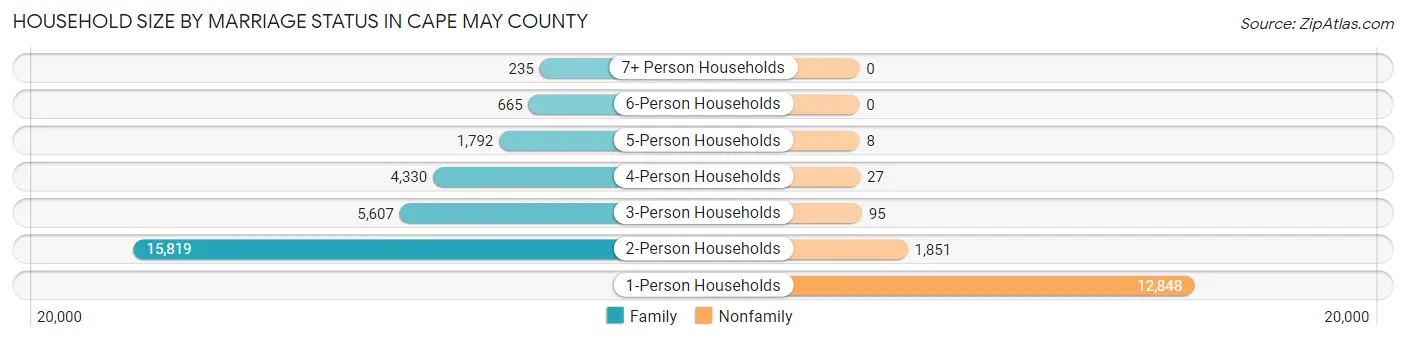
Out of a total of 43,277 households in Cape May County, 28,448 (65.7%) are family households, while 14,829 (34.3%) are nonfamily households. The most numerous type of family households are 2-person households, comprising 15,819, and the most common type of nonfamily households are 1-person households, comprising 12,848.
| Household Size | Family Households | Nonfamily Households |
| 1-Person Households | - | 12,848 (29.7%) |
| 2-Person Households | 15,819 (36.5%) | 1,851 (4.3%) |
| 3-Person Households | 5,607 (13.0%) | 95 (0.2%) |
| 4-Person Households | 4,330 (10.0%) | 27 (0.1%) |
| 5-Person Households | 1,792 (4.1%) | 8 (0.0%) |
| 6-Person Households | 665 (1.5%) | 0 (0.0%) |
| 7+ Person Households | 235 (0.5%) | 0 (0.0%) |
| Total | 28,448 (65.7%) | 14,829 (34.3%) |
Female Fertility in Cape May County
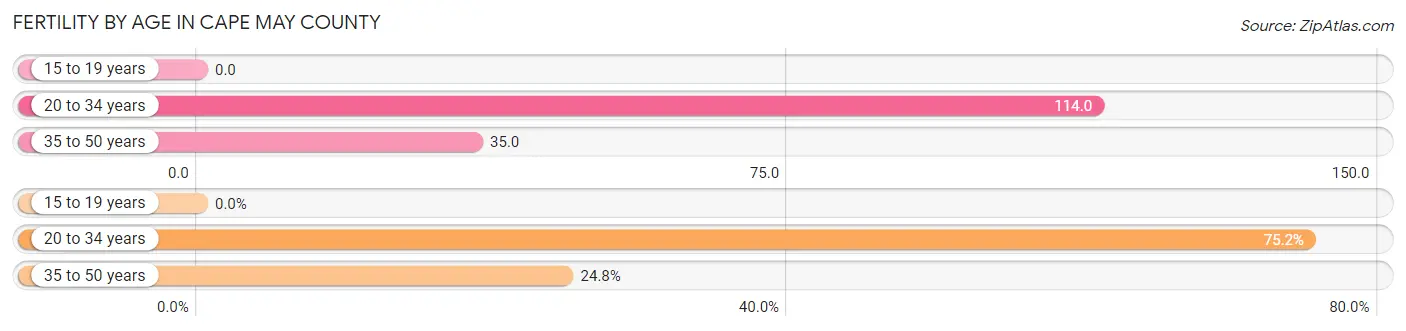
Fertility by Age in Cape May County
Average fertility rate in Cape May County is 63.0 births per 1,000 women. Women in the age bracket of 20 to 34 years have the highest fertility rate with 114.0 births per 1,000 women. Women in the age bracket of 20 to 34 years acount for 75.2% of all women with births.
| Age Bracket | Women with Births | Births / 1,000 Women |
| 15 to 19 years | 0 (0.0%) | 0.0 |
| 20 to 34 years | 794 (75.2%) | 114.0 |
| 35 to 50 years | 262 (24.8%) | 35.0 |
| Total | 1,056 (100.0%) | 63.0 |
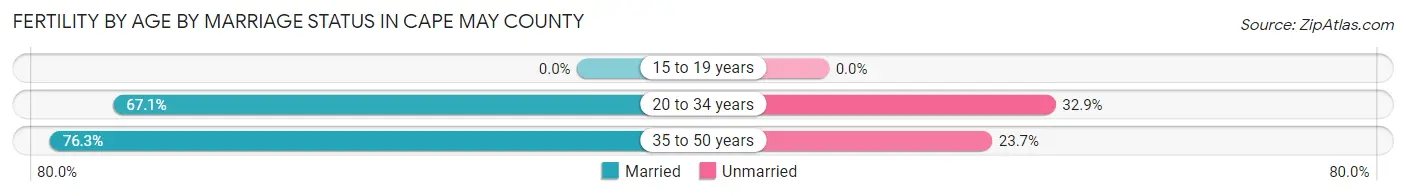
Fertility by Age by Marriage Status in Cape May County
69.4% of women with births (1,056) in Cape May County are married. The highest percentage of unmarried women with births falls into 20 to 34 years age bracket with 32.9% of them unmarried at the time of birth, while the lowest percentage of unmarried women with births belong to 35 to 50 years age bracket with 23.7% of them unmarried.
| Age Bracket | Married | Unmarried |
| 15 to 19 years | 0 (0.0%) | 0 (0.0%) |
| 20 to 34 years | 533 (67.1%) | 261 (32.9%) |
| 35 to 50 years | 200 (76.3%) | 62 (23.7%) |
| Total | 733 (69.4%) | 323 (30.6%) |
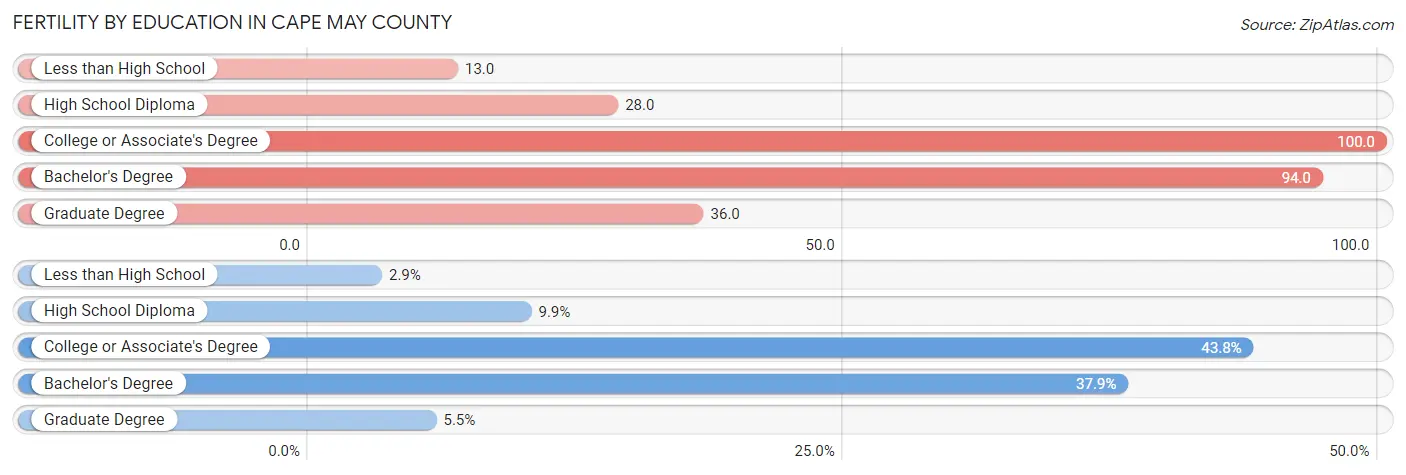
Fertility by Education in Cape May County
Average fertility rate in Cape May County is 63.0 births per 1,000 women. Women with the education attainment of college or associate's degree have the highest fertility rate of 100.0 births per 1,000 women, while women with the education attainment of less than high school have the lowest fertility at 13.0 births per 1,000 women. Women with the education attainment of college or associate's degree represent 43.8% of all women with births.
| Educational Attainment | Women with Births | Births / 1,000 Women |
| Less than High School | 31 (2.9%) | 13.0 |
| High School Diploma | 105 (9.9%) | 28.0 |
| College or Associate's Degree | 462 (43.8%) | 100.0 |
| Bachelor's Degree | 400 (37.9%) | 94.0 |
| Graduate Degree | 58 (5.5%) | 36.0 |
| Total | 1,056 (100.0%) | 63.0 |
Fertility by Education by Marriage Status in Cape May County
30.6% of women with births in Cape May County are unmarried. Women with the educational attainment of graduate degree are most likely to be married with 100.0% of them married at childbirth, while women with the educational attainment of less than high school are least likely to be married with 100.0% of them unmarried at childbirth.

| Educational Attainment | Married | Unmarried |
| Less than High School | 0 (0.0%) | 31 (100.0%) |
| High School Diploma | 77 (73.3%) | 28 (26.7%) |
| College or Associate's Degree | 202 (43.7%) | 260 (56.3%) |
| Bachelor's Degree | 396 (99.0%) | 4 (1.0%) |
| Graduate Degree | 58 (100.0%) | 0 (0.0%) |
| Total | 733 (69.4%) | 323 (30.6%) |
Income in Cape May County
Income Overview in Cape May County
Per Capita Income in Cape May County is $51,344, while median incomes of families and households are $101,287 and $83,870 respectively.
| Characteristic | Number | Measure |
| Per Capita Income | 95,456 | $51,344 |
| Median Family Income | 28,448 | $101,287 |
| Mean Family Income | 28,448 | $136,845 |
| Median Household Income | 43,277 | $83,870 |
| Mean Household Income | 43,277 | $115,264 |
| Income Deficit | 28,448 | $10,386 |
| Wage / Income Gap (%) | 95,456 | 23.95% |
| Wage / Income Gap ($) | 95,456 | 76.05¢ per $1 |
| Gini / Inequality Index | 95,456 | 0.47 |
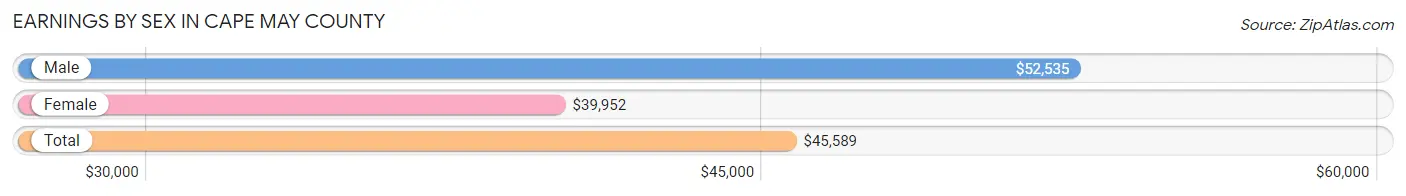
Earnings by Sex in Cape May County
Average Earnings in Cape May County are $45,589, $52,535 for men and $39,952 for women, a difference of 23.9%.
| Sex | Number | Average Earnings |
| Male | 25,669 (52.1%) | $52,535 |
| Female | 23,610 (47.9%) | $39,952 |
| Total | 49,279 (100.0%) | $45,589 |
Earnings by Sex by Income Bracket in Cape May County
The most common earnings brackets in Cape May County are $100,000+ for men (5,825 | 22.7%) and $75,000 to $99,999 for women (2,944 | 12.5%).
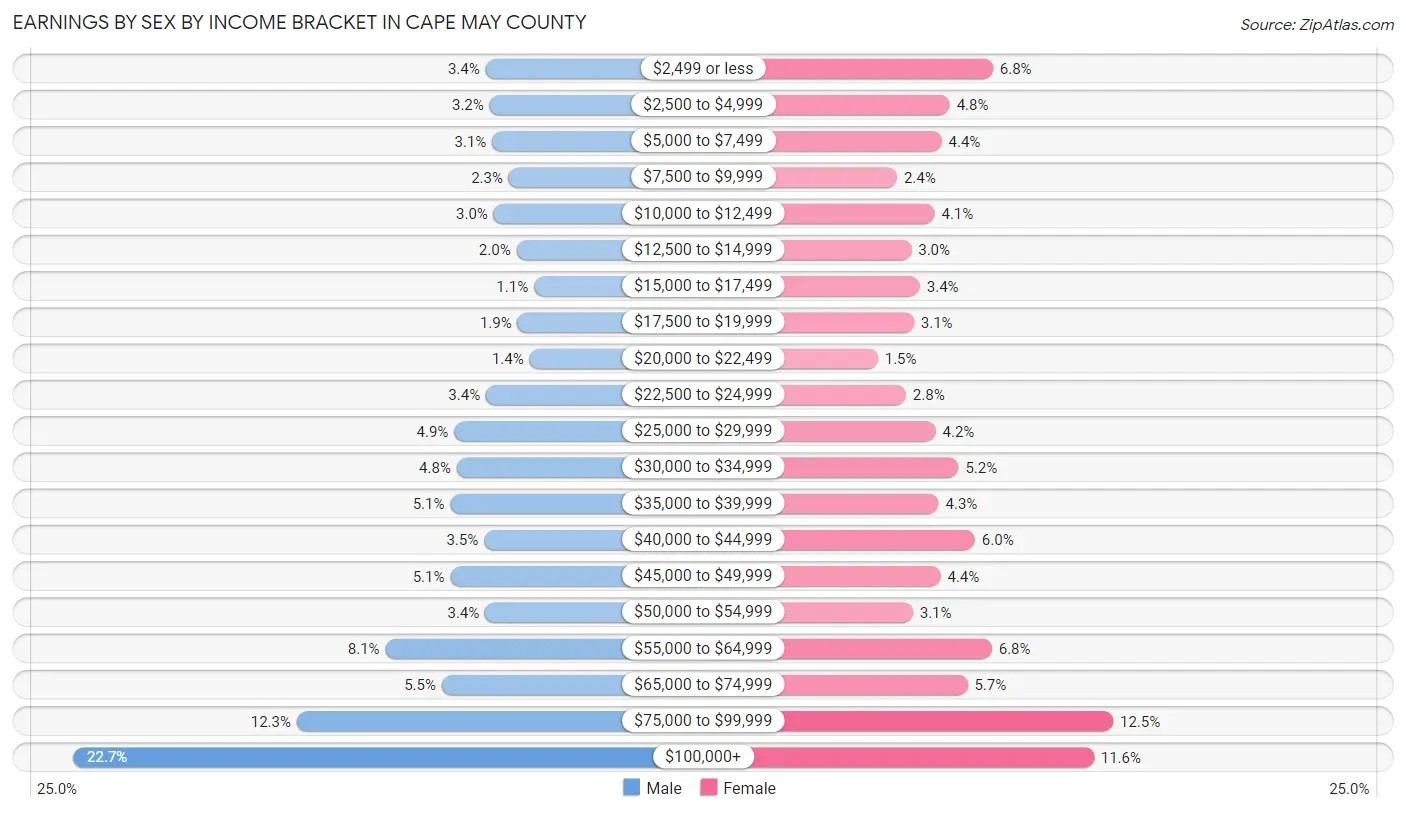
| Income | Male | Female |
| $2,499 or less | 876 (3.4%) | 1,614 (6.8%) |
| $2,500 to $4,999 | 827 (3.2%) | 1,137 (4.8%) |
| $5,000 to $7,499 | 795 (3.1%) | 1,048 (4.4%) |
| $7,500 to $9,999 | 595 (2.3%) | 554 (2.4%) |
| $10,000 to $12,499 | 778 (3.0%) | 971 (4.1%) |
| $12,500 to $14,999 | 503 (2.0%) | 714 (3.0%) |
| $15,000 to $17,499 | 292 (1.1%) | 808 (3.4%) |
| $17,500 to $19,999 | 491 (1.9%) | 742 (3.1%) |
| $20,000 to $22,499 | 347 (1.3%) | 342 (1.5%) |
| $22,500 to $24,999 | 869 (3.4%) | 653 (2.8%) |
| $25,000 to $29,999 | 1,253 (4.9%) | 982 (4.2%) |
| $30,000 to $34,999 | 1,223 (4.8%) | 1,234 (5.2%) |
| $35,000 to $39,999 | 1,298 (5.1%) | 1,016 (4.3%) |
| $40,000 to $44,999 | 893 (3.5%) | 1,416 (6.0%) |
| $45,000 to $49,999 | 1,300 (5.1%) | 1,036 (4.4%) |
| $50,000 to $54,999 | 880 (3.4%) | 730 (3.1%) |
| $55,000 to $64,999 | 2,078 (8.1%) | 1,603 (6.8%) |
| $65,000 to $74,999 | 1,402 (5.5%) | 1,334 (5.7%) |
| $75,000 to $99,999 | 3,144 (12.2%) | 2,944 (12.5%) |
| $100,000+ | 5,825 (22.7%) | 2,732 (11.6%) |
| Total | 25,669 (100.0%) | 23,610 (100.0%) |
Earnings by Sex by Educational Attainment in Cape May County
Average earnings in Cape May County are $59,586 for men and $43,745 for women, a difference of 26.6%. Men with an educational attainment of graduate degree enjoy the highest average annual earnings of $104,290, while those with less than high school education earn the least with $28,543. Women with an educational attainment of graduate degree earn the most with the average annual earnings of $83,941, while those with less than high school education have the smallest earnings of $19,950.
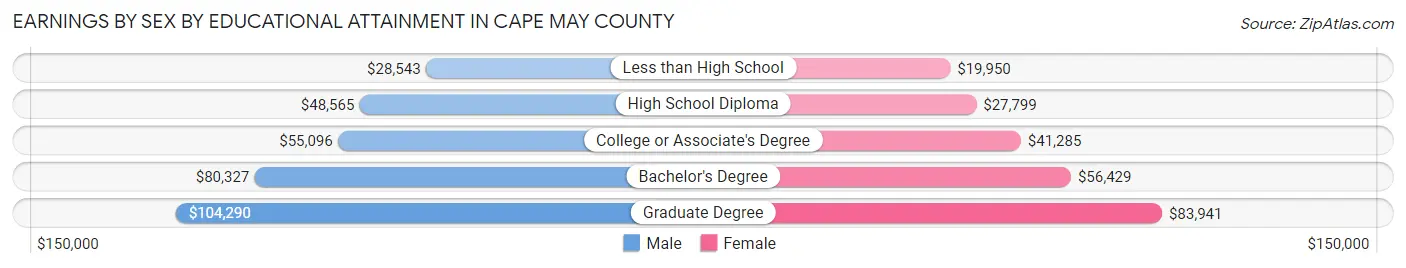
| Educational Attainment | Male Income | Female Income |
| Less than High School | $28,543 | $19,950 |
| High School Diploma | $48,565 | $27,799 |
| College or Associate's Degree | $55,096 | $41,285 |
| Bachelor's Degree | $80,327 | $56,429 |
| Graduate Degree | $104,290 | $83,941 |
| Total | $59,586 | $43,745 |
Family Income in Cape May County
Family Income Brackets in Cape May County
According to the Cape May County family income data, there are 5,860 families falling into the $100,000 to $149,999 income range, which is the most common income bracket and makes up 20.6% of all families. Conversely, the $10,000 to $14,999 income bracket is the least frequent group with only 455 families (1.6%) belonging to this category.
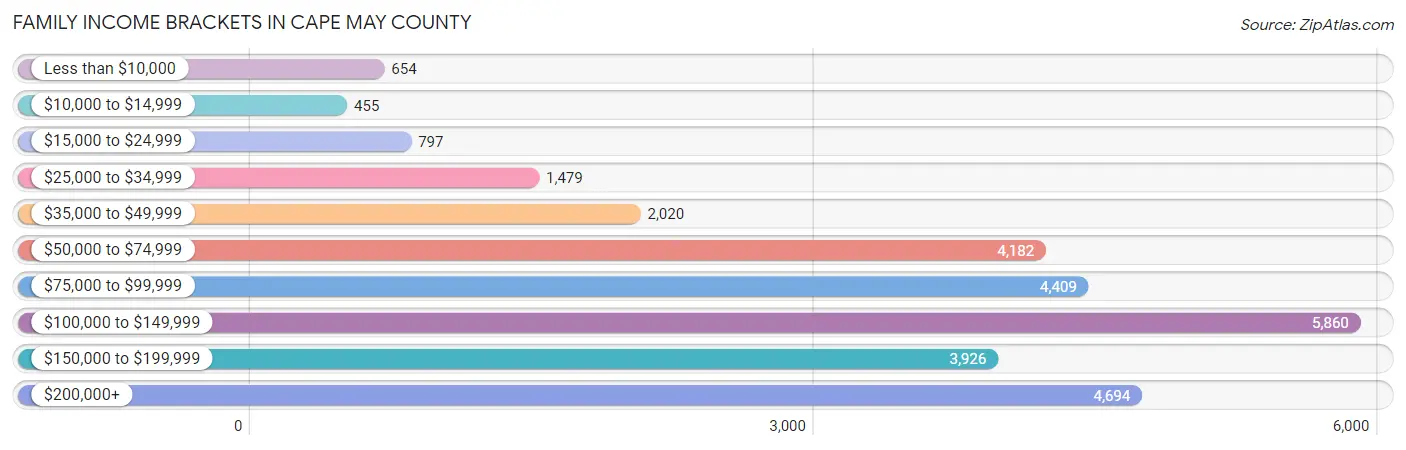
| Income Bracket | # Families | % Families |
| Less than $10,000 | 654 | 2.3% |
| $10,000 to $14,999 | 455 | 1.6% |
| $15,000 to $24,999 | 797 | 2.8% |
| $25,000 to $34,999 | 1,479 | 5.2% |
| $35,000 to $49,999 | 2,020 | 7.1% |
| $50,000 to $74,999 | 4,182 | 14.7% |
| $75,000 to $99,999 | 4,409 | 15.5% |
| $100,000 to $149,999 | 5,860 | 20.6% |
| $150,000 to $199,999 | 3,926 | 13.8% |
| $200,000+ | 4,694 | 16.5% |
Family Income by Famaliy Size in Cape May County
7+ person families (192 | 0.7%) account for the highest median family income in Cape May County with $169,327 per family, while 2-person families (16,889 | 59.4%) have the highest median income of $47,274 per family member.
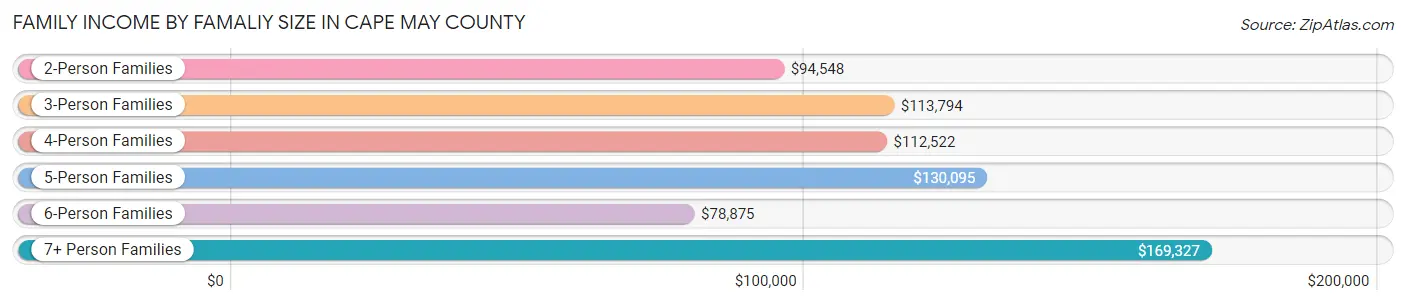
| Income Bracket | # Families | Median Income |
| 2-Person Families | 16,889 (59.4%) | $94,548 |
| 3-Person Families | 4,854 (17.1%) | $113,794 |
| 4-Person Families | 4,221 (14.8%) | $112,522 |
| 5-Person Families | 1,651 (5.8%) | $130,095 |
| 6-Person Families | 641 (2.2%) | $78,875 |
| 7+ Person Families | 192 (0.7%) | $169,327 |
| Total | 28,448 (100.0%) | $101,287 |
Family Income by Number of Earners in Cape May County
The median family income in Cape May County is $101,287, with families comprising 3+ earners (2,989) having the highest median family income of $159,798, while families with no earners (5,964) have the lowest median family income of $69,807, accounting for 10.5% and 21.0% of families, respectively.
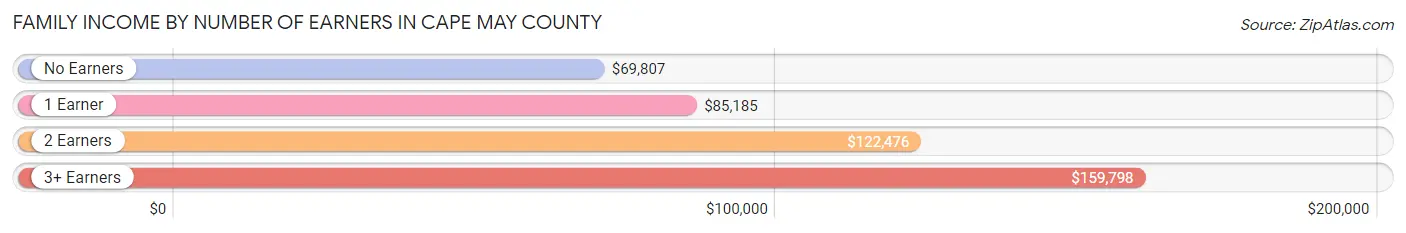
| Number of Earners | # Families | Median Income |
| No Earners | 5,964 (21.0%) | $69,807 |
| 1 Earner | 8,893 (31.3%) | $85,185 |
| 2 Earners | 10,602 (37.3%) | $122,476 |
| 3+ Earners | 2,989 (10.5%) | $159,798 |
| Total | 28,448 (100.0%) | $101,287 |
Household Income in Cape May County
Household Income Brackets in Cape May County
With 7,530 households falling in the category, the $100,000 to $149,999 income range is the most frequent in Cape May County, accounting for 17.4% of all households. In contrast, only 1,515 households (3.5%) fall into the $10,000 to $14,999 income bracket, making it the least populous group.
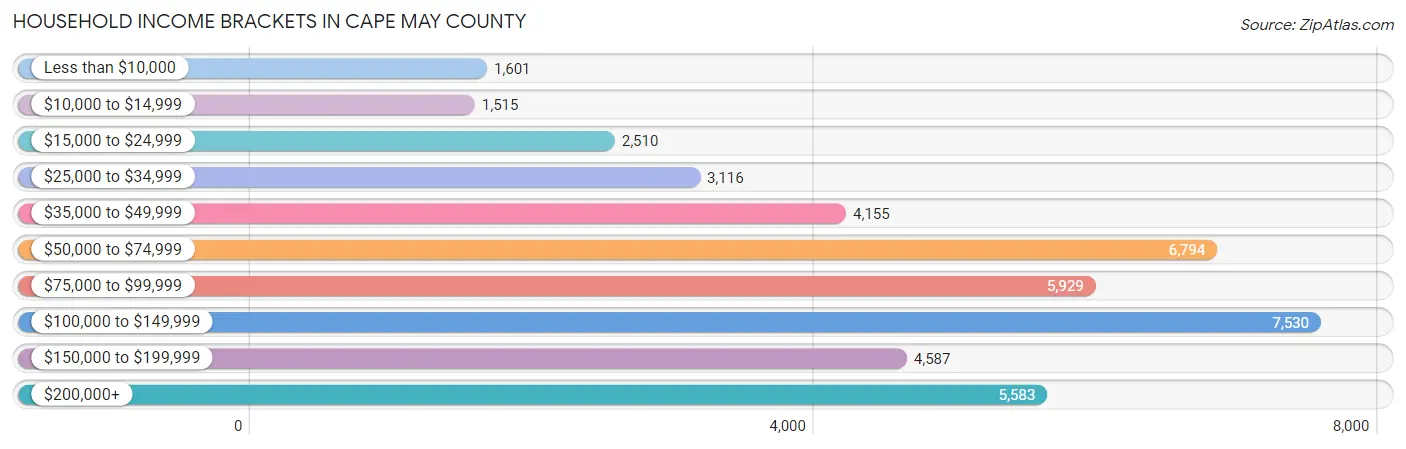
| Income Bracket | # Households | % Households |
| Less than $10,000 | 1,601 | 3.7% |
| $10,000 to $14,999 | 1,515 | 3.5% |
| $15,000 to $24,999 | 2,510 | 5.8% |
| $25,000 to $34,999 | 3,116 | 7.2% |
| $35,000 to $49,999 | 4,155 | 9.6% |
| $50,000 to $74,999 | 6,794 | 15.7% |
| $75,000 to $99,999 | 5,929 | 13.7% |
| $100,000 to $149,999 | 7,530 | 17.4% |
| $150,000 to $199,999 | 4,587 | 10.6% |
| $200,000+ | 5,583 | 12.9% |
Household Income by Householder Age in Cape May County
The median household income in Cape May County is $83,870, with the highest median household income of $101,949 found in the 45 to 64 years age bracket for the primary householder. A total of 16,104 households (37.2%) fall into this category. Meanwhile, the 15 to 24 years age bracket for the primary householder has the lowest median household income of $41,366, with 957 households (2.2%) in this group.
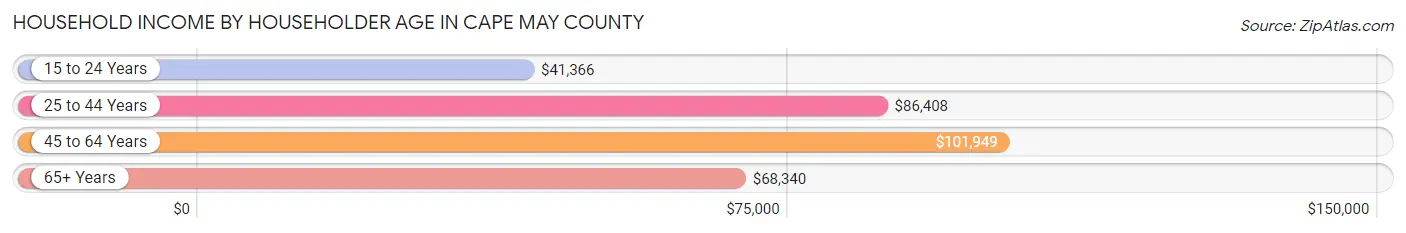
| Income Bracket | # Households | Median Income |
| 15 to 24 Years | 957 (2.2%) | $41,366 |
| 25 to 44 Years | 9,337 (21.6%) | $86,408 |
| 45 to 64 Years | 16,104 (37.2%) | $101,949 |
| 65+ Years | 16,879 (39.0%) | $68,340 |
| Total | 43,277 (100.0%) | $83,870 |
Poverty in Cape May County
Income Below Poverty by Sex and Age in Cape May County
With 8.8% poverty level for males and 9.1% for females among the residents of Cape May County, 15 year old males and 35 to 44 year old females are the most vulnerable to poverty, with 182 males (31.2%) and 706 females (15.2%) in their respective age groups living below the poverty level.
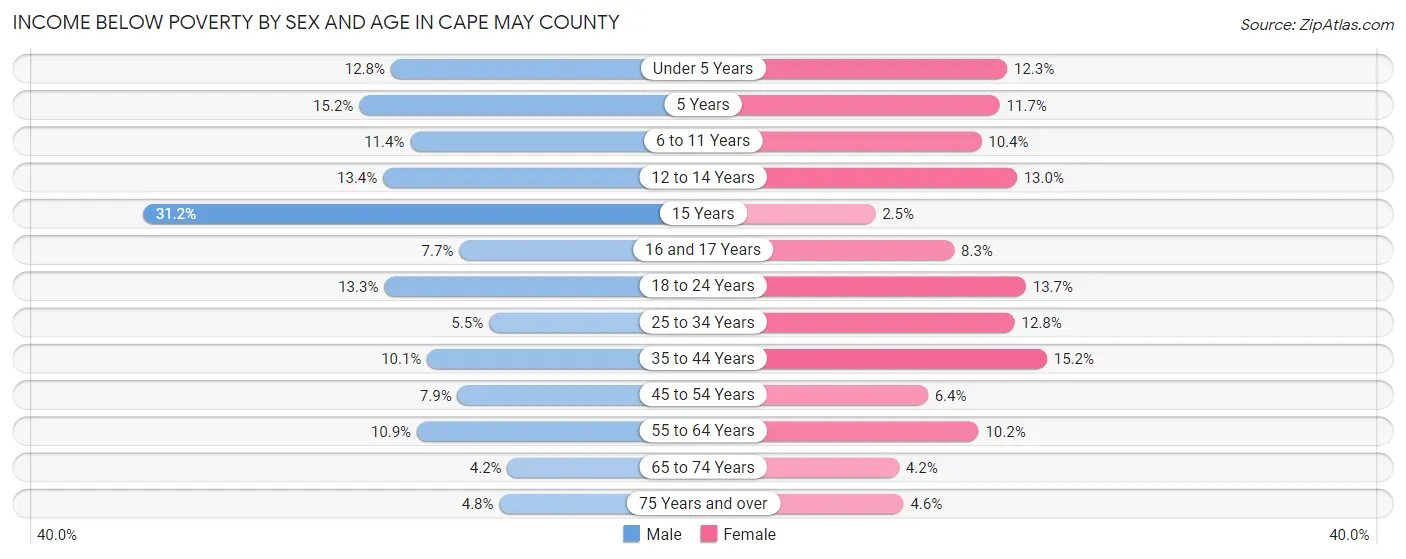
| Age Bracket | Male | Female |
| Under 5 Years | 247 (12.8%) | 268 (12.3%) |
| 5 Years | 47 (15.2%) | 56 (11.7%) |
| 6 to 11 Years | 329 (11.4%) | 273 (10.4%) |
| 12 to 14 Years | 200 (13.4%) | 216 (13.0%) |
| 15 Years | 182 (31.2%) | 9 (2.5%) |
| 16 and 17 Years | 77 (7.7%) | 91 (8.3%) |
| 18 to 24 Years | 430 (13.3%) | 381 (13.7%) |
| 25 to 34 Years | 273 (5.5%) | 620 (12.8%) |
| 35 to 44 Years | 444 (10.1%) | 706 (15.2%) |
| 45 to 54 Years | 435 (7.9%) | 341 (6.4%) |
| 55 to 64 Years | 826 (10.9%) | 861 (10.2%) |
| 65 to 74 Years | 301 (4.2%) | 340 (4.2%) |
| 75 Years and over | 217 (4.8%) | 273 (4.6%) |
| Total | 4,008 (8.8%) | 4,435 (9.1%) |
Income Above Poverty by Sex and Age in Cape May County
According to the poverty statistics in Cape May County, males aged 65 to 74 years and females aged 15 years are the age groups that are most secure financially, with 95.9% of males and 97.5% of females in these age groups living above the poverty line.
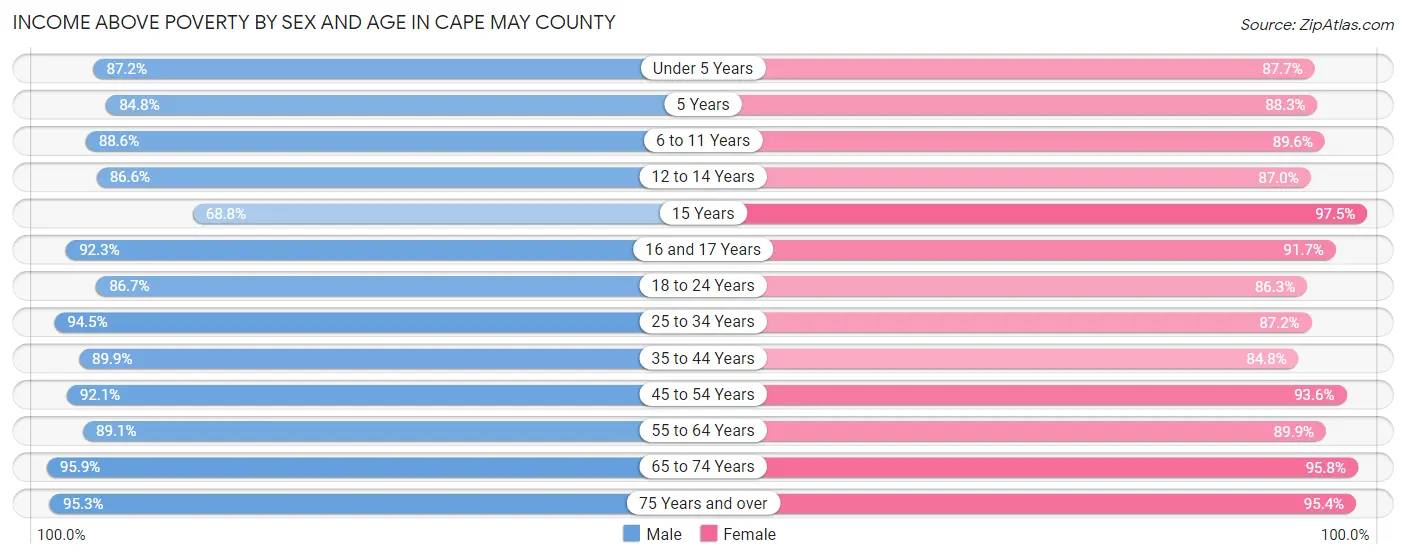
| Age Bracket | Male | Female |
| Under 5 Years | 1,681 (87.2%) | 1,916 (87.7%) |
| 5 Years | 263 (84.8%) | 422 (88.3%) |
| 6 to 11 Years | 2,564 (88.6%) | 2,363 (89.6%) |
| 12 to 14 Years | 1,294 (86.6%) | 1,447 (87.0%) |
| 15 Years | 401 (68.8%) | 354 (97.5%) |
| 16 and 17 Years | 919 (92.3%) | 1,000 (91.7%) |
| 18 to 24 Years | 2,803 (86.7%) | 2,409 (86.3%) |
| 25 to 34 Years | 4,677 (94.5%) | 4,212 (87.2%) |
| 35 to 44 Years | 3,947 (89.9%) | 3,934 (84.8%) |
| 45 to 54 Years | 5,099 (92.1%) | 5,002 (93.6%) |
| 55 to 64 Years | 6,771 (89.1%) | 7,618 (89.8%) |
| 65 to 74 Years | 6,946 (95.9%) | 7,683 (95.8%) |
| 75 Years and over | 4,352 (95.3%) | 5,687 (95.4%) |
| Total | 41,717 (91.2%) | 44,047 (90.8%) |
Income Below Poverty Among Married-Couple Families in Cape May County
The poverty statistics for married-couple families in Cape May County show that 3.2% or 736 of the total 22,687 families live below the poverty line. Families with 3 or 4 children have the highest poverty rate of 6.7%, comprising of 90 families. On the other hand, families with 5 or more children have the lowest poverty rate of 0.0%, which includes 0 families.
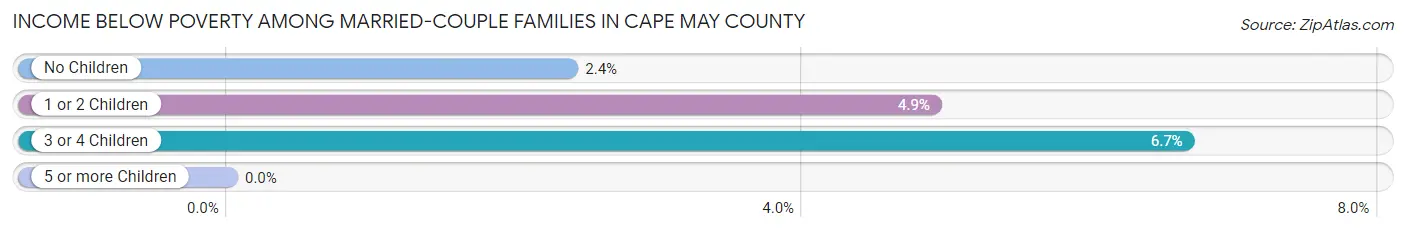
| Children | Above Poverty | Below Poverty |
| No Children | 15,229 (97.6%) | 369 (2.4%) |
| 1 or 2 Children | 5,371 (95.1%) | 277 (4.9%) |
| 3 or 4 Children | 1,262 (93.3%) | 90 (6.7%) |
| 5 or more Children | 89 (100.0%) | 0 (0.0%) |
| Total | 21,951 (96.8%) | 736 (3.2%) |
Income Below Poverty Among Single-Parent Households in Cape May County
According to the poverty data in Cape May County, 9.1% or 144 single-father households and 22.5% or 938 single-mother households are living below the poverty line. Among single-father households, those with no children have the highest poverty rate, with 111 households (12.4%) experiencing poverty. Likewise, among single-mother households, those with 3 or 4 children have the highest poverty rate, with 150 households (44.6%) falling below the poverty line.
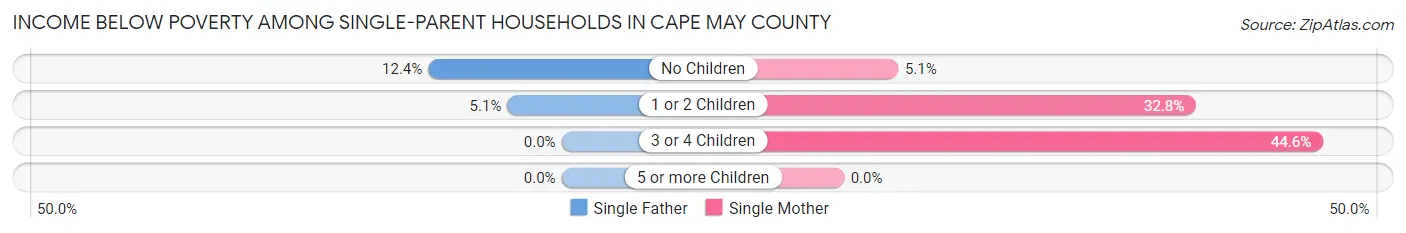
| Children | Single Father | Single Mother |
| No Children | 111 (12.4%) | 86 (5.1%) |
| 1 or 2 Children | 33 (5.1%) | 702 (32.8%) |
| 3 or 4 Children | 0 (0.0%) | 150 (44.6%) |
| 5 or more Children | 0 (0.0%) | 0 (0.0%) |
| Total | 144 (9.1%) | 938 (22.5%) |
Income Below Poverty Among Married-Couple vs Single-Parent Households in Cape May County
The poverty data for Cape May County shows that 736 of the married-couple family households (3.2%) and 1,082 of the single-parent households (18.8%) are living below the poverty level. Within the married-couple family households, those with 3 or 4 children have the highest poverty rate, with 90 households (6.7%) falling below the poverty line. Among the single-parent households, those with 3 or 4 children have the highest poverty rate, with 150 household (43.0%) living below poverty.
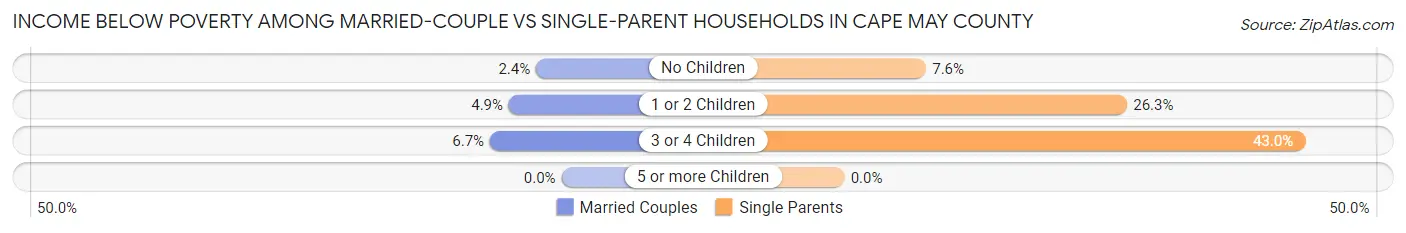
| Children | Married-Couple Families | Single-Parent Households |
| No Children | 369 (2.4%) | 197 (7.6%) |
| 1 or 2 Children | 277 (4.9%) | 735 (26.3%) |
| 3 or 4 Children | 90 (6.7%) | 150 (43.0%) |
| 5 or more Children | 0 (0.0%) | 0 (0.0%) |
| Total | 736 (3.2%) | 1,082 (18.8%) |
Employment Characteristics in Cape May County
Employment by Class of Employer in Cape May County
Among the 42,154 employed individuals in Cape May County, private company employees (24,399 | 57.9%), local government employees (5,875 | 13.9%), and not-for-profit organizations (3,335 | 7.9%) make up the most common classes of employment.
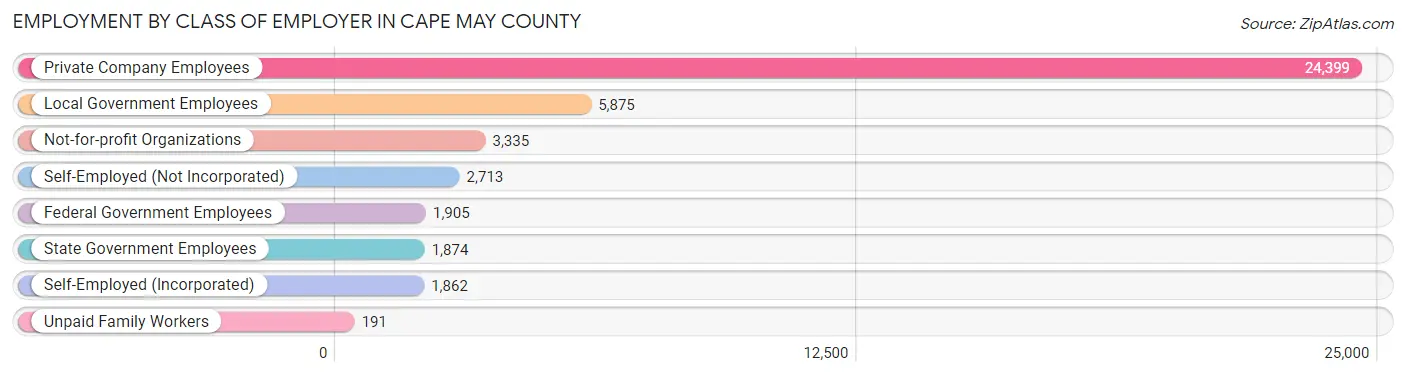
| Employer Class | # Employees | % Employees |
| Private Company Employees | 24,399 | 57.9% |
| Self-Employed (Incorporated) | 1,862 | 4.4% |
| Self-Employed (Not Incorporated) | 2,713 | 6.4% |
| Not-for-profit Organizations | 3,335 | 7.9% |
| Local Government Employees | 5,875 | 13.9% |
| State Government Employees | 1,874 | 4.4% |
| Federal Government Employees | 1,905 | 4.5% |
| Unpaid Family Workers | 191 | 0.4% |
| Total | 42,154 | 100.0% |
Employment Status by Age in Cape May County
According to the labor force statistics for Cape May County, out of the total population over 16 years of age (80,856), 56.8% or 45,926 individuals are in the labor force, with 6.5% or 2,985 of them unemployed. The age group with the highest labor force participation rate is 30 to 34 years, with 90.1% or 4,211 individuals in the labor force. Within the labor force, the 20 to 24 years age range has the highest percentage of unemployed individuals, with 16.4% or 585 of them being unemployed.

| Age Bracket | In Labor Force | Unemployed |
| 16 to 19 Years | 1,550 (41.8%) | 205 (13.2%) |
| 20 to 24 Years | 3,569 (77.3%) | 585 (16.4%) |
| 25 to 29 Years | 4,284 (82.6%) | 206 (4.8%) |
| 30 to 34 Years | 4,211 (90.1%) | 173 (4.1%) |
| 35 to 44 Years | 7,769 (85.4%) | 466 (6.0%) |
| 45 to 54 Years | 8,997 (82.3%) | 549 (6.1%) |
| 55 to 59 Years | 4,794 (70.0%) | 182 (3.8%) |
| 60 to 64 Years | 5,291 (57.1%) | 233 (4.4%) |
| 65 to 74 Years | 4,355 (28.2%) | 366 (8.4%) |
| 75 Years and over | 1,109 (10.0%) | 40 (3.6%) |
| Total | 45,926 (56.8%) | 2,985 (6.5%) |
Employment Status by Educational Attainment in Cape May County
According to labor force statistics for Cape May County, 76.8% of individuals (35,330) out of the total population between 25 and 64 years of age (46,003) are in the labor force, with 5.1% or 1,802 of them being unemployed. The group with the highest labor force participation rate are those with the educational attainment of bachelor's degree or higher, with 84.4% or 14,450 individuals in the labor force. Within the labor force, individuals with less than high school education have the highest percentage of unemployment, with 13.0% or 188 of them being unemployed.
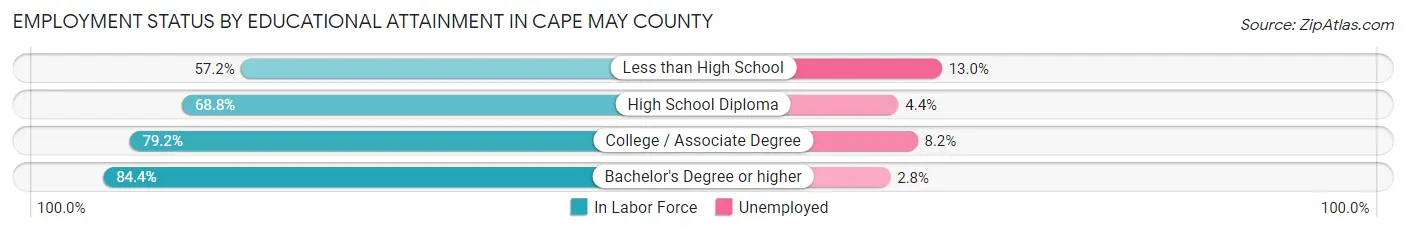
| Educational Attainment | In Labor Force | Unemployed |
| Less than High School | 1,447 (57.2%) | 329 (13.0%) |
| High School Diploma | 9,380 (68.8%) | 600 (4.4%) |
| College / Associate Degree | 10,073 (79.2%) | 1,043 (8.2%) |
| Bachelor's Degree or higher | 14,450 (84.4%) | 479 (2.8%) |
| Total | 35,330 (76.8%) | 2,346 (5.1%) |
Employment Occupations by Sex in Cape May County
Management, Business, Science and Arts Occupations
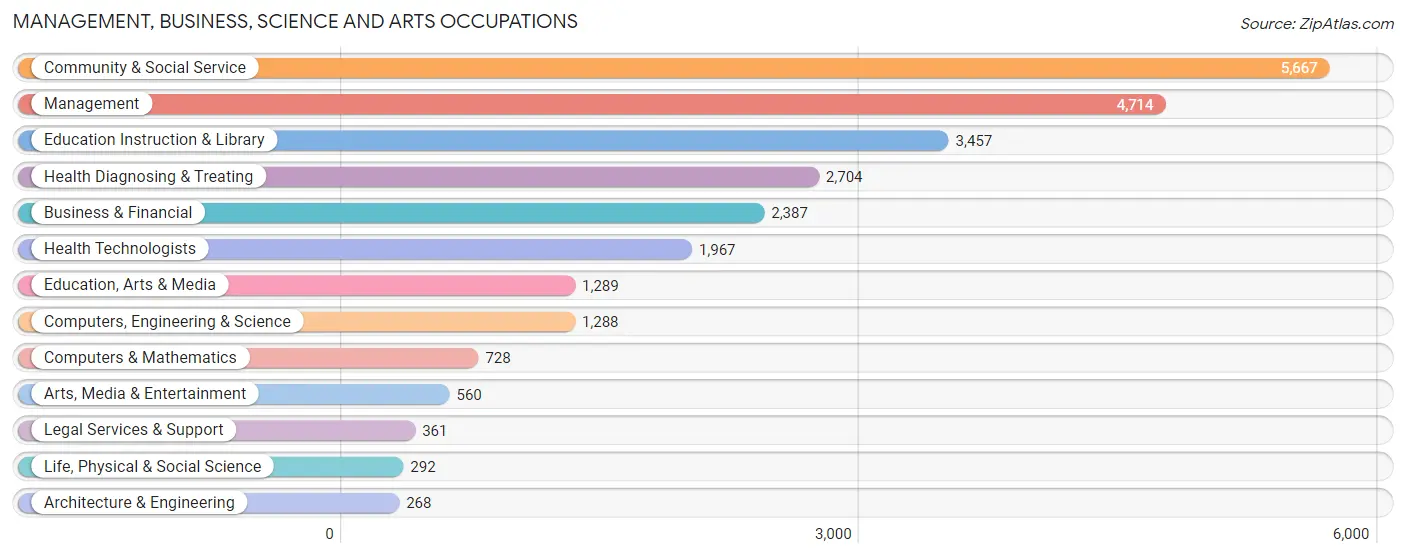
The most common Management, Business, Science and Arts occupations in Cape May County are Community & Social Service (5,667 | 13.4%), Management (4,714 | 11.2%), Education Instruction & Library (3,457 | 8.2%), Health Diagnosing & Treating (2,704 | 6.4%), and Business & Financial (2,387 | 5.7%).
Management, Business, Science and Arts Occupations by Sex
Within the Management, Business, Science and Arts occupations in Cape May County, the most male-oriented occupations are Architecture & Engineering (90.3%), Management (66.6%), and Computers & Mathematics (64.0%), while the most female-oriented occupations are Health Technologists (80.6%), Health Diagnosing & Treating (77.8%), and Education Instruction & Library (74.5%).

| Occupation | Male | Female |
| Management | 3,142 (66.6%) | 1,572 (33.4%) |
| Business & Financial | 1,136 (47.6%) | 1,251 (52.4%) |
| Computers, Engineering & Science | 824 (64.0%) | 464 (36.0%) |
| Computers & Mathematics | 466 (64.0%) | 262 (36.0%) |
| Architecture & Engineering | 242 (90.3%) | 26 (9.7%) |
| Life, Physical & Social Science | 116 (39.7%) | 176 (60.3%) |
| Community & Social Service | 1,695 (29.9%) | 3,972 (70.1%) |
| Education, Arts & Media | 341 (26.5%) | 948 (73.6%) |
| Legal Services & Support | 226 (62.6%) | 135 (37.4%) |
| Education Instruction & Library | 881 (25.5%) | 2,576 (74.5%) |
| Arts, Media & Entertainment | 247 (44.1%) | 313 (55.9%) |
| Health Diagnosing & Treating | 601 (22.2%) | 2,103 (77.8%) |
| Health Technologists | 381 (19.4%) | 1,586 (80.6%) |
| Total (Category) | 7,398 (44.1%) | 9,362 (55.9%) |
| Total (Overall) | 21,899 (51.9%) | 20,315 (48.1%) |
Services Occupations
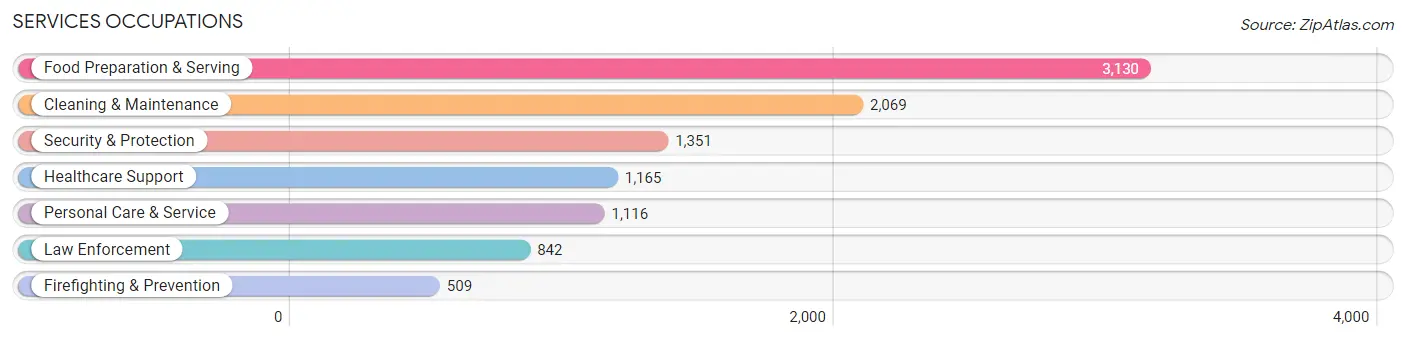
The most common Services occupations in Cape May County are Food Preparation & Serving (3,130 | 7.4%), Cleaning & Maintenance (2,069 | 4.9%), Security & Protection (1,351 | 3.2%), Healthcare Support (1,165 | 2.8%), and Personal Care & Service (1,116 | 2.6%).
Services Occupations by Sex
Within the Services occupations in Cape May County, the most male-oriented occupations are Law Enforcement (82.4%), Security & Protection (79.2%), and Firefighting & Prevention (73.9%), while the most female-oriented occupations are Healthcare Support (88.1%), Personal Care & Service (78.8%), and Food Preparation & Serving (53.3%).
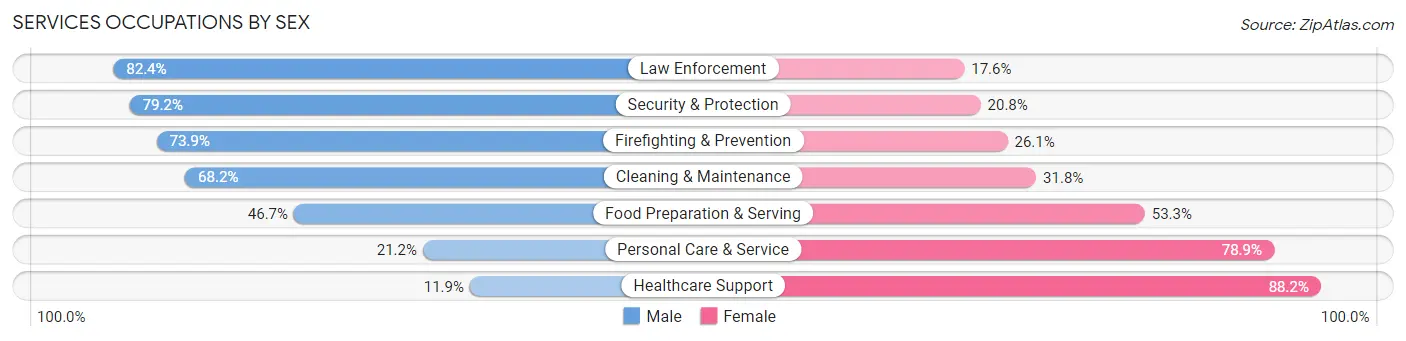
| Occupation | Male | Female |
| Healthcare Support | 138 (11.8%) | 1,027 (88.1%) |
| Security & Protection | 1,070 (79.2%) | 281 (20.8%) |
| Firefighting & Prevention | 376 (73.9%) | 133 (26.1%) |
| Law Enforcement | 694 (82.4%) | 148 (17.6%) |
| Food Preparation & Serving | 1,461 (46.7%) | 1,669 (53.3%) |
| Cleaning & Maintenance | 1,411 (68.2%) | 658 (31.8%) |
| Personal Care & Service | 236 (21.1%) | 880 (78.8%) |
| Total (Category) | 4,316 (48.9%) | 4,515 (51.1%) |
| Total (Overall) | 21,899 (51.9%) | 20,315 (48.1%) |
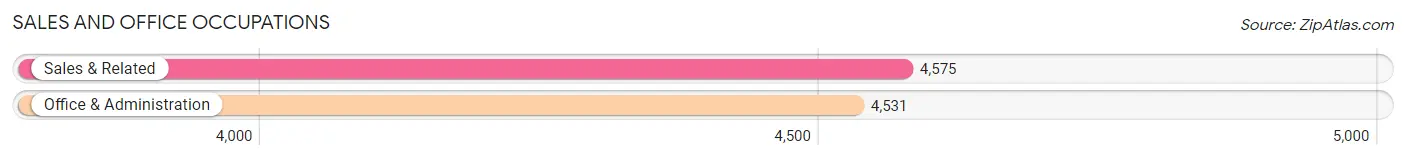
Sales and Office Occupations
The most common Sales and Office occupations in Cape May County are Sales & Related (4,575 | 10.8%), and Office & Administration (4,531 | 10.7%).
Sales and Office Occupations by Sex
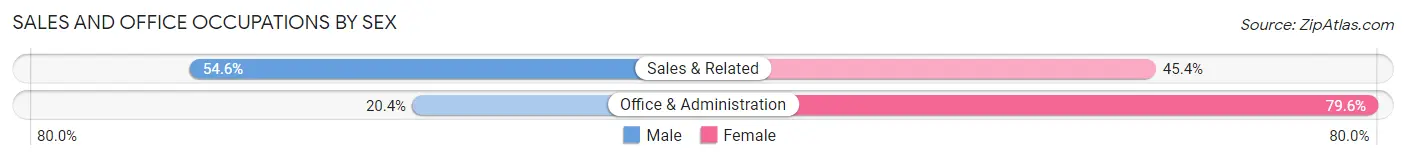
| Occupation | Male | Female |
| Sales & Related | 2,496 (54.6%) | 2,079 (45.4%) |
| Office & Administration | 925 (20.4%) | 3,606 (79.6%) |
| Total (Category) | 3,421 (37.6%) | 5,685 (62.4%) |
| Total (Overall) | 21,899 (51.9%) | 20,315 (48.1%) |
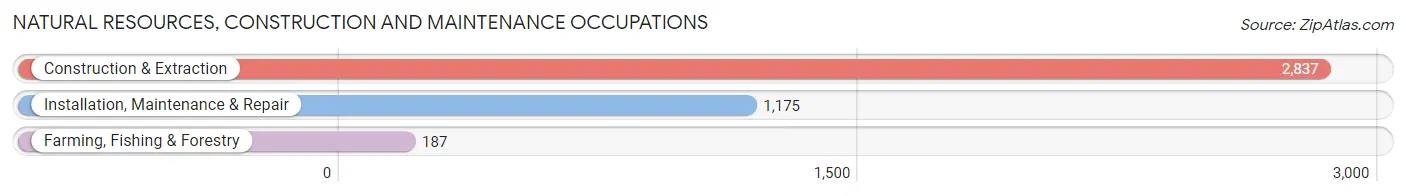
Natural Resources, Construction and Maintenance Occupations
The most common Natural Resources, Construction and Maintenance occupations in Cape May County are Construction & Extraction (2,837 | 6.7%), Installation, Maintenance & Repair (1,175 | 2.8%), and Farming, Fishing & Forestry (187 | 0.4%).
Natural Resources, Construction and Maintenance Occupations by Sex
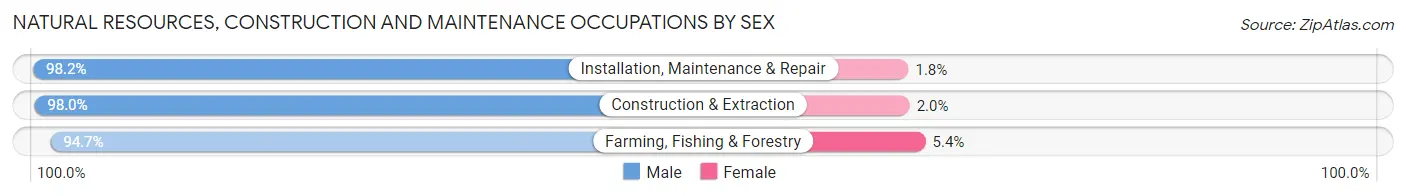
| Occupation | Male | Female |
| Farming, Fishing & Forestry | 177 (94.7%) | 10 (5.3%) |
| Construction & Extraction | 2,779 (98.0%) | 58 (2.0%) |
| Installation, Maintenance & Repair | 1,154 (98.2%) | 21 (1.8%) |
| Total (Category) | 4,110 (97.9%) | 89 (2.1%) |
| Total (Overall) | 21,899 (51.9%) | 20,315 (48.1%) |
Production, Transportation and Moving Occupations
The most common Production, Transportation and Moving occupations in Cape May County are Transportation (1,356 | 3.2%), Production (1,229 | 2.9%), and Material Moving (733 | 1.7%).
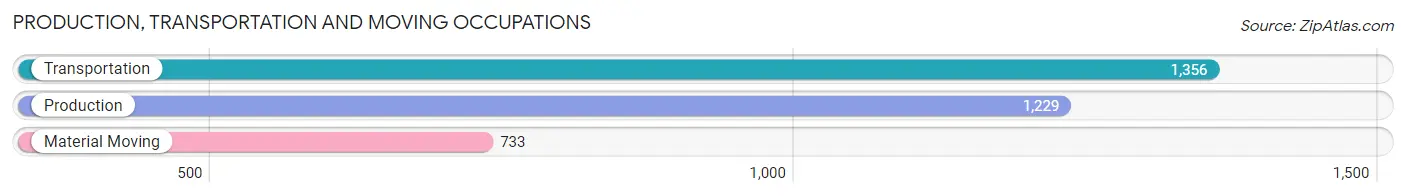
Production, Transportation and Moving Occupations by Sex
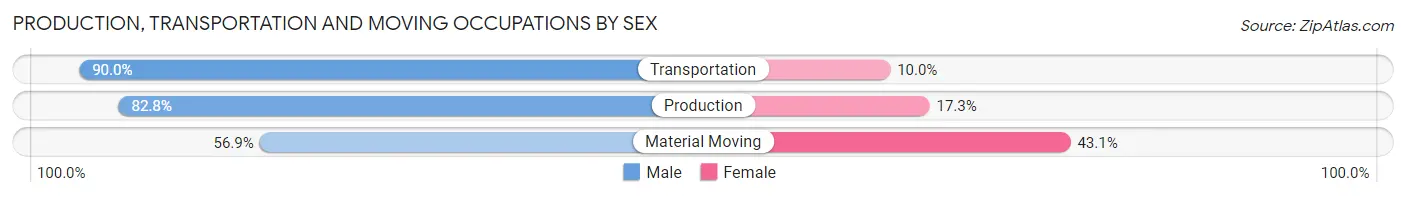
| Occupation | Male | Female |
| Production | 1,017 (82.8%) | 212 (17.2%) |
| Transportation | 1,220 (90.0%) | 136 (10.0%) |
| Material Moving | 417 (56.9%) | 316 (43.1%) |
| Total (Category) | 2,654 (80.0%) | 664 (20.0%) |
| Total (Overall) | 21,899 (51.9%) | 20,315 (48.1%) |
Employment Industries by Sex in Cape May County
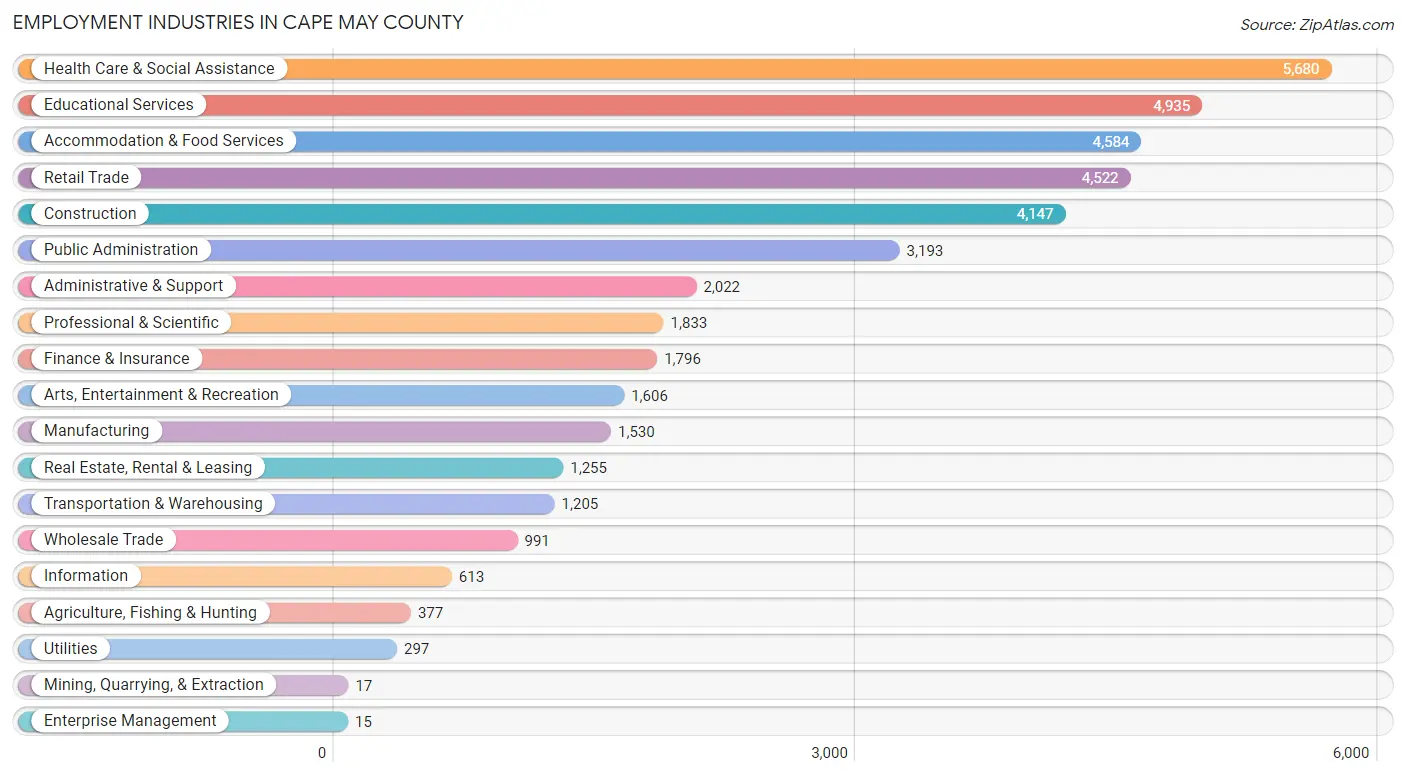
Employment Industries in Cape May County
The major employment industries in Cape May County include Health Care & Social Assistance (5,680 | 13.5%), Educational Services (4,935 | 11.7%), Accommodation & Food Services (4,584 | 10.9%), Retail Trade (4,522 | 10.7%), and Construction (4,147 | 9.8%).
Employment Industries by Sex in Cape May County
The Cape May County industries that see more men than women are Mining, Quarrying, & Extraction (100.0%), Construction (88.8%), and Manufacturing (86.5%), whereas the industries that tend to have a higher number of women are Health Care & Social Assistance (79.0%), Educational Services (73.0%), and Finance & Insurance (50.5%).
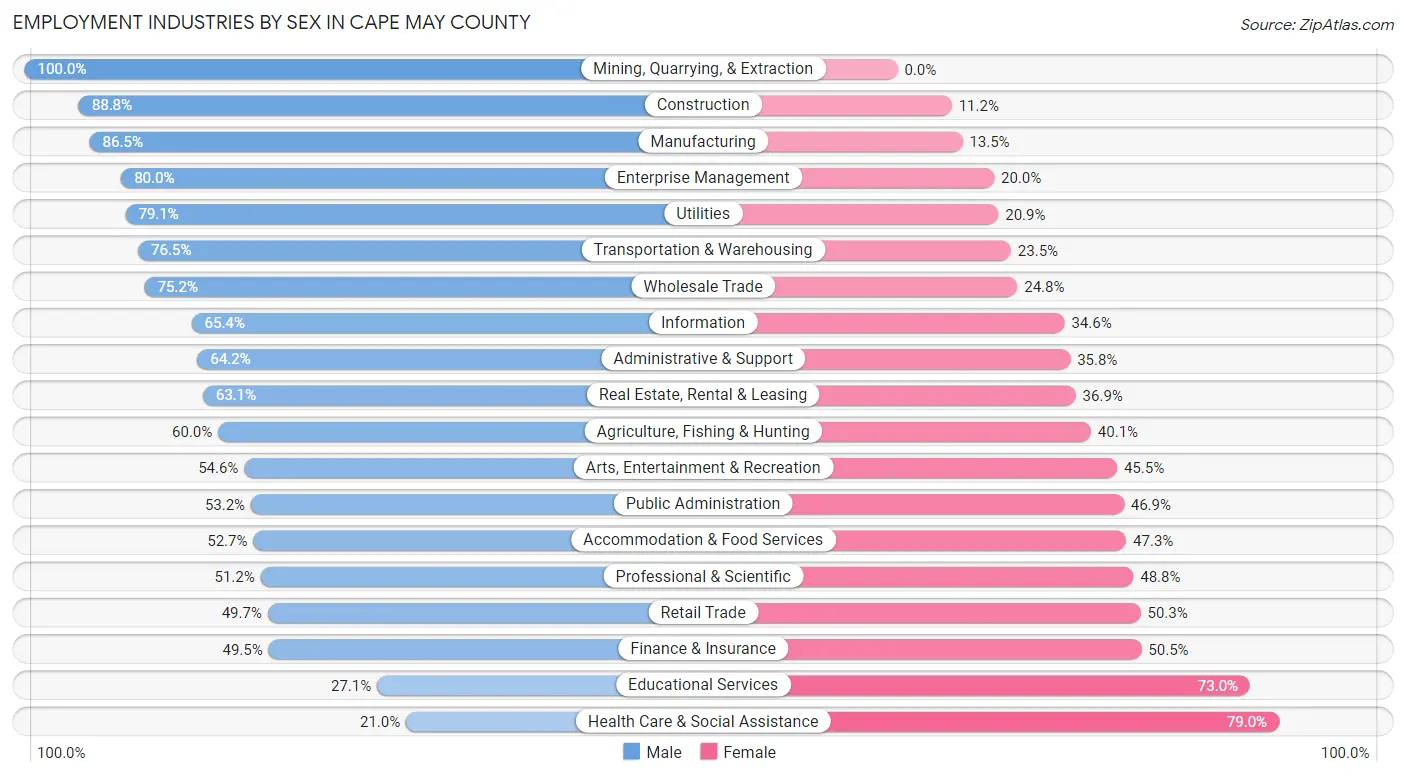
| Industry | Male | Female |
| Agriculture, Fishing & Hunting | 226 (60.0%) | 151 (40.1%) |
| Mining, Quarrying, & Extraction | 17 (100.0%) | 0 (0.0%) |
| Construction | 3,681 (88.8%) | 466 (11.2%) |
| Manufacturing | 1,324 (86.5%) | 206 (13.5%) |
| Wholesale Trade | 745 (75.2%) | 246 (24.8%) |
| Retail Trade | 2,246 (49.7%) | 2,276 (50.3%) |
| Transportation & Warehousing | 922 (76.5%) | 283 (23.5%) |
| Utilities | 235 (79.1%) | 62 (20.9%) |
| Information | 401 (65.4%) | 212 (34.6%) |
| Finance & Insurance | 889 (49.5%) | 907 (50.5%) |
| Real Estate, Rental & Leasing | 792 (63.1%) | 463 (36.9%) |
| Professional & Scientific | 938 (51.2%) | 895 (48.8%) |
| Enterprise Management | 12 (80.0%) | 3 (20.0%) |
| Administrative & Support | 1,299 (64.2%) | 723 (35.8%) |
| Educational Services | 1,335 (27.1%) | 3,600 (73.0%) |
| Health Care & Social Assistance | 1,195 (21.0%) | 4,485 (79.0%) |
| Arts, Entertainment & Recreation | 876 (54.5%) | 730 (45.5%) |
| Accommodation & Food Services | 2,414 (52.7%) | 2,170 (47.3%) |
| Public Administration | 1,697 (53.1%) | 1,496 (46.9%) |
| Total | 21,899 (51.9%) | 20,315 (48.1%) |
Education in Cape May County
School Enrollment in Cape May County
The most common levels of schooling among the 16,968 students in Cape May County are high school (4,000 | 23.6%), middle school (3,929 | 23.2%), and elementary school (3,723 | 21.9%).
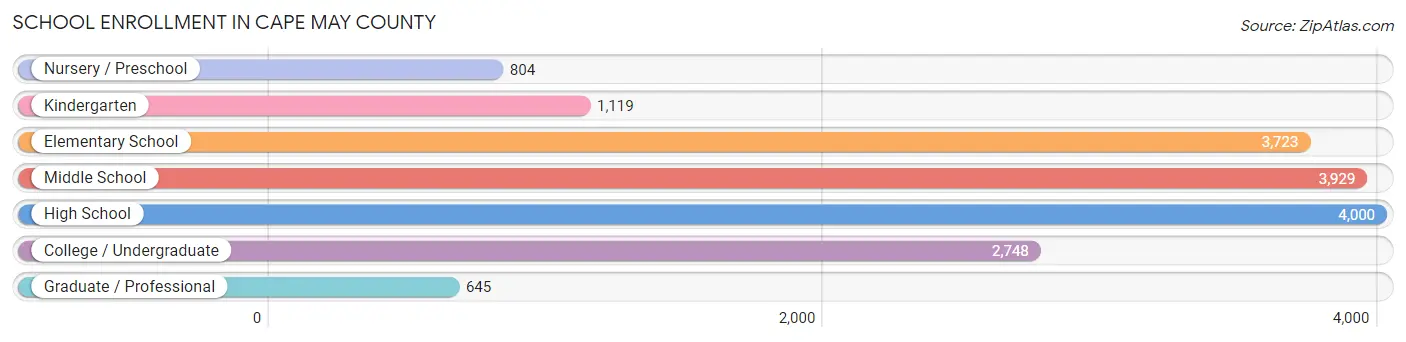
| School Level | # Students | % Students |
| Nursery / Preschool | 804 | 4.7% |
| Kindergarten | 1,119 | 6.6% |
| Elementary School | 3,723 | 21.9% |
| Middle School | 3,929 | 23.2% |
| High School | 4,000 | 23.6% |
| College / Undergraduate | 2,748 | 16.2% |
| Graduate / Professional | 645 | 3.8% |
| Total | 16,968 | 100.0% |
School Enrollment by Age by Funding Source in Cape May County
Out of a total of 16,968 students who are enrolled in schools in Cape May County, 2,426 (14.3%) attend a private institution, while the remaining 14,542 (85.7%) are enrolled in public schools. The age group of 3 to 4 year olds has the highest likelihood of being enrolled in private schools, with 246 (37.7% in the age bracket) enrolled. Conversely, the age group of 10 to 14 year olds has the lowest likelihood of being enrolled in a private school, with 4,563 (93.7% in the age bracket) attending a public institution.
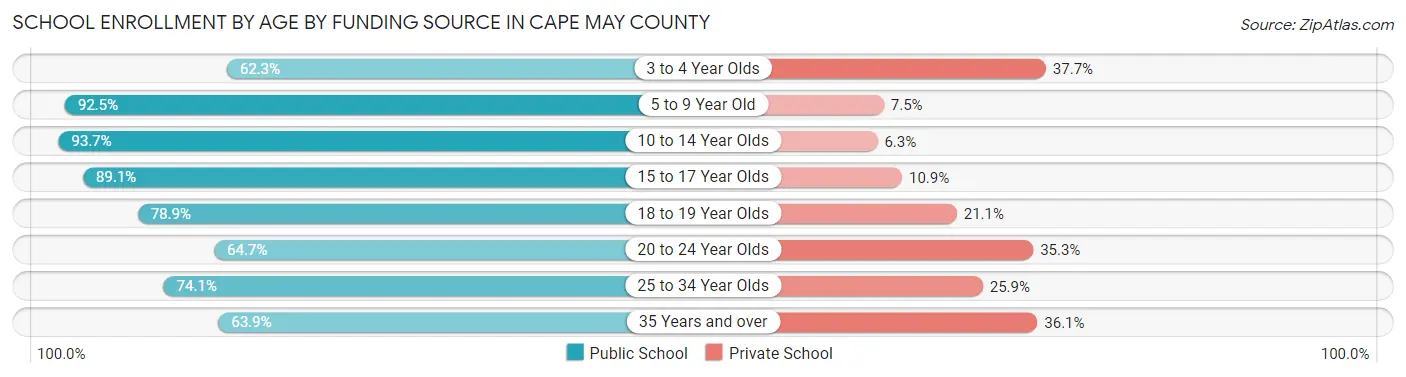
| Age Bracket | Public School | Private School |
| 3 to 4 Year Olds | 407 (62.3%) | 246 (37.7%) |
| 5 to 9 Year Old | 4,128 (92.5%) | 334 (7.5%) |
| 10 to 14 Year Olds | 4,563 (93.7%) | 307 (6.3%) |
| 15 to 17 Year Olds | 2,658 (89.1%) | 324 (10.9%) |
| 18 to 19 Year Olds | 948 (78.9%) | 253 (21.1%) |
| 20 to 24 Year Olds | 953 (64.7%) | 520 (35.3%) |
| 25 to 34 Year Olds | 326 (74.1%) | 114 (25.9%) |
| 35 Years and over | 567 (63.9%) | 320 (36.1%) |
| Total | 14,542 (85.7%) | 2,426 (14.3%) |
Educational Attainment by Field of Study in Cape May County
Business (5,583 | 20.1%), education (4,716 | 17.0%), science & technology (2,886 | 10.4%), social sciences (2,469 | 8.9%), and arts & humanities (1,753 | 6.3%) are the most common fields of study among 27,732 individuals in Cape May County who have obtained a bachelor's degree or higher.
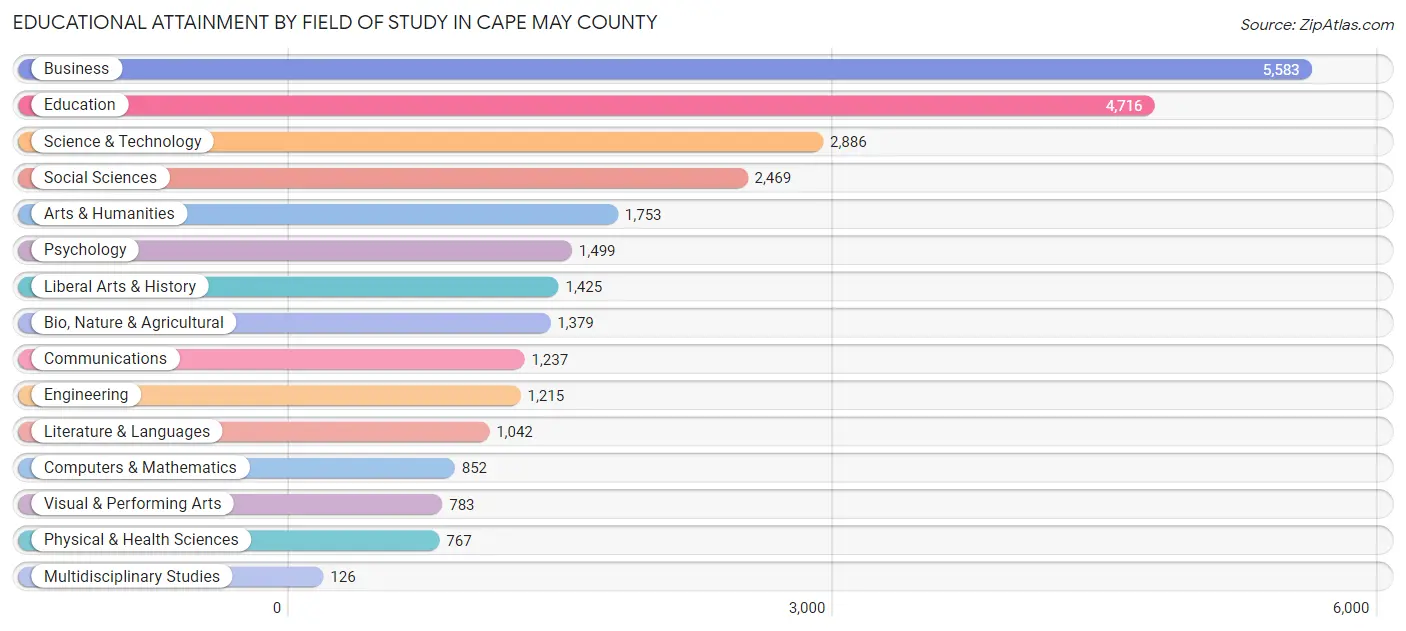
| Field of Study | # Graduates | % Graduates |
| Computers & Mathematics | 852 | 3.1% |
| Bio, Nature & Agricultural | 1,379 | 5.0% |
| Physical & Health Sciences | 767 | 2.8% |
| Psychology | 1,499 | 5.4% |
| Social Sciences | 2,469 | 8.9% |
| Engineering | 1,215 | 4.4% |
| Multidisciplinary Studies | 126 | 0.4% |
| Science & Technology | 2,886 | 10.4% |
| Business | 5,583 | 20.1% |
| Education | 4,716 | 17.0% |
| Literature & Languages | 1,042 | 3.8% |
| Liberal Arts & History | 1,425 | 5.1% |
| Visual & Performing Arts | 783 | 2.8% |
| Communications | 1,237 | 4.5% |
| Arts & Humanities | 1,753 | 6.3% |
| Total | 27,732 | 100.0% |
Transportation & Commute in Cape May County
Vehicle Availability by Sex in Cape May County
The most prevalent vehicle ownership categories in Cape May County are males with 2 vehicles (9,922, accounting for 45.4%) and females with 2 vehicles (9,413, making up 49.6%).
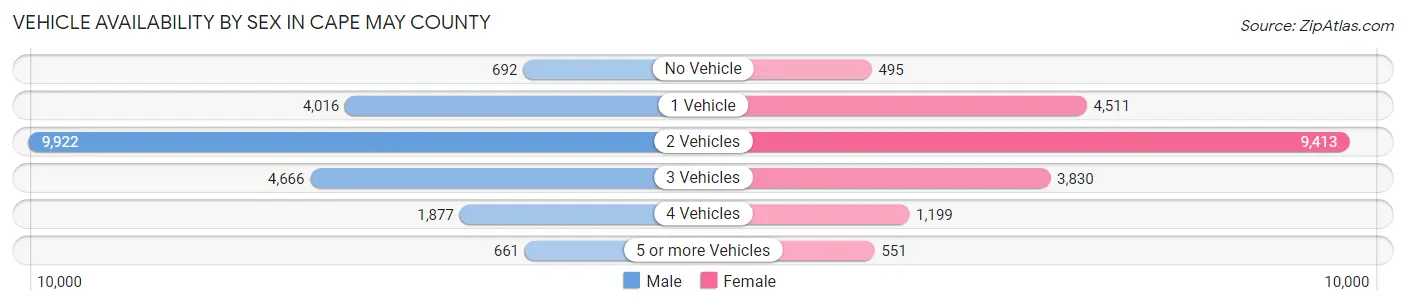
| Vehicles Available | Male | Female |
| No Vehicle | 692 (3.2%) | 495 (2.5%) |
| 1 Vehicle | 4,016 (18.4%) | 4,511 (22.6%) |
| 2 Vehicles | 9,922 (45.4%) | 9,413 (47.1%) |
| 3 Vehicles | 4,666 (21.4%) | 3,830 (19.2%) |
| 4 Vehicles | 1,877 (8.6%) | 1,199 (6.0%) |
| 5 or more Vehicles | 661 (3.0%) | 551 (2.8%) |
| Total | 21,834 (100.0%) | 19,999 (100.0%) |
Commute Time in Cape May County
The most frequently occuring commute durations in Cape May County are 15 to 19 minutes (7,092 commuters, 18.2%), 10 to 14 minutes (6,756 commuters, 17.3%), and 5 to 9 minutes (5,696 commuters, 14.6%).
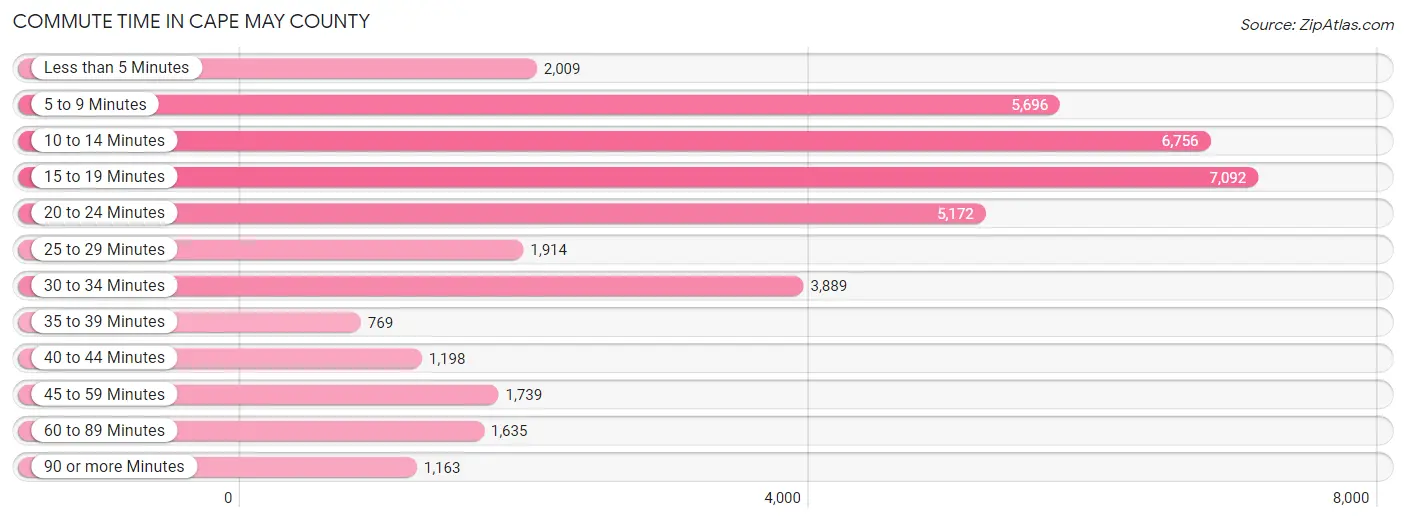
| Commute Time | # Commuters | % Commuters |
| Less than 5 Minutes | 2,009 | 5.1% |
| 5 to 9 Minutes | 5,696 | 14.6% |
| 10 to 14 Minutes | 6,756 | 17.3% |
| 15 to 19 Minutes | 7,092 | 18.2% |
| 20 to 24 Minutes | 5,172 | 13.3% |
| 25 to 29 Minutes | 1,914 | 4.9% |
| 30 to 34 Minutes | 3,889 | 10.0% |
| 35 to 39 Minutes | 769 | 2.0% |
| 40 to 44 Minutes | 1,198 | 3.1% |
| 45 to 59 Minutes | 1,739 | 4.5% |
| 60 to 89 Minutes | 1,635 | 4.2% |
| 90 or more Minutes | 1,163 | 3.0% |
Commute Time by Sex in Cape May County
The most common commute times in Cape May County are 15 to 19 minutes (3,822 commuters, 18.5%) for males and 15 to 19 minutes (3,270 commuters, 17.8%) for females.

| Commute Time | Male | Female |
| Less than 5 Minutes | 1,243 (6.0%) | 766 (4.2%) |
| 5 to 9 Minutes | 2,570 (12.4%) | 3,126 (17.0%) |
| 10 to 14 Minutes | 3,562 (17.2%) | 3,194 (17.4%) |
| 15 to 19 Minutes | 3,822 (18.5%) | 3,270 (17.8%) |
| 20 to 24 Minutes | 2,604 (12.6%) | 2,568 (14.0%) |
| 25 to 29 Minutes | 1,003 (4.9%) | 911 (5.0%) |
| 30 to 34 Minutes | 2,050 (9.9%) | 1,839 (10.0%) |
| 35 to 39 Minutes | 448 (2.2%) | 321 (1.8%) |
| 40 to 44 Minutes | 596 (2.9%) | 602 (3.3%) |
| 45 to 59 Minutes | 1,044 (5.1%) | 695 (3.8%) |
| 60 to 89 Minutes | 1,003 (4.9%) | 632 (3.4%) |
| 90 or more Minutes | 700 (3.4%) | 463 (2.5%) |
Time of Departure to Work by Sex in Cape May County
The most frequent times of departure to work in Cape May County are 8:00 AM to 8:29 AM (2,824, 13.7%) for males and 8:00 AM to 8:29 AM (3,130, 17.0%) for females.
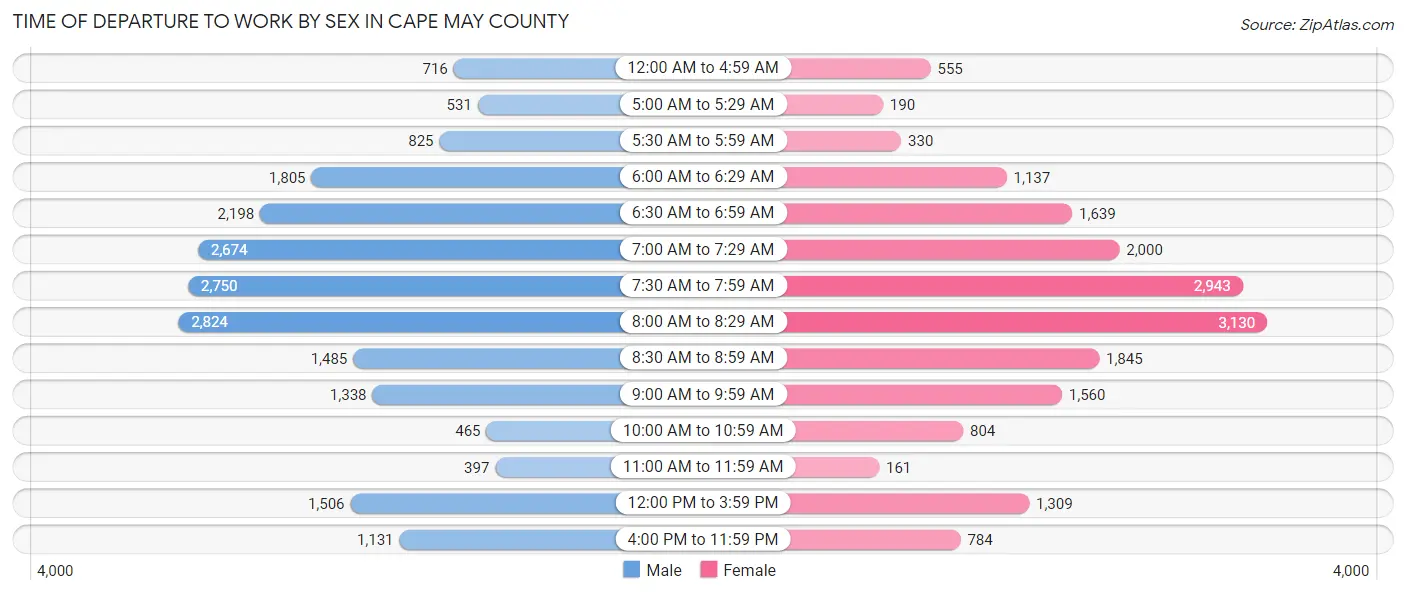
| Time of Departure | Male | Female |
| 12:00 AM to 4:59 AM | 716 (3.5%) | 555 (3.0%) |
| 5:00 AM to 5:29 AM | 531 (2.6%) | 190 (1.0%) |
| 5:30 AM to 5:59 AM | 825 (4.0%) | 330 (1.8%) |
| 6:00 AM to 6:29 AM | 1,805 (8.7%) | 1,137 (6.2%) |
| 6:30 AM to 6:59 AM | 2,198 (10.6%) | 1,639 (8.9%) |
| 7:00 AM to 7:29 AM | 2,674 (13.0%) | 2,000 (10.9%) |
| 7:30 AM to 7:59 AM | 2,750 (13.3%) | 2,943 (16.0%) |
| 8:00 AM to 8:29 AM | 2,824 (13.7%) | 3,130 (17.0%) |
| 8:30 AM to 8:59 AM | 1,485 (7.2%) | 1,845 (10.0%) |
| 9:00 AM to 9:59 AM | 1,338 (6.5%) | 1,560 (8.5%) |
| 10:00 AM to 10:59 AM | 465 (2.2%) | 804 (4.4%) |
| 11:00 AM to 11:59 AM | 397 (1.9%) | 161 (0.9%) |
| 12:00 PM to 3:59 PM | 1,506 (7.3%) | 1,309 (7.1%) |
| 4:00 PM to 11:59 PM | 1,131 (5.5%) | 784 (4.3%) |
| Total | 20,645 (100.0%) | 18,387 (100.0%) |
Housing Occupancy in Cape May County
Occupancy by Ownership in Cape May County
Of the total 43,277 dwellings in Cape May County, owner-occupied units account for 33,950 (78.4%), while renter-occupied units make up 9,327 (21.5%).
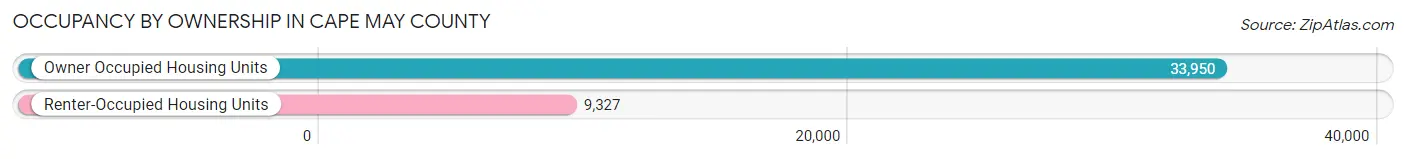
| Occupancy | # Housing Units | % Housing Units |
| Owner Occupied Housing Units | 33,950 | 78.4% |
| Renter-Occupied Housing Units | 9,327 | 21.5% |
| Total Occupied Housing Units | 43,277 | 100.0% |
Occupancy by Household Size in Cape May County
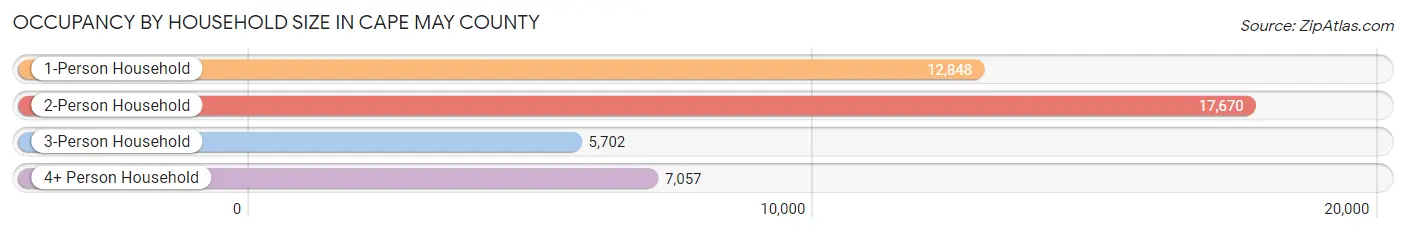
| Household Size | # Housing Units | % Housing Units |
| 1-Person Household | 12,848 | 29.7% |
| 2-Person Household | 17,670 | 40.8% |
| 3-Person Household | 5,702 | 13.2% |
| 4+ Person Household | 7,057 | 16.3% |
| Total Housing Units | 43,277 | 100.0% |
Occupancy by Ownership by Household Size in Cape May County
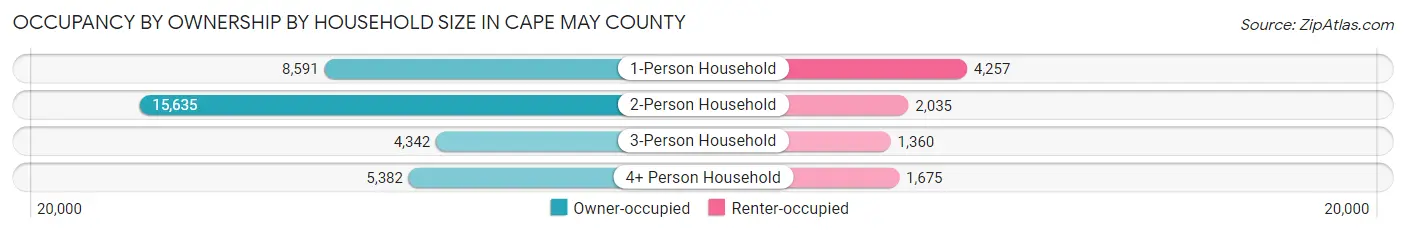
| Household Size | Owner-occupied | Renter-occupied |
| 1-Person Household | 8,591 (66.9%) | 4,257 (33.1%) |
| 2-Person Household | 15,635 (88.5%) | 2,035 (11.5%) |
| 3-Person Household | 4,342 (76.1%) | 1,360 (23.8%) |
| 4+ Person Household | 5,382 (76.3%) | 1,675 (23.7%) |
| Total Housing Units | 33,950 (78.4%) | 9,327 (21.5%) |
Occupancy by Educational Attainment in Cape May County
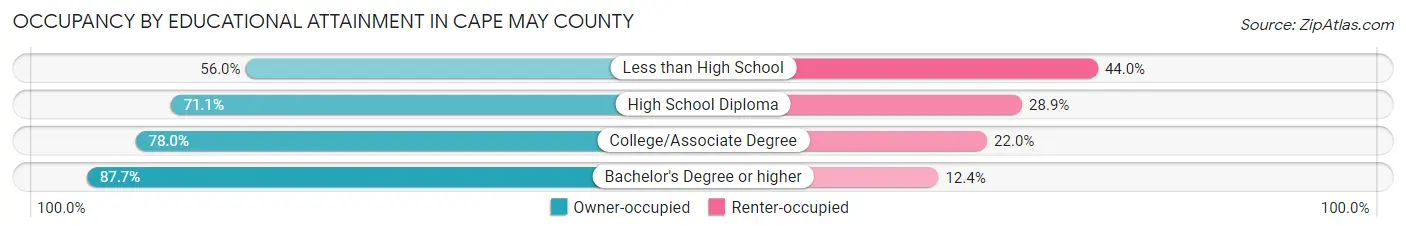
| Household Size | Owner-occupied | Renter-occupied |
| Less than High School | 1,222 (56.0%) | 959 (44.0%) |
| High School Diploma | 9,091 (71.1%) | 3,702 (28.9%) |
| College/Associate Degree | 9,452 (78.0%) | 2,667 (22.0%) |
| Bachelor's Degree or higher | 14,185 (87.6%) | 1,999 (12.3%) |
Occupancy by Age of Householder in Cape May County
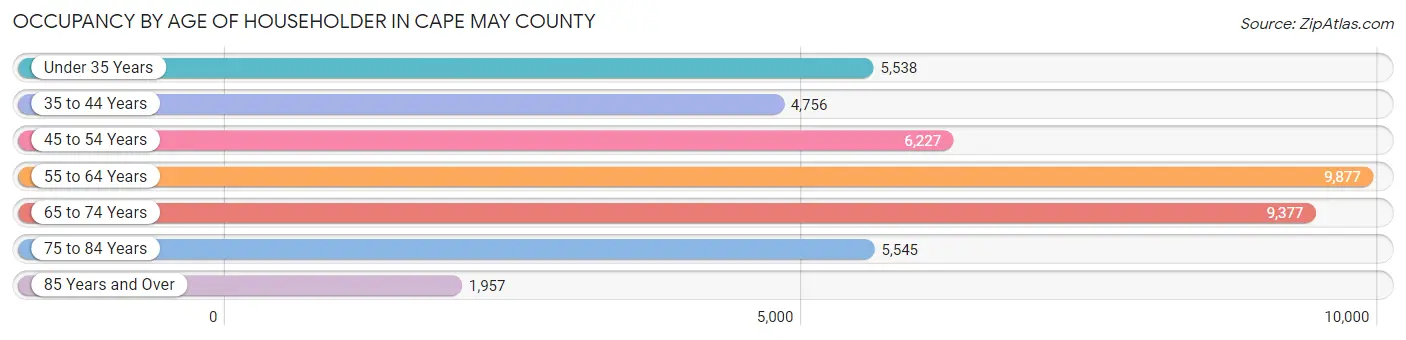
| Age Bracket | # Households | % Households |
| Under 35 Years | 5,538 | 12.8% |
| 35 to 44 Years | 4,756 | 11.0% |
| 45 to 54 Years | 6,227 | 14.4% |
| 55 to 64 Years | 9,877 | 22.8% |
| 65 to 74 Years | 9,377 | 21.7% |
| 75 to 84 Years | 5,545 | 12.8% |
| 85 Years and Over | 1,957 | 4.5% |
| Total | 43,277 | 100.0% |
Housing Finances in Cape May County
Median Income by Occupancy in Cape May County
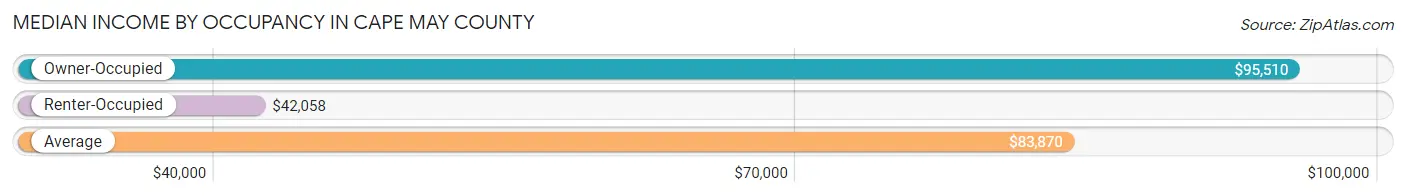
| Occupancy Type | # Households | Median Income |
| Owner-Occupied | 33,950 (78.4%) | $95,510 |
| Renter-Occupied | 9,327 (21.5%) | $42,058 |
| Average | 43,277 (100.0%) | $83,870 |
Occupancy by Householder Income Bracket in Cape May County
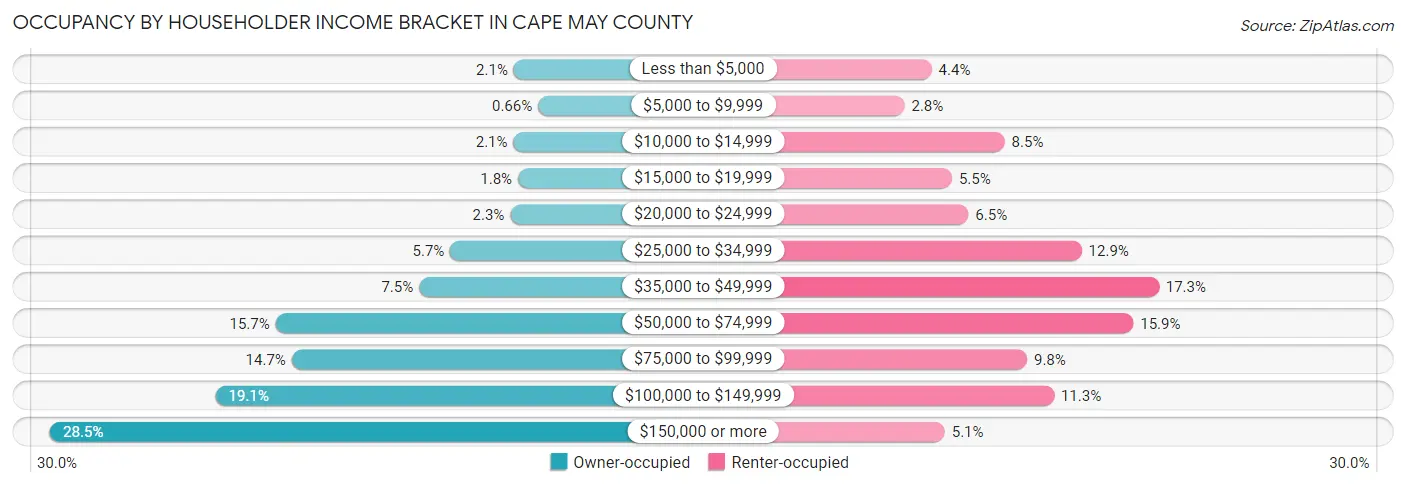
| Income Bracket | Owner-occupied | Renter-occupied |
| Less than $5,000 | 696 (2.1%) | 406 (4.3%) |
| $5,000 to $9,999 | 225 (0.7%) | 261 (2.8%) |
| $10,000 to $14,999 | 704 (2.1%) | 795 (8.5%) |
| $15,000 to $19,999 | 616 (1.8%) | 514 (5.5%) |
| $20,000 to $24,999 | 763 (2.2%) | 602 (6.5%) |
| $25,000 to $34,999 | 1,927 (5.7%) | 1,205 (12.9%) |
| $35,000 to $49,999 | 2,532 (7.5%) | 1,616 (17.3%) |
| $50,000 to $74,999 | 5,315 (15.7%) | 1,480 (15.9%) |
| $75,000 to $99,999 | 5,003 (14.7%) | 914 (9.8%) |
| $100,000 to $149,999 | 6,480 (19.1%) | 1,058 (11.3%) |
| $150,000 or more | 9,689 (28.5%) | 476 (5.1%) |
| Total | 33,950 (100.0%) | 9,327 (100.0%) |
Monthly Housing Cost Tiers in Cape May County
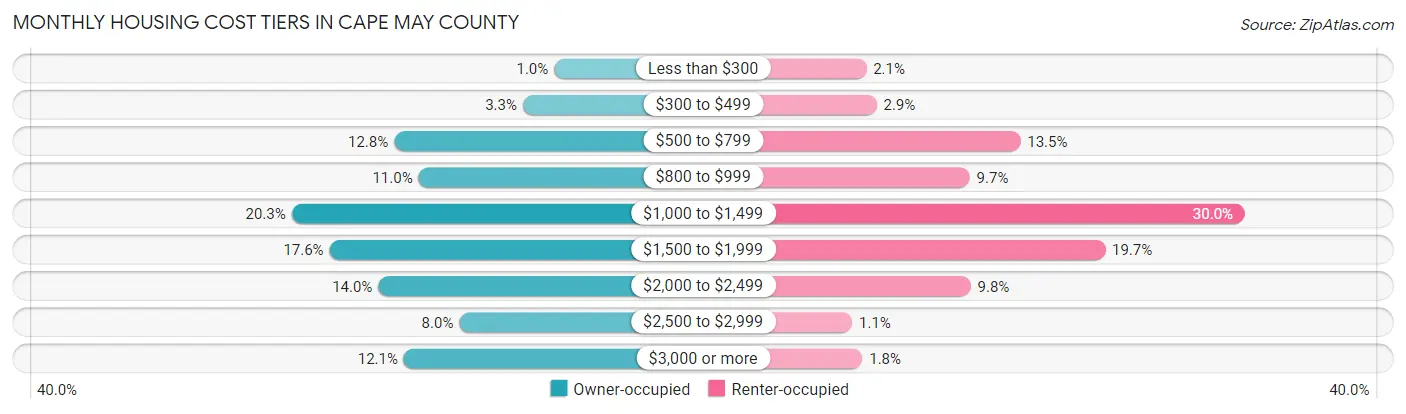
| Monthly Cost | Owner-occupied | Renter-occupied |
| Less than $300 | 341 (1.0%) | 198 (2.1%) |
| $300 to $499 | 1,125 (3.3%) | 269 (2.9%) |
| $500 to $799 | 4,343 (12.8%) | 1,256 (13.5%) |
| $800 to $999 | 3,731 (11.0%) | 908 (9.7%) |
| $1,000 to $1,499 | 6,905 (20.3%) | 2,799 (30.0%) |
| $1,500 to $1,999 | 5,957 (17.5%) | 1,838 (19.7%) |
| $2,000 to $2,499 | 4,740 (14.0%) | 915 (9.8%) |
| $2,500 to $2,999 | 2,711 (8.0%) | 101 (1.1%) |
| $3,000 or more | 4,097 (12.1%) | 171 (1.8%) |
| Total | 33,950 (100.0%) | 9,327 (100.0%) |
Physical Housing Characteristics in Cape May County
Housing Structures in Cape May County
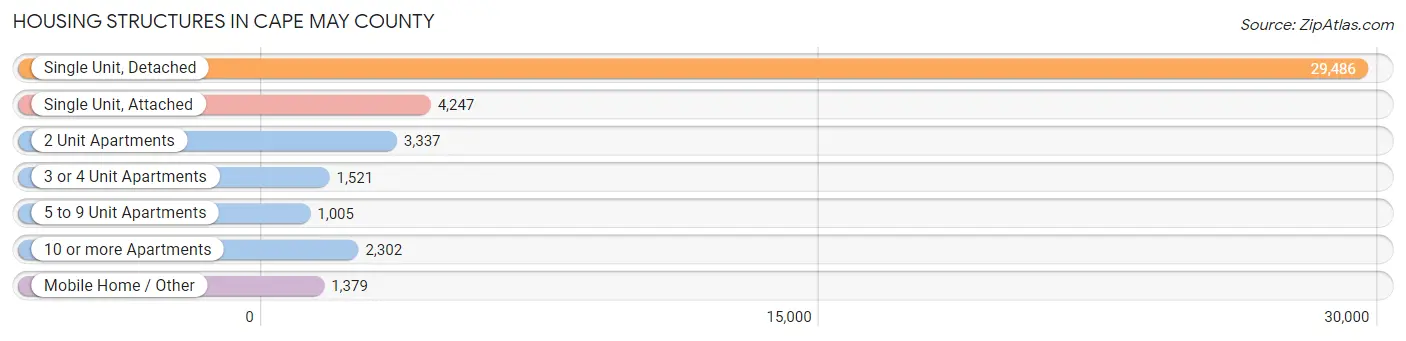
| Structure Type | # Housing Units | % Housing Units |
| Single Unit, Detached | 29,486 | 68.1% |
| Single Unit, Attached | 4,247 | 9.8% |
| 2 Unit Apartments | 3,337 | 7.7% |
| 3 or 4 Unit Apartments | 1,521 | 3.5% |
| 5 to 9 Unit Apartments | 1,005 | 2.3% |
| 10 or more Apartments | 2,302 | 5.3% |
| Mobile Home / Other | 1,379 | 3.2% |
| Total | 43,277 | 100.0% |
Housing Structures by Occupancy in Cape May County
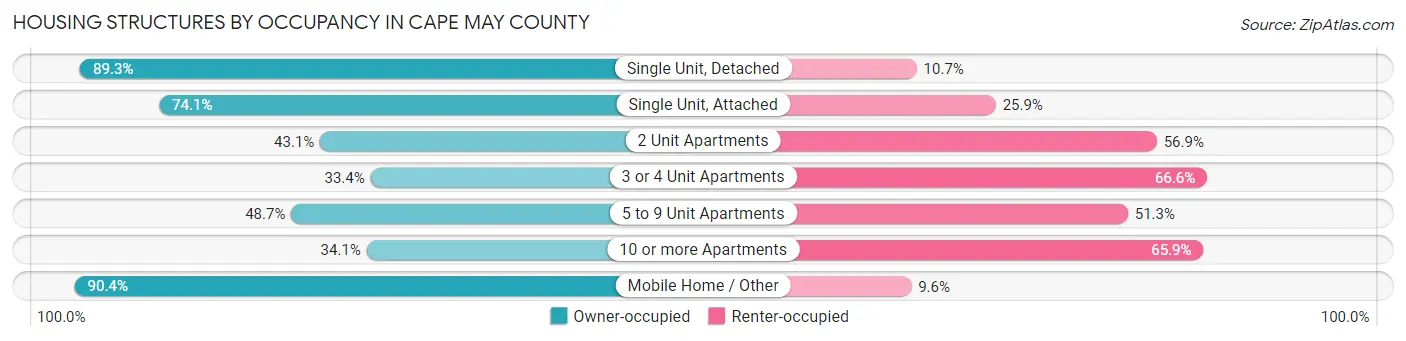
| Structure Type | Owner-occupied | Renter-occupied |
| Single Unit, Detached | 26,336 (89.3%) | 3,150 (10.7%) |
| Single Unit, Attached | 3,147 (74.1%) | 1,100 (25.9%) |
| 2 Unit Apartments | 1,438 (43.1%) | 1,899 (56.9%) |
| 3 or 4 Unit Apartments | 508 (33.4%) | 1,013 (66.6%) |
| 5 to 9 Unit Apartments | 489 (48.7%) | 516 (51.3%) |
| 10 or more Apartments | 786 (34.1%) | 1,516 (65.9%) |
| Mobile Home / Other | 1,246 (90.4%) | 133 (9.6%) |
| Total | 33,950 (78.4%) | 9,327 (21.5%) |
Housing Structures by Number of Rooms in Cape May County
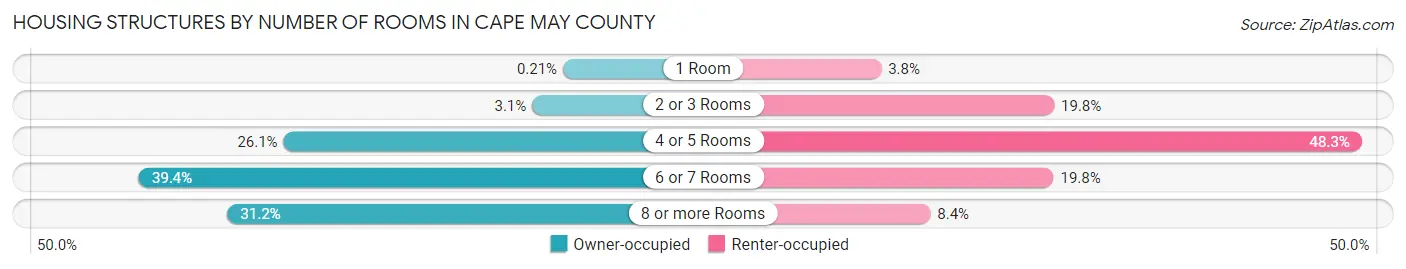
| Number of Rooms | Owner-occupied | Renter-occupied |
| 1 Room | 70 (0.2%) | 356 (3.8%) |
| 2 or 3 Rooms | 1,038 (3.1%) | 1,848 (19.8%) |
| 4 or 5 Rooms | 8,849 (26.1%) | 4,500 (48.2%) |
| 6 or 7 Rooms | 13,386 (39.4%) | 1,843 (19.8%) |
| 8 or more Rooms | 10,607 (31.2%) | 780 (8.4%) |
| Total | 33,950 (100.0%) | 9,327 (100.0%) |
Housing Structure by Heating Type in Cape May County
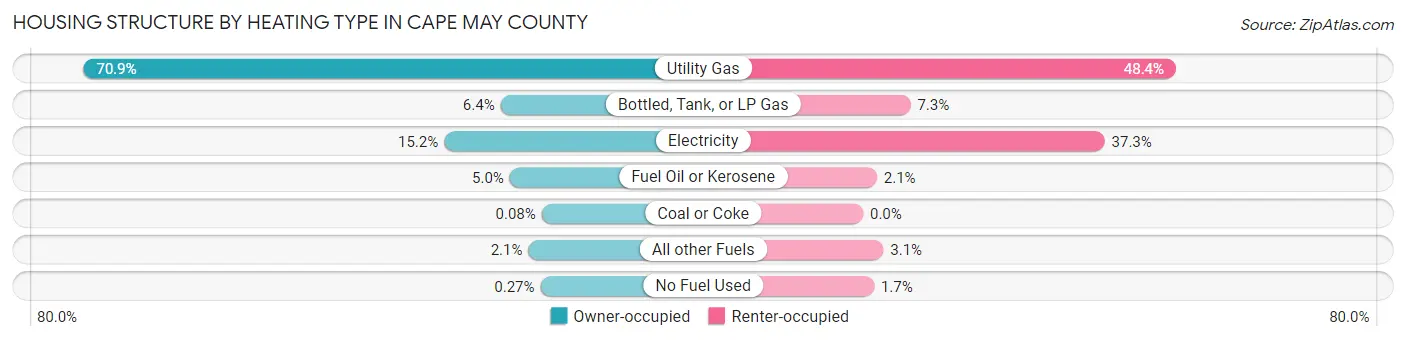
| Heating Type | Owner-occupied | Renter-occupied |
| Utility Gas | 24,077 (70.9%) | 4,510 (48.3%) |
| Bottled, Tank, or LP Gas | 2,184 (6.4%) | 684 (7.3%) |
| Electricity | 5,148 (15.2%) | 3,483 (37.3%) |
| Fuel Oil or Kerosene | 1,701 (5.0%) | 199 (2.1%) |
| Coal or Coke | 27 (0.1%) | 0 (0.0%) |
| All other Fuels | 723 (2.1%) | 293 (3.1%) |
| No Fuel Used | 90 (0.3%) | 158 (1.7%) |
| Total | 33,950 (100.0%) | 9,327 (100.0%) |
Household Vehicle Usage in Cape May County
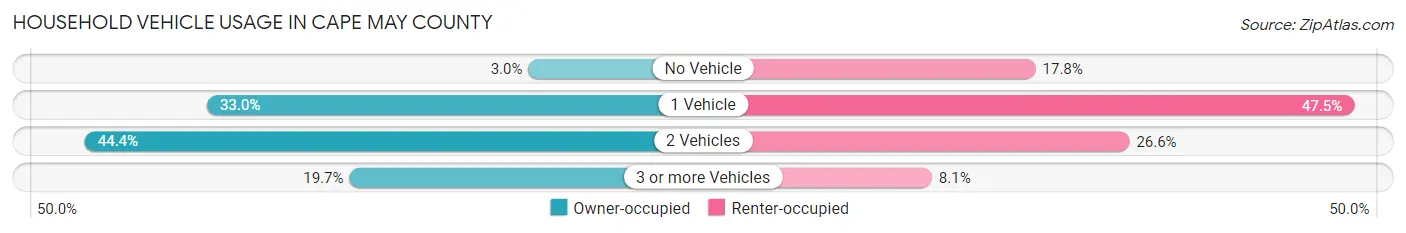
| Vehicles per Household | Owner-occupied | Renter-occupied |
| No Vehicle | 1,011 (3.0%) | 1,660 (17.8%) |
| 1 Vehicle | 11,192 (33.0%) | 4,433 (47.5%) |
| 2 Vehicles | 15,062 (44.4%) | 2,477 (26.6%) |
| 3 or more Vehicles | 6,685 (19.7%) | 757 (8.1%) |
| Total | 33,950 (100.0%) | 9,327 (100.0%) |
Real Estate & Mortgages in Cape May County
Real Estate and Mortgage Overview in Cape May County
| Characteristic | Without Mortgage | With Mortgage |
| Housing Units | 13,780 | 20,170 |
| Median Property Value | $390,000 | $362,000 |
| Median Household Income | $76,440 | $6,842 |
| Monthly Housing Costs | $895 | $3,972 |
| Real Estate Taxes | $5,080 | $373 |
Property Value by Mortgage Status in Cape May County
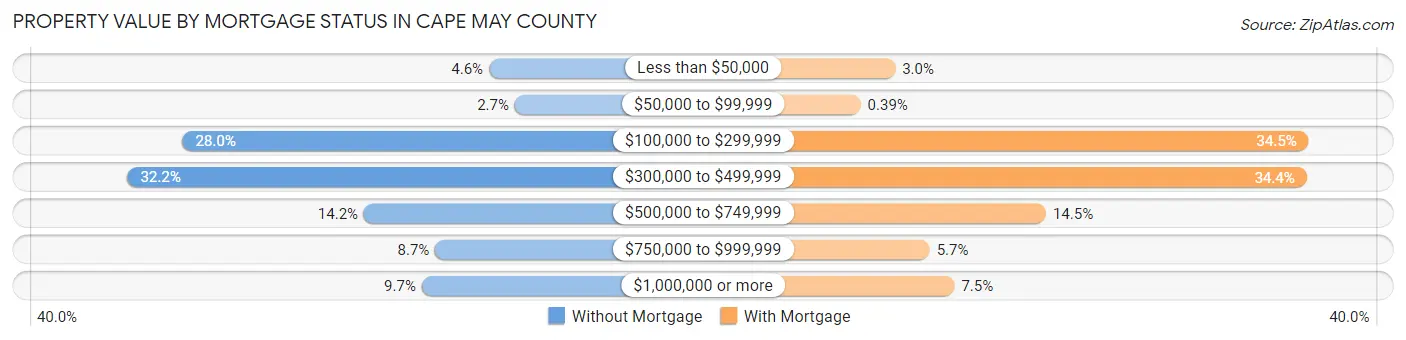
| Property Value | Without Mortgage | With Mortgage |
| Less than $50,000 | 637 (4.6%) | 610 (3.0%) |
| $50,000 to $99,999 | 365 (2.6%) | 79 (0.4%) |
| $100,000 to $299,999 | 3,854 (28.0%) | 6,962 (34.5%) |
| $300,000 to $499,999 | 4,431 (32.2%) | 6,933 (34.4%) |
| $500,000 to $749,999 | 1,950 (14.1%) | 2,926 (14.5%) |
| $750,000 to $999,999 | 1,201 (8.7%) | 1,140 (5.7%) |
| $1,000,000 or more | 1,342 (9.7%) | 1,520 (7.5%) |
| Total | 13,780 (100.0%) | 20,170 (100.0%) |
Household Income by Mortgage Status in Cape May County
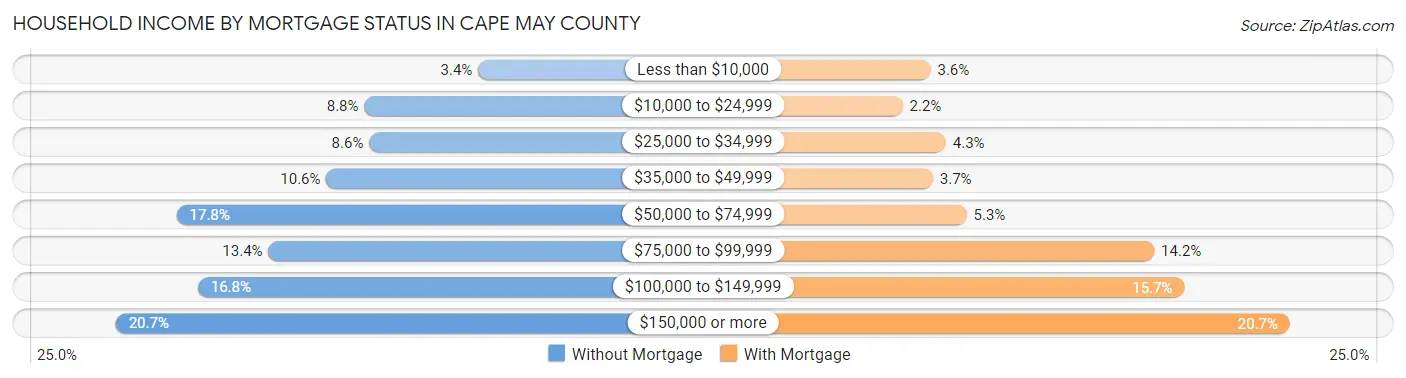
| Household Income | Without Mortgage | With Mortgage |
| Less than $10,000 | 469 (3.4%) | 720 (3.6%) |
| $10,000 to $24,999 | 1,215 (8.8%) | 452 (2.2%) |
| $25,000 to $34,999 | 1,184 (8.6%) | 868 (4.3%) |
| $35,000 to $49,999 | 1,465 (10.6%) | 743 (3.7%) |
| $50,000 to $74,999 | 2,447 (17.8%) | 1,067 (5.3%) |
| $75,000 to $99,999 | 1,845 (13.4%) | 2,868 (14.2%) |
| $100,000 to $149,999 | 2,308 (16.8%) | 3,158 (15.7%) |
| $150,000 or more | 2,847 (20.7%) | 4,172 (20.7%) |
| Total | 13,780 (100.0%) | 20,170 (100.0%) |
Property Value to Household Income Ratio in Cape May County
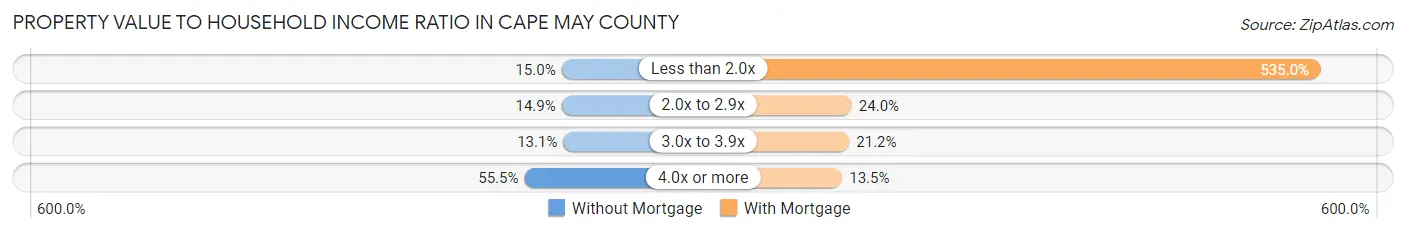
| Value-to-Income Ratio | Without Mortgage | With Mortgage |
| Less than 2.0x | 2,066 (15.0%) | 107,902 (535.0%) |
| 2.0x to 2.9x | 2,049 (14.9%) | 4,835 (24.0%) |
| 3.0x to 3.9x | 1,799 (13.1%) | 4,267 (21.2%) |
| 4.0x or more | 7,654 (55.5%) | 2,716 (13.5%) |
| Total | 13,780 (100.0%) | 20,170 (100.0%) |
Real Estate Taxes by Mortgage Status in Cape May County
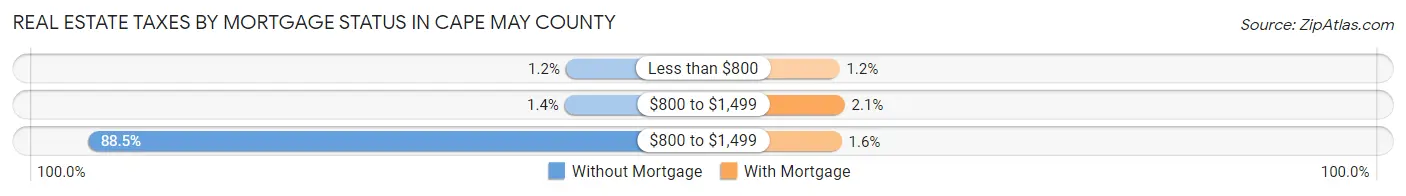
| Property Taxes | Without Mortgage | With Mortgage |
| Less than $800 | 160 (1.2%) | 239 (1.2%) |
| $800 to $1,499 | 187 (1.4%) | 425 (2.1%) |
| $800 to $1,499 | 12,191 (88.5%) | 314 (1.6%) |
| Total | 13,780 (100.0%) | 20,170 (100.0%) |
Health & Disability in Cape May County
Health Insurance Coverage by Age in Cape May County
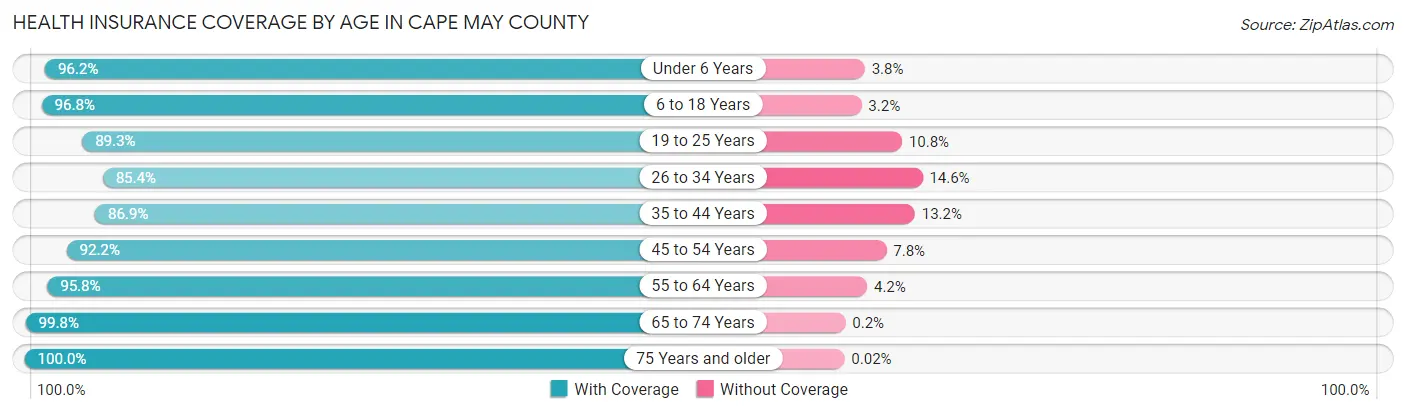
| Age Bracket | With Coverage | Without Coverage |
| Under 6 Years | 4,717 (96.2%) | 187 (3.8%) |
| 6 to 18 Years | 12,233 (96.8%) | 403 (3.2%) |
| 19 to 25 Years | 5,097 (89.2%) | 614 (10.7%) |
| 26 to 34 Years | 7,563 (85.4%) | 1,290 (14.6%) |
| 35 to 44 Years | 7,730 (86.9%) | 1,170 (13.2%) |
| 45 to 54 Years | 10,008 (92.2%) | 851 (7.8%) |
| 55 to 64 Years | 15,384 (95.8%) | 681 (4.2%) |
| 65 to 74 Years | 15,239 (99.8%) | 31 (0.2%) |
| 75 Years and older | 10,527 (100.0%) | 2 (0.0%) |
| Total | 88,498 (94.4%) | 5,229 (5.6%) |
Health Insurance Coverage by Citizenship Status in Cape May County
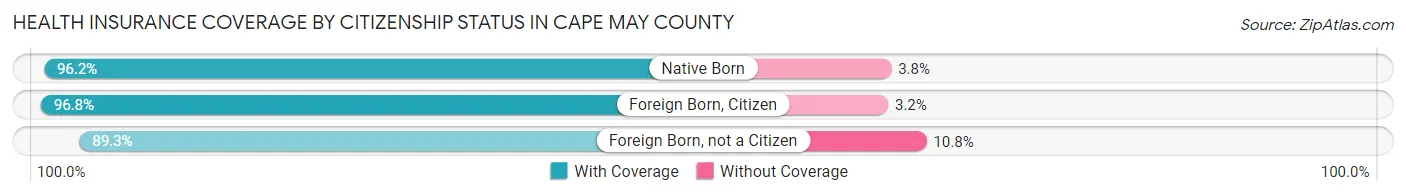
| Citizenship Status | With Coverage | Without Coverage |
| Native Born | 4,717 (96.2%) | 187 (3.8%) |
| Foreign Born, Citizen | 12,233 (96.8%) | 403 (3.2%) |
| Foreign Born, not a Citizen | 5,097 (89.2%) | 614 (10.7%) |
Health Insurance Coverage by Household Income in Cape May County
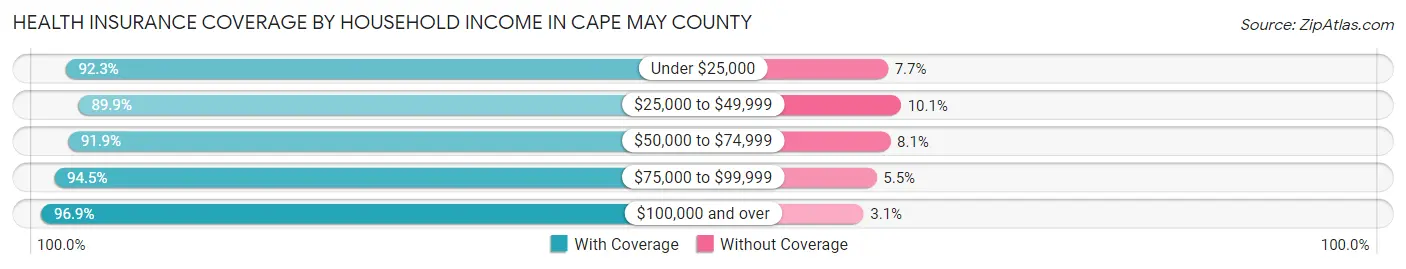
| Household Income | With Coverage | Without Coverage |
| Under $25,000 | 7,484 (92.3%) | 621 (7.7%) |
| $25,000 to $49,999 | 11,823 (89.9%) | 1,328 (10.1%) |
| $50,000 to $74,999 | 12,804 (91.9%) | 1,130 (8.1%) |
| $75,000 to $99,999 | 12,410 (94.5%) | 728 (5.5%) |
| $100,000 and over | 43,385 (96.9%) | 1,390 (3.1%) |
Public vs Private Health Insurance Coverage by Age in Cape May County

| Age Bracket | Public Insurance | Private Insurance |
| Under 6 | 1,458 (29.7%) | 3,387 (69.1%) |
| 6 to 18 Years | 4,279 (33.9%) | 8,641 (68.4%) |
| 19 to 25 Years | 1,362 (23.8%) | 3,925 (68.7%) |
| 25 to 34 Years | 1,732 (19.6%) | 5,980 (67.5%) |
| 35 to 44 Years | 1,487 (16.7%) | 6,415 (72.1%) |
| 45 to 54 Years | 1,412 (13.0%) | 9,148 (84.2%) |
| 55 to 64 Years | 3,150 (19.6%) | 13,449 (83.7%) |
| 65 to 74 Years | 14,803 (96.9%) | 9,976 (65.3%) |
| 75 Years and over | 10,480 (99.5%) | 7,953 (75.5%) |
| Total | 40,163 (42.8%) | 68,874 (73.5%) |
Disability Status by Sex by Age in Cape May County
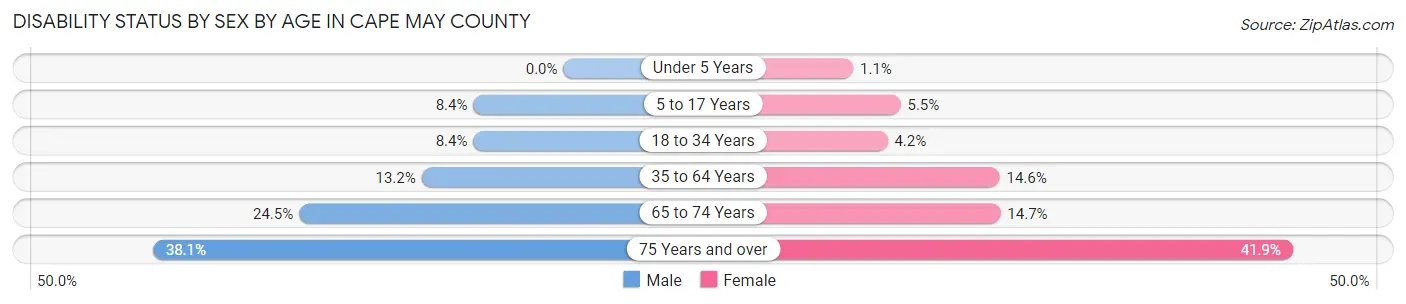
| Age Bracket | Male | Female |
| Under 5 Years | 0 (0.0%) | 23 (1.1%) |
| 5 to 17 Years | 529 (8.4%) | 340 (5.4%) |
| 18 to 34 Years | 655 (8.4%) | 322 (4.2%) |
| 35 to 64 Years | 2,291 (13.2%) | 2,695 (14.6%) |
| 65 to 74 Years | 1,778 (24.5%) | 1,181 (14.7%) |
| 75 Years and over | 1,741 (38.1%) | 2,494 (41.8%) |
Disability Class by Sex by Age in Cape May County
Disability Class: Hearing Difficulty
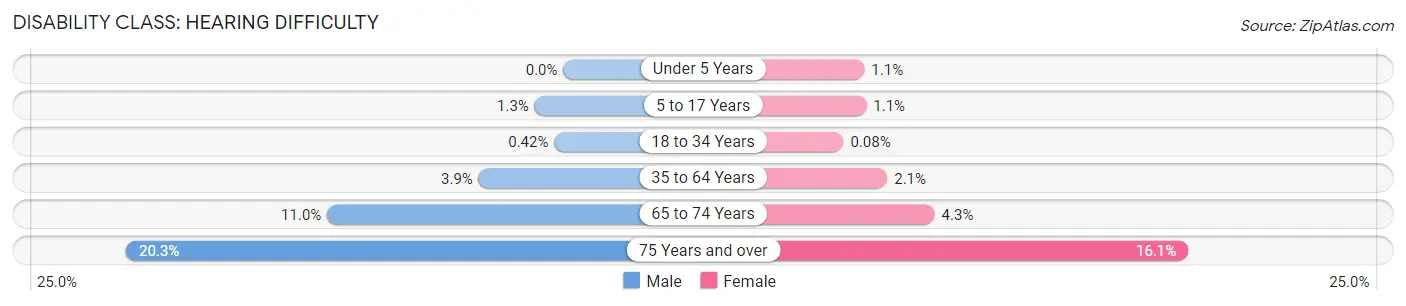
| Age Bracket | Male | Female |
| Under 5 Years | 0 (0.0%) | 23 (1.1%) |
| 5 to 17 Years | 84 (1.3%) | 71 (1.1%) |
| 18 to 34 Years | 33 (0.4%) | 6 (0.1%) |
| 35 to 64 Years | 685 (3.9%) | 388 (2.1%) |
| 65 to 74 Years | 794 (11.0%) | 346 (4.3%) |
| 75 Years and over | 927 (20.3%) | 958 (16.1%) |
Disability Class: Vision Difficulty
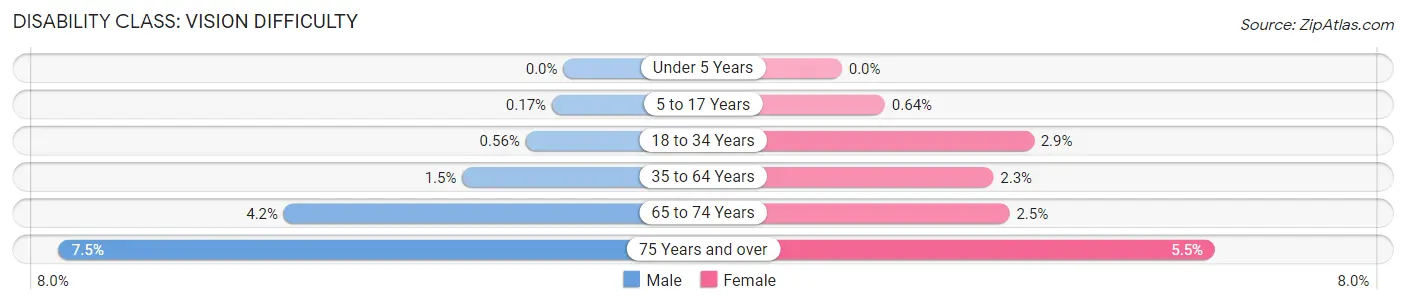
| Age Bracket | Male | Female |
| Under 5 Years | 0 (0.0%) | 0 (0.0%) |
| 5 to 17 Years | 11 (0.2%) | 40 (0.6%) |
| 18 to 34 Years | 44 (0.6%) | 216 (2.9%) |
| 35 to 64 Years | 261 (1.5%) | 415 (2.2%) |
| 65 to 74 Years | 301 (4.2%) | 200 (2.5%) |
| 75 Years and over | 342 (7.5%) | 330 (5.5%) |
Disability Class: Cognitive Difficulty
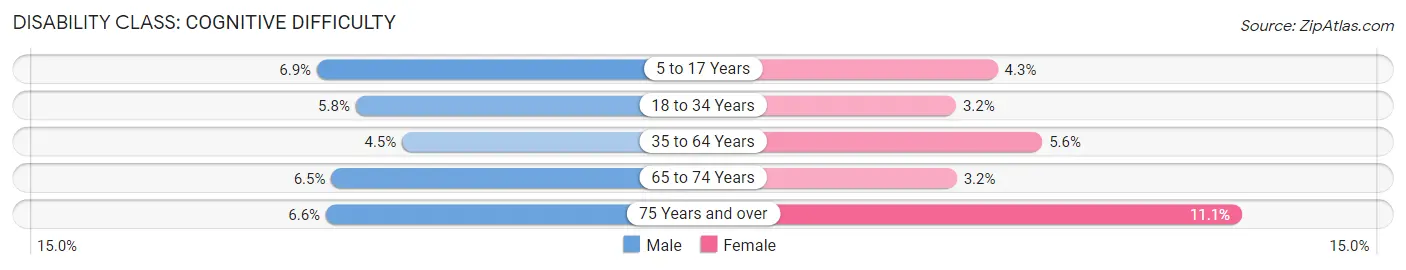
| Age Bracket | Male | Female |
| 5 to 17 Years | 434 (6.9%) | 271 (4.3%) |
| 18 to 34 Years | 453 (5.8%) | 241 (3.2%) |
| 35 to 64 Years | 782 (4.5%) | 1,027 (5.6%) |
| 65 to 74 Years | 468 (6.5%) | 257 (3.2%) |
| 75 Years and over | 302 (6.6%) | 664 (11.1%) |
Disability Class: Ambulatory Difficulty
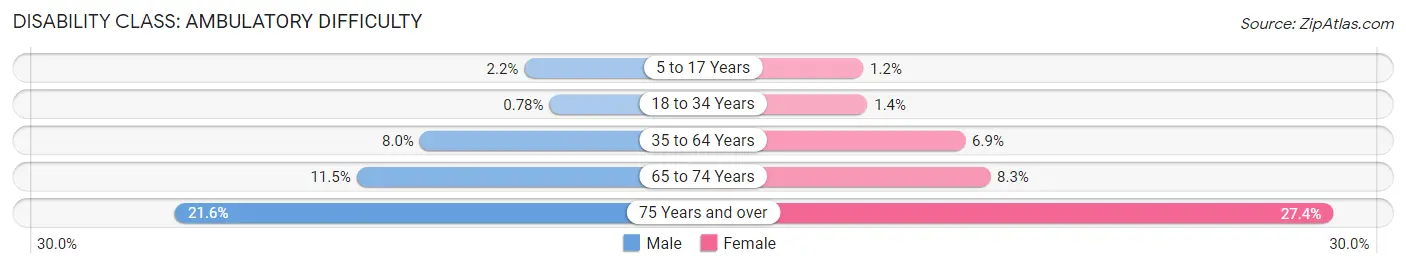
| Age Bracket | Male | Female |
| 5 to 17 Years | 138 (2.2%) | 74 (1.2%) |
| 18 to 34 Years | 61 (0.8%) | 108 (1.4%) |
| 35 to 64 Years | 1,393 (8.0%) | 1,264 (6.9%) |
| 65 to 74 Years | 835 (11.5%) | 663 (8.3%) |
| 75 Years and over | 988 (21.6%) | 1,630 (27.4%) |
Disability Class: Self-Care Difficulty
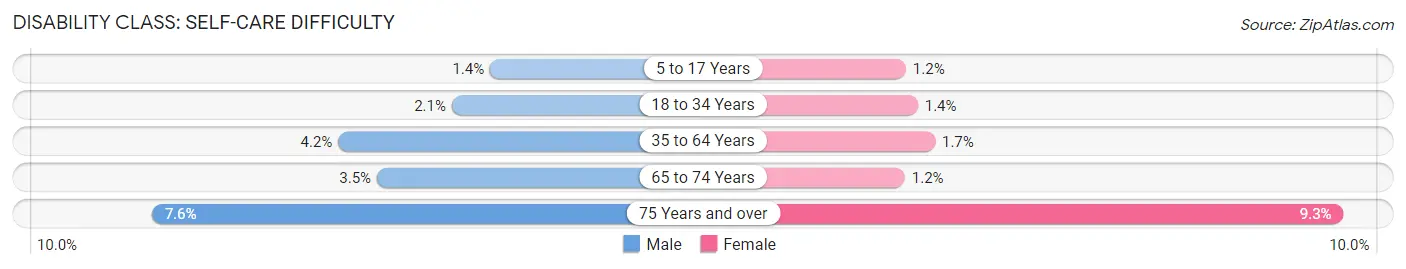
| Age Bracket | Male | Female |
| 5 to 17 Years | 86 (1.4%) | 74 (1.2%) |
| 18 to 34 Years | 162 (2.1%) | 107 (1.4%) |
| 35 to 64 Years | 728 (4.2%) | 318 (1.7%) |
| 65 to 74 Years | 251 (3.5%) | 94 (1.2%) |
| 75 Years and over | 349 (7.6%) | 555 (9.3%) |
Technology Access in Cape May County
Computing Device Access in Cape May County

| Device Type | # Households | % Households |
| Desktop or Laptop | 35,774 | 82.7% |
| Smartphone | 37,473 | 86.6% |
| Tablet | 28,022 | 64.7% |
| No Computing Device | 2,218 | 5.1% |
| Total | 43,277 | 100.0% |
Internet Access in Cape May County
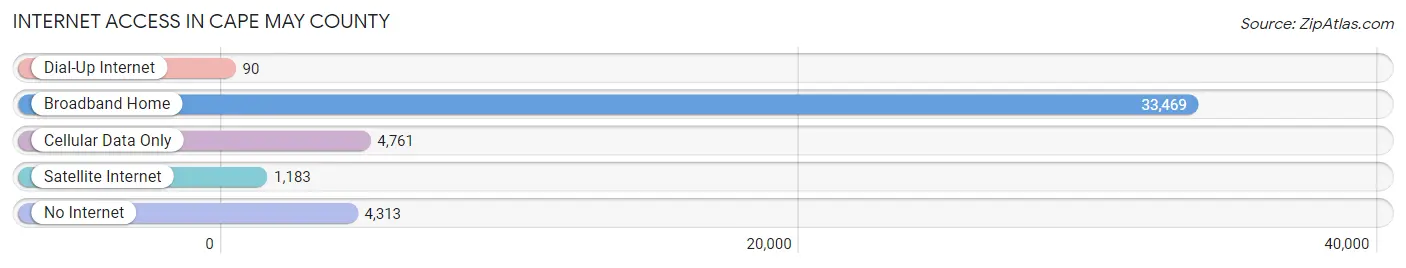
| Internet Type | # Households | % Households |
| Dial-Up Internet | 90 | 0.2% |
| Broadband Home | 33,469 | 77.3% |
| Cellular Data Only | 4,761 | 11.0% |
| Satellite Internet | 1,183 | 2.7% |
| No Internet | 4,313 | 10.0% |
| Total | 43,277 | 100.0% |
Cape May County Summary
Cape May County is a county located in the U.S. state of New Jersey. As of the 2010 United States Census, the county had a population of 97,265, making it the second-least populous county in New Jersey. Its county seat is the city of Cape May Court House. The county is part of the Ocean City, NJ Metropolitan Statistical Area as well as the Philadelphia-Reading-Camden, PA-NJ-DE-MD Combined Statistical Area.
History
Cape May County was created on March 10, 1692, from portions of the now-defunct Burlington County. It was named for Cornelius Jacobsen Mey, a Dutch captain who explored and charted the area from 1611 to 1614, and established a claim for the province of New Netherland. The county was originally settled by the Dutch, and was the location of the first European settlement in what is now New Jersey.
The county was the site of several battles during the American Revolutionary War, including the Battle of Chestnut Neck and the Battle of Cape May. After the war, Cape May County was the first county in the United States to be organized under the new Constitution of the United States.
Geography
Cape May County is located at the southern tip of New Jersey, bordered by the Atlantic Ocean to the east and Delaware Bay to the west. It is the southernmost county in the state. The county is divided into three municipalities: Lower Township, Middle Township, and Upper Township. The county has a total area of 620 square miles, of which 590 square miles is land and 30 square miles (4.8%) is water.
Economy
Cape May County is a popular tourist destination, with its beaches, boardwalks, and other attractions. Tourism is the county’s largest industry, accounting for over $1 billion in economic activity each year. The county is also home to a number of other industries, including agriculture, fishing, and manufacturing.
Demographics
As of the 2010 United States Census, there were 97,265 people, 39,813 households, and 26,845 families residing in the county. The population density was 164.9 inhabitants per square mile (63.7/km2). There were 56,845 housing units at an average density of 96.3 per square mile (37.2/km2). The racial makeup of the county was 92.2% White, 4.2% Black or African American, 0.3% Native American, 0.8% Asian, 0.0% Pacific Islander, 1.2% from other races, and 1.3% from two or more races. Hispanic or Latino of any race were 4.2% of the population.
There were 39,813 households, out of which 25.3% had children under the age of 18 living with them, 51.2% were married couples living together, 10.7% had a female householder with no husband present, and 33.7% were non-families. 28.2% of all households were made up of individuals, and 13.7% had someone living alone who was 65 years of age or older. The average household size was 2.41 and the average family size was 2.93.
In the county, the population was spread out, with 20.9% under the age of 18, 6.7% from 18 to 24, 22.2% from 25 to 44, 29.2% from 45 to 64, and 21.0% who were 65 years of age or older. The median age was 44.8 years. For every 100 females there were 93.2 males. For every 100 females ages 18 and older there were 90.2 males.
The median income for a household in the county was $54,817, and the median income for a family was $65,871. Males had a median income of $48,867 versus $35,921 for females. The per capita income for the county was $27,837. About 5.2% of families and 8.2% of the population were below the poverty line, including 10.2% of those under age 18 and 6.2% of those age 65 or over.
Common Questions
What is the Total Population of Cape May County?
Total Population of Cape May County is 95,456.
What is the Total Male Population of Cape May County?
Total Male Population of Cape May County is 46,347.
What is the Total Female Population of Cape May County?
Total Female Population of Cape May County is 49,109.
What is the Ratio of Males per 100 Females in Cape May County?
There are 94.38 Males per 100 Females in Cape May County.
What is the Ratio of Females per 100 Males in Cape May County?
There are 105.96 Females per 100 Males in Cape May County.
What is the Median Population Age in Cape May County?
Median Population Age in Cape May County is 50.9 Years.
What is the Average Family Size in Cape May County
Average Family Size in Cape May County is 2.6 People.
What is the Average Household Size in Cape May County
Average Household Size in Cape May County is 2.2 People.
What is Per Capita Income in Cape May County?
Per Capita income in Cape May County is $51,344.
What is the Median Family Income in Cape May County?
Median Family Income in Cape May County is $101,287.
What is the Median Household income in Cape May County?
Median Household Income in Cape May County is $83,870.
What is Income or Wage Gap in Cape May County?
Income or Wage Gap in Cape May County is 24.0%.
Women in Cape May County earn 76.0 cents for every dollar earned by a man.
What is Family Income Deficit in Cape May County?
Family Income Deficit in Cape May County is $10,386.
Families that are below poverty line in Cape May County earn $10,386 less on average than the poverty threshold level.
What is Inequality or Gini Index in Cape May County?
Inequality or Gini Index in Cape May County is 0.47.
How Large is the Labor Force in Cape May County?
There are 45,926 People in the Labor Forcein in Cape May County.
What is the Percentage of People in the Labor Force in Cape May County?
56.8% of People are in the Labor Force in Cape May County.
What is the Unemployment Rate in Cape May County?
Unemployment Rate in Cape May County is 6.5%.