Camden County, NJ
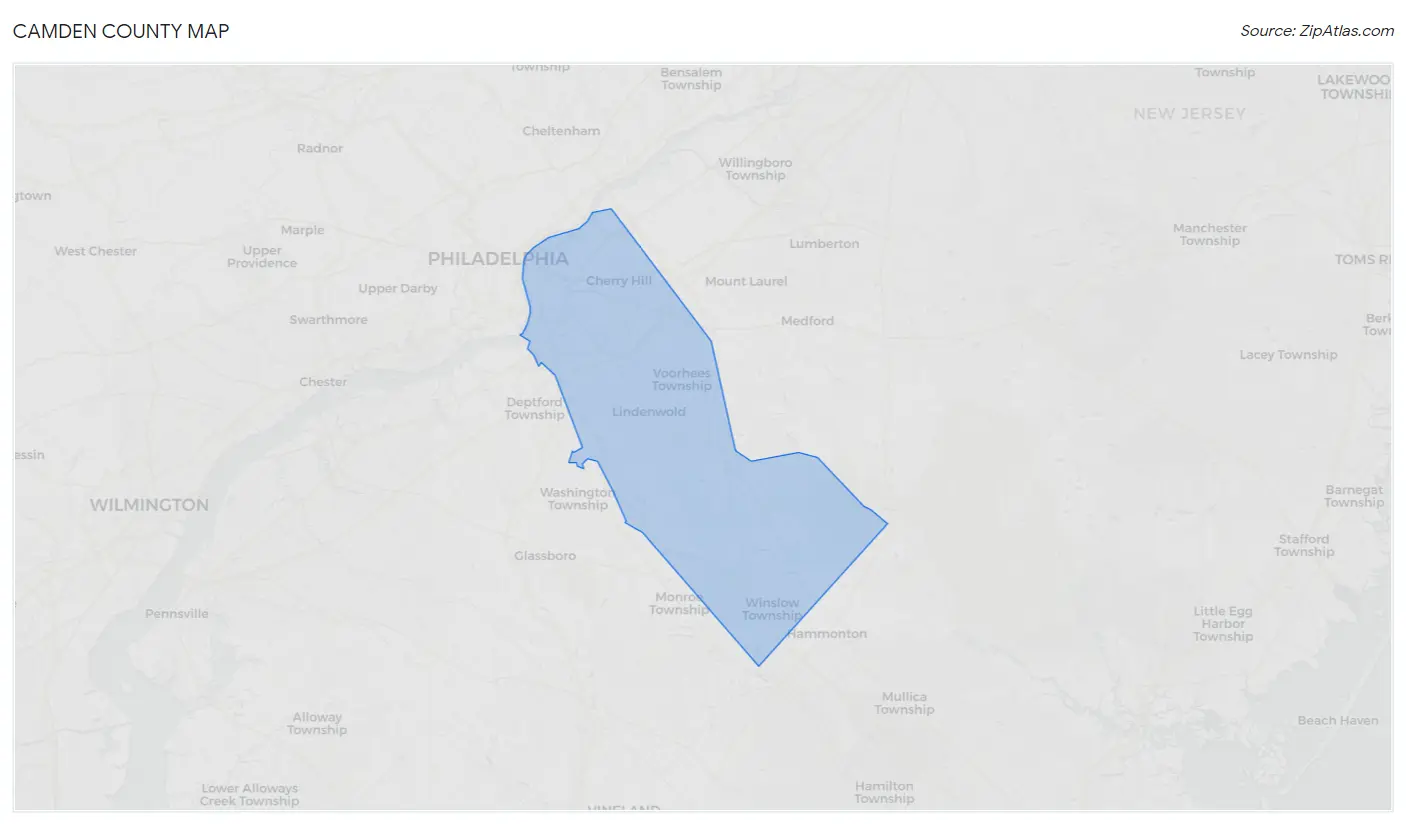
Camden County Map
Camden County Overview
522,581
TOTAL POPULATION
253,604
MALE POPULATION
268,977
FEMALE POPULATION
94.28
MALES / 100 FEMALES
106.06
FEMALES / 100 MALES
38.7
MEDIAN AGE
3.2
AVG FAMILY SIZE
2.6
AVG HOUSEHOLD SIZE
$42,398
PER CAPITA INCOME
$102,893
AVG FAMILY INCOME
$82,005
AVG HOUSEHOLD INCOME
23.9%
WAGE / INCOME GAP [ % ]
76.1¢/ $1
WAGE / INCOME GAP [ $ ]
$10,293
FAMILY INCOME DEFICIT
0.47
INEQUALITY / GINI INDEX
277,424
LABOR FORCE [ PEOPLE ]
66.4%
PERCENT IN LABOR FORCE
7.2%
UNEMPLOYMENT RATE
Race in Camden County
The most populous races in Camden County are White / Caucasian (304,112 | 58.2%), Black / African American (100,874 | 19.3%), and Hispanic or Latino (94,913 | 18.2%).
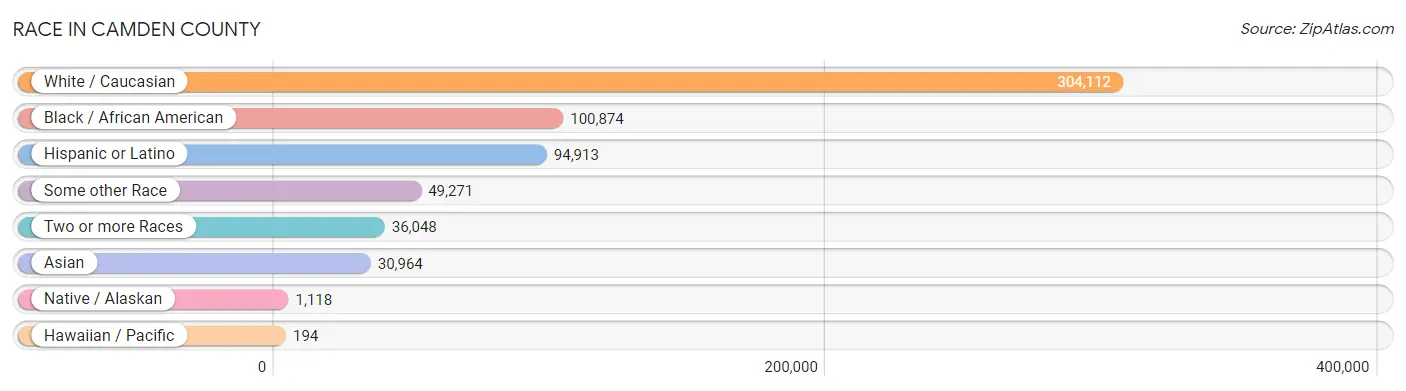
| Race | # Population | % Population |
| Asian | 30,964 | 5.9% |
| Black / African American | 100,874 | 19.3% |
| Hawaiian / Pacific | 194 | 0.0% |
| Hispanic or Latino | 94,913 | 18.2% |
| Native / Alaskan | 1,118 | 0.2% |
| White / Caucasian | 304,112 | 58.2% |
| Two or more Races | 36,048 | 6.9% |
| Some other Race | 49,271 | 9.4% |
| Total | 522,581 | 100.0% |
Ancestry in Camden County
The most populous ancestries reported in Camden County are Irish (87,985 | 16.8%), Italian (77,552 | 14.8%), German (63,012 | 12.1%), Puerto Rican (44,456 | 8.5%), and English (33,586 | 6.4%), together accounting for 58.7% of all Camden County residents.
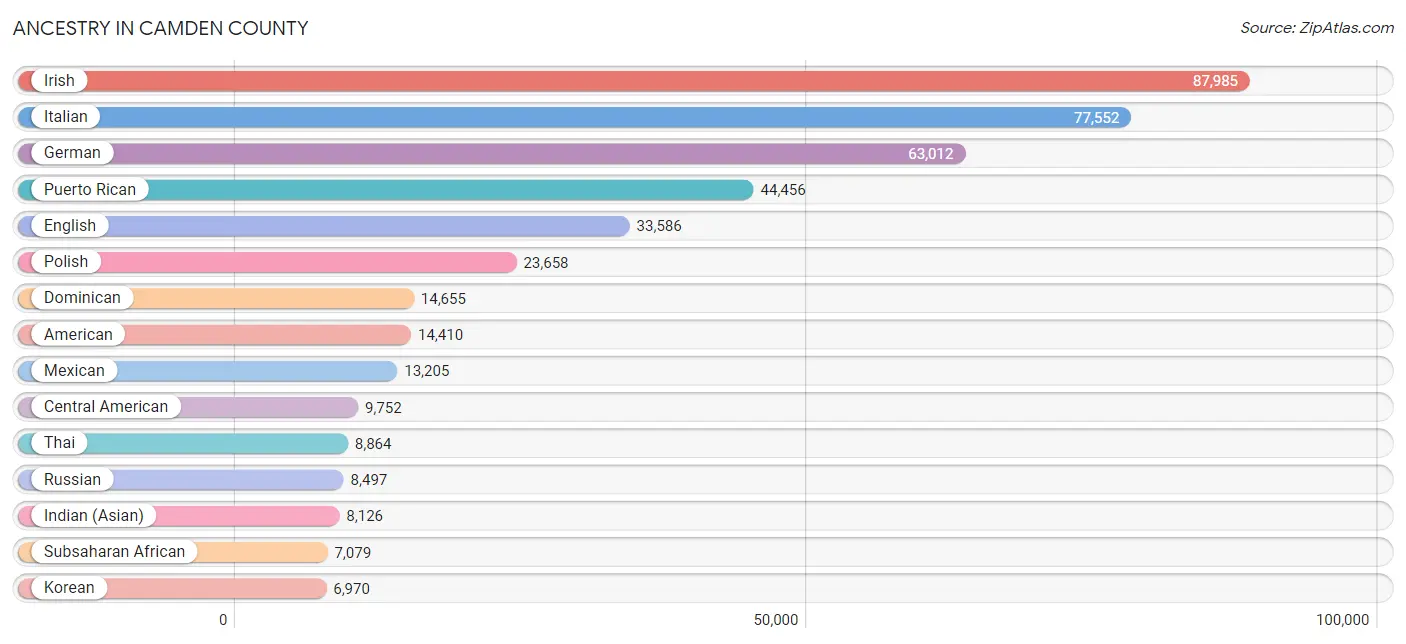
| Ancestry | # Population | % Population |
| Afghan | 48 | 0.0% |
| African | 2,877 | 0.5% |
| Alaskan Athabascan | 9 | 0.0% |
| Albanian | 795 | 0.2% |
| American | 14,410 | 2.8% |
| Apache | 31 | 0.0% |
| Arab | 2,043 | 0.4% |
| Argentinean | 630 | 0.1% |
| Armenian | 500 | 0.1% |
| Australian | 74 | 0.0% |
| Austrian | 1,093 | 0.2% |
| Bahamian | 154 | 0.0% |
| Barbadian | 236 | 0.1% |
| Basque | 52 | 0.0% |
| Belgian | 236 | 0.1% |
| Bhutanese | 1,558 | 0.3% |
| Blackfeet | 338 | 0.1% |
| Bolivian | 146 | 0.0% |
| Brazilian | 810 | 0.2% |
| British | 1,342 | 0.3% |
| British West Indian | 129 | 0.0% |
| Bulgarian | 5 | 0.0% |
| Burmese | 2,731 | 0.5% |
| Cajun | 25 | 0.0% |
| Cambodian | 363 | 0.1% |
| Canadian | 327 | 0.1% |
| Carpatho Rusyn | 13 | 0.0% |
| Celtic | 27 | 0.0% |
| Central American | 9,752 | 1.9% |
| Central American Indian | 606 | 0.1% |
| Cherokee | 941 | 0.2% |
| Chilean | 143 | 0.0% |
| Chinese | 105 | 0.0% |
| Chippewa | 240 | 0.1% |
| Choctaw | 9 | 0.0% |
| Colombian | 1,968 | 0.4% |
| Costa Rican | 172 | 0.0% |
| Croatian | 342 | 0.1% |
| Cuban | 2,483 | 0.5% |
| Czech | 997 | 0.2% |
| Czechoslovakian | 202 | 0.0% |
| Danish | 423 | 0.1% |
| Delaware | 150 | 0.0% |
| Dominican | 14,655 | 2.8% |
| Dutch | 2,786 | 0.5% |
| Eastern European | 3,068 | 0.6% |
| Ecuadorian | 1,061 | 0.2% |
| Egyptian | 671 | 0.1% |
| English | 33,586 | 6.4% |
| Estonian | 193 | 0.0% |
| Ethiopian | 322 | 0.1% |
| European | 3,775 | 0.7% |
| Filipino | 285 | 0.1% |
| Finnish | 411 | 0.1% |
| French | 5,495 | 1.1% |
| French American Indian | 49 | 0.0% |
| French Canadian | 1,084 | 0.2% |
| German | 63,012 | 12.1% |
| Ghanaian | 264 | 0.1% |
| Greek | 2,179 | 0.4% |
| Guamanian / Chamorro | 7 | 0.0% |
| Guatemalan | 1,549 | 0.3% |
| Guyanese | 222 | 0.0% |
| Haitian | 2,239 | 0.4% |
| Hmong | 36 | 0.0% |
| Honduran | 1,938 | 0.4% |
| Hungarian | 2,002 | 0.4% |
| Icelander | 13 | 0.0% |
| Indian (Asian) | 8,126 | 1.5% |
| Indonesian | 56 | 0.0% |
| Iranian | 114 | 0.0% |
| Iraqi | 30 | 0.0% |
| Irish | 87,985 | 16.8% |
| Israeli | 446 | 0.1% |
| Italian | 77,552 | 14.8% |
| Jamaican | 2,068 | 0.4% |
| Japanese | 1,403 | 0.3% |
| Jordanian | 59 | 0.0% |
| Kenyan | 28 | 0.0% |
| Korean | 6,970 | 1.3% |
| Laotian | 158 | 0.0% |
| Latvian | 229 | 0.0% |
| Lebanese | 527 | 0.1% |
| Liberian | 133 | 0.0% |
| Lithuanian | 1,913 | 0.4% |
| Lumbee | 8 | 0.0% |
| Malaysian | 55 | 0.0% |
| Maltese | 7 | 0.0% |
| Mexican | 13,205 | 2.5% |
| Mexican American Indian | 152 | 0.0% |
| Mongolian | 9 | 0.0% |
| Moroccan | 281 | 0.1% |
| Native Hawaiian | 341 | 0.1% |
| Navajo | 60 | 0.0% |
| Nicaraguan | 1,608 | 0.3% |
| Nigerian | 1,883 | 0.4% |
| Northern European | 340 | 0.1% |
| Norwegian | 2,144 | 0.4% |
| Pakistani | 96 | 0.0% |
| Palestinian | 94 | 0.0% |
| Panamanian | 565 | 0.1% |
| Paraguayan | 10 | 0.0% |
| Pennsylvania German | 416 | 0.1% |
| Peruvian | 757 | 0.1% |
| Polish | 23,658 | 4.5% |
| Portuguese | 1,016 | 0.2% |
| Potawatomi | 4 | 0.0% |
| Puerto Rican | 44,456 | 8.5% |
| Romanian | 1,131 | 0.2% |
| Russian | 8,497 | 1.6% |
| Salvadoran | 3,880 | 0.7% |
| Samoan | 32 | 0.0% |
| Scandinavian | 805 | 0.2% |
| Scotch-Irish | 2,078 | 0.4% |
| Scottish | 5,360 | 1.0% |
| Seminole | 40 | 0.0% |
| Serbian | 332 | 0.1% |
| Sierra Leonean | 981 | 0.2% |
| Sioux | 40 | 0.0% |
| Slavic | 188 | 0.0% |
| Slovak | 901 | 0.2% |
| Slovene | 52 | 0.0% |
| South African | 91 | 0.0% |
| South American | 5,621 | 1.1% |
| South American Indian | 68 | 0.0% |
| Spaniard | 1,092 | 0.2% |
| Spanish | 677 | 0.1% |
| Spanish American | 128 | 0.0% |
| Spanish American Indian | 15 | 0.0% |
| Sri Lankan | 5,184 | 1.0% |
| Subsaharan African | 7,079 | 1.3% |
| Swedish | 2,247 | 0.4% |
| Swiss | 618 | 0.1% |
| Syrian | 243 | 0.1% |
| Thai | 8,864 | 1.7% |
| Trinidadian and Tobagonian | 605 | 0.1% |
| Turkish | 1,006 | 0.2% |
| U.S. Virgin Islander | 18 | 0.0% |
| Ukrainian | 3,151 | 0.6% |
| Uruguayan | 317 | 0.1% |
| Venezuelan | 589 | 0.1% |
| Vietnamese | 166 | 0.0% |
| Welsh | 2,867 | 0.5% |
| West Indian | 708 | 0.1% |
| Yugoslavian | 623 | 0.1% | View All 145 Rows |
Immigrants in Camden County
The most numerous immigrant groups reported in Camden County came from Latin America (27,499 | 5.3%), Asia (22,975 | 4.4%), Caribbean (12,098 | 2.3%), Central America (11,112 | 2.1%), and Dominican Republic (9,233 | 1.8%), together accounting for 15.9% of all Camden County residents.
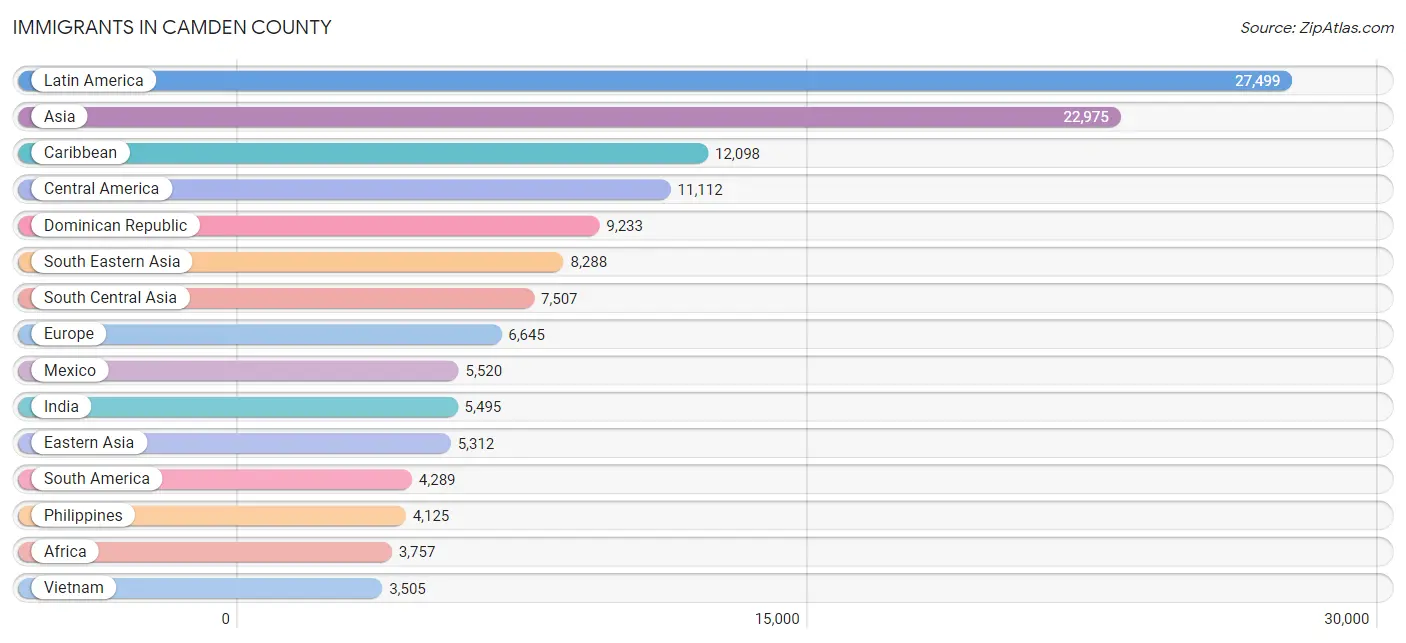
| Immigration Origin | # Population | % Population |
| Afghanistan | 22 | 0.0% |
| Africa | 3,757 | 0.7% |
| Albania | 274 | 0.1% |
| Argentina | 231 | 0.0% |
| Armenia | 11 | 0.0% |
| Asia | 22,975 | 4.4% |
| Australia | 75 | 0.0% |
| Austria | 71 | 0.0% |
| Bahamas | 112 | 0.0% |
| Bangladesh | 607 | 0.1% |
| Barbados | 116 | 0.0% |
| Belarus | 67 | 0.0% |
| Belgium | 10 | 0.0% |
| Belize | 30 | 0.0% |
| Bolivia | 43 | 0.0% |
| Bosnia and Herzegovina | 252 | 0.1% |
| Brazil | 645 | 0.1% |
| Cambodia | 290 | 0.1% |
| Cameroon | 137 | 0.0% |
| Canada | 712 | 0.1% |
| Caribbean | 12,098 | 2.3% |
| Central America | 11,112 | 2.1% |
| Chile | 141 | 0.0% |
| China | 3,457 | 0.7% |
| Colombia | 1,168 | 0.2% |
| Croatia | 12 | 0.0% |
| Cuba | 381 | 0.1% |
| Czechoslovakia | 31 | 0.0% |
| Dominica | 83 | 0.0% |
| Dominican Republic | 9,233 | 1.8% |
| Eastern Africa | 431 | 0.1% |
| Eastern Asia | 5,312 | 1.0% |
| Eastern Europe | 3,425 | 0.7% |
| Ecuador | 769 | 0.2% |
| Egypt | 409 | 0.1% |
| El Salvador | 2,244 | 0.4% |
| England | 520 | 0.1% |
| Eritrea | 15 | 0.0% |
| Ethiopia | 262 | 0.1% |
| Europe | 6,645 | 1.3% |
| France | 168 | 0.0% |
| Germany | 511 | 0.1% |
| Ghana | 288 | 0.1% |
| Greece | 266 | 0.1% |
| Grenada | 91 | 0.0% |
| Guatemala | 1,117 | 0.2% |
| Guyana | 326 | 0.1% |
| Haiti | 448 | 0.1% |
| Honduras | 1,193 | 0.2% |
| Hong Kong | 312 | 0.1% |
| Hungary | 21 | 0.0% |
| India | 5,495 | 1.1% |
| Indonesia | 61 | 0.0% |
| Iran | 15 | 0.0% |
| Iraq | 59 | 0.0% |
| Ireland | 145 | 0.0% |
| Israel | 520 | 0.1% |
| Italy | 693 | 0.1% |
| Jamaica | 1,073 | 0.2% |
| Japan | 320 | 0.1% |
| Jordan | 44 | 0.0% |
| Kazakhstan | 54 | 0.0% |
| Kenya | 79 | 0.0% |
| Korea | 1,535 | 0.3% |
| Kuwait | 6 | 0.0% |
| Laos | 52 | 0.0% |
| Latin America | 27,499 | 5.3% |
| Latvia | 35 | 0.0% |
| Lebanon | 146 | 0.0% |
| Liberia | 138 | 0.0% |
| Lithuania | 25 | 0.0% |
| Malaysia | 52 | 0.0% |
| Mexico | 5,520 | 1.1% |
| Middle Africa | 167 | 0.0% |
| Moldova | 80 | 0.0% |
| Morocco | 24 | 0.0% |
| Nepal | 147 | 0.0% |
| Netherlands | 25 | 0.0% |
| Nicaragua | 868 | 0.2% |
| Nigeria | 1,201 | 0.2% |
| North Macedonia | 120 | 0.0% |
| Northern Africa | 435 | 0.1% |
| Northern Europe | 1,181 | 0.2% |
| Norway | 23 | 0.0% |
| Oceania | 123 | 0.0% |
| Pakistan | 1,110 | 0.2% |
| Panama | 138 | 0.0% |
| Peru | 409 | 0.1% |
| Philippines | 4,125 | 0.8% |
| Poland | 640 | 0.1% |
| Portugal | 152 | 0.0% |
| Romania | 67 | 0.0% |
| Russia | 575 | 0.1% |
| Saudi Arabia | 28 | 0.0% |
| Scotland | 74 | 0.0% |
| Serbia | 236 | 0.1% |
| Sierra Leone | 595 | 0.1% |
| Singapore | 62 | 0.0% |
| South Africa | 30 | 0.0% |
| South America | 4,289 | 0.8% |
| South Central Asia | 7,507 | 1.4% |
| South Eastern Asia | 8,288 | 1.6% |
| Southern Europe | 1,182 | 0.2% |
| Spain | 70 | 0.0% |
| Sri Lanka | 13 | 0.0% |
| Sweden | 55 | 0.0% |
| Switzerland | 72 | 0.0% |
| Syria | 105 | 0.0% |
| Taiwan | 514 | 0.1% |
| Thailand | 77 | 0.0% |
| Trinidad and Tobago | 414 | 0.1% |
| Turkey | 759 | 0.2% |
| Uganda | 35 | 0.0% |
| Ukraine | 599 | 0.1% |
| Uruguay | 187 | 0.0% |
| Uzbekistan | 44 | 0.0% |
| Venezuela | 346 | 0.1% |
| Vietnam | 3,505 | 0.7% |
| Western Africa | 2,521 | 0.5% |
| Western Asia | 1,843 | 0.4% |
| Western Europe | 857 | 0.2% |
| Zaire | 30 | 0.0% | View All 122 Rows |
Sex and Age in Camden County
Sex and Age in Camden County
The most populous age groups in Camden County are 30 to 34 Years (18,011 | 7.1%) for men and 30 to 34 Years (18,528 | 6.9%) for women.
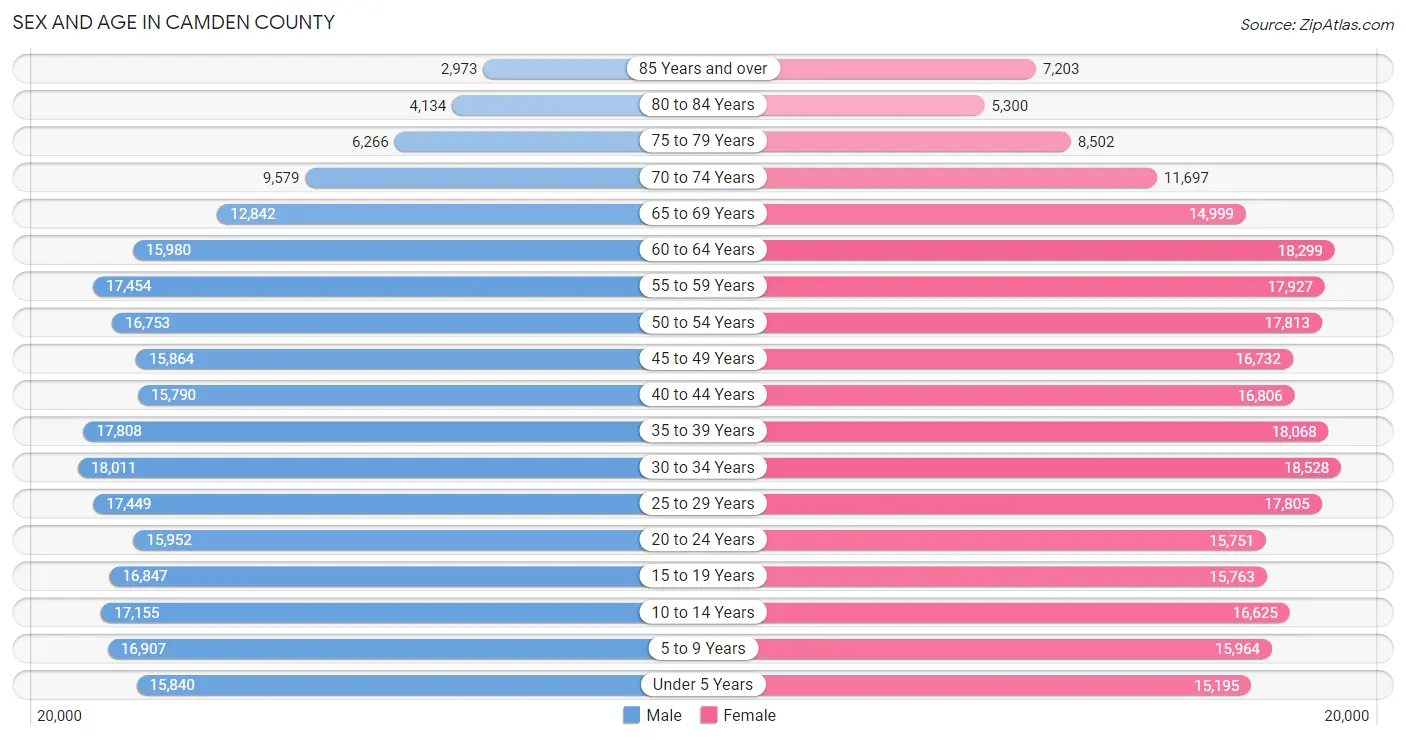
| Age Bracket | Male | Female |
| Under 5 Years | 15,840 (6.2%) | 15,195 (5.7%) |
| 5 to 9 Years | 16,907 (6.7%) | 15,964 (5.9%) |
| 10 to 14 Years | 17,155 (6.8%) | 16,625 (6.2%) |
| 15 to 19 Years | 16,847 (6.6%) | 15,763 (5.9%) |
| 20 to 24 Years | 15,952 (6.3%) | 15,751 (5.9%) |
| 25 to 29 Years | 17,449 (6.9%) | 17,805 (6.6%) |
| 30 to 34 Years | 18,011 (7.1%) | 18,528 (6.9%) |
| 35 to 39 Years | 17,808 (7.0%) | 18,068 (6.7%) |
| 40 to 44 Years | 15,790 (6.2%) | 16,806 (6.2%) |
| 45 to 49 Years | 15,864 (6.3%) | 16,732 (6.2%) |
| 50 to 54 Years | 16,753 (6.6%) | 17,813 (6.6%) |
| 55 to 59 Years | 17,454 (6.9%) | 17,927 (6.7%) |
| 60 to 64 Years | 15,980 (6.3%) | 18,299 (6.8%) |
| 65 to 69 Years | 12,842 (5.1%) | 14,999 (5.6%) |
| 70 to 74 Years | 9,579 (3.8%) | 11,697 (4.3%) |
| 75 to 79 Years | 6,266 (2.5%) | 8,502 (3.2%) |
| 80 to 84 Years | 4,134 (1.6%) | 5,300 (2.0%) |
| 85 Years and over | 2,973 (1.2%) | 7,203 (2.7%) |
| Total | 253,604 (100.0%) | 268,977 (100.0%) |
Families and Households in Camden County
Median Family Size in Camden County
The median family size in Camden County is 3.22 persons per family, with married-couple families (86,735 | 66.6%) accounting for the largest median family size of 3.27 persons per family. On the other hand, single male/father families (12,160 | 9.3%) represent the smallest median family size with 2.96 persons per family.
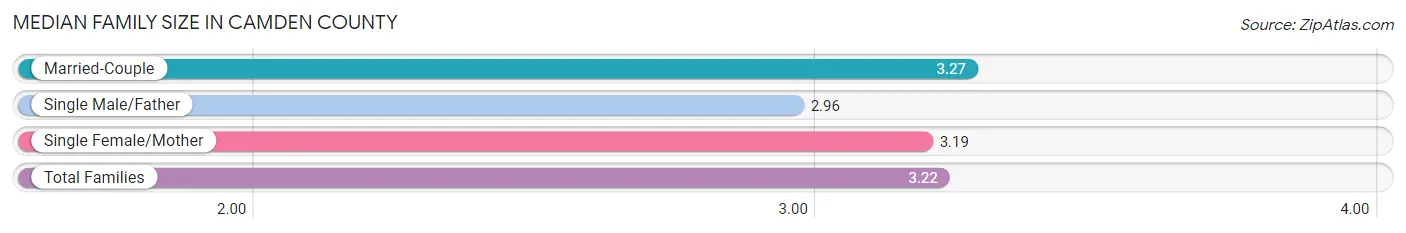
| Family Type | # Families | Family Size |
| Married-Couple | 86,735 (66.6%) | 3.27 |
| Single Male/Father | 12,160 (9.3%) | 2.96 |
| Single Female/Mother | 31,339 (24.1%) | 3.19 |
| Total Families | 130,234 (100.0%) | 3.22 |
Median Household Size in Camden County
The median household size in Camden County is 2.60 persons per household, with single female/mother households (31,339 | 15.8%) accounting for the largest median household size of 3.38 persons per household. non-family households (68,523 | 34.5%) represent the smallest median household size with 1.22 persons per household.
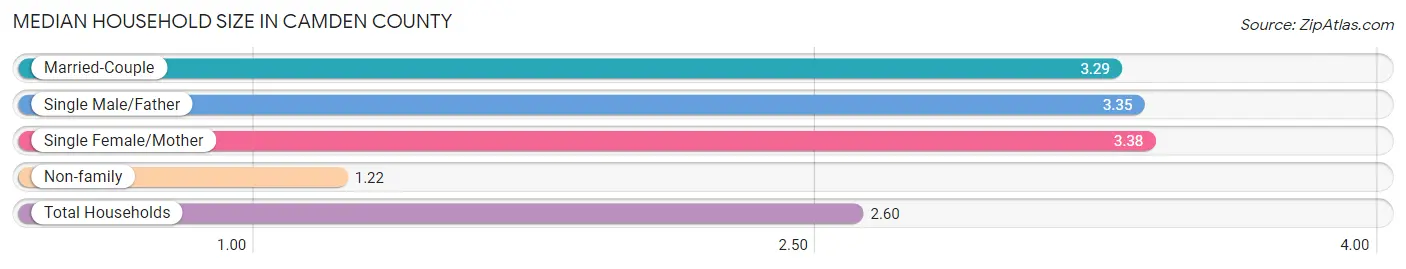
| Household Type | # Households | Household Size |
| Married-Couple | 86,735 (43.6%) | 3.29 |
| Single Male/Father | 12,160 (6.1%) | 3.35 |
| Single Female/Mother | 31,339 (15.8%) | 3.38 |
| Non-family | 68,523 (34.5%) | 1.22 |
| Total Households | 198,757 (100.0%) | 2.60 |
Household Size by Marriage Status in Camden County
Out of a total of 198,757 households in Camden County, 130,234 (65.5%) are family households, while 68,523 (34.5%) are nonfamily households. The most numerous type of family households are 2-person households, comprising 50,634, and the most common type of nonfamily households are 1-person households, comprising 55,599.
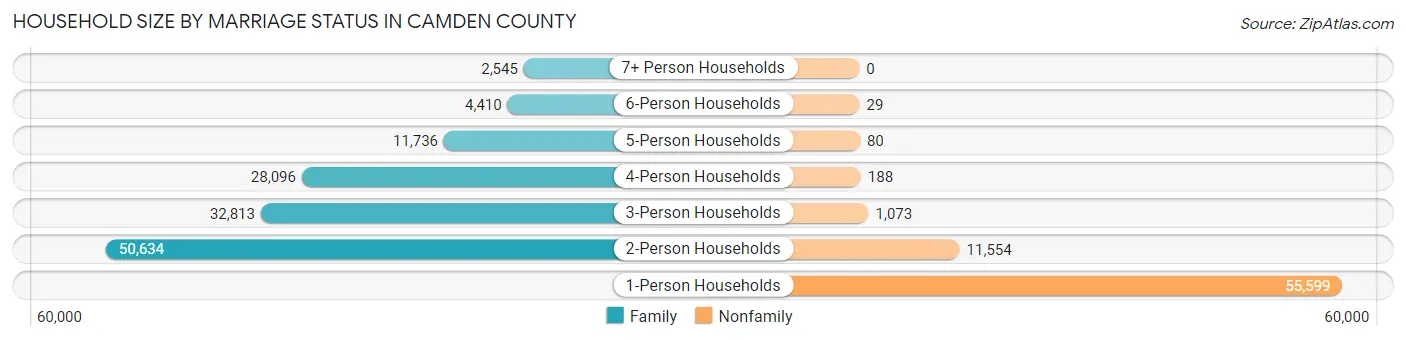
| Household Size | Family Households | Nonfamily Households |
| 1-Person Households | - | 55,599 (28.0%) |
| 2-Person Households | 50,634 (25.5%) | 11,554 (5.8%) |
| 3-Person Households | 32,813 (16.5%) | 1,073 (0.5%) |
| 4-Person Households | 28,096 (14.1%) | 188 (0.1%) |
| 5-Person Households | 11,736 (5.9%) | 80 (0.0%) |
| 6-Person Households | 4,410 (2.2%) | 29 (0.0%) |
| 7+ Person Households | 2,545 (1.3%) | 0 (0.0%) |
| Total | 130,234 (65.5%) | 68,523 (34.5%) |
Female Fertility in Camden County
Fertility by Age in Camden County
Average fertility rate in Camden County is 51.0 births per 1,000 women. Women in the age bracket of 20 to 34 years have the highest fertility rate with 72.0 births per 1,000 women. Women in the age bracket of 20 to 34 years acount for 59.5% of all women with births.
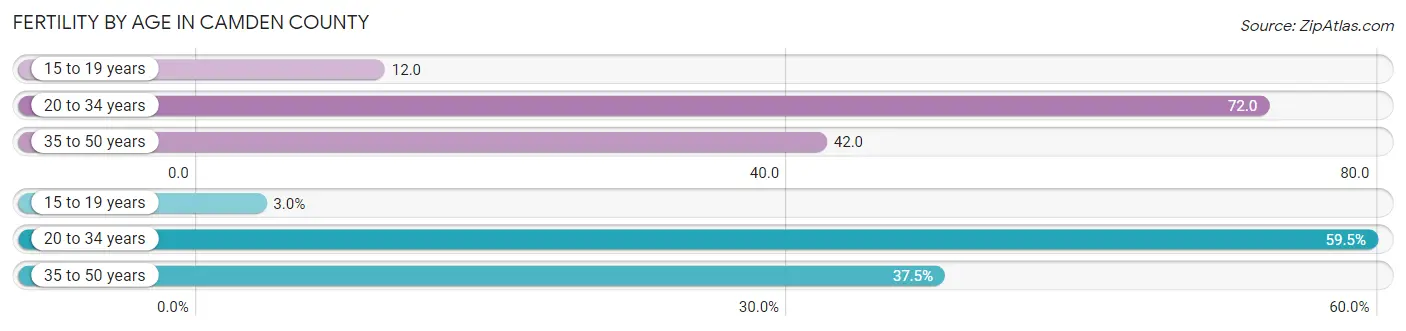
| Age Bracket | Women with Births | Births / 1,000 Women |
| 15 to 19 years | 186 (3.0%) | 12.0 |
| 20 to 34 years | 3,727 (59.5%) | 72.0 |
| 35 to 50 years | 2,348 (37.5%) | 42.0 |
| Total | 6,261 (100.0%) | 51.0 |
Fertility by Age by Marriage Status in Camden County
62.3% of women with births (6,261) in Camden County are married. The highest percentage of unmarried women with births falls into 15 to 19 years age bracket with 85.5% of them unmarried at the time of birth, while the lowest percentage of unmarried women with births belong to 35 to 50 years age bracket with 25.7% of them unmarried.
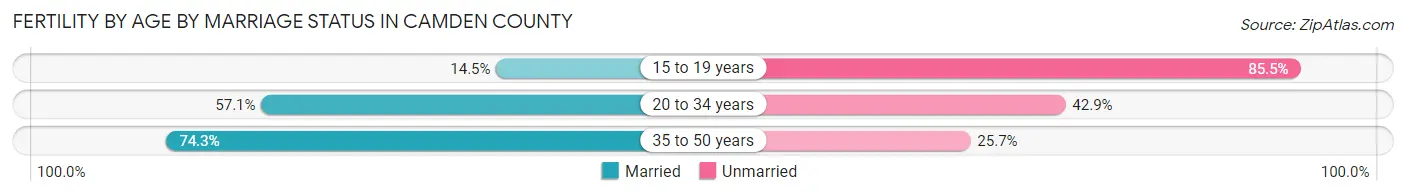
| Age Bracket | Married | Unmarried |
| 15 to 19 years | 27 (14.5%) | 159 (85.5%) |
| 20 to 34 years | 2,128 (57.1%) | 1,599 (42.9%) |
| 35 to 50 years | 1,745 (74.3%) | 603 (25.7%) |
| Total | 3,901 (62.3%) | 2,360 (37.7%) |
Fertility by Education in Camden County
Average fertility rate in Camden County is 51.0 births per 1,000 women. Women with the education attainment of graduate degree have the highest fertility rate of 76.0 births per 1,000 women, while women with the education attainment of less than high school have the lowest fertility at 29.0 births per 1,000 women. Women with the education attainment of college or associate's degree represent 30.3% of all women with births.
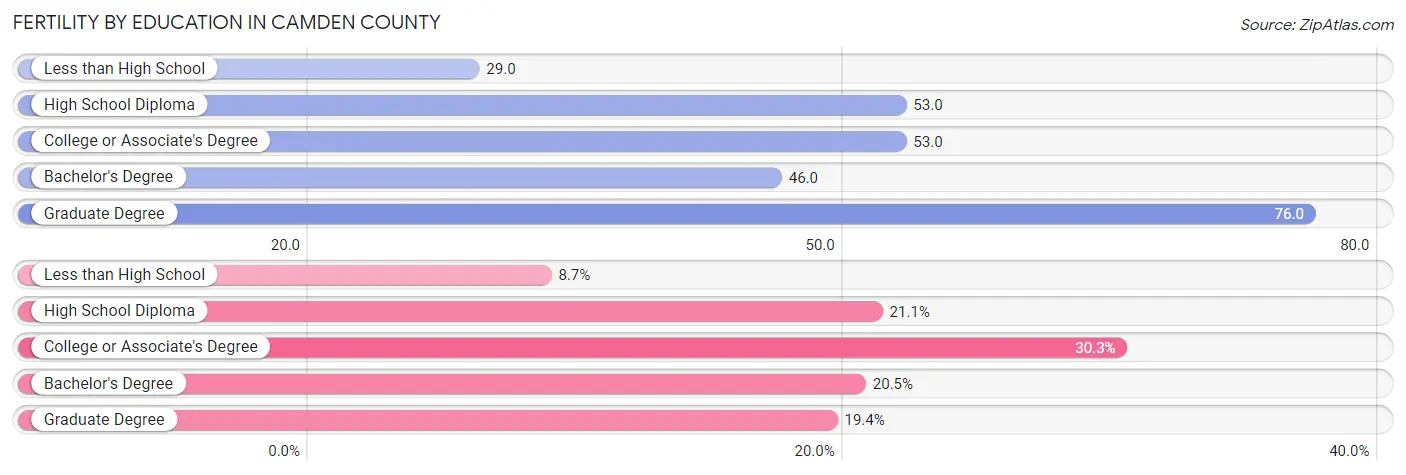
| Educational Attainment | Women with Births | Births / 1,000 Women |
| Less than High School | 545 (8.7%) | 29.0 |
| High School Diploma | 1,322 (21.1%) | 53.0 |
| College or Associate's Degree | 1,896 (30.3%) | 53.0 |
| Bachelor's Degree | 1,282 (20.5%) | 46.0 |
| Graduate Degree | 1,216 (19.4%) | 76.0 |
| Total | 6,261 (100.0%) | 51.0 |
Fertility by Education by Marriage Status in Camden County
37.7% of women with births in Camden County are unmarried. Women with the educational attainment of graduate degree are most likely to be married with 89.2% of them married at childbirth, while women with the educational attainment of less than high school are least likely to be married with 78.7% of them unmarried at childbirth.
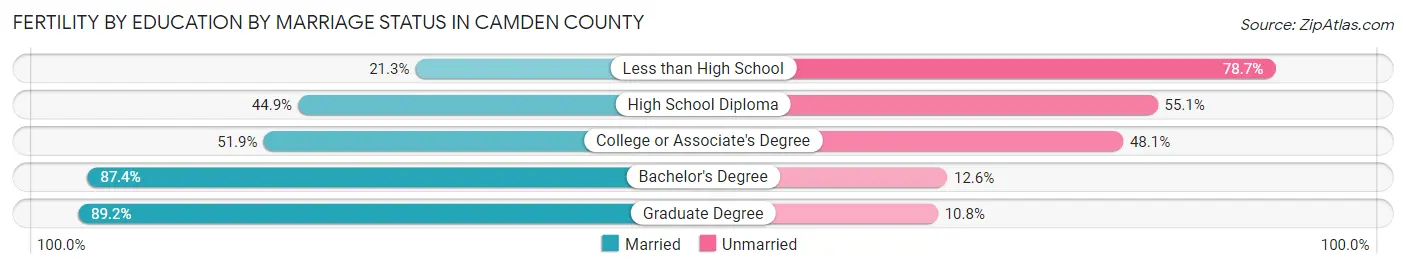
| Educational Attainment | Married | Unmarried |
| Less than High School | 116 (21.3%) | 429 (78.7%) |
| High School Diploma | 594 (44.9%) | 728 (55.1%) |
| College or Associate's Degree | 984 (51.9%) | 912 (48.1%) |
| Bachelor's Degree | 1,120 (87.4%) | 162 (12.6%) |
| Graduate Degree | 1,085 (89.2%) | 131 (10.8%) |
| Total | 3,901 (62.3%) | 2,360 (37.7%) |
Income in Camden County
Income Overview in Camden County
Per Capita Income in Camden County is $42,398, while median incomes of families and households are $102,893 and $82,005 respectively.
| Characteristic | Number | Measure |
| Per Capita Income | 522,581 | $42,398 |
| Median Family Income | 130,234 | $102,893 |
| Mean Family Income | 130,234 | $130,398 |
| Median Household Income | 198,757 | $82,005 |
| Mean Household Income | 198,757 | $109,600 |
| Income Deficit | 130,234 | $10,293 |
| Wage / Income Gap (%) | 522,581 | 23.88% |
| Wage / Income Gap ($) | 522,581 | 76.12¢ per $1 |
| Gini / Inequality Index | 522,581 | 0.47 |
Earnings by Sex in Camden County
Average Earnings in Camden County are $45,921, $53,022 for men and $40,362 for women, a difference of 23.9%.
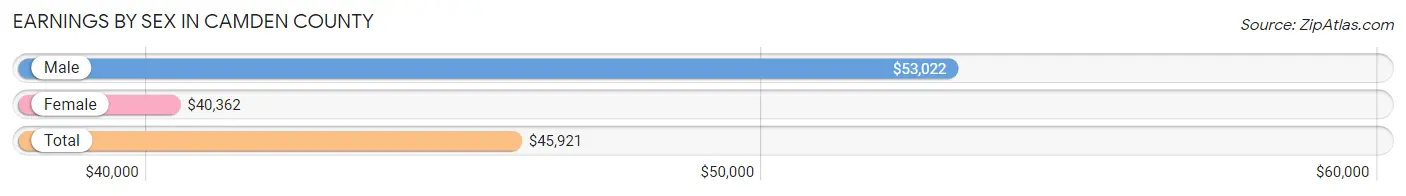
| Sex | Number | Average Earnings |
| Male | 144,569 (51.1%) | $53,022 |
| Female | 138,540 (48.9%) | $40,362 |
| Total | 283,109 (100.0%) | $45,921 |
Earnings by Sex by Income Bracket in Camden County
The most common earnings brackets in Camden County are $100,000+ for men (31,403 | 21.7%) and $100,000+ for women (16,395 | 11.8%).
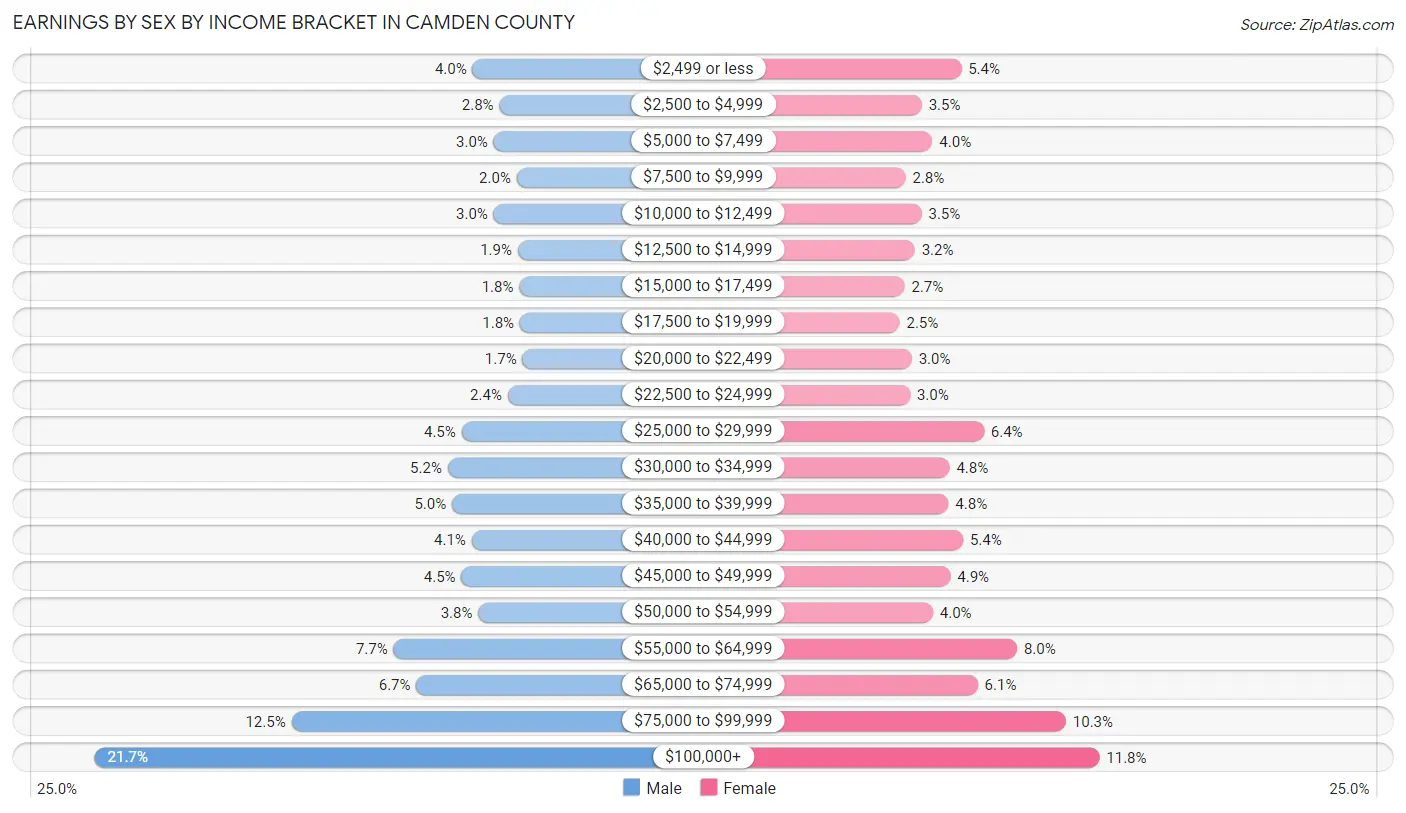
| Income | Male | Female |
| $2,499 or less | 5,812 (4.0%) | 7,430 (5.4%) |
| $2,500 to $4,999 | 3,991 (2.8%) | 4,866 (3.5%) |
| $5,000 to $7,499 | 4,387 (3.0%) | 5,551 (4.0%) |
| $7,500 to $9,999 | 2,812 (1.9%) | 3,813 (2.8%) |
| $10,000 to $12,499 | 4,374 (3.0%) | 4,844 (3.5%) |
| $12,500 to $14,999 | 2,745 (1.9%) | 4,403 (3.2%) |
| $15,000 to $17,499 | 2,650 (1.8%) | 3,737 (2.7%) |
| $17,500 to $19,999 | 2,596 (1.8%) | 3,424 (2.5%) |
| $20,000 to $22,499 | 2,422 (1.7%) | 4,218 (3.0%) |
| $22,500 to $24,999 | 3,424 (2.4%) | 4,106 (3.0%) |
| $25,000 to $29,999 | 6,556 (4.5%) | 8,894 (6.4%) |
| $30,000 to $34,999 | 7,492 (5.2%) | 6,670 (4.8%) |
| $35,000 to $39,999 | 7,199 (5.0%) | 6,599 (4.8%) |
| $40,000 to $44,999 | 5,863 (4.1%) | 7,540 (5.4%) |
| $45,000 to $49,999 | 6,563 (4.5%) | 6,724 (4.9%) |
| $50,000 to $54,999 | 5,421 (3.7%) | 5,578 (4.0%) |
| $55,000 to $64,999 | 11,167 (7.7%) | 11,047 (8.0%) |
| $65,000 to $74,999 | 9,615 (6.7%) | 8,490 (6.1%) |
| $75,000 to $99,999 | 18,077 (12.5%) | 14,211 (10.3%) |
| $100,000+ | 31,403 (21.7%) | 16,395 (11.8%) |
| Total | 144,569 (100.0%) | 138,540 (100.0%) |
Earnings by Sex by Educational Attainment in Camden County
Average earnings in Camden County are $60,706 for men and $45,752 for women, a difference of 24.6%. Men with an educational attainment of graduate degree enjoy the highest average annual earnings of $111,375, while those with less than high school education earn the least with $33,203. Women with an educational attainment of graduate degree earn the most with the average annual earnings of $78,603, while those with less than high school education have the smallest earnings of $24,693.
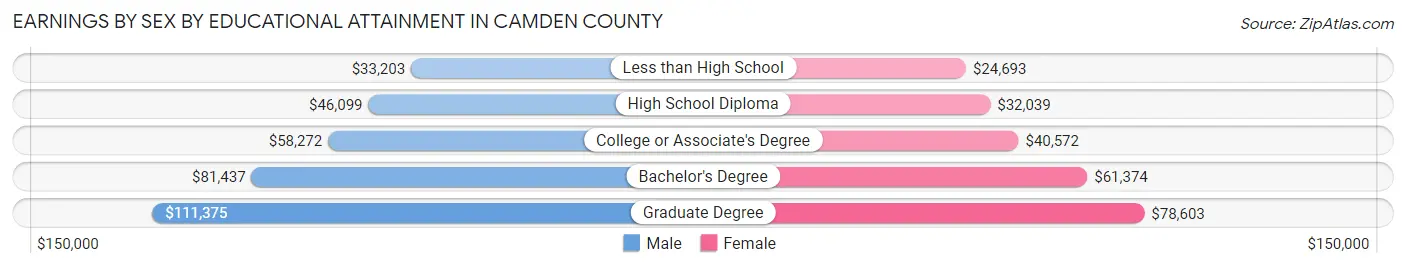
| Educational Attainment | Male Income | Female Income |
| Less than High School | $33,203 | $24,693 |
| High School Diploma | $46,099 | $32,039 |
| College or Associate's Degree | $58,272 | $40,572 |
| Bachelor's Degree | $81,437 | $61,374 |
| Graduate Degree | $111,375 | $78,603 |
| Total | $60,706 | $45,752 |
Family Income in Camden County
Family Income Brackets in Camden County
According to the Camden County family income data, there are 28,521 families falling into the $100,000 to $149,999 income range, which is the most common income bracket and makes up 21.9% of all families. Conversely, the $10,000 to $14,999 income bracket is the least frequent group with only 2,605 families (2.0%) belonging to this category.

| Income Bracket | # Families | % Families |
| Less than $10,000 | 3,777 | 2.9% |
| $10,000 to $14,999 | 2,605 | 2.0% |
| $15,000 to $24,999 | 5,861 | 4.5% |
| $25,000 to $34,999 | 6,512 | 5.0% |
| $35,000 to $49,999 | 10,028 | 7.7% |
| $50,000 to $74,999 | 17,972 | 13.8% |
| $75,000 to $99,999 | 16,409 | 12.6% |
| $100,000 to $149,999 | 28,521 | 21.9% |
| $150,000 to $199,999 | 17,451 | 13.4% |
| $200,000+ | 21,228 | 16.3% |
Family Income by Famaliy Size in Camden County
5-person families (10,269 | 7.9%) account for the highest median family income in Camden County with $135,212 per family, while 2-person families (55,114 | 42.3%) have the highest median income of $43,547 per family member.
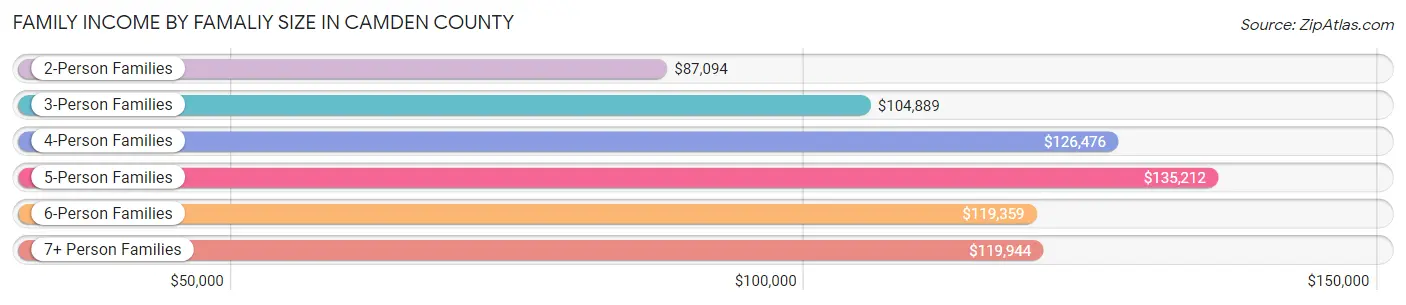
| Income Bracket | # Families | Median Income |
| 2-Person Families | 55,114 (42.3%) | $87,094 |
| 3-Person Families | 32,011 (24.6%) | $104,889 |
| 4-Person Families | 26,848 (20.6%) | $126,476 |
| 5-Person Families | 10,269 (7.9%) | $135,212 |
| 6-Person Families | 3,927 (3.0%) | $119,359 |
| 7+ Person Families | 2,065 (1.6%) | $119,944 |
| Total | 130,234 (100.0%) | $102,893 |
Family Income by Number of Earners in Camden County
The median family income in Camden County is $102,893, with families comprising 3+ earners (19,679) having the highest median family income of $160,304, while families with no earners (14,823) have the lowest median family income of $47,158, accounting for 15.1% and 11.4% of families, respectively.
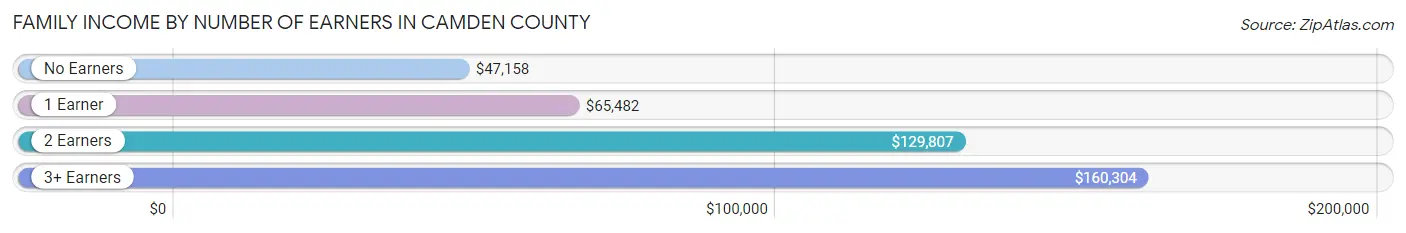
| Number of Earners | # Families | Median Income |
| No Earners | 14,823 (11.4%) | $47,158 |
| 1 Earner | 42,915 (33.0%) | $65,482 |
| 2 Earners | 52,817 (40.6%) | $129,807 |
| 3+ Earners | 19,679 (15.1%) | $160,304 |
| Total | 130,234 (100.0%) | $102,893 |
Household Income in Camden County
Household Income Brackets in Camden County
With 37,565 households falling in the category, the $100,000 to $149,999 income range is the most frequent in Camden County, accounting for 18.9% of all households. In contrast, only 7,553 households (3.8%) fall into the $10,000 to $14,999 income bracket, making it the least populous group.
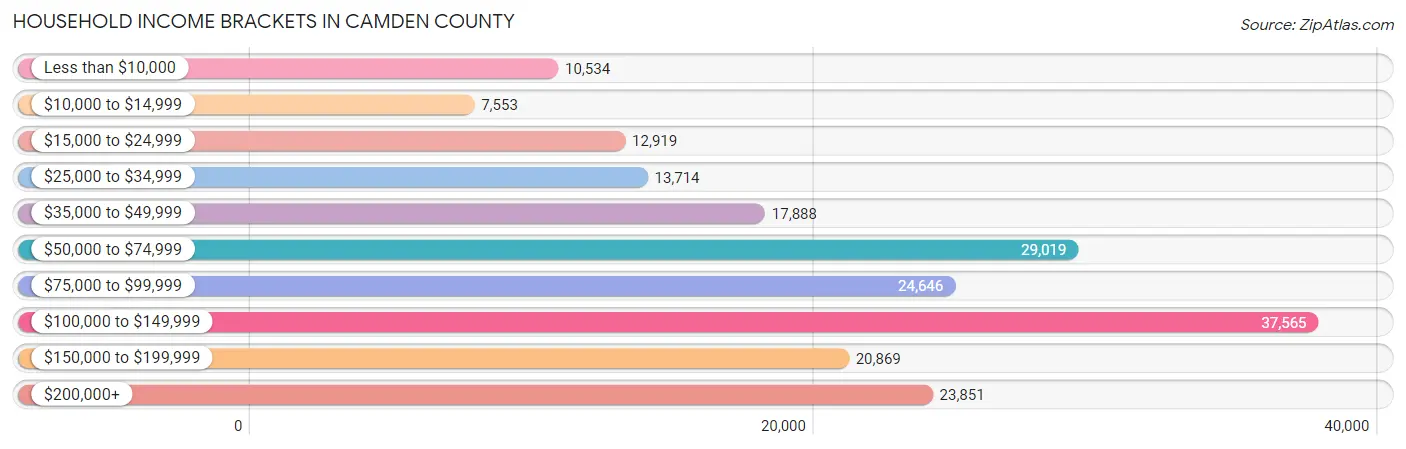
| Income Bracket | # Households | % Households |
| Less than $10,000 | 10,534 | 5.3% |
| $10,000 to $14,999 | 7,553 | 3.8% |
| $15,000 to $24,999 | 12,919 | 6.5% |
| $25,000 to $34,999 | 13,714 | 6.9% |
| $35,000 to $49,999 | 17,888 | 9.0% |
| $50,000 to $74,999 | 29,019 | 14.6% |
| $75,000 to $99,999 | 24,646 | 12.4% |
| $100,000 to $149,999 | 37,565 | 18.9% |
| $150,000 to $199,999 | 20,869 | 10.5% |
| $200,000+ | 23,851 | 12.0% |
Household Income by Householder Age in Camden County
The median household income in Camden County is $82,005, with the highest median household income of $100,338 found in the 45 to 64 years age bracket for the primary householder. A total of 77,785 households (39.1%) fall into this category. Meanwhile, the 15 to 24 years age bracket for the primary householder has the lowest median household income of $41,571, with 4,389 households (2.2%) in this group.
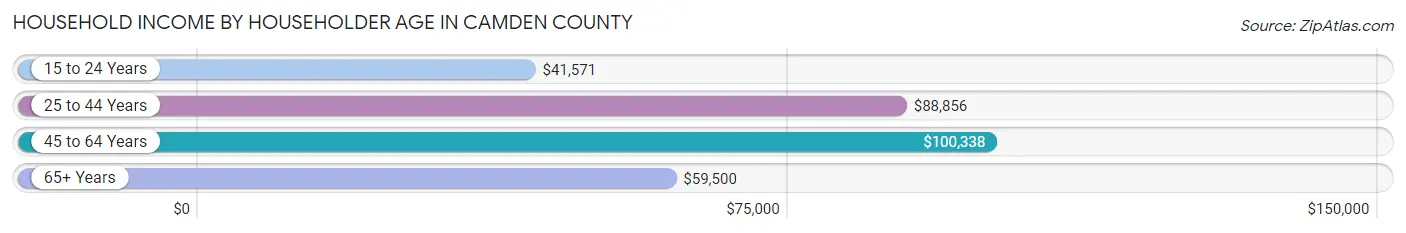
| Income Bracket | # Households | Median Income |
| 15 to 24 Years | 4,389 (2.2%) | $41,571 |
| 25 to 44 Years | 63,344 (31.9%) | $88,856 |
| 45 to 64 Years | 77,785 (39.1%) | $100,338 |
| 65+ Years | 53,239 (26.8%) | $59,500 |
| Total | 198,757 (100.0%) | $82,005 |
Poverty in Camden County
Income Below Poverty by Sex and Age in Camden County
With 10.9% poverty level for males and 13.8% for females among the residents of Camden County, under 5 year old males and 12 to 14 year old females are the most vulnerable to poverty, with 2,951 males (19.1%) and 2,550 females (25.5%) in their respective age groups living below the poverty level.

| Age Bracket | Male | Female |
| Under 5 Years | 2,951 (19.1%) | 2,661 (17.7%) |
| 5 Years | 492 (15.7%) | 351 (10.8%) |
| 6 to 11 Years | 3,334 (16.2%) | 3,223 (16.9%) |
| 12 to 14 Years | 1,761 (17.8%) | 2,550 (25.5%) |
| 15 Years | 549 (15.9%) | 639 (17.7%) |
| 16 and 17 Years | 1,089 (15.4%) | 970 (15.1%) |
| 18 to 24 Years | 2,702 (12.4%) | 3,348 (15.8%) |
| 25 to 34 Years | 3,193 (9.1%) | 5,150 (14.2%) |
| 35 to 44 Years | 2,928 (8.8%) | 4,507 (12.9%) |
| 45 to 54 Years | 2,562 (7.9%) | 3,867 (11.2%) |
| 55 to 64 Years | 3,102 (9.4%) | 3,703 (10.3%) |
| 65 to 74 Years | 1,665 (7.6%) | 2,945 (11.2%) |
| 75 Years and over | 1,022 (7.8%) | 2,786 (14.0%) |
| Total | 27,350 (10.9%) | 36,700 (13.8%) |
Income Above Poverty by Sex and Age in Camden County
According to the poverty statistics in Camden County, males aged 65 to 74 years and females aged 55 to 64 years are the age groups that are most secure financially, with 92.4% of males and 89.7% of females in these age groups living above the poverty line.
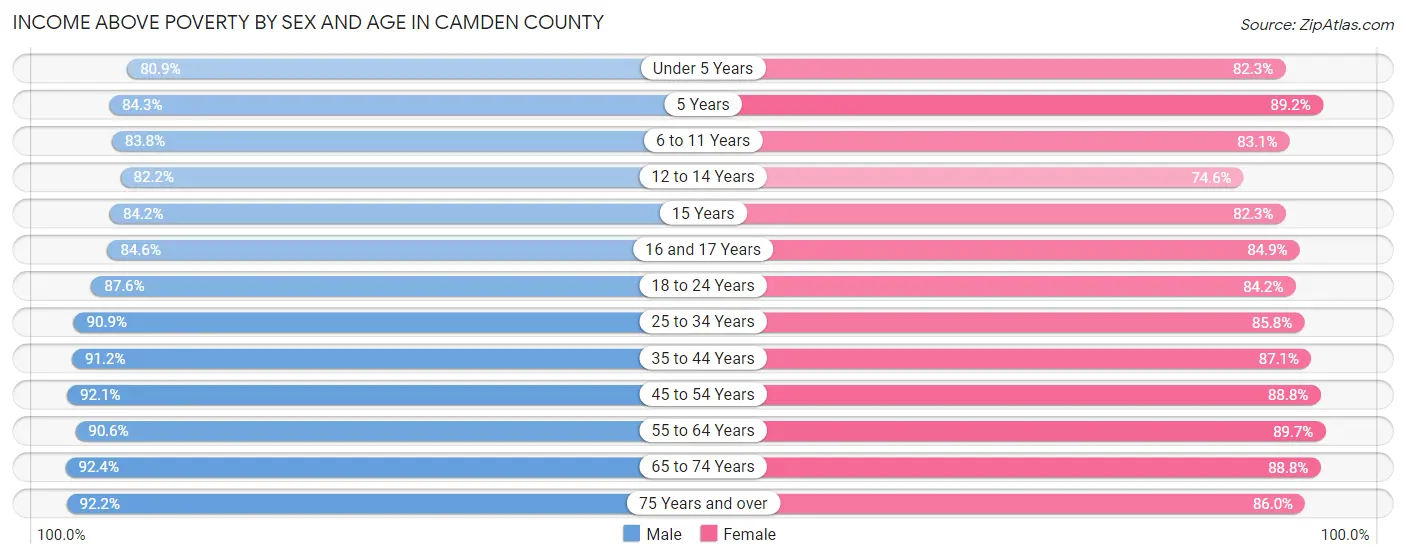
| Age Bracket | Male | Female |
| Under 5 Years | 12,535 (80.9%) | 12,343 (82.3%) |
| 5 Years | 2,644 (84.3%) | 2,908 (89.2%) |
| 6 to 11 Years | 17,265 (83.8%) | 15,818 (83.1%) |
| 12 to 14 Years | 8,116 (82.2%) | 7,471 (74.6%) |
| 15 Years | 2,915 (84.2%) | 2,977 (82.3%) |
| 16 and 17 Years | 5,978 (84.6%) | 5,473 (84.9%) |
| 18 to 24 Years | 19,085 (87.6%) | 17,789 (84.2%) |
| 25 to 34 Years | 31,874 (90.9%) | 31,095 (85.8%) |
| 35 to 44 Years | 30,296 (91.2%) | 30,312 (87.1%) |
| 45 to 54 Years | 29,822 (92.1%) | 30,601 (88.8%) |
| 55 to 64 Years | 29,842 (90.6%) | 32,323 (89.7%) |
| 65 to 74 Years | 20,197 (92.4%) | 23,331 (88.8%) |
| 75 Years and over | 12,081 (92.2%) | 17,054 (86.0%) |
| Total | 222,650 (89.1%) | 229,495 (86.2%) |
Income Below Poverty Among Married-Couple Families in Camden County
The poverty statistics for married-couple families in Camden County show that 3.6% or 3,095 of the total 86,735 families live below the poverty line. Families with 3 or 4 children have the highest poverty rate of 10.0%, comprising of 630 families. On the other hand, families with no children have the lowest poverty rate of 2.8%, which includes 1,399 families.
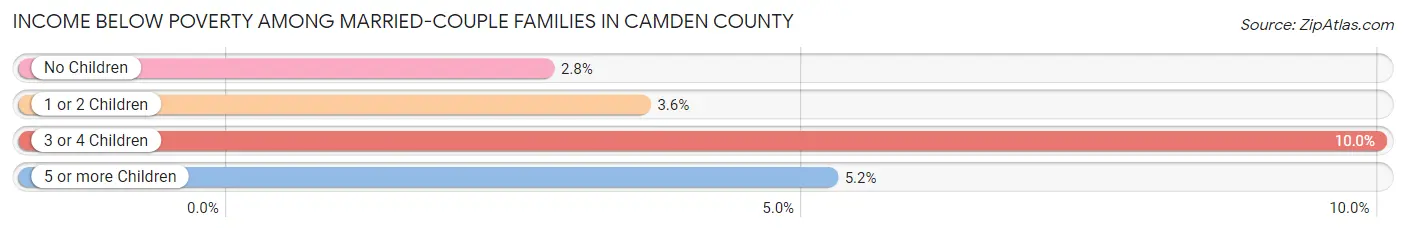
| Children | Above Poverty | Below Poverty |
| No Children | 49,409 (97.3%) | 1,399 (2.8%) |
| 1 or 2 Children | 28,344 (96.4%) | 1,054 (3.6%) |
| 3 or 4 Children | 5,669 (90.0%) | 630 (10.0%) |
| 5 or more Children | 218 (94.8%) | 12 (5.2%) |
| Total | 83,640 (96.4%) | 3,095 (3.6%) |
Income Below Poverty Among Single-Parent Households in Camden County
According to the poverty data in Camden County, 13.6% or 1,656 single-father households and 22.7% or 7,122 single-mother households are living below the poverty line. Among single-father households, those with 1 or 2 children have the highest poverty rate, with 1,182 households (20.2%) experiencing poverty. Likewise, among single-mother households, those with 5 or more children have the highest poverty rate, with 283 households (69.0%) falling below the poverty line.
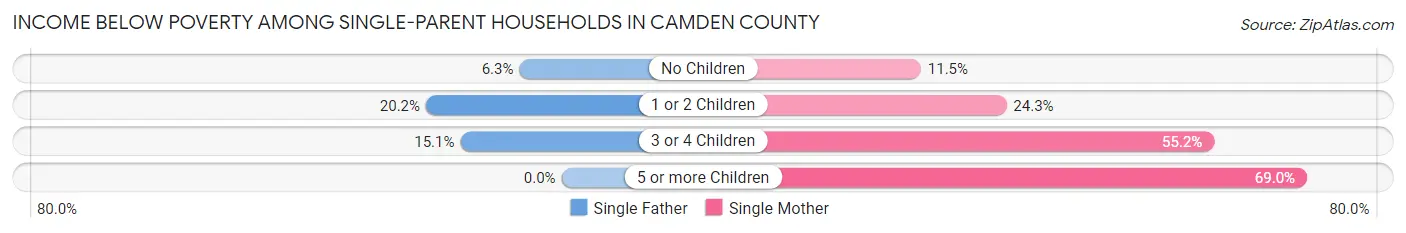
| Children | Single Father | Single Mother |
| No Children | 339 (6.3%) | 1,511 (11.5%) |
| 1 or 2 Children | 1,182 (20.2%) | 3,523 (24.2%) |
| 3 or 4 Children | 135 (15.1%) | 1,805 (55.2%) |
| 5 or more Children | 0 (0.0%) | 283 (69.0%) |
| Total | 1,656 (13.6%) | 7,122 (22.7%) |
Income Below Poverty Among Married-Couple vs Single-Parent Households in Camden County
The poverty data for Camden County shows that 3,095 of the married-couple family households (3.6%) and 8,778 of the single-parent households (20.2%) are living below the poverty level. Within the married-couple family households, those with 3 or 4 children have the highest poverty rate, with 630 households (10.0%) falling below the poverty line. Among the single-parent households, those with 5 or more children have the highest poverty rate, with 283 household (66.1%) living below poverty.
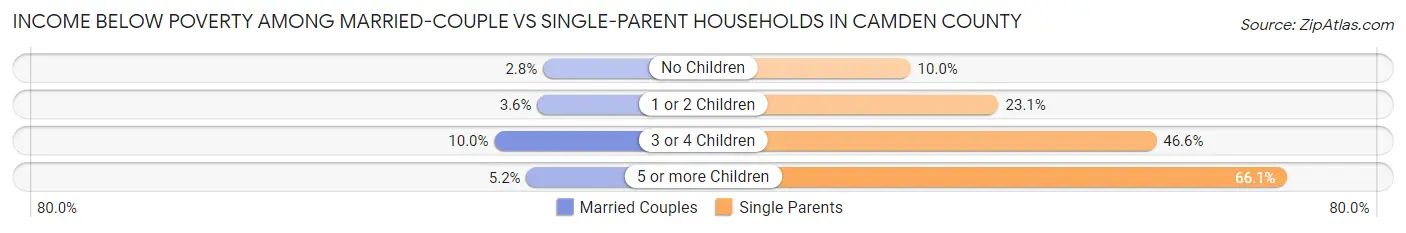
| Children | Married-Couple Families | Single-Parent Households |
| No Children | 1,399 (2.8%) | 1,850 (10.0%) |
| 1 or 2 Children | 1,054 (3.6%) | 4,705 (23.1%) |
| 3 or 4 Children | 630 (10.0%) | 1,940 (46.6%) |
| 5 or more Children | 12 (5.2%) | 283 (66.1%) |
| Total | 3,095 (3.6%) | 8,778 (20.2%) |
Employment Characteristics in Camden County
Employment by Class of Employer in Camden County
Among the 250,162 employed individuals in Camden County, private company employees (172,951 | 69.1%), not-for-profit organizations (23,202 | 9.3%), and local government employees (17,789 | 7.1%) make up the most common classes of employment.
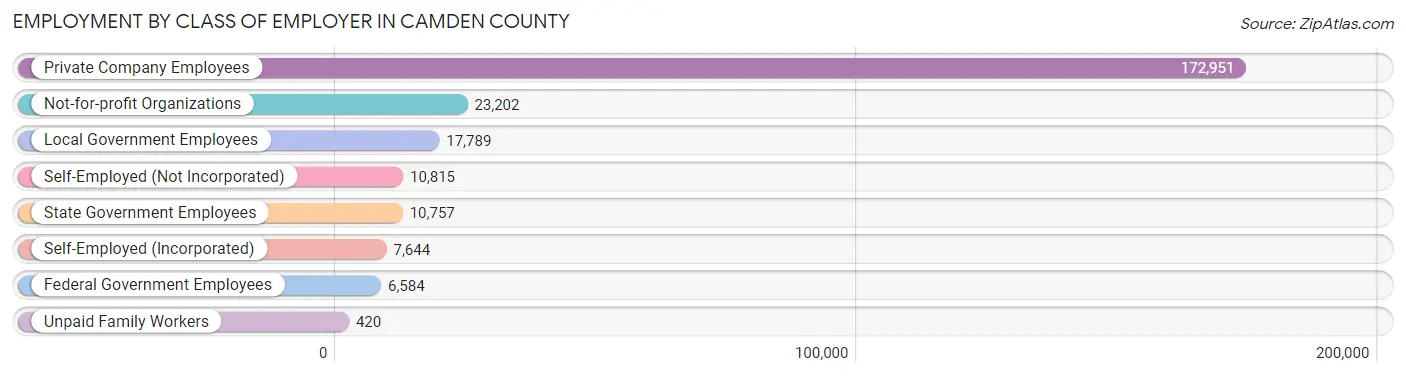
| Employer Class | # Employees | % Employees |
| Private Company Employees | 172,951 | 69.1% |
| Self-Employed (Incorporated) | 7,644 | 3.1% |
| Self-Employed (Not Incorporated) | 10,815 | 4.3% |
| Not-for-profit Organizations | 23,202 | 9.3% |
| Local Government Employees | 17,789 | 7.1% |
| State Government Employees | 10,757 | 4.3% |
| Federal Government Employees | 6,584 | 2.6% |
| Unpaid Family Workers | 420 | 0.2% |
| Total | 250,162 | 100.0% |
Employment Status by Age in Camden County
According to the labor force statistics for Camden County, out of the total population over 16 years of age (417,807), 66.4% or 277,424 individuals are in the labor force, with 7.2% or 19,975 of them unemployed. The age group with the highest labor force participation rate is 30 to 34 years, with 86.0% or 31,424 individuals in the labor force. Within the labor force, the 16 to 19 years age range has the highest percentage of unemployed individuals, with 17.9% or 1,978 of them being unemployed.
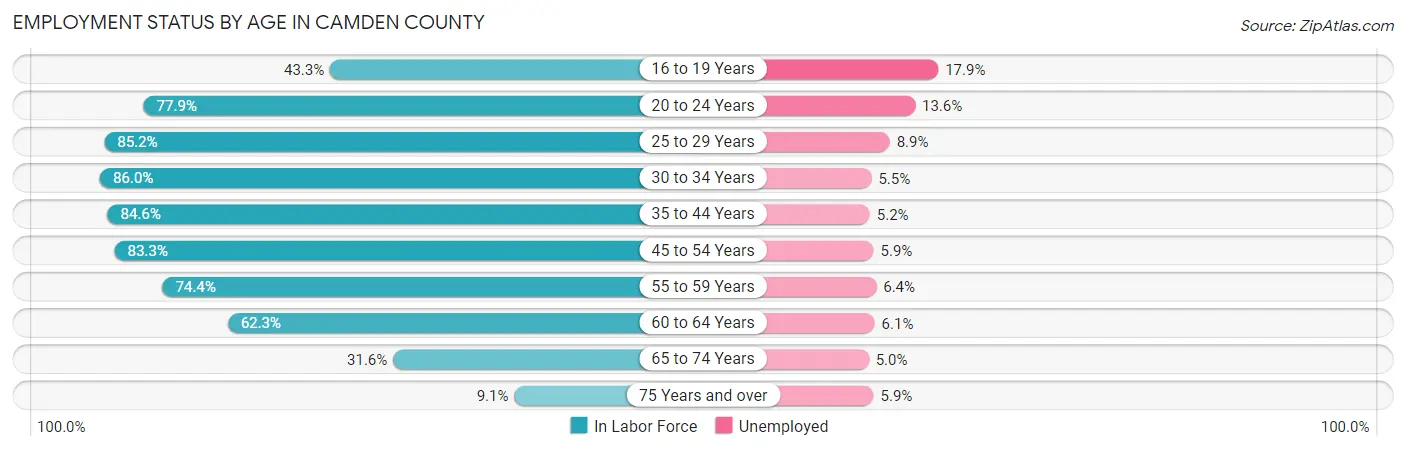
| Age Bracket | In Labor Force | Unemployed |
| 16 to 19 Years | 11,051 (43.3%) | 1,978 (17.9%) |
| 20 to 24 Years | 24,697 (77.9%) | 3,359 (13.6%) |
| 25 to 29 Years | 30,036 (85.2%) | 2,673 (8.9%) |
| 30 to 34 Years | 31,424 (86.0%) | 1,728 (5.5%) |
| 35 to 44 Years | 57,927 (84.6%) | 3,012 (5.2%) |
| 45 to 54 Years | 55,946 (83.3%) | 3,301 (5.9%) |
| 55 to 59 Years | 26,323 (74.4%) | 1,685 (6.4%) |
| 60 to 64 Years | 21,356 (62.3%) | 1,303 (6.1%) |
| 65 to 74 Years | 15,521 (31.6%) | 776 (5.0%) |
| 75 Years and over | 3,128 (9.1%) | 185 (5.9%) |
| Total | 277,424 (66.4%) | 19,975 (7.2%) |
Employment Status by Educational Attainment in Camden County
According to labor force statistics for Camden County, 80.5% of individuals (223,055) out of the total population between 25 and 64 years of age (277,087) are in the labor force, with 6.2% or 13,829 of them being unemployed. The group with the highest labor force participation rate are those with the educational attainment of bachelor's degree or higher, with 89.7% or 90,347 individuals in the labor force. Within the labor force, individuals with less than high school education have the highest percentage of unemployment, with 8.9% or 1,417 of them being unemployed.
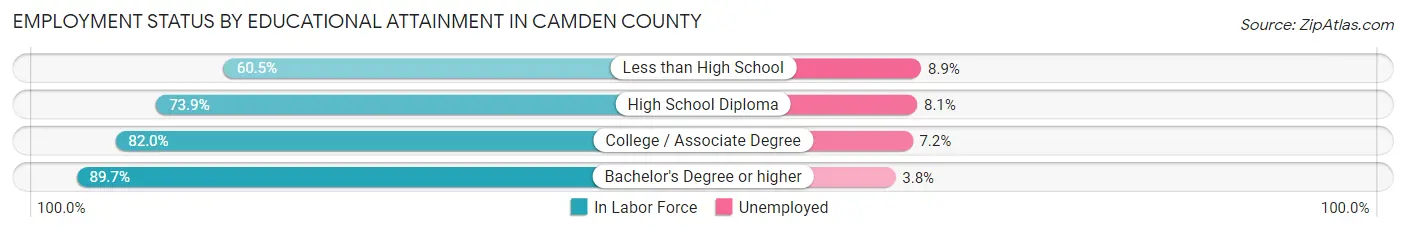
| Educational Attainment | In Labor Force | Unemployed |
| Less than High School | 15,916 (60.5%) | 2,341 (8.9%) |
| High School Diploma | 56,584 (73.9%) | 6,202 (8.1%) |
| College / Associate Degree | 60,262 (82.0%) | 5,291 (7.2%) |
| Bachelor's Degree or higher | 90,347 (89.7%) | 3,827 (3.8%) |
| Total | 223,055 (80.5%) | 17,179 (6.2%) |
Employment Occupations by Sex in Camden County
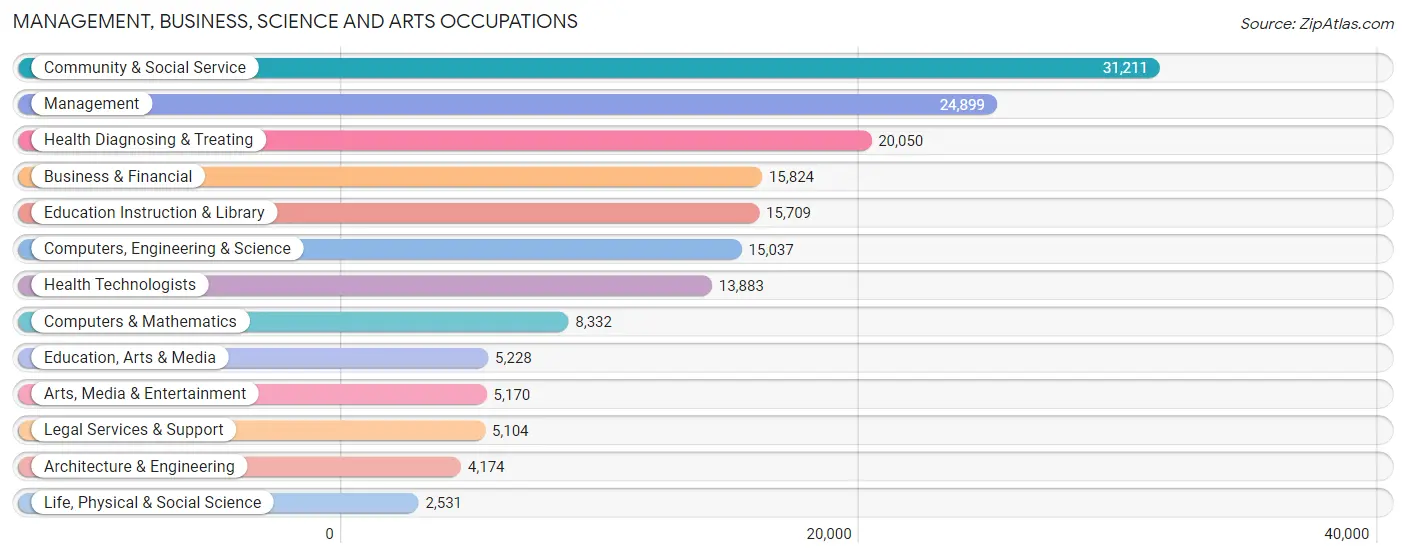
Management, Business, Science and Arts Occupations
The most common Management, Business, Science and Arts occupations in Camden County are Community & Social Service (31,211 | 12.1%), Management (24,899 | 9.7%), Health Diagnosing & Treating (20,050 | 7.8%), Business & Financial (15,824 | 6.2%), and Education Instruction & Library (15,709 | 6.1%).
Management, Business, Science and Arts Occupations by Sex
Within the Management, Business, Science and Arts occupations in Camden County, the most male-oriented occupations are Architecture & Engineering (88.4%), Computers & Mathematics (76.1%), and Computers, Engineering & Science (74.2%), while the most female-oriented occupations are Education Instruction & Library (76.1%), Health Diagnosing & Treating (75.0%), and Health Technologists (73.4%).
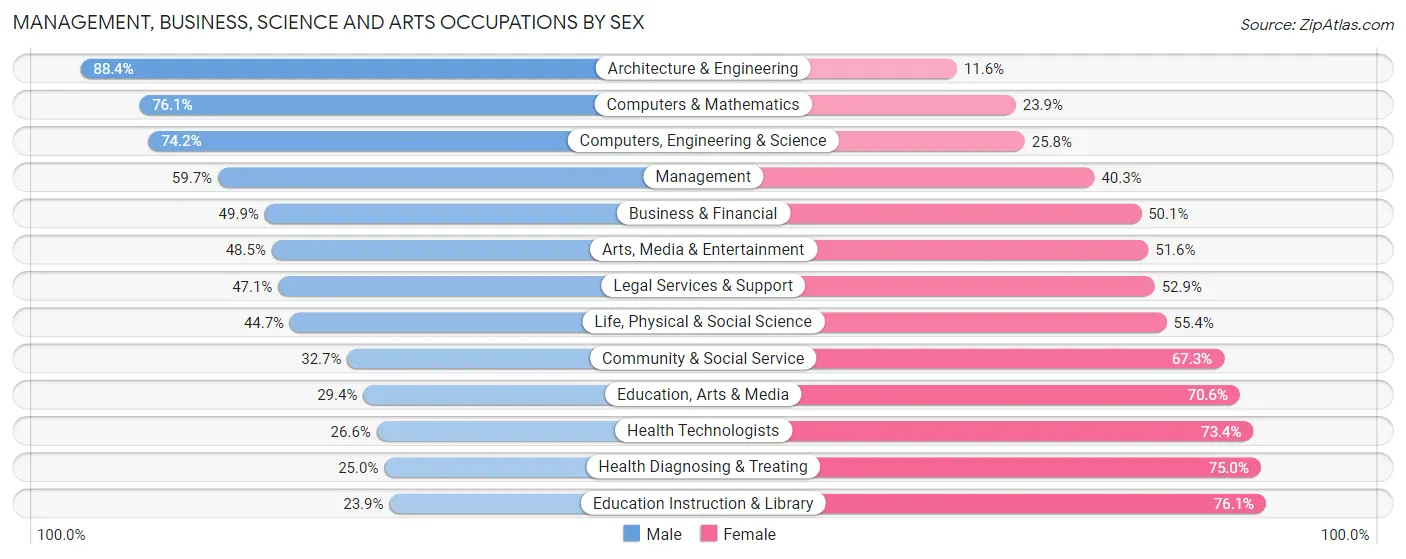
| Occupation | Male | Female |
| Management | 14,859 (59.7%) | 10,040 (40.3%) |
| Business & Financial | 7,900 (49.9%) | 7,924 (50.1%) |
| Computers, Engineering & Science | 11,157 (74.2%) | 3,880 (25.8%) |
| Computers & Mathematics | 6,339 (76.1%) | 1,993 (23.9%) |
| Architecture & Engineering | 3,688 (88.4%) | 486 (11.6%) |
| Life, Physical & Social Science | 1,130 (44.7%) | 1,401 (55.3%) |
| Community & Social Service | 10,201 (32.7%) | 21,010 (67.3%) |
| Education, Arts & Media | 1,535 (29.4%) | 3,693 (70.6%) |
| Legal Services & Support | 2,404 (47.1%) | 2,700 (52.9%) |
| Education Instruction & Library | 3,757 (23.9%) | 11,952 (76.1%) |
| Arts, Media & Entertainment | 2,505 (48.4%) | 2,665 (51.5%) |
| Health Diagnosing & Treating | 5,008 (25.0%) | 15,042 (75.0%) |
| Health Technologists | 3,687 (26.6%) | 10,196 (73.4%) |
| Total (Category) | 49,125 (45.9%) | 57,896 (54.1%) |
| Total (Overall) | 131,702 (51.3%) | 125,093 (48.7%) |
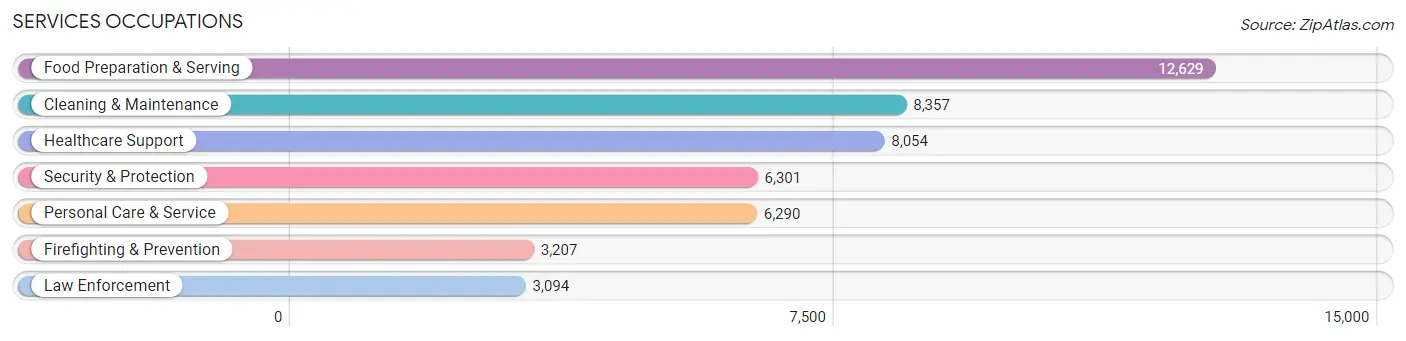
Services Occupations
The most common Services occupations in Camden County are Food Preparation & Serving (12,629 | 4.9%), Cleaning & Maintenance (8,357 | 3.3%), Healthcare Support (8,054 | 3.1%), Security & Protection (6,301 | 2.5%), and Personal Care & Service (6,290 | 2.5%).
Services Occupations by Sex
Within the Services occupations in Camden County, the most male-oriented occupations are Law Enforcement (80.2%), Security & Protection (74.6%), and Firefighting & Prevention (69.2%), while the most female-oriented occupations are Healthcare Support (83.6%), Personal Care & Service (72.8%), and Food Preparation & Serving (54.9%).
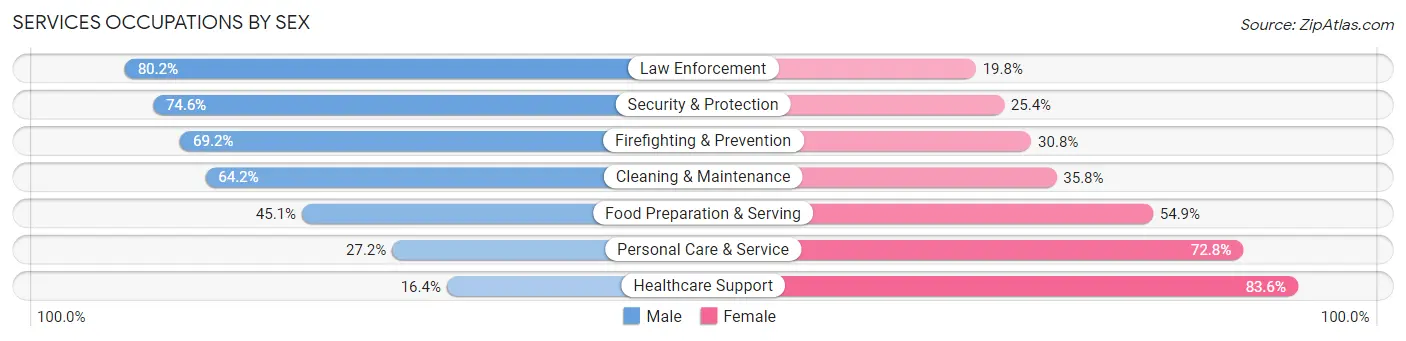
| Occupation | Male | Female |
| Healthcare Support | 1,322 (16.4%) | 6,732 (83.6%) |
| Security & Protection | 4,699 (74.6%) | 1,602 (25.4%) |
| Firefighting & Prevention | 2,219 (69.2%) | 988 (30.8%) |
| Law Enforcement | 2,480 (80.2%) | 614 (19.8%) |
| Food Preparation & Serving | 5,695 (45.1%) | 6,934 (54.9%) |
| Cleaning & Maintenance | 5,365 (64.2%) | 2,992 (35.8%) |
| Personal Care & Service | 1,713 (27.2%) | 4,577 (72.8%) |
| Total (Category) | 18,794 (45.1%) | 22,837 (54.9%) |
| Total (Overall) | 131,702 (51.3%) | 125,093 (48.7%) |
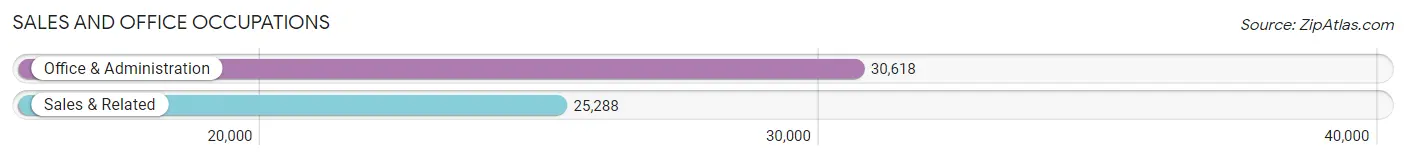
Sales and Office Occupations
The most common Sales and Office occupations in Camden County are Office & Administration (30,618 | 11.9%), and Sales & Related (25,288 | 9.9%).
Sales and Office Occupations by Sex
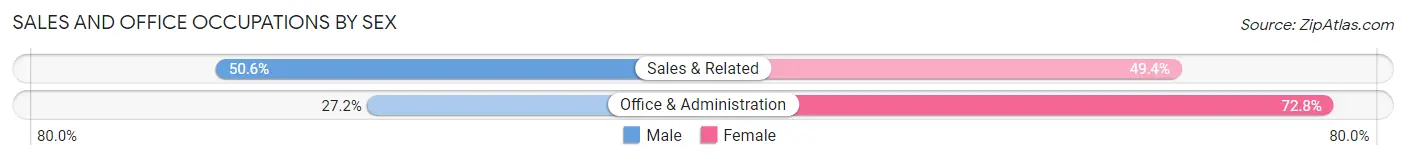
| Occupation | Male | Female |
| Sales & Related | 12,787 (50.6%) | 12,501 (49.4%) |
| Office & Administration | 8,333 (27.2%) | 22,285 (72.8%) |
| Total (Category) | 21,120 (37.8%) | 34,786 (62.2%) |
| Total (Overall) | 131,702 (51.3%) | 125,093 (48.7%) |
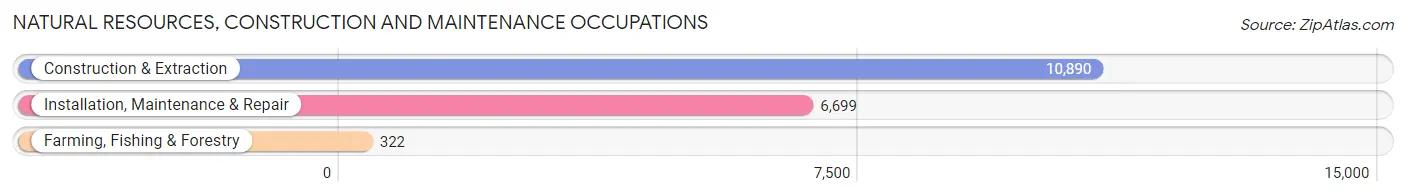
Natural Resources, Construction and Maintenance Occupations
The most common Natural Resources, Construction and Maintenance occupations in Camden County are Construction & Extraction (10,890 | 4.2%), Installation, Maintenance & Repair (6,699 | 2.6%), and Farming, Fishing & Forestry (322 | 0.1%).
Natural Resources, Construction and Maintenance Occupations by Sex
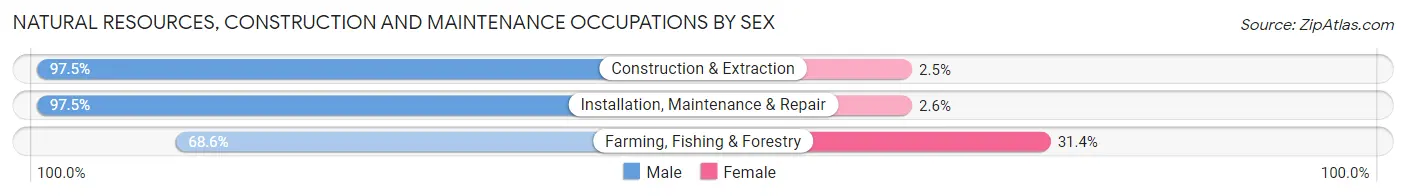
| Occupation | Male | Female |
| Farming, Fishing & Forestry | 221 (68.6%) | 101 (31.4%) |
| Construction & Extraction | 10,613 (97.5%) | 277 (2.5%) |
| Installation, Maintenance & Repair | 6,528 (97.5%) | 171 (2.5%) |
| Total (Category) | 17,362 (96.9%) | 549 (3.1%) |
| Total (Overall) | 131,702 (51.3%) | 125,093 (48.7%) |
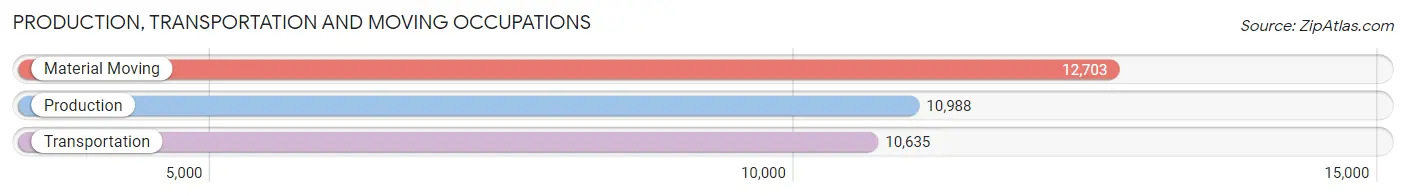
Production, Transportation and Moving Occupations
The most common Production, Transportation and Moving occupations in Camden County are Material Moving (12,703 | 5.0%), Production (10,988 | 4.3%), and Transportation (10,635 | 4.1%).
Production, Transportation and Moving Occupations by Sex
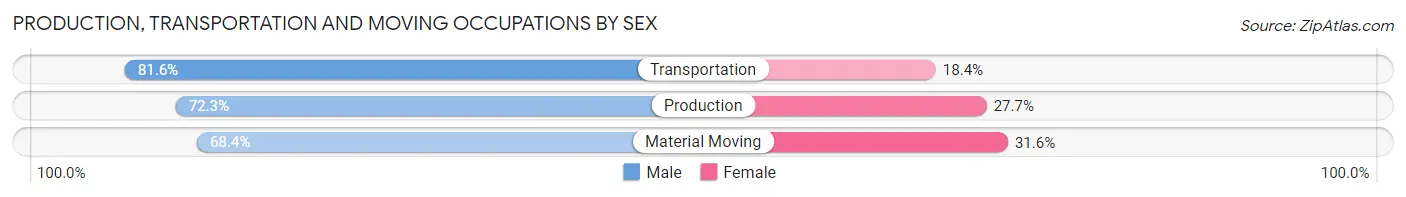
| Occupation | Male | Female |
| Production | 7,940 (72.3%) | 3,048 (27.7%) |
| Transportation | 8,677 (81.6%) | 1,958 (18.4%) |
| Material Moving | 8,684 (68.4%) | 4,019 (31.6%) |
| Total (Category) | 25,301 (73.7%) | 9,025 (26.3%) |
| Total (Overall) | 131,702 (51.3%) | 125,093 (48.7%) |
Employment Industries by Sex in Camden County
Employment Industries in Camden County
The major employment industries in Camden County include Health Care & Social Assistance (43,238 | 16.8%), Retail Trade (32,451 | 12.6%), Educational Services (23,175 | 9.0%), Professional & Scientific (21,599 | 8.4%), and Manufacturing (19,027 | 7.4%).

Employment Industries by Sex in Camden County
The Camden County industries that see more men than women are Construction (90.2%), Utilities (81.1%), and Wholesale Trade (72.1%), whereas the industries that tend to have a higher number of women are Health Care & Social Assistance (76.4%), Educational Services (69.5%), and Enterprise Management (57.0%).
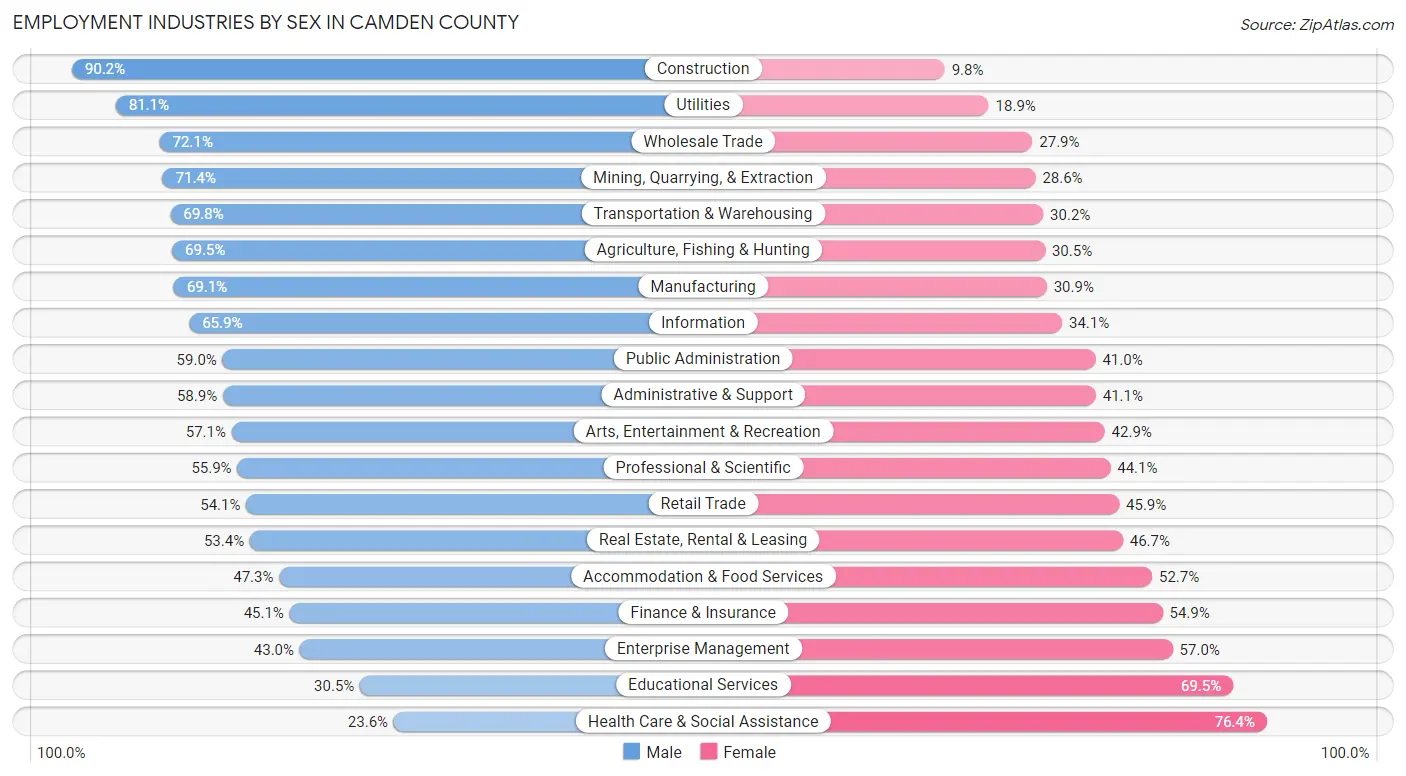
| Industry | Male | Female |
| Agriculture, Fishing & Hunting | 298 (69.5%) | 131 (30.5%) |
| Mining, Quarrying, & Extraction | 80 (71.4%) | 32 (28.6%) |
| Construction | 13,926 (90.2%) | 1,511 (9.8%) |
| Manufacturing | 13,145 (69.1%) | 5,882 (30.9%) |
| Wholesale Trade | 5,023 (72.1%) | 1,947 (27.9%) |
| Retail Trade | 17,560 (54.1%) | 14,891 (45.9%) |
| Transportation & Warehousing | 10,764 (69.8%) | 4,651 (30.2%) |
| Utilities | 1,431 (81.1%) | 333 (18.9%) |
| Information | 3,011 (65.9%) | 1,557 (34.1%) |
| Finance & Insurance | 5,915 (45.1%) | 7,193 (54.9%) |
| Real Estate, Rental & Leasing | 2,326 (53.3%) | 2,034 (46.7%) |
| Professional & Scientific | 12,083 (55.9%) | 9,516 (44.1%) |
| Enterprise Management | 176 (43.0%) | 233 (57.0%) |
| Administrative & Support | 6,006 (58.9%) | 4,184 (41.1%) |
| Educational Services | 7,078 (30.5%) | 16,097 (69.5%) |
| Health Care & Social Assistance | 10,189 (23.6%) | 33,049 (76.4%) |
| Arts, Entertainment & Recreation | 2,519 (57.1%) | 1,892 (42.9%) |
| Accommodation & Food Services | 7,650 (47.3%) | 8,527 (52.7%) |
| Public Administration | 7,445 (59.0%) | 5,174 (41.0%) |
| Total | 131,702 (51.3%) | 125,093 (48.7%) |
Education in Camden County
School Enrollment in Camden County
The most common levels of schooling among the 126,664 students in Camden County are high school (27,200 | 21.5%), middle school (27,049 | 21.3%), and elementary school (25,570 | 20.2%).

| School Level | # Students | % Students |
| Nursery / Preschool | 8,180 | 6.5% |
| Kindergarten | 7,072 | 5.6% |
| Elementary School | 25,570 | 20.2% |
| Middle School | 27,049 | 21.3% |
| High School | 27,200 | 21.5% |
| College / Undergraduate | 22,971 | 18.1% |
| Graduate / Professional | 8,622 | 6.8% |
| Total | 126,664 | 100.0% |
School Enrollment by Age by Funding Source in Camden County
Out of a total of 126,664 students who are enrolled in schools in Camden County, 21,153 (16.7%) attend a private institution, while the remaining 105,511 (83.3%) are enrolled in public schools. The age group of 3 to 4 year olds has the highest likelihood of being enrolled in private schools, with 3,164 (48.6% in the age bracket) enrolled. Conversely, the age group of 10 to 14 year olds has the lowest likelihood of being enrolled in a private school, with 29,814 (90.4% in the age bracket) attending a public institution.
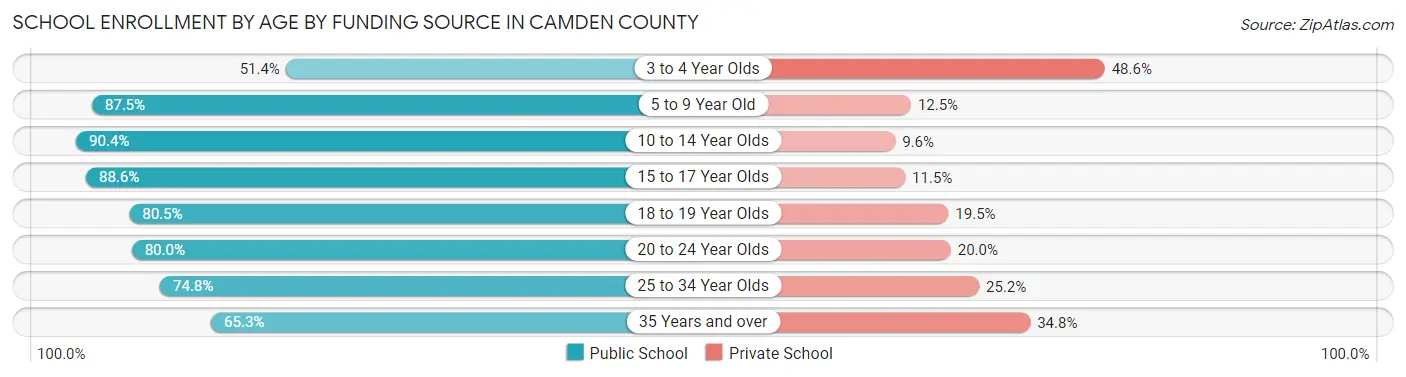
| Age Bracket | Public School | Private School |
| 3 to 4 Year Olds | 3,342 (51.4%) | 3,164 (48.6%) |
| 5 to 9 Year Old | 27,193 (87.5%) | 3,897 (12.5%) |
| 10 to 14 Year Olds | 29,814 (90.4%) | 3,170 (9.6%) |
| 15 to 17 Year Olds | 17,491 (88.5%) | 2,262 (11.5%) |
| 18 to 19 Year Olds | 6,703 (80.5%) | 1,625 (19.5%) |
| 20 to 24 Year Olds | 10,368 (80.0%) | 2,586 (20.0%) |
| 25 to 34 Year Olds | 6,179 (74.8%) | 2,085 (25.2%) |
| 35 Years and over | 4,427 (65.2%) | 2,358 (34.7%) |
| Total | 105,511 (83.3%) | 21,153 (16.7%) |
Educational Attainment by Field of Study in Camden County
Business (25,262 | 18.8%), science & technology (14,268 | 10.6%), education (14,263 | 10.6%), social sciences (10,636 | 7.9%), and psychology (9,535 | 7.1%) are the most common fields of study among 134,298 individuals in Camden County who have obtained a bachelor's degree or higher.
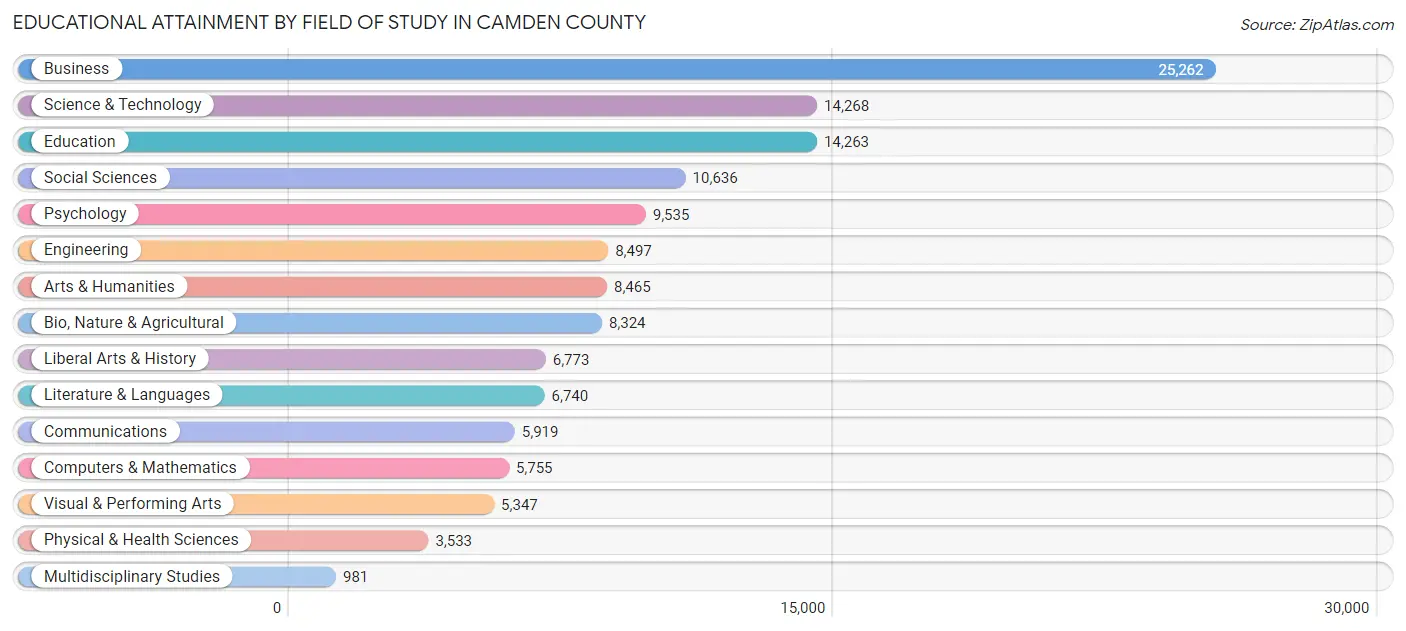
| Field of Study | # Graduates | % Graduates |
| Computers & Mathematics | 5,755 | 4.3% |
| Bio, Nature & Agricultural | 8,324 | 6.2% |
| Physical & Health Sciences | 3,533 | 2.6% |
| Psychology | 9,535 | 7.1% |
| Social Sciences | 10,636 | 7.9% |
| Engineering | 8,497 | 6.3% |
| Multidisciplinary Studies | 981 | 0.7% |
| Science & Technology | 14,268 | 10.6% |
| Business | 25,262 | 18.8% |
| Education | 14,263 | 10.6% |
| Literature & Languages | 6,740 | 5.0% |
| Liberal Arts & History | 6,773 | 5.0% |
| Visual & Performing Arts | 5,347 | 4.0% |
| Communications | 5,919 | 4.4% |
| Arts & Humanities | 8,465 | 6.3% |
| Total | 134,298 | 100.0% |
Transportation & Commute in Camden County
Vehicle Availability by Sex in Camden County
The most prevalent vehicle ownership categories in Camden County are males with 2 vehicles (56,616, accounting for 44.0%) and females with 2 vehicles (50,190, making up 46.8%).

| Vehicles Available | Male | Female |
| No Vehicle | 5,994 (4.7%) | 4,723 (3.9%) |
| 1 Vehicle | 25,203 (19.6%) | 29,905 (24.7%) |
| 2 Vehicles | 56,616 (44.0%) | 50,190 (41.5%) |
| 3 Vehicles | 24,973 (19.4%) | 22,719 (18.8%) |
| 4 Vehicles | 11,722 (9.1%) | 10,150 (8.4%) |
| 5 or more Vehicles | 4,243 (3.3%) | 3,357 (2.8%) |
| Total | 128,751 (100.0%) | 121,044 (100.0%) |
Commute Time in Camden County
The most frequently occuring commute durations in Camden County are 20 to 24 minutes (32,086 commuters, 14.5%), 30 to 34 minutes (31,747 commuters, 14.4%), and 15 to 19 minutes (31,369 commuters, 14.2%).
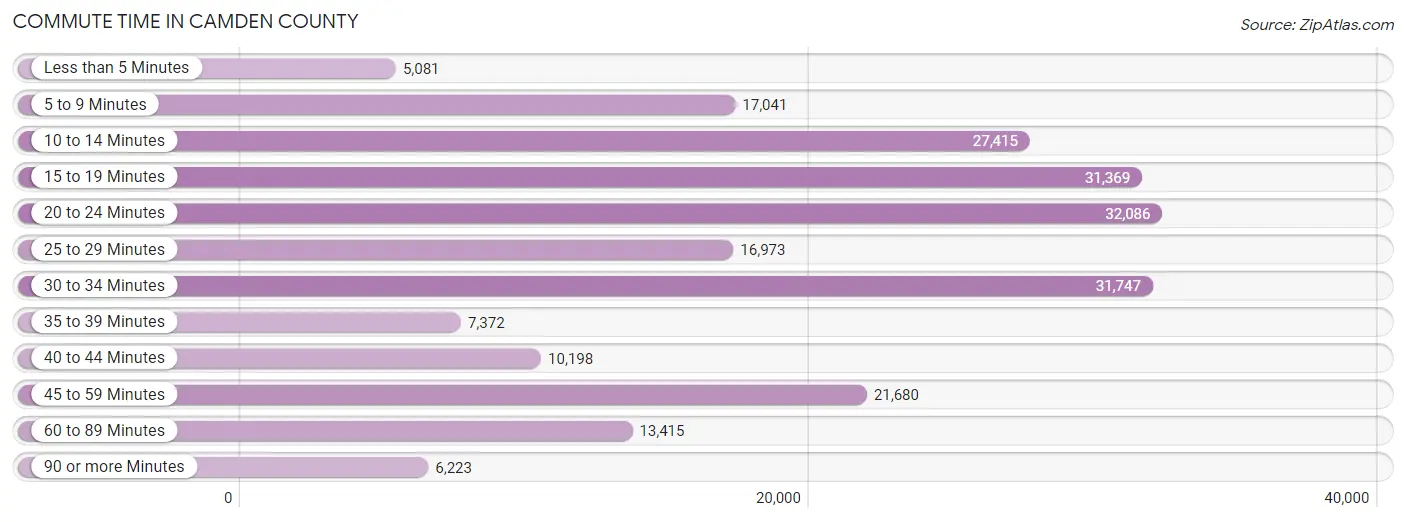
| Commute Time | # Commuters | % Commuters |
| Less than 5 Minutes | 5,081 | 2.3% |
| 5 to 9 Minutes | 17,041 | 7.7% |
| 10 to 14 Minutes | 27,415 | 12.4% |
| 15 to 19 Minutes | 31,369 | 14.2% |
| 20 to 24 Minutes | 32,086 | 14.5% |
| 25 to 29 Minutes | 16,973 | 7.7% |
| 30 to 34 Minutes | 31,747 | 14.4% |
| 35 to 39 Minutes | 7,372 | 3.3% |
| 40 to 44 Minutes | 10,198 | 4.6% |
| 45 to 59 Minutes | 21,680 | 9.8% |
| 60 to 89 Minutes | 13,415 | 6.1% |
| 90 or more Minutes | 6,223 | 2.8% |
Commute Time by Sex in Camden County
The most common commute times in Camden County are 30 to 34 minutes (17,037 commuters, 14.8%) for males and 15 to 19 minutes (16,753 commuters, 15.9%) for females.
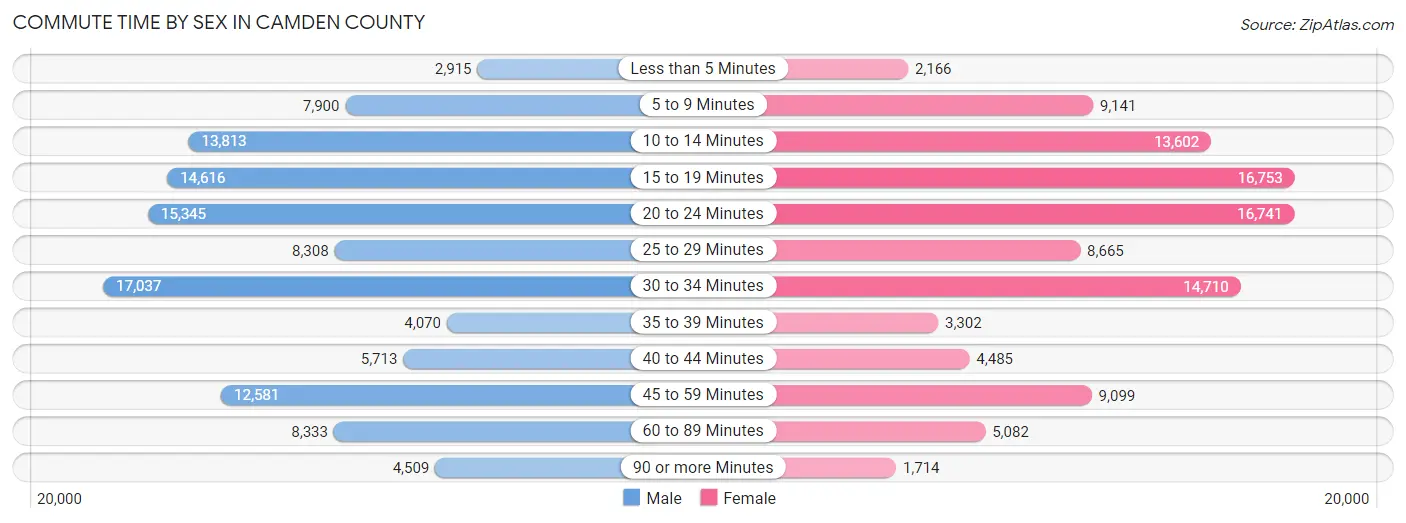
| Commute Time | Male | Female |
| Less than 5 Minutes | 2,915 (2.5%) | 2,166 (2.1%) |
| 5 to 9 Minutes | 7,900 (6.9%) | 9,141 (8.7%) |
| 10 to 14 Minutes | 13,813 (12.0%) | 13,602 (12.9%) |
| 15 to 19 Minutes | 14,616 (12.7%) | 16,753 (15.9%) |
| 20 to 24 Minutes | 15,345 (13.3%) | 16,741 (15.9%) |
| 25 to 29 Minutes | 8,308 (7.2%) | 8,665 (8.2%) |
| 30 to 34 Minutes | 17,037 (14.8%) | 14,710 (14.0%) |
| 35 to 39 Minutes | 4,070 (3.5%) | 3,302 (3.1%) |
| 40 to 44 Minutes | 5,713 (5.0%) | 4,485 (4.3%) |
| 45 to 59 Minutes | 12,581 (10.9%) | 9,099 (8.6%) |
| 60 to 89 Minutes | 8,333 (7.2%) | 5,082 (4.8%) |
| 90 or more Minutes | 4,509 (3.9%) | 1,714 (1.6%) |
Time of Departure to Work by Sex in Camden County
The most frequent times of departure to work in Camden County are 7:00 AM to 7:29 AM (14,546, 12.6%) for males and 8:00 AM to 8:29 AM (16,262, 15.4%) for females.
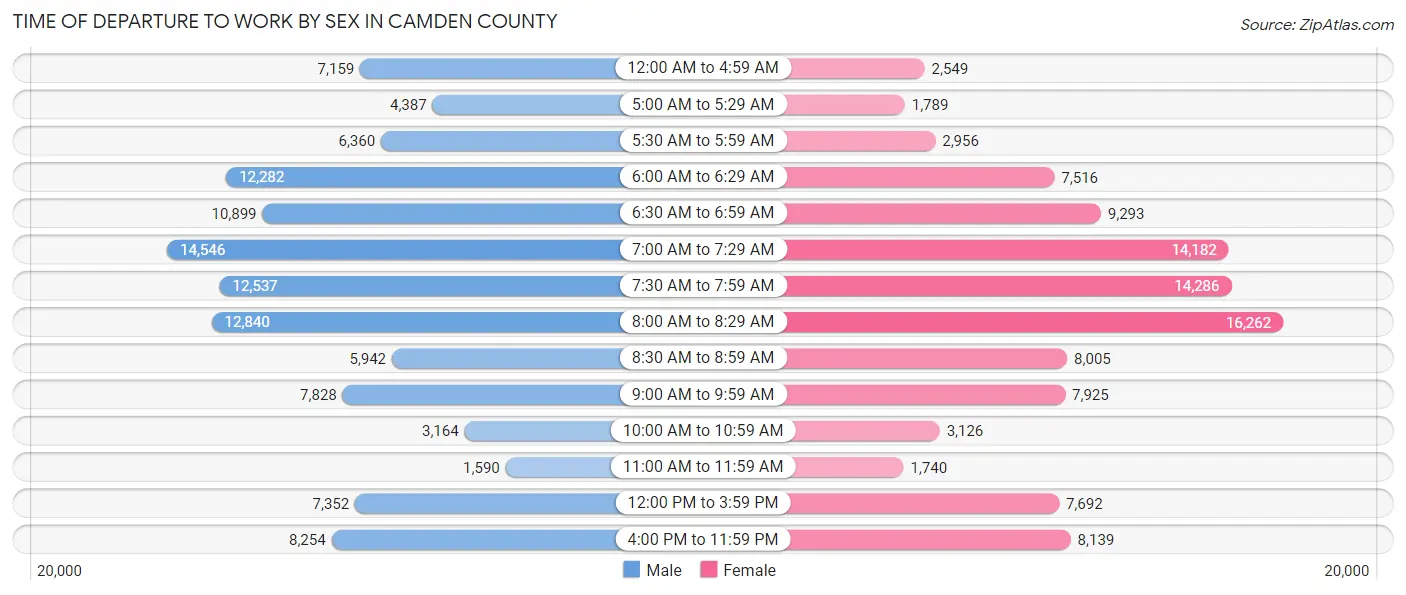
| Time of Departure | Male | Female |
| 12:00 AM to 4:59 AM | 7,159 (6.2%) | 2,549 (2.4%) |
| 5:00 AM to 5:29 AM | 4,387 (3.8%) | 1,789 (1.7%) |
| 5:30 AM to 5:59 AM | 6,360 (5.5%) | 2,956 (2.8%) |
| 6:00 AM to 6:29 AM | 12,282 (10.7%) | 7,516 (7.1%) |
| 6:30 AM to 6:59 AM | 10,899 (9.5%) | 9,293 (8.8%) |
| 7:00 AM to 7:29 AM | 14,546 (12.6%) | 14,182 (13.5%) |
| 7:30 AM to 7:59 AM | 12,537 (10.9%) | 14,286 (13.6%) |
| 8:00 AM to 8:29 AM | 12,840 (11.2%) | 16,262 (15.4%) |
| 8:30 AM to 8:59 AM | 5,942 (5.2%) | 8,005 (7.6%) |
| 9:00 AM to 9:59 AM | 7,828 (6.8%) | 7,925 (7.5%) |
| 10:00 AM to 10:59 AM | 3,164 (2.8%) | 3,126 (3.0%) |
| 11:00 AM to 11:59 AM | 1,590 (1.4%) | 1,740 (1.7%) |
| 12:00 PM to 3:59 PM | 7,352 (6.4%) | 7,692 (7.3%) |
| 4:00 PM to 11:59 PM | 8,254 (7.2%) | 8,139 (7.7%) |
| Total | 115,140 (100.0%) | 105,460 (100.0%) |
Housing Occupancy in Camden County
Occupancy by Ownership in Camden County
Of the total 198,757 dwellings in Camden County, owner-occupied units account for 130,036 (65.4%), while renter-occupied units make up 68,721 (34.6%).
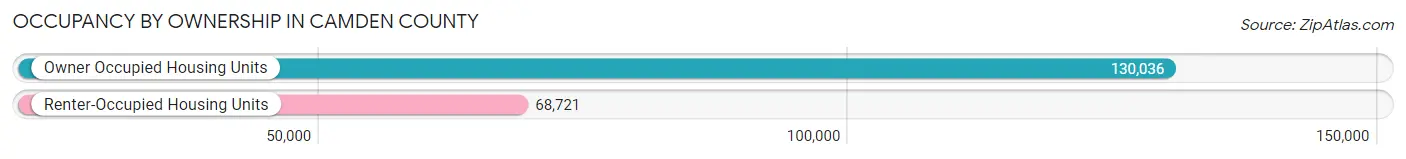
| Occupancy | # Housing Units | % Housing Units |
| Owner Occupied Housing Units | 130,036 | 65.4% |
| Renter-Occupied Housing Units | 68,721 | 34.6% |
| Total Occupied Housing Units | 198,757 | 100.0% |
Occupancy by Household Size in Camden County
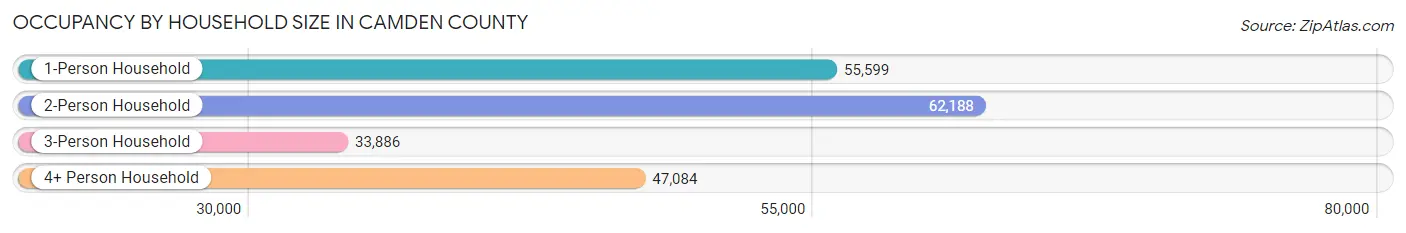
| Household Size | # Housing Units | % Housing Units |
| 1-Person Household | 55,599 | 28.0% |
| 2-Person Household | 62,188 | 31.3% |
| 3-Person Household | 33,886 | 17.1% |
| 4+ Person Household | 47,084 | 23.7% |
| Total Housing Units | 198,757 | 100.0% |
Occupancy by Ownership by Household Size in Camden County
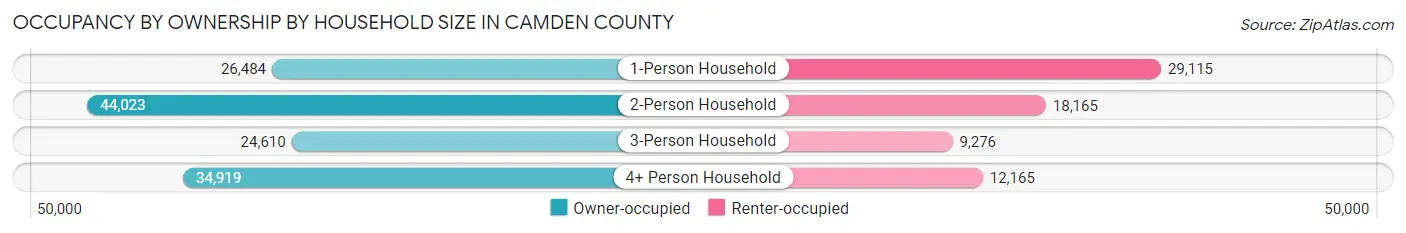
| Household Size | Owner-occupied | Renter-occupied |
| 1-Person Household | 26,484 (47.6%) | 29,115 (52.4%) |
| 2-Person Household | 44,023 (70.8%) | 18,165 (29.2%) |
| 3-Person Household | 24,610 (72.6%) | 9,276 (27.4%) |
| 4+ Person Household | 34,919 (74.2%) | 12,165 (25.8%) |
| Total Housing Units | 130,036 (65.4%) | 68,721 (34.6%) |
Occupancy by Educational Attainment in Camden County

| Household Size | Owner-occupied | Renter-occupied |
| Less than High School | 7,892 (44.4%) | 9,899 (55.6%) |
| High School Diploma | 31,507 (58.2%) | 22,625 (41.8%) |
| College/Associate Degree | 34,036 (62.6%) | 20,332 (37.4%) |
| Bachelor's Degree or higher | 56,601 (78.1%) | 15,865 (21.9%) |
Occupancy by Age of Householder in Camden County
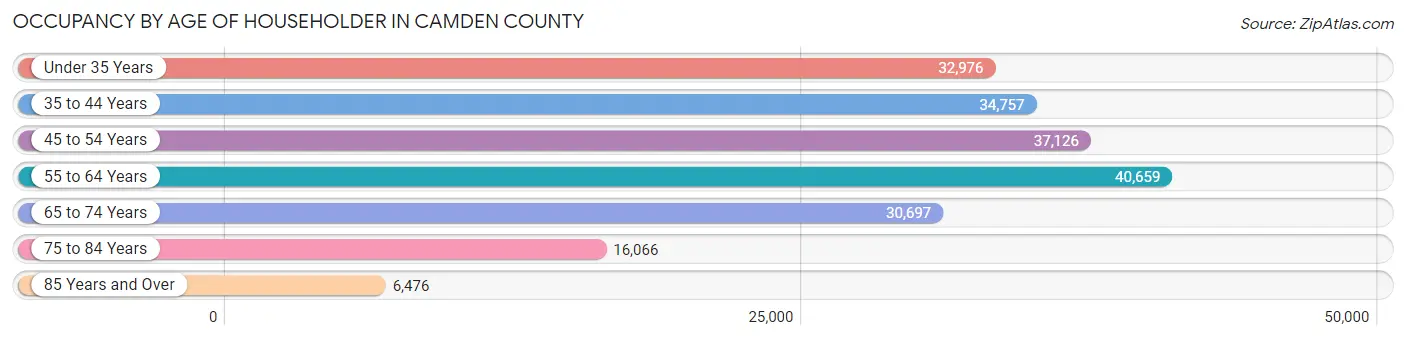
| Age Bracket | # Households | % Households |
| Under 35 Years | 32,976 | 16.6% |
| 35 to 44 Years | 34,757 | 17.5% |
| 45 to 54 Years | 37,126 | 18.7% |
| 55 to 64 Years | 40,659 | 20.5% |
| 65 to 74 Years | 30,697 | 15.4% |
| 75 to 84 Years | 16,066 | 8.1% |
| 85 Years and Over | 6,476 | 3.3% |
| Total | 198,757 | 100.0% |
Housing Finances in Camden County
Median Income by Occupancy in Camden County
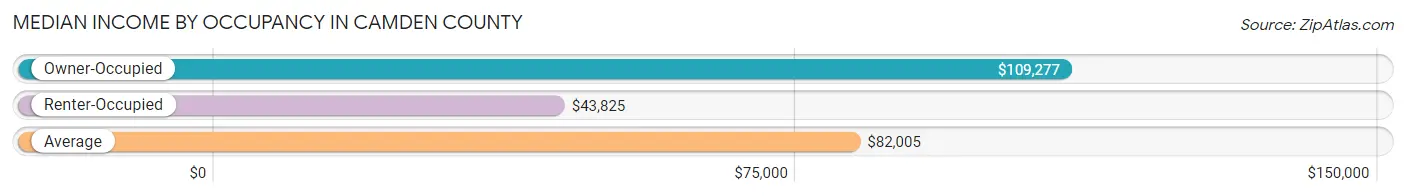
| Occupancy Type | # Households | Median Income |
| Owner-Occupied | 130,036 (65.4%) | $109,277 |
| Renter-Occupied | 68,721 (34.6%) | $43,825 |
| Average | 198,757 (100.0%) | $82,005 |
Occupancy by Householder Income Bracket in Camden County
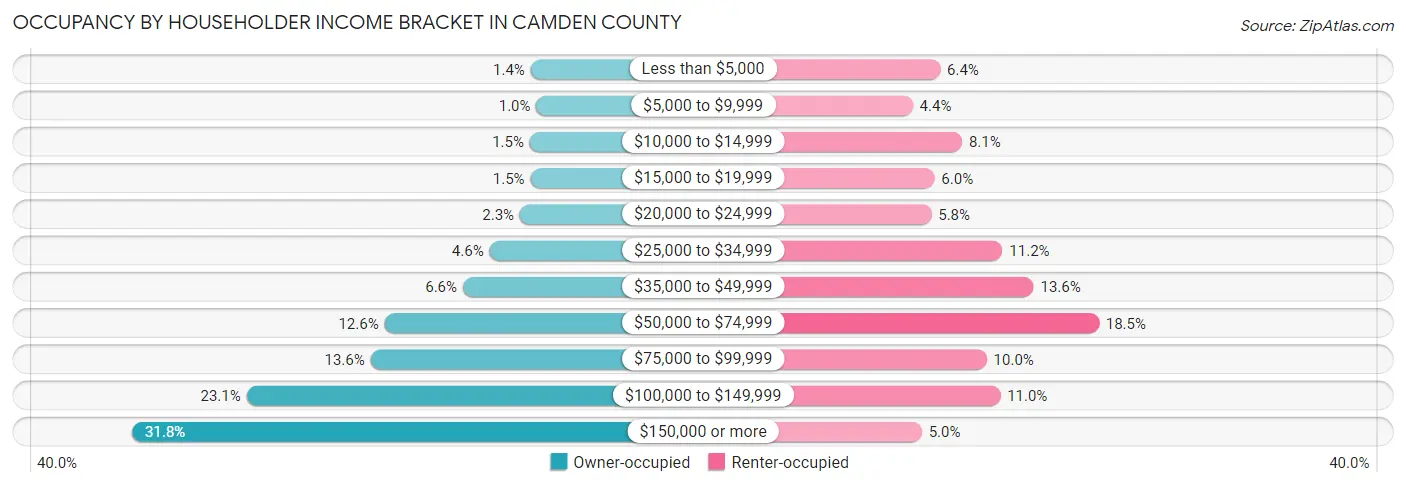
| Income Bracket | Owner-occupied | Renter-occupied |
| Less than $5,000 | 1,874 (1.4%) | 4,428 (6.4%) |
| $5,000 to $9,999 | 1,310 (1.0%) | 2,990 (4.3%) |
| $10,000 to $14,999 | 1,962 (1.5%) | 5,572 (8.1%) |
| $15,000 to $19,999 | 1,905 (1.5%) | 4,132 (6.0%) |
| $20,000 to $24,999 | 2,937 (2.3%) | 3,964 (5.8%) |
| $25,000 to $34,999 | 5,962 (4.6%) | 7,689 (11.2%) |
| $35,000 to $49,999 | 8,594 (6.6%) | 9,316 (13.6%) |
| $50,000 to $74,999 | 16,353 (12.6%) | 12,731 (18.5%) |
| $75,000 to $99,999 | 17,742 (13.6%) | 6,866 (10.0%) |
| $100,000 to $149,999 | 30,023 (23.1%) | 7,572 (11.0%) |
| $150,000 or more | 41,374 (31.8%) | 3,461 (5.0%) |
| Total | 130,036 (100.0%) | 68,721 (100.0%) |
Monthly Housing Cost Tiers in Camden County
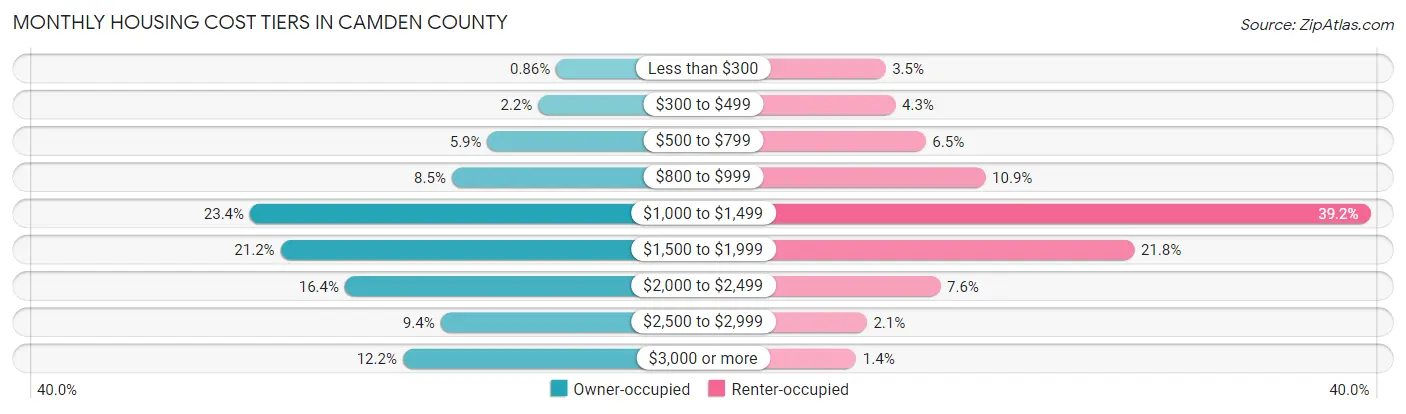
| Monthly Cost | Owner-occupied | Renter-occupied |
| Less than $300 | 1,112 (0.9%) | 2,422 (3.5%) |
| $300 to $499 | 2,840 (2.2%) | 2,923 (4.3%) |
| $500 to $799 | 7,698 (5.9%) | 4,452 (6.5%) |
| $800 to $999 | 11,106 (8.5%) | 7,477 (10.9%) |
| $1,000 to $1,499 | 30,441 (23.4%) | 26,963 (39.2%) |
| $1,500 to $1,999 | 27,511 (21.2%) | 15,012 (21.8%) |
| $2,000 to $2,499 | 21,353 (16.4%) | 5,198 (7.6%) |
| $2,500 to $2,999 | 12,178 (9.4%) | 1,474 (2.1%) |
| $3,000 or more | 15,797 (12.1%) | 936 (1.4%) |
| Total | 130,036 (100.0%) | 68,721 (100.0%) |
Physical Housing Characteristics in Camden County
Housing Structures in Camden County
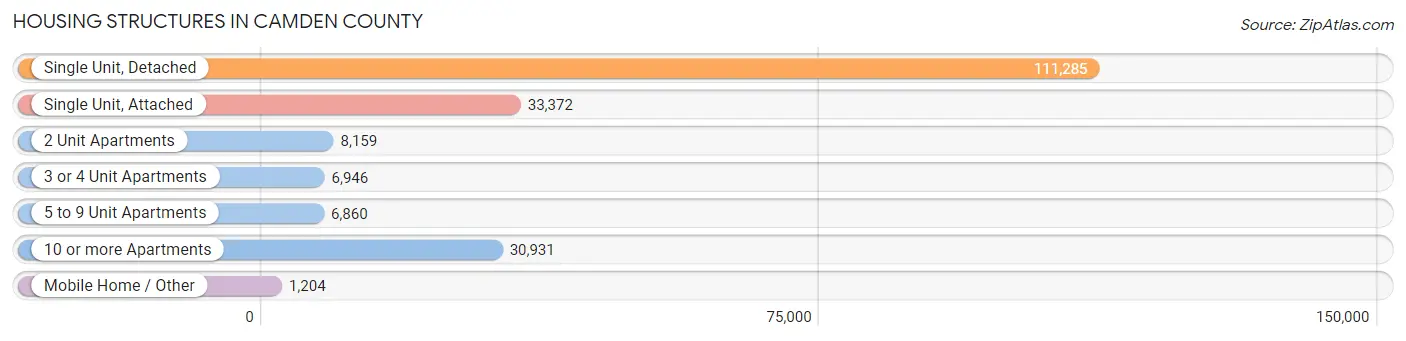
| Structure Type | # Housing Units | % Housing Units |
| Single Unit, Detached | 111,285 | 56.0% |
| Single Unit, Attached | 33,372 | 16.8% |
| 2 Unit Apartments | 8,159 | 4.1% |
| 3 or 4 Unit Apartments | 6,946 | 3.5% |
| 5 to 9 Unit Apartments | 6,860 | 3.5% |
| 10 or more Apartments | 30,931 | 15.6% |
| Mobile Home / Other | 1,204 | 0.6% |
| Total | 198,757 | 100.0% |
Housing Structures by Occupancy in Camden County
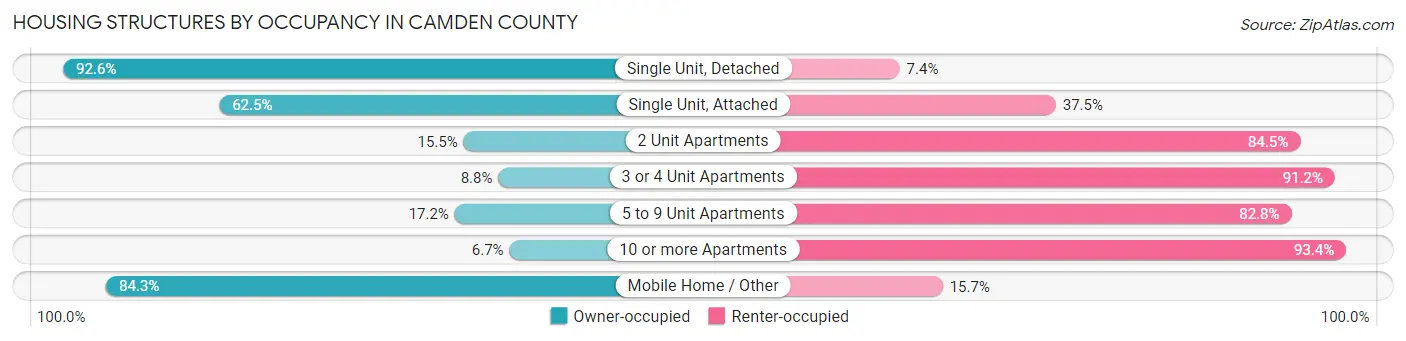
| Structure Type | Owner-occupied | Renter-occupied |
| Single Unit, Detached | 103,040 (92.6%) | 8,245 (7.4%) |
| Single Unit, Attached | 20,869 (62.5%) | 12,503 (37.5%) |
| 2 Unit Apartments | 1,264 (15.5%) | 6,895 (84.5%) |
| 3 or 4 Unit Apartments | 611 (8.8%) | 6,335 (91.2%) |
| 5 to 9 Unit Apartments | 1,179 (17.2%) | 5,681 (82.8%) |
| 10 or more Apartments | 2,058 (6.7%) | 28,873 (93.3%) |
| Mobile Home / Other | 1,015 (84.3%) | 189 (15.7%) |
| Total | 130,036 (65.4%) | 68,721 (34.6%) |
Housing Structures by Number of Rooms in Camden County
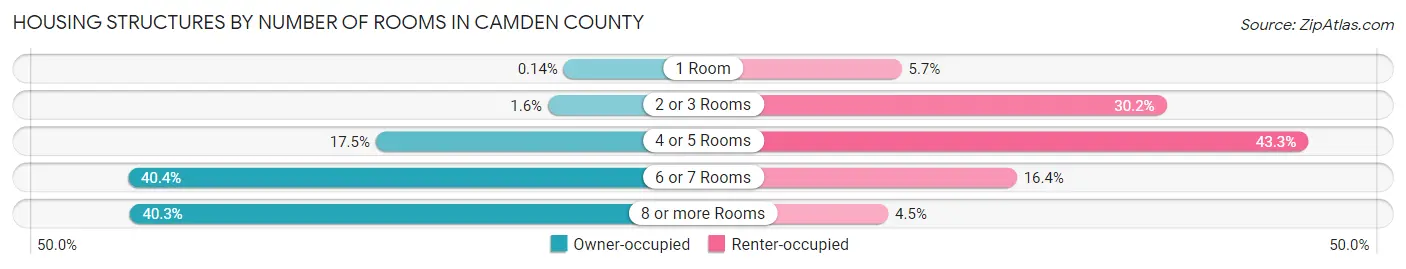
| Number of Rooms | Owner-occupied | Renter-occupied |
| 1 Room | 181 (0.1%) | 3,920 (5.7%) |
| 2 or 3 Rooms | 2,082 (1.6%) | 20,750 (30.2%) |
| 4 or 5 Rooms | 22,787 (17.5%) | 29,749 (43.3%) |
| 6 or 7 Rooms | 52,583 (40.4%) | 11,239 (16.4%) |
| 8 or more Rooms | 52,403 (40.3%) | 3,063 (4.5%) |
| Total | 130,036 (100.0%) | 68,721 (100.0%) |
Housing Structure by Heating Type in Camden County
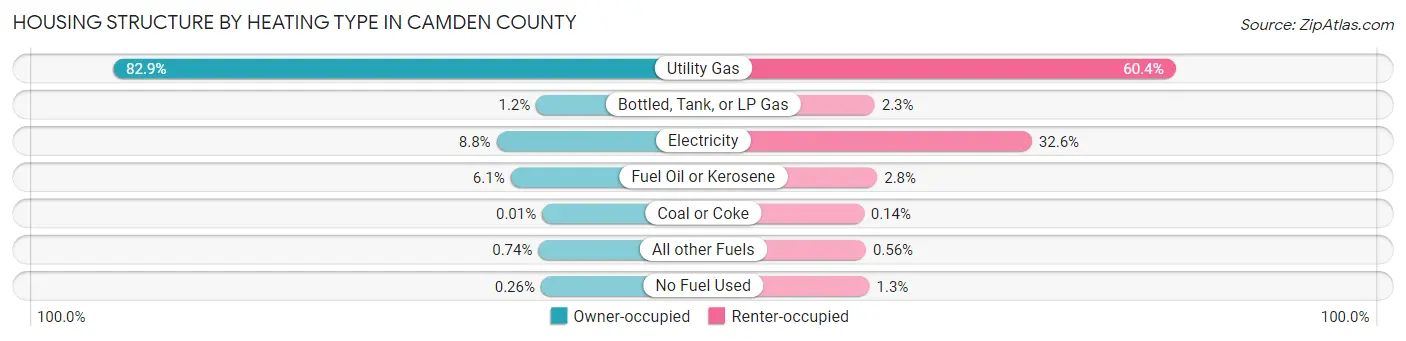
| Heating Type | Owner-occupied | Renter-occupied |
| Utility Gas | 107,790 (82.9%) | 41,489 (60.4%) |
| Bottled, Tank, or LP Gas | 1,509 (1.2%) | 1,560 (2.3%) |
| Electricity | 11,473 (8.8%) | 22,427 (32.6%) |
| Fuel Oil or Kerosene | 7,950 (6.1%) | 1,892 (2.8%) |
| Coal or Coke | 14 (0.0%) | 97 (0.1%) |
| All other Fuels | 968 (0.7%) | 386 (0.6%) |
| No Fuel Used | 332 (0.3%) | 870 (1.3%) |
| Total | 130,036 (100.0%) | 68,721 (100.0%) |
Household Vehicle Usage in Camden County
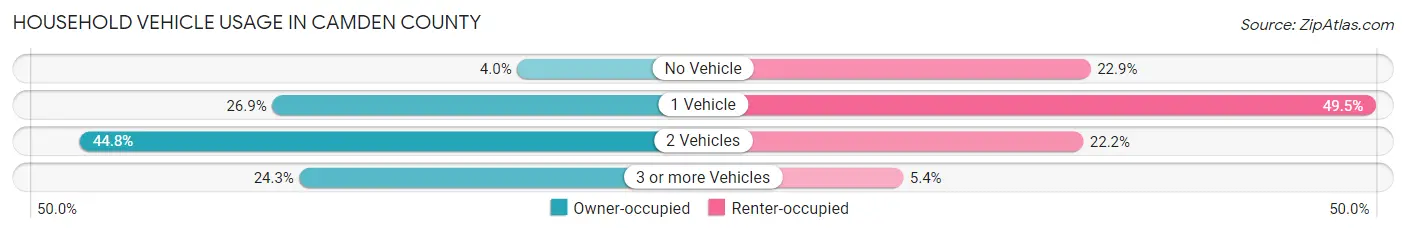
| Vehicles per Household | Owner-occupied | Renter-occupied |
| No Vehicle | 5,194 (4.0%) | 15,734 (22.9%) |
| 1 Vehicle | 34,931 (26.9%) | 34,006 (49.5%) |
| 2 Vehicles | 58,290 (44.8%) | 15,266 (22.2%) |
| 3 or more Vehicles | 31,621 (24.3%) | 3,715 (5.4%) |
| Total | 130,036 (100.0%) | 68,721 (100.0%) |
Real Estate & Mortgages in Camden County
Real Estate and Mortgage Overview in Camden County
| Characteristic | Without Mortgage | With Mortgage |
| Housing Units | 45,586 | 84,450 |
| Median Property Value | $232,700 | $245,500 |
| Median Household Income | $85,990 | $30,330 |
| Monthly Housing Costs | $1,076 | $15,433 |
| Real Estate Taxes | $7,758 | $1,715 |
Property Value by Mortgage Status in Camden County
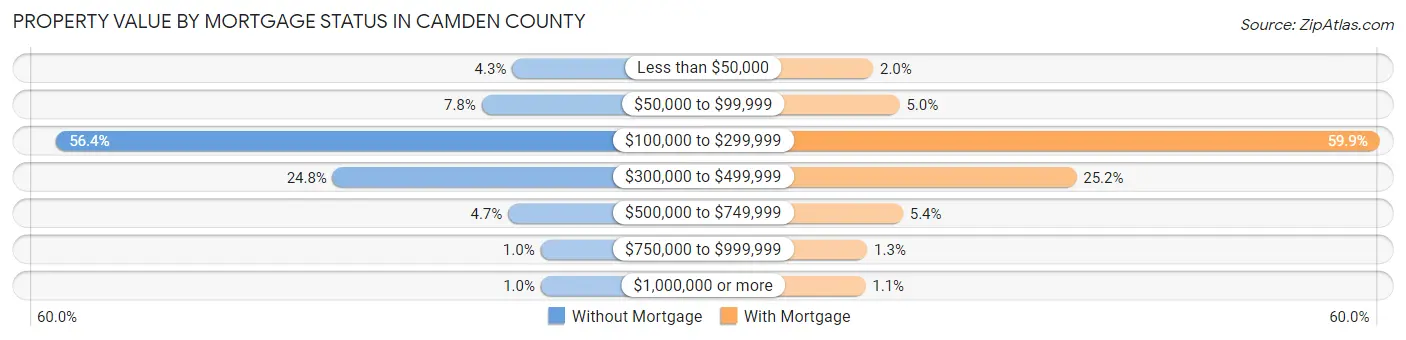
| Property Value | Without Mortgage | With Mortgage |
| Less than $50,000 | 1,945 (4.3%) | 1,691 (2.0%) |
| $50,000 to $99,999 | 3,543 (7.8%) | 4,242 (5.0%) |
| $100,000 to $299,999 | 25,703 (56.4%) | 50,585 (59.9%) |
| $300,000 to $499,999 | 11,301 (24.8%) | 21,304 (25.2%) |
| $500,000 to $749,999 | 2,159 (4.7%) | 4,557 (5.4%) |
| $750,000 to $999,999 | 476 (1.0%) | 1,123 (1.3%) |
| $1,000,000 or more | 459 (1.0%) | 948 (1.1%) |
| Total | 45,586 (100.0%) | 84,450 (100.0%) |
Household Income by Mortgage Status in Camden County
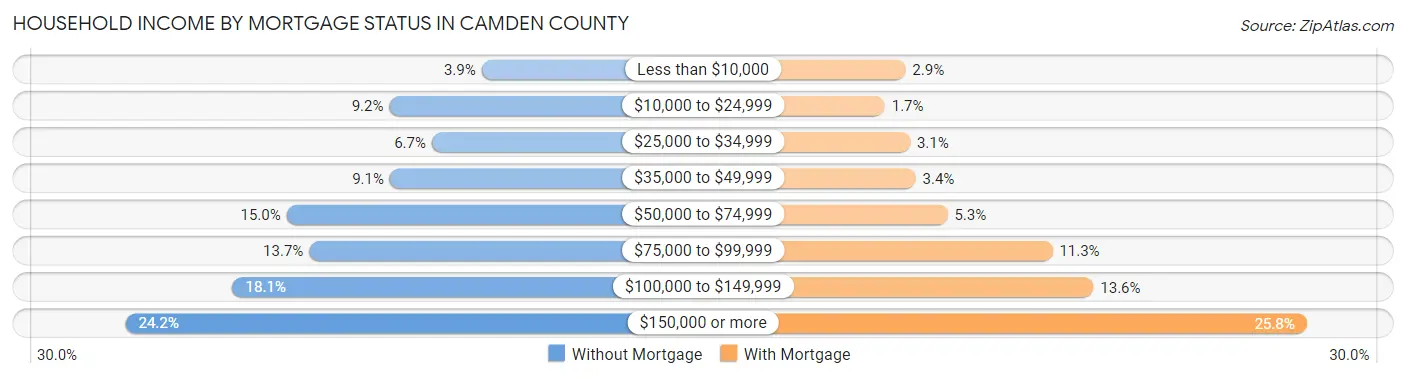
| Household Income | Without Mortgage | With Mortgage |
| Less than $10,000 | 1,772 (3.9%) | 2,411 (2.9%) |
| $10,000 to $24,999 | 4,174 (9.2%) | 1,412 (1.7%) |
| $25,000 to $34,999 | 3,068 (6.7%) | 2,630 (3.1%) |
| $35,000 to $49,999 | 4,161 (9.1%) | 2,894 (3.4%) |
| $50,000 to $74,999 | 6,851 (15.0%) | 4,433 (5.2%) |
| $75,000 to $99,999 | 6,262 (13.7%) | 9,502 (11.3%) |
| $100,000 to $149,999 | 8,254 (18.1%) | 11,480 (13.6%) |
| $150,000 or more | 11,044 (24.2%) | 21,769 (25.8%) |
| Total | 45,586 (100.0%) | 84,450 (100.0%) |
Property Value to Household Income Ratio in Camden County
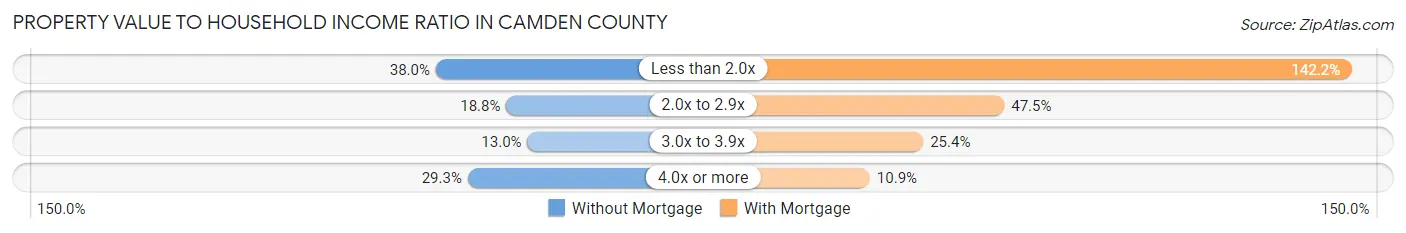
| Value-to-Income Ratio | Without Mortgage | With Mortgage |
| Less than 2.0x | 17,318 (38.0%) | 120,117 (142.2%) |
| 2.0x to 2.9x | 8,558 (18.8%) | 40,112 (47.5%) |
| 3.0x to 3.9x | 5,940 (13.0%) | 21,465 (25.4%) |
| 4.0x or more | 13,349 (29.3%) | 9,195 (10.9%) |
| Total | 45,586 (100.0%) | 84,450 (100.0%) |
Real Estate Taxes by Mortgage Status in Camden County

| Property Taxes | Without Mortgage | With Mortgage |
| Less than $800 | 938 (2.1%) | 233 (0.3%) |
| $800 to $1,499 | 1,220 (2.7%) | 1,256 (1.5%) |
| $800 to $1,499 | 41,425 (90.9%) | 1,338 (1.6%) |
| Total | 45,586 (100.0%) | 84,450 (100.0%) |
Health & Disability in Camden County
Health Insurance Coverage by Age in Camden County
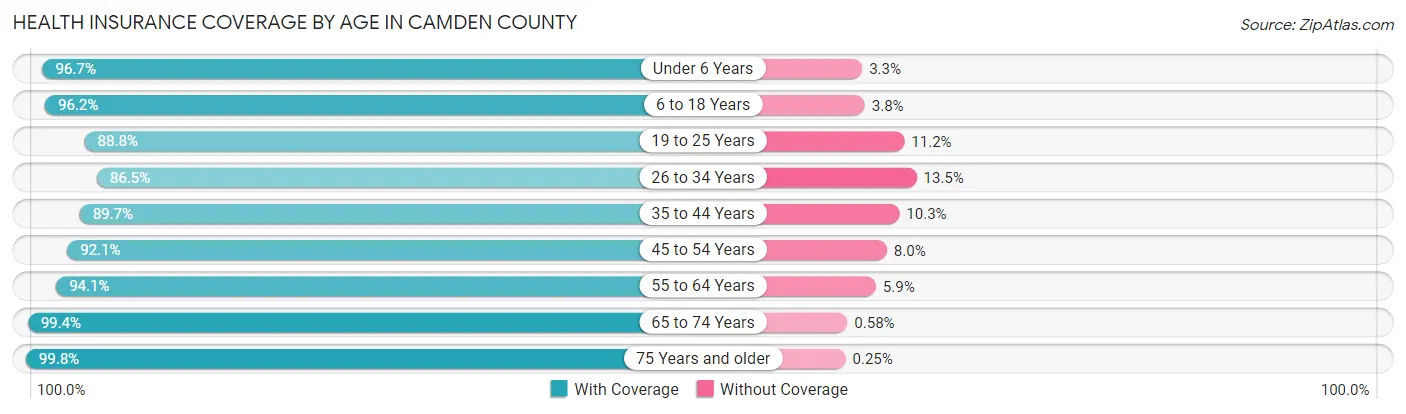
| Age Bracket | With Coverage | Without Coverage |
| Under 6 Years | 36,236 (96.7%) | 1,251 (3.3%) |
| 6 to 18 Years | 83,491 (96.2%) | 3,326 (3.8%) |
| 19 to 25 Years | 38,913 (88.8%) | 4,915 (11.2%) |
| 26 to 34 Years | 55,808 (86.5%) | 8,696 (13.5%) |
| 35 to 44 Years | 60,905 (89.7%) | 6,976 (10.3%) |
| 45 to 54 Years | 61,478 (92.0%) | 5,308 (8.0%) |
| 55 to 64 Years | 64,898 (94.1%) | 4,072 (5.9%) |
| 65 to 74 Years | 47,857 (99.4%) | 281 (0.6%) |
| 75 Years and older | 32,862 (99.8%) | 81 (0.3%) |
| Total | 482,448 (93.2%) | 34,906 (6.8%) |
Health Insurance Coverage by Citizenship Status in Camden County
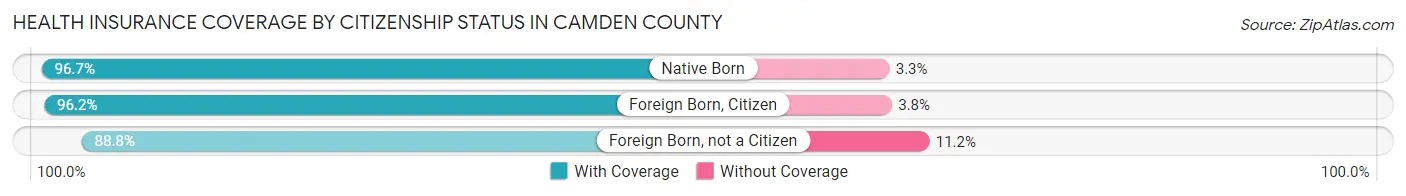
| Citizenship Status | With Coverage | Without Coverage |
| Native Born | 36,236 (96.7%) | 1,251 (3.3%) |
| Foreign Born, Citizen | 83,491 (96.2%) | 3,326 (3.8%) |
| Foreign Born, not a Citizen | 38,913 (88.8%) | 4,915 (11.2%) |
Health Insurance Coverage by Household Income in Camden County
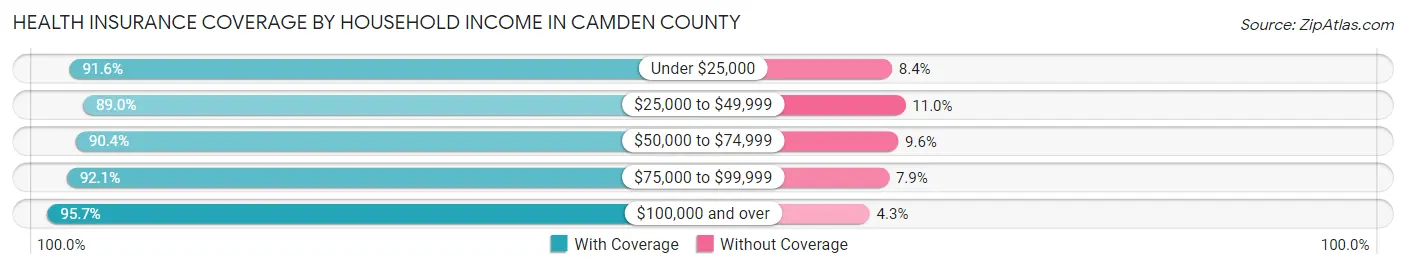
| Household Income | With Coverage | Without Coverage |
| Under $25,000 | 50,298 (91.6%) | 4,635 (8.4%) |
| $25,000 to $49,999 | 59,603 (89.0%) | 7,341 (11.0%) |
| $50,000 to $74,999 | 61,686 (90.4%) | 6,555 (9.6%) |
| $75,000 to $99,999 | 57,724 (92.1%) | 4,950 (7.9%) |
| $100,000 and over | 251,320 (95.7%) | 11,236 (4.3%) |
Public vs Private Health Insurance Coverage by Age in Camden County
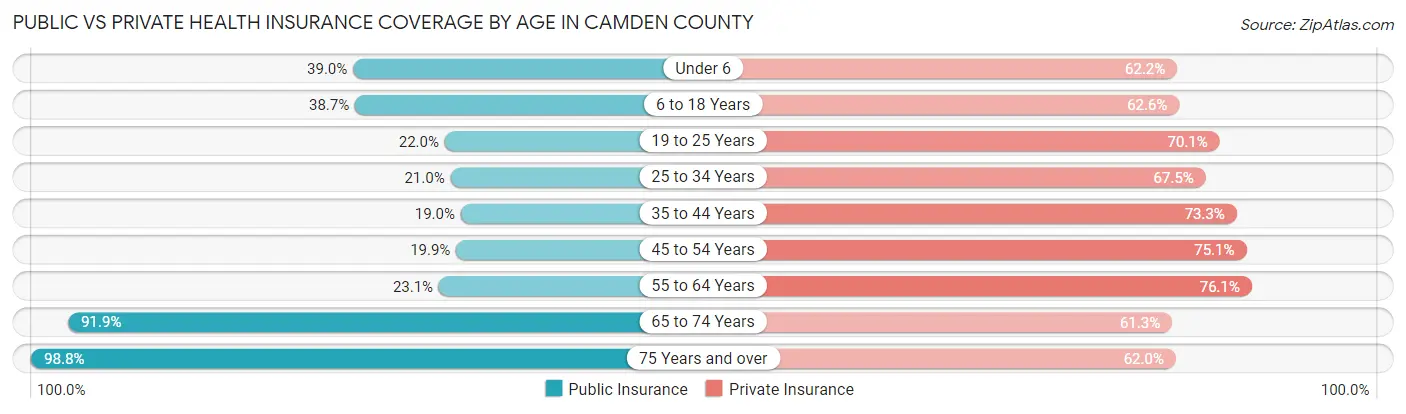
| Age Bracket | Public Insurance | Private Insurance |
| Under 6 | 14,629 (39.0%) | 23,329 (62.2%) |
| 6 to 18 Years | 33,576 (38.7%) | 54,362 (62.6%) |
| 19 to 25 Years | 9,642 (22.0%) | 30,731 (70.1%) |
| 25 to 34 Years | 13,514 (20.9%) | 43,559 (67.5%) |
| 35 to 44 Years | 12,927 (19.0%) | 49,753 (73.3%) |
| 45 to 54 Years | 13,286 (19.9%) | 50,150 (75.1%) |
| 55 to 64 Years | 15,926 (23.1%) | 52,480 (76.1%) |
| 65 to 74 Years | 44,256 (91.9%) | 29,500 (61.3%) |
| 75 Years and over | 32,540 (98.8%) | 20,418 (62.0%) |
| Total | 190,296 (36.8%) | 354,282 (68.5%) |
Disability Status by Sex by Age in Camden County
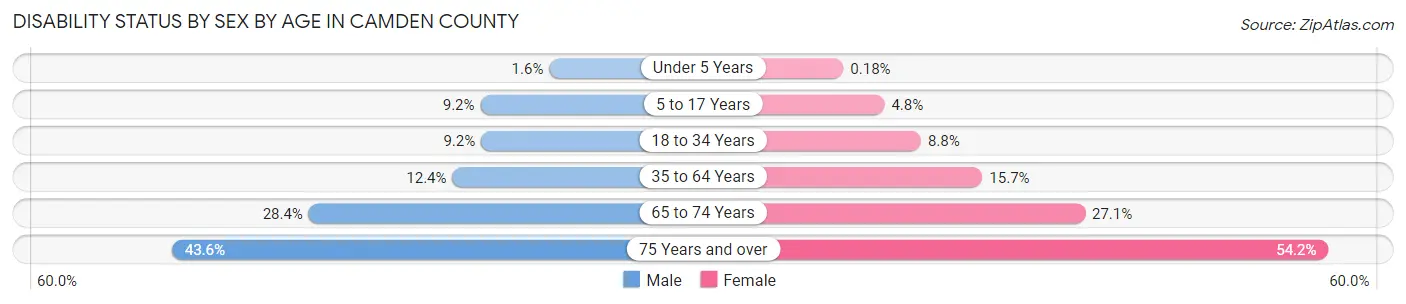
| Age Bracket | Male | Female |
| Under 5 Years | 249 (1.6%) | 27 (0.2%) |
| 5 to 17 Years | 4,123 (9.2%) | 2,026 (4.8%) |
| 18 to 34 Years | 5,198 (9.2%) | 5,080 (8.8%) |
| 35 to 64 Years | 12,155 (12.4%) | 16,479 (15.7%) |
| 65 to 74 Years | 6,200 (28.4%) | 7,118 (27.1%) |
| 75 Years and over | 5,713 (43.6%) | 10,750 (54.2%) |
Disability Class by Sex by Age in Camden County
Disability Class: Hearing Difficulty
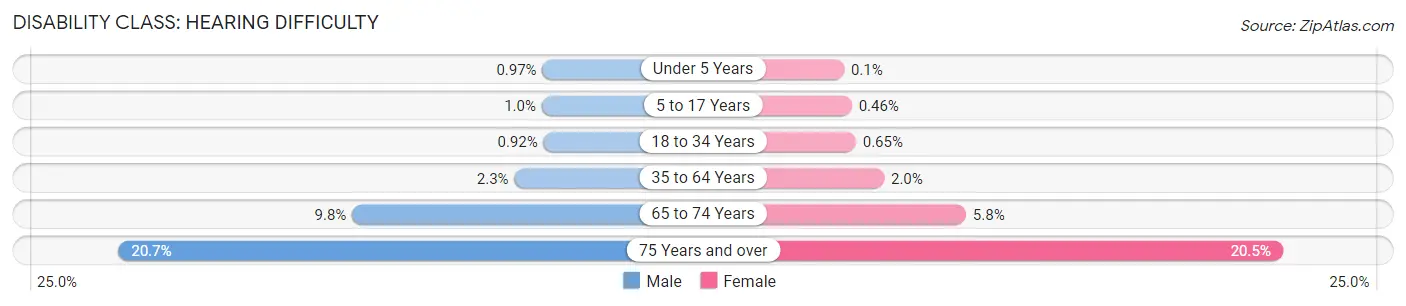
| Age Bracket | Male | Female |
| Under 5 Years | 154 (1.0%) | 15 (0.1%) |
| 5 to 17 Years | 444 (1.0%) | 198 (0.5%) |
| 18 to 34 Years | 520 (0.9%) | 376 (0.6%) |
| 35 to 64 Years | 2,232 (2.3%) | 2,058 (2.0%) |
| 65 to 74 Years | 2,143 (9.8%) | 1,514 (5.8%) |
| 75 Years and over | 2,706 (20.6%) | 4,059 (20.5%) |
Disability Class: Vision Difficulty
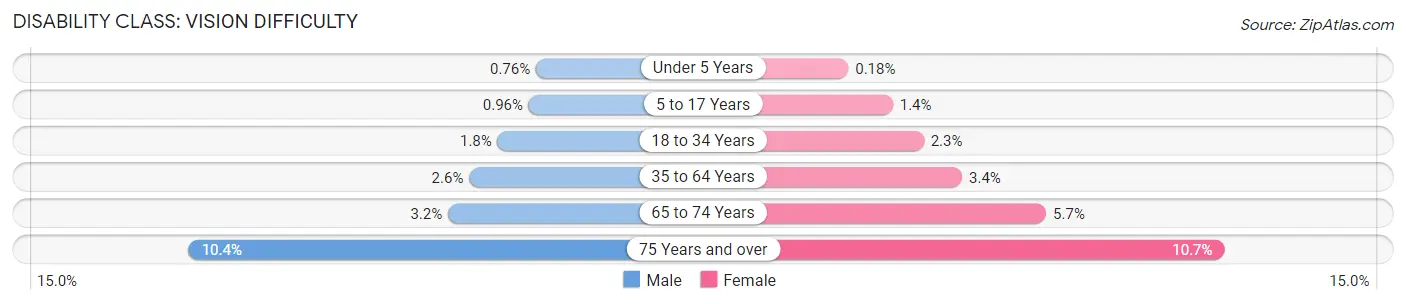
| Age Bracket | Male | Female |
| Under 5 Years | 121 (0.8%) | 27 (0.2%) |
| 5 to 17 Years | 428 (1.0%) | 606 (1.4%) |
| 18 to 34 Years | 1,038 (1.8%) | 1,316 (2.3%) |
| 35 to 64 Years | 2,576 (2.6%) | 3,524 (3.4%) |
| 65 to 74 Years | 702 (3.2%) | 1,495 (5.7%) |
| 75 Years and over | 1,366 (10.4%) | 2,113 (10.6%) |
Disability Class: Cognitive Difficulty
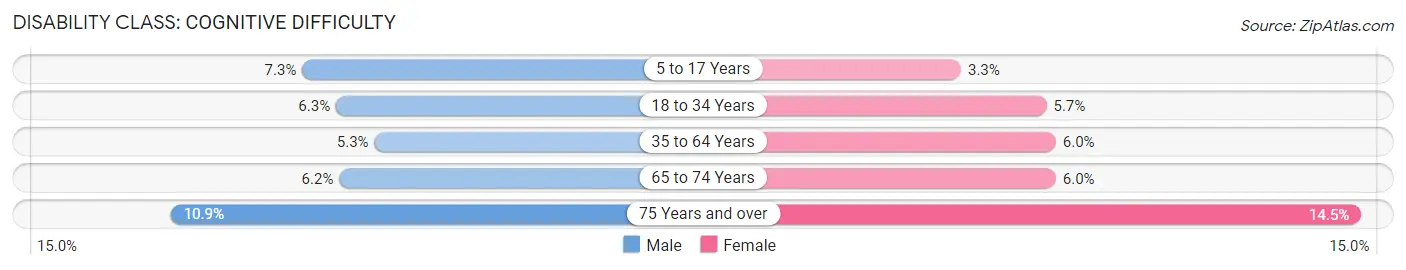
| Age Bracket | Male | Female |
| 5 to 17 Years | 3,245 (7.3%) | 1,417 (3.3%) |
| 18 to 34 Years | 3,591 (6.3%) | 3,286 (5.7%) |
| 35 to 64 Years | 5,177 (5.3%) | 6,277 (6.0%) |
| 65 to 74 Years | 1,365 (6.2%) | 1,565 (6.0%) |
| 75 Years and over | 1,432 (10.9%) | 2,868 (14.5%) |
Disability Class: Ambulatory Difficulty
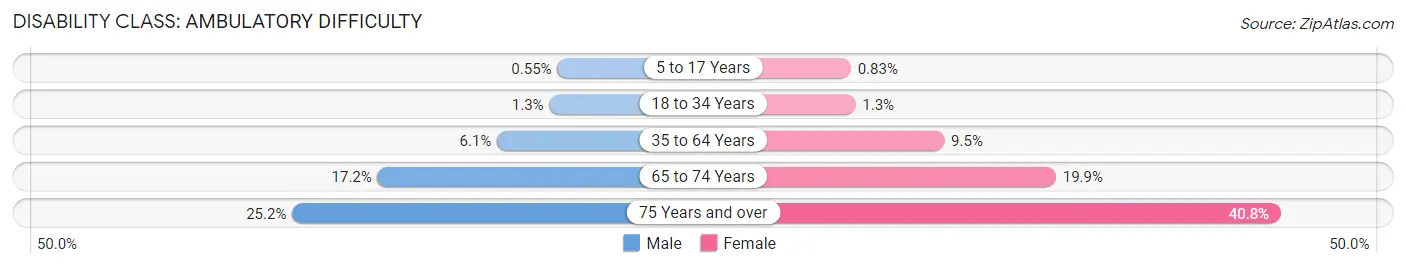
| Age Bracket | Male | Female |
| 5 to 17 Years | 244 (0.5%) | 356 (0.8%) |
| 18 to 34 Years | 734 (1.3%) | 724 (1.3%) |
| 35 to 64 Years | 6,045 (6.1%) | 10,000 (9.5%) |
| 65 to 74 Years | 3,769 (17.2%) | 5,218 (19.9%) |
| 75 Years and over | 3,297 (25.2%) | 8,084 (40.7%) |
Disability Class: Self-Care Difficulty
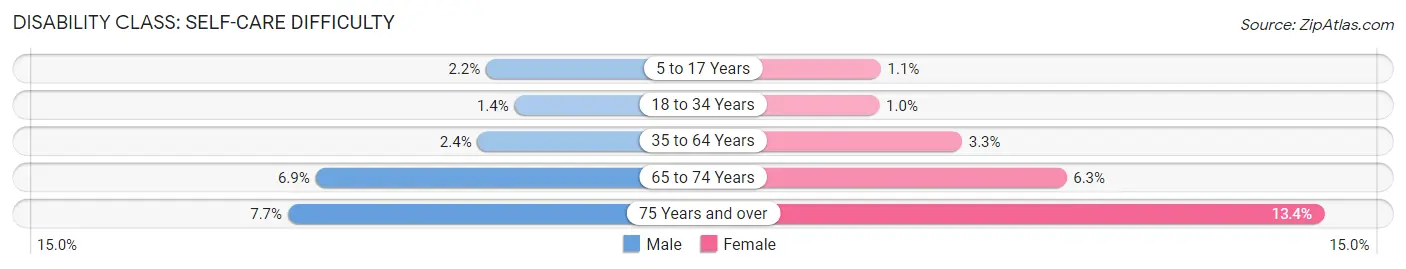
| Age Bracket | Male | Female |
| 5 to 17 Years | 959 (2.1%) | 462 (1.1%) |
| 18 to 34 Years | 769 (1.4%) | 599 (1.0%) |
| 35 to 64 Years | 2,348 (2.4%) | 3,519 (3.3%) |
| 65 to 74 Years | 1,508 (6.9%) | 1,642 (6.2%) |
| 75 Years and over | 1,005 (7.7%) | 2,662 (13.4%) |
Technology Access in Camden County
Computing Device Access in Camden County

| Device Type | # Households | % Households |
| Desktop or Laptop | 158,814 | 79.9% |
| Smartphone | 173,271 | 87.2% |
| Tablet | 130,959 | 65.9% |
| No Computing Device | 12,459 | 6.3% |
| Total | 198,757 | 100.0% |
Internet Access in Camden County
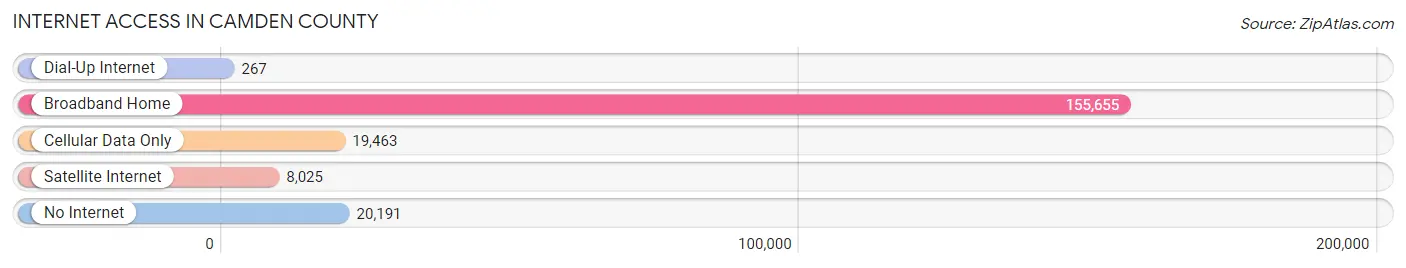
| Internet Type | # Households | % Households |
| Dial-Up Internet | 267 | 0.1% |
| Broadband Home | 155,655 | 78.3% |
| Cellular Data Only | 19,463 | 9.8% |
| Satellite Internet | 8,025 | 4.0% |
| No Internet | 20,191 | 10.2% |
| Total | 198,757 | 100.0% |
Camden County Summary
Camden County, New Jersey is located in the southern part of the state, just across the Delaware River from Philadelphia, Pennsylvania. It is the eighth most populous county in the state, with a population of 513,657 as of the 2010 census. The county seat is Camden, the county's largest city. Camden County is part of the Delaware Valley region, and is home to a diverse population of people from all walks of life.
Geography
Camden County is located in the southern part of New Jersey, and is bordered by Burlington County to the north, Gloucester County to the south, and Philadelphia County, Pennsylvania to the east. The county is situated on the Atlantic Coastal Plain, and is characterized by flat terrain and low hills. The highest point in the county is located in the Pine Barrens, at an elevation of just over 200 feet. The county is home to a number of rivers and streams, including the Cooper River, the Delaware River, and the Rancocas Creek.
Economy
Camden County has a diverse economy, with a mix of manufacturing, retail, and service industries. The county is home to a number of large corporations, including Campbell Soup Company, Subaru of America, and Lockheed Martin. The county is also home to a number of smaller businesses, including restaurants, retail stores, and professional services. The county is also home to a number of educational institutions, including Rutgers University, Camden County College, and Rowan University.
Demographics
As of the 2010 census, Camden County had a population of 513,657. The population was spread out, with 24.3% under the age of 18, 10.3% from 18 to 24, 28.2% from 25 to 44, 24.7% from 45 to 64, and 12.5% who were 65 years of age or older. The median age was 36.4 years. The racial makeup of the county was 64.2% White, 25.3% African American, 0.3% Native American, 3.2% Asian, 0.1% Pacific Islander, 4.7% from other races, and 2.2% from two or more races. Hispanic or Latino of any race were 11.2% of the population.
The median income for a household in the county was $50,867, and the median income for a family was $62,817. The per capita income for the county was $25,867. About 11.2% of families and 14.3% of the population were below the poverty line, including 19.7% of those under age 18 and 8.7% of those age 65 or over.
Camden County is a diverse and vibrant community, with a mix of cultures, backgrounds, and lifestyles. The county is home to a number of large corporations, educational institutions, and small businesses, and is a great place to live, work, and play.
Common Questions
What is the Total Population of Camden County?
Total Population of Camden County is 522,581.
What is the Total Male Population of Camden County?
Total Male Population of Camden County is 253,604.
What is the Total Female Population of Camden County?
Total Female Population of Camden County is 268,977.
What is the Ratio of Males per 100 Females in Camden County?
There are 94.28 Males per 100 Females in Camden County.
What is the Ratio of Females per 100 Males in Camden County?
There are 106.06 Females per 100 Males in Camden County.
What is the Median Population Age in Camden County?
Median Population Age in Camden County is 38.7 Years.
What is the Average Family Size in Camden County
Average Family Size in Camden County is 3.2 People.
What is the Average Household Size in Camden County
Average Household Size in Camden County is 2.6 People.
What is Per Capita Income in Camden County?
Per Capita income in Camden County is $42,398.
What is the Median Family Income in Camden County?
Median Family Income in Camden County is $102,893.
What is the Median Household income in Camden County?
Median Household Income in Camden County is $82,005.
What is Income or Wage Gap in Camden County?
Income or Wage Gap in Camden County is 23.9%.
Women in Camden County earn 76.1 cents for every dollar earned by a man.
What is Family Income Deficit in Camden County?
Family Income Deficit in Camden County is $10,293.
Families that are below poverty line in Camden County earn $10,293 less on average than the poverty threshold level.
What is Inequality or Gini Index in Camden County?
Inequality or Gini Index in Camden County is 0.47.
How Large is the Labor Force in Camden County?
There are 277,424 People in the Labor Forcein in Camden County.
What is the Percentage of People in the Labor Force in Camden County?
66.4% of People are in the Labor Force in Camden County.
What is the Unemployment Rate in Camden County?
Unemployment Rate in Camden County is 7.2%.