Burlington County, NJ
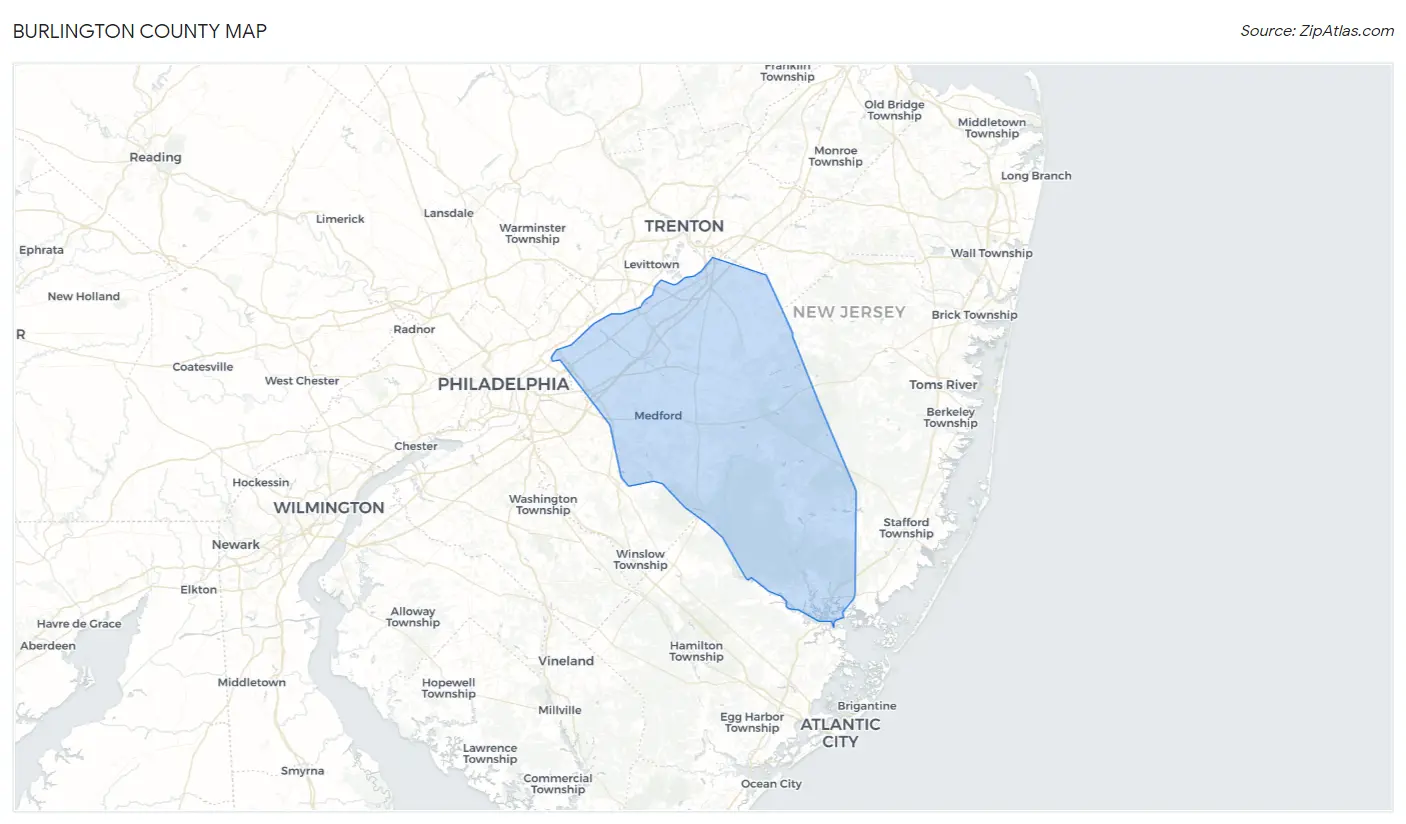
Burlington County Map
Burlington County Overview
461,853
TOTAL POPULATION
228,468
MALE POPULATION
233,385
FEMALE POPULATION
97.89
MALES / 100 FEMALES
102.15
FEMALES / 100 MALES
41.7
MEDIAN AGE
3.1
AVG FAMILY SIZE
2.6
AVG HOUSEHOLD SIZE
$51,549
PER CAPITA INCOME
$122,708
AVG FAMILY INCOME
$102,615
AVG HOUSEHOLD INCOME
26.1%
WAGE / INCOME GAP [ % ]
73.9¢/ $1
WAGE / INCOME GAP [ $ ]
$11,375
FAMILY INCOME DEFICIT
0.44
INEQUALITY / GINI INDEX
251,863
LABOR FORCE [ PEOPLE ]
66.5%
PERCENT IN LABOR FORCE
5.1%
UNEMPLOYMENT RATE
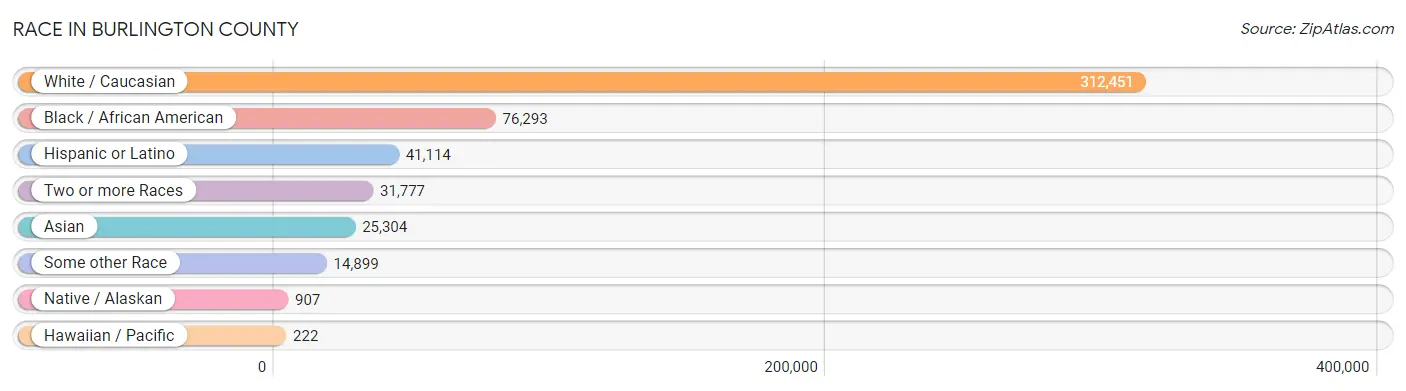
Race in Burlington County
The most populous races in Burlington County are White / Caucasian (312,451 | 67.6%), Black / African American (76,293 | 16.5%), and Hispanic or Latino (41,114 | 8.9%).
| Race | # Population | % Population |
| Asian | 25,304 | 5.5% |
| Black / African American | 76,293 | 16.5% |
| Hawaiian / Pacific | 222 | 0.1% |
| Hispanic or Latino | 41,114 | 8.9% |
| Native / Alaskan | 907 | 0.2% |
| White / Caucasian | 312,451 | 67.6% |
| Two or more Races | 31,777 | 6.9% |
| Some other Race | 14,899 | 3.2% |
| Total | 461,853 | 100.0% |
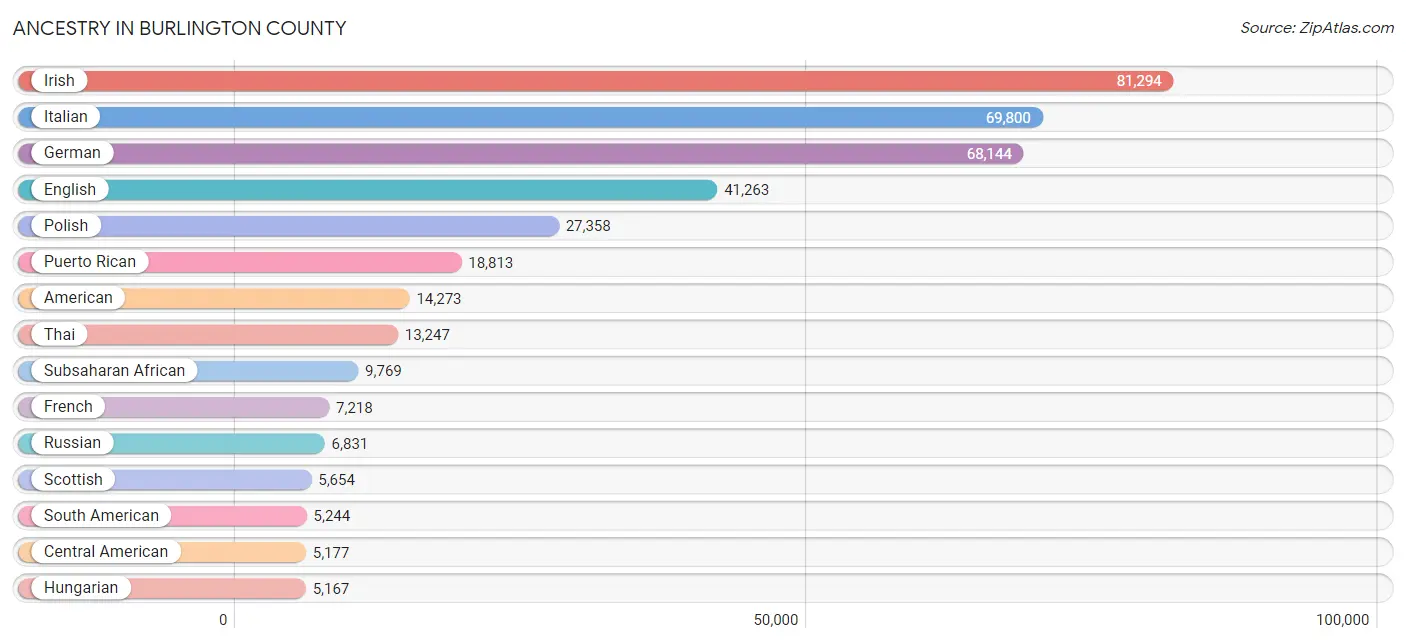
Ancestry in Burlington County
The most populous ancestries reported in Burlington County are Irish (81,294 | 17.6%), Italian (69,800 | 15.1%), German (68,144 | 14.7%), English (41,263 | 8.9%), and Polish (27,358 | 5.9%), together accounting for 62.3% of all Burlington County residents.
| Ancestry | # Population | % Population |
| Afghan | 58 | 0.0% |
| African | 3,462 | 0.7% |
| Albanian | 261 | 0.1% |
| Alsatian | 10 | 0.0% |
| American | 14,273 | 3.1% |
| Apache | 50 | 0.0% |
| Arab | 2,239 | 0.5% |
| Argentinean | 342 | 0.1% |
| Armenian | 633 | 0.1% |
| Australian | 11 | 0.0% |
| Austrian | 1,338 | 0.3% |
| Bangladeshi | 9 | 0.0% |
| Barbadian | 244 | 0.1% |
| Belgian | 246 | 0.1% |
| Bermudan | 105 | 0.0% |
| Bhutanese | 1,741 | 0.4% |
| Blackfeet | 258 | 0.1% |
| Bolivian | 304 | 0.1% |
| Brazilian | 2,311 | 0.5% |
| British | 1,804 | 0.4% |
| British West Indian | 309 | 0.1% |
| Bulgarian | 44 | 0.0% |
| Burmese | 3,722 | 0.8% |
| Cajun | 14 | 0.0% |
| Cambodian | 17 | 0.0% |
| Canadian | 527 | 0.1% |
| Cape Verdean | 56 | 0.0% |
| Carpatho Rusyn | 27 | 0.0% |
| Celtic | 127 | 0.0% |
| Central American | 5,177 | 1.1% |
| Central American Indian | 804 | 0.2% |
| Cherokee | 1,239 | 0.3% |
| Chickasaw | 6 | 0.0% |
| Chilean | 144 | 0.0% |
| Chinese | 153 | 0.0% |
| Chippewa | 43 | 0.0% |
| Choctaw | 35 | 0.0% |
| Colombian | 1,411 | 0.3% |
| Costa Rican | 670 | 0.2% |
| Cree | 40 | 0.0% |
| Creek | 24 | 0.0% |
| Croatian | 385 | 0.1% |
| Cuban | 1,368 | 0.3% |
| Cypriot | 15 | 0.0% |
| Czech | 1,417 | 0.3% |
| Czechoslovakian | 570 | 0.1% |
| Danish | 811 | 0.2% |
| Delaware | 93 | 0.0% |
| Dominican | 2,878 | 0.6% |
| Dutch | 3,822 | 0.8% |
| Dutch West Indian | 16 | 0.0% |
| Eastern European | 2,422 | 0.5% |
| Ecuadorian | 1,948 | 0.4% |
| Egyptian | 1,212 | 0.3% |
| English | 41,263 | 8.9% |
| Estonian | 70 | 0.0% |
| Ethiopian | 77 | 0.0% |
| European | 5,133 | 1.1% |
| Filipino | 443 | 0.1% |
| Finnish | 295 | 0.1% |
| French | 7,218 | 1.6% |
| French American Indian | 19 | 0.0% |
| French Canadian | 1,254 | 0.3% |
| German | 68,144 | 14.7% |
| German Russian | 72 | 0.0% |
| Ghanaian | 470 | 0.1% |
| Greek | 2,511 | 0.5% |
| Guamanian / Chamorro | 187 | 0.0% |
| Guatemalan | 1,530 | 0.3% |
| Guyanese | 890 | 0.2% |
| Haitian | 1,940 | 0.4% |
| Honduran | 1,132 | 0.3% |
| Hungarian | 5,167 | 1.1% |
| Icelander | 31 | 0.0% |
| Indian (Asian) | 3,581 | 0.8% |
| Indonesian | 226 | 0.1% |
| Iranian | 135 | 0.0% |
| Iraqi | 48 | 0.0% |
| Irish | 81,294 | 17.6% |
| Iroquois | 76 | 0.0% |
| Israeli | 127 | 0.0% |
| Italian | 69,800 | 15.1% |
| Jamaican | 2,760 | 0.6% |
| Japanese | 158 | 0.0% |
| Jordanian | 95 | 0.0% |
| Kenyan | 470 | 0.1% |
| Korean | 4,136 | 0.9% |
| Laotian | 103 | 0.0% |
| Latvian | 219 | 0.1% |
| Lebanese | 270 | 0.1% |
| Liberian | 1,816 | 0.4% |
| Lithuanian | 1,809 | 0.4% |
| Lumbee | 55 | 0.0% |
| Macedonian | 47 | 0.0% |
| Malaysian | 56 | 0.0% |
| Maltese | 45 | 0.0% |
| Mexican | 4,339 | 0.9% |
| Mexican American Indian | 110 | 0.0% |
| Mongolian | 19 | 0.0% |
| Moroccan | 145 | 0.0% |
| Native Hawaiian | 253 | 0.1% |
| Navajo | 68 | 0.0% |
| New Zealander | 18 | 0.0% |
| Nicaraguan | 421 | 0.1% |
| Nigerian | 2,545 | 0.5% |
| Northern European | 375 | 0.1% |
| Norwegian | 2,505 | 0.5% |
| Okinawan | 14 | 0.0% |
| Pakistani | 409 | 0.1% |
| Palestinian | 66 | 0.0% |
| Panamanian | 643 | 0.1% |
| Pennsylvania German | 571 | 0.1% |
| Peruvian | 847 | 0.2% |
| Polish | 27,358 | 5.9% |
| Portuguese | 2,023 | 0.4% |
| Puerto Rican | 18,813 | 4.1% |
| Romanian | 1,080 | 0.2% |
| Russian | 6,831 | 1.5% |
| Salvadoran | 781 | 0.2% |
| Samoan | 41 | 0.0% |
| Scandinavian | 797 | 0.2% |
| Scotch-Irish | 2,438 | 0.5% |
| Scottish | 5,654 | 1.2% |
| Seminole | 6 | 0.0% |
| Senegalese | 143 | 0.0% |
| Serbian | 257 | 0.1% |
| Shoshone | 1 | 0.0% |
| Sierra Leonean | 106 | 0.0% |
| Sioux | 67 | 0.0% |
| Slavic | 579 | 0.1% |
| Slovak | 2,176 | 0.5% |
| Slovene | 98 | 0.0% |
| South African | 48 | 0.0% |
| South American | 5,244 | 1.1% |
| South American Indian | 183 | 0.0% |
| Spaniard | 674 | 0.2% |
| Spanish | 642 | 0.1% |
| Spanish American Indian | 4 | 0.0% |
| Sri Lankan | 1,334 | 0.3% |
| Subsaharan African | 9,769 | 2.1% |
| Swedish | 2,506 | 0.5% |
| Swiss | 467 | 0.1% |
| Syrian | 60 | 0.0% |
| Thai | 13,247 | 2.9% |
| Trinidadian and Tobagonian | 1,523 | 0.3% |
| Turkish | 3,259 | 0.7% |
| Ukrainian | 2,979 | 0.6% |
| Uruguayan | 57 | 0.0% |
| Venezuelan | 191 | 0.0% |
| Vietnamese | 214 | 0.1% |
| Welsh | 3,274 | 0.7% |
| West Indian | 1,049 | 0.2% |
| Yaqui | 3 | 0.0% |
| Yugoslavian | 234 | 0.1% |
| Zimbabwean | 147 | 0.0% | View All 155 Rows |
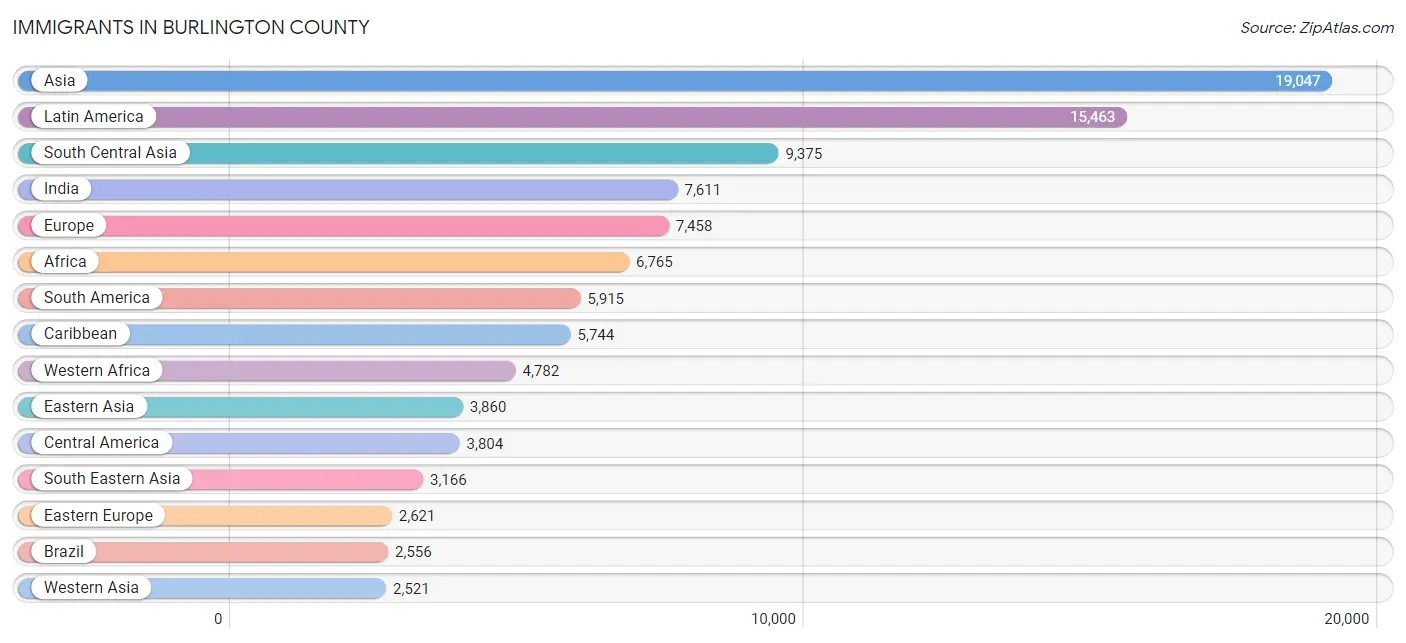
Immigrants in Burlington County
The most numerous immigrant groups reported in Burlington County came from Asia (19,047 | 4.1%), Latin America (15,463 | 3.4%), South Central Asia (9,375 | 2.0%), India (7,611 | 1.7%), and Europe (7,458 | 1.6%), together accounting for 12.8% of all Burlington County residents.
| Immigration Origin | # Population | % Population |
| Afghanistan | 58 | 0.0% |
| Africa | 6,765 | 1.5% |
| Albania | 83 | 0.0% |
| Argentina | 170 | 0.0% |
| Armenia | 21 | 0.0% |
| Asia | 19,047 | 4.1% |
| Australia | 44 | 0.0% |
| Austria | 102 | 0.0% |
| Bangladesh | 470 | 0.1% |
| Barbados | 242 | 0.1% |
| Belarus | 96 | 0.0% |
| Belgium | 20 | 0.0% |
| Belize | 32 | 0.0% |
| Bolivia | 108 | 0.0% |
| Bosnia and Herzegovina | 30 | 0.0% |
| Brazil | 2,556 | 0.5% |
| Bulgaria | 24 | 0.0% |
| Cambodia | 97 | 0.0% |
| Canada | 557 | 0.1% |
| Caribbean | 5,744 | 1.2% |
| Central America | 3,804 | 0.8% |
| Chile | 123 | 0.0% |
| China | 1,996 | 0.4% |
| Colombia | 721 | 0.2% |
| Congo | 3 | 0.0% |
| Costa Rica | 387 | 0.1% |
| Croatia | 107 | 0.0% |
| Cuba | 489 | 0.1% |
| Czechoslovakia | 57 | 0.0% |
| Denmark | 8 | 0.0% |
| Dominica | 100 | 0.0% |
| Dominican Republic | 1,151 | 0.3% |
| Eastern Africa | 644 | 0.1% |
| Eastern Asia | 3,860 | 0.8% |
| Eastern Europe | 2,621 | 0.6% |
| Ecuador | 1,077 | 0.2% |
| Egypt | 746 | 0.2% |
| El Salvador | 290 | 0.1% |
| England | 590 | 0.1% |
| Ethiopia | 68 | 0.0% |
| Europe | 7,458 | 1.6% |
| France | 249 | 0.1% |
| Germany | 1,045 | 0.2% |
| Ghana | 643 | 0.1% |
| Greece | 165 | 0.0% |
| Grenada | 68 | 0.0% |
| Guatemala | 621 | 0.1% |
| Guyana | 522 | 0.1% |
| Haiti | 1,152 | 0.3% |
| Honduras | 651 | 0.1% |
| Hong Kong | 211 | 0.1% |
| Hungary | 131 | 0.0% |
| India | 7,611 | 1.7% |
| Indonesia | 68 | 0.0% |
| Iran | 97 | 0.0% |
| Iraq | 48 | 0.0% |
| Ireland | 158 | 0.0% |
| Israel | 45 | 0.0% |
| Italy | 1,160 | 0.3% |
| Jamaica | 1,691 | 0.4% |
| Japan | 394 | 0.1% |
| Jordan | 27 | 0.0% |
| Kazakhstan | 49 | 0.0% |
| Kenya | 455 | 0.1% |
| Korea | 1,470 | 0.3% |
| Laos | 35 | 0.0% |
| Latin America | 15,463 | 3.4% |
| Latvia | 4 | 0.0% |
| Lebanon | 66 | 0.0% |
| Liberia | 2,061 | 0.4% |
| Lithuania | 8 | 0.0% |
| Malaysia | 73 | 0.0% |
| Mexico | 1,278 | 0.3% |
| Middle Africa | 3 | 0.0% |
| Morocco | 71 | 0.0% |
| Netherlands | 80 | 0.0% |
| Nicaragua | 141 | 0.0% |
| Nigeria | 1,465 | 0.3% |
| North Macedonia | 23 | 0.0% |
| Northern Africa | 873 | 0.2% |
| Northern Europe | 1,576 | 0.3% |
| Norway | 28 | 0.0% |
| Oceania | 62 | 0.0% |
| Pakistan | 830 | 0.2% |
| Panama | 404 | 0.1% |
| Peru | 570 | 0.1% |
| Philippines | 1,866 | 0.4% |
| Poland | 969 | 0.2% |
| Portugal | 350 | 0.1% |
| Romania | 248 | 0.1% |
| Russia | 307 | 0.1% |
| Saudi Arabia | 35 | 0.0% |
| Scotland | 156 | 0.0% |
| Senegal | 69 | 0.0% |
| Serbia | 106 | 0.0% |
| Sierra Leone | 199 | 0.0% |
| Singapore | 27 | 0.0% |
| South Africa | 66 | 0.0% |
| South America | 5,915 | 1.3% |
| South Central Asia | 9,375 | 2.0% |
| South Eastern Asia | 3,166 | 0.7% |
| Southern Europe | 1,720 | 0.4% |
| Spain | 33 | 0.0% |
| Sri Lanka | 109 | 0.0% |
| Sudan | 43 | 0.0% |
| Switzerland | 29 | 0.0% |
| Syria | 46 | 0.0% |
| Taiwan | 366 | 0.1% |
| Thailand | 121 | 0.0% |
| Trinidad and Tobago | 651 | 0.1% |
| Turkey | 2,050 | 0.4% |
| Uganda | 8 | 0.0% |
| Ukraine | 319 | 0.1% |
| Uzbekistan | 115 | 0.0% |
| Venezuela | 67 | 0.0% |
| Vietnam | 680 | 0.2% |
| West Indies | 3 | 0.0% |
| Western Africa | 4,782 | 1.0% |
| Western Asia | 2,521 | 0.5% |
| Western Europe | 1,525 | 0.3% |
| Yemen | 133 | 0.0% |
| Zimbabwe | 66 | 0.0% | View All 122 Rows |
Sex and Age in Burlington County
Sex and Age in Burlington County
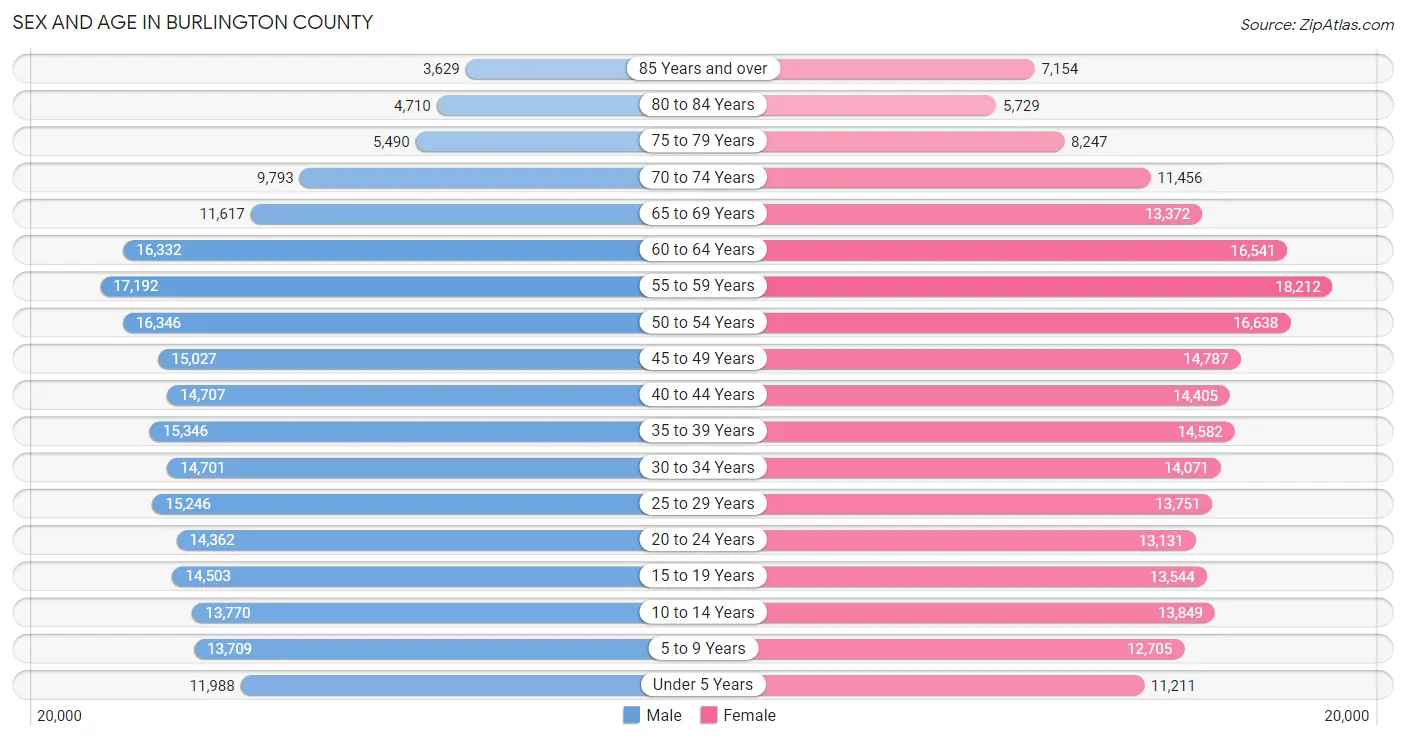
The most populous age groups in Burlington County are 55 to 59 Years (17,192 | 7.5%) for men and 55 to 59 Years (18,212 | 7.8%) for women.
| Age Bracket | Male | Female |
| Under 5 Years | 11,988 (5.2%) | 11,211 (4.8%) |
| 5 to 9 Years | 13,709 (6.0%) | 12,705 (5.4%) |
| 10 to 14 Years | 13,770 (6.0%) | 13,849 (5.9%) |
| 15 to 19 Years | 14,503 (6.4%) | 13,544 (5.8%) |
| 20 to 24 Years | 14,362 (6.3%) | 13,131 (5.6%) |
| 25 to 29 Years | 15,246 (6.7%) | 13,751 (5.9%) |
| 30 to 34 Years | 14,701 (6.4%) | 14,071 (6.0%) |
| 35 to 39 Years | 15,346 (6.7%) | 14,582 (6.2%) |
| 40 to 44 Years | 14,707 (6.4%) | 14,405 (6.2%) |
| 45 to 49 Years | 15,027 (6.6%) | 14,787 (6.3%) |
| 50 to 54 Years | 16,346 (7.1%) | 16,638 (7.1%) |
| 55 to 59 Years | 17,192 (7.5%) | 18,212 (7.8%) |
| 60 to 64 Years | 16,332 (7.1%) | 16,541 (7.1%) |
| 65 to 69 Years | 11,617 (5.1%) | 13,372 (5.7%) |
| 70 to 74 Years | 9,793 (4.3%) | 11,456 (4.9%) |
| 75 to 79 Years | 5,490 (2.4%) | 8,247 (3.5%) |
| 80 to 84 Years | 4,710 (2.1%) | 5,729 (2.5%) |
| 85 Years and over | 3,629 (1.6%) | 7,154 (3.1%) |
| Total | 228,468 (100.0%) | 233,385 (100.0%) |
Families and Households in Burlington County
Median Family Size in Burlington County
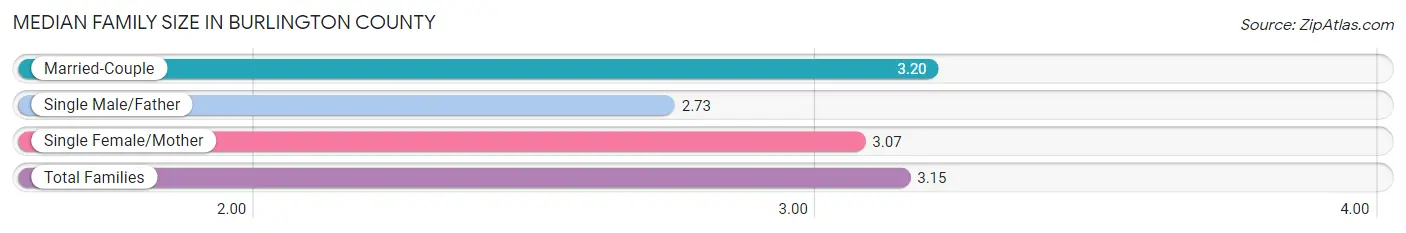
The median family size in Burlington County is 3.15 persons per family, with married-couple families (93,134 | 77.5%) accounting for the largest median family size of 3.2 persons per family. On the other hand, single male/father families (7,273 | 6.0%) represent the smallest median family size with 2.73 persons per family.
| Family Type | # Families | Family Size |
| Married-Couple | 93,134 (77.5%) | 3.20 |
| Single Male/Father | 7,273 (6.0%) | 2.73 |
| Single Female/Mother | 19,751 (16.4%) | 3.07 |
| Total Families | 120,158 (100.0%) | 3.15 |
Median Household Size in Burlington County
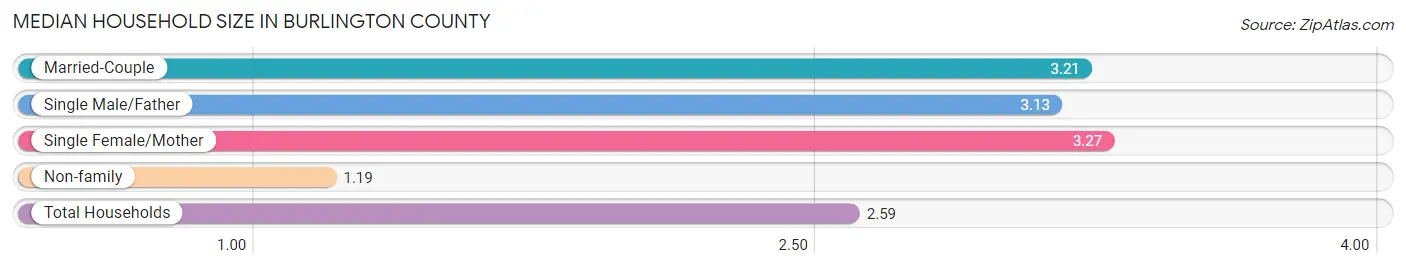
The median household size in Burlington County is 2.59 persons per household, with single female/mother households (19,751 | 11.3%) accounting for the largest median household size of 3.27 persons per household. non-family households (54,296 | 31.1%) represent the smallest median household size with 1.19 persons per household.
| Household Type | # Households | Household Size |
| Married-Couple | 93,134 (53.4%) | 3.21 |
| Single Male/Father | 7,273 (4.2%) | 3.13 |
| Single Female/Mother | 19,751 (11.3%) | 3.27 |
| Non-family | 54,296 (31.1%) | 1.19 |
| Total Households | 174,454 (100.0%) | 2.59 |
Household Size by Marriage Status in Burlington County
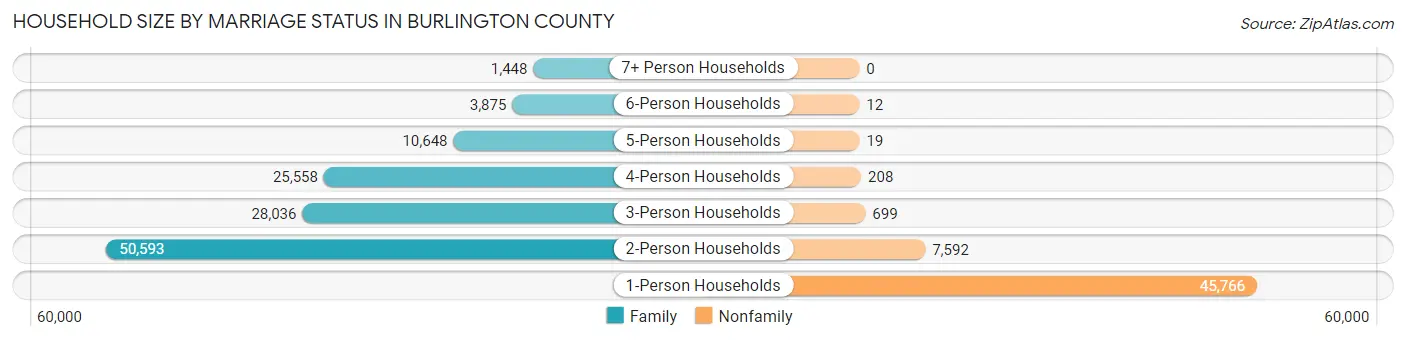
Out of a total of 174,454 households in Burlington County, 120,158 (68.9%) are family households, while 54,296 (31.1%) are nonfamily households. The most numerous type of family households are 2-person households, comprising 50,593, and the most common type of nonfamily households are 1-person households, comprising 45,766.
| Household Size | Family Households | Nonfamily Households |
| 1-Person Households | - | 45,766 (26.2%) |
| 2-Person Households | 50,593 (29.0%) | 7,592 (4.3%) |
| 3-Person Households | 28,036 (16.1%) | 699 (0.4%) |
| 4-Person Households | 25,558 (14.6%) | 208 (0.1%) |
| 5-Person Households | 10,648 (6.1%) | 19 (0.0%) |
| 6-Person Households | 3,875 (2.2%) | 12 (0.0%) |
| 7+ Person Households | 1,448 (0.8%) | 0 (0.0%) |
| Total | 120,158 (68.9%) | 54,296 (31.1%) |
Female Fertility in Burlington County
Fertility by Age in Burlington County
Average fertility rate in Burlington County is 42.0 births per 1,000 women. Women in the age bracket of 20 to 34 years have the highest fertility rate with 70.0 births per 1,000 women. Women in the age bracket of 20 to 34 years acount for 66.4% of all women with births.
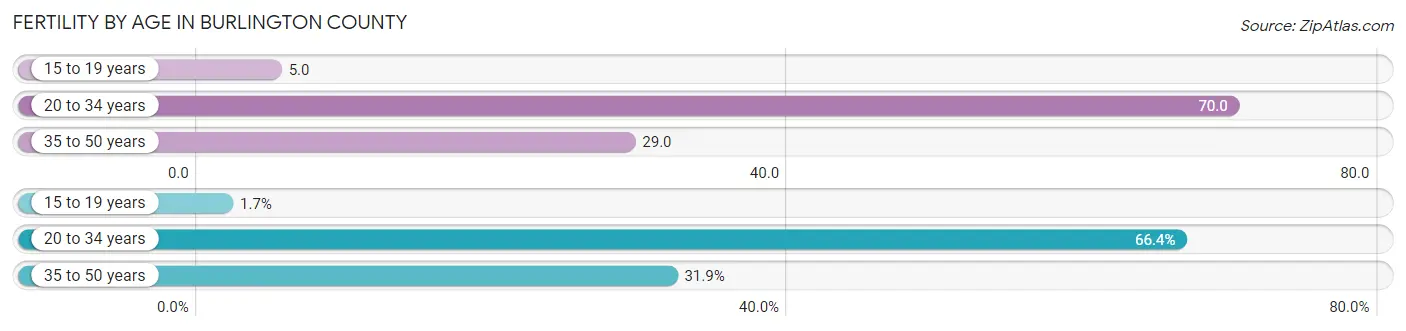
| Age Bracket | Women with Births | Births / 1,000 Women |
| 15 to 19 years | 73 (1.7%) | 5.0 |
| 20 to 34 years | 2,855 (66.4%) | 70.0 |
| 35 to 50 years | 1,369 (31.9%) | 29.0 |
| Total | 4,297 (100.0%) | 42.0 |
Fertility by Age by Marriage Status in Burlington County
76.2% of women with births (4,297) in Burlington County are married. The highest percentage of unmarried women with births falls into 15 to 19 years age bracket with 100.0% of them unmarried at the time of birth, while the lowest percentage of unmarried women with births belong to 35 to 50 years age bracket with 11.3% of them unmarried.
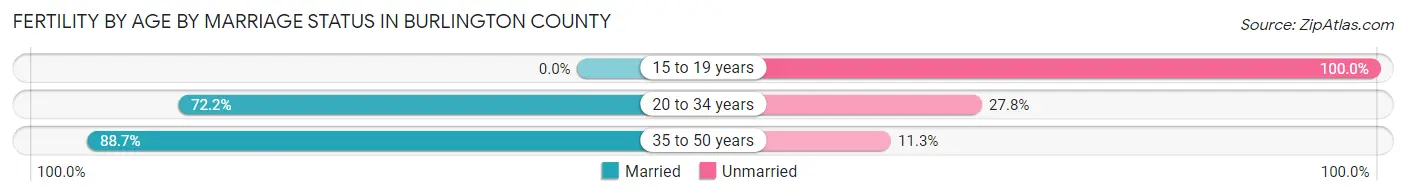
| Age Bracket | Married | Unmarried |
| 15 to 19 years | 0 (0.0%) | 73 (100.0%) |
| 20 to 34 years | 2,061 (72.2%) | 794 (27.8%) |
| 35 to 50 years | 1,214 (88.7%) | 155 (11.3%) |
| Total | 3,274 (76.2%) | 1,023 (23.8%) |
Fertility by Education in Burlington County
Average fertility rate in Burlington County is 42.0 births per 1,000 women. Women with the education attainment of graduate degree have the highest fertility rate of 69.0 births per 1,000 women, while women with the education attainment of less than high school have the lowest fertility at 9.0 births per 1,000 women. Women with the education attainment of bachelor's degree represent 31.8% of all women with births.
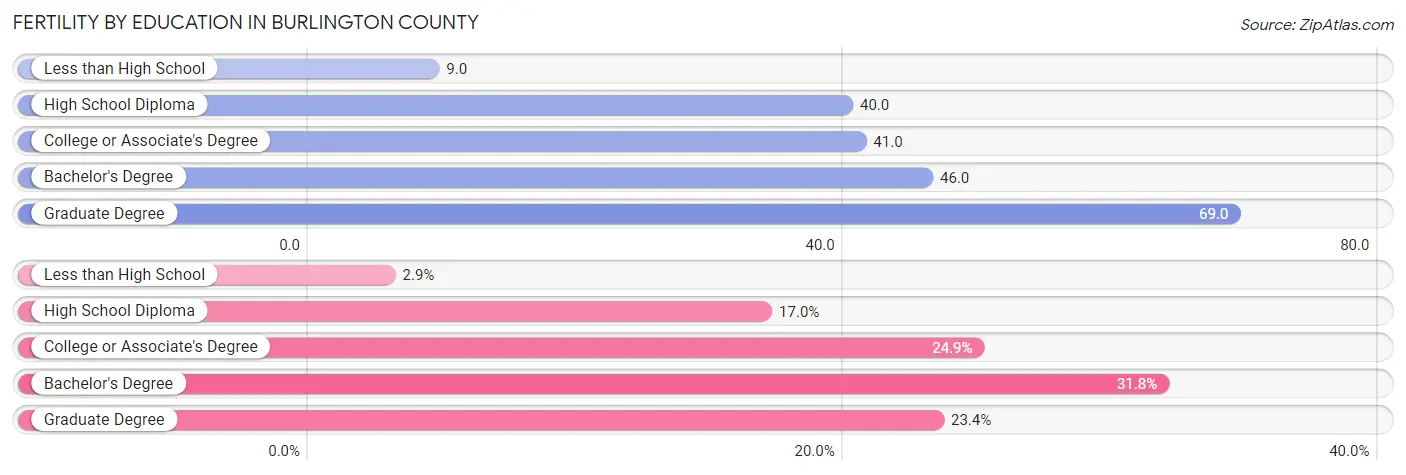
| Educational Attainment | Women with Births | Births / 1,000 Women |
| Less than High School | 123 (2.9%) | 9.0 |
| High School Diploma | 729 (17.0%) | 40.0 |
| College or Associate's Degree | 1,071 (24.9%) | 41.0 |
| Bachelor's Degree | 1,368 (31.8%) | 46.0 |
| Graduate Degree | 1,006 (23.4%) | 69.0 |
| Total | 4,297 (100.0%) | 42.0 |
Fertility by Education by Marriage Status in Burlington County
23.8% of women with births in Burlington County are unmarried. Women with the educational attainment of graduate degree are most likely to be married with 96.1% of them married at childbirth, while women with the educational attainment of less than high school are least likely to be married with 69.1% of them unmarried at childbirth.
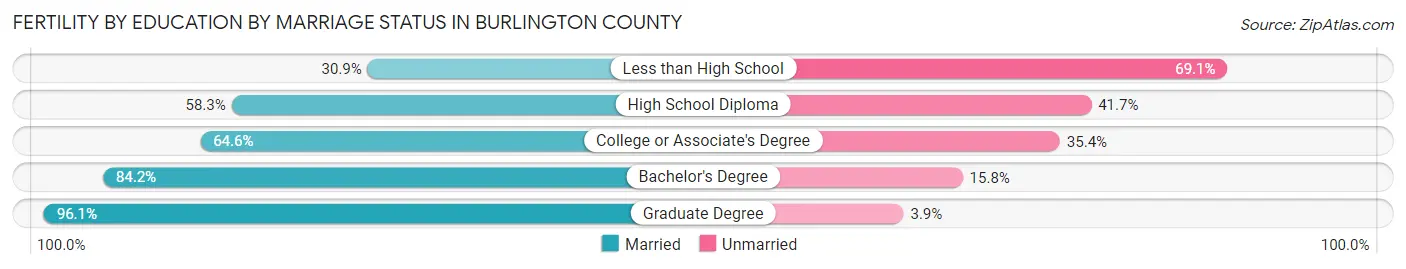
| Educational Attainment | Married | Unmarried |
| Less than High School | 38 (30.9%) | 85 (69.1%) |
| High School Diploma | 425 (58.3%) | 304 (41.7%) |
| College or Associate's Degree | 692 (64.6%) | 379 (35.4%) |
| Bachelor's Degree | 1,152 (84.2%) | 216 (15.8%) |
| Graduate Degree | 967 (96.1%) | 39 (3.9%) |
| Total | 3,274 (76.2%) | 1,023 (23.8%) |
Income in Burlington County
Income Overview in Burlington County
Per Capita Income in Burlington County is $51,549, while median incomes of families and households are $122,708 and $102,615 respectively.
| Characteristic | Number | Measure |
| Per Capita Income | 461,853 | $51,549 |
| Median Family Income | 120,158 | $122,708 |
| Mean Family Income | 120,158 | $155,481 |
| Median Household Income | 174,454 | $102,615 |
| Mean Household Income | 174,454 | $132,928 |
| Income Deficit | 120,158 | $11,375 |
| Wage / Income Gap (%) | 461,853 | 26.10% |
| Wage / Income Gap ($) | 461,853 | 73.90¢ per $1 |
| Gini / Inequality Index | 461,853 | 0.44 |
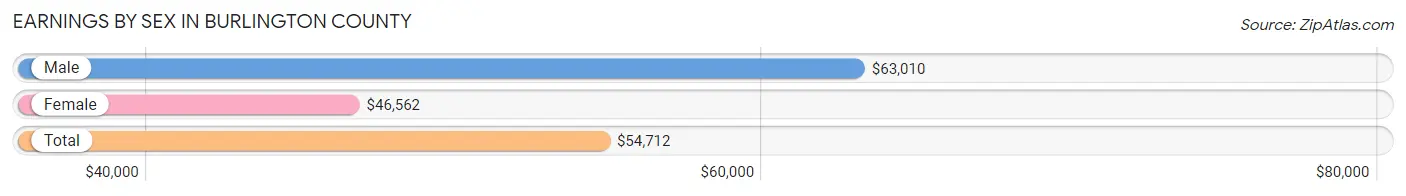
Earnings by Sex in Burlington County
Average Earnings in Burlington County are $54,712, $63,010 for men and $46,562 for women, a difference of 26.1%.
| Sex | Number | Average Earnings |
| Male | 136,842 (52.3%) | $63,010 |
| Female | 125,028 (47.7%) | $46,562 |
| Total | 261,870 (100.0%) | $54,712 |
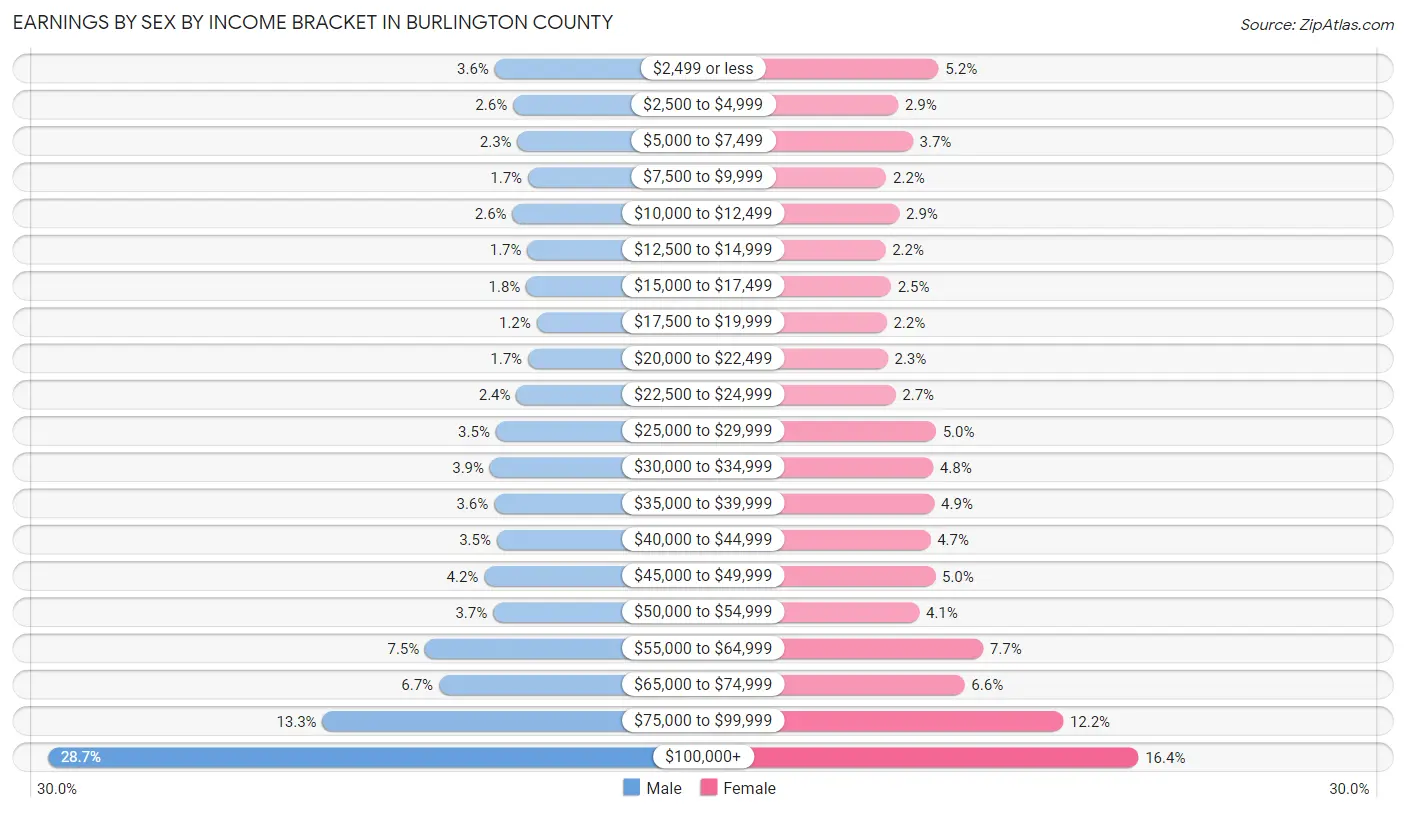
Earnings by Sex by Income Bracket in Burlington County
The most common earnings brackets in Burlington County are $100,000+ for men (39,277 | 28.7%) and $100,000+ for women (20,485 | 16.4%).
| Income | Male | Female |
| $2,499 or less | 4,900 (3.6%) | 6,437 (5.1%) |
| $2,500 to $4,999 | 3,495 (2.5%) | 3,596 (2.9%) |
| $5,000 to $7,499 | 3,154 (2.3%) | 4,632 (3.7%) |
| $7,500 to $9,999 | 2,342 (1.7%) | 2,760 (2.2%) |
| $10,000 to $12,499 | 3,533 (2.6%) | 3,671 (2.9%) |
| $12,500 to $14,999 | 2,376 (1.7%) | 2,701 (2.2%) |
| $15,000 to $17,499 | 2,480 (1.8%) | 3,088 (2.5%) |
| $17,500 to $19,999 | 1,669 (1.2%) | 2,786 (2.2%) |
| $20,000 to $22,499 | 2,335 (1.7%) | 2,861 (2.3%) |
| $22,500 to $24,999 | 3,225 (2.4%) | 3,417 (2.7%) |
| $25,000 to $29,999 | 4,818 (3.5%) | 6,255 (5.0%) |
| $30,000 to $34,999 | 5,272 (3.8%) | 6,047 (4.8%) |
| $35,000 to $39,999 | 4,936 (3.6%) | 6,135 (4.9%) |
| $40,000 to $44,999 | 4,736 (3.5%) | 5,863 (4.7%) |
| $45,000 to $49,999 | 5,705 (4.2%) | 6,196 (5.0%) |
| $50,000 to $54,999 | 5,019 (3.7%) | 5,077 (4.1%) |
| $55,000 to $64,999 | 10,255 (7.5%) | 9,559 (7.6%) |
| $65,000 to $74,999 | 9,176 (6.7%) | 8,268 (6.6%) |
| $75,000 to $99,999 | 18,139 (13.3%) | 15,194 (12.1%) |
| $100,000+ | 39,277 (28.7%) | 20,485 (16.4%) |
| Total | 136,842 (100.0%) | 125,028 (100.0%) |
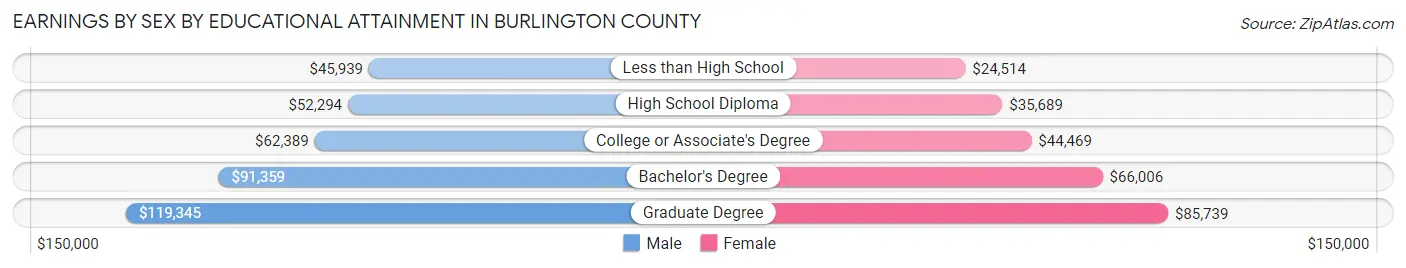
Earnings by Sex by Educational Attainment in Burlington County
Average earnings in Burlington County are $71,858 for men and $53,195 for women, a difference of 26.0%. Men with an educational attainment of graduate degree enjoy the highest average annual earnings of $119,345, while those with less than high school education earn the least with $45,939. Women with an educational attainment of graduate degree earn the most with the average annual earnings of $85,739, while those with less than high school education have the smallest earnings of $24,514.
| Educational Attainment | Male Income | Female Income |
| Less than High School | $45,939 | $24,514 |
| High School Diploma | $52,294 | $35,689 |
| College or Associate's Degree | $62,389 | $44,469 |
| Bachelor's Degree | $91,359 | $66,006 |
| Graduate Degree | $119,345 | $85,739 |
| Total | $71,858 | $53,195 |
Family Income in Burlington County
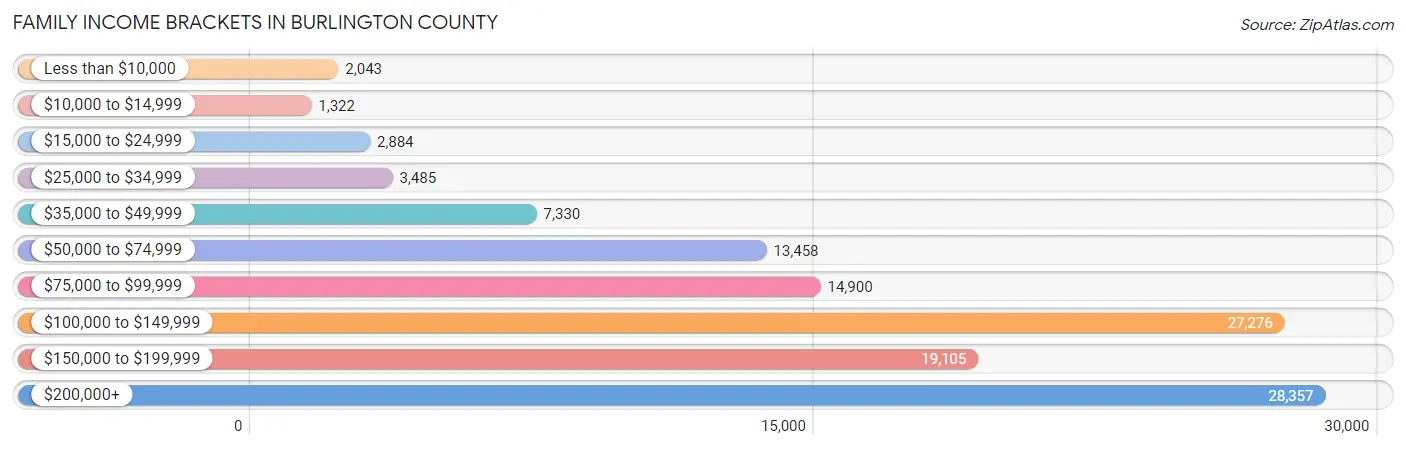
Family Income Brackets in Burlington County
According to the Burlington County family income data, there are 28,357 families falling into the $200,000+ income range, which is the most common income bracket and makes up 23.6% of all families. Conversely, the $10,000 to $14,999 income bracket is the least frequent group with only 1,322 families (1.1%) belonging to this category.
| Income Bracket | # Families | % Families |
| Less than $10,000 | 2,043 | 1.7% |
| $10,000 to $14,999 | 1,322 | 1.1% |
| $15,000 to $24,999 | 2,884 | 2.4% |
| $25,000 to $34,999 | 3,485 | 2.9% |
| $35,000 to $49,999 | 7,330 | 6.1% |
| $50,000 to $74,999 | 13,458 | 11.2% |
| $75,000 to $99,999 | 14,900 | 12.4% |
| $100,000 to $149,999 | 27,276 | 22.7% |
| $150,000 to $199,999 | 19,105 | 15.9% |
| $200,000+ | 28,357 | 23.6% |
Family Income by Famaliy Size in Burlington County
4-person families (24,691 | 20.5%) account for the highest median family income in Burlington County with $164,755 per family, while 2-person families (53,325 | 44.4%) have the highest median income of $51,772 per family member.
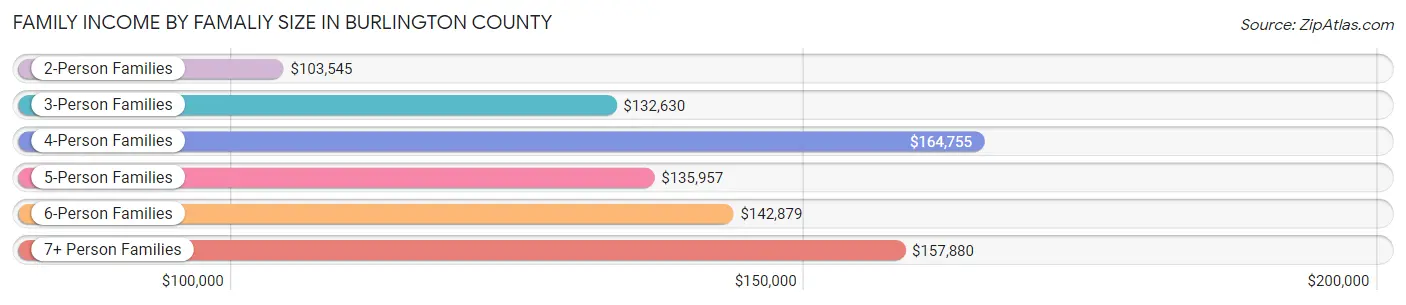
| Income Bracket | # Families | Median Income |
| 2-Person Families | 53,325 (44.4%) | $103,545 |
| 3-Person Families | 27,542 (22.9%) | $132,630 |
| 4-Person Families | 24,691 (20.5%) | $164,755 |
| 5-Person Families | 9,927 (8.3%) | $135,957 |
| 6-Person Families | 3,481 (2.9%) | $142,879 |
| 7+ Person Families | 1,192 (1.0%) | $157,880 |
| Total | 120,158 (100.0%) | $122,708 |
Family Income by Number of Earners in Burlington County
The median family income in Burlington County is $122,708, with families comprising 3+ earners (18,331) having the highest median family income of $183,501, while families with no earners (15,131) have the lowest median family income of $61,781, accounting for 15.3% and 12.6% of families, respectively.
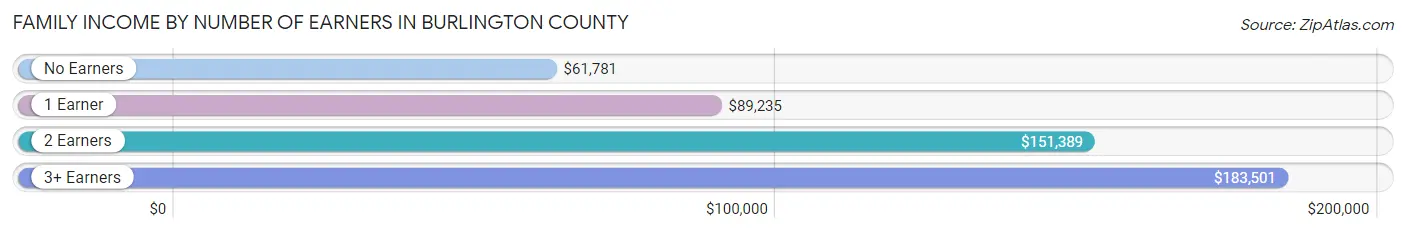
| Number of Earners | # Families | Median Income |
| No Earners | 15,131 (12.6%) | $61,781 |
| 1 Earner | 33,967 (28.3%) | $89,235 |
| 2 Earners | 52,729 (43.9%) | $151,389 |
| 3+ Earners | 18,331 (15.3%) | $183,501 |
| Total | 120,158 (100.0%) | $122,708 |
Household Income in Burlington County
Household Income Brackets in Burlington County
With 35,240 households falling in the category, the $100,000 to $149,999 income range is the most frequent in Burlington County, accounting for 20.2% of all households. In contrast, only 2,966 households (1.7%) fall into the $10,000 to $14,999 income bracket, making it the least populous group.
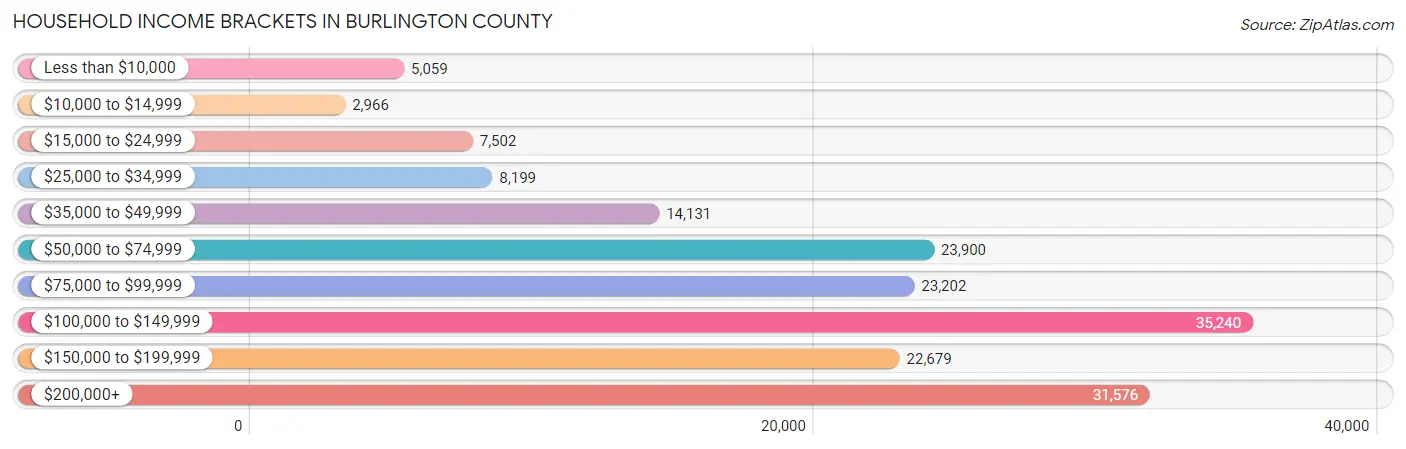
| Income Bracket | # Households | % Households |
| Less than $10,000 | 5,059 | 2.9% |
| $10,000 to $14,999 | 2,966 | 1.7% |
| $15,000 to $24,999 | 7,502 | 4.3% |
| $25,000 to $34,999 | 8,199 | 4.7% |
| $35,000 to $49,999 | 14,131 | 8.1% |
| $50,000 to $74,999 | 23,900 | 13.7% |
| $75,000 to $99,999 | 23,202 | 13.3% |
| $100,000 to $149,999 | 35,240 | 20.2% |
| $150,000 to $199,999 | 22,679 | 13.0% |
| $200,000+ | 31,576 | 18.1% |
Household Income by Householder Age in Burlington County
The median household income in Burlington County is $102,615, with the highest median household income of $127,135 found in the 45 to 64 years age bracket for the primary householder. A total of 70,939 households (40.7%) fall into this category. Meanwhile, the 15 to 24 years age bracket for the primary householder has the lowest median household income of $49,925, with 3,358 households (1.9%) in this group.
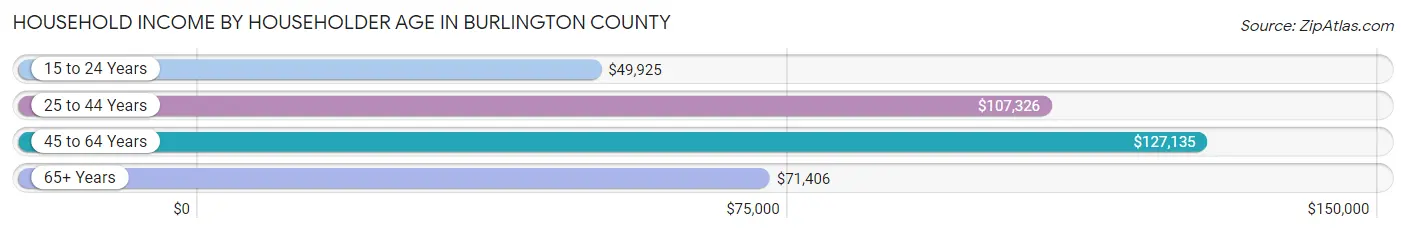
| Income Bracket | # Households | Median Income |
| 15 to 24 Years | 3,358 (1.9%) | $49,925 |
| 25 to 44 Years | 49,953 (28.6%) | $107,326 |
| 45 to 64 Years | 70,939 (40.7%) | $127,135 |
| 65+ Years | 50,204 (28.8%) | $71,406 |
| Total | 174,454 (100.0%) | $102,615 |
Poverty in Burlington County
Income Below Poverty by Sex and Age in Burlington County
With 5.5% poverty level for males and 7.6% for females among the residents of Burlington County, under 5 year old males and under 5 year old females are the most vulnerable to poverty, with 1,185 males (10.0%) and 1,507 females (13.7%) in their respective age groups living below the poverty level.
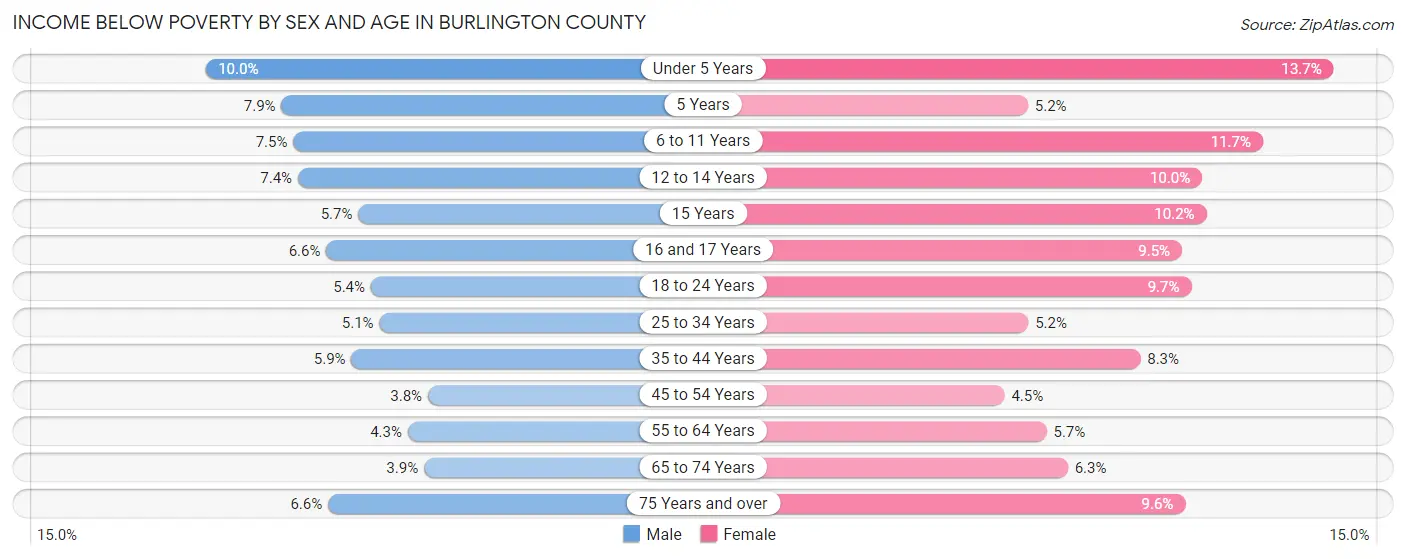
| Age Bracket | Male | Female |
| Under 5 Years | 1,185 (10.0%) | 1,507 (13.7%) |
| 5 Years | 232 (7.9%) | 119 (5.2%) |
| 6 to 11 Years | 1,215 (7.5%) | 1,843 (11.7%) |
| 12 to 14 Years | 602 (7.4%) | 818 (10.0%) |
| 15 Years | 160 (5.7%) | 309 (10.2%) |
| 16 and 17 Years | 409 (6.6%) | 543 (9.5%) |
| 18 to 24 Years | 983 (5.4%) | 1,726 (9.7%) |
| 25 to 34 Years | 1,438 (5.1%) | 1,441 (5.2%) |
| 35 to 44 Years | 1,671 (5.9%) | 2,407 (8.3%) |
| 45 to 54 Years | 1,142 (3.8%) | 1,421 (4.5%) |
| 55 to 64 Years | 1,414 (4.3%) | 1,972 (5.7%) |
| 65 to 74 Years | 820 (3.9%) | 1,553 (6.3%) |
| 75 Years and over | 883 (6.6%) | 1,905 (9.6%) |
| Total | 12,154 (5.5%) | 17,564 (7.6%) |
Income Above Poverty by Sex and Age in Burlington County
According to the poverty statistics in Burlington County, males aged 45 to 54 years and females aged 45 to 54 years are the age groups that are most secure financially, with 96.2% of males and 95.5% of females in these age groups living above the poverty line.
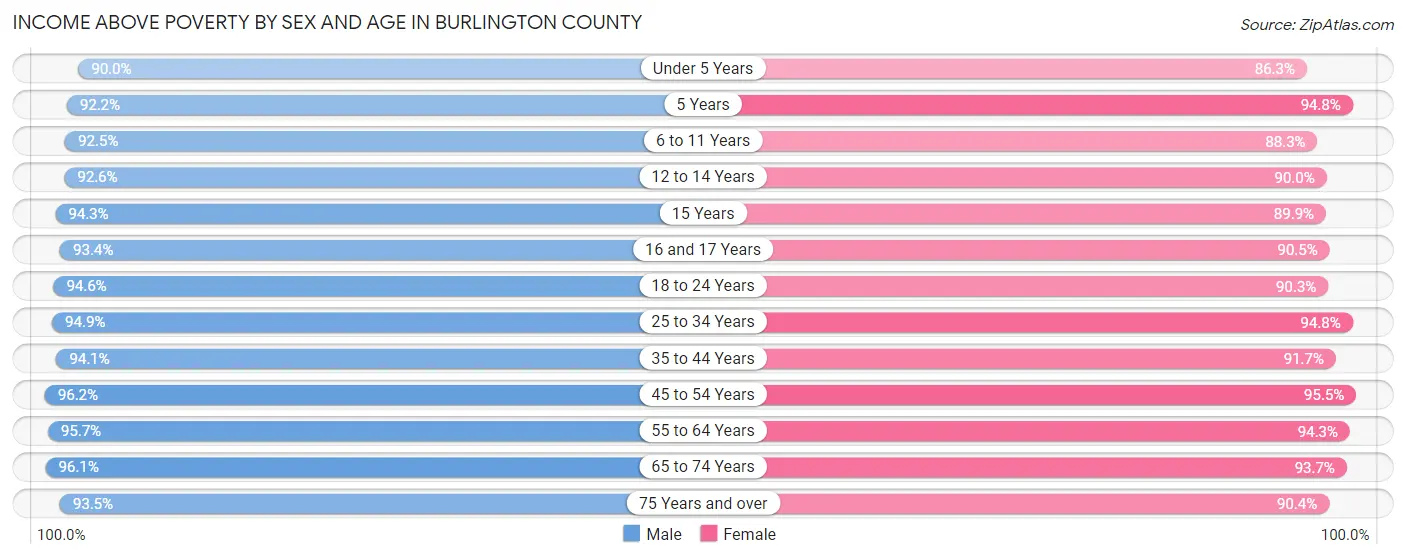
| Age Bracket | Male | Female |
| Under 5 Years | 10,702 (90.0%) | 9,498 (86.3%) |
| 5 Years | 2,724 (92.1%) | 2,177 (94.8%) |
| 6 to 11 Years | 14,934 (92.5%) | 13,877 (88.3%) |
| 12 to 14 Years | 7,542 (92.6%) | 7,339 (90.0%) |
| 15 Years | 2,641 (94.3%) | 2,735 (89.8%) |
| 16 and 17 Years | 5,787 (93.4%) | 5,188 (90.5%) |
| 18 to 24 Years | 17,349 (94.6%) | 16,004 (90.3%) |
| 25 to 34 Years | 26,651 (94.9%) | 26,329 (94.8%) |
| 35 to 44 Years | 26,660 (94.1%) | 26,565 (91.7%) |
| 45 to 54 Years | 29,119 (96.2%) | 29,955 (95.5%) |
| 55 to 64 Years | 31,223 (95.7%) | 32,615 (94.3%) |
| 65 to 74 Years | 20,290 (96.1%) | 23,154 (93.7%) |
| 75 Years and over | 12,593 (93.4%) | 18,030 (90.4%) |
| Total | 208,215 (94.5%) | 213,466 (92.4%) |
Income Below Poverty Among Married-Couple Families in Burlington County
The poverty statistics for married-couple families in Burlington County show that 2.4% or 2,258 of the total 93,134 families live below the poverty line. Families with 5 or more children have the highest poverty rate of 17.2%, comprising of 47 families. On the other hand, families with no children have the lowest poverty rate of 1.8%, which includes 997 families.
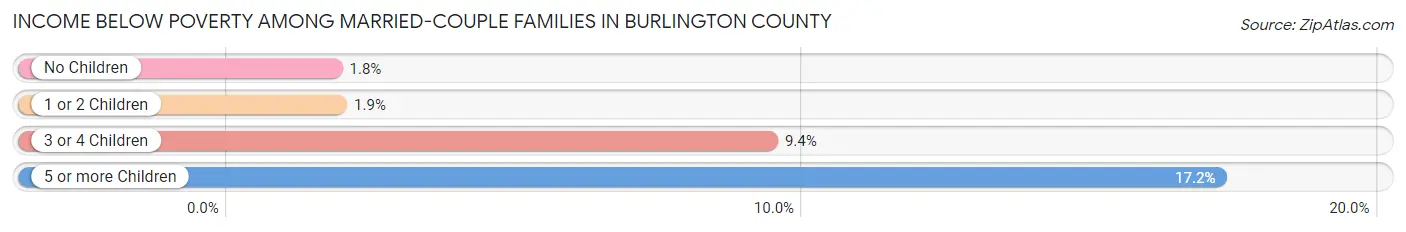
| Children | Above Poverty | Below Poverty |
| No Children | 53,708 (98.2%) | 997 (1.8%) |
| 1 or 2 Children | 31,052 (98.1%) | 603 (1.9%) |
| 3 or 4 Children | 5,890 (90.6%) | 611 (9.4%) |
| 5 or more Children | 226 (82.8%) | 47 (17.2%) |
| Total | 90,876 (97.6%) | 2,258 (2.4%) |
Income Below Poverty Among Single-Parent Households in Burlington County
According to the poverty data in Burlington County, 7.9% or 573 single-father households and 14.5% or 2,873 single-mother households are living below the poverty line. Among single-father households, those with 3 or 4 children have the highest poverty rate, with 42 households (12.1%) experiencing poverty. Likewise, among single-mother households, those with 5 or more children have the highest poverty rate, with 168 households (92.8%) falling below the poverty line.
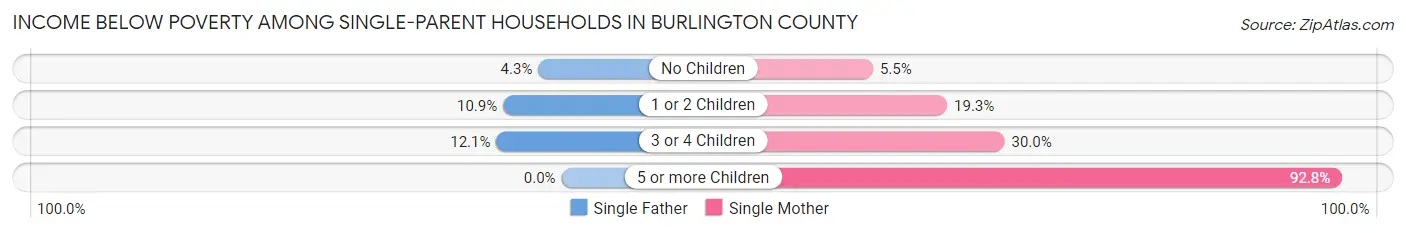
| Children | Single Father | Single Mother |
| No Children | 146 (4.3%) | 491 (5.5%) |
| 1 or 2 Children | 385 (10.9%) | 1,726 (19.3%) |
| 3 or 4 Children | 42 (12.1%) | 488 (30.0%) |
| 5 or more Children | 0 (0.0%) | 168 (92.8%) |
| Total | 573 (7.9%) | 2,873 (14.5%) |
Income Below Poverty Among Married-Couple vs Single-Parent Households in Burlington County
The poverty data for Burlington County shows that 2,258 of the married-couple family households (2.4%) and 3,446 of the single-parent households (12.8%) are living below the poverty level. Within the married-couple family households, those with 5 or more children have the highest poverty rate, with 47 households (17.2%) falling below the poverty line. Among the single-parent households, those with 5 or more children have the highest poverty rate, with 168 household (84.0%) living below poverty.
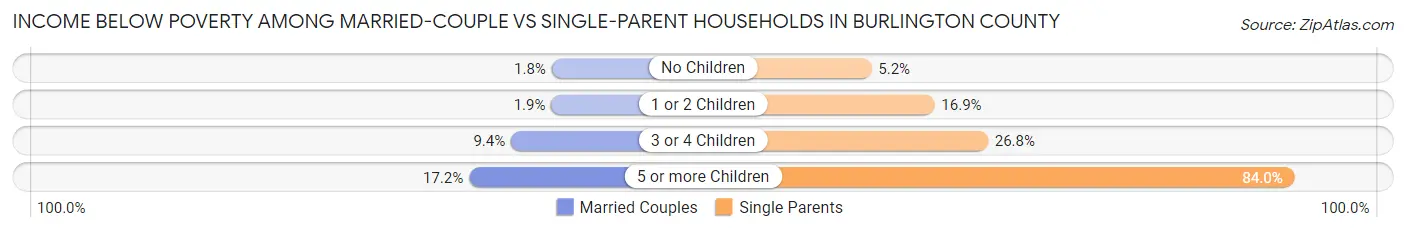
| Children | Married-Couple Families | Single-Parent Households |
| No Children | 997 (1.8%) | 637 (5.2%) |
| 1 or 2 Children | 603 (1.9%) | 2,111 (16.9%) |
| 3 or 4 Children | 611 (9.4%) | 530 (26.8%) |
| 5 or more Children | 47 (17.2%) | 168 (84.0%) |
| Total | 2,258 (2.4%) | 3,446 (12.8%) |
Employment Characteristics in Burlington County
Employment by Class of Employer in Burlington County
Among the 234,607 employed individuals in Burlington County, private company employees (150,402 | 64.1%), local government employees (20,871 | 8.9%), and not-for-profit organizations (18,003 | 7.7%) make up the most common classes of employment.
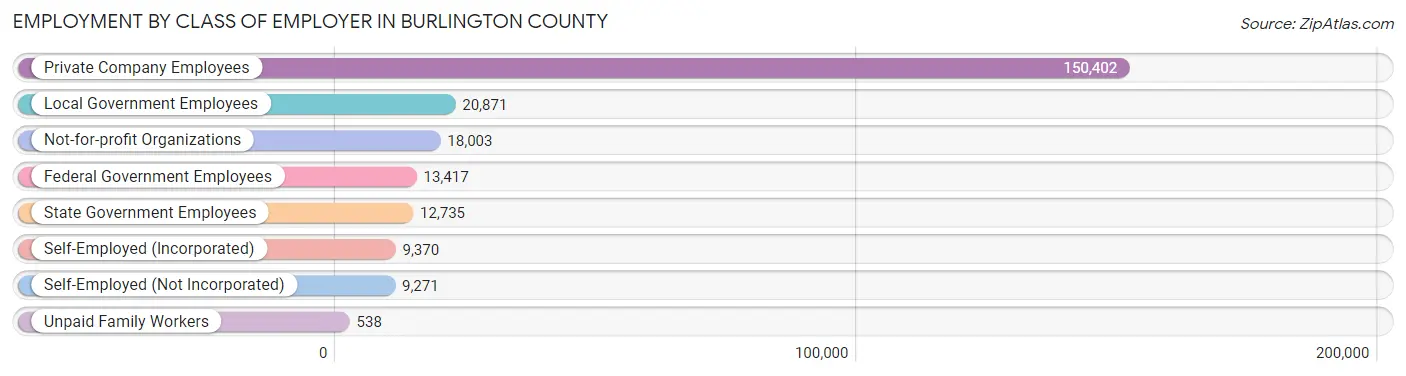
| Employer Class | # Employees | % Employees |
| Private Company Employees | 150,402 | 64.1% |
| Self-Employed (Incorporated) | 9,370 | 4.0% |
| Self-Employed (Not Incorporated) | 9,271 | 4.0% |
| Not-for-profit Organizations | 18,003 | 7.7% |
| Local Government Employees | 20,871 | 8.9% |
| State Government Employees | 12,735 | 5.4% |
| Federal Government Employees | 13,417 | 5.7% |
| Unpaid Family Workers | 538 | 0.2% |
| Total | 234,607 | 100.0% |
Employment Status by Age in Burlington County
According to the labor force statistics for Burlington County, out of the total population over 16 years of age (378,741), 66.5% or 251,863 individuals are in the labor force, with 5.1% or 12,845 of them unemployed. The age group with the highest labor force participation rate is 25 to 29 years, with 87.4% or 25,343 individuals in the labor force. Within the labor force, the 16 to 19 years age range has the highest percentage of unemployed individuals, with 13.0% or 1,176 of them being unemployed.
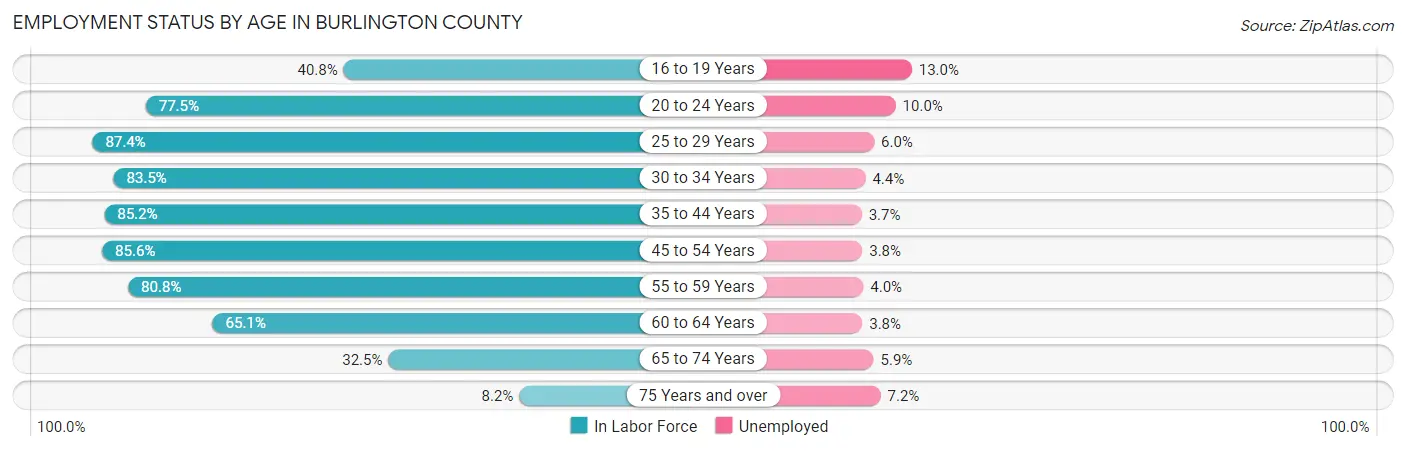
| Age Bracket | In Labor Force | Unemployed |
| 16 to 19 Years | 9,044 (40.8%) | 1,176 (13.0%) |
| 20 to 24 Years | 21,307 (77.5%) | 2,131 (10.0%) |
| 25 to 29 Years | 25,343 (87.4%) | 1,521 (6.0%) |
| 30 to 34 Years | 24,025 (83.5%) | 1,057 (4.4%) |
| 35 to 44 Years | 50,302 (85.2%) | 1,861 (3.7%) |
| 45 to 54 Years | 53,755 (85.6%) | 2,043 (3.8%) |
| 55 to 59 Years | 28,606 (80.8%) | 1,144 (4.0%) |
| 60 to 64 Years | 21,400 (65.1%) | 813 (3.8%) |
| 65 to 74 Years | 15,027 (32.5%) | 887 (5.9%) |
| 75 Years and over | 2,867 (8.2%) | 206 (7.2%) |
| Total | 251,863 (66.5%) | 12,845 (5.1%) |
Employment Status by Educational Attainment in Burlington County
According to labor force statistics for Burlington County, 82.1% of individuals (203,513) out of the total population between 25 and 64 years of age (247,884) are in the labor force, with 4.1% or 8,344 of them being unemployed. The group with the highest labor force participation rate are those with the educational attainment of bachelor's degree or higher, with 89.3% or 97,889 individuals in the labor force. Within the labor force, individuals with less than high school education have the highest percentage of unemployment, with 9.5% or 592 of them being unemployed.
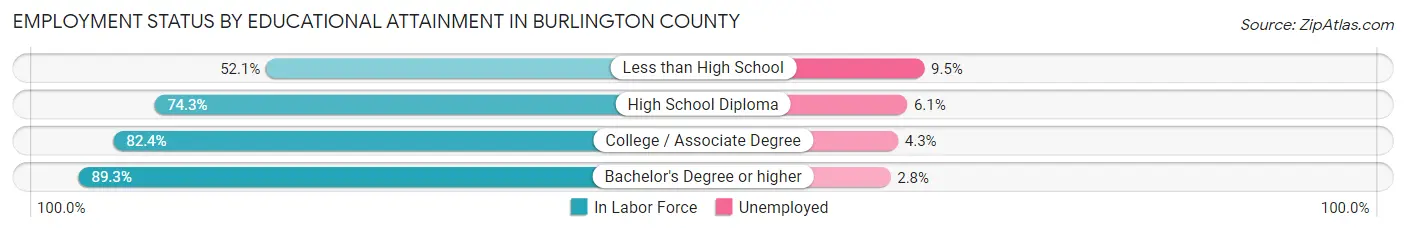
| Educational Attainment | In Labor Force | Unemployed |
| Less than High School | 6,232 (52.1%) | 1,136 (9.5%) |
| High School Diploma | 43,914 (74.3%) | 3,605 (6.1%) |
| College / Associate Degree | 55,374 (82.4%) | 2,890 (4.3%) |
| Bachelor's Degree or higher | 97,889 (89.3%) | 3,069 (2.8%) |
| Total | 203,513 (82.1%) | 10,163 (4.1%) |
Employment Occupations by Sex in Burlington County
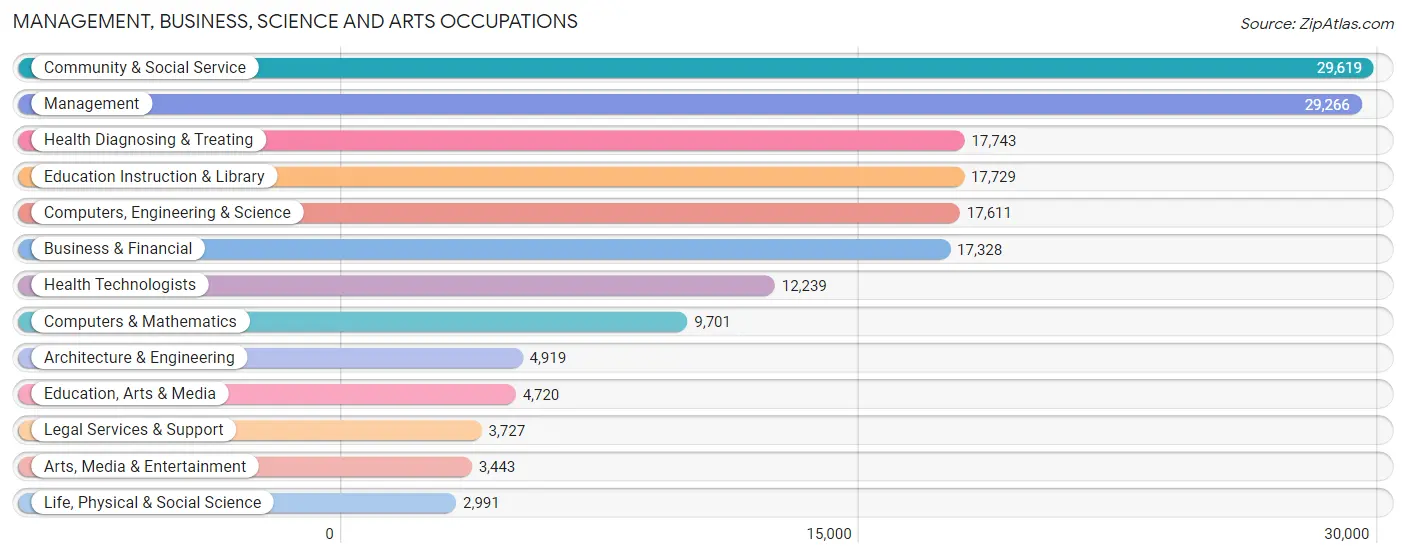
Management, Business, Science and Arts Occupations
The most common Management, Business, Science and Arts occupations in Burlington County are Community & Social Service (29,619 | 12.7%), Management (29,266 | 12.5%), Health Diagnosing & Treating (17,743 | 7.6%), Education Instruction & Library (17,729 | 7.6%), and Computers, Engineering & Science (17,611 | 7.5%).
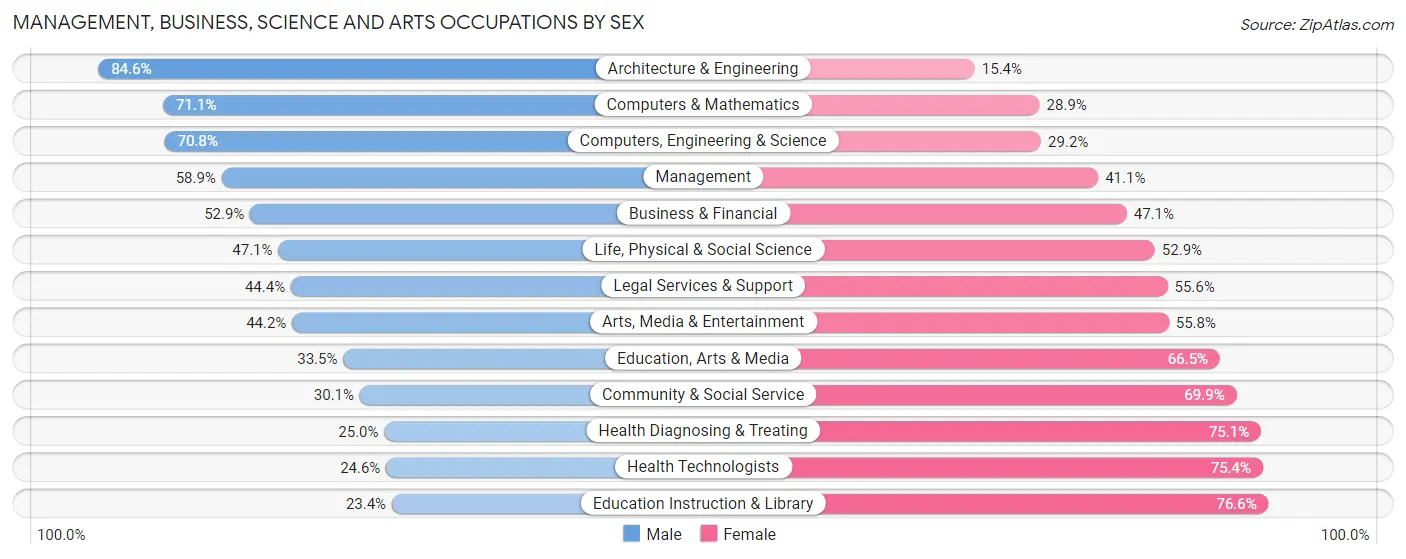
Management, Business, Science and Arts Occupations by Sex
Within the Management, Business, Science and Arts occupations in Burlington County, the most male-oriented occupations are Architecture & Engineering (84.6%), Computers & Mathematics (71.1%), and Computers, Engineering & Science (70.8%), while the most female-oriented occupations are Education Instruction & Library (76.6%), Health Technologists (75.4%), and Health Diagnosing & Treating (75.0%).
| Occupation | Male | Female |
| Management | 17,235 (58.9%) | 12,031 (41.1%) |
| Business & Financial | 9,173 (52.9%) | 8,155 (47.1%) |
| Computers, Engineering & Science | 12,469 (70.8%) | 5,142 (29.2%) |
| Computers & Mathematics | 6,898 (71.1%) | 2,803 (28.9%) |
| Architecture & Engineering | 4,163 (84.6%) | 756 (15.4%) |
| Life, Physical & Social Science | 1,408 (47.1%) | 1,583 (52.9%) |
| Community & Social Service | 8,902 (30.1%) | 20,717 (69.9%) |
| Education, Arts & Media | 1,582 (33.5%) | 3,138 (66.5%) |
| Legal Services & Support | 1,656 (44.4%) | 2,071 (55.6%) |
| Education Instruction & Library | 4,143 (23.4%) | 13,586 (76.6%) |
| Arts, Media & Entertainment | 1,521 (44.2%) | 1,922 (55.8%) |
| Health Diagnosing & Treating | 4,426 (24.9%) | 13,317 (75.0%) |
| Health Technologists | 3,007 (24.6%) | 9,232 (75.4%) |
| Total (Category) | 52,205 (46.8%) | 59,362 (53.2%) |
| Total (Overall) | 119,482 (51.2%) | 113,807 (48.8%) |
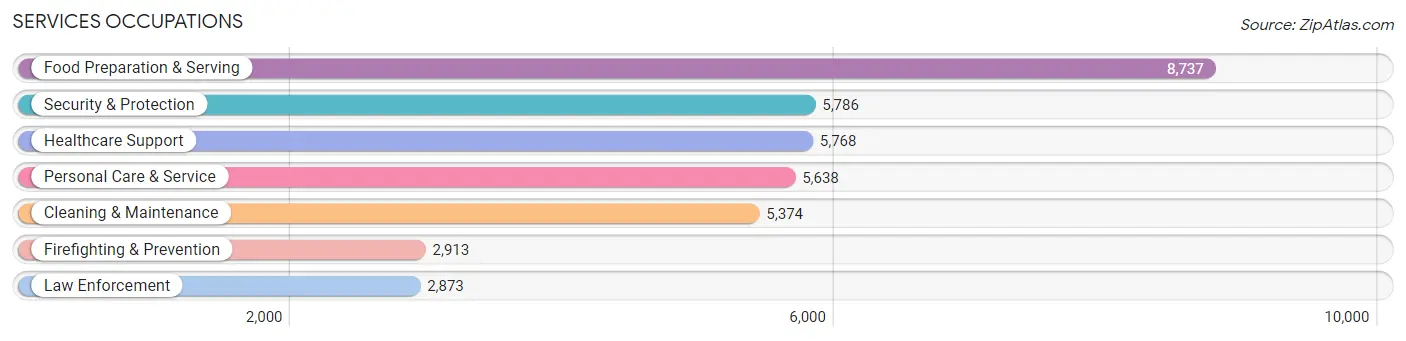
Services Occupations
The most common Services occupations in Burlington County are Food Preparation & Serving (8,737 | 3.7%), Security & Protection (5,786 | 2.5%), Healthcare Support (5,768 | 2.5%), Personal Care & Service (5,638 | 2.4%), and Cleaning & Maintenance (5,374 | 2.3%).
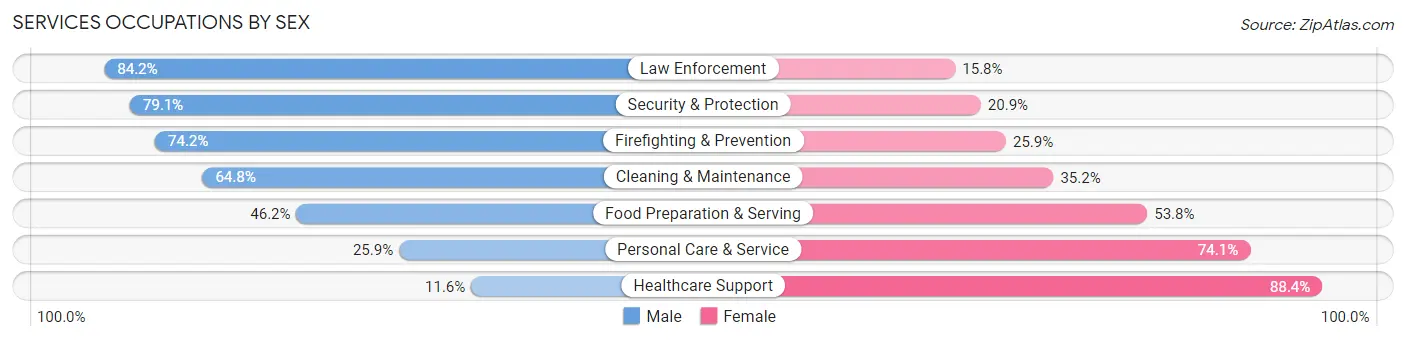
Services Occupations by Sex
Within the Services occupations in Burlington County, the most male-oriented occupations are Law Enforcement (84.2%), Security & Protection (79.1%), and Firefighting & Prevention (74.2%), while the most female-oriented occupations are Healthcare Support (88.4%), Personal Care & Service (74.1%), and Food Preparation & Serving (53.8%).
| Occupation | Male | Female |
| Healthcare Support | 668 (11.6%) | 5,100 (88.4%) |
| Security & Protection | 4,579 (79.1%) | 1,207 (20.9%) |
| Firefighting & Prevention | 2,160 (74.2%) | 753 (25.9%) |
| Law Enforcement | 2,419 (84.2%) | 454 (15.8%) |
| Food Preparation & Serving | 4,036 (46.2%) | 4,701 (53.8%) |
| Cleaning & Maintenance | 3,481 (64.8%) | 1,893 (35.2%) |
| Personal Care & Service | 1,458 (25.9%) | 4,180 (74.1%) |
| Total (Category) | 14,222 (45.4%) | 17,081 (54.6%) |
| Total (Overall) | 119,482 (51.2%) | 113,807 (48.8%) |
Sales and Office Occupations
The most common Sales and Office occupations in Burlington County are Office & Administration (28,044 | 12.0%), and Sales & Related (23,387 | 10.0%).

Sales and Office Occupations by Sex
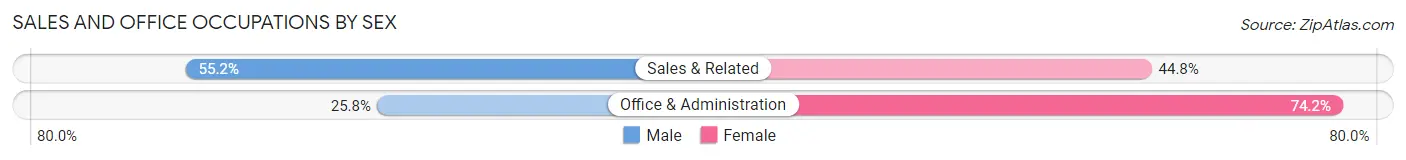
| Occupation | Male | Female |
| Sales & Related | 12,914 (55.2%) | 10,473 (44.8%) |
| Office & Administration | 7,240 (25.8%) | 20,804 (74.2%) |
| Total (Category) | 20,154 (39.2%) | 31,277 (60.8%) |
| Total (Overall) | 119,482 (51.2%) | 113,807 (48.8%) |
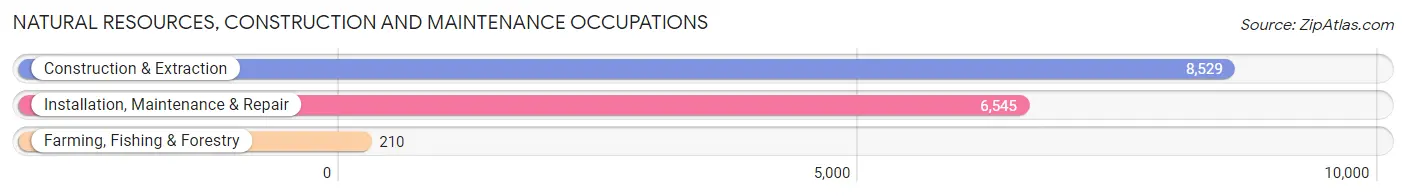
Natural Resources, Construction and Maintenance Occupations
The most common Natural Resources, Construction and Maintenance occupations in Burlington County are Construction & Extraction (8,529 | 3.7%), Installation, Maintenance & Repair (6,545 | 2.8%), and Farming, Fishing & Forestry (210 | 0.1%).
Natural Resources, Construction and Maintenance Occupations by Sex
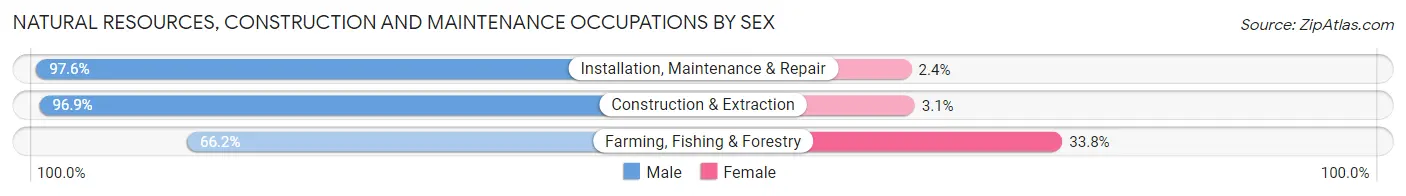
| Occupation | Male | Female |
| Farming, Fishing & Forestry | 139 (66.2%) | 71 (33.8%) |
| Construction & Extraction | 8,265 (96.9%) | 264 (3.1%) |
| Installation, Maintenance & Repair | 6,385 (97.6%) | 160 (2.4%) |
| Total (Category) | 14,789 (96.8%) | 495 (3.2%) |
| Total (Overall) | 119,482 (51.2%) | 113,807 (48.8%) |
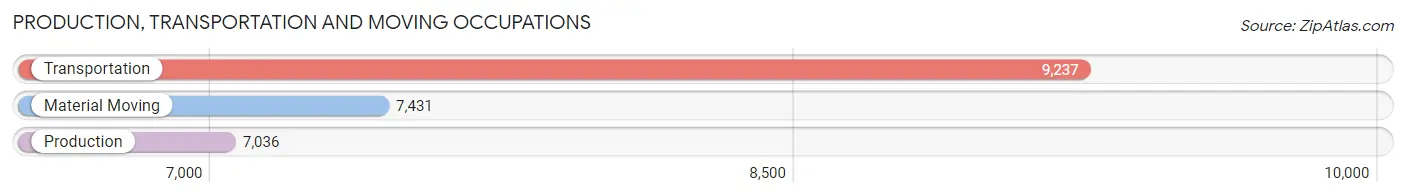
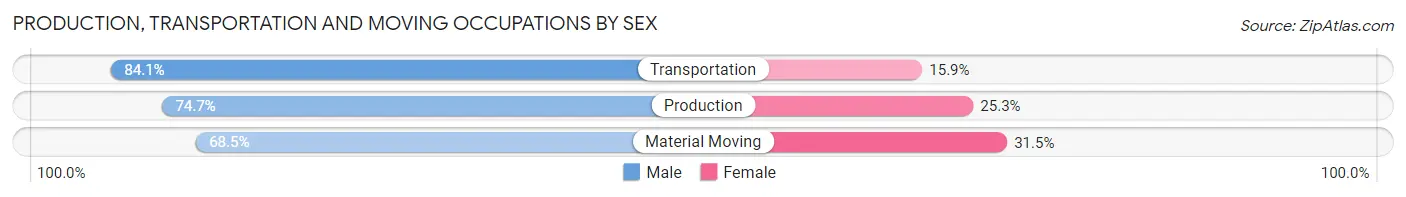
Production, Transportation and Moving Occupations
The most common Production, Transportation and Moving occupations in Burlington County are Transportation (9,237 | 4.0%), Material Moving (7,431 | 3.2%), and Production (7,036 | 3.0%).
Production, Transportation and Moving Occupations by Sex
| Occupation | Male | Female |
| Production | 5,256 (74.7%) | 1,780 (25.3%) |
| Transportation | 7,766 (84.1%) | 1,471 (15.9%) |
| Material Moving | 5,090 (68.5%) | 2,341 (31.5%) |
| Total (Category) | 18,112 (76.4%) | 5,592 (23.6%) |
| Total (Overall) | 119,482 (51.2%) | 113,807 (48.8%) |
Employment Industries by Sex in Burlington County
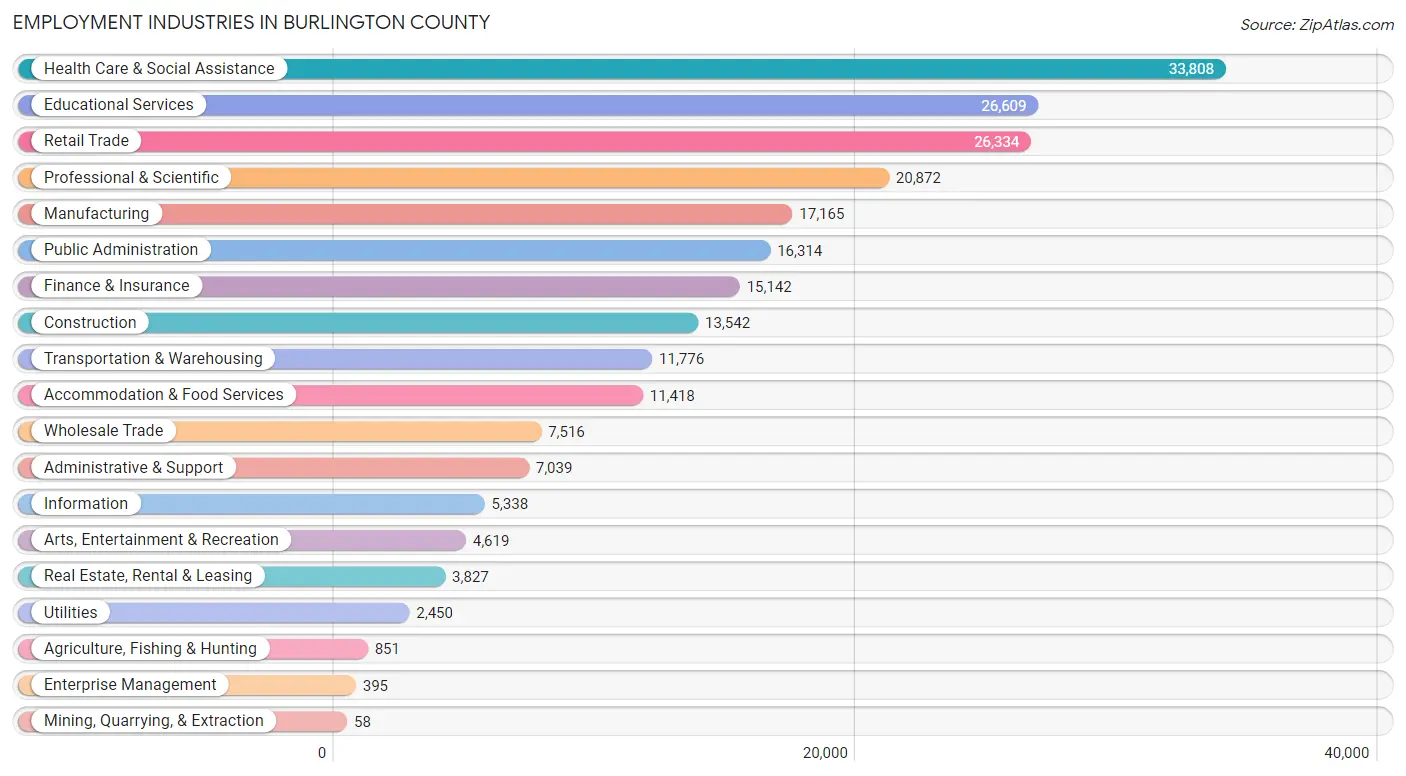
Employment Industries in Burlington County
The major employment industries in Burlington County include Health Care & Social Assistance (33,808 | 14.5%), Educational Services (26,609 | 11.4%), Retail Trade (26,334 | 11.3%), Professional & Scientific (20,872 | 8.9%), and Manufacturing (17,165 | 7.4%).
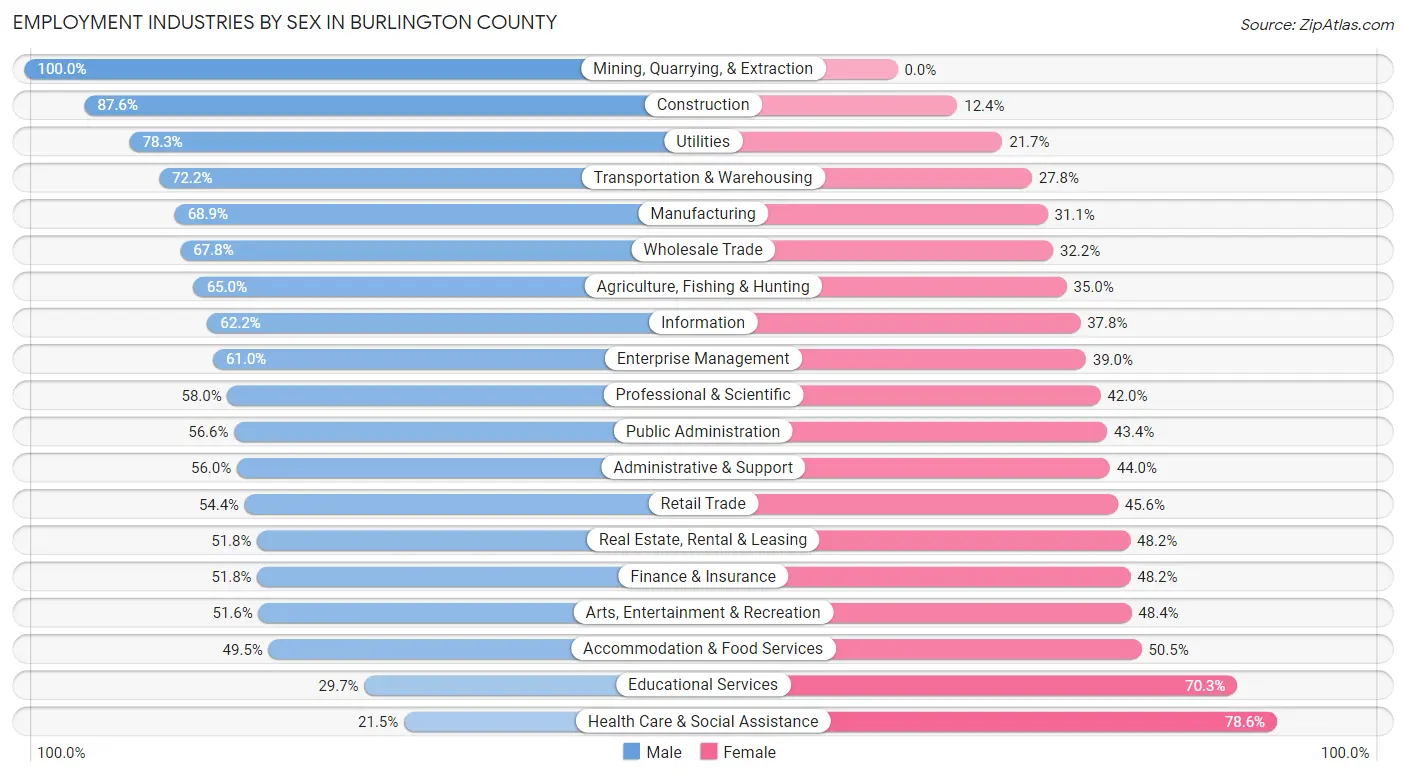
Employment Industries by Sex in Burlington County
The Burlington County industries that see more men than women are Mining, Quarrying, & Extraction (100.0%), Construction (87.6%), and Utilities (78.3%), whereas the industries that tend to have a higher number of women are Health Care & Social Assistance (78.5%), Educational Services (70.3%), and Accommodation & Food Services (50.5%).
| Industry | Male | Female |
| Agriculture, Fishing & Hunting | 553 (65.0%) | 298 (35.0%) |
| Mining, Quarrying, & Extraction | 58 (100.0%) | 0 (0.0%) |
| Construction | 11,863 (87.6%) | 1,679 (12.4%) |
| Manufacturing | 11,830 (68.9%) | 5,335 (31.1%) |
| Wholesale Trade | 5,094 (67.8%) | 2,422 (32.2%) |
| Retail Trade | 14,323 (54.4%) | 12,011 (45.6%) |
| Transportation & Warehousing | 8,500 (72.2%) | 3,276 (27.8%) |
| Utilities | 1,918 (78.3%) | 532 (21.7%) |
| Information | 3,318 (62.2%) | 2,020 (37.8%) |
| Finance & Insurance | 7,843 (51.8%) | 7,299 (48.2%) |
| Real Estate, Rental & Leasing | 1,984 (51.8%) | 1,843 (48.2%) |
| Professional & Scientific | 12,105 (58.0%) | 8,767 (42.0%) |
| Enterprise Management | 241 (61.0%) | 154 (39.0%) |
| Administrative & Support | 3,944 (56.0%) | 3,095 (44.0%) |
| Educational Services | 7,892 (29.7%) | 18,717 (70.3%) |
| Health Care & Social Assistance | 7,253 (21.4%) | 26,555 (78.5%) |
| Arts, Entertainment & Recreation | 2,382 (51.6%) | 2,237 (48.4%) |
| Accommodation & Food Services | 5,650 (49.5%) | 5,768 (50.5%) |
| Public Administration | 9,234 (56.6%) | 7,080 (43.4%) |
| Total | 119,482 (51.2%) | 113,807 (48.8%) |
Education in Burlington County
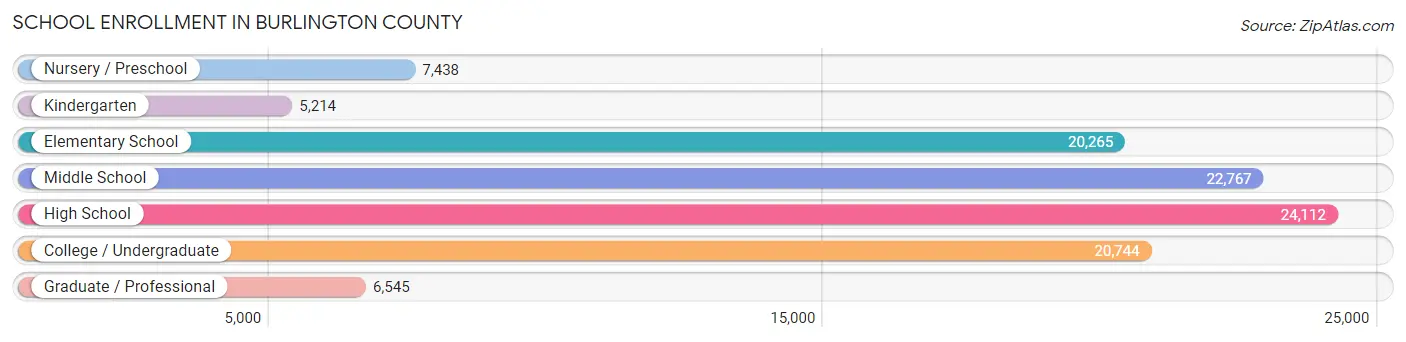
School Enrollment in Burlington County
The most common levels of schooling among the 107,085 students in Burlington County are high school (24,112 | 22.5%), middle school (22,767 | 21.3%), and college / undergraduate (20,744 | 19.4%).
| School Level | # Students | % Students |
| Nursery / Preschool | 7,438 | 7.0% |
| Kindergarten | 5,214 | 4.9% |
| Elementary School | 20,265 | 18.9% |
| Middle School | 22,767 | 21.3% |
| High School | 24,112 | 22.5% |
| College / Undergraduate | 20,744 | 19.4% |
| Graduate / Professional | 6,545 | 6.1% |
| Total | 107,085 | 100.0% |
School Enrollment by Age by Funding Source in Burlington County
Out of a total of 107,085 students who are enrolled in schools in Burlington County, 19,061 (17.8%) attend a private institution, while the remaining 88,024 (82.2%) are enrolled in public schools. The age group of 35 years and over has the highest likelihood of being enrolled in private schools, with 2,992 (45.3% in the age bracket) enrolled. Conversely, the age group of 10 to 14 year olds has the lowest likelihood of being enrolled in a private school, with 24,817 (91.1% in the age bracket) attending a public institution.
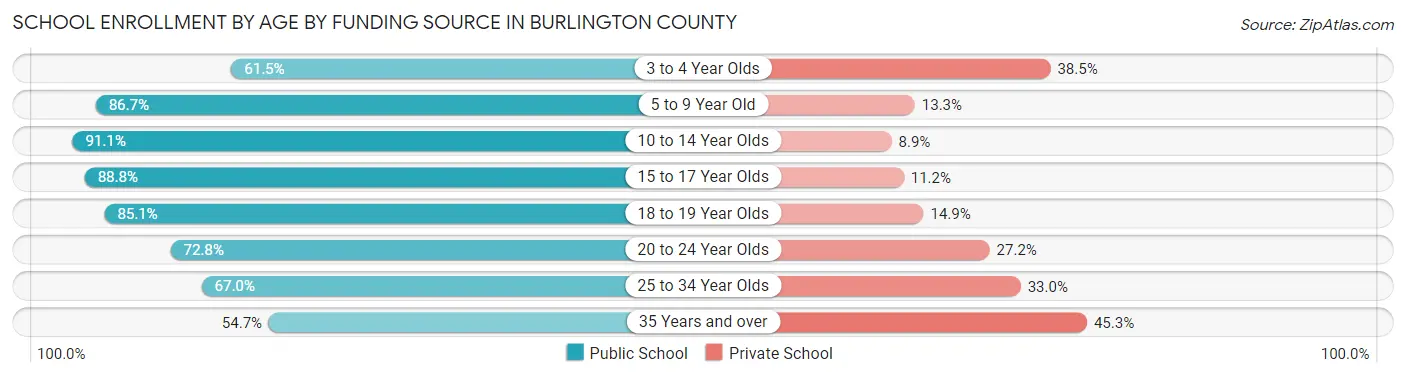
| Age Bracket | Public School | Private School |
| 3 to 4 Year Olds | 3,486 (61.5%) | 2,184 (38.5%) |
| 5 to 9 Year Old | 21,839 (86.7%) | 3,339 (13.3%) |
| 10 to 14 Year Olds | 24,817 (91.1%) | 2,432 (8.9%) |
| 15 to 17 Year Olds | 15,569 (88.8%) | 1,964 (11.2%) |
| 18 to 19 Year Olds | 6,438 (85.1%) | 1,125 (14.9%) |
| 20 to 24 Year Olds | 8,226 (72.8%) | 3,072 (27.2%) |
| 25 to 34 Year Olds | 4,016 (67.0%) | 1,976 (33.0%) |
| 35 Years and over | 3,610 (54.7%) | 2,992 (45.3%) |
| Total | 88,024 (82.2%) | 19,061 (17.8%) |
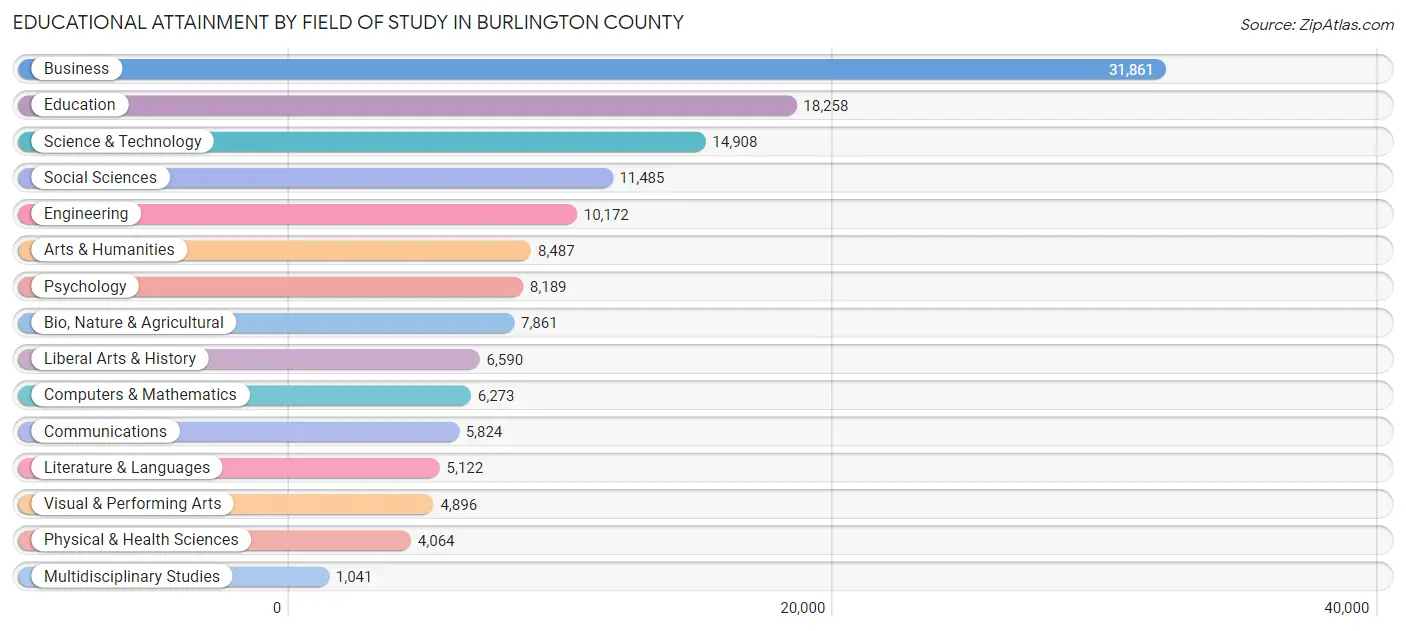
Educational Attainment by Field of Study in Burlington County
Business (31,861 | 22.0%), education (18,258 | 12.6%), science & technology (14,908 | 10.3%), social sciences (11,485 | 7.9%), and engineering (10,172 | 7.0%) are the most common fields of study among 145,031 individuals in Burlington County who have obtained a bachelor's degree or higher.
| Field of Study | # Graduates | % Graduates |
| Computers & Mathematics | 6,273 | 4.3% |
| Bio, Nature & Agricultural | 7,861 | 5.4% |
| Physical & Health Sciences | 4,064 | 2.8% |
| Psychology | 8,189 | 5.7% |
| Social Sciences | 11,485 | 7.9% |
| Engineering | 10,172 | 7.0% |
| Multidisciplinary Studies | 1,041 | 0.7% |
| Science & Technology | 14,908 | 10.3% |
| Business | 31,861 | 22.0% |
| Education | 18,258 | 12.6% |
| Literature & Languages | 5,122 | 3.5% |
| Liberal Arts & History | 6,590 | 4.5% |
| Visual & Performing Arts | 4,896 | 3.4% |
| Communications | 5,824 | 4.0% |
| Arts & Humanities | 8,487 | 5.9% |
| Total | 145,031 | 100.0% |
Transportation & Commute in Burlington County
Vehicle Availability by Sex in Burlington County
The most prevalent vehicle ownership categories in Burlington County are males with 2 vehicles (53,366, accounting for 43.7%) and females with 2 vehicles (46,396, making up 47.8%).
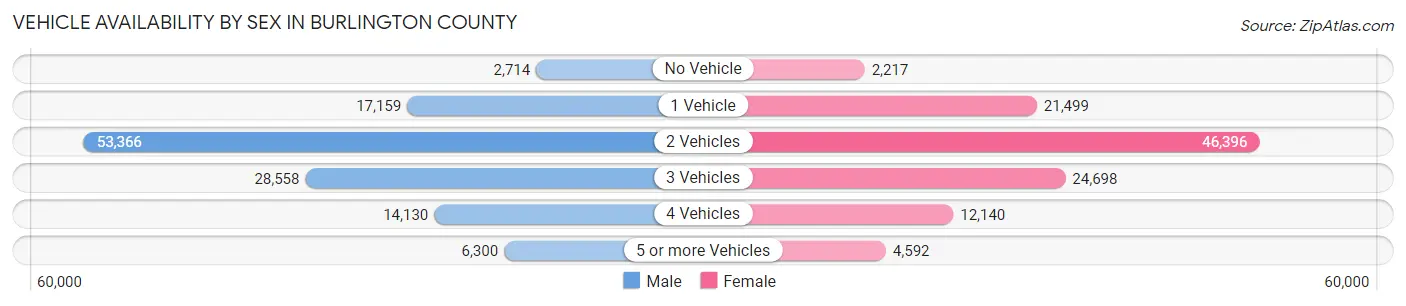
| Vehicles Available | Male | Female |
| No Vehicle | 2,714 (2.2%) | 2,217 (2.0%) |
| 1 Vehicle | 17,159 (14.0%) | 21,499 (19.3%) |
| 2 Vehicles | 53,366 (43.7%) | 46,396 (41.6%) |
| 3 Vehicles | 28,558 (23.4%) | 24,698 (22.1%) |
| 4 Vehicles | 14,130 (11.6%) | 12,140 (10.9%) |
| 5 or more Vehicles | 6,300 (5.1%) | 4,592 (4.1%) |
| Total | 122,227 (100.0%) | 111,542 (100.0%) |
Commute Time in Burlington County
The most frequently occuring commute durations in Burlington County are 30 to 34 minutes (30,623 commuters, 14.9%), 15 to 19 minutes (29,081 commuters, 14.2%), and 20 to 24 minutes (26,800 commuters, 13.1%).
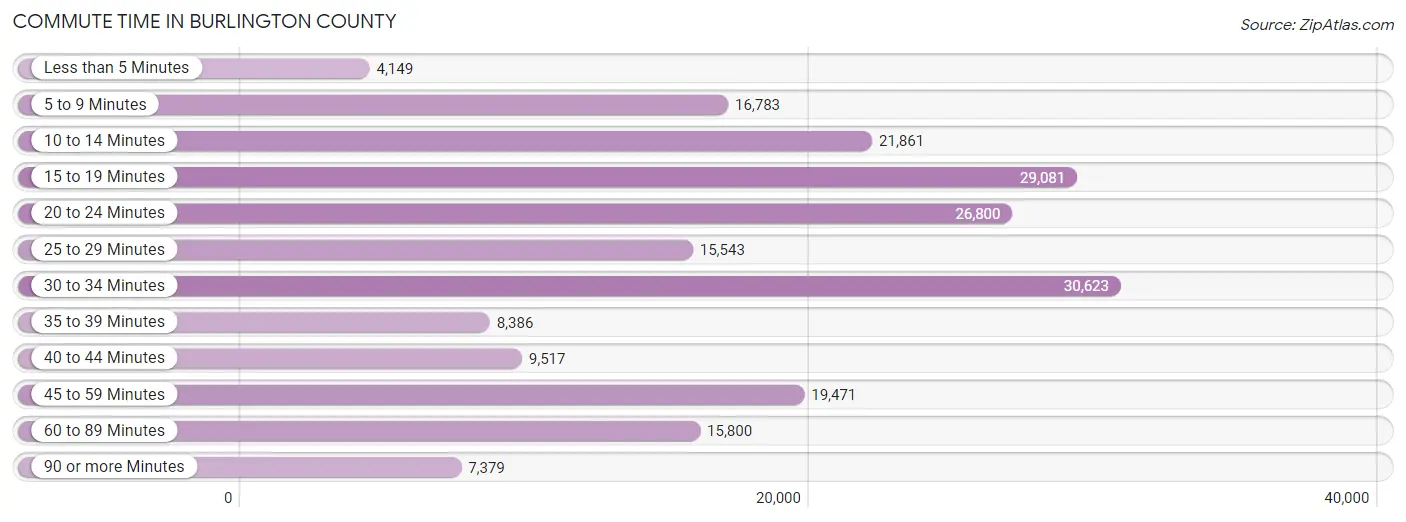
| Commute Time | # Commuters | % Commuters |
| Less than 5 Minutes | 4,149 | 2.0% |
| 5 to 9 Minutes | 16,783 | 8.2% |
| 10 to 14 Minutes | 21,861 | 10.6% |
| 15 to 19 Minutes | 29,081 | 14.2% |
| 20 to 24 Minutes | 26,800 | 13.1% |
| 25 to 29 Minutes | 15,543 | 7.6% |
| 30 to 34 Minutes | 30,623 | 14.9% |
| 35 to 39 Minutes | 8,386 | 4.1% |
| 40 to 44 Minutes | 9,517 | 4.6% |
| 45 to 59 Minutes | 19,471 | 9.5% |
| 60 to 89 Minutes | 15,800 | 7.7% |
| 90 or more Minutes | 7,379 | 3.6% |
Commute Time by Sex in Burlington County
The most common commute times in Burlington County are 30 to 34 minutes (16,779 commuters, 15.5%) for males and 15 to 19 minutes (14,733 commuters, 15.2%) for females.
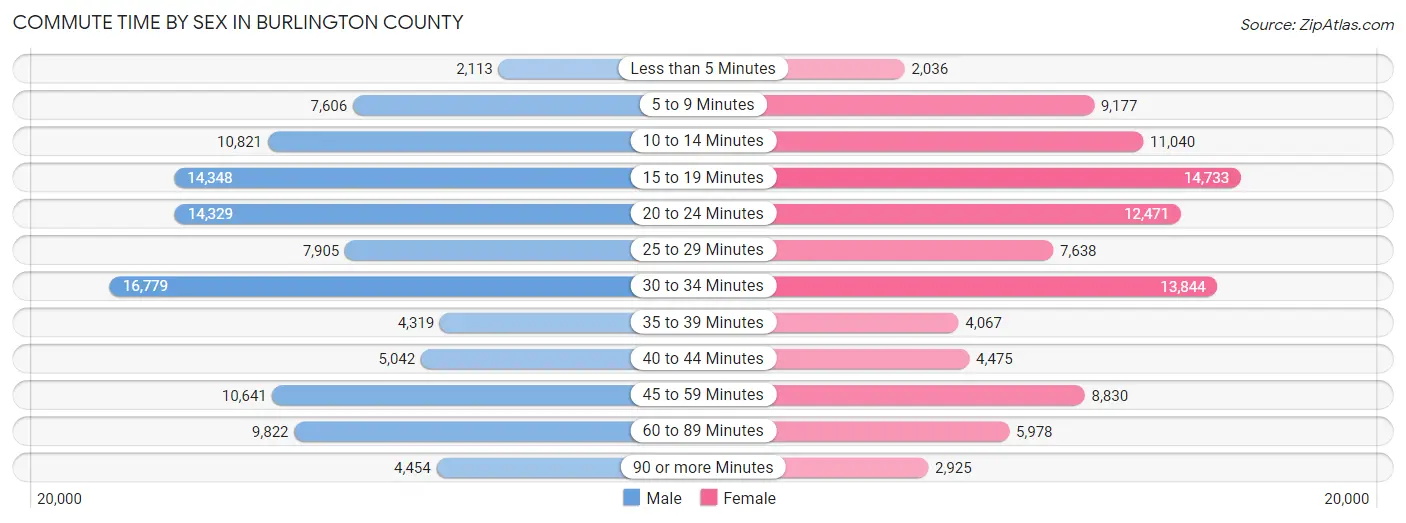
| Commute Time | Male | Female |
| Less than 5 Minutes | 2,113 (1.9%) | 2,036 (2.1%) |
| 5 to 9 Minutes | 7,606 (7.0%) | 9,177 (9.4%) |
| 10 to 14 Minutes | 10,821 (10.0%) | 11,040 (11.4%) |
| 15 to 19 Minutes | 14,348 (13.3%) | 14,733 (15.2%) |
| 20 to 24 Minutes | 14,329 (13.3%) | 12,471 (12.8%) |
| 25 to 29 Minutes | 7,905 (7.3%) | 7,638 (7.9%) |
| 30 to 34 Minutes | 16,779 (15.5%) | 13,844 (14.2%) |
| 35 to 39 Minutes | 4,319 (4.0%) | 4,067 (4.2%) |
| 40 to 44 Minutes | 5,042 (4.7%) | 4,475 (4.6%) |
| 45 to 59 Minutes | 10,641 (9.8%) | 8,830 (9.1%) |
| 60 to 89 Minutes | 9,822 (9.1%) | 5,978 (6.1%) |
| 90 or more Minutes | 4,454 (4.1%) | 2,925 (3.0%) |
Time of Departure to Work by Sex in Burlington County
The most frequent times of departure to work in Burlington County are 7:00 AM to 7:29 AM (15,331, 14.2%) for males and 7:30 AM to 7:59 AM (15,304, 15.7%) for females.
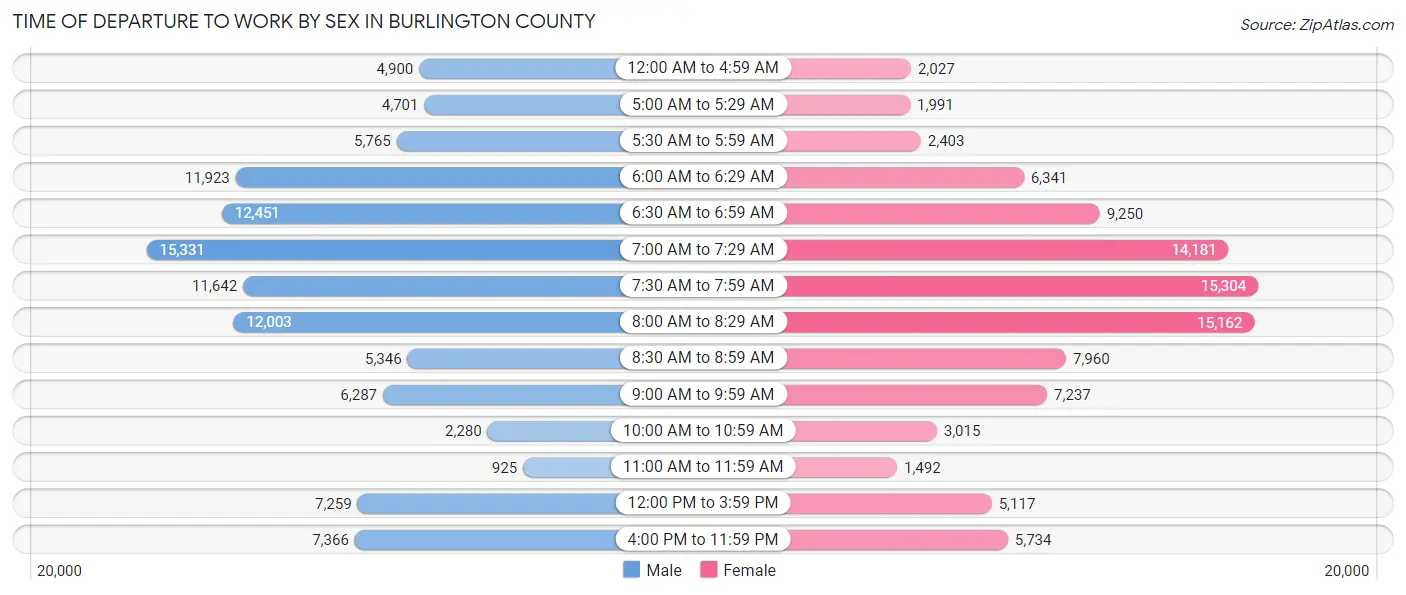
| Time of Departure | Male | Female |
| 12:00 AM to 4:59 AM | 4,900 (4.5%) | 2,027 (2.1%) |
| 5:00 AM to 5:29 AM | 4,701 (4.3%) | 1,991 (2.1%) |
| 5:30 AM to 5:59 AM | 5,765 (5.3%) | 2,403 (2.5%) |
| 6:00 AM to 6:29 AM | 11,923 (11.0%) | 6,341 (6.5%) |
| 6:30 AM to 6:59 AM | 12,451 (11.5%) | 9,250 (9.5%) |
| 7:00 AM to 7:29 AM | 15,331 (14.2%) | 14,181 (14.6%) |
| 7:30 AM to 7:59 AM | 11,642 (10.8%) | 15,304 (15.7%) |
| 8:00 AM to 8:29 AM | 12,003 (11.1%) | 15,162 (15.6%) |
| 8:30 AM to 8:59 AM | 5,346 (4.9%) | 7,960 (8.2%) |
| 9:00 AM to 9:59 AM | 6,287 (5.8%) | 7,237 (7.4%) |
| 10:00 AM to 10:59 AM | 2,280 (2.1%) | 3,015 (3.1%) |
| 11:00 AM to 11:59 AM | 925 (0.9%) | 1,492 (1.5%) |
| 12:00 PM to 3:59 PM | 7,259 (6.7%) | 5,117 (5.3%) |
| 4:00 PM to 11:59 PM | 7,366 (6.8%) | 5,734 (5.9%) |
| Total | 108,179 (100.0%) | 97,214 (100.0%) |
Housing Occupancy in Burlington County
Occupancy by Ownership in Burlington County
Of the total 174,454 dwellings in Burlington County, owner-occupied units account for 132,314 (75.8%), while renter-occupied units make up 42,140 (24.2%).
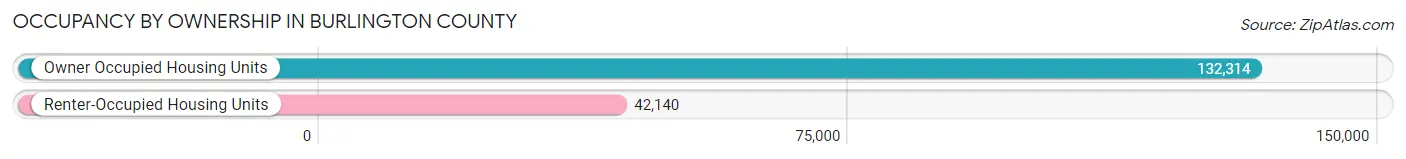
| Occupancy | # Housing Units | % Housing Units |
| Owner Occupied Housing Units | 132,314 | 75.8% |
| Renter-Occupied Housing Units | 42,140 | 24.2% |
| Total Occupied Housing Units | 174,454 | 100.0% |
Occupancy by Household Size in Burlington County
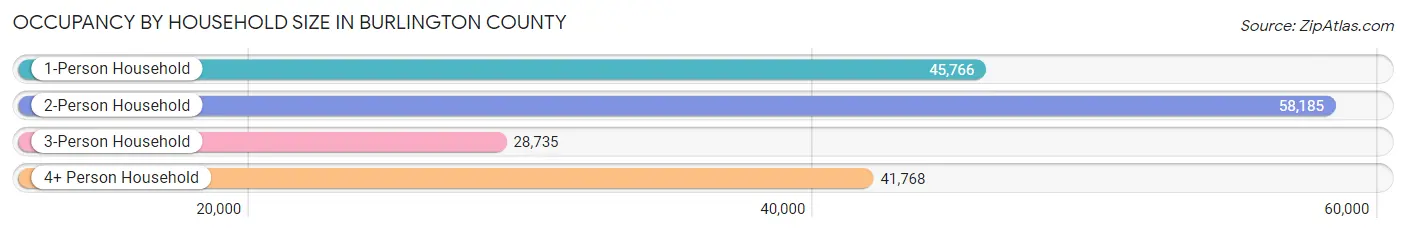
| Household Size | # Housing Units | % Housing Units |
| 1-Person Household | 45,766 | 26.2% |
| 2-Person Household | 58,185 | 33.4% |
| 3-Person Household | 28,735 | 16.5% |
| 4+ Person Household | 41,768 | 23.9% |
| Total Housing Units | 174,454 | 100.0% |
Occupancy by Ownership by Household Size in Burlington County
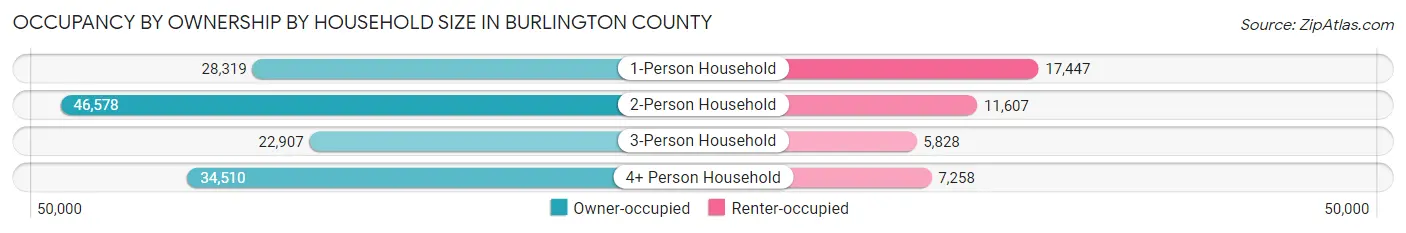
| Household Size | Owner-occupied | Renter-occupied |
| 1-Person Household | 28,319 (61.9%) | 17,447 (38.1%) |
| 2-Person Household | 46,578 (80.0%) | 11,607 (20.0%) |
| 3-Person Household | 22,907 (79.7%) | 5,828 (20.3%) |
| 4+ Person Household | 34,510 (82.6%) | 7,258 (17.4%) |
| Total Housing Units | 132,314 (75.8%) | 42,140 (24.2%) |
Occupancy by Educational Attainment in Burlington County
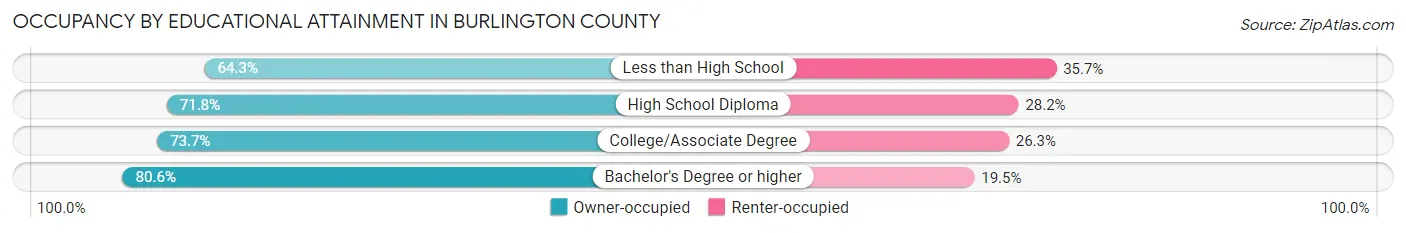
| Household Size | Owner-occupied | Renter-occupied |
| Less than High School | 5,614 (64.3%) | 3,115 (35.7%) |
| High School Diploma | 28,460 (71.8%) | 11,185 (28.2%) |
| College/Associate Degree | 35,660 (73.7%) | 12,728 (26.3%) |
| Bachelor's Degree or higher | 62,580 (80.5%) | 15,112 (19.5%) |
Occupancy by Age of Householder in Burlington County
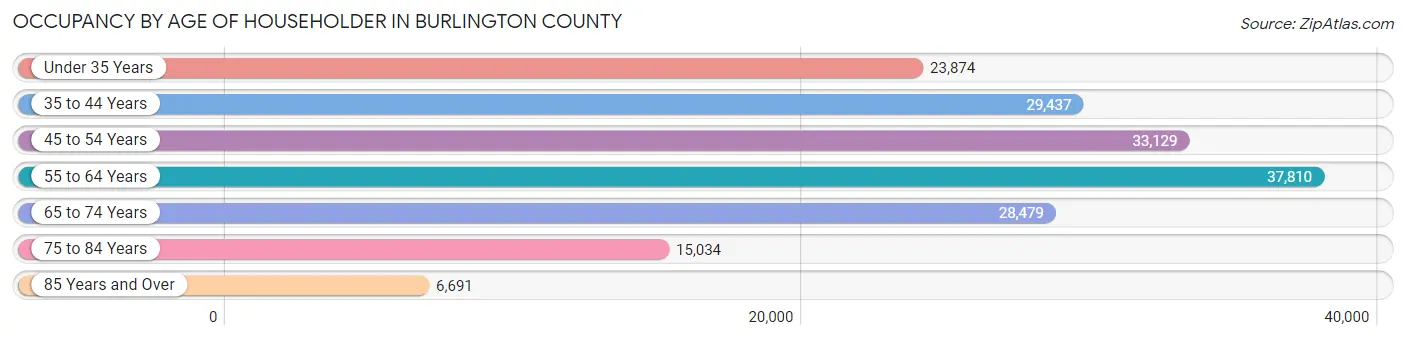
| Age Bracket | # Households | % Households |
| Under 35 Years | 23,874 | 13.7% |
| 35 to 44 Years | 29,437 | 16.9% |
| 45 to 54 Years | 33,129 | 19.0% |
| 55 to 64 Years | 37,810 | 21.7% |
| 65 to 74 Years | 28,479 | 16.3% |
| 75 to 84 Years | 15,034 | 8.6% |
| 85 Years and Over | 6,691 | 3.8% |
| Total | 174,454 | 100.0% |
Housing Finances in Burlington County
Median Income by Occupancy in Burlington County
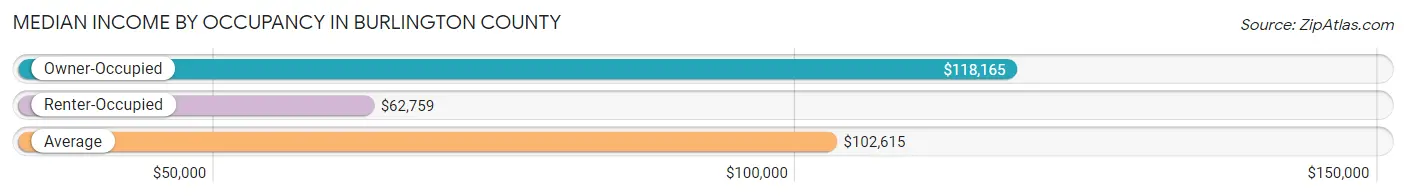
| Occupancy Type | # Households | Median Income |
| Owner-Occupied | 132,314 (75.8%) | $118,165 |
| Renter-Occupied | 42,140 (24.2%) | $62,759 |
| Average | 174,454 (100.0%) | $102,615 |
Occupancy by Householder Income Bracket in Burlington County
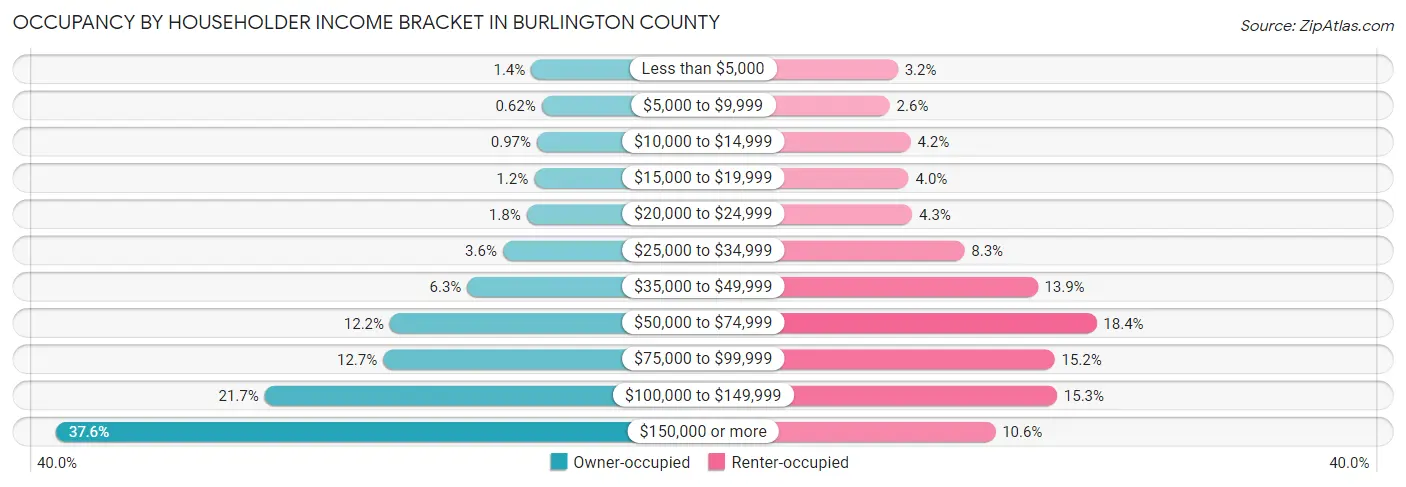
| Income Bracket | Owner-occupied | Renter-occupied |
| Less than $5,000 | 1,869 (1.4%) | 1,352 (3.2%) |
| $5,000 to $9,999 | 820 (0.6%) | 1,097 (2.6%) |
| $10,000 to $14,999 | 1,282 (1.0%) | 1,767 (4.2%) |
| $15,000 to $19,999 | 1,579 (1.2%) | 1,703 (4.0%) |
| $20,000 to $24,999 | 2,332 (1.8%) | 1,816 (4.3%) |
| $25,000 to $34,999 | 4,718 (3.6%) | 3,494 (8.3%) |
| $35,000 to $49,999 | 8,308 (6.3%) | 5,841 (13.9%) |
| $50,000 to $74,999 | 16,104 (12.2%) | 7,734 (18.3%) |
| $75,000 to $99,999 | 16,795 (12.7%) | 6,387 (15.2%) |
| $100,000 to $149,999 | 28,736 (21.7%) | 6,466 (15.3%) |
| $150,000 or more | 49,771 (37.6%) | 4,483 (10.6%) |
| Total | 132,314 (100.0%) | 42,140 (100.0%) |
Monthly Housing Cost Tiers in Burlington County
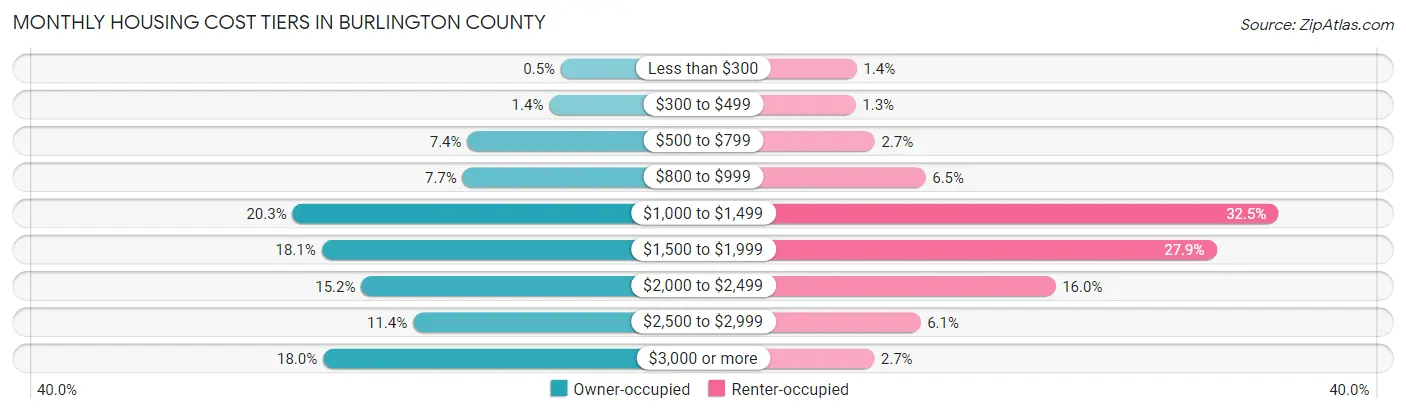
| Monthly Cost | Owner-occupied | Renter-occupied |
| Less than $300 | 661 (0.5%) | 589 (1.4%) |
| $300 to $499 | 1,802 (1.4%) | 556 (1.3%) |
| $500 to $799 | 9,774 (7.4%) | 1,151 (2.7%) |
| $800 to $999 | 10,239 (7.7%) | 2,725 (6.5%) |
| $1,000 to $1,499 | 26,821 (20.3%) | 13,677 (32.5%) |
| $1,500 to $1,999 | 23,987 (18.1%) | 11,757 (27.9%) |
| $2,000 to $2,499 | 20,116 (15.2%) | 6,759 (16.0%) |
| $2,500 to $2,999 | 15,066 (11.4%) | 2,570 (6.1%) |
| $3,000 or more | 23,848 (18.0%) | 1,131 (2.7%) |
| Total | 132,314 (100.0%) | 42,140 (100.0%) |
Physical Housing Characteristics in Burlington County
Housing Structures in Burlington County
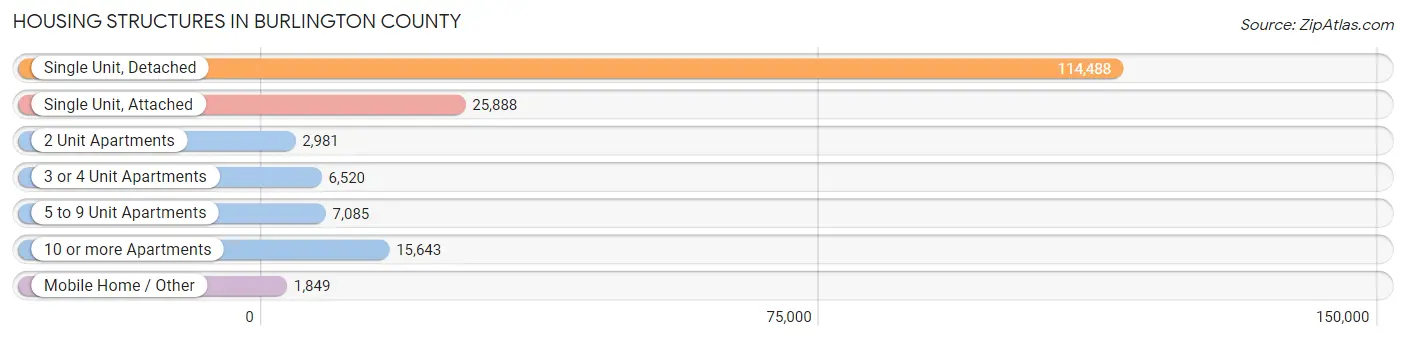
| Structure Type | # Housing Units | % Housing Units |
| Single Unit, Detached | 114,488 | 65.6% |
| Single Unit, Attached | 25,888 | 14.8% |
| 2 Unit Apartments | 2,981 | 1.7% |
| 3 or 4 Unit Apartments | 6,520 | 3.7% |
| 5 to 9 Unit Apartments | 7,085 | 4.1% |
| 10 or more Apartments | 15,643 | 9.0% |
| Mobile Home / Other | 1,849 | 1.1% |
| Total | 174,454 | 100.0% |
Housing Structures by Occupancy in Burlington County
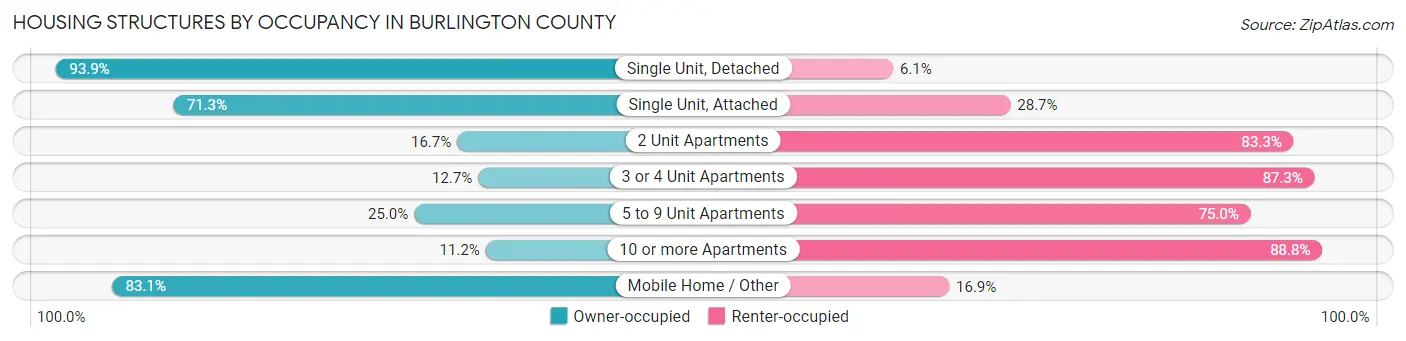
| Structure Type | Owner-occupied | Renter-occupied |
| Single Unit, Detached | 107,474 (93.9%) | 7,014 (6.1%) |
| Single Unit, Attached | 18,450 (71.3%) | 7,438 (28.7%) |
| 2 Unit Apartments | 499 (16.7%) | 2,482 (83.3%) |
| 3 or 4 Unit Apartments | 827 (12.7%) | 5,693 (87.3%) |
| 5 to 9 Unit Apartments | 1,772 (25.0%) | 5,313 (75.0%) |
| 10 or more Apartments | 1,756 (11.2%) | 13,887 (88.8%) |
| Mobile Home / Other | 1,536 (83.1%) | 313 (16.9%) |
| Total | 132,314 (75.8%) | 42,140 (24.2%) |
Housing Structures by Number of Rooms in Burlington County

| Number of Rooms | Owner-occupied | Renter-occupied |
| 1 Room | 208 (0.2%) | 1,481 (3.5%) |
| 2 or 3 Rooms | 1,905 (1.4%) | 11,669 (27.7%) |
| 4 or 5 Rooms | 23,473 (17.7%) | 16,968 (40.3%) |
| 6 or 7 Rooms | 45,978 (34.7%) | 8,749 (20.8%) |
| 8 or more Rooms | 60,750 (45.9%) | 3,273 (7.8%) |
| Total | 132,314 (100.0%) | 42,140 (100.0%) |
Housing Structure by Heating Type in Burlington County
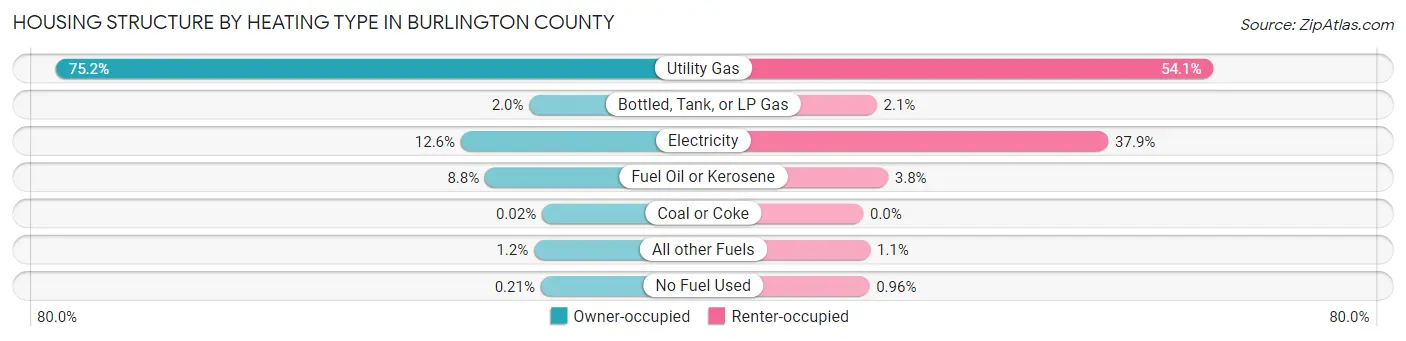
| Heating Type | Owner-occupied | Renter-occupied |
| Utility Gas | 99,461 (75.2%) | 22,813 (54.1%) |
| Bottled, Tank, or LP Gas | 2,626 (2.0%) | 881 (2.1%) |
| Electricity | 16,614 (12.6%) | 15,965 (37.9%) |
| Fuel Oil or Kerosene | 11,664 (8.8%) | 1,619 (3.8%) |
| Coal or Coke | 24 (0.0%) | 0 (0.0%) |
| All other Fuels | 1,646 (1.2%) | 456 (1.1%) |
| No Fuel Used | 279 (0.2%) | 406 (1.0%) |
| Total | 132,314 (100.0%) | 42,140 (100.0%) |
Household Vehicle Usage in Burlington County
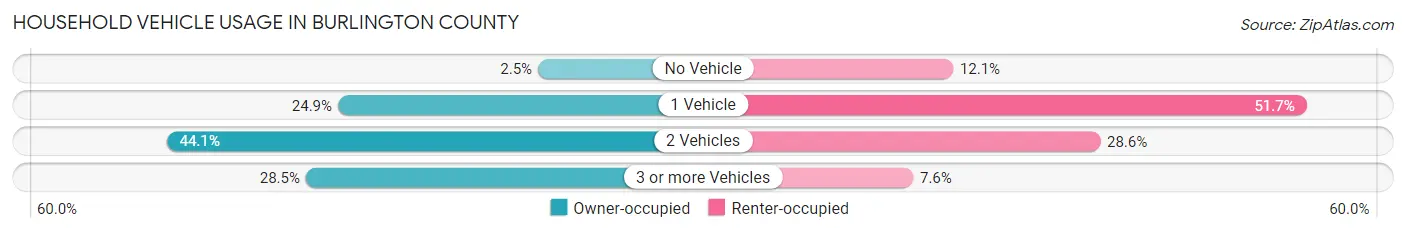
| Vehicles per Household | Owner-occupied | Renter-occupied |
| No Vehicle | 3,303 (2.5%) | 5,097 (12.1%) |
| 1 Vehicle | 32,955 (24.9%) | 21,787 (51.7%) |
| 2 Vehicles | 58,348 (44.1%) | 12,042 (28.6%) |
| 3 or more Vehicles | 37,708 (28.5%) | 3,214 (7.6%) |
| Total | 132,314 (100.0%) | 42,140 (100.0%) |
Real Estate & Mortgages in Burlington County
Real Estate and Mortgage Overview in Burlington County
| Characteristic | Without Mortgage | With Mortgage |
| Housing Units | 43,105 | 89,209 |
| Median Property Value | $288,300 | $313,500 |
| Median Household Income | $92,222 | $38,613 |
| Monthly Housing Costs | $1,031 | $23,349 |
| Real Estate Taxes | $7,390 | $1,812 |
Property Value by Mortgage Status in Burlington County
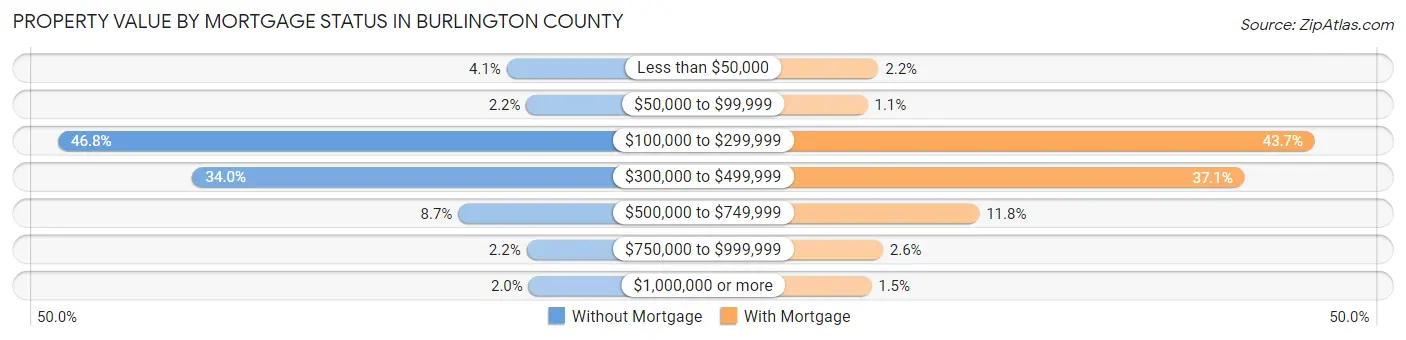
| Property Value | Without Mortgage | With Mortgage |
| Less than $50,000 | 1,761 (4.1%) | 1,934 (2.2%) |
| $50,000 to $99,999 | 951 (2.2%) | 1,018 (1.1%) |
| $100,000 to $299,999 | 20,175 (46.8%) | 39,023 (43.7%) |
| $300,000 to $499,999 | 14,653 (34.0%) | 33,067 (37.1%) |
| $500,000 to $749,999 | 3,756 (8.7%) | 10,510 (11.8%) |
| $750,000 to $999,999 | 947 (2.2%) | 2,318 (2.6%) |
| $1,000,000 or more | 862 (2.0%) | 1,339 (1.5%) |
| Total | 43,105 (100.0%) | 89,209 (100.0%) |
Household Income by Mortgage Status in Burlington County
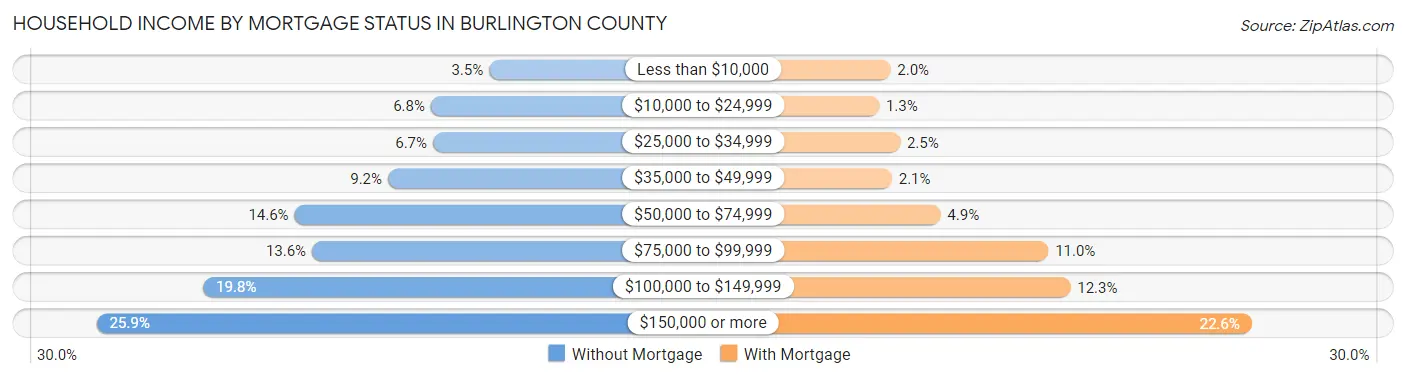
| Household Income | Without Mortgage | With Mortgage |
| Less than $10,000 | 1,490 (3.5%) | 1,777 (2.0%) |
| $10,000 to $24,999 | 2,925 (6.8%) | 1,199 (1.3%) |
| $25,000 to $34,999 | 2,875 (6.7%) | 2,268 (2.5%) |
| $35,000 to $49,999 | 3,984 (9.2%) | 1,843 (2.1%) |
| $50,000 to $74,999 | 6,285 (14.6%) | 4,324 (4.9%) |
| $75,000 to $99,999 | 5,853 (13.6%) | 9,819 (11.0%) |
| $100,000 to $149,999 | 8,535 (19.8%) | 10,942 (12.3%) |
| $150,000 or more | 11,158 (25.9%) | 20,201 (22.6%) |
| Total | 43,105 (100.0%) | 89,209 (100.0%) |
Property Value to Household Income Ratio in Burlington County
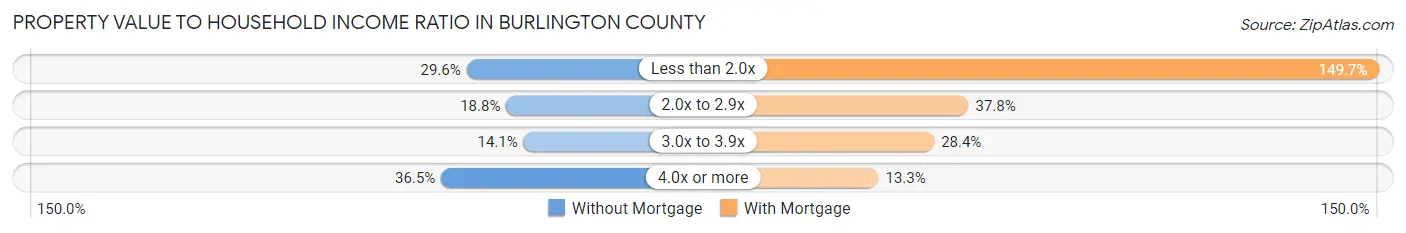
| Value-to-Income Ratio | Without Mortgage | With Mortgage |
| Less than 2.0x | 12,758 (29.6%) | 133,511 (149.7%) |
| 2.0x to 2.9x | 8,100 (18.8%) | 33,684 (37.8%) |
| 3.0x to 3.9x | 6,065 (14.1%) | 25,341 (28.4%) |
| 4.0x or more | 15,741 (36.5%) | 11,824 (13.3%) |
| Total | 43,105 (100.0%) | 89,209 (100.0%) |
Real Estate Taxes by Mortgage Status in Burlington County
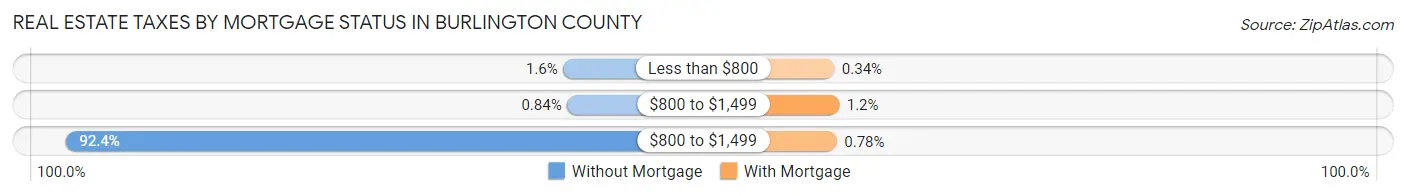
| Property Taxes | Without Mortgage | With Mortgage |
| Less than $800 | 666 (1.5%) | 301 (0.3%) |
| $800 to $1,499 | 363 (0.8%) | 1,097 (1.2%) |
| $800 to $1,499 | 39,813 (92.4%) | 698 (0.8%) |
| Total | 43,105 (100.0%) | 89,209 (100.0%) |
Health & Disability in Burlington County
Health Insurance Coverage by Age in Burlington County
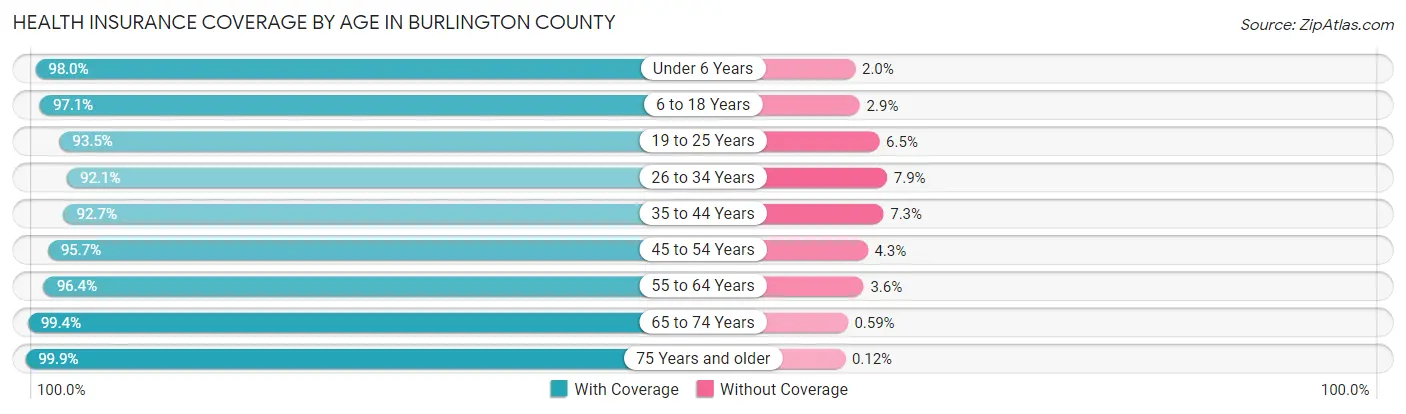
| Age Bracket | With Coverage | Without Coverage |
| Under 6 Years | 27,996 (98.0%) | 571 (2.0%) |
| 6 to 18 Years | 69,540 (97.1%) | 2,052 (2.9%) |
| 19 to 25 Years | 33,101 (93.5%) | 2,301 (6.5%) |
| 26 to 34 Years | 44,303 (92.1%) | 3,814 (7.9%) |
| 35 to 44 Years | 51,808 (92.7%) | 4,062 (7.3%) |
| 45 to 54 Years | 58,505 (95.7%) | 2,644 (4.3%) |
| 55 to 64 Years | 64,808 (96.4%) | 2,399 (3.6%) |
| 65 to 74 Years | 45,548 (99.4%) | 269 (0.6%) |
| 75 Years and older | 33,370 (99.9%) | 41 (0.1%) |
| Total | 428,979 (95.9%) | 18,153 (4.1%) |
Health Insurance Coverage by Citizenship Status in Burlington County
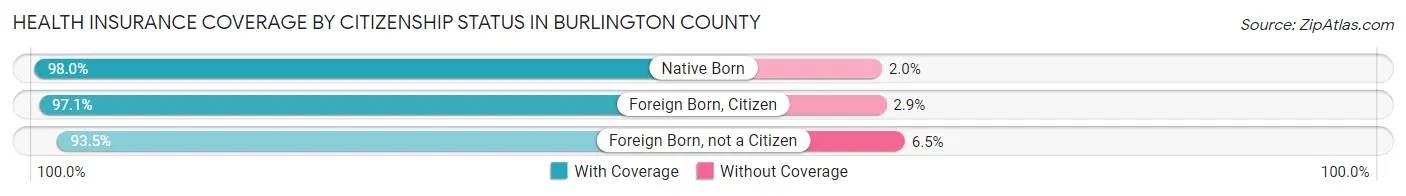
| Citizenship Status | With Coverage | Without Coverage |
| Native Born | 27,996 (98.0%) | 571 (2.0%) |
| Foreign Born, Citizen | 69,540 (97.1%) | 2,052 (2.9%) |
| Foreign Born, not a Citizen | 33,101 (93.5%) | 2,301 (6.5%) |
Health Insurance Coverage by Household Income in Burlington County
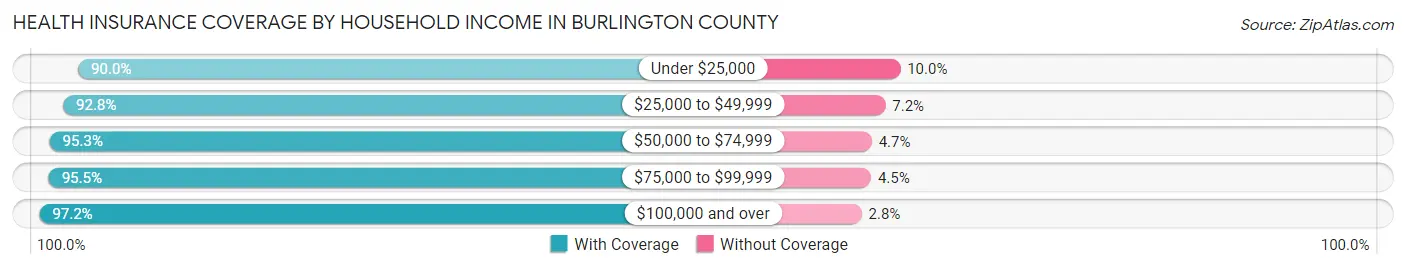
| Household Income | With Coverage | Without Coverage |
| Under $25,000 | 24,665 (90.0%) | 2,743 (10.0%) |
| $25,000 to $49,999 | 39,080 (92.8%) | 3,039 (7.2%) |
| $50,000 to $74,999 | 46,084 (95.3%) | 2,259 (4.7%) |
| $75,000 to $99,999 | 51,829 (95.5%) | 2,457 (4.5%) |
| $100,000 and over | 266,291 (97.2%) | 7,612 (2.8%) |
Public vs Private Health Insurance Coverage by Age in Burlington County
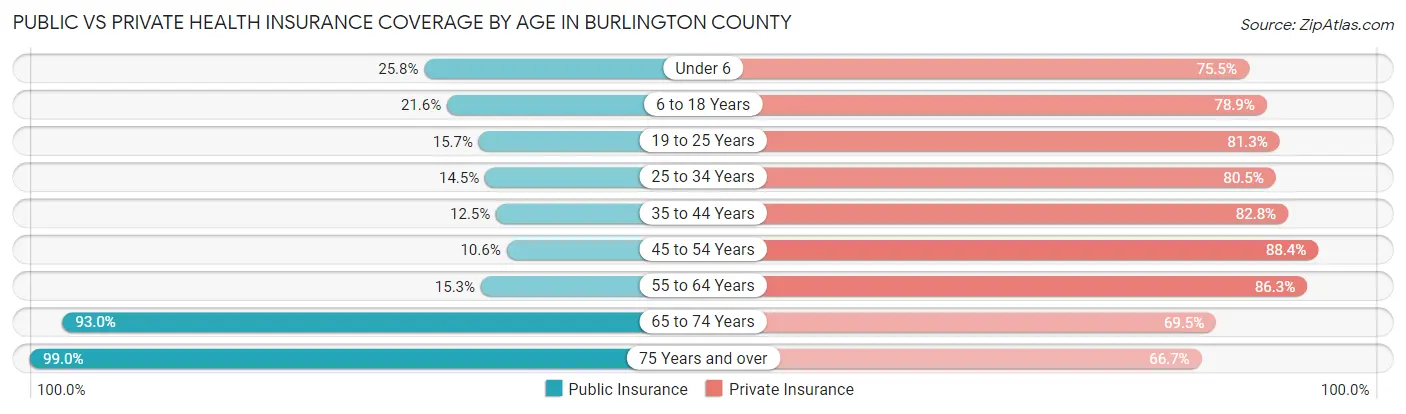
| Age Bracket | Public Insurance | Private Insurance |
| Under 6 | 7,374 (25.8%) | 21,576 (75.5%) |
| 6 to 18 Years | 15,454 (21.6%) | 56,451 (78.8%) |
| 19 to 25 Years | 5,557 (15.7%) | 28,764 (81.2%) |
| 25 to 34 Years | 6,991 (14.5%) | 38,745 (80.5%) |
| 35 to 44 Years | 6,971 (12.5%) | 46,262 (82.8%) |
| 45 to 54 Years | 6,459 (10.6%) | 54,055 (88.4%) |
| 55 to 64 Years | 10,291 (15.3%) | 58,027 (86.3%) |
| 65 to 74 Years | 42,600 (93.0%) | 31,829 (69.5%) |
| 75 Years and over | 33,062 (99.0%) | 22,299 (66.7%) |
| Total | 134,759 (30.1%) | 358,008 (80.1%) |
Disability Status by Sex by Age in Burlington County
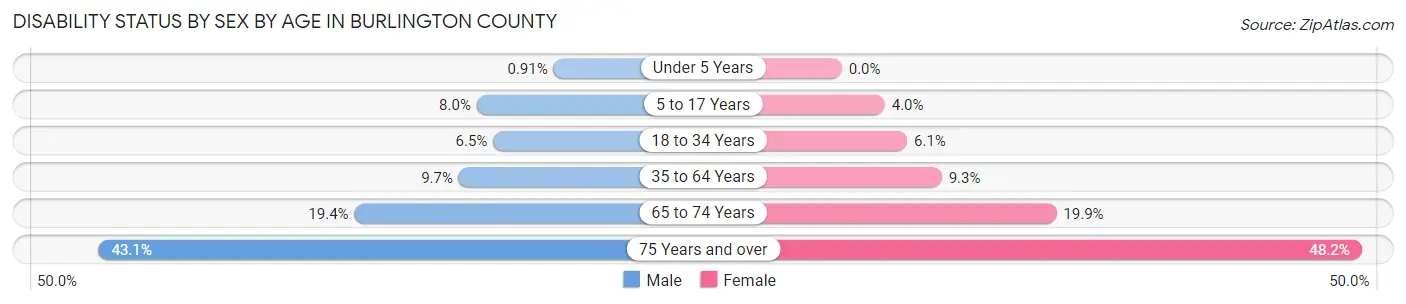
| Age Bracket | Male | Female |
| Under 5 Years | 109 (0.9%) | 0 (0.0%) |
| 5 to 17 Years | 2,932 (8.0%) | 1,408 (4.0%) |
| 18 to 34 Years | 2,850 (6.5%) | 2,724 (6.1%) |
| 35 to 64 Years | 8,688 (9.7%) | 8,771 (9.3%) |
| 65 to 74 Years | 4,094 (19.4%) | 4,921 (19.9%) |
| 75 Years and over | 5,813 (43.1%) | 9,616 (48.2%) |
Disability Class by Sex by Age in Burlington County
Disability Class: Hearing Difficulty
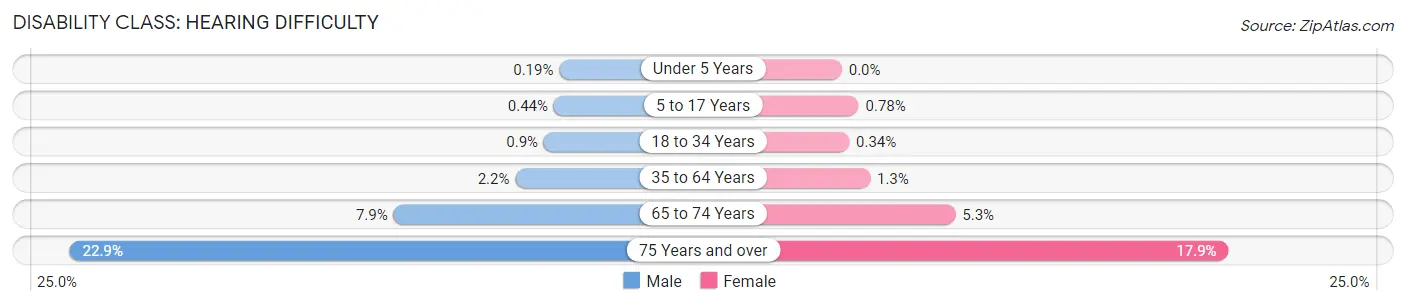
| Age Bracket | Male | Female |
| Under 5 Years | 23 (0.2%) | 0 (0.0%) |
| 5 to 17 Years | 162 (0.4%) | 275 (0.8%) |
| 18 to 34 Years | 394 (0.9%) | 151 (0.3%) |
| 35 to 64 Years | 2,001 (2.2%) | 1,239 (1.3%) |
| 65 to 74 Years | 1,663 (7.9%) | 1,302 (5.3%) |
| 75 Years and over | 3,087 (22.9%) | 3,576 (17.9%) |
Disability Class: Vision Difficulty
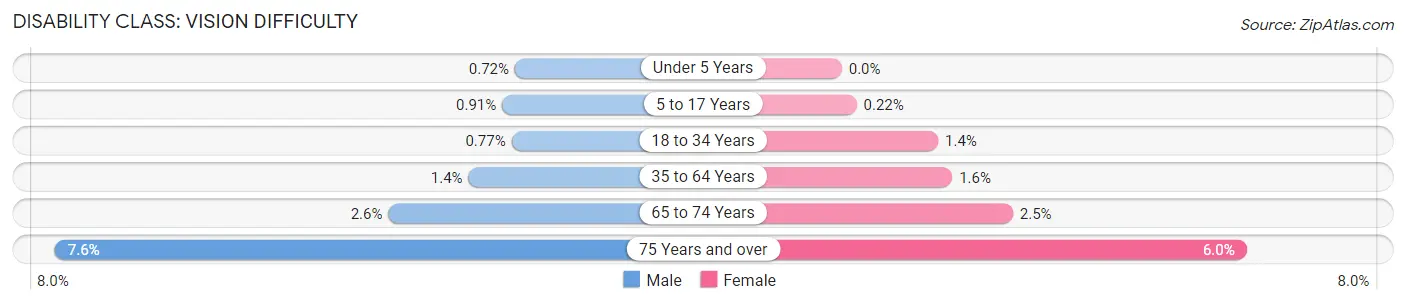
| Age Bracket | Male | Female |
| Under 5 Years | 86 (0.7%) | 0 (0.0%) |
| 5 to 17 Years | 331 (0.9%) | 79 (0.2%) |
| 18 to 34 Years | 338 (0.8%) | 642 (1.4%) |
| 35 to 64 Years | 1,261 (1.4%) | 1,555 (1.6%) |
| 65 to 74 Years | 549 (2.6%) | 627 (2.5%) |
| 75 Years and over | 1,018 (7.5%) | 1,198 (6.0%) |
Disability Class: Cognitive Difficulty
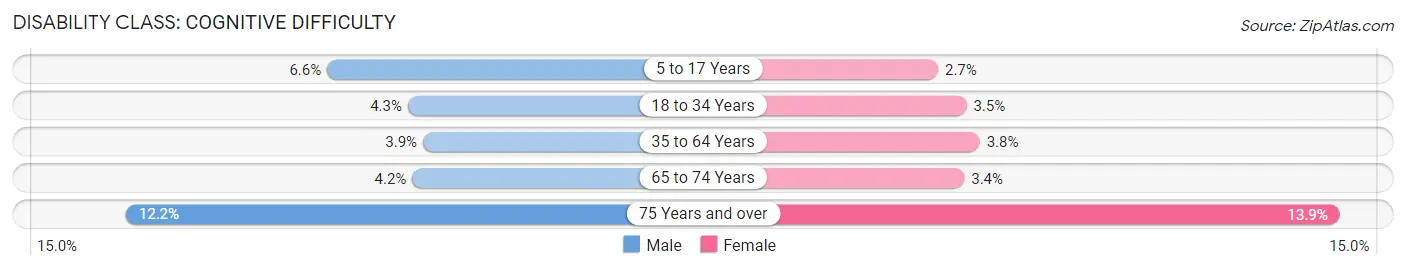
| Age Bracket | Male | Female |
| 5 to 17 Years | 2,399 (6.6%) | 948 (2.7%) |
| 18 to 34 Years | 1,893 (4.3%) | 1,558 (3.5%) |
| 35 to 64 Years | 3,506 (3.9%) | 3,632 (3.8%) |
| 65 to 74 Years | 888 (4.2%) | 843 (3.4%) |
| 75 Years and over | 1,641 (12.2%) | 2,763 (13.9%) |
Disability Class: Ambulatory Difficulty
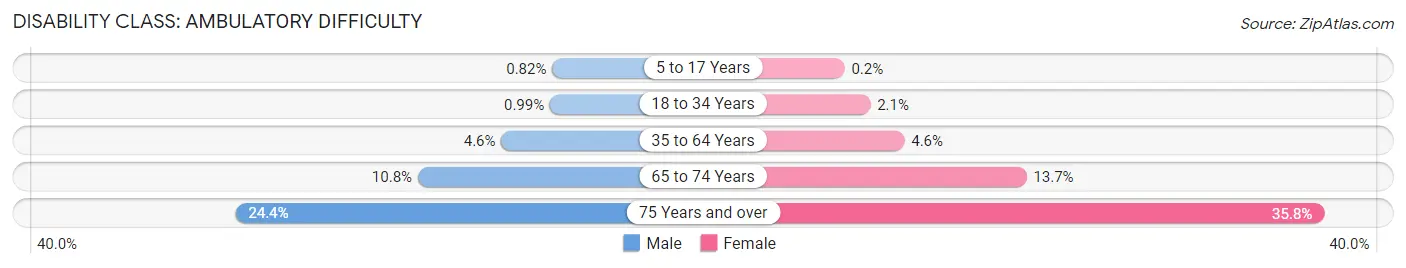
| Age Bracket | Male | Female |
| 5 to 17 Years | 298 (0.8%) | 71 (0.2%) |
| 18 to 34 Years | 434 (1.0%) | 948 (2.1%) |
| 35 to 64 Years | 4,120 (4.6%) | 4,394 (4.6%) |
| 65 to 74 Years | 2,279 (10.8%) | 3,388 (13.7%) |
| 75 Years and over | 3,282 (24.3%) | 7,139 (35.8%) |
Disability Class: Self-Care Difficulty
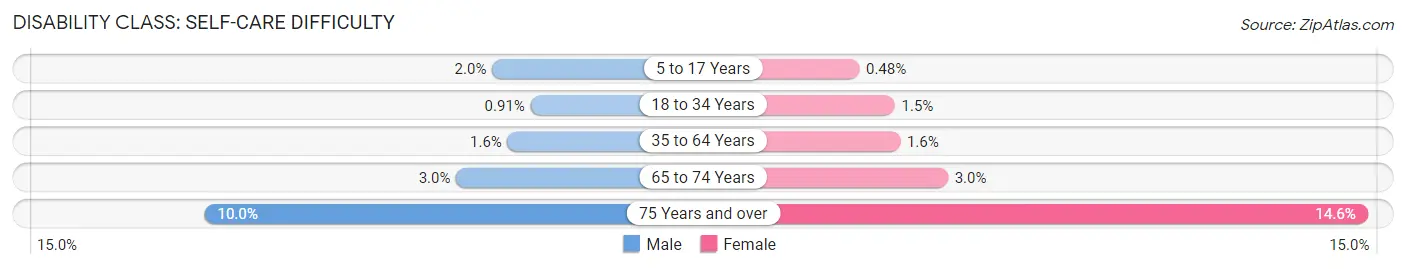
| Age Bracket | Male | Female |
| 5 to 17 Years | 722 (2.0%) | 169 (0.5%) |
| 18 to 34 Years | 397 (0.9%) | 662 (1.5%) |
| 35 to 64 Years | 1,384 (1.5%) | 1,532 (1.6%) |
| 65 to 74 Years | 630 (3.0%) | 729 (2.9%) |
| 75 Years and over | 1,346 (10.0%) | 2,919 (14.6%) |
Technology Access in Burlington County
Computing Device Access in Burlington County
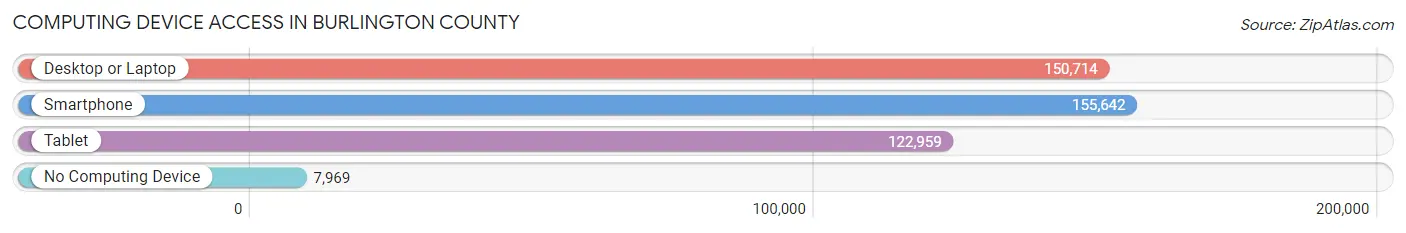
| Device Type | # Households | % Households |
| Desktop or Laptop | 150,714 | 86.4% |
| Smartphone | 155,642 | 89.2% |
| Tablet | 122,959 | 70.5% |
| No Computing Device | 7,969 | 4.6% |
| Total | 174,454 | 100.0% |
Internet Access in Burlington County
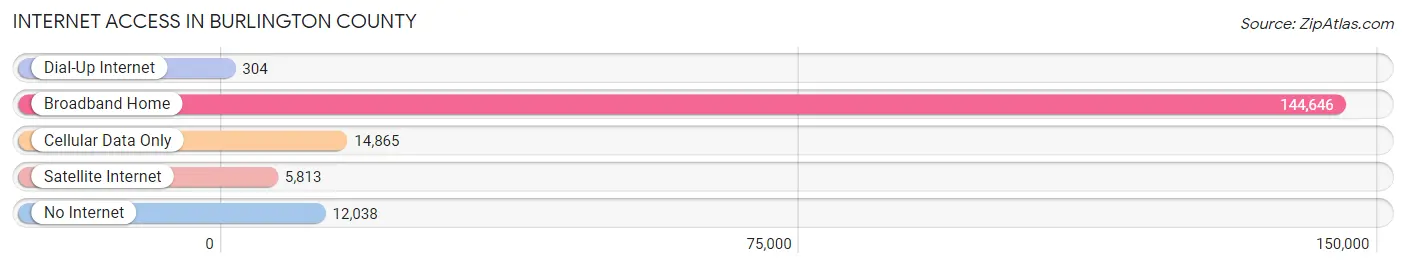
| Internet Type | # Households | % Households |
| Dial-Up Internet | 304 | 0.2% |
| Broadband Home | 144,646 | 82.9% |
| Cellular Data Only | 14,865 | 8.5% |
| Satellite Internet | 5,813 | 3.3% |
| No Internet | 12,038 | 6.9% |
| Total | 174,454 | 100.0% |
Burlington County Summary
Burlington County, New Jersey is located in the southern part of the state and is part of the Delaware Valley region. It is the largest county in New Jersey by area, covering 819 square miles. The county is bordered by the Delaware River to the east, the Atlantic Ocean to the south, and Pennsylvania to the west. The county seat is Mount Holly, and the largest city is Willingboro.
History
Burlington County was established in 1694, making it one of the oldest counties in the United States. It was named after the English town of Bridlington, which was the hometown of the first governor of New Jersey, William Penn. The county was originally part of West Jersey, one of the two provinces that made up the colony of New Jersey.
The county was home to several Native American tribes, including the Lenape, Susquehannock, and Nanticoke. The first European settlers arrived in the area in the 1680s, and the county was officially established in 1694.
During the American Revolution, the county was a major center of activity. The Battle of Iron Works Hill was fought in the county in 1777, and the Battle of Red Bank was fought in 1777.
In the 19th century, the county was an important center of industry. The first glass factory in the United States was established in the county in 1739, and the first paper mill in the United States was established in the county in 1795. The county was also home to several ironworks, which produced iron for the Union Army during the Civil War.
Geography
Burlington County is located in the southern part of New Jersey and is part of the Delaware Valley region. It is bordered by the Delaware River to the east, the Atlantic Ocean to the south, and Pennsylvania to the west. The county is 819 square miles in area and is the largest county in New Jersey.
The county is divided into two distinct regions: the Coastal Plain and the Piedmont. The Coastal Plain is located in the southern part of the county and is characterized by flat terrain and sandy soils. The Piedmont is located in the northern part of the county and is characterized by rolling hills and rocky soils.
The county is home to several rivers, including the Rancocas Creek, the Assiscunk Creek, and the Mullica River. The county is also home to several lakes, including Lake Assunpink, Lake Oswego, and Lake Neshaminy.
Economy
Burlington County has a diverse economy that is driven by several industries, including manufacturing, healthcare, retail, and tourism. The county is home to several major employers, including Lockheed Martin, Virtua Health, and the Joint Base McGuire-Dix-Lakehurst.
The county is also home to several major shopping centers, including the Moorestown Mall, the Cherry Hill Mall, and the Burlington Center Mall. The county is also home to several tourist attractions, including the Smithville Mansion, the Burlington County Prison Museum, and the Burlington County Historical Society.
Demographics
As of the 2010 census, Burlington County had a population of 448,734. The population is racially diverse, with the largest racial group being White (77.2%), followed by African American (13.2%), Hispanic or Latino (7.2%), and Asian (2.2%).
The median household income in the county is $76,845, and the median home value is $269,400. The county has a poverty rate of 8.2%, and the unemployment rate is 4.2%.
Conclusion
Burlington County, New Jersey is a large county located in the southern part of the state. It has a long and rich history, and it is home to several major industries, including manufacturing, healthcare, retail, and tourism. The county is racially diverse, and it has a median household income of $76,845 and a median home value of $269,400.
Common Questions
What is the Total Population of Burlington County?
Total Population of Burlington County is 461,853.
What is the Total Male Population of Burlington County?
Total Male Population of Burlington County is 228,468.
What is the Total Female Population of Burlington County?
Total Female Population of Burlington County is 233,385.
What is the Ratio of Males per 100 Females in Burlington County?
There are 97.89 Males per 100 Females in Burlington County.
What is the Ratio of Females per 100 Males in Burlington County?
There are 102.15 Females per 100 Males in Burlington County.
What is the Median Population Age in Burlington County?
Median Population Age in Burlington County is 41.7 Years.
What is the Average Family Size in Burlington County
Average Family Size in Burlington County is 3.1 People.
What is the Average Household Size in Burlington County
Average Household Size in Burlington County is 2.6 People.
What is Per Capita Income in Burlington County?
Per Capita income in Burlington County is $51,549.
What is the Median Family Income in Burlington County?
Median Family Income in Burlington County is $122,708.
What is the Median Household income in Burlington County?
Median Household Income in Burlington County is $102,615.
What is Income or Wage Gap in Burlington County?
Income or Wage Gap in Burlington County is 26.1%.
Women in Burlington County earn 73.9 cents for every dollar earned by a man.
What is Family Income Deficit in Burlington County?
Family Income Deficit in Burlington County is $11,375.
Families that are below poverty line in Burlington County earn $11,375 less on average than the poverty threshold level.
What is Inequality or Gini Index in Burlington County?
Inequality or Gini Index in Burlington County is 0.44.
How Large is the Labor Force in Burlington County?
There are 251,863 People in the Labor Forcein in Burlington County.
What is the Percentage of People in the Labor Force in Burlington County?
66.5% of People are in the Labor Force in Burlington County.
What is the Unemployment Rate in Burlington County?
Unemployment Rate in Burlington County is 5.1%.