Bergen County, NJ
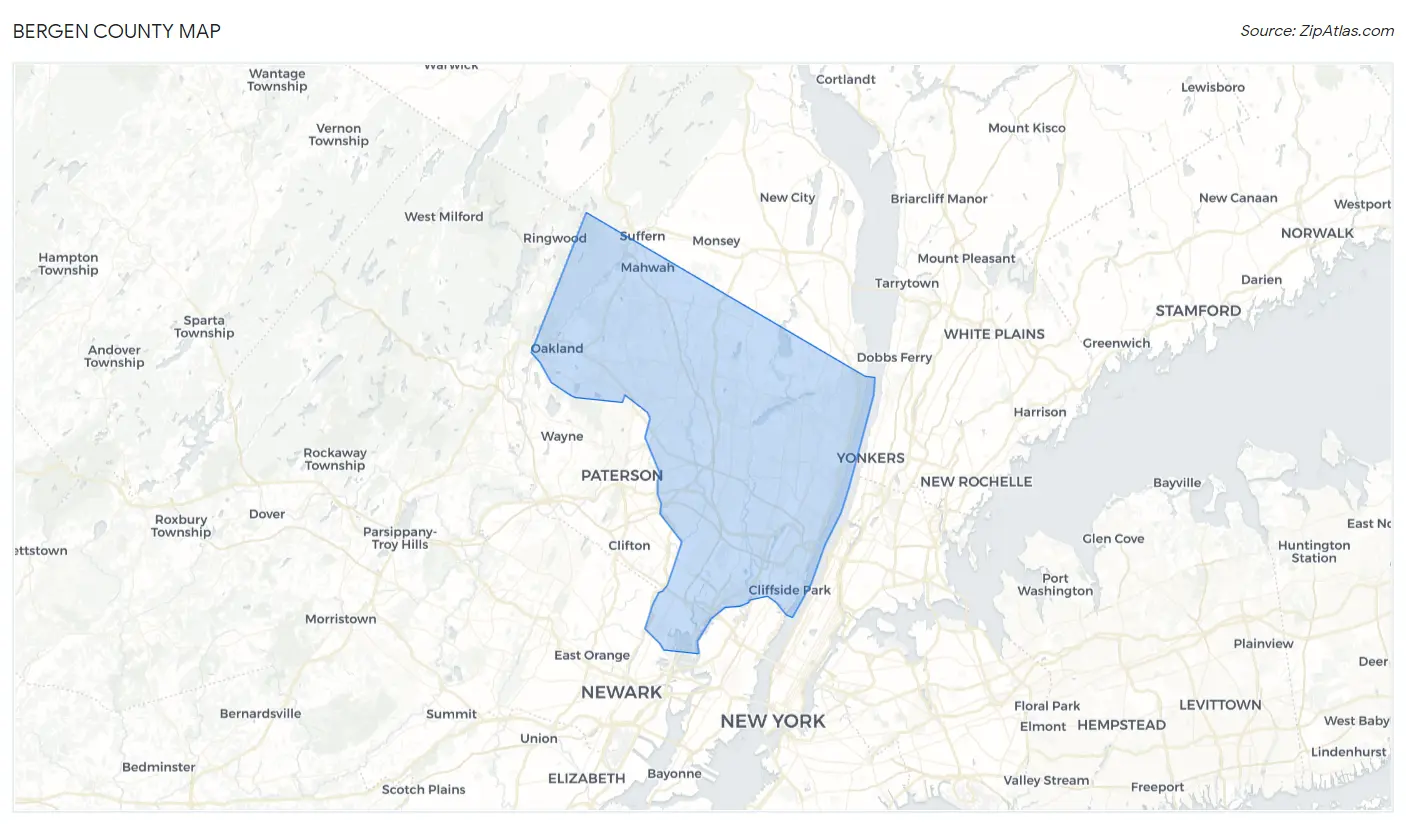
Bergen County Map
Bergen County Overview
953,243
TOTAL POPULATION
467,592
MALE POPULATION
485,651
FEMALE POPULATION
96.28
MALES / 100 FEMALES
103.86
FEMALES / 100 MALES
42.0
MEDIAN AGE
3.2
AVG FAMILY SIZE
2.7
AVG HOUSEHOLD SIZE
$60,222
PER CAPITA INCOME
$144,348
AVG FAMILY INCOME
$118,714
AVG HOUSEHOLD INCOME
29.9%
WAGE / INCOME GAP [ % ]
70.1¢/ $1
WAGE / INCOME GAP [ $ ]
$10,761
FAMILY INCOME DEFICIT
0.47
INEQUALITY / GINI INDEX
520,852
LABOR FORCE [ PEOPLE ]
66.9%
PERCENT IN LABOR FORCE
5.5%
UNEMPLOYMENT RATE
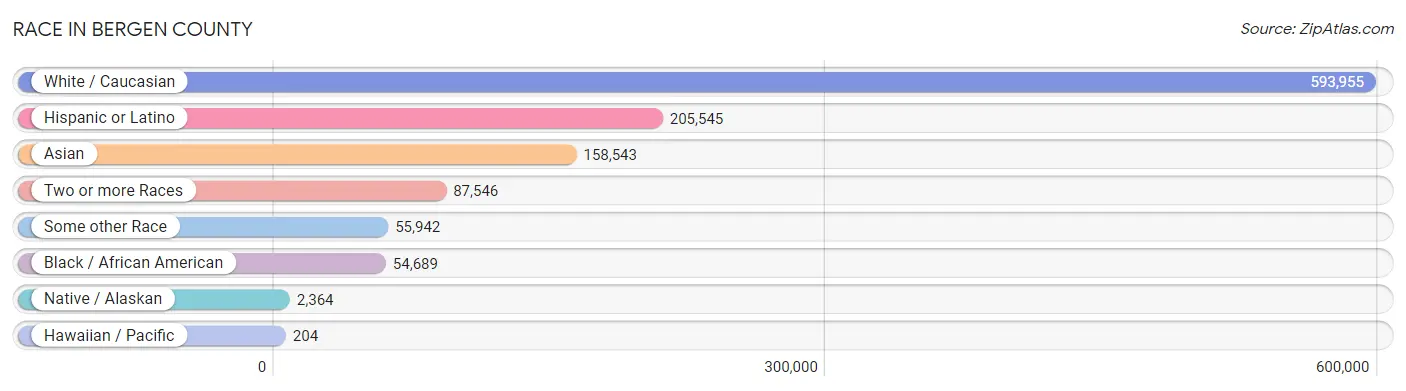
Race in Bergen County
The most populous races in Bergen County are White / Caucasian (593,955 | 62.3%), Hispanic or Latino (205,545 | 21.6%), and Asian (158,543 | 16.6%).
| Race | # Population | % Population |
| Asian | 158,543 | 16.6% |
| Black / African American | 54,689 | 5.7% |
| Hawaiian / Pacific | 204 | 0.0% |
| Hispanic or Latino | 205,545 | 21.6% |
| Native / Alaskan | 2,364 | 0.3% |
| White / Caucasian | 593,955 | 62.3% |
| Two or more Races | 87,546 | 9.2% |
| Some other Race | 55,942 | 5.9% |
| Total | 953,243 | 100.0% |
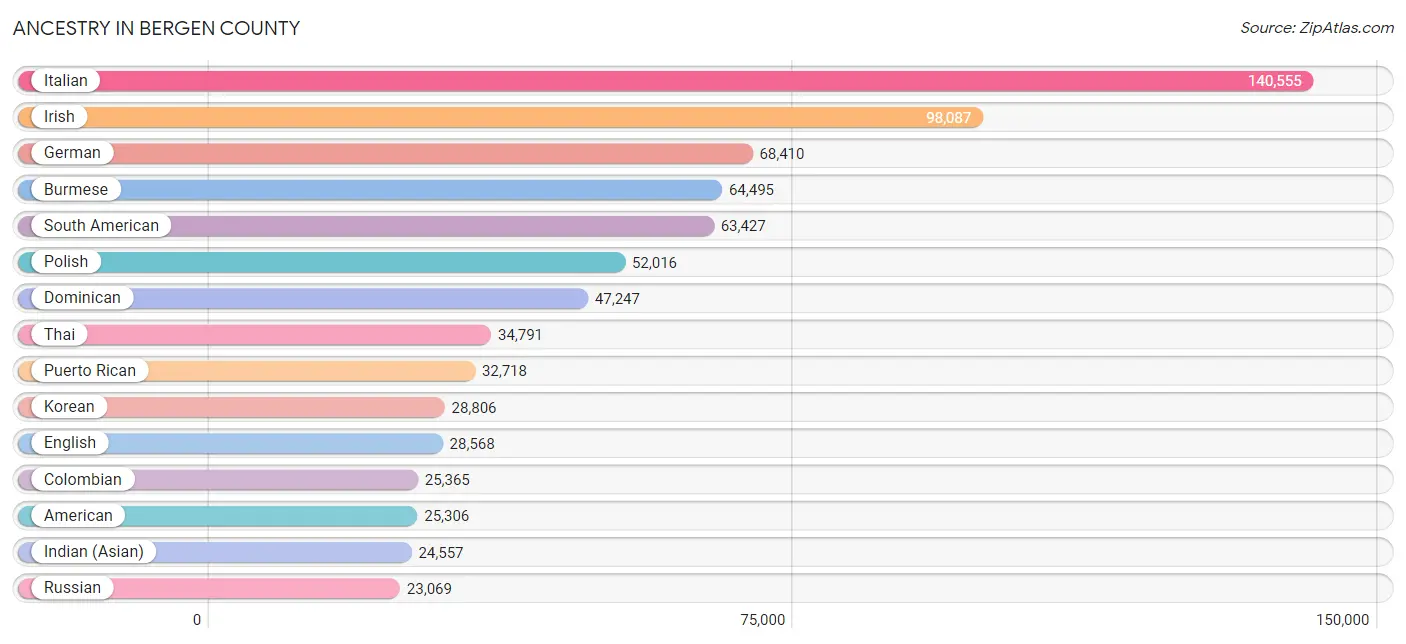
Ancestry in Bergen County
The most populous ancestries reported in Bergen County are Italian (140,555 | 14.7%), Irish (98,087 | 10.3%), German (68,410 | 7.2%), Burmese (64,495 | 6.8%), and South American (63,427 | 6.7%), together accounting for 45.6% of all Bergen County residents.
| Ancestry | # Population | % Population |
| Afghan | 567 | 0.1% |
| African | 2,948 | 0.3% |
| Alaskan Athabascan | 5 | 0.0% |
| Albanian | 5,015 | 0.5% |
| Alsatian | 25 | 0.0% |
| American | 25,306 | 2.6% |
| Apache | 14 | 0.0% |
| Arab | 16,811 | 1.8% |
| Argentinean | 3,720 | 0.4% |
| Armenian | 5,967 | 0.6% |
| Assyrian / Chaldean / Syriac | 318 | 0.0% |
| Australian | 425 | 0.0% |
| Austrian | 4,723 | 0.5% |
| Bahamian | 106 | 0.0% |
| Barbadian | 463 | 0.1% |
| Basque | 25 | 0.0% |
| Belgian | 353 | 0.0% |
| Belizean | 225 | 0.0% |
| Bermudan | 220 | 0.0% |
| Bhutanese | 7,720 | 0.8% |
| Blackfeet | 127 | 0.0% |
| Bolivian | 1,001 | 0.1% |
| Brazilian | 3,266 | 0.3% |
| British | 2,458 | 0.3% |
| British West Indian | 548 | 0.1% |
| Bulgarian | 656 | 0.1% |
| Burmese | 64,495 | 6.8% |
| Cajun | 6 | 0.0% |
| Canadian | 1,356 | 0.1% |
| Cape Verdean | 108 | 0.0% |
| Celtic | 19 | 0.0% |
| Central American | 22,143 | 2.3% |
| Central American Indian | 1,416 | 0.2% |
| Cherokee | 497 | 0.1% |
| Cheyenne | 48 | 0.0% |
| Chickasaw | 47 | 0.0% |
| Chilean | 1,165 | 0.1% |
| Chippewa | 32 | 0.0% |
| Choctaw | 106 | 0.0% |
| Colombian | 25,365 | 2.7% |
| Costa Rican | 2,218 | 0.2% |
| Creek | 282 | 0.0% |
| Croatian | 4,093 | 0.4% |
| Cuban | 14,656 | 1.5% |
| Cypriot | 426 | 0.0% |
| Czech | 2,065 | 0.2% |
| Czechoslovakian | 864 | 0.1% |
| Danish | 957 | 0.1% |
| Delaware | 108 | 0.0% |
| Dominican | 47,247 | 5.0% |
| Dutch | 8,979 | 0.9% |
| Dutch West Indian | 57 | 0.0% |
| Eastern European | 11,120 | 1.2% |
| Ecuadorian | 19,572 | 2.1% |
| Egyptian | 4,648 | 0.5% |
| English | 28,568 | 3.0% |
| Estonian | 106 | 0.0% |
| Ethiopian | 448 | 0.1% |
| European | 7,667 | 0.8% |
| Filipino | 1,150 | 0.1% |
| Finnish | 604 | 0.1% |
| French | 8,354 | 0.9% |
| French American Indian | 8 | 0.0% |
| French Canadian | 1,408 | 0.2% |
| German | 68,410 | 7.2% |
| Ghanaian | 856 | 0.1% |
| Greek | 10,206 | 1.1% |
| Guamanian / Chamorro | 77 | 0.0% |
| Guatemalan | 7,756 | 0.8% |
| Guyanese | 1,545 | 0.2% |
| Haitian | 1,661 | 0.2% |
| Honduran | 3,511 | 0.4% |
| Hopi | 13 | 0.0% |
| Hungarian | 6,665 | 0.7% |
| Icelander | 62 | 0.0% |
| Indian (Asian) | 24,557 | 2.6% |
| Indonesian | 164 | 0.0% |
| Iranian | 1,400 | 0.2% |
| Iraqi | 278 | 0.0% |
| Irish | 98,087 | 10.3% |
| Iroquois | 64 | 0.0% |
| Israeli | 3,052 | 0.3% |
| Italian | 140,555 | 14.7% |
| Jamaican | 9,476 | 1.0% |
| Japanese | 130 | 0.0% |
| Jordanian | 857 | 0.1% |
| Kenyan | 379 | 0.0% |
| Korean | 28,806 | 3.0% |
| Laotian | 555 | 0.1% |
| Latvian | 476 | 0.1% |
| Lebanese | 2,249 | 0.2% |
| Lithuanian | 1,910 | 0.2% |
| Lumbee | 111 | 0.0% |
| Luxembourger | 31 | 0.0% |
| Macedonian | 3,044 | 0.3% |
| Malaysian | 108 | 0.0% |
| Maltese | 205 | 0.0% |
| Mexican | 10,175 | 1.1% |
| Mexican American Indian | 444 | 0.1% |
| Mongolian | 142 | 0.0% |
| Moroccan | 1,047 | 0.1% |
| Native Hawaiian | 212 | 0.0% |
| Navajo | 35 | 0.0% |
| New Zealander | 52 | 0.0% |
| Nicaraguan | 999 | 0.1% |
| Nigerian | 1,088 | 0.1% |
| Northern European | 477 | 0.1% |
| Norwegian | 3,563 | 0.4% |
| Okinawan | 64 | 0.0% |
| Ottawa | 4 | 0.0% |
| Pakistani | 1,251 | 0.1% |
| Palestinian | 1,674 | 0.2% |
| Panamanian | 791 | 0.1% |
| Paraguayan | 321 | 0.0% |
| Pennsylvania German | 146 | 0.0% |
| Peruvian | 10,048 | 1.1% |
| Polish | 52,016 | 5.5% |
| Portuguese | 6,075 | 0.6% |
| Puerto Rican | 32,718 | 3.4% |
| Romanian | 3,007 | 0.3% |
| Russian | 23,069 | 2.4% |
| Salvadoran | 6,752 | 0.7% |
| Samoan | 57 | 0.0% |
| Scandinavian | 607 | 0.1% |
| Scotch-Irish | 1,936 | 0.2% |
| Scottish | 6,507 | 0.7% |
| Serbian | 1,041 | 0.1% |
| Sierra Leonean | 10 | 0.0% |
| Sioux | 28 | 0.0% |
| Slavic | 460 | 0.1% |
| Slovak | 1,852 | 0.2% |
| Slovene | 140 | 0.0% |
| South African | 326 | 0.0% |
| South American | 63,427 | 6.7% |
| South American Indian | 727 | 0.1% |
| Soviet Union | 11 | 0.0% |
| Spaniard | 5,524 | 0.6% |
| Spanish | 1,553 | 0.2% |
| Sri Lankan | 1,800 | 0.2% |
| Subsaharan African | 7,015 | 0.7% |
| Sudanese | 160 | 0.0% |
| Swedish | 3,826 | 0.4% |
| Swiss | 2,002 | 0.2% |
| Syrian | 2,936 | 0.3% |
| Thai | 34,791 | 3.6% |
| Tlingit-Haida | 87 | 0.0% |
| Trinidadian and Tobagonian | 1,766 | 0.2% |
| Turkish | 5,412 | 0.6% |
| U.S. Virgin Islander | 51 | 0.0% |
| Ugandan | 200 | 0.0% |
| Ukrainian | 8,289 | 0.9% |
| Uruguayan | 418 | 0.0% |
| Venezuelan | 1,708 | 0.2% |
| Vietnamese | 936 | 0.1% |
| Welsh | 1,453 | 0.2% |
| West Indian | 1,519 | 0.2% |
| Yugoslavian | 754 | 0.1% |
| Zimbabwean | 41 | 0.0% | View All 158 Rows |
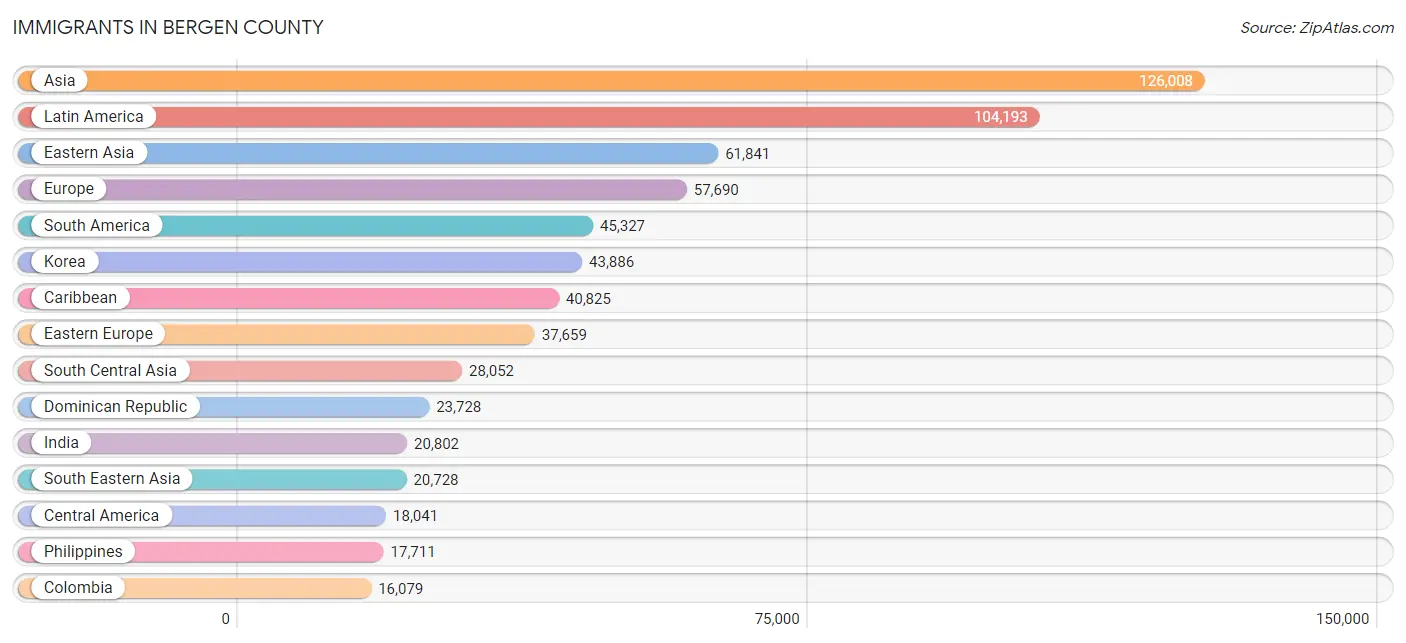
Immigrants in Bergen County
The most numerous immigrant groups reported in Bergen County came from Asia (126,008 | 13.2%), Latin America (104,193 | 10.9%), Eastern Asia (61,841 | 6.5%), Europe (57,690 | 6.0%), and South America (45,327 | 4.8%), together accounting for 41.4% of all Bergen County residents.
| Immigration Origin | # Population | % Population |
| Afghanistan | 416 | 0.0% |
| Africa | 8,965 | 0.9% |
| Albania | 2,682 | 0.3% |
| Argentina | 2,174 | 0.2% |
| Armenia | 420 | 0.0% |
| Asia | 126,008 | 13.2% |
| Australia | 381 | 0.0% |
| Austria | 426 | 0.0% |
| Azores | 49 | 0.0% |
| Bahamas | 29 | 0.0% |
| Bangladesh | 809 | 0.1% |
| Barbados | 277 | 0.0% |
| Belarus | 1,394 | 0.2% |
| Belgium | 184 | 0.0% |
| Belize | 94 | 0.0% |
| Bolivia | 660 | 0.1% |
| Bosnia and Herzegovina | 168 | 0.0% |
| Brazil | 3,372 | 0.4% |
| Bulgaria | 533 | 0.1% |
| Cabo Verde | 38 | 0.0% |
| Cambodia | 102 | 0.0% |
| Cameroon | 62 | 0.0% |
| Canada | 1,909 | 0.2% |
| Caribbean | 40,825 | 4.3% |
| Central America | 18,041 | 1.9% |
| Chile | 732 | 0.1% |
| China | 13,747 | 1.4% |
| Colombia | 16,079 | 1.7% |
| Congo | 159 | 0.0% |
| Costa Rica | 1,046 | 0.1% |
| Croatia | 1,170 | 0.1% |
| Cuba | 6,108 | 0.6% |
| Czechoslovakia | 711 | 0.1% |
| Denmark | 131 | 0.0% |
| Dominica | 776 | 0.1% |
| Dominican Republic | 23,728 | 2.5% |
| Eastern Africa | 1,634 | 0.2% |
| Eastern Asia | 61,841 | 6.5% |
| Eastern Europe | 37,659 | 4.0% |
| Ecuador | 12,560 | 1.3% |
| Egypt | 2,789 | 0.3% |
| El Salvador | 4,116 | 0.4% |
| England | 1,070 | 0.1% |
| Ethiopia | 374 | 0.0% |
| Europe | 57,690 | 6.0% |
| Fiji | 22 | 0.0% |
| France | 846 | 0.1% |
| Germany | 2,202 | 0.2% |
| Ghana | 1,028 | 0.1% |
| Greece | 1,454 | 0.2% |
| Grenada | 207 | 0.0% |
| Guatemala | 5,251 | 0.5% |
| Guyana | 1,953 | 0.2% |
| Haiti | 912 | 0.1% |
| Honduras | 2,146 | 0.2% |
| Hong Kong | 1,545 | 0.2% |
| Hungary | 732 | 0.1% |
| India | 20,802 | 2.2% |
| Indonesia | 274 | 0.0% |
| Iran | 1,132 | 0.1% |
| Iraq | 257 | 0.0% |
| Ireland | 2,123 | 0.2% |
| Israel | 3,972 | 0.4% |
| Italy | 5,945 | 0.6% |
| Jamaica | 6,152 | 0.6% |
| Japan | 4,208 | 0.4% |
| Jordan | 437 | 0.1% |
| Kazakhstan | 148 | 0.0% |
| Kenya | 528 | 0.1% |
| Korea | 43,886 | 4.6% |
| Kuwait | 439 | 0.1% |
| Laos | 33 | 0.0% |
| Latin America | 104,193 | 10.9% |
| Latvia | 332 | 0.0% |
| Lebanon | 1,039 | 0.1% |
| Liberia | 5 | 0.0% |
| Lithuania | 193 | 0.0% |
| Malaysia | 456 | 0.1% |
| Mexico | 4,367 | 0.5% |
| Middle Africa | 530 | 0.1% |
| Moldova | 417 | 0.0% |
| Morocco | 519 | 0.1% |
| Nepal | 752 | 0.1% |
| Netherlands | 279 | 0.0% |
| Nicaragua | 657 | 0.1% |
| Nigeria | 1,040 | 0.1% |
| North Macedonia | 1,911 | 0.2% |
| Northern Africa | 3,636 | 0.4% |
| Northern Europe | 4,974 | 0.5% |
| Norway | 131 | 0.0% |
| Oceania | 477 | 0.1% |
| Pakistan | 2,747 | 0.3% |
| Panama | 359 | 0.0% |
| Peru | 5,994 | 0.6% |
| Philippines | 17,711 | 1.9% |
| Poland | 12,618 | 1.3% |
| Portugal | 2,013 | 0.2% |
| Romania | 1,332 | 0.1% |
| Russia | 4,816 | 0.5% |
| Saudi Arabia | 462 | 0.1% |
| Scotland | 251 | 0.0% |
| Senegal | 30 | 0.0% |
| Serbia | 288 | 0.0% |
| Singapore | 241 | 0.0% |
| South Africa | 582 | 0.1% |
| South America | 45,327 | 4.8% |
| South Central Asia | 28,052 | 2.9% |
| South Eastern Asia | 20,728 | 2.2% |
| Southern Europe | 10,862 | 1.1% |
| Spain | 1,448 | 0.2% |
| Sri Lanka | 389 | 0.0% |
| St. Vincent and the Grenadines | 104 | 0.0% |
| Sudan | 41 | 0.0% |
| Sweden | 114 | 0.0% |
| Switzerland | 90 | 0.0% |
| Syria | 2,003 | 0.2% |
| Taiwan | 1,665 | 0.2% |
| Thailand | 788 | 0.1% |
| Trinidad and Tobago | 1,959 | 0.2% |
| Turkey | 4,690 | 0.5% |
| Uganda | 299 | 0.0% |
| Ukraine | 5,274 | 0.5% |
| Uruguay | 310 | 0.0% |
| Uzbekistan | 470 | 0.1% |
| Venezuela | 1,037 | 0.1% |
| Vietnam | 894 | 0.1% |
| West Indies | 216 | 0.0% |
| Western Africa | 2,346 | 0.3% |
| Western Asia | 14,831 | 1.6% |
| Western Europe | 4,027 | 0.4% |
| Yemen | 96 | 0.0% |
| Zaire | 291 | 0.0% |
| Zimbabwe | 189 | 0.0% | View All 133 Rows |
Sex and Age in Bergen County
Sex and Age in Bergen County
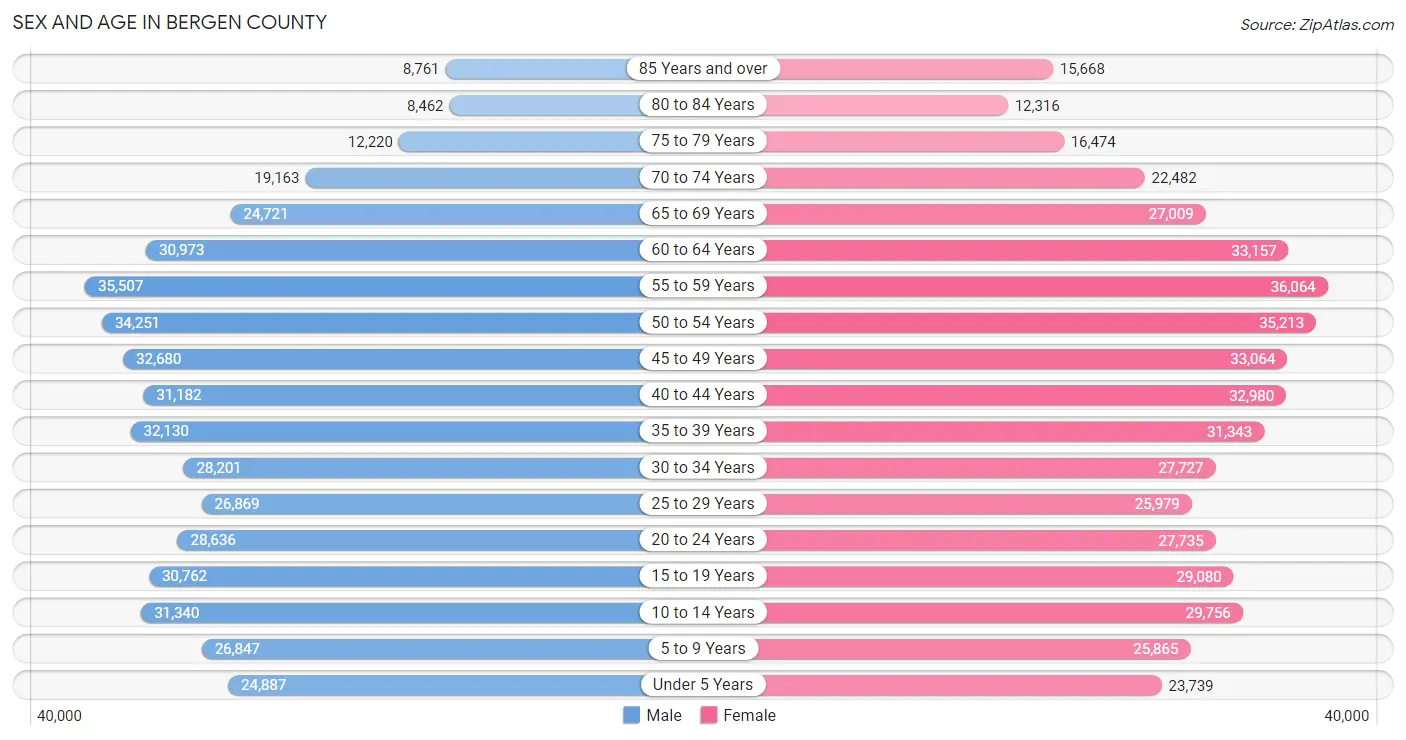
The most populous age groups in Bergen County are 55 to 59 Years (35,507 | 7.6%) for men and 55 to 59 Years (36,064 | 7.4%) for women.
| Age Bracket | Male | Female |
| Under 5 Years | 24,887 (5.3%) | 23,739 (4.9%) |
| 5 to 9 Years | 26,847 (5.7%) | 25,865 (5.3%) |
| 10 to 14 Years | 31,340 (6.7%) | 29,756 (6.1%) |
| 15 to 19 Years | 30,762 (6.6%) | 29,080 (6.0%) |
| 20 to 24 Years | 28,636 (6.1%) | 27,735 (5.7%) |
| 25 to 29 Years | 26,869 (5.8%) | 25,979 (5.3%) |
| 30 to 34 Years | 28,201 (6.0%) | 27,727 (5.7%) |
| 35 to 39 Years | 32,130 (6.9%) | 31,343 (6.5%) |
| 40 to 44 Years | 31,182 (6.7%) | 32,980 (6.8%) |
| 45 to 49 Years | 32,680 (7.0%) | 33,064 (6.8%) |
| 50 to 54 Years | 34,251 (7.3%) | 35,213 (7.2%) |
| 55 to 59 Years | 35,507 (7.6%) | 36,064 (7.4%) |
| 60 to 64 Years | 30,973 (6.6%) | 33,157 (6.8%) |
| 65 to 69 Years | 24,721 (5.3%) | 27,009 (5.6%) |
| 70 to 74 Years | 19,163 (4.1%) | 22,482 (4.6%) |
| 75 to 79 Years | 12,220 (2.6%) | 16,474 (3.4%) |
| 80 to 84 Years | 8,462 (1.8%) | 12,316 (2.5%) |
| 85 Years and over | 8,761 (1.9%) | 15,668 (3.2%) |
| Total | 467,592 (100.0%) | 485,651 (100.0%) |
Families and Households in Bergen County
Median Family Size in Bergen County
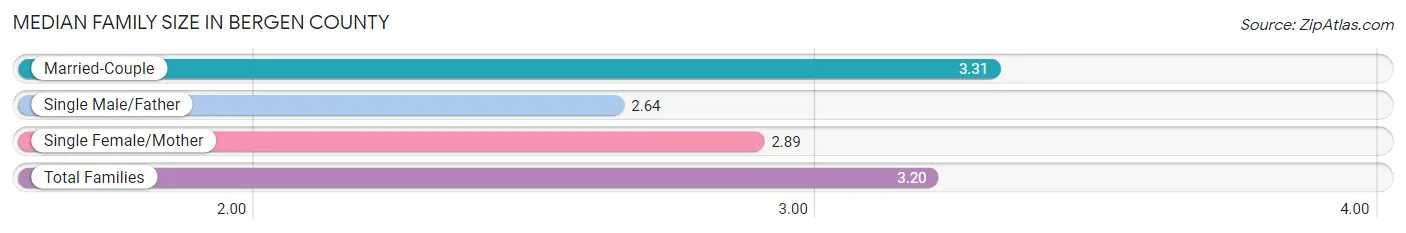
The median family size in Bergen County is 3.20 persons per family, with married-couple families (196,430 | 78.1%) accounting for the largest median family size of 3.31 persons per family. On the other hand, single male/father families (14,790 | 5.9%) represent the smallest median family size with 2.64 persons per family.
| Family Type | # Families | Family Size |
| Married-Couple | 196,430 (78.1%) | 3.31 |
| Single Male/Father | 14,790 (5.9%) | 2.64 |
| Single Female/Mother | 40,294 (16.0%) | 2.89 |
| Total Families | 251,514 (100.0%) | 3.20 |
Median Household Size in Bergen County
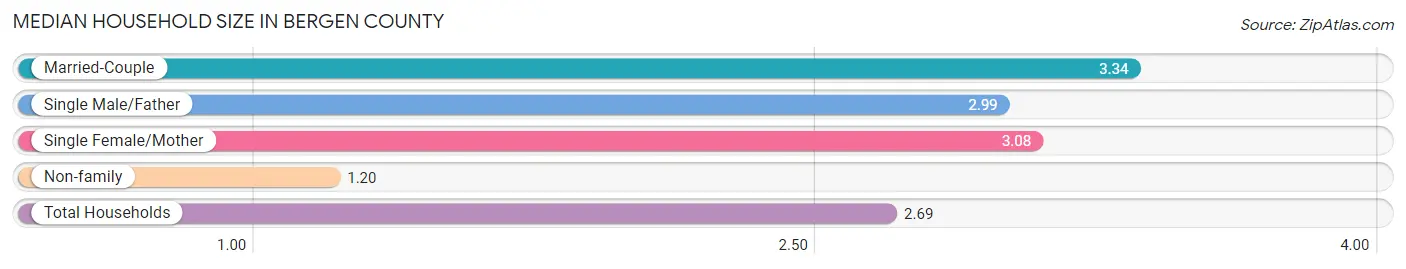
The median household size in Bergen County is 2.69 persons per household, with married-couple households (196,430 | 56.0%) accounting for the largest median household size of 3.34 persons per household. non-family households (99,329 | 28.3%) represent the smallest median household size with 1.20 persons per household.
| Household Type | # Households | Household Size |
| Married-Couple | 196,430 (56.0%) | 3.34 |
| Single Male/Father | 14,790 (4.2%) | 2.99 |
| Single Female/Mother | 40,294 (11.5%) | 3.08 |
| Non-family | 99,329 (28.3%) | 1.20 |
| Total Households | 350,843 (100.0%) | 2.69 |
Household Size by Marriage Status in Bergen County
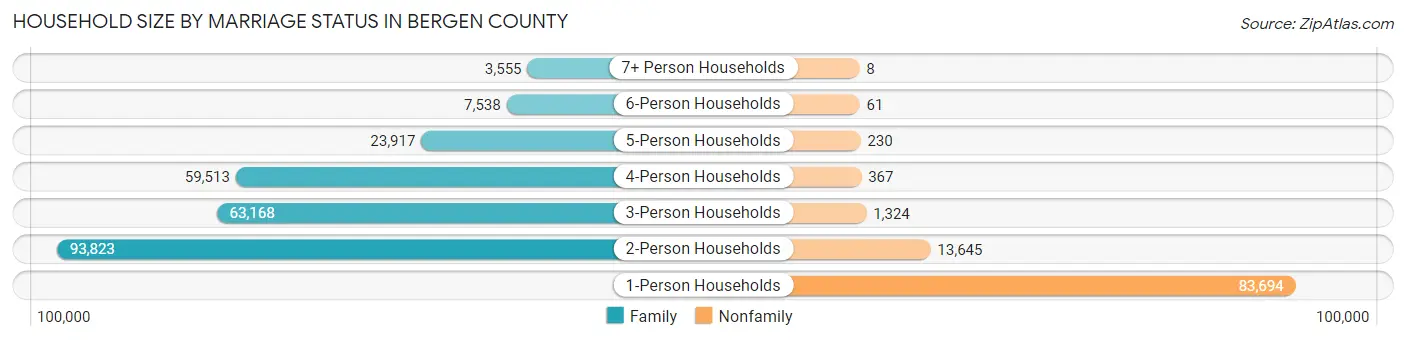
Out of a total of 350,843 households in Bergen County, 251,514 (71.7%) are family households, while 99,329 (28.3%) are nonfamily households. The most numerous type of family households are 2-person households, comprising 93,823, and the most common type of nonfamily households are 1-person households, comprising 83,694.
| Household Size | Family Households | Nonfamily Households |
| 1-Person Households | - | 83,694 (23.9%) |
| 2-Person Households | 93,823 (26.7%) | 13,645 (3.9%) |
| 3-Person Households | 63,168 (18.0%) | 1,324 (0.4%) |
| 4-Person Households | 59,513 (17.0%) | 367 (0.1%) |
| 5-Person Households | 23,917 (6.8%) | 230 (0.1%) |
| 6-Person Households | 7,538 (2.1%) | 61 (0.0%) |
| 7+ Person Households | 3,555 (1.0%) | 8 (0.0%) |
| Total | 251,514 (71.7%) | 99,329 (28.3%) |
Female Fertility in Bergen County
Fertility by Age in Bergen County
Average fertility rate in Bergen County is 49.0 births per 1,000 women. Women in the age bracket of 20 to 34 years have the highest fertility rate with 74.0 births per 1,000 women. Women in the age bracket of 20 to 34 years acount for 57.3% of all women with births.
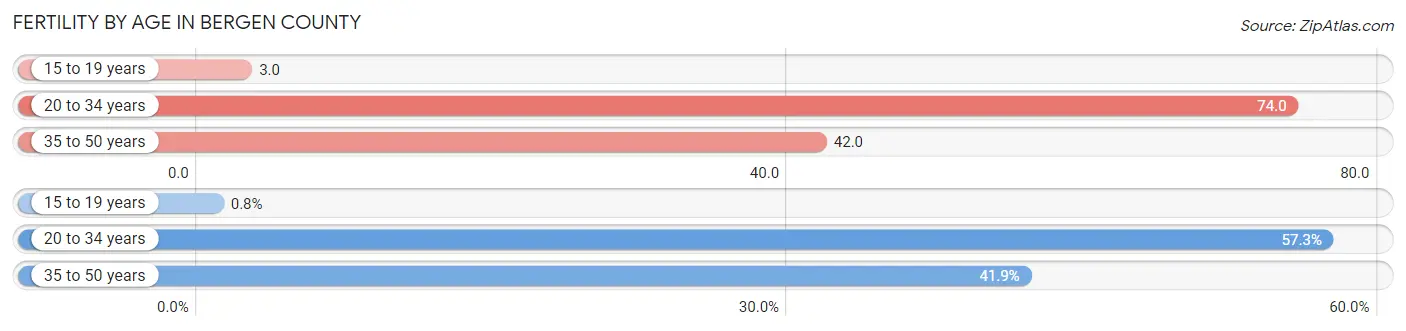
| Age Bracket | Women with Births | Births / 1,000 Women |
| 15 to 19 years | 84 (0.8%) | 3.0 |
| 20 to 34 years | 6,038 (57.3%) | 74.0 |
| 35 to 50 years | 4,417 (41.9%) | 42.0 |
| Total | 10,539 (100.0%) | 49.0 |
Fertility by Age by Marriage Status in Bergen County
79.6% of women with births (10,539) in Bergen County are married. The highest percentage of unmarried women with births falls into 15 to 19 years age bracket with 100.0% of them unmarried at the time of birth, while the lowest percentage of unmarried women with births belong to 35 to 50 years age bracket with 16.2% of them unmarried.
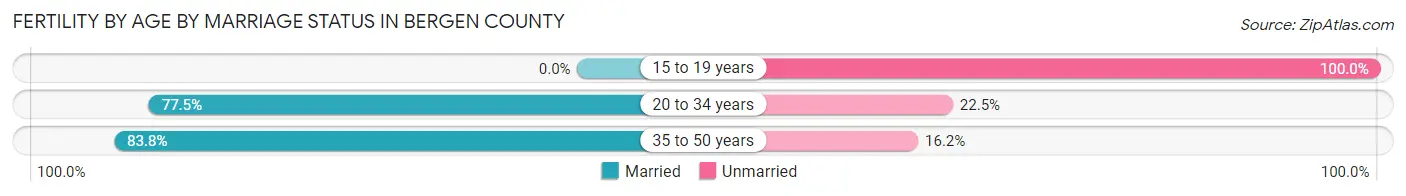
| Age Bracket | Married | Unmarried |
| 15 to 19 years | 0 (0.0%) | 84 (100.0%) |
| 20 to 34 years | 4,679 (77.5%) | 1,359 (22.5%) |
| 35 to 50 years | 3,701 (83.8%) | 716 (16.2%) |
| Total | 8,389 (79.6%) | 2,150 (20.4%) |
Fertility by Education in Bergen County
Average fertility rate in Bergen County is 49.0 births per 1,000 women. Women with the education attainment of graduate degree have the highest fertility rate of 81.0 births per 1,000 women, while women with the education attainment of less than high school have the lowest fertility at 22.0 births per 1,000 women. Women with the education attainment of bachelor's degree represent 33.4% of all women with births.
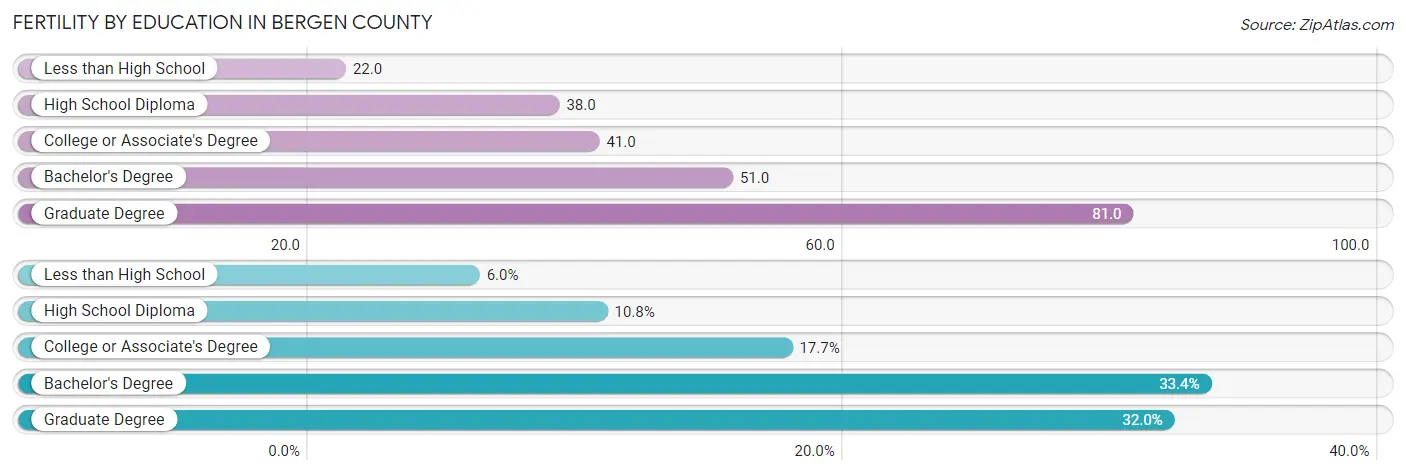
| Educational Attainment | Women with Births | Births / 1,000 Women |
| Less than High School | 633 (6.0%) | 22.0 |
| High School Diploma | 1,138 (10.8%) | 38.0 |
| College or Associate's Degree | 1,869 (17.7%) | 41.0 |
| Bachelor's Degree | 3,522 (33.4%) | 51.0 |
| Graduate Degree | 3,377 (32.0%) | 81.0 |
| Total | 10,539 (100.0%) | 49.0 |
Fertility by Education by Marriage Status in Bergen County
20.4% of women with births in Bergen County are unmarried. Women with the educational attainment of graduate degree are most likely to be married with 89.4% of them married at childbirth, while women with the educational attainment of less than high school are least likely to be married with 41.7% of them unmarried at childbirth.
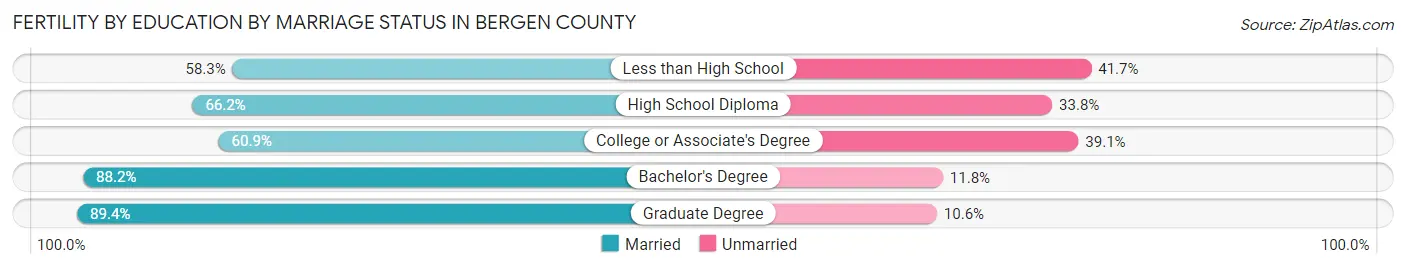
| Educational Attainment | Married | Unmarried |
| Less than High School | 369 (58.3%) | 264 (41.7%) |
| High School Diploma | 753 (66.2%) | 385 (33.8%) |
| College or Associate's Degree | 1,138 (60.9%) | 731 (39.1%) |
| Bachelor's Degree | 3,106 (88.2%) | 416 (11.8%) |
| Graduate Degree | 3,019 (89.4%) | 358 (10.6%) |
| Total | 8,389 (79.6%) | 2,150 (20.4%) |
Income in Bergen County
Income Overview in Bergen County
Per Capita Income in Bergen County is $60,222, while median incomes of families and households are $144,348 and $118,714 respectively.
| Characteristic | Number | Measure |
| Per Capita Income | 953,243 | $60,222 |
| Median Family Income | 251,514 | $144,348 |
| Mean Family Income | 251,514 | $188,367 |
| Median Household Income | 350,843 | $118,714 |
| Mean Household Income | 350,843 | $161,998 |
| Income Deficit | 251,514 | $10,761 |
| Wage / Income Gap (%) | 953,243 | 29.90% |
| Wage / Income Gap ($) | 953,243 | 70.10¢ per $1 |
| Gini / Inequality Index | 953,243 | 0.47 |
Earnings by Sex in Bergen County
Average Earnings in Bergen County are $61,076, $71,924 for men and $50,420 for women, a difference of 29.9%.
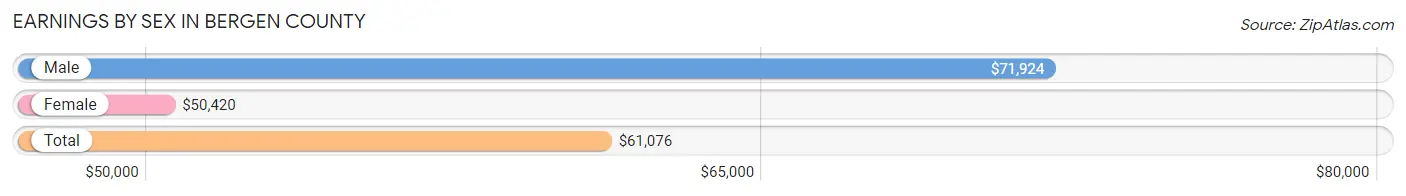
| Sex | Number | Average Earnings |
| Male | 282,817 (52.9%) | $71,924 |
| Female | 251,867 (47.1%) | $50,420 |
| Total | 534,684 (100.0%) | $61,076 |
Earnings by Sex by Income Bracket in Bergen County
The most common earnings brackets in Bergen County are $100,000+ for men (102,423 | 36.2%) and $100,000+ for women (53,405 | 21.2%).
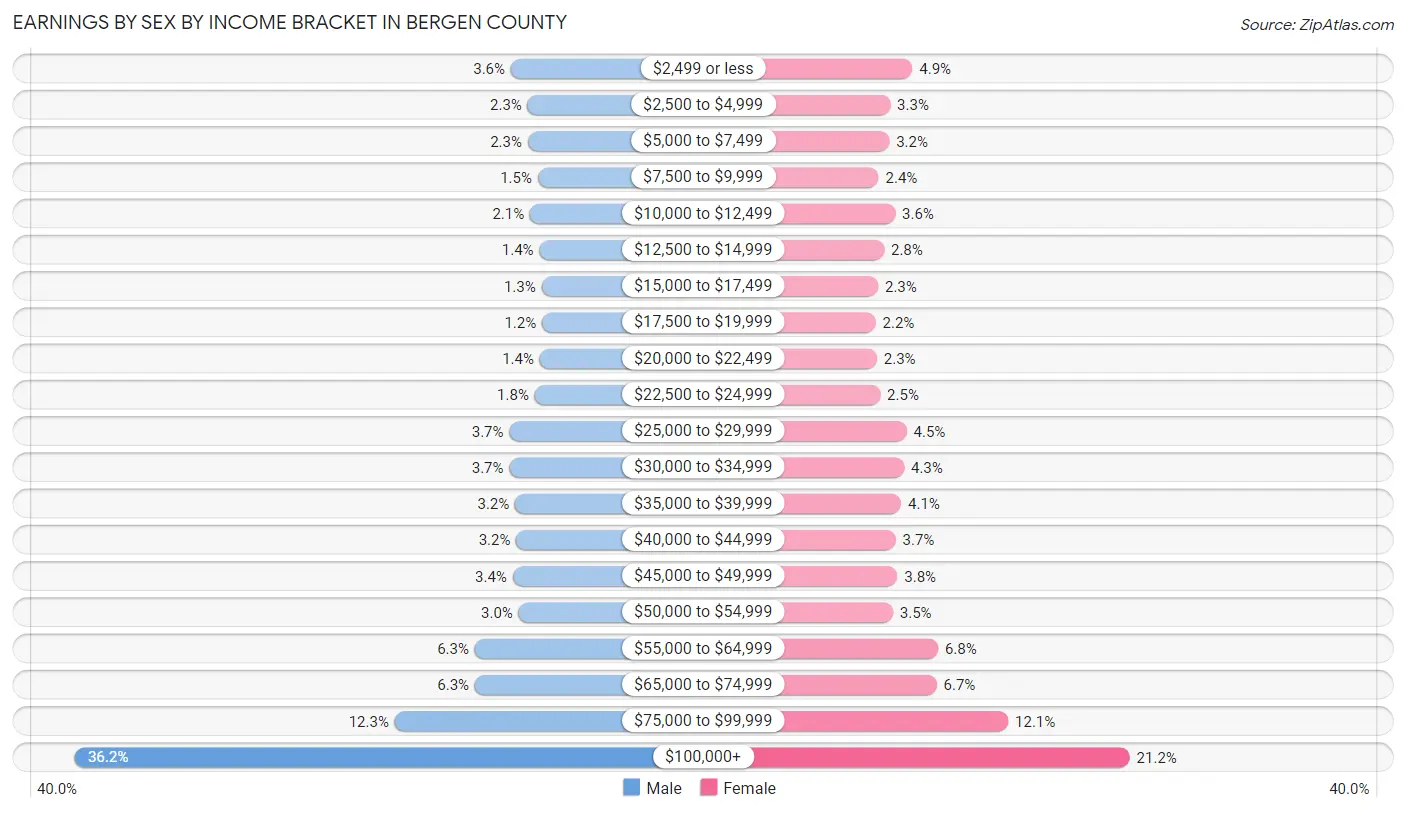
| Income | Male | Female |
| $2,499 or less | 10,081 (3.6%) | 12,363 (4.9%) |
| $2,500 to $4,999 | 6,509 (2.3%) | 8,197 (3.3%) |
| $5,000 to $7,499 | 6,475 (2.3%) | 7,999 (3.2%) |
| $7,500 to $9,999 | 4,353 (1.5%) | 5,997 (2.4%) |
| $10,000 to $12,499 | 6,002 (2.1%) | 9,122 (3.6%) |
| $12,500 to $14,999 | 4,013 (1.4%) | 7,026 (2.8%) |
| $15,000 to $17,499 | 3,575 (1.3%) | 5,902 (2.3%) |
| $17,500 to $19,999 | 3,454 (1.2%) | 5,448 (2.2%) |
| $20,000 to $22,499 | 3,927 (1.4%) | 5,659 (2.2%) |
| $22,500 to $24,999 | 5,018 (1.8%) | 6,288 (2.5%) |
| $25,000 to $29,999 | 10,368 (3.7%) | 11,295 (4.5%) |
| $30,000 to $34,999 | 10,379 (3.7%) | 10,814 (4.3%) |
| $35,000 to $39,999 | 9,172 (3.2%) | 10,260 (4.1%) |
| $40,000 to $44,999 | 8,918 (3.2%) | 9,225 (3.7%) |
| $45,000 to $49,999 | 9,675 (3.4%) | 9,549 (3.8%) |
| $50,000 to $54,999 | 8,412 (3.0%) | 8,699 (3.5%) |
| $55,000 to $64,999 | 17,717 (6.3%) | 17,212 (6.8%) |
| $65,000 to $74,999 | 17,676 (6.2%) | 16,947 (6.7%) |
| $75,000 to $99,999 | 34,670 (12.3%) | 30,460 (12.1%) |
| $100,000+ | 102,423 (36.2%) | 53,405 (21.2%) |
| Total | 282,817 (100.0%) | 251,867 (100.0%) |
Earnings by Sex by Educational Attainment in Bergen County
Average earnings in Bergen County are $80,833 for men and $58,002 for women, a difference of 28.2%. Men with an educational attainment of graduate degree enjoy the highest average annual earnings of $130,613, while those with less than high school education earn the least with $40,802. Women with an educational attainment of graduate degree earn the most with the average annual earnings of $88,799, while those with less than high school education have the smallest earnings of $21,951.
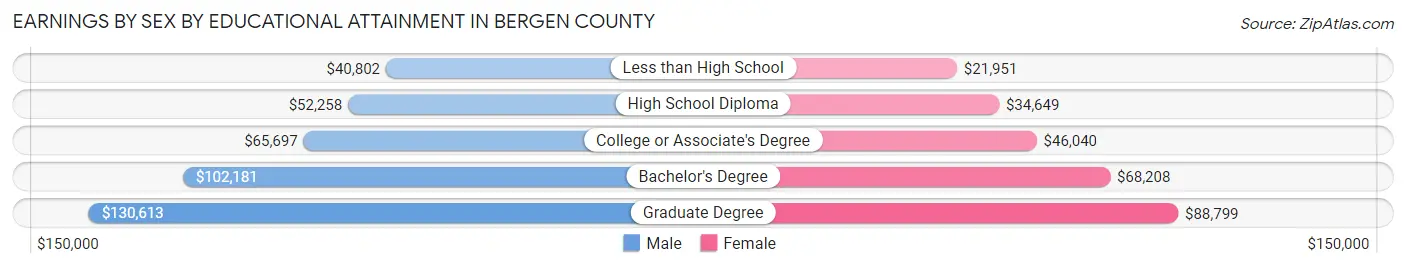
| Educational Attainment | Male Income | Female Income |
| Less than High School | $40,802 | $21,951 |
| High School Diploma | $52,258 | $34,649 |
| College or Associate's Degree | $65,697 | $46,040 |
| Bachelor's Degree | $102,181 | $68,208 |
| Graduate Degree | $130,613 | $88,799 |
| Total | $80,833 | $58,002 |
Family Income in Bergen County
Family Income Brackets in Bergen County
According to the Bergen County family income data, there are 83,754 families falling into the $200,000+ income range, which is the most common income bracket and makes up 33.3% of all families. Conversely, the $10,000 to $14,999 income bracket is the least frequent group with only 2,767 families (1.1%) belonging to this category.
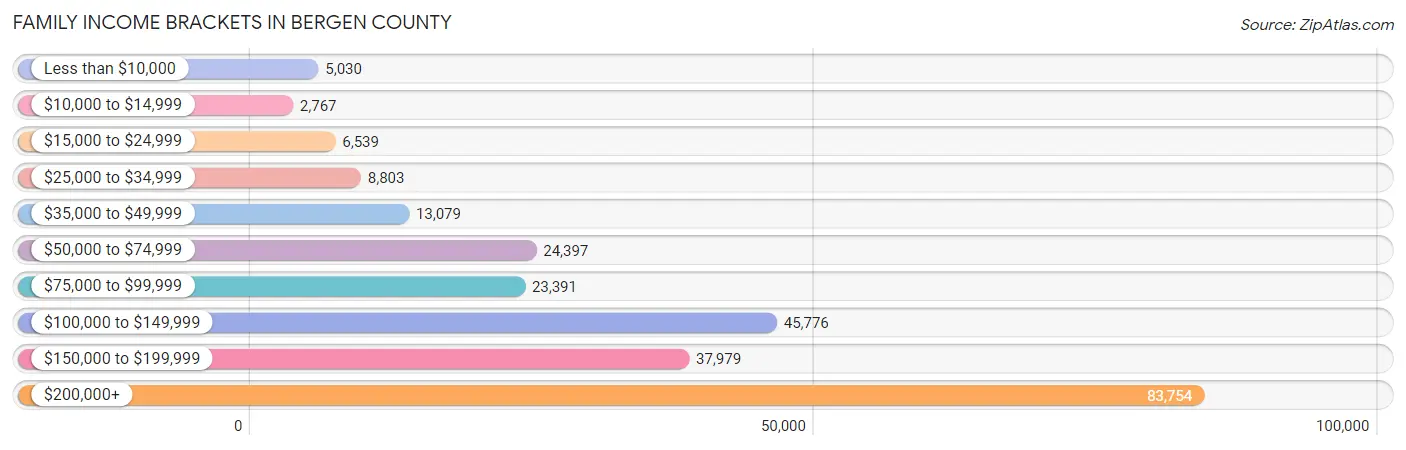
| Income Bracket | # Families | % Families |
| Less than $10,000 | 5,030 | 2.0% |
| $10,000 to $14,999 | 2,767 | 1.1% |
| $15,000 to $24,999 | 6,539 | 2.6% |
| $25,000 to $34,999 | 8,803 | 3.5% |
| $35,000 to $49,999 | 13,079 | 5.2% |
| $50,000 to $74,999 | 24,397 | 9.7% |
| $75,000 to $99,999 | 23,391 | 9.3% |
| $100,000 to $149,999 | 45,776 | 18.2% |
| $150,000 to $199,999 | 37,979 | 15.1% |
| $200,000+ | 83,754 | 33.3% |
Family Income by Famaliy Size in Bergen County
7+ person families (2,747 | 1.1%) account for the highest median family income in Bergen County with $221,076 per family, while 2-person families (100,127 | 39.8%) have the highest median income of $55,244 per family member.
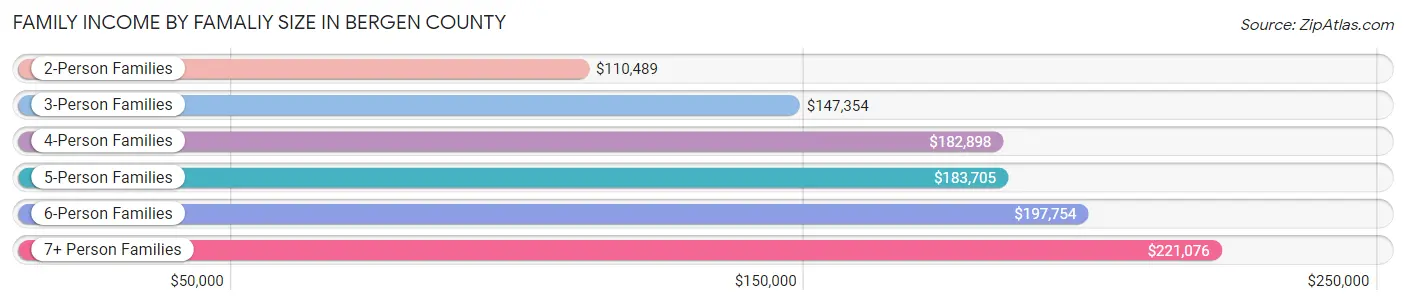
| Income Bracket | # Families | Median Income |
| 2-Person Families | 100,127 (39.8%) | $110,489 |
| 3-Person Families | 61,024 (24.3%) | $147,354 |
| 4-Person Families | 58,560 (23.3%) | $182,898 |
| 5-Person Families | 22,284 (8.9%) | $183,705 |
| 6-Person Families | 6,772 (2.7%) | $197,754 |
| 7+ Person Families | 2,747 (1.1%) | $221,076 |
| Total | 251,514 (100.0%) | $144,348 |
Family Income by Number of Earners in Bergen County
The median family income in Bergen County is $144,348, with families comprising 3+ earners (40,677) having the highest median family income of $202,040, while families with no earners (25,879) have the lowest median family income of $55,618, accounting for 16.2% and 10.3% of families, respectively.
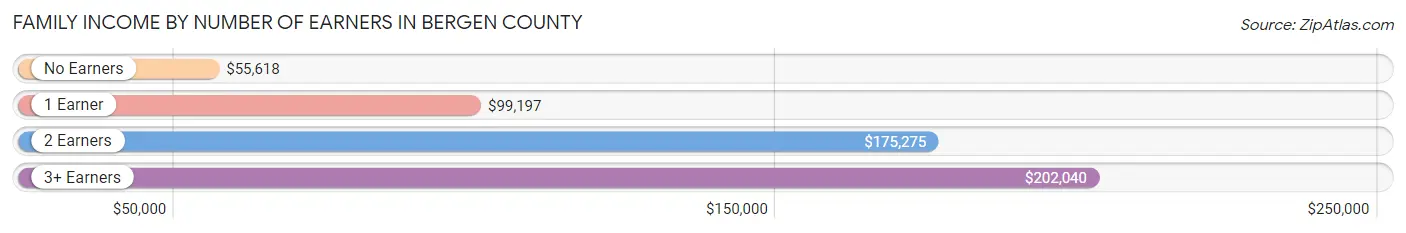
| Number of Earners | # Families | Median Income |
| No Earners | 25,879 (10.3%) | $55,618 |
| 1 Earner | 73,527 (29.2%) | $99,197 |
| 2 Earners | 111,431 (44.3%) | $175,275 |
| 3+ Earners | 40,677 (16.2%) | $202,040 |
| Total | 251,514 (100.0%) | $144,348 |
Household Income in Bergen County
Household Income Brackets in Bergen County
With 92,973 households falling in the category, the $200,000+ income range is the most frequent in Bergen County, accounting for 26.5% of all households. In contrast, only 7,719 households (2.2%) fall into the $10,000 to $14,999 income bracket, making it the least populous group.
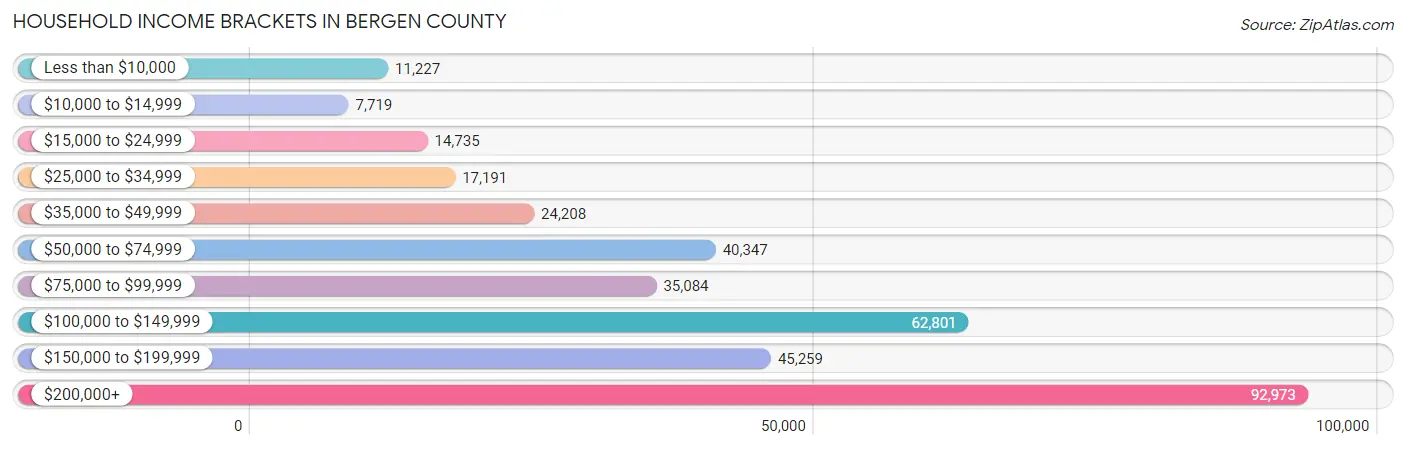
| Income Bracket | # Households | % Households |
| Less than $10,000 | 11,227 | 3.2% |
| $10,000 to $14,999 | 7,719 | 2.2% |
| $15,000 to $24,999 | 14,735 | 4.2% |
| $25,000 to $34,999 | 17,191 | 4.9% |
| $35,000 to $49,999 | 24,208 | 6.9% |
| $50,000 to $74,999 | 40,347 | 11.5% |
| $75,000 to $99,999 | 35,084 | 10.0% |
| $100,000 to $149,999 | 62,801 | 17.9% |
| $150,000 to $199,999 | 45,259 | 12.9% |
| $200,000+ | 92,973 | 26.5% |
Household Income by Householder Age in Bergen County
The median household income in Bergen County is $118,714, with the highest median household income of $142,011 found in the 45 to 64 years age bracket for the primary householder. A total of 147,048 households (41.9%) fall into this category. Meanwhile, the 15 to 24 years age bracket for the primary householder has the lowest median household income of $66,400, with 4,939 households (1.4%) in this group.
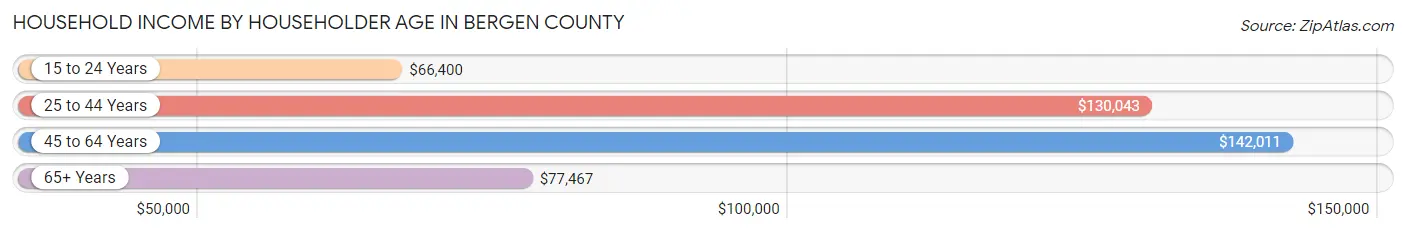
| Income Bracket | # Households | Median Income |
| 15 to 24 Years | 4,939 (1.4%) | $66,400 |
| 25 to 44 Years | 101,425 (28.9%) | $130,043 |
| 45 to 64 Years | 147,048 (41.9%) | $142,011 |
| 65+ Years | 97,431 (27.8%) | $77,467 |
| Total | 350,843 (100.0%) | $118,714 |
Poverty in Bergen County
Income Below Poverty by Sex and Age in Bergen County
With 5.7% poverty level for males and 7.8% for females among the residents of Bergen County, 6 to 11 year old males and 75 year old and over females are the most vulnerable to poverty, with 2,841 males (8.3%) and 5,357 females (12.7%) in their respective age groups living below the poverty level.
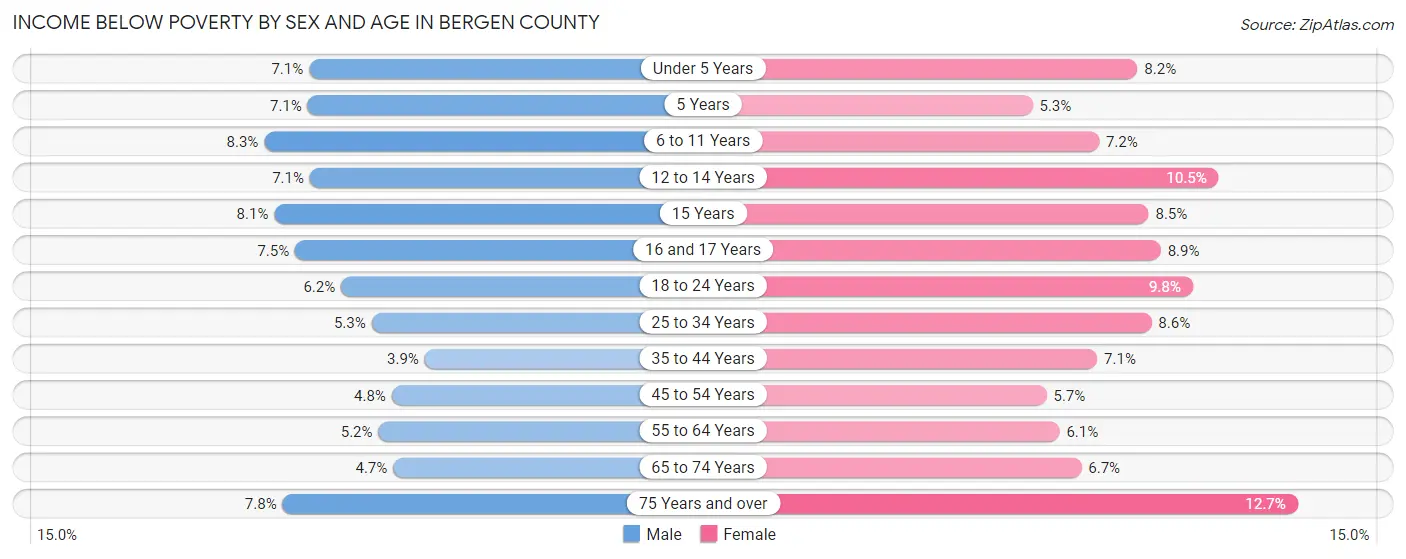
| Age Bracket | Male | Female |
| Under 5 Years | 1,745 (7.1%) | 1,934 (8.2%) |
| 5 Years | 346 (7.1%) | 252 (5.3%) |
| 6 to 11 Years | 2,841 (8.3%) | 2,303 (7.2%) |
| 12 to 14 Years | 1,291 (7.1%) | 1,910 (10.5%) |
| 15 Years | 502 (8.1%) | 514 (8.5%) |
| 16 and 17 Years | 973 (7.5%) | 1,081 (8.9%) |
| 18 to 24 Years | 2,390 (6.2%) | 3,599 (9.8%) |
| 25 to 34 Years | 2,922 (5.3%) | 4,624 (8.6%) |
| 35 to 44 Years | 2,427 (3.9%) | 4,570 (7.1%) |
| 45 to 54 Years | 3,192 (4.8%) | 3,880 (5.7%) |
| 55 to 64 Years | 3,410 (5.1%) | 4,185 (6.1%) |
| 65 to 74 Years | 2,075 (4.7%) | 3,278 (6.7%) |
| 75 Years and over | 2,224 (7.8%) | 5,357 (12.7%) |
| Total | 26,338 (5.7%) | 37,487 (7.8%) |
Income Above Poverty by Sex and Age in Bergen County
According to the poverty statistics in Bergen County, males aged 35 to 44 years and females aged 5 years are the age groups that are most secure financially, with 96.1% of males and 94.7% of females in these age groups living above the poverty line.
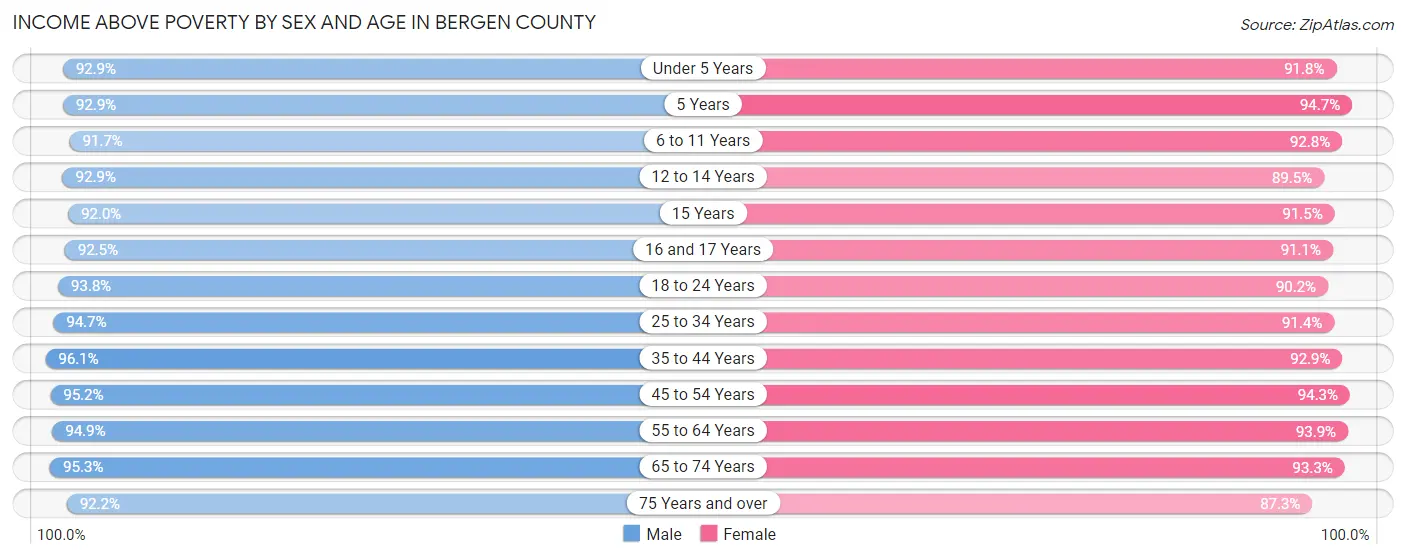
| Age Bracket | Male | Female |
| Under 5 Years | 22,919 (92.9%) | 21,555 (91.8%) |
| 5 Years | 4,512 (92.9%) | 4,495 (94.7%) |
| 6 to 11 Years | 31,280 (91.7%) | 29,864 (92.8%) |
| 12 to 14 Years | 17,005 (92.9%) | 16,306 (89.5%) |
| 15 Years | 5,736 (91.9%) | 5,502 (91.5%) |
| 16 and 17 Years | 12,059 (92.5%) | 11,088 (91.1%) |
| 18 to 24 Years | 36,201 (93.8%) | 33,244 (90.2%) |
| 25 to 34 Years | 51,834 (94.7%) | 49,010 (91.4%) |
| 35 to 44 Years | 60,508 (96.1%) | 59,747 (92.9%) |
| 45 to 54 Years | 63,569 (95.2%) | 64,249 (94.3%) |
| 55 to 64 Years | 62,752 (94.9%) | 64,904 (93.9%) |
| 65 to 74 Years | 41,668 (95.3%) | 45,893 (93.3%) |
| 75 Years and over | 26,219 (92.2%) | 36,846 (87.3%) |
| Total | 436,262 (94.3%) | 442,703 (92.2%) |
Income Below Poverty Among Married-Couple Families in Bergen County
The poverty statistics for married-couple families in Bergen County show that 2.8% or 5,557 of the total 196,430 families live below the poverty line. Families with 5 or more children have the highest poverty rate of 11.2%, comprising of 63 families. On the other hand, families with no children have the lowest poverty rate of 2.5%, which includes 2,722 families.
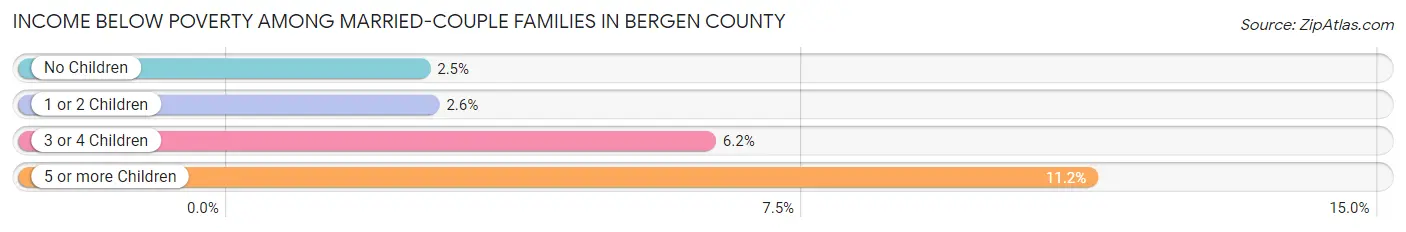
| Children | Above Poverty | Below Poverty |
| No Children | 105,592 (97.5%) | 2,722 (2.5%) |
| 1 or 2 Children | 72,636 (97.4%) | 1,963 (2.6%) |
| 3 or 4 Children | 12,147 (93.8%) | 809 (6.2%) |
| 5 or more Children | 498 (88.8%) | 63 (11.2%) |
| Total | 190,873 (97.2%) | 5,557 (2.8%) |
Income Below Poverty Among Single-Parent Households in Bergen County
According to the poverty data in Bergen County, 8.6% or 1,280 single-father households and 15.5% or 6,240 single-mother households are living below the poverty line. Among single-father households, those with 3 or 4 children have the highest poverty rate, with 77 households (13.8%) experiencing poverty. Likewise, among single-mother households, those with 5 or more children have the highest poverty rate, with 123 households (100.0%) falling below the poverty line.
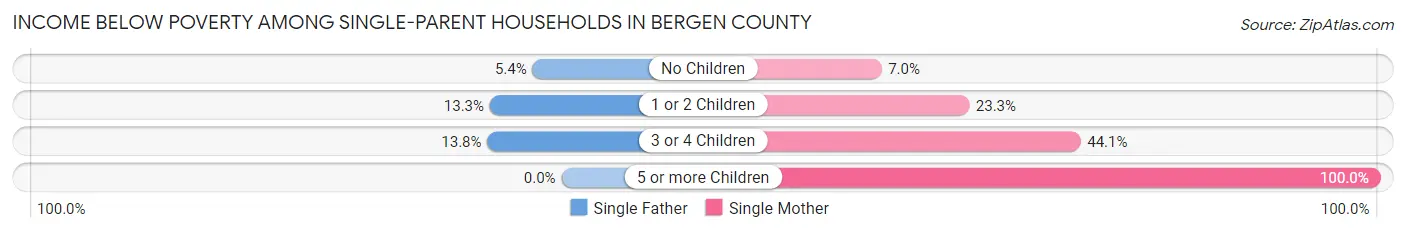
| Children | Single Father | Single Mother |
| No Children | 465 (5.4%) | 1,538 (7.0%) |
| 1 or 2 Children | 738 (13.3%) | 3,860 (23.3%) |
| 3 or 4 Children | 77 (13.8%) | 719 (44.1%) |
| 5 or more Children | 0 (0.0%) | 123 (100.0%) |
| Total | 1,280 (8.6%) | 6,240 (15.5%) |
Income Below Poverty Among Married-Couple vs Single-Parent Households in Bergen County
The poverty data for Bergen County shows that 5,557 of the married-couple family households (2.8%) and 7,520 of the single-parent households (13.7%) are living below the poverty level. Within the married-couple family households, those with 5 or more children have the highest poverty rate, with 63 households (11.2%) falling below the poverty line. Among the single-parent households, those with 5 or more children have the highest poverty rate, with 123 household (62.1%) living below poverty.
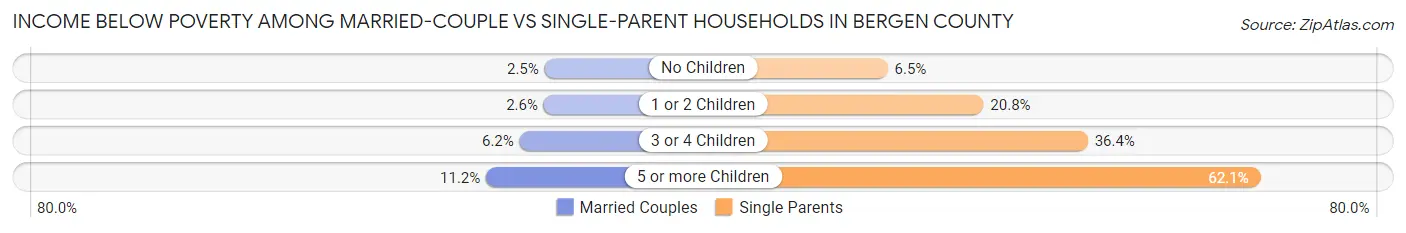
| Children | Married-Couple Families | Single-Parent Households |
| No Children | 2,722 (2.5%) | 2,003 (6.5%) |
| 1 or 2 Children | 1,963 (2.6%) | 4,598 (20.8%) |
| 3 or 4 Children | 809 (6.2%) | 796 (36.4%) |
| 5 or more Children | 63 (11.2%) | 123 (62.1%) |
| Total | 5,557 (2.8%) | 7,520 (13.7%) |
Employment Characteristics in Bergen County
Employment by Class of Employer in Bergen County
Among the 482,857 employed individuals in Bergen County, private company employees (331,368 | 68.6%), local government employees (41,079 | 8.5%), and not-for-profit organizations (38,136 | 7.9%) make up the most common classes of employment.
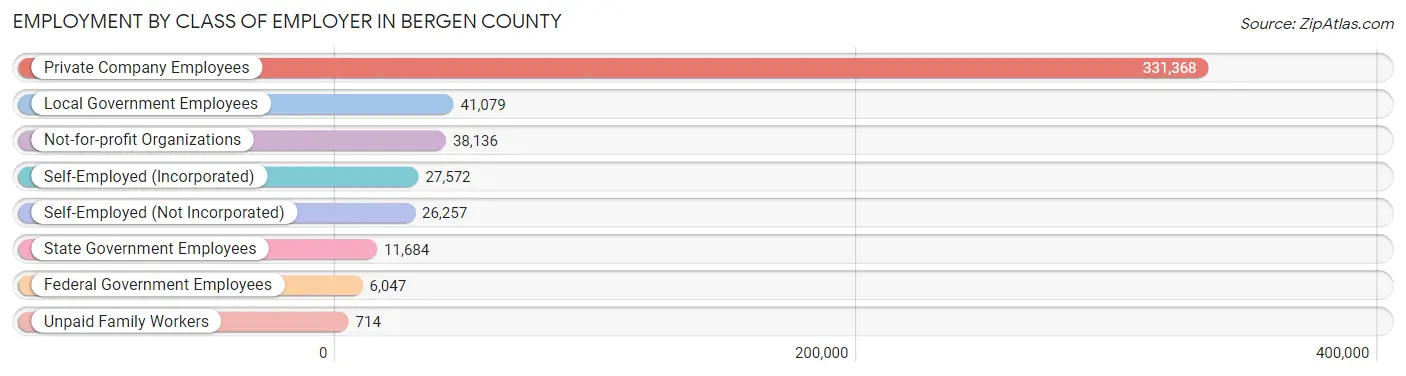
| Employer Class | # Employees | % Employees |
| Private Company Employees | 331,368 | 68.6% |
| Self-Employed (Incorporated) | 27,572 | 5.7% |
| Self-Employed (Not Incorporated) | 26,257 | 5.4% |
| Not-for-profit Organizations | 38,136 | 7.9% |
| Local Government Employees | 41,079 | 8.5% |
| State Government Employees | 11,684 | 2.4% |
| Federal Government Employees | 6,047 | 1.3% |
| Unpaid Family Workers | 714 | 0.2% |
| Total | 482,857 | 100.0% |
Employment Status by Age in Bergen County
According to the labor force statistics for Bergen County, out of the total population over 16 years of age (778,553), 66.9% or 520,852 individuals are in the labor force, with 5.5% or 28,647 of them unemployed. The age group with the highest labor force participation rate is 30 to 34 years, with 87.5% or 48,937 individuals in the labor force. Within the labor force, the 16 to 19 years age range has the highest percentage of unemployed individuals, with 16.7% or 2,090 of them being unemployed.
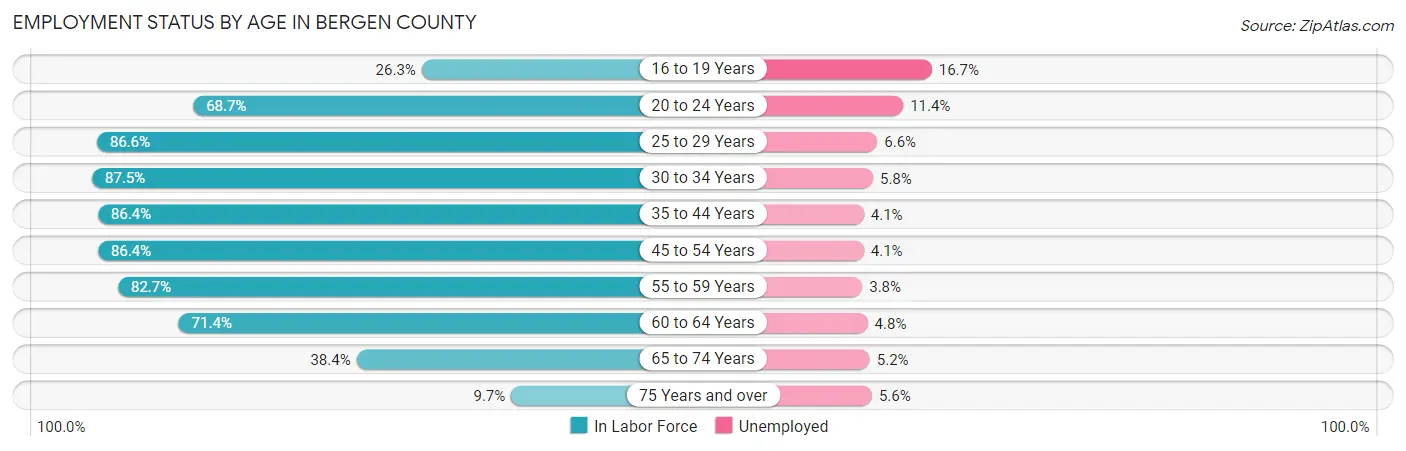
| Age Bracket | In Labor Force | Unemployed |
| 16 to 19 Years | 12,515 (26.3%) | 2,090 (16.7%) |
| 20 to 24 Years | 38,727 (68.7%) | 4,415 (11.4%) |
| 25 to 29 Years | 45,766 (86.6%) | 3,021 (6.6%) |
| 30 to 34 Years | 48,937 (87.5%) | 2,838 (5.8%) |
| 35 to 44 Years | 110,277 (86.4%) | 4,521 (4.1%) |
| 45 to 54 Years | 116,820 (86.4%) | 4,790 (4.1%) |
| 55 to 59 Years | 59,189 (82.7%) | 2,249 (3.8%) |
| 60 to 64 Years | 45,789 (71.4%) | 2,198 (4.8%) |
| 65 to 74 Years | 35,856 (38.4%) | 1,865 (5.2%) |
| 75 Years and over | 7,168 (9.7%) | 401 (5.6%) |
| Total | 520,852 (66.9%) | 28,647 (5.5%) |
Employment Status by Educational Attainment in Bergen County
According to labor force statistics for Bergen County, 84.1% of individuals (426,656) out of the total population between 25 and 64 years of age (507,320) are in the labor force, with 4.6% or 19,626 of them being unemployed. The group with the highest labor force participation rate are those with the educational attainment of bachelor's degree or higher, with 87.6% or 245,304 individuals in the labor force. Within the labor force, individuals with college / associate degree education have the highest percentage of unemployment, with 6.8% or 6,160 of them being unemployed.
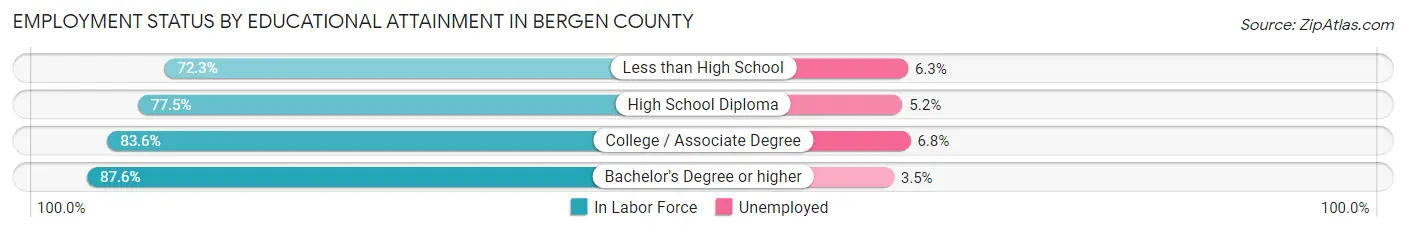
| Educational Attainment | In Labor Force | Unemployed |
| Less than High School | 19,755 (72.3%) | 1,721 (6.3%) |
| High School Diploma | 70,995 (77.5%) | 4,764 (5.2%) |
| College / Associate Degree | 90,591 (83.6%) | 7,369 (6.8%) |
| Bachelor's Degree or higher | 245,304 (87.6%) | 9,801 (3.5%) |
| Total | 426,656 (84.1%) | 23,337 (4.6%) |
Employment Occupations by Sex in Bergen County
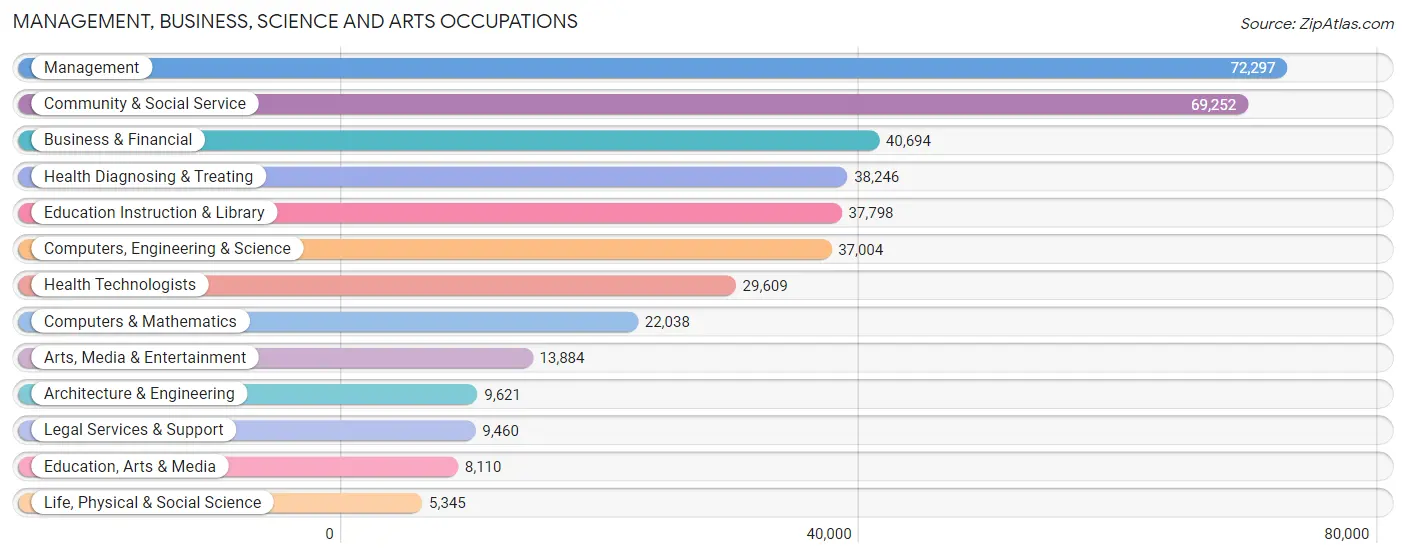
Management, Business, Science and Arts Occupations
The most common Management, Business, Science and Arts occupations in Bergen County are Management (72,297 | 14.7%), Community & Social Service (69,252 | 14.1%), Business & Financial (40,694 | 8.3%), Health Diagnosing & Treating (38,246 | 7.8%), and Education Instruction & Library (37,798 | 7.7%).
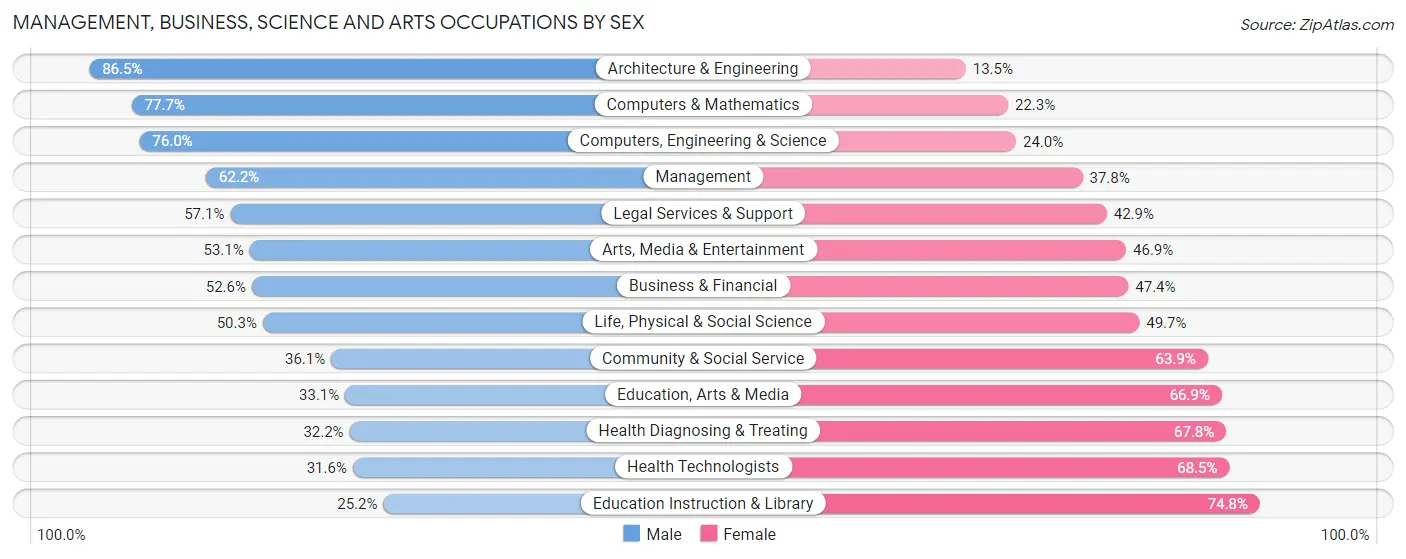
Management, Business, Science and Arts Occupations by Sex
Within the Management, Business, Science and Arts occupations in Bergen County, the most male-oriented occupations are Architecture & Engineering (86.5%), Computers & Mathematics (77.7%), and Computers, Engineering & Science (76.0%), while the most female-oriented occupations are Education Instruction & Library (74.8%), Health Technologists (68.4%), and Health Diagnosing & Treating (67.8%).
| Occupation | Male | Female |
| Management | 44,946 (62.2%) | 27,351 (37.8%) |
| Business & Financial | 21,409 (52.6%) | 19,285 (47.4%) |
| Computers, Engineering & Science | 28,138 (76.0%) | 8,866 (24.0%) |
| Computers & Mathematics | 17,124 (77.7%) | 4,914 (22.3%) |
| Architecture & Engineering | 8,324 (86.5%) | 1,297 (13.5%) |
| Life, Physical & Social Science | 2,690 (50.3%) | 2,655 (49.7%) |
| Community & Social Service | 24,978 (36.1%) | 44,274 (63.9%) |
| Education, Arts & Media | 2,688 (33.1%) | 5,422 (66.9%) |
| Legal Services & Support | 5,402 (57.1%) | 4,058 (42.9%) |
| Education Instruction & Library | 9,519 (25.2%) | 28,279 (74.8%) |
| Arts, Media & Entertainment | 7,369 (53.1%) | 6,515 (46.9%) |
| Health Diagnosing & Treating | 12,329 (32.2%) | 25,917 (67.8%) |
| Health Technologists | 9,343 (31.6%) | 20,266 (68.4%) |
| Total (Category) | 131,800 (51.2%) | 125,693 (48.8%) |
| Total (Overall) | 261,787 (53.2%) | 230,572 (46.8%) |
Services Occupations
The most common Services occupations in Bergen County are Food Preparation & Serving (14,629 | 3.0%), Personal Care & Service (14,112 | 2.9%), Cleaning & Maintenance (11,335 | 2.3%), Healthcare Support (11,230 | 2.3%), and Security & Protection (9,597 | 1.9%).

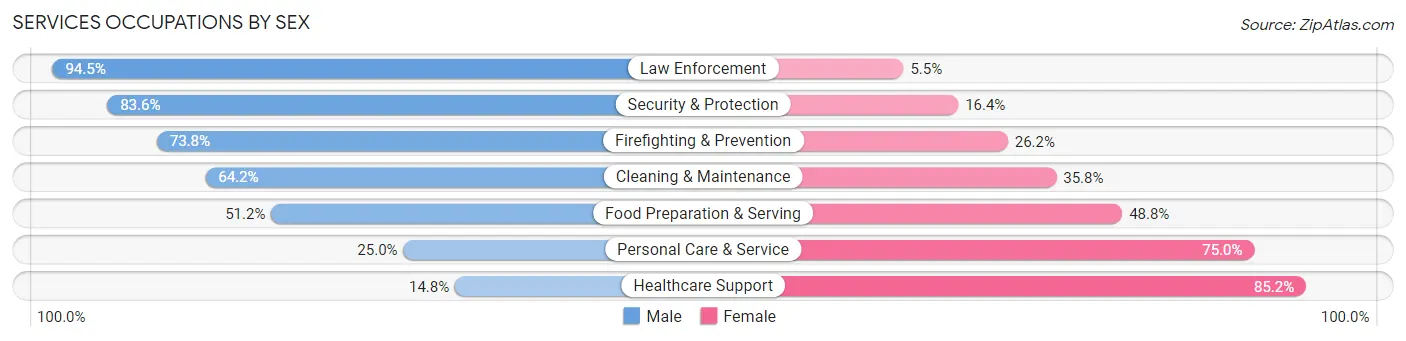
Services Occupations by Sex
Within the Services occupations in Bergen County, the most male-oriented occupations are Law Enforcement (94.5%), Security & Protection (83.6%), and Firefighting & Prevention (73.8%), while the most female-oriented occupations are Healthcare Support (85.2%), Personal Care & Service (75.0%), and Food Preparation & Serving (48.8%).
| Occupation | Male | Female |
| Healthcare Support | 1,657 (14.8%) | 9,573 (85.2%) |
| Security & Protection | 8,026 (83.6%) | 1,571 (16.4%) |
| Firefighting & Prevention | 3,717 (73.8%) | 1,319 (26.2%) |
| Law Enforcement | 4,309 (94.5%) | 252 (5.5%) |
| Food Preparation & Serving | 7,484 (51.2%) | 7,145 (48.8%) |
| Cleaning & Maintenance | 7,278 (64.2%) | 4,057 (35.8%) |
| Personal Care & Service | 3,526 (25.0%) | 10,586 (75.0%) |
| Total (Category) | 27,971 (45.9%) | 32,932 (54.1%) |
| Total (Overall) | 261,787 (53.2%) | 230,572 (46.8%) |
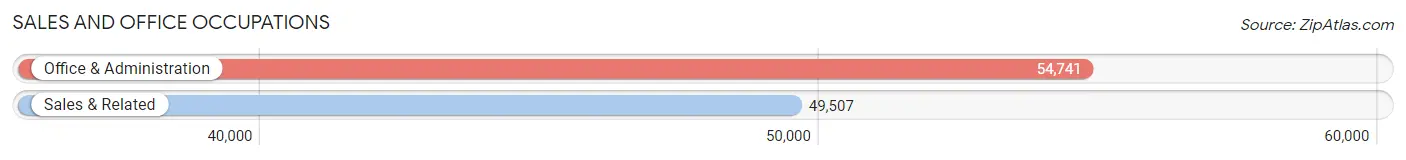
Sales and Office Occupations
The most common Sales and Office occupations in Bergen County are Office & Administration (54,741 | 11.1%), and Sales & Related (49,507 | 10.1%).
Sales and Office Occupations by Sex
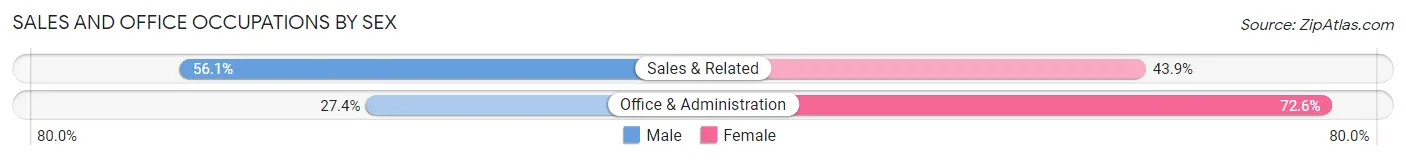
| Occupation | Male | Female |
| Sales & Related | 27,771 (56.1%) | 21,736 (43.9%) |
| Office & Administration | 15,013 (27.4%) | 39,728 (72.6%) |
| Total (Category) | 42,784 (41.0%) | 61,464 (59.0%) |
| Total (Overall) | 261,787 (53.2%) | 230,572 (46.8%) |
Natural Resources, Construction and Maintenance Occupations
The most common Natural Resources, Construction and Maintenance occupations in Bergen County are Construction & Extraction (15,929 | 3.2%), Installation, Maintenance & Repair (10,138 | 2.1%), and Farming, Fishing & Forestry (169 | 0.0%).

Natural Resources, Construction and Maintenance Occupations by Sex
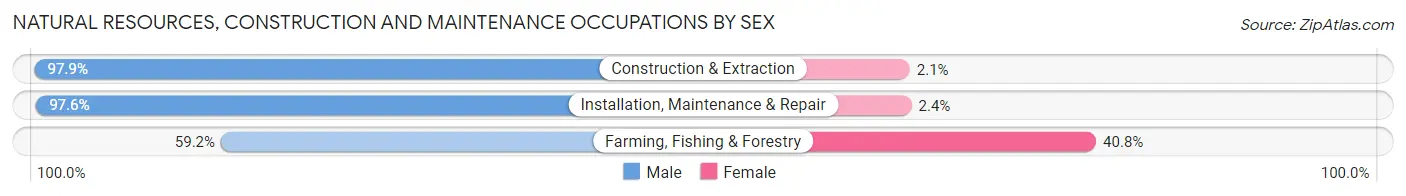
| Occupation | Male | Female |
| Farming, Fishing & Forestry | 100 (59.2%) | 69 (40.8%) |
| Construction & Extraction | 15,599 (97.9%) | 330 (2.1%) |
| Installation, Maintenance & Repair | 9,892 (97.6%) | 246 (2.4%) |
| Total (Category) | 25,591 (97.5%) | 645 (2.5%) |
| Total (Overall) | 261,787 (53.2%) | 230,572 (46.8%) |
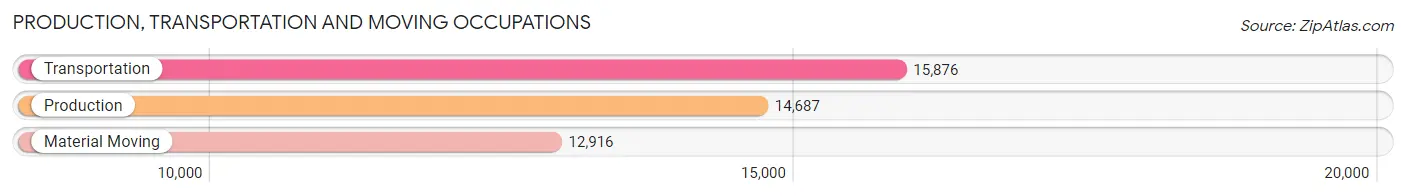
Production, Transportation and Moving Occupations
The most common Production, Transportation and Moving occupations in Bergen County are Transportation (15,876 | 3.2%), Production (14,687 | 3.0%), and Material Moving (12,916 | 2.6%).
Production, Transportation and Moving Occupations by Sex
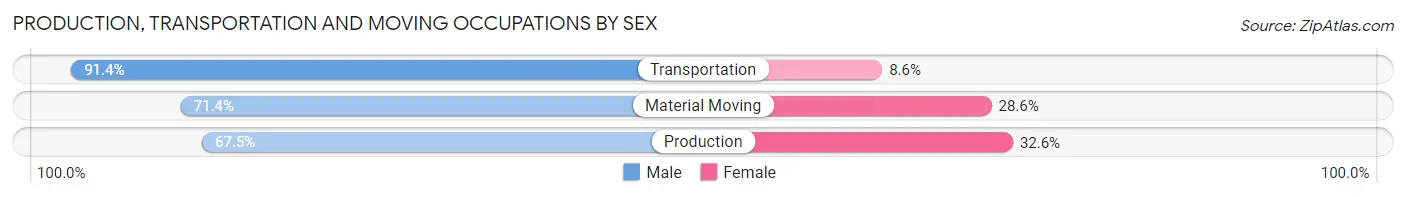
| Occupation | Male | Female |
| Production | 9,906 (67.4%) | 4,781 (32.6%) |
| Transportation | 14,517 (91.4%) | 1,359 (8.6%) |
| Material Moving | 9,218 (71.4%) | 3,698 (28.6%) |
| Total (Category) | 33,641 (77.4%) | 9,838 (22.6%) |
| Total (Overall) | 261,787 (53.2%) | 230,572 (46.8%) |
Employment Industries by Sex in Bergen County
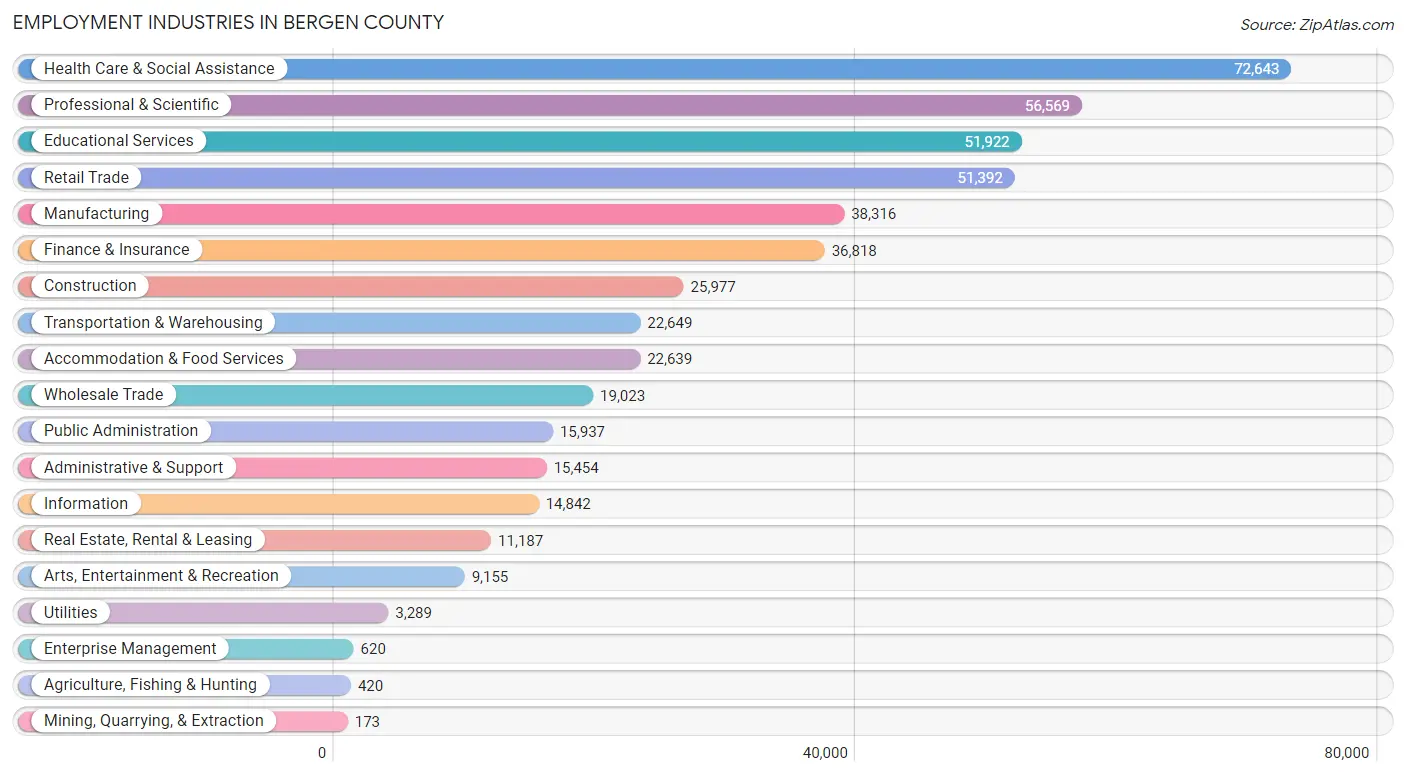
Employment Industries in Bergen County
The major employment industries in Bergen County include Health Care & Social Assistance (72,643 | 14.7%), Professional & Scientific (56,569 | 11.5%), Educational Services (51,922 | 10.5%), Retail Trade (51,392 | 10.4%), and Manufacturing (38,316 | 7.8%).
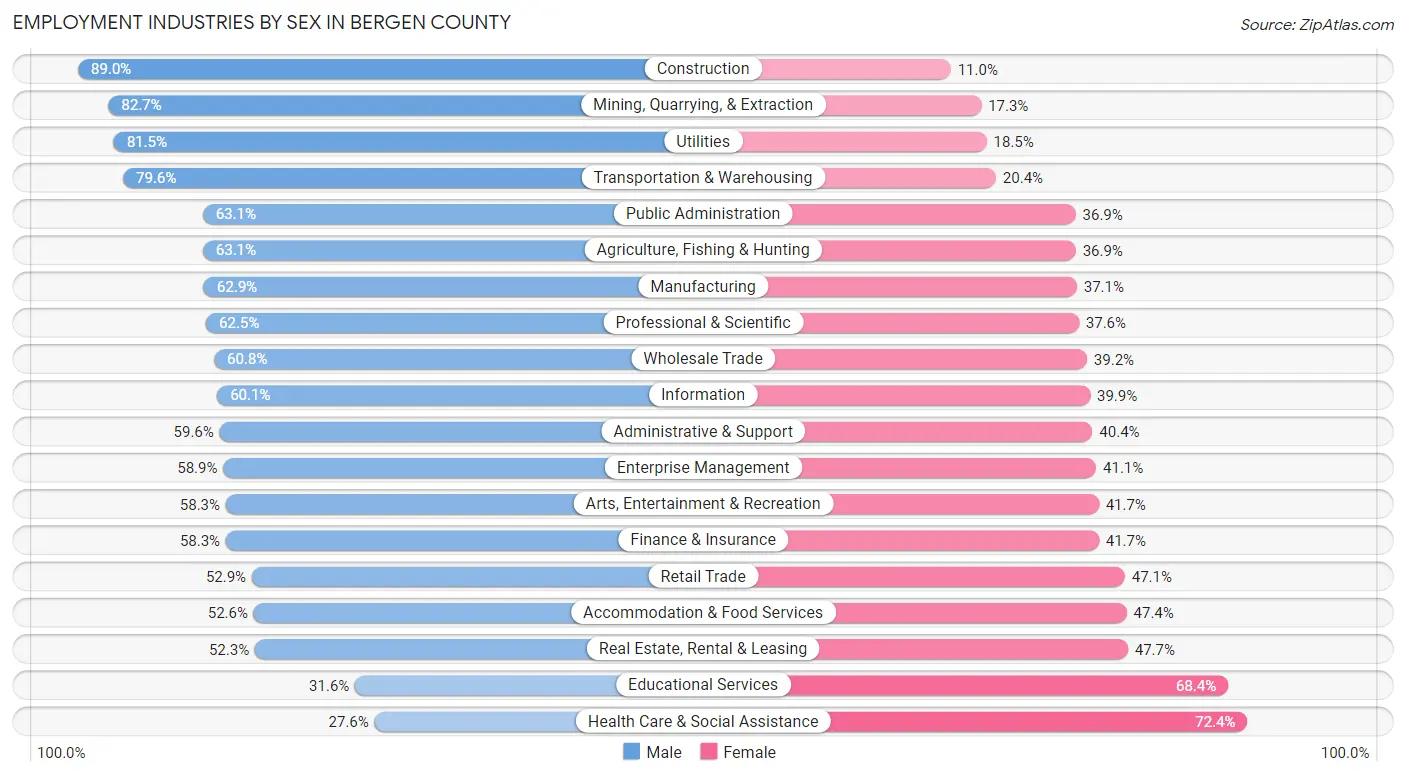
Employment Industries by Sex in Bergen County
The Bergen County industries that see more men than women are Construction (89.0%), Mining, Quarrying, & Extraction (82.7%), and Utilities (81.5%), whereas the industries that tend to have a higher number of women are Health Care & Social Assistance (72.4%), Educational Services (68.4%), and Real Estate, Rental & Leasing (47.7%).
| Industry | Male | Female |
| Agriculture, Fishing & Hunting | 265 (63.1%) | 155 (36.9%) |
| Mining, Quarrying, & Extraction | 143 (82.7%) | 30 (17.3%) |
| Construction | 23,110 (89.0%) | 2,867 (11.0%) |
| Manufacturing | 24,095 (62.9%) | 14,221 (37.1%) |
| Wholesale Trade | 11,562 (60.8%) | 7,461 (39.2%) |
| Retail Trade | 27,209 (52.9%) | 24,183 (47.1%) |
| Transportation & Warehousing | 18,034 (79.6%) | 4,615 (20.4%) |
| Utilities | 2,682 (81.5%) | 607 (18.5%) |
| Information | 8,925 (60.1%) | 5,917 (39.9%) |
| Finance & Insurance | 21,472 (58.3%) | 15,346 (41.7%) |
| Real Estate, Rental & Leasing | 5,852 (52.3%) | 5,335 (47.7%) |
| Professional & Scientific | 35,329 (62.5%) | 21,240 (37.6%) |
| Enterprise Management | 365 (58.9%) | 255 (41.1%) |
| Administrative & Support | 9,216 (59.6%) | 6,238 (40.4%) |
| Educational Services | 16,395 (31.6%) | 35,527 (68.4%) |
| Health Care & Social Assistance | 20,024 (27.6%) | 52,619 (72.4%) |
| Arts, Entertainment & Recreation | 5,341 (58.3%) | 3,814 (41.7%) |
| Accommodation & Food Services | 11,898 (52.6%) | 10,741 (47.4%) |
| Public Administration | 10,059 (63.1%) | 5,878 (36.9%) |
| Total | 261,787 (53.2%) | 230,572 (46.8%) |
Education in Bergen County
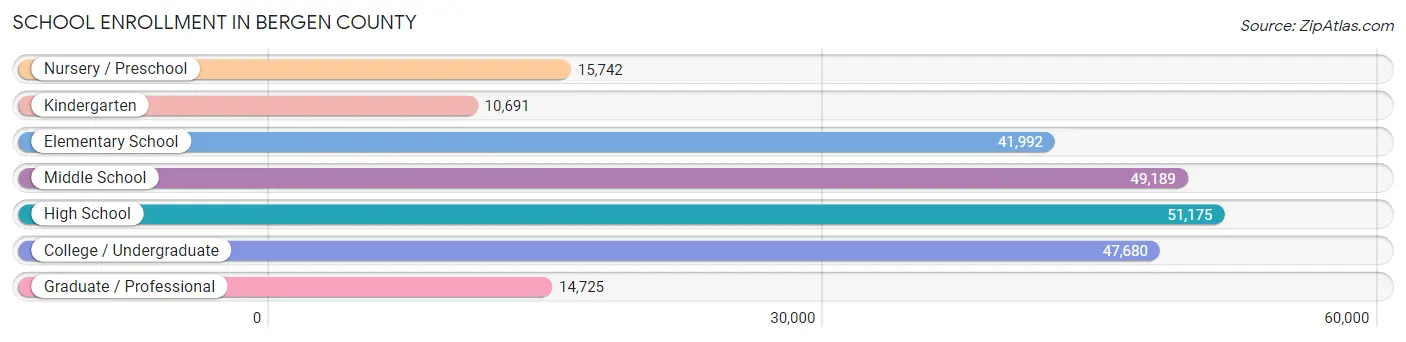
School Enrollment in Bergen County
The most common levels of schooling among the 231,194 students in Bergen County are high school (51,175 | 22.1%), middle school (49,189 | 21.3%), and college / undergraduate (47,680 | 20.6%).
| School Level | # Students | % Students |
| Nursery / Preschool | 15,742 | 6.8% |
| Kindergarten | 10,691 | 4.6% |
| Elementary School | 41,992 | 18.2% |
| Middle School | 49,189 | 21.3% |
| High School | 51,175 | 22.1% |
| College / Undergraduate | 47,680 | 20.6% |
| Graduate / Professional | 14,725 | 6.4% |
| Total | 231,194 | 100.0% |
School Enrollment by Age by Funding Source in Bergen County
Out of a total of 231,194 students who are enrolled in schools in Bergen County, 53,175 (23.0%) attend a private institution, while the remaining 178,019 (77.0%) are enrolled in public schools. The age group of 3 to 4 year olds has the highest likelihood of being enrolled in private schools, with 7,899 (61.4% in the age bracket) enrolled. Conversely, the age group of 10 to 14 year olds has the lowest likelihood of being enrolled in a private school, with 53,193 (88.8% in the age bracket) attending a public institution.

| Age Bracket | Public School | Private School |
| 3 to 4 Year Olds | 4,961 (38.6%) | 7,899 (61.4%) |
| 5 to 9 Year Old | 43,962 (86.4%) | 6,939 (13.6%) |
| 10 to 14 Year Olds | 53,193 (88.8%) | 6,708 (11.2%) |
| 15 to 17 Year Olds | 31,598 (86.3%) | 5,011 (13.7%) |
| 18 to 19 Year Olds | 14,651 (73.9%) | 5,176 (26.1%) |
| 20 to 24 Year Olds | 16,029 (59.2%) | 11,071 (40.8%) |
| 25 to 34 Year Olds | 7,583 (61.5%) | 4,744 (38.5%) |
| 35 Years and over | 5,991 (51.3%) | 5,678 (48.7%) |
| Total | 178,019 (77.0%) | 53,175 (23.0%) |
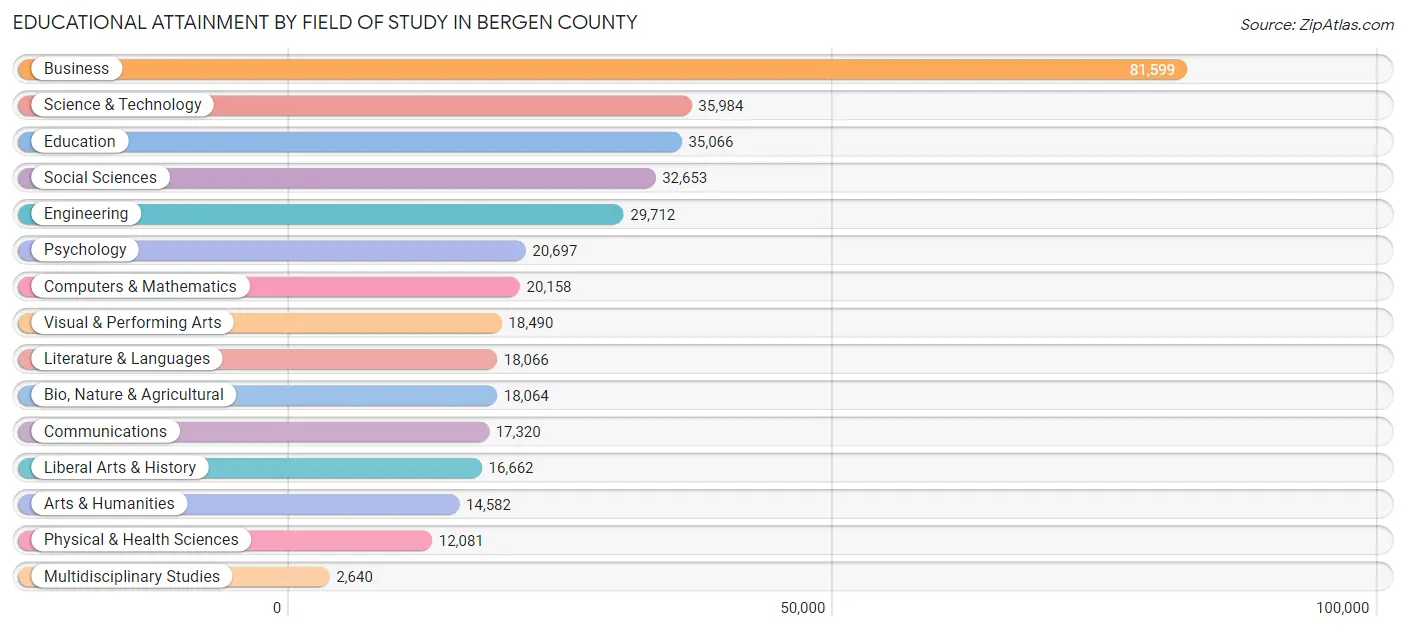
Educational Attainment by Field of Study in Bergen County
Business (81,599 | 21.8%), science & technology (35,984 | 9.6%), education (35,066 | 9.4%), social sciences (32,653 | 8.7%), and engineering (29,712 | 8.0%) are the most common fields of study among 373,774 individuals in Bergen County who have obtained a bachelor's degree or higher.
| Field of Study | # Graduates | % Graduates |
| Computers & Mathematics | 20,158 | 5.4% |
| Bio, Nature & Agricultural | 18,064 | 4.8% |
| Physical & Health Sciences | 12,081 | 3.2% |
| Psychology | 20,697 | 5.5% |
| Social Sciences | 32,653 | 8.7% |
| Engineering | 29,712 | 8.0% |
| Multidisciplinary Studies | 2,640 | 0.7% |
| Science & Technology | 35,984 | 9.6% |
| Business | 81,599 | 21.8% |
| Education | 35,066 | 9.4% |
| Literature & Languages | 18,066 | 4.8% |
| Liberal Arts & History | 16,662 | 4.5% |
| Visual & Performing Arts | 18,490 | 5.0% |
| Communications | 17,320 | 4.6% |
| Arts & Humanities | 14,582 | 3.9% |
| Total | 373,774 | 100.0% |
Transportation & Commute in Bergen County
Vehicle Availability by Sex in Bergen County
The most prevalent vehicle ownership categories in Bergen County are males with 2 vehicles (110,102, accounting for 42.7%) and females with 2 vehicles (93,926, making up 49.2%).
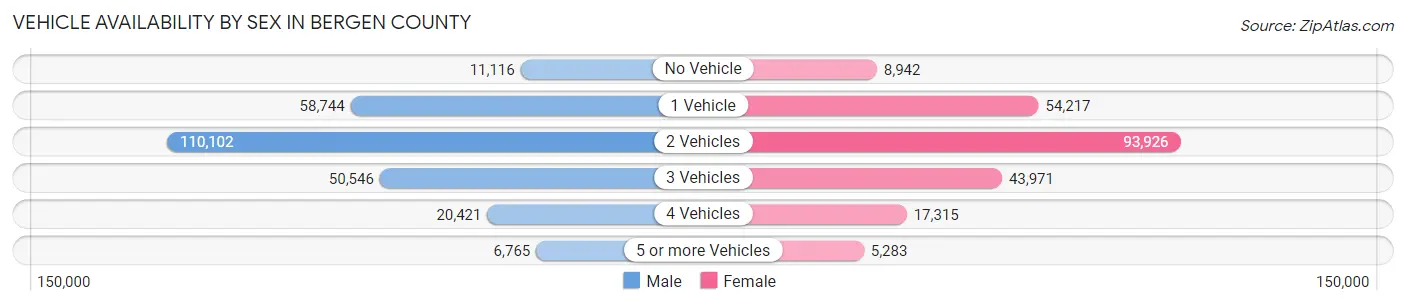
| Vehicles Available | Male | Female |
| No Vehicle | 11,116 (4.3%) | 8,942 (4.0%) |
| 1 Vehicle | 58,744 (22.8%) | 54,217 (24.2%) |
| 2 Vehicles | 110,102 (42.7%) | 93,926 (42.0%) |
| 3 Vehicles | 50,546 (19.6%) | 43,971 (19.7%) |
| 4 Vehicles | 20,421 (7.9%) | 17,315 (7.7%) |
| 5 or more Vehicles | 6,765 (2.6%) | 5,283 (2.4%) |
| Total | 257,694 (100.0%) | 223,654 (100.0%) |
Commute Time in Bergen County
The most frequently occuring commute durations in Bergen County are 60 to 89 minutes (53,698 commuters, 13.0%), 20 to 24 minutes (52,883 commuters, 12.8%), and 30 to 34 minutes (52,829 commuters, 12.8%).
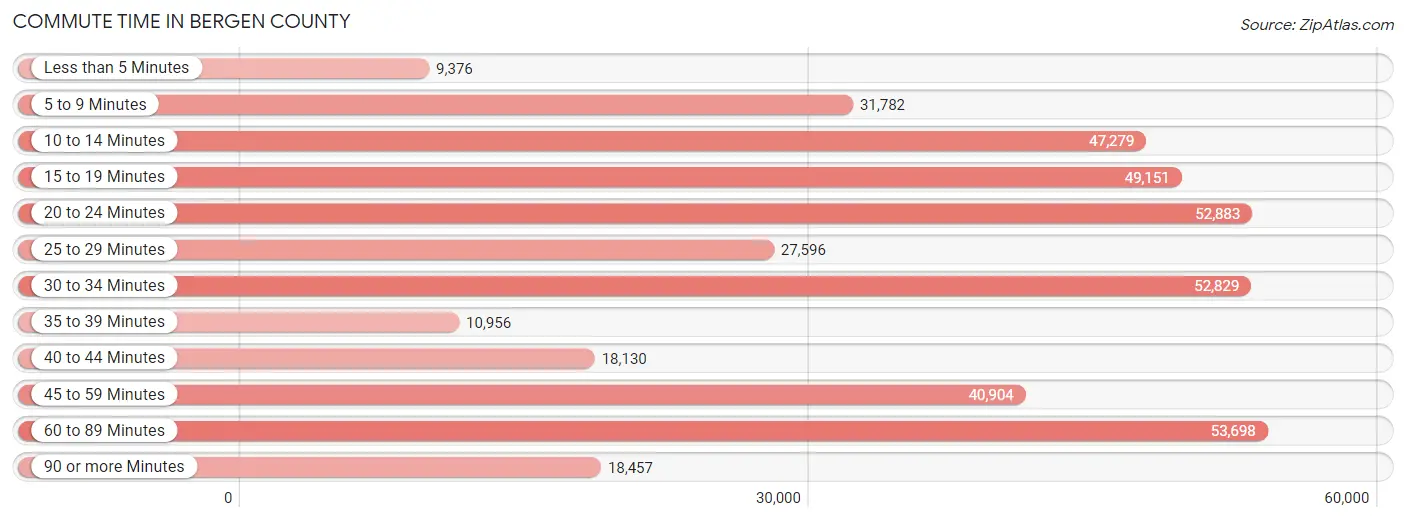
| Commute Time | # Commuters | % Commuters |
| Less than 5 Minutes | 9,376 | 2.3% |
| 5 to 9 Minutes | 31,782 | 7.7% |
| 10 to 14 Minutes | 47,279 | 11.5% |
| 15 to 19 Minutes | 49,151 | 11.9% |
| 20 to 24 Minutes | 52,883 | 12.8% |
| 25 to 29 Minutes | 27,596 | 6.7% |
| 30 to 34 Minutes | 52,829 | 12.8% |
| 35 to 39 Minutes | 10,956 | 2.6% |
| 40 to 44 Minutes | 18,130 | 4.4% |
| 45 to 59 Minutes | 40,904 | 9.9% |
| 60 to 89 Minutes | 53,698 | 13.0% |
| 90 or more Minutes | 18,457 | 4.5% |
Commute Time by Sex in Bergen County
The most common commute times in Bergen County are 60 to 89 minutes (32,003 commuters, 14.4%) for males and 20 to 24 minutes (26,097 commuters, 13.7%) for females.
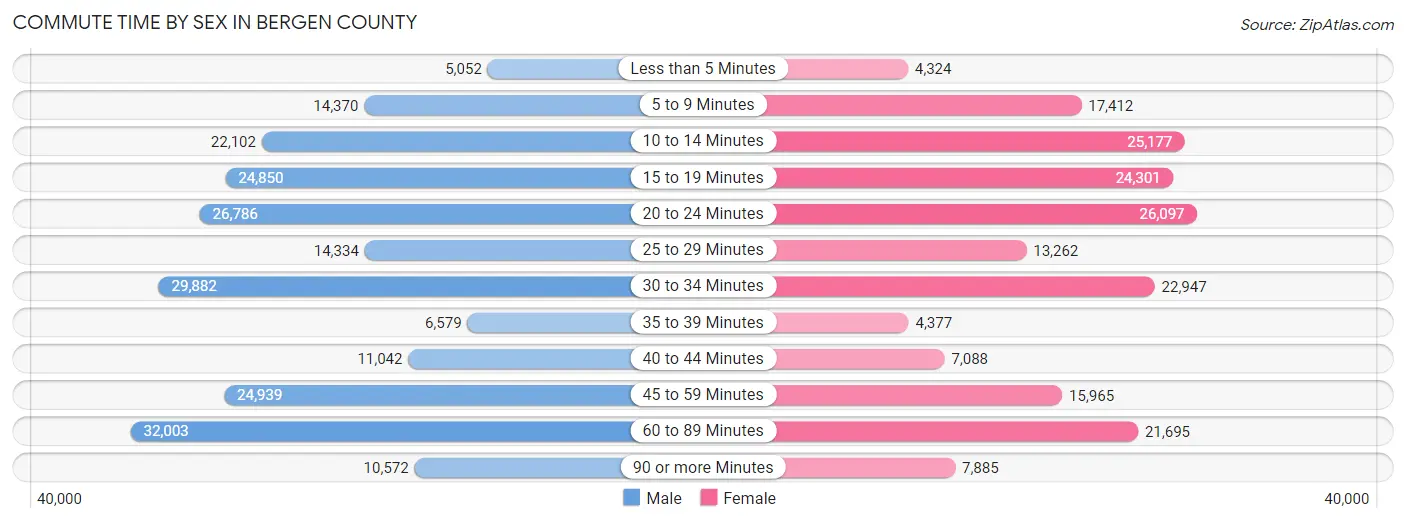
| Commute Time | Male | Female |
| Less than 5 Minutes | 5,052 (2.3%) | 4,324 (2.3%) |
| 5 to 9 Minutes | 14,370 (6.5%) | 17,412 (9.1%) |
| 10 to 14 Minutes | 22,102 (9.9%) | 25,177 (13.2%) |
| 15 to 19 Minutes | 24,850 (11.2%) | 24,301 (12.8%) |
| 20 to 24 Minutes | 26,786 (12.0%) | 26,097 (13.7%) |
| 25 to 29 Minutes | 14,334 (6.4%) | 13,262 (7.0%) |
| 30 to 34 Minutes | 29,882 (13.4%) | 22,947 (12.0%) |
| 35 to 39 Minutes | 6,579 (3.0%) | 4,377 (2.3%) |
| 40 to 44 Minutes | 11,042 (5.0%) | 7,088 (3.7%) |
| 45 to 59 Minutes | 24,939 (11.2%) | 15,965 (8.4%) |
| 60 to 89 Minutes | 32,003 (14.4%) | 21,695 (11.4%) |
| 90 or more Minutes | 10,572 (4.8%) | 7,885 (4.1%) |
Time of Departure to Work by Sex in Bergen County
The most frequent times of departure to work in Bergen County are 8:00 AM to 8:29 AM (38,799, 17.4%) for males and 8:00 AM to 8:29 AM (38,851, 20.4%) for females.
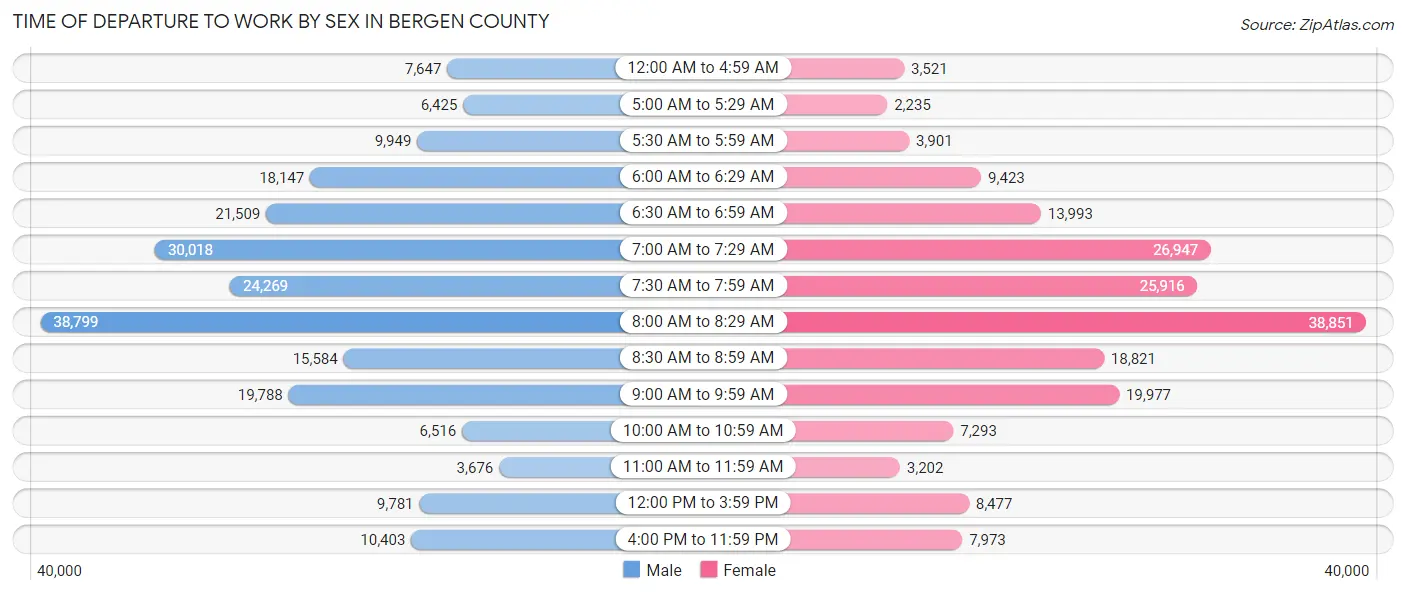
| Time of Departure | Male | Female |
| 12:00 AM to 4:59 AM | 7,647 (3.4%) | 3,521 (1.8%) |
| 5:00 AM to 5:29 AM | 6,425 (2.9%) | 2,235 (1.2%) |
| 5:30 AM to 5:59 AM | 9,949 (4.5%) | 3,901 (2.1%) |
| 6:00 AM to 6:29 AM | 18,147 (8.2%) | 9,423 (5.0%) |
| 6:30 AM to 6:59 AM | 21,509 (9.7%) | 13,993 (7.3%) |
| 7:00 AM to 7:29 AM | 30,018 (13.5%) | 26,947 (14.1%) |
| 7:30 AM to 7:59 AM | 24,269 (10.9%) | 25,916 (13.6%) |
| 8:00 AM to 8:29 AM | 38,799 (17.4%) | 38,851 (20.4%) |
| 8:30 AM to 8:59 AM | 15,584 (7.0%) | 18,821 (9.9%) |
| 9:00 AM to 9:59 AM | 19,788 (8.9%) | 19,977 (10.5%) |
| 10:00 AM to 10:59 AM | 6,516 (2.9%) | 7,293 (3.8%) |
| 11:00 AM to 11:59 AM | 3,676 (1.7%) | 3,202 (1.7%) |
| 12:00 PM to 3:59 PM | 9,781 (4.4%) | 8,477 (4.4%) |
| 4:00 PM to 11:59 PM | 10,403 (4.7%) | 7,973 (4.2%) |
| Total | 222,511 (100.0%) | 190,530 (100.0%) |
Housing Occupancy in Bergen County
Occupancy by Ownership in Bergen County
Of the total 350,843 dwellings in Bergen County, owner-occupied units account for 228,445 (65.1%), while renter-occupied units make up 122,398 (34.9%).
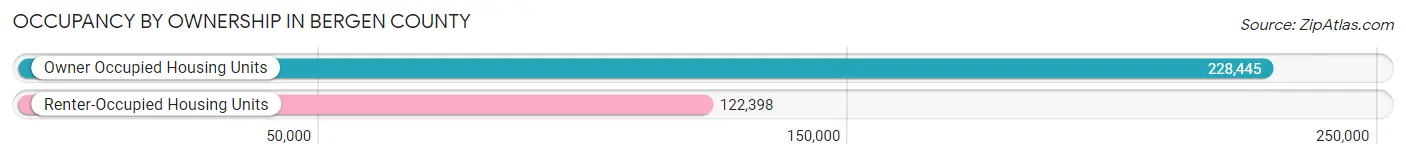
| Occupancy | # Housing Units | % Housing Units |
| Owner Occupied Housing Units | 228,445 | 65.1% |
| Renter-Occupied Housing Units | 122,398 | 34.9% |
| Total Occupied Housing Units | 350,843 | 100.0% |
Occupancy by Household Size in Bergen County
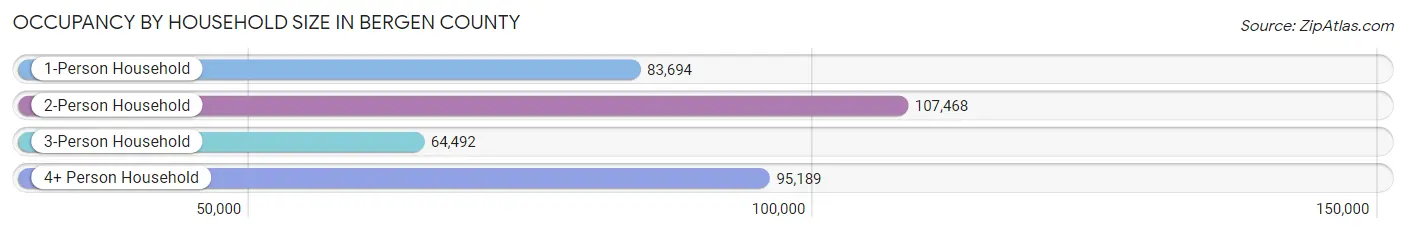
| Household Size | # Housing Units | % Housing Units |
| 1-Person Household | 83,694 | 23.9% |
| 2-Person Household | 107,468 | 30.6% |
| 3-Person Household | 64,492 | 18.4% |
| 4+ Person Household | 95,189 | 27.1% |
| Total Housing Units | 350,843 | 100.0% |
Occupancy by Ownership by Household Size in Bergen County
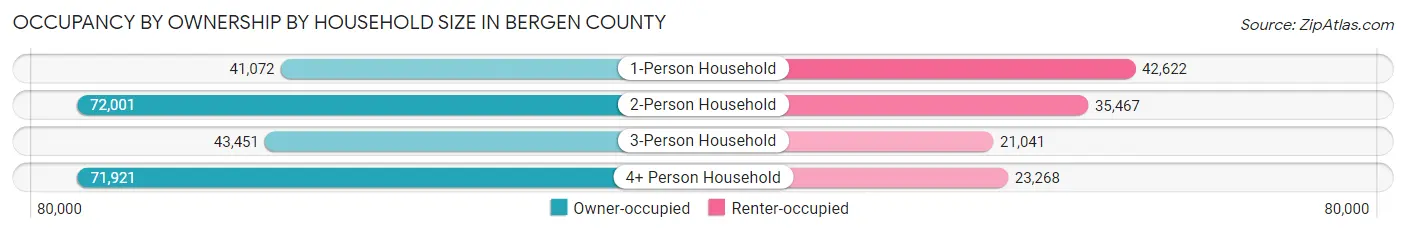
| Household Size | Owner-occupied | Renter-occupied |
| 1-Person Household | 41,072 (49.1%) | 42,622 (50.9%) |
| 2-Person Household | 72,001 (67.0%) | 35,467 (33.0%) |
| 3-Person Household | 43,451 (67.4%) | 21,041 (32.6%) |
| 4+ Person Household | 71,921 (75.6%) | 23,268 (24.4%) |
| Total Housing Units | 228,445 (65.1%) | 122,398 (34.9%) |
Occupancy by Educational Attainment in Bergen County
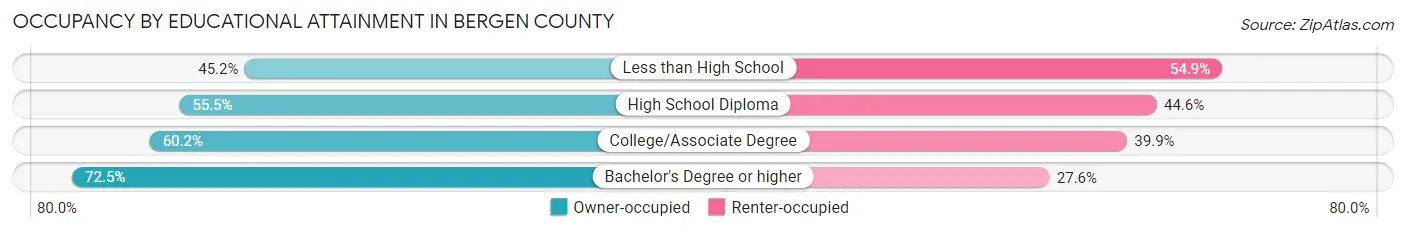
| Household Size | Owner-occupied | Renter-occupied |
| Less than High School | 9,328 (45.2%) | 11,333 (54.8%) |
| High School Diploma | 35,721 (55.4%) | 28,703 (44.6%) |
| College/Associate Degree | 44,678 (60.2%) | 29,601 (39.9%) |
| Bachelor's Degree or higher | 138,718 (72.5%) | 52,761 (27.6%) |
Occupancy by Age of Householder in Bergen County
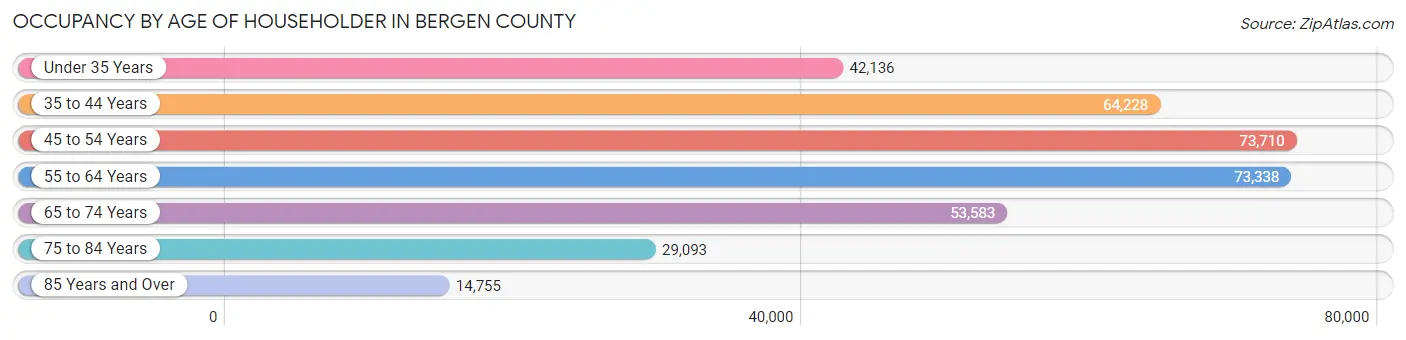
| Age Bracket | # Households | % Households |
| Under 35 Years | 42,136 | 12.0% |
| 35 to 44 Years | 64,228 | 18.3% |
| 45 to 54 Years | 73,710 | 21.0% |
| 55 to 64 Years | 73,338 | 20.9% |
| 65 to 74 Years | 53,583 | 15.3% |
| 75 to 84 Years | 29,093 | 8.3% |
| 85 Years and Over | 14,755 | 4.2% |
| Total | 350,843 | 100.0% |
Housing Finances in Bergen County
Median Income by Occupancy in Bergen County
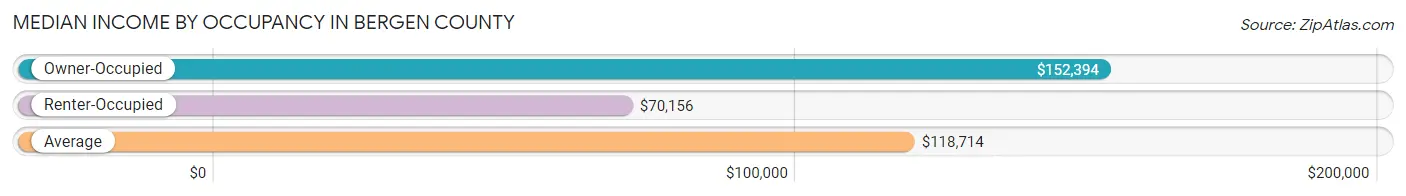
| Occupancy Type | # Households | Median Income |
| Owner-Occupied | 228,445 (65.1%) | $152,394 |
| Renter-Occupied | 122,398 (34.9%) | $70,156 |
| Average | 350,843 (100.0%) | $118,714 |
Occupancy by Householder Income Bracket in Bergen County
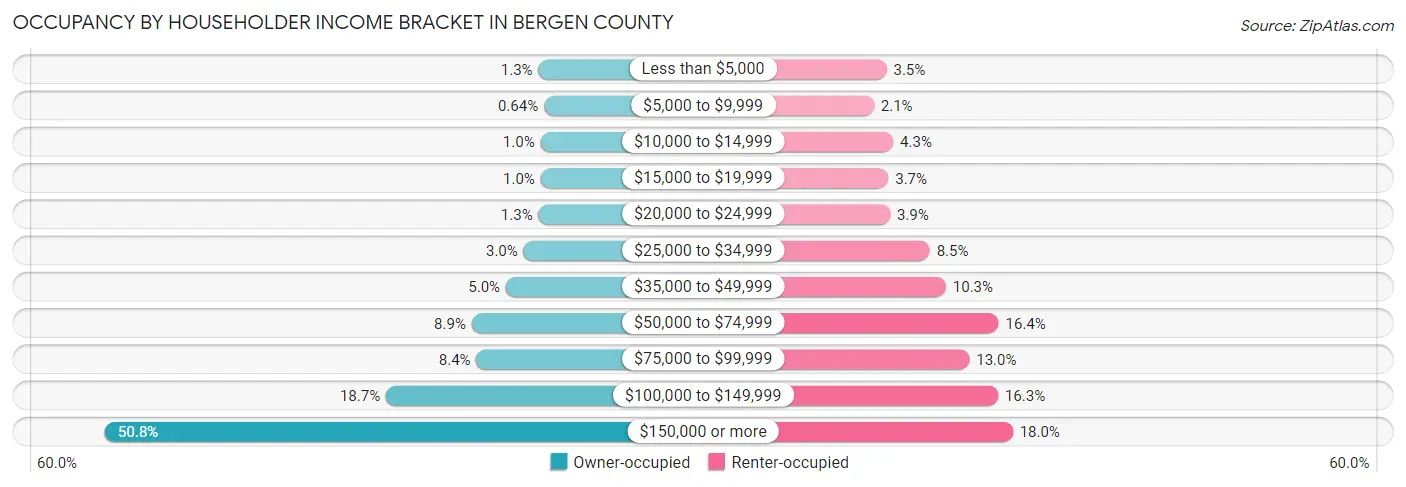
| Income Bracket | Owner-occupied | Renter-occupied |
| Less than $5,000 | 2,934 (1.3%) | 4,334 (3.5%) |
| $5,000 to $9,999 | 1,463 (0.6%) | 2,561 (2.1%) |
| $10,000 to $14,999 | 2,377 (1.0%) | 5,263 (4.3%) |
| $15,000 to $19,999 | 2,341 (1.0%) | 4,572 (3.7%) |
| $20,000 to $24,999 | 2,893 (1.3%) | 4,805 (3.9%) |
| $25,000 to $34,999 | 6,786 (3.0%) | 10,384 (8.5%) |
| $35,000 to $49,999 | 11,404 (5.0%) | 12,633 (10.3%) |
| $50,000 to $74,999 | 20,334 (8.9%) | 20,017 (16.4%) |
| $75,000 to $99,999 | 19,096 (8.4%) | 15,913 (13.0%) |
| $100,000 to $149,999 | 42,725 (18.7%) | 19,930 (16.3%) |
| $150,000 or more | 116,092 (50.8%) | 21,986 (18.0%) |
| Total | 228,445 (100.0%) | 122,398 (100.0%) |
Monthly Housing Cost Tiers in Bergen County
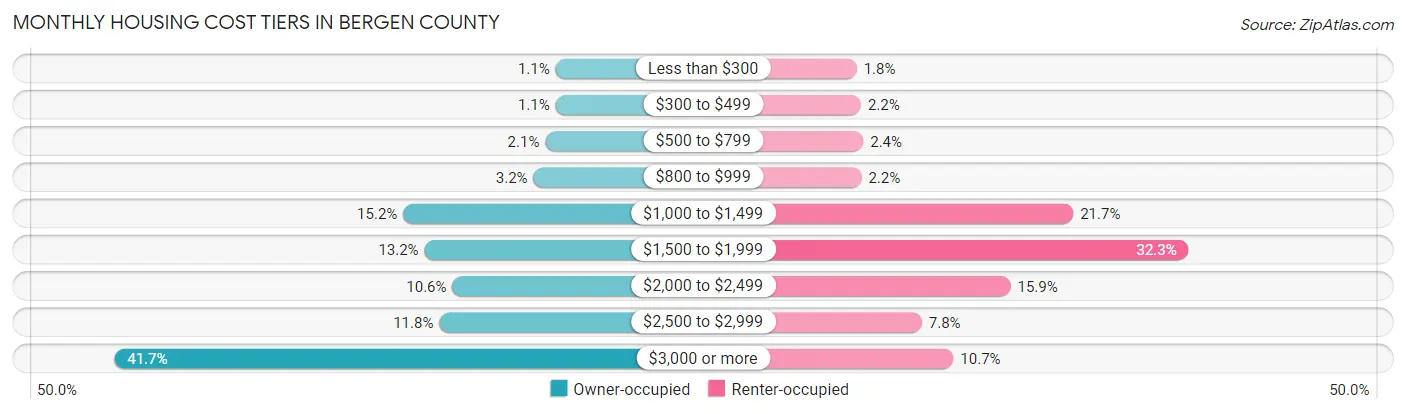
| Monthly Cost | Owner-occupied | Renter-occupied |
| Less than $300 | 2,561 (1.1%) | 2,175 (1.8%) |
| $300 to $499 | 2,555 (1.1%) | 2,654 (2.2%) |
| $500 to $799 | 4,737 (2.1%) | 2,908 (2.4%) |
| $800 to $999 | 7,217 (3.2%) | 2,721 (2.2%) |
| $1,000 to $1,499 | 34,601 (15.1%) | 26,572 (21.7%) |
| $1,500 to $1,999 | 30,136 (13.2%) | 39,557 (32.3%) |
| $2,000 to $2,499 | 24,265 (10.6%) | 19,507 (15.9%) |
| $2,500 to $2,999 | 27,031 (11.8%) | 9,509 (7.8%) |
| $3,000 or more | 95,342 (41.7%) | 13,076 (10.7%) |
| Total | 228,445 (100.0%) | 122,398 (100.0%) |
Physical Housing Characteristics in Bergen County
Housing Structures in Bergen County
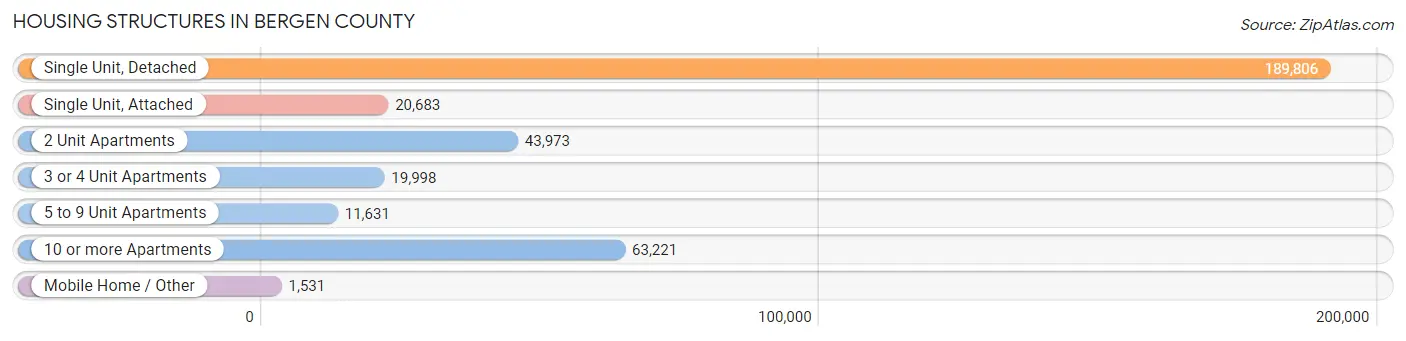
| Structure Type | # Housing Units | % Housing Units |
| Single Unit, Detached | 189,806 | 54.1% |
| Single Unit, Attached | 20,683 | 5.9% |
| 2 Unit Apartments | 43,973 | 12.5% |
| 3 or 4 Unit Apartments | 19,998 | 5.7% |
| 5 to 9 Unit Apartments | 11,631 | 3.3% |
| 10 or more Apartments | 63,221 | 18.0% |
| Mobile Home / Other | 1,531 | 0.4% |
| Total | 350,843 | 100.0% |
Housing Structures by Occupancy in Bergen County
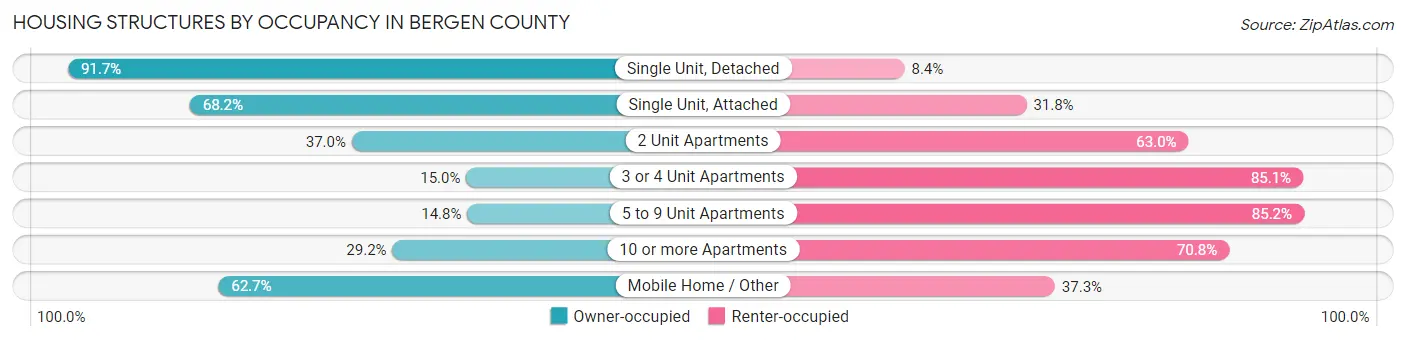
| Structure Type | Owner-occupied | Renter-occupied |
| Single Unit, Detached | 173,959 (91.6%) | 15,847 (8.4%) |
| Single Unit, Attached | 14,102 (68.2%) | 6,581 (31.8%) |
| 2 Unit Apartments | 16,269 (37.0%) | 27,704 (63.0%) |
| 3 or 4 Unit Apartments | 2,989 (14.9%) | 17,009 (85.1%) |
| 5 to 9 Unit Apartments | 1,718 (14.8%) | 9,913 (85.2%) |
| 10 or more Apartments | 18,448 (29.2%) | 44,773 (70.8%) |
| Mobile Home / Other | 960 (62.7%) | 571 (37.3%) |
| Total | 228,445 (65.1%) | 122,398 (34.9%) |
Housing Structures by Number of Rooms in Bergen County

| Number of Rooms | Owner-occupied | Renter-occupied |
| 1 Room | 1,589 (0.7%) | 7,504 (6.1%) |
| 2 or 3 Rooms | 9,483 (4.2%) | 40,102 (32.8%) |
| 4 or 5 Rooms | 43,443 (19.0%) | 53,190 (43.5%) |
| 6 or 7 Rooms | 85,468 (37.4%) | 16,264 (13.3%) |
| 8 or more Rooms | 88,462 (38.7%) | 5,338 (4.4%) |
| Total | 228,445 (100.0%) | 122,398 (100.0%) |
Housing Structure by Heating Type in Bergen County
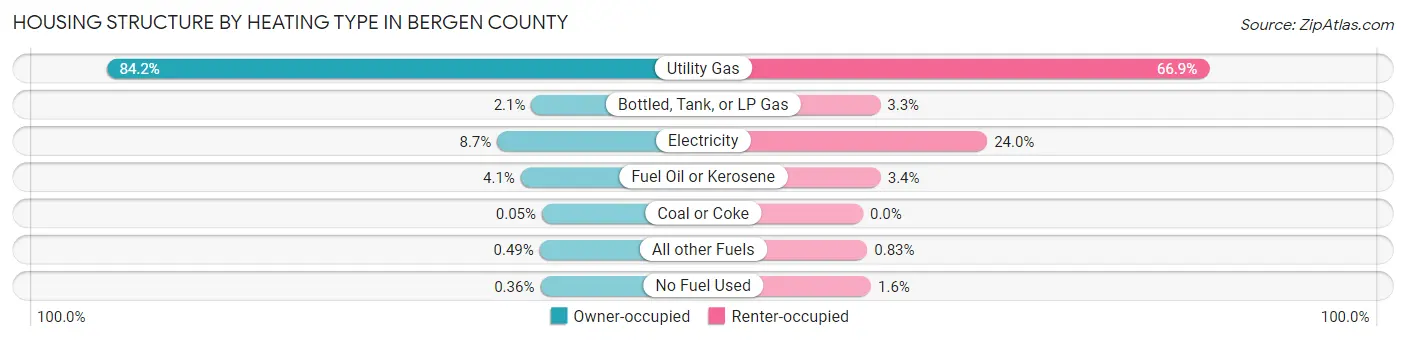
| Heating Type | Owner-occupied | Renter-occupied |
| Utility Gas | 192,295 (84.2%) | 81,825 (66.8%) |
| Bottled, Tank, or LP Gas | 4,752 (2.1%) | 4,087 (3.3%) |
| Electricity | 19,856 (8.7%) | 29,367 (24.0%) |
| Fuel Oil or Kerosene | 9,469 (4.1%) | 4,193 (3.4%) |
| Coal or Coke | 116 (0.1%) | 0 (0.0%) |
| All other Fuels | 1,125 (0.5%) | 1,022 (0.8%) |
| No Fuel Used | 832 (0.4%) | 1,904 (1.6%) |
| Total | 228,445 (100.0%) | 122,398 (100.0%) |
Household Vehicle Usage in Bergen County

| Vehicles per Household | Owner-occupied | Renter-occupied |
| No Vehicle | 7,265 (3.2%) | 20,762 (17.0%) |
| 1 Vehicle | 61,835 (27.1%) | 61,313 (50.1%) |
| 2 Vehicles | 102,771 (45.0%) | 32,605 (26.6%) |
| 3 or more Vehicles | 56,574 (24.8%) | 7,718 (6.3%) |
| Total | 228,445 (100.0%) | 122,398 (100.0%) |
Real Estate & Mortgages in Bergen County
Real Estate and Mortgage Overview in Bergen County
| Characteristic | Without Mortgage | With Mortgage |
| Housing Units | 85,414 | 143,031 |
| Median Property Value | $523,900 | $581,000 |
| Median Household Income | $112,946 | $84,696 |
| Monthly Housing Costs | $1,447 | $90,772 |
| Real Estate Taxes | $10,001 | $2,170 |
Property Value by Mortgage Status in Bergen County
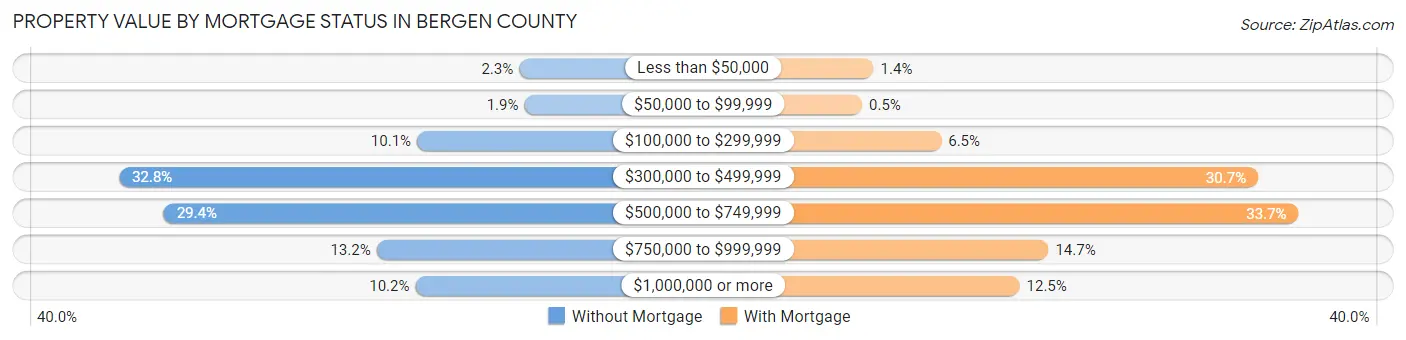
| Property Value | Without Mortgage | With Mortgage |
| Less than $50,000 | 1,992 (2.3%) | 1,971 (1.4%) |
| $50,000 to $99,999 | 1,651 (1.9%) | 718 (0.5%) |
| $100,000 to $299,999 | 8,632 (10.1%) | 9,336 (6.5%) |
| $300,000 to $499,999 | 28,027 (32.8%) | 43,850 (30.7%) |
| $500,000 to $749,999 | 25,110 (29.4%) | 48,254 (33.7%) |
| $750,000 to $999,999 | 11,262 (13.2%) | 21,026 (14.7%) |
| $1,000,000 or more | 8,740 (10.2%) | 17,876 (12.5%) |
| Total | 85,414 (100.0%) | 143,031 (100.0%) |
Household Income by Mortgage Status in Bergen County
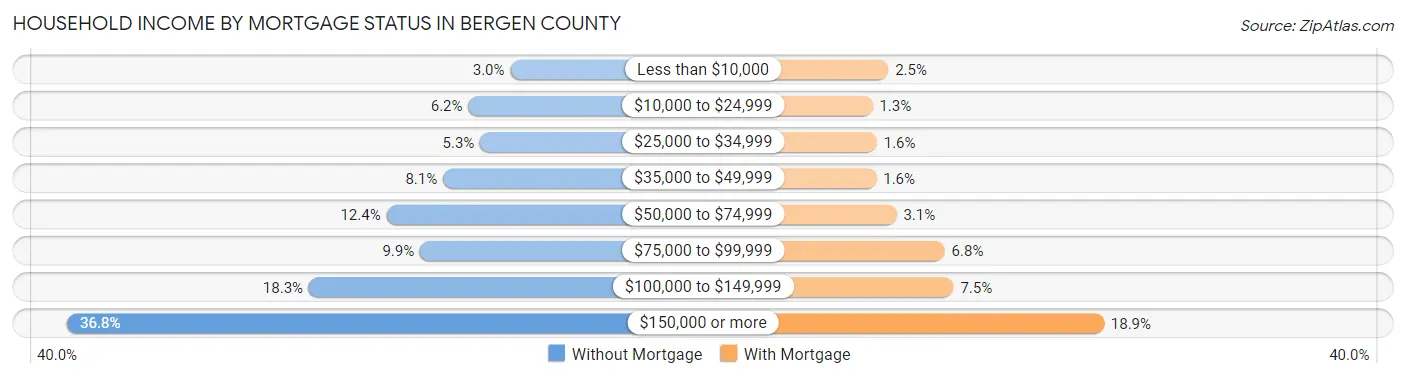
| Household Income | Without Mortgage | With Mortgage |
| Less than $10,000 | 2,552 (3.0%) | 3,565 (2.5%) |
| $10,000 to $24,999 | 5,290 (6.2%) | 1,845 (1.3%) |
| $25,000 to $34,999 | 4,520 (5.3%) | 2,321 (1.6%) |
| $35,000 to $49,999 | 6,938 (8.1%) | 2,266 (1.6%) |
| $50,000 to $74,999 | 10,617 (12.4%) | 4,466 (3.1%) |
| $75,000 to $99,999 | 8,432 (9.9%) | 9,717 (6.8%) |
| $100,000 to $149,999 | 15,669 (18.3%) | 10,664 (7.5%) |
| $150,000 or more | 31,396 (36.8%) | 27,056 (18.9%) |
| Total | 85,414 (100.0%) | 143,031 (100.0%) |
Property Value to Household Income Ratio in Bergen County
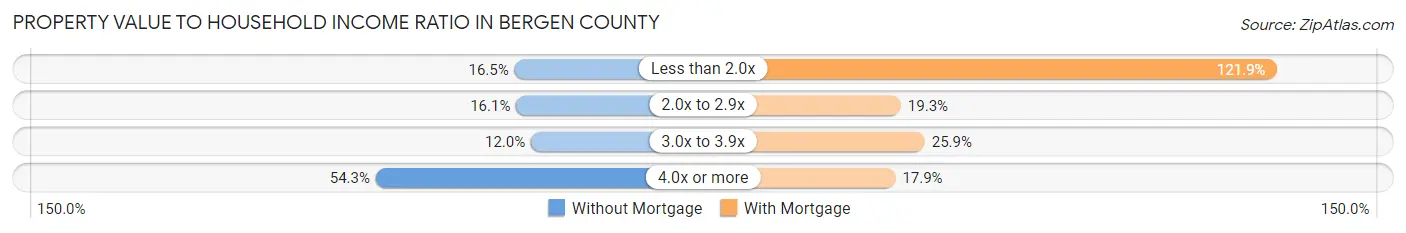
| Value-to-Income Ratio | Without Mortgage | With Mortgage |
| Less than 2.0x | 14,130 (16.5%) | 174,354 (121.9%) |
| 2.0x to 2.9x | 13,724 (16.1%) | 27,656 (19.3%) |
| 3.0x to 3.9x | 10,279 (12.0%) | 36,974 (25.9%) |
| 4.0x or more | 46,398 (54.3%) | 25,529 (17.8%) |
| Total | 85,414 (100.0%) | 143,031 (100.0%) |
Real Estate Taxes by Mortgage Status in Bergen County
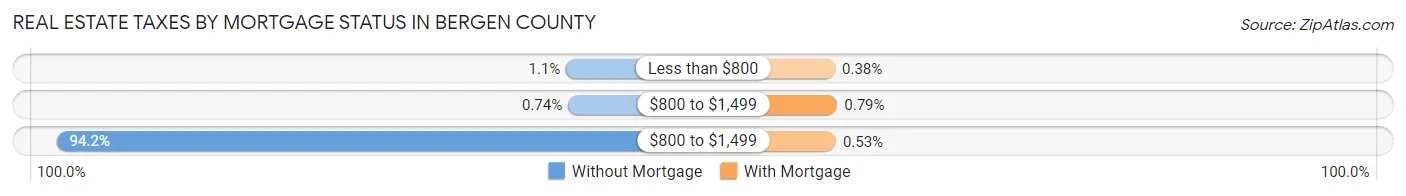
| Property Taxes | Without Mortgage | With Mortgage |
| Less than $800 | 922 (1.1%) | 543 (0.4%) |
| $800 to $1,499 | 631 (0.7%) | 1,132 (0.8%) |
| $800 to $1,499 | 80,427 (94.2%) | 758 (0.5%) |
| Total | 85,414 (100.0%) | 143,031 (100.0%) |
Health & Disability in Bergen County
Health Insurance Coverage by Age in Bergen County
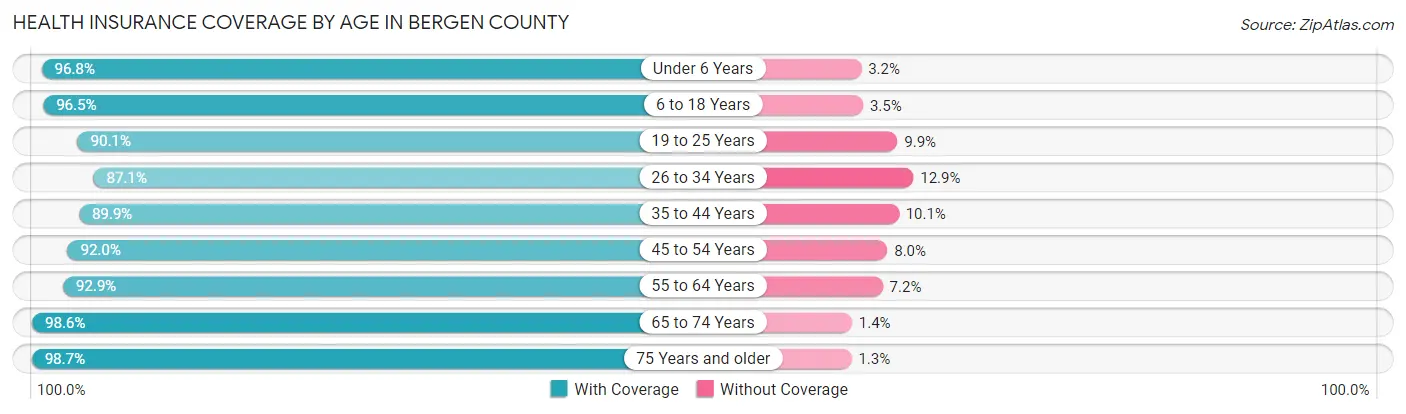
| Age Bracket | With Coverage | Without Coverage |
| Under 6 Years | 56,419 (96.8%) | 1,843 (3.2%) |
| 6 to 18 Years | 149,066 (96.5%) | 5,381 (3.5%) |
| 19 to 25 Years | 68,763 (90.1%) | 7,547 (9.9%) |
| 26 to 34 Years | 85,135 (87.1%) | 12,577 (12.9%) |
| 35 to 44 Years | 114,355 (89.9%) | 12,908 (10.1%) |
| 45 to 54 Years | 123,961 (92.0%) | 10,807 (8.0%) |
| 55 to 64 Years | 125,580 (92.8%) | 9,666 (7.1%) |
| 65 to 74 Years | 91,606 (98.6%) | 1,308 (1.4%) |
| 75 Years and older | 69,699 (98.7%) | 947 (1.3%) |
| Total | 884,584 (93.3%) | 62,984 (6.7%) |
Health Insurance Coverage by Citizenship Status in Bergen County

| Citizenship Status | With Coverage | Without Coverage |
| Native Born | 56,419 (96.8%) | 1,843 (3.2%) |
| Foreign Born, Citizen | 149,066 (96.5%) | 5,381 (3.5%) |
| Foreign Born, not a Citizen | 68,763 (90.1%) | 7,547 (9.9%) |
Health Insurance Coverage by Household Income in Bergen County
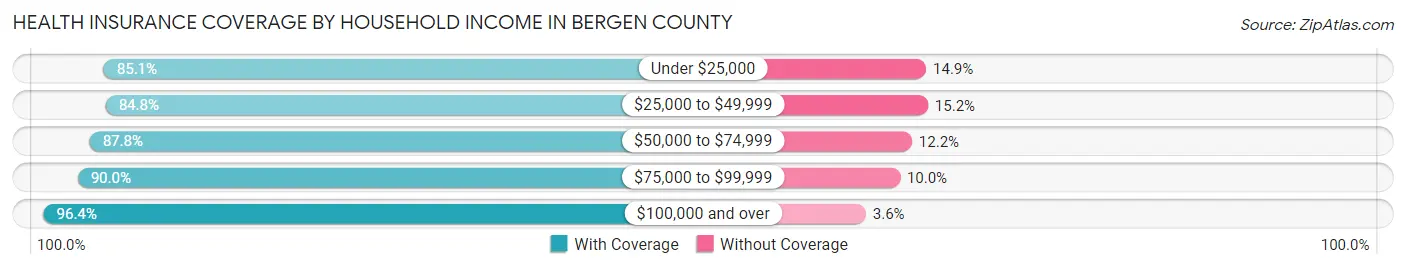
| Household Income | With Coverage | Without Coverage |
| Under $25,000 | 48,712 (85.1%) | 8,500 (14.9%) |
| $25,000 to $49,999 | 68,715 (84.8%) | 12,321 (15.2%) |
| $50,000 to $74,999 | 77,422 (87.8%) | 10,755 (12.2%) |
| $75,000 to $99,999 | 76,259 (90.0%) | 8,440 (10.0%) |
| $100,000 and over | 608,689 (96.4%) | 22,529 (3.6%) |
Public vs Private Health Insurance Coverage by Age in Bergen County
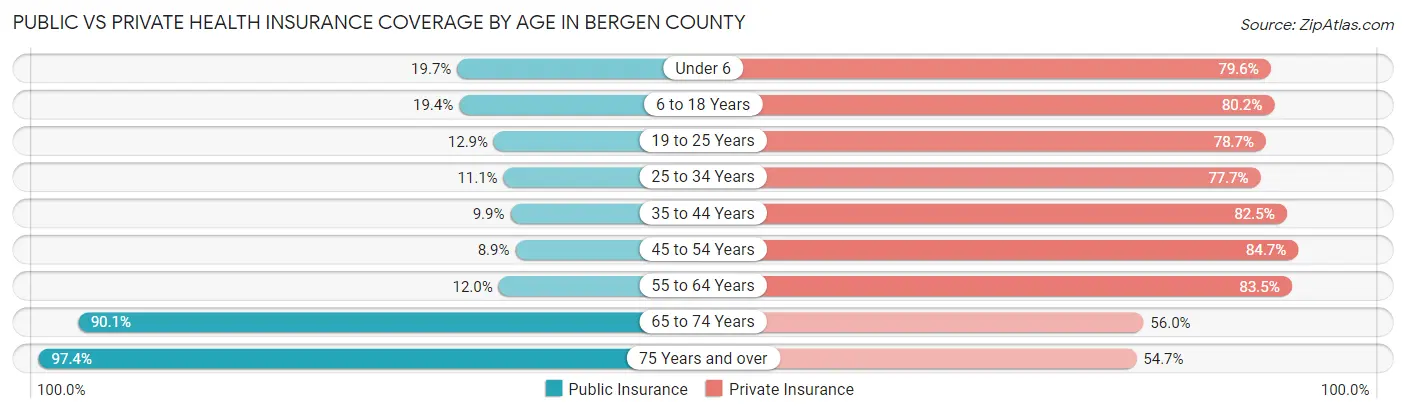
| Age Bracket | Public Insurance | Private Insurance |
| Under 6 | 11,483 (19.7%) | 46,363 (79.6%) |
| 6 to 18 Years | 29,907 (19.4%) | 123,883 (80.2%) |
| 19 to 25 Years | 9,841 (12.9%) | 60,055 (78.7%) |
| 25 to 34 Years | 10,868 (11.1%) | 75,918 (77.7%) |
| 35 to 44 Years | 12,535 (9.9%) | 105,024 (82.5%) |
| 45 to 54 Years | 12,015 (8.9%) | 114,132 (84.7%) |
| 55 to 64 Years | 16,273 (12.0%) | 112,891 (83.5%) |
| 65 to 74 Years | 83,757 (90.1%) | 52,012 (56.0%) |
| 75 Years and over | 68,802 (97.4%) | 38,628 (54.7%) |
| Total | 255,481 (27.0%) | 728,906 (76.9%) |
Disability Status by Sex by Age in Bergen County

| Age Bracket | Male | Female |
| Under 5 Years | 92 (0.4%) | 110 (0.5%) |
| 5 to 17 Years | 2,892 (3.7%) | 1,452 (2.0%) |
| 18 to 34 Years | 4,299 (4.5%) | 3,652 (4.0%) |
| 35 to 64 Years | 11,293 (5.8%) | 12,290 (6.1%) |
| 65 to 74 Years | 6,575 (15.0%) | 7,695 (15.7%) |
| 75 Years and over | 10,614 (37.3%) | 17,738 (42.0%) |
Disability Class by Sex by Age in Bergen County
Disability Class: Hearing Difficulty
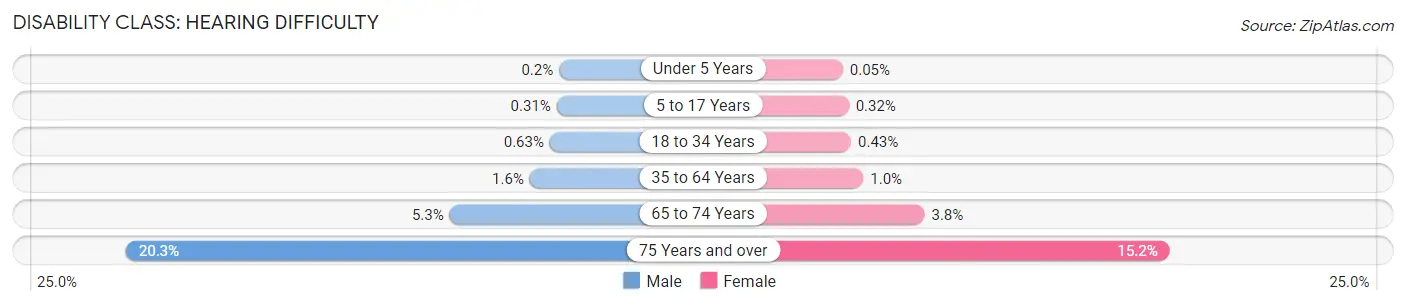
| Age Bracket | Male | Female |
| Under 5 Years | 49 (0.2%) | 13 (0.1%) |
| 5 to 17 Years | 237 (0.3%) | 238 (0.3%) |
| 18 to 34 Years | 595 (0.6%) | 397 (0.4%) |
| 35 to 64 Years | 3,045 (1.6%) | 2,017 (1.0%) |
| 65 to 74 Years | 2,311 (5.3%) | 1,886 (3.8%) |
| 75 Years and over | 5,775 (20.3%) | 6,417 (15.2%) |
Disability Class: Vision Difficulty
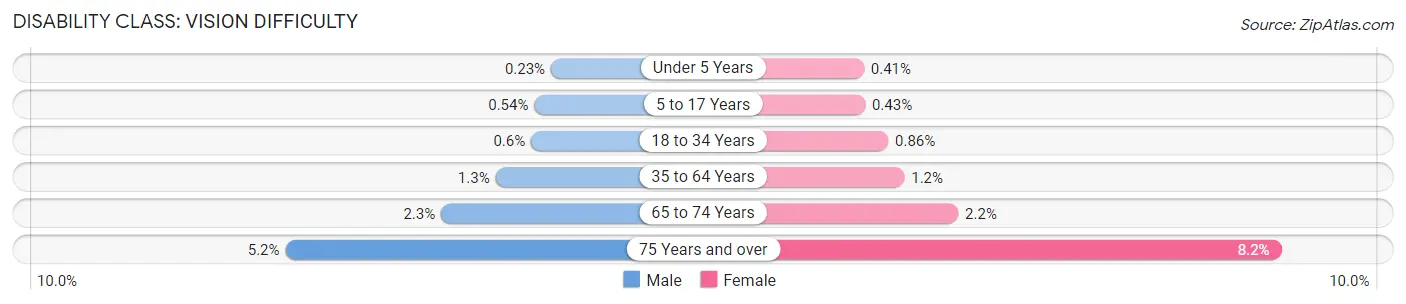
| Age Bracket | Male | Female |
| Under 5 Years | 58 (0.2%) | 97 (0.4%) |
| 5 to 17 Years | 419 (0.5%) | 321 (0.4%) |
| 18 to 34 Years | 569 (0.6%) | 791 (0.9%) |
| 35 to 64 Years | 2,476 (1.3%) | 2,336 (1.2%) |
| 65 to 74 Years | 995 (2.3%) | 1,061 (2.2%) |
| 75 Years and over | 1,469 (5.2%) | 3,445 (8.2%) |
Disability Class: Cognitive Difficulty
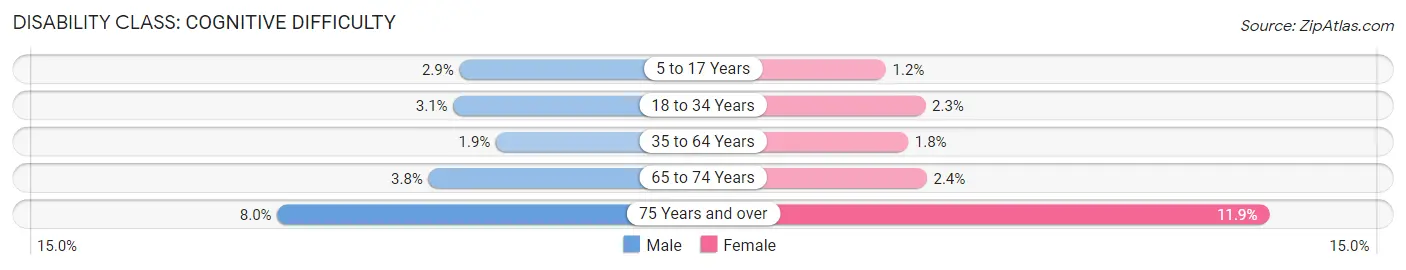
| Age Bracket | Male | Female |
| 5 to 17 Years | 2,240 (2.9%) | 904 (1.2%) |
| 18 to 34 Years | 2,899 (3.1%) | 2,143 (2.3%) |
| 35 to 64 Years | 3,667 (1.9%) | 3,707 (1.8%) |
| 65 to 74 Years | 1,639 (3.7%) | 1,161 (2.4%) |
| 75 Years and over | 2,265 (8.0%) | 5,022 (11.9%) |
Disability Class: Ambulatory Difficulty
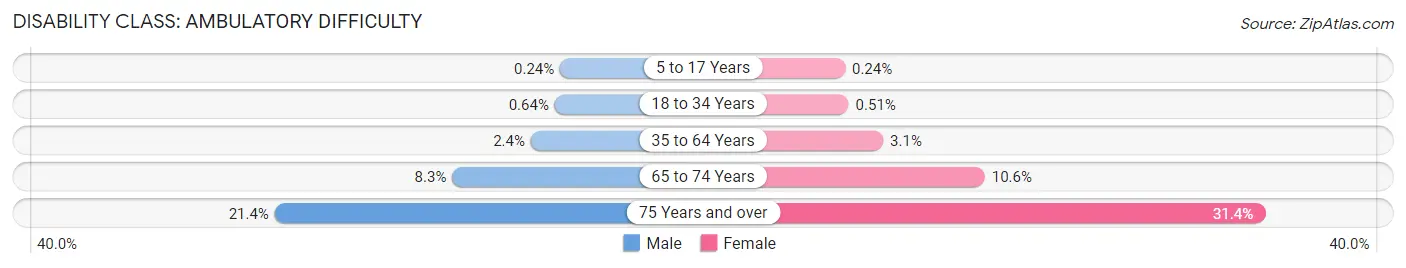
| Age Bracket | Male | Female |
| 5 to 17 Years | 187 (0.2%) | 175 (0.2%) |
| 18 to 34 Years | 605 (0.6%) | 471 (0.5%) |
| 35 to 64 Years | 4,735 (2.4%) | 6,197 (3.1%) |
| 65 to 74 Years | 3,607 (8.3%) | 5,220 (10.6%) |
| 75 Years and over | 6,096 (21.4%) | 13,259 (31.4%) |
Disability Class: Self-Care Difficulty
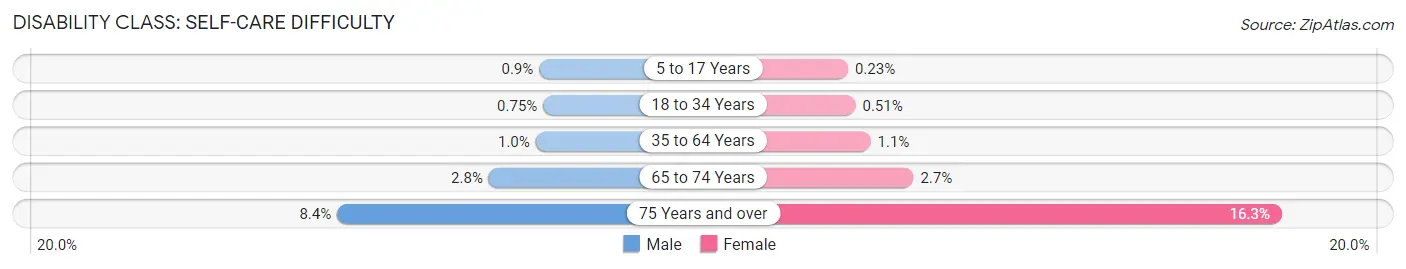
| Age Bracket | Male | Female |
| 5 to 17 Years | 694 (0.9%) | 172 (0.2%) |
| 18 to 34 Years | 707 (0.7%) | 469 (0.5%) |
| 35 to 64 Years | 2,014 (1.0%) | 2,158 (1.1%) |
| 65 to 74 Years | 1,213 (2.8%) | 1,308 (2.7%) |
| 75 Years and over | 2,388 (8.4%) | 6,892 (16.3%) |
Technology Access in Bergen County
Computing Device Access in Bergen County
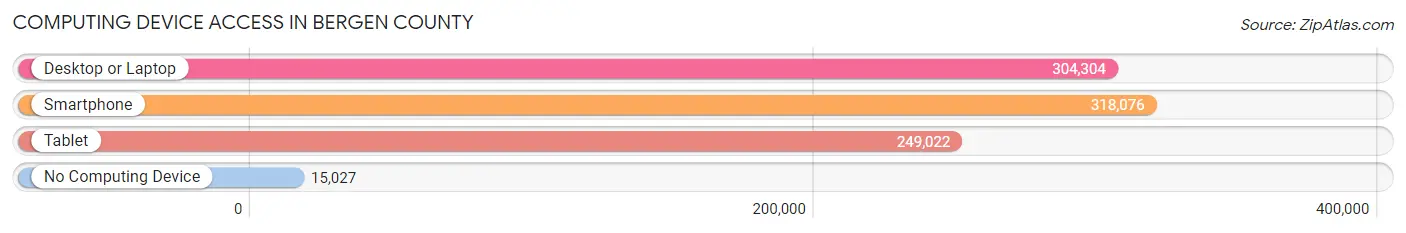
| Device Type | # Households | % Households |
| Desktop or Laptop | 304,304 | 86.7% |
| Smartphone | 318,076 | 90.7% |
| Tablet | 249,022 | 71.0% |
| No Computing Device | 15,027 | 4.3% |
| Total | 350,843 | 100.0% |
Internet Access in Bergen County
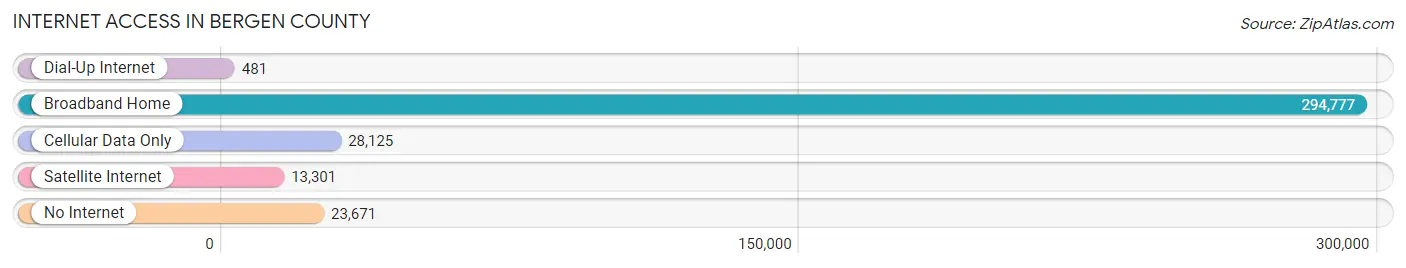
| Internet Type | # Households | % Households |
| Dial-Up Internet | 481 | 0.1% |
| Broadband Home | 294,777 | 84.0% |
| Cellular Data Only | 28,125 | 8.0% |
| Satellite Internet | 13,301 | 3.8% |
| No Internet | 23,671 | 6.8% |
| Total | 350,843 | 100.0% |
Bergen County Summary
Bergen County, New Jersey is located in the northeastern part of the state and is the most populous county in the state. It is bordered by Hudson County to the east, Passaic County to the south, and Rockland County, New York to the north. The county seat is Hackensack, and the county is home to over 900,000 people.
History
Bergen County was established in 1683 as one of the four original counties of New Jersey. It was named after the city of Bergen in Norway, which was the home of the first settlers in the area. The county was originally part of the Province of East Jersey, and was divided into four townships: Hackensack, Bergen, Acquackanonk, and New Barbadoes.
In the late 1700s, the county was divided into seven townships: Hackensack, Bergen, Acquackanonk, New Barbadoes, Saddle River, Franklin, and Lodi. During the Revolutionary War, Bergen County was a major center of activity, and was the site of several battles.
Geography
Bergen County covers an area of 247 square miles, and is located in the northeastern part of New Jersey. The county is bordered by Hudson County to the east, Passaic County to the south, and Rockland County, New York to the north. The county is home to the Palisades Interstate Park, which runs along the Hudson River. The county is also home to several rivers, including the Hackensack, Saddle, and Passaic Rivers.
The county is divided into 70 municipalities, including the cities of Hackensack, Englewood, and Teaneck. The county is also home to several unincorporated communities, including Allendale, Bergenfield, and Paramus.
Economy
Bergen County has a diverse economy, with a mix of manufacturing, retail, and service industries. The county is home to several major corporations, including Panasonic, Unilever, and Toys R Us. The county is also home to several major shopping malls, including the Garden State Plaza and the Bergen Town Center.
The county is home to several major universities, including Fairleigh Dickinson University, Ramapo College, and Bergen Community College. The county is also home to several major hospitals, including Hackensack University Medical Center and Englewood Hospital and Medical Center.
Demographics
As of the 2010 census, Bergen County had a population of 905,116. The racial makeup of the county was 73.3% White, 11.3% African American, 0.3% Native American, 8.7% Asian, and 4.4% from other races. The county is home to a large Hispanic population, with 24.3% of the population identifying as Hispanic or Latino.
The median household income in the county was $87,837, and the median family income was $103,817. The per capita income in the county was $41,845. The county is home to a large number of immigrants, with over 20% of the population born outside of the United States.
Bergen County is a diverse and vibrant county, with a rich history and a strong economy. The county is home to a large and diverse population, and is a major center of activity in the state of New Jersey.
Common Questions
What is the Total Population of Bergen County?
Total Population of Bergen County is 953,243.
What is the Total Male Population of Bergen County?
Total Male Population of Bergen County is 467,592.
What is the Total Female Population of Bergen County?
Total Female Population of Bergen County is 485,651.
What is the Ratio of Males per 100 Females in Bergen County?
There are 96.28 Males per 100 Females in Bergen County.
What is the Ratio of Females per 100 Males in Bergen County?
There are 103.86 Females per 100 Males in Bergen County.
What is the Median Population Age in Bergen County?
Median Population Age in Bergen County is 42.0 Years.
What is the Average Family Size in Bergen County
Average Family Size in Bergen County is 3.2 People.
What is the Average Household Size in Bergen County
Average Household Size in Bergen County is 2.7 People.
What is Per Capita Income in Bergen County?
Per Capita income in Bergen County is $60,222.
What is the Median Family Income in Bergen County?
Median Family Income in Bergen County is $144,348.
What is the Median Household income in Bergen County?
Median Household Income in Bergen County is $118,714.
What is Income or Wage Gap in Bergen County?
Income or Wage Gap in Bergen County is 29.9%.
Women in Bergen County earn 70.1 cents for every dollar earned by a man.
What is Family Income Deficit in Bergen County?
Family Income Deficit in Bergen County is $10,761.
Families that are below poverty line in Bergen County earn $10,761 less on average than the poverty threshold level.
What is Inequality or Gini Index in Bergen County?
Inequality or Gini Index in Bergen County is 0.47.
How Large is the Labor Force in Bergen County?
There are 520,852 People in the Labor Forcein in Bergen County.
What is the Percentage of People in the Labor Force in Bergen County?
66.9% of People are in the Labor Force in Bergen County.
What is the Unemployment Rate in Bergen County?
Unemployment Rate in Bergen County is 5.5%.