Stanfield, NC
Stanfield Map
Stanfield Overview
1,463
TOTAL POPULATION
764
MALE POPULATION
699
FEMALE POPULATION
109.30
MALES / 100 FEMALES
91.49
FEMALES / 100 MALES
38.0
MEDIAN AGE
3.0
AVG FAMILY SIZE
2.5
AVG HOUSEHOLD SIZE
$39,027
PER CAPITA INCOME
$104,018
AVG FAMILY INCOME
$79,946
AVG HOUSEHOLD INCOME
36.7%
WAGE / INCOME GAP [ % ]
63.3¢/ $1
WAGE / INCOME GAP [ $ ]
0.44
INEQUALITY / GINI INDEX
820
LABOR FORCE [ PEOPLE ]
72.6%
PERCENT IN LABOR FORCE
9.1%
UNEMPLOYMENT RATE
Stanfield Zip Codes
Stanfield Area Codes
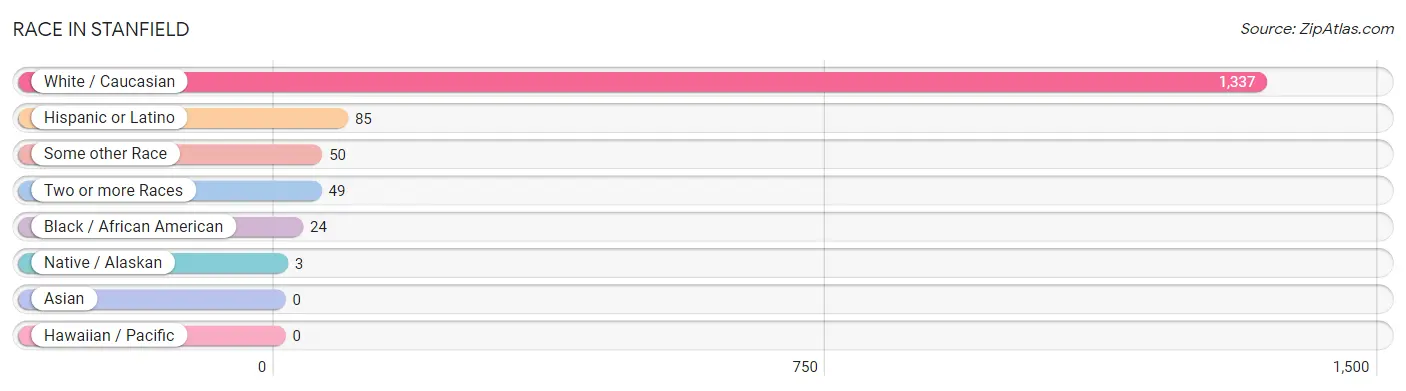
Race in Stanfield
The most populous races in Stanfield are White / Caucasian (1,337 | 91.4%), Hispanic or Latino (85 | 5.8%), and Some other Race (50 | 3.4%).
| Race | # Population | % Population |
| Asian | 0 | 0.0% |
| Black / African American | 24 | 1.6% |
| Hawaiian / Pacific | 0 | 0.0% |
| Hispanic or Latino | 85 | 5.8% |
| Native / Alaskan | 3 | 0.2% |
| White / Caucasian | 1,337 | 91.4% |
| Two or more Races | 49 | 3.4% |
| Some other Race | 50 | 3.4% |
| Total | 1,463 | 100.0% |
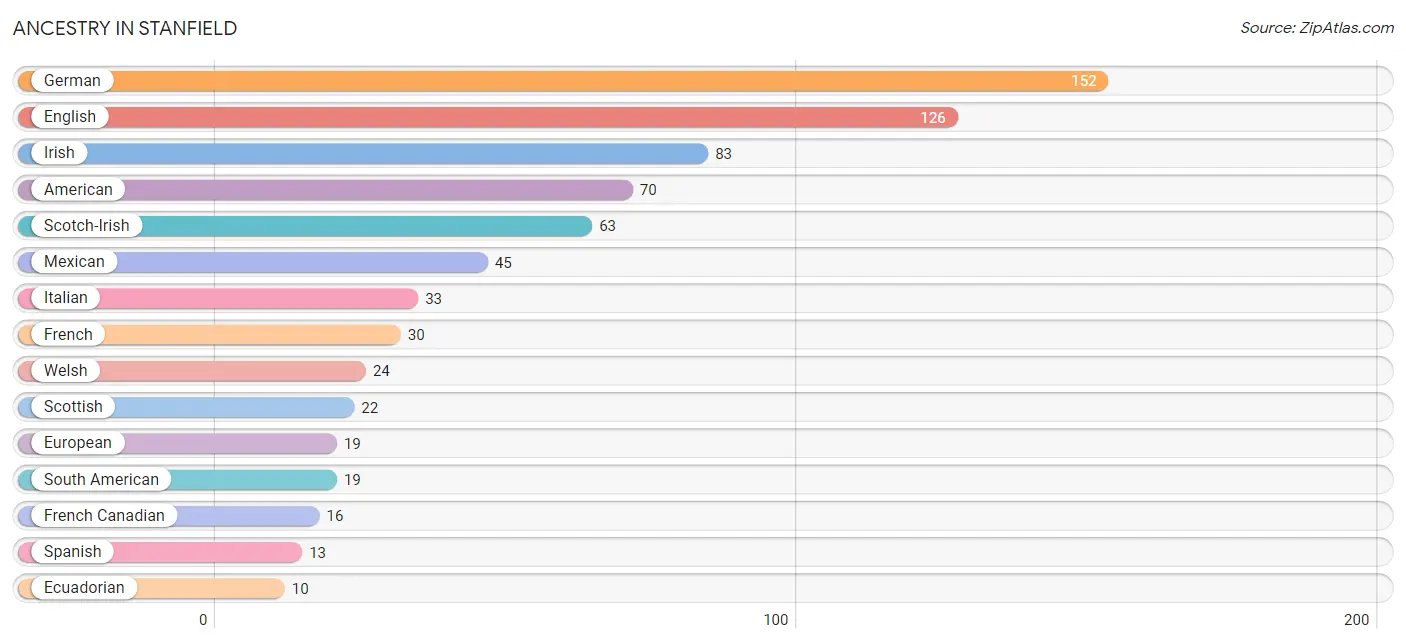
Ancestry in Stanfield
The most populous ancestries reported in Stanfield are German (152 | 10.4%), English (126 | 8.6%), Irish (83 | 5.7%), American (70 | 4.8%), and Scotch-Irish (63 | 4.3%), together accounting for 33.8% of all Stanfield residents.
| Ancestry | # Population | % Population |
| Alaskan Athabascan | 2 | 0.1% |
| American | 70 | 4.8% |
| British | 8 | 0.5% |
| Canadian | 2 | 0.1% |
| Central American | 5 | 0.3% |
| Cherokee | 1 | 0.1% |
| Chilean | 9 | 0.6% |
| Costa Rican | 5 | 0.3% |
| Czechoslovakian | 9 | 0.6% |
| Dutch | 3 | 0.2% |
| Ecuadorian | 10 | 0.7% |
| English | 126 | 8.6% |
| European | 19 | 1.3% |
| French | 30 | 2.1% |
| French Canadian | 16 | 1.1% |
| German | 152 | 10.4% |
| Greek | 6 | 0.4% |
| Irish | 83 | 5.7% |
| Iroquois | 5 | 0.3% |
| Italian | 33 | 2.3% |
| Lumbee | 1 | 0.1% |
| Mexican | 45 | 3.1% |
| Pennsylvania German | 2 | 0.1% |
| Polish | 9 | 0.6% |
| Puerto Rican | 3 | 0.2% |
| Scotch-Irish | 63 | 4.3% |
| Scottish | 22 | 1.5% |
| Slavic | 6 | 0.4% |
| Slovak | 3 | 0.2% |
| South American | 19 | 1.3% |
| Spanish | 13 | 0.9% |
| Swedish | 5 | 0.3% |
| Swiss | 2 | 0.1% |
| Turkish | 3 | 0.2% |
| Welsh | 24 | 1.6% | View All 35 Rows |
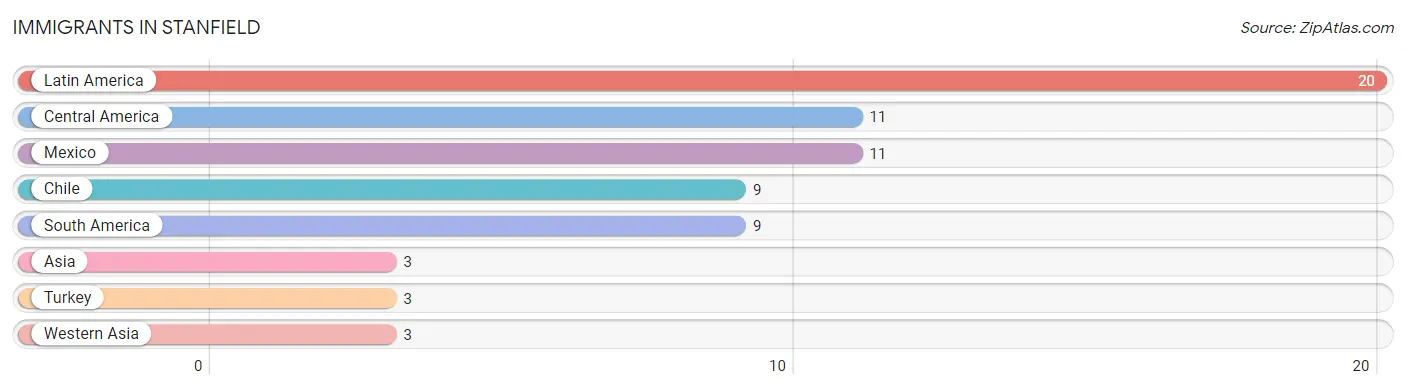
Immigrants in Stanfield
The most numerous immigrant groups reported in Stanfield came from Latin America (20 | 1.4%), Central America (11 | 0.7%), Mexico (11 | 0.7%), Chile (9 | 0.6%), and South America (9 | 0.6%), together accounting for 4.1% of all Stanfield residents.
| Immigration Origin | # Population | % Population |
| Asia | 3 | 0.2% |
| Central America | 11 | 0.7% |
| Chile | 9 | 0.6% |
| Latin America | 20 | 1.4% |
| Mexico | 11 | 0.7% |
| South America | 9 | 0.6% |
| Turkey | 3 | 0.2% |
| Western Asia | 3 | 0.2% | View All 8 Rows |
Sex and Age in Stanfield
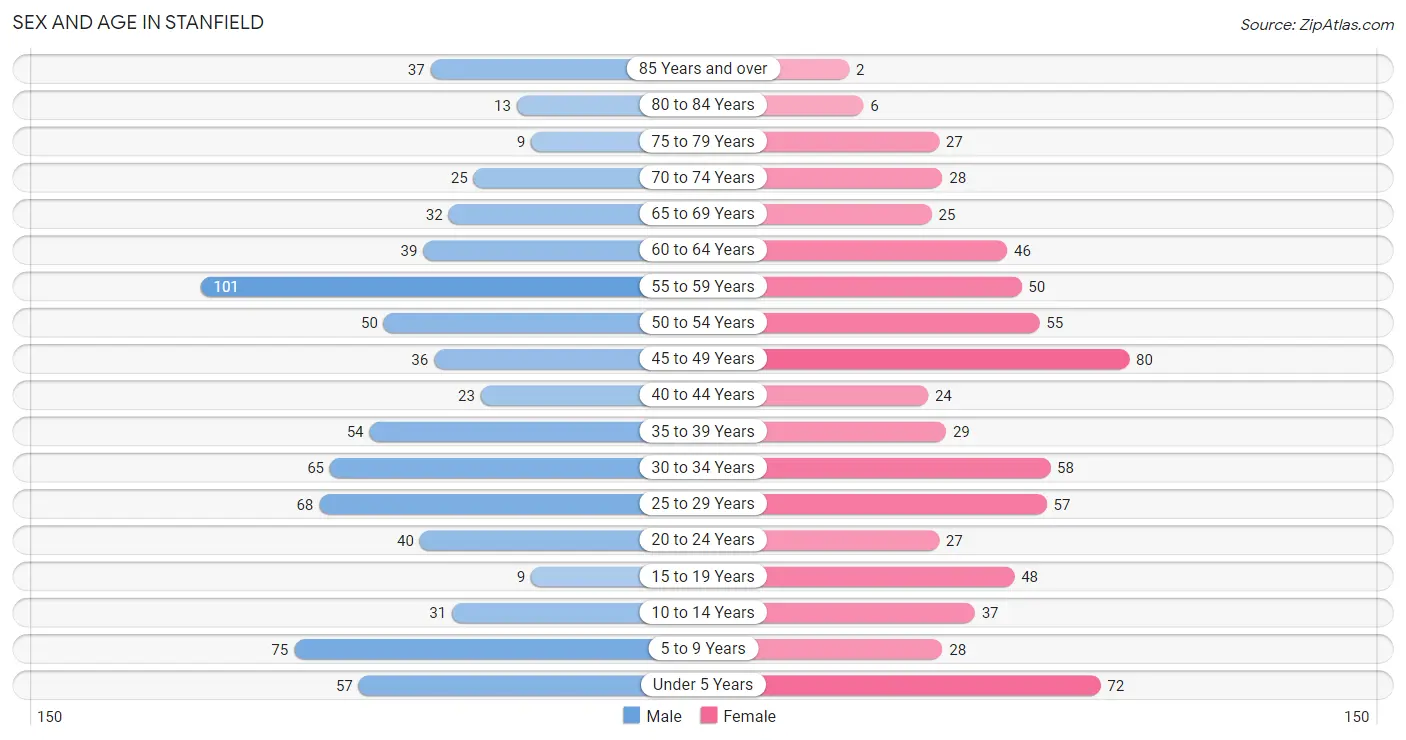
Sex and Age in Stanfield
The most populous age groups in Stanfield are 55 to 59 Years (101 | 13.2%) for men and 45 to 49 Years (80 | 11.4%) for women.
| Age Bracket | Male | Female |
| Under 5 Years | 57 (7.5%) | 72 (10.3%) |
| 5 to 9 Years | 75 (9.8%) | 28 (4.0%) |
| 10 to 14 Years | 31 (4.1%) | 37 (5.3%) |
| 15 to 19 Years | 9 (1.2%) | 48 (6.9%) |
| 20 to 24 Years | 40 (5.2%) | 27 (3.9%) |
| 25 to 29 Years | 68 (8.9%) | 57 (8.2%) |
| 30 to 34 Years | 65 (8.5%) | 58 (8.3%) |
| 35 to 39 Years | 54 (7.1%) | 29 (4.2%) |
| 40 to 44 Years | 23 (3.0%) | 24 (3.4%) |
| 45 to 49 Years | 36 (4.7%) | 80 (11.4%) |
| 50 to 54 Years | 50 (6.5%) | 55 (7.9%) |
| 55 to 59 Years | 101 (13.2%) | 50 (7.1%) |
| 60 to 64 Years | 39 (5.1%) | 46 (6.6%) |
| 65 to 69 Years | 32 (4.2%) | 25 (3.6%) |
| 70 to 74 Years | 25 (3.3%) | 28 (4.0%) |
| 75 to 79 Years | 9 (1.2%) | 27 (3.9%) |
| 80 to 84 Years | 13 (1.7%) | 6 (0.9%) |
| 85 Years and over | 37 (4.8%) | 2 (0.3%) |
| Total | 764 (100.0%) | 699 (100.0%) |
Families and Households in Stanfield
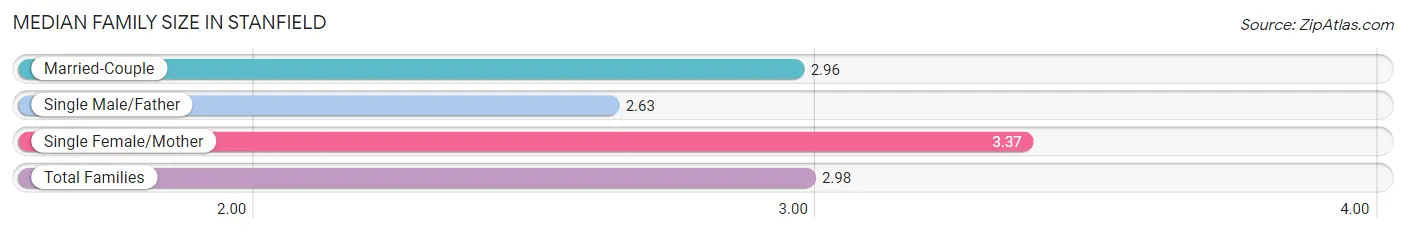
Median Family Size in Stanfield
The median family size in Stanfield is 2.98 persons per family, with single female/mother families (46 | 11.8%) accounting for the largest median family size of 3.37 persons per family. On the other hand, single male/father families (40 | 10.2%) represent the smallest median family size with 2.63 persons per family.
| Family Type | # Families | Family Size |
| Married-Couple | 305 (78.0%) | 2.96 |
| Single Male/Father | 40 (10.2%) | 2.63 |
| Single Female/Mother | 46 (11.8%) | 3.37 |
| Total Families | 391 (100.0%) | 2.98 |
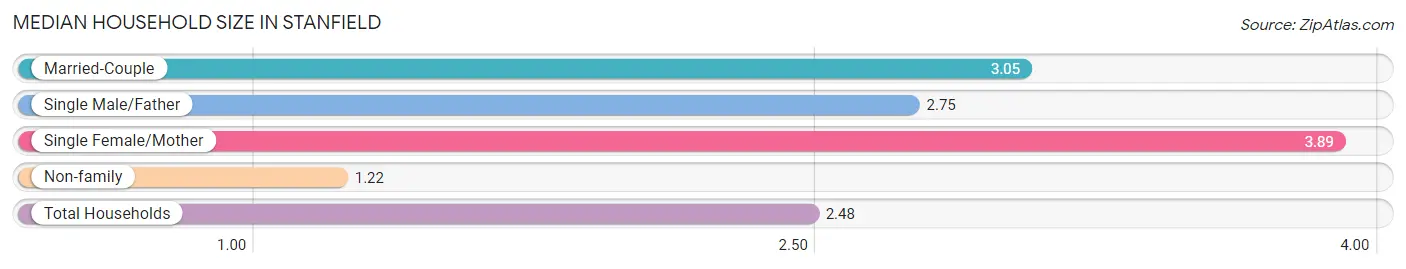
Median Household Size in Stanfield
The median household size in Stanfield is 2.48 persons per household, with single female/mother households (46 | 7.8%) accounting for the largest median household size of 3.89 persons per household. non-family households (200 | 33.8%) represent the smallest median household size with 1.22 persons per household.
| Household Type | # Households | Household Size |
| Married-Couple | 305 (51.6%) | 3.05 |
| Single Male/Father | 40 (6.8%) | 2.75 |
| Single Female/Mother | 46 (7.8%) | 3.89 |
| Non-family | 200 (33.8%) | 1.22 |
| Total Households | 591 (100.0%) | 2.48 |
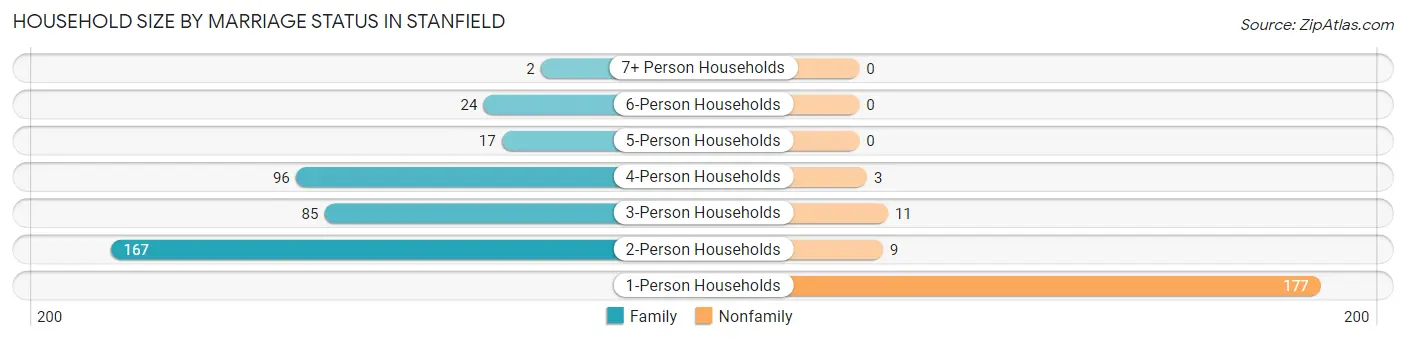
Household Size by Marriage Status in Stanfield
Out of a total of 591 households in Stanfield, 391 (66.2%) are family households, while 200 (33.8%) are nonfamily households. The most numerous type of family households are 2-person households, comprising 167, and the most common type of nonfamily households are 1-person households, comprising 177.
| Household Size | Family Households | Nonfamily Households |
| 1-Person Households | - | 177 (29.9%) |
| 2-Person Households | 167 (28.3%) | 9 (1.5%) |
| 3-Person Households | 85 (14.4%) | 11 (1.9%) |
| 4-Person Households | 96 (16.2%) | 3 (0.5%) |
| 5-Person Households | 17 (2.9%) | 0 (0.0%) |
| 6-Person Households | 24 (4.1%) | 0 (0.0%) |
| 7+ Person Households | 2 (0.3%) | 0 (0.0%) |
| Total | 391 (66.2%) | 200 (33.8%) |
Female Fertility in Stanfield
Fertility by Age in Stanfield
Average fertility rate in Stanfield is 31.0 births per 1,000 women. Women in the age bracket of 35 to 50 years have the highest fertility rate with 74.0 births per 1,000 women. Women in the age bracket of 35 to 50 years acount for 100.0% of all women with births.
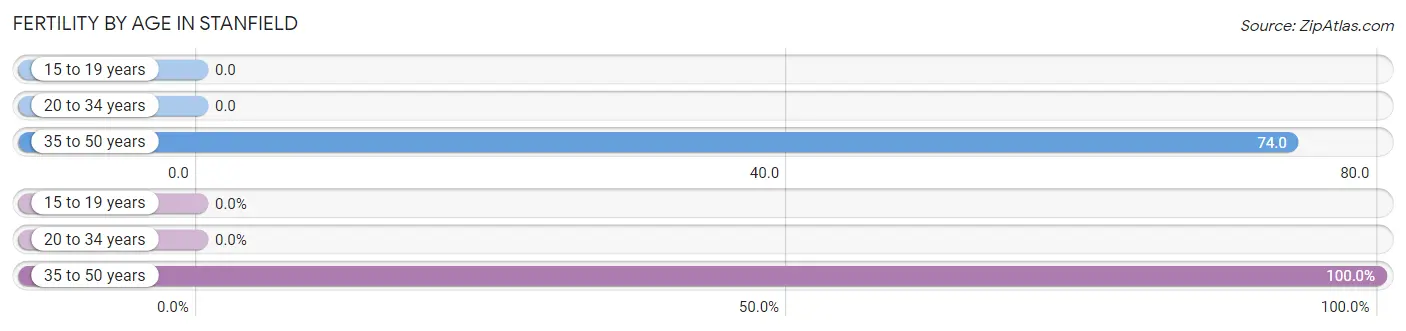
| Age Bracket | Women with Births | Births / 1,000 Women |
| 15 to 19 years | 0 (0.0%) | 0.0 |
| 20 to 34 years | 0 (0.0%) | 0.0 |
| 35 to 50 years | 10 (100.0%) | 74.0 |
| Total | 10 (100.0%) | 31.0 |
Fertility by Age by Marriage Status in Stanfield
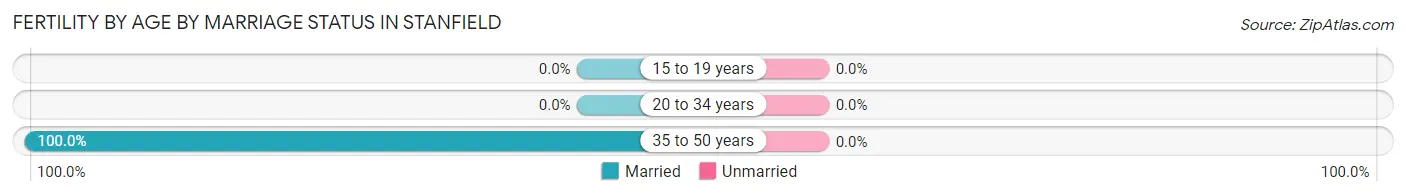
| Age Bracket | Married | Unmarried |
| 15 to 19 years | 0 (0.0%) | 0 (0.0%) |
| 20 to 34 years | 0 (0.0%) | 0 (0.0%) |
| 35 to 50 years | 10 (100.0%) | 0 (0.0%) |
| Total | 10 (100.0%) | 0 (0.0%) |
Fertility by Education in Stanfield
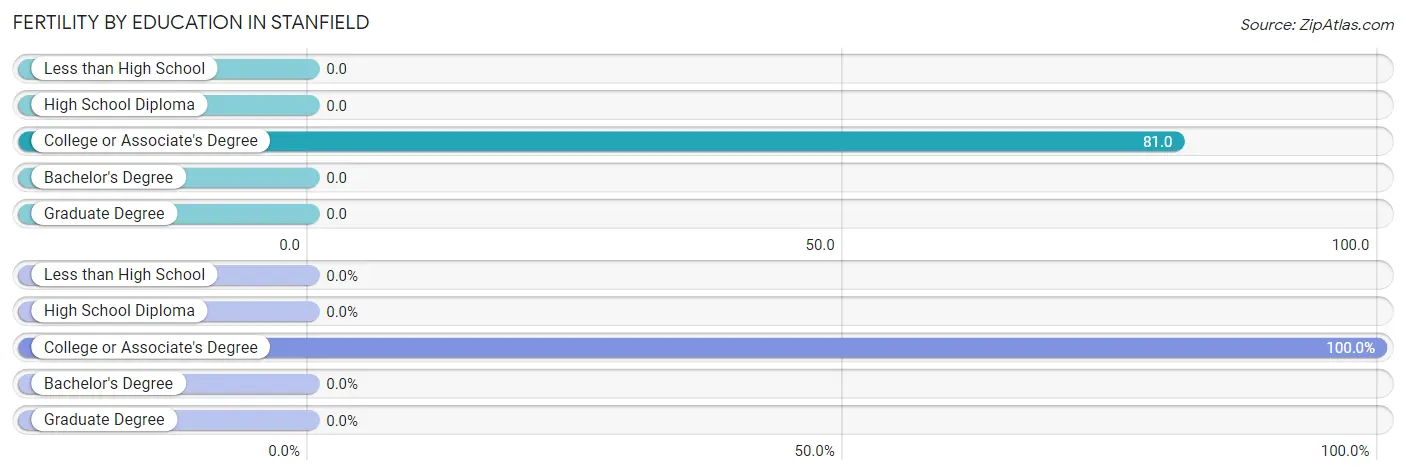
| Educational Attainment | Women with Births | Births / 1,000 Women |
| Less than High School | 0 (0.0%) | 0.0 |
| High School Diploma | 0 (0.0%) | 0.0 |
| College or Associate's Degree | 10 (100.0%) | 81.0 |
| Bachelor's Degree | 0 (0.0%) | 0.0 |
| Graduate Degree | 0 (0.0%) | 0.0 |
| Total | 10 (100.0%) | 31.0 |
Fertility by Education by Marriage Status in Stanfield
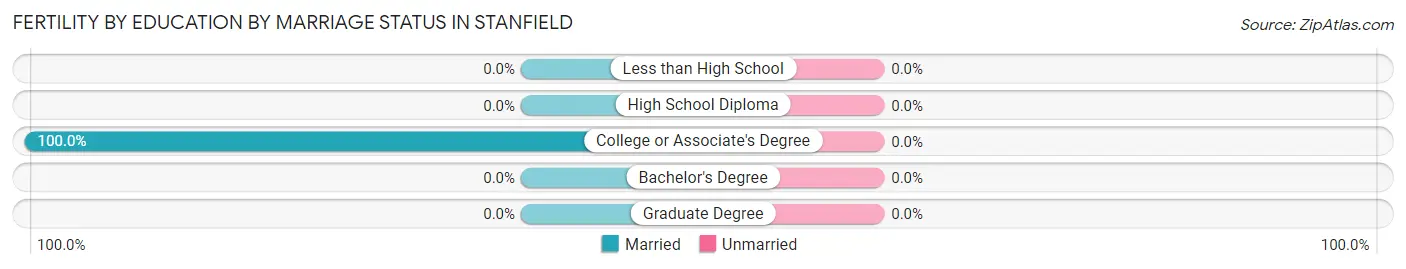
| Educational Attainment | Married | Unmarried |
| Less than High School | 0 (0.0%) | 0 (0.0%) |
| High School Diploma | 0 (0.0%) | 0 (0.0%) |
| College or Associate's Degree | 10 (100.0%) | 0 (0.0%) |
| Bachelor's Degree | 0 (0.0%) | 0 (0.0%) |
| Graduate Degree | 0 (0.0%) | 0 (0.0%) |
| Total | 10 (100.0%) | 0 (0.0%) |
Income in Stanfield
Income Overview in Stanfield
Per Capita Income in Stanfield is $39,027, while median incomes of families and households are $104,018 and $79,946 respectively.
| Characteristic | Number | Measure |
| Per Capita Income | 1,463 | $39,027 |
| Median Family Income | 391 | $104,018 |
| Mean Family Income | 391 | $117,711 |
| Median Household Income | 591 | $79,946 |
| Mean Household Income | 591 | $96,243 |
| Income Deficit | 391 | $0 |
| Wage / Income Gap (%) | 1,463 | 36.69% |
| Wage / Income Gap ($) | 1,463 | 63.31¢ per $1 |
| Gini / Inequality Index | 1,463 | 0.44 |
Earnings by Sex in Stanfield
Average Earnings in Stanfield are $45,236, $57,014 for men and $36,094 for women, a difference of 36.7%.
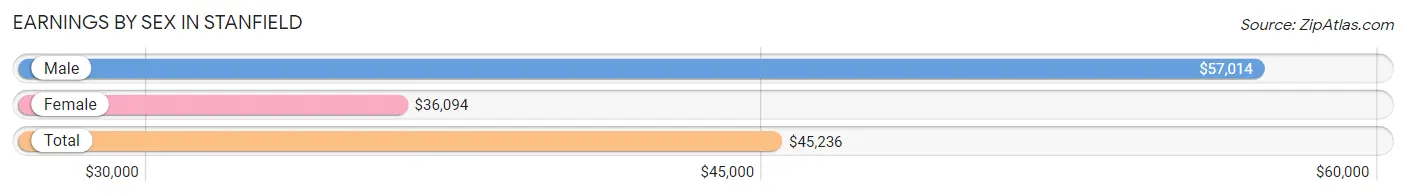
| Sex | Number | Average Earnings |
| Male | 479 (57.0%) | $57,014 |
| Female | 361 (43.0%) | $36,094 |
| Total | 840 (100.0%) | $45,236 |
Earnings by Sex by Income Bracket in Stanfield
The most common earnings brackets in Stanfield are $100,000+ for men (101 | 21.1%) and $30,000 to $34,999 for women (49 | 13.6%).
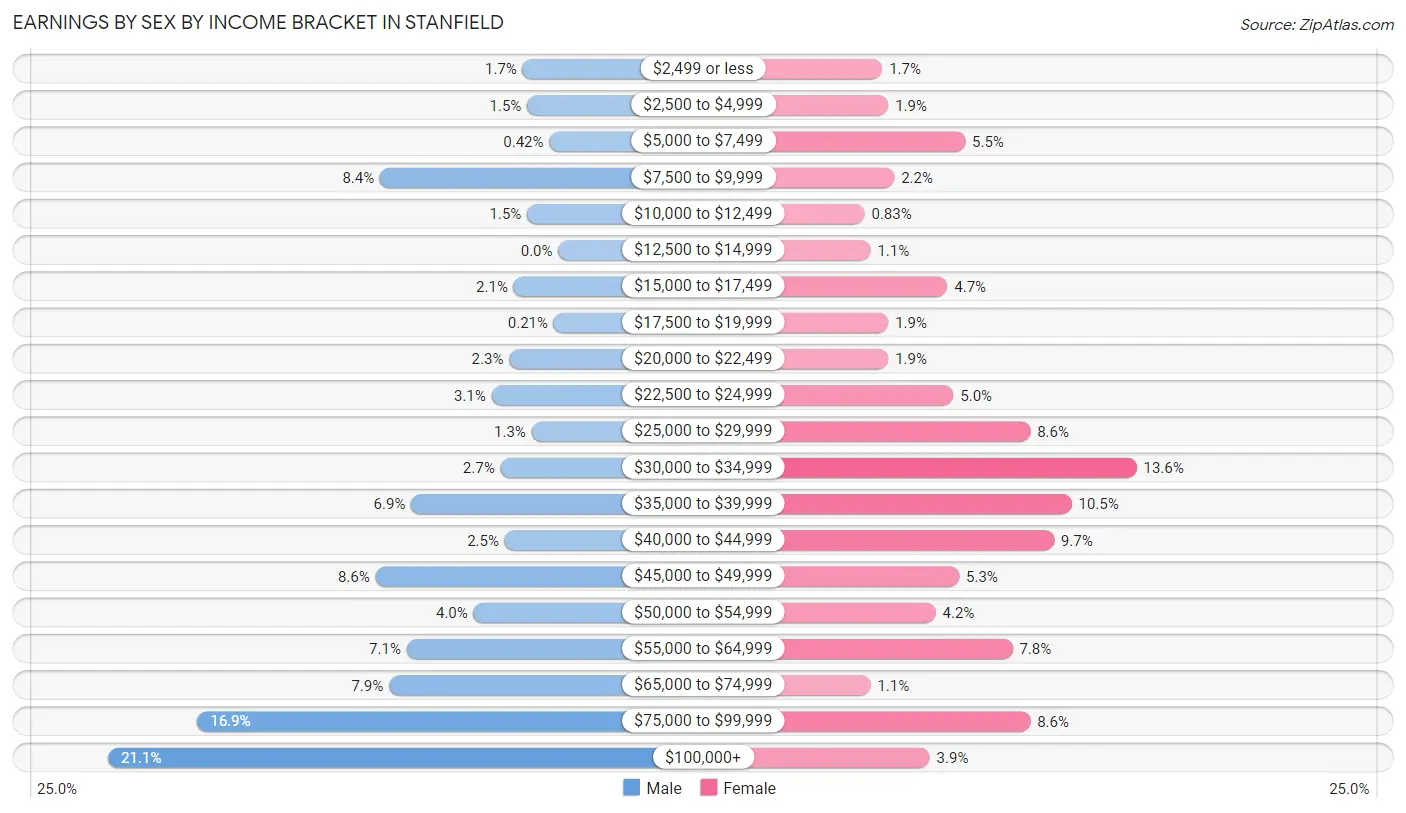
| Income | Male | Female |
| $2,499 or less | 8 (1.7%) | 6 (1.7%) |
| $2,500 to $4,999 | 7 (1.5%) | 7 (1.9%) |
| $5,000 to $7,499 | 2 (0.4%) | 20 (5.5%) |
| $7,500 to $9,999 | 40 (8.4%) | 8 (2.2%) |
| $10,000 to $12,499 | 7 (1.5%) | 3 (0.8%) |
| $12,500 to $14,999 | 0 (0.0%) | 4 (1.1%) |
| $15,000 to $17,499 | 10 (2.1%) | 17 (4.7%) |
| $17,500 to $19,999 | 1 (0.2%) | 7 (1.9%) |
| $20,000 to $22,499 | 11 (2.3%) | 7 (1.9%) |
| $22,500 to $24,999 | 15 (3.1%) | 18 (5.0%) |
| $25,000 to $29,999 | 6 (1.3%) | 31 (8.6%) |
| $30,000 to $34,999 | 13 (2.7%) | 49 (13.6%) |
| $35,000 to $39,999 | 33 (6.9%) | 38 (10.5%) |
| $40,000 to $44,999 | 12 (2.5%) | 35 (9.7%) |
| $45,000 to $49,999 | 41 (8.6%) | 19 (5.3%) |
| $50,000 to $54,999 | 19 (4.0%) | 15 (4.2%) |
| $55,000 to $64,999 | 34 (7.1%) | 28 (7.8%) |
| $65,000 to $74,999 | 38 (7.9%) | 4 (1.1%) |
| $75,000 to $99,999 | 81 (16.9%) | 31 (8.6%) |
| $100,000+ | 101 (21.1%) | 14 (3.9%) |
| Total | 479 (100.0%) | 361 (100.0%) |
Earnings by Sex by Educational Attainment in Stanfield
Average earnings in Stanfield are $65,781 for men and $36,875 for women, a difference of 43.9%. Men with an educational attainment of college or associate's degree enjoy the highest average annual earnings of $71,136, while those with bachelor's degree education earn the least with $52,250. Women with an educational attainment of graduate degree earn the most with the average annual earnings of $56,625, while those with less than high school education have the smallest earnings of $27,614.
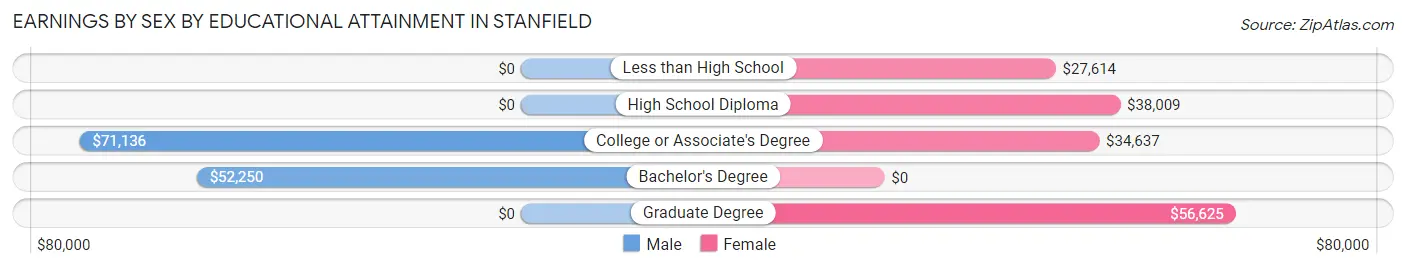
| Educational Attainment | Male Income | Female Income |
| Less than High School | - | - |
| High School Diploma | - | - |
| College or Associate's Degree | $71,136 | $34,637 |
| Bachelor's Degree | $52,250 | $0 |
| Graduate Degree | - | - |
| Total | $65,781 | $36,875 |
Family Income in Stanfield
Family Income Brackets in Stanfield
According to the Stanfield family income data, there are 117 families falling into the $100,000 to $149,999 income range, which is the most common income bracket and makes up 29.9% of all families.
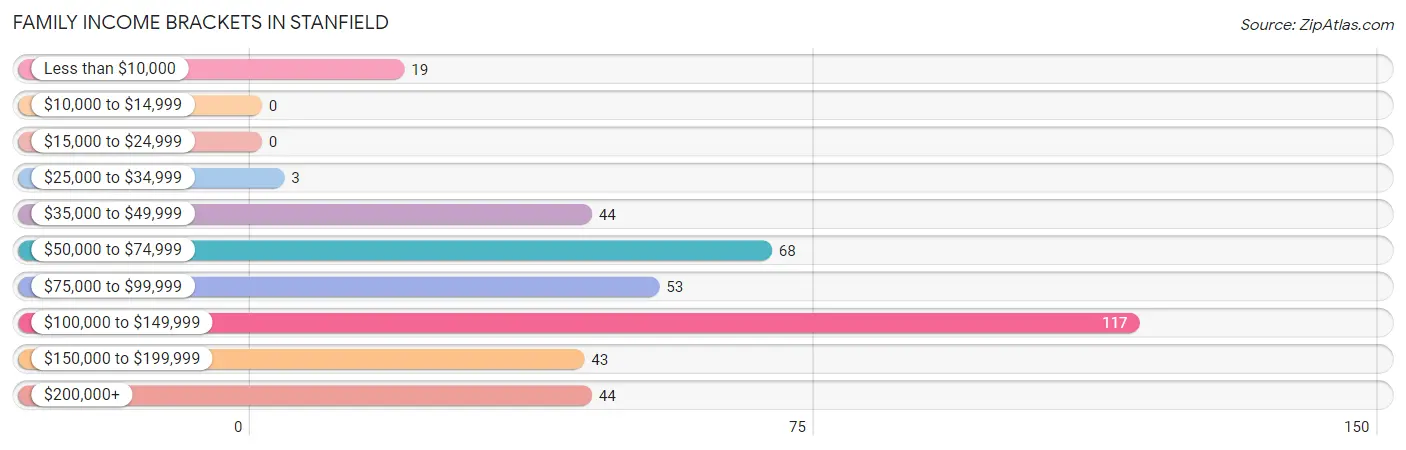
| Income Bracket | # Families | % Families |
| Less than $10,000 | 19 | 4.9% |
| $10,000 to $14,999 | 0 | 0.0% |
| $15,000 to $24,999 | 0 | 0.0% |
| $25,000 to $34,999 | 3 | 0.8% |
| $35,000 to $49,999 | 44 | 11.3% |
| $50,000 to $74,999 | 68 | 17.4% |
| $75,000 to $99,999 | 53 | 13.6% |
| $100,000 to $149,999 | 117 | 29.9% |
| $150,000 to $199,999 | 43 | 11.0% |
| $200,000+ | 44 | 11.3% |
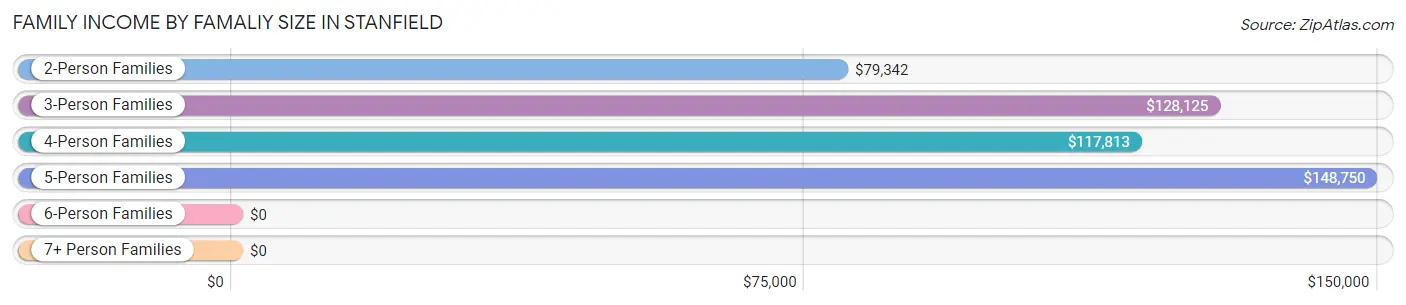
Family Income by Famaliy Size in Stanfield
5-person families (15 | 3.8%) account for the highest median family income in Stanfield with $148,750 per family, while 3-person families (97 | 24.8%) have the highest median income of $42,708 per family member.
| Income Bracket | # Families | Median Income |
| 2-Person Families | 180 (46.0%) | $79,342 |
| 3-Person Families | 97 (24.8%) | $128,125 |
| 4-Person Families | 73 (18.7%) | $117,813 |
| 5-Person Families | 15 (3.8%) | $148,750 |
| 6-Person Families | 24 (6.1%) | $0 |
| 7+ Person Families | 2 (0.5%) | $0 |
| Total | 391 (100.0%) | $104,018 |
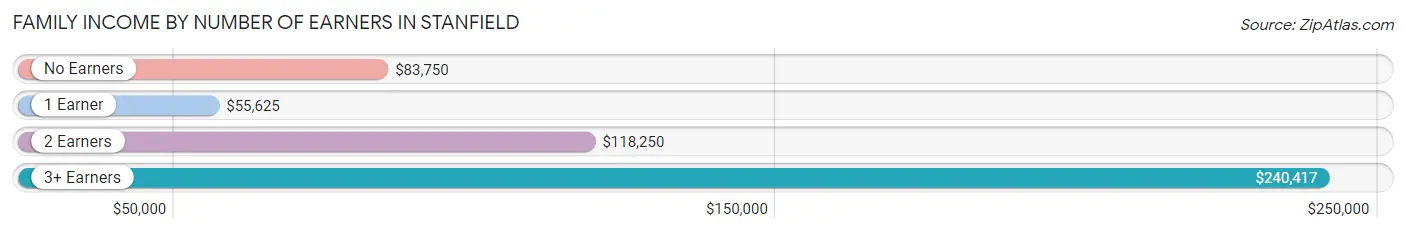
Family Income by Number of Earners in Stanfield
The median family income in Stanfield is $104,018, with families comprising 3+ earners (43) having the highest median family income of $240,417, while families with 1 earner (135) have the lowest median family income of $55,625, accounting for 11.0% and 34.5% of families, respectively.
| Number of Earners | # Families | Median Income |
| No Earners | 32 (8.2%) | $83,750 |
| 1 Earner | 135 (34.5%) | $55,625 |
| 2 Earners | 181 (46.3%) | $118,250 |
| 3+ Earners | 43 (11.0%) | $240,417 |
| Total | 391 (100.0%) | $104,018 |
Household Income in Stanfield
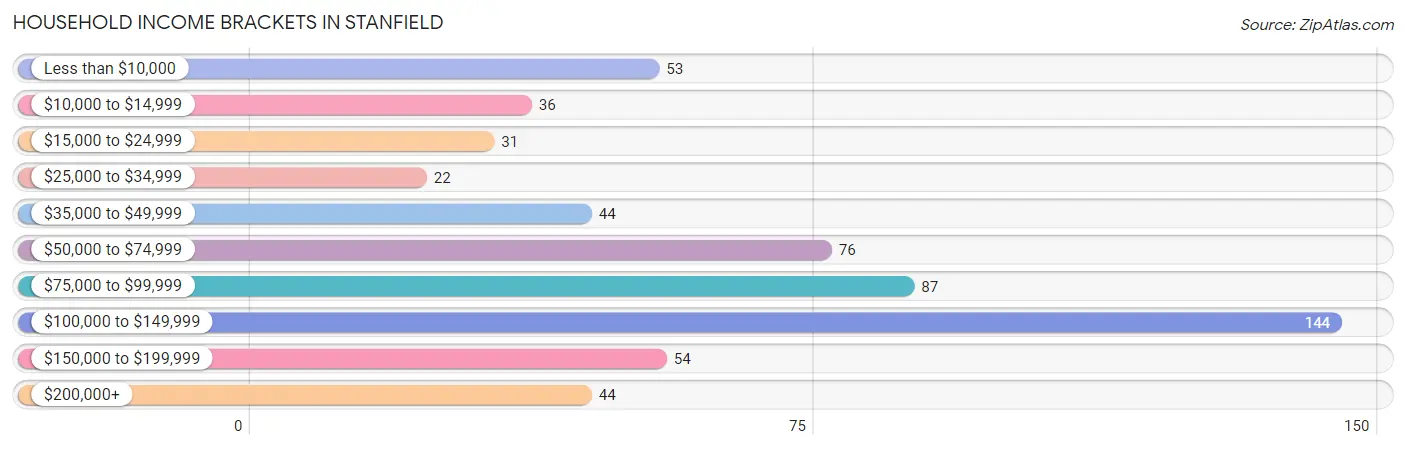
Household Income Brackets in Stanfield
With 144 households falling in the category, the $100,000 to $149,999 income range is the most frequent in Stanfield, accounting for 24.4% of all households. In contrast, only 22 households (3.7%) fall into the $25,000 to $34,999 income bracket, making it the least populous group.
| Income Bracket | # Households | % Households |
| Less than $10,000 | 53 | 9.0% |
| $10,000 to $14,999 | 36 | 6.1% |
| $15,000 to $24,999 | 31 | 5.2% |
| $25,000 to $34,999 | 22 | 3.7% |
| $35,000 to $49,999 | 44 | 7.4% |
| $50,000 to $74,999 | 76 | 12.9% |
| $75,000 to $99,999 | 87 | 14.7% |
| $100,000 to $149,999 | 144 | 24.4% |
| $150,000 to $199,999 | 54 | 9.1% |
| $200,000+ | 44 | 7.4% |
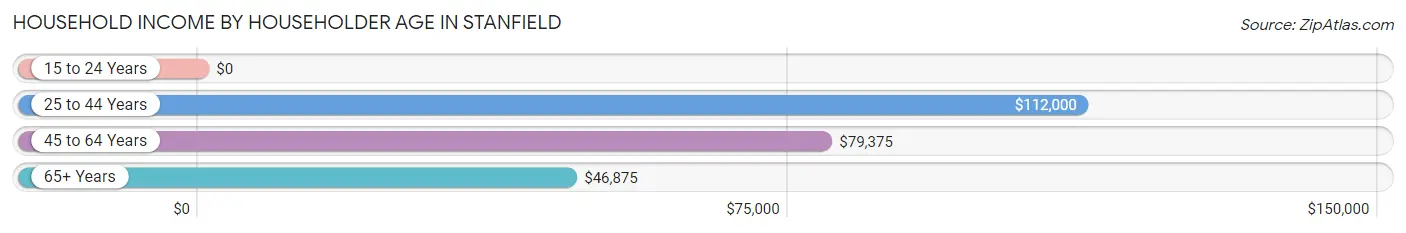
Household Income by Householder Age in Stanfield
The median household income in Stanfield is $79,946, with the highest median household income of $112,000 found in the 25 to 44 years age bracket for the primary householder. A total of 180 households (30.5%) fall into this category. Meanwhile, the 15 to 24 years age bracket for the primary householder has the lowest median household income of $0, with 7 households (1.2%) in this group.
| Income Bracket | # Households | Median Income |
| 15 to 24 Years | 7 (1.2%) | $0 |
| 25 to 44 Years | 180 (30.5%) | $112,000 |
| 45 to 64 Years | 270 (45.7%) | $79,375 |
| 65+ Years | 134 (22.7%) | $46,875 |
| Total | 591 (100.0%) | $79,946 |
Poverty in Stanfield
Income Below Poverty by Sex and Age in Stanfield
With 10.7% poverty level for males and 7.7% for females among the residents of Stanfield, 75 year old and over males and 15 year old females are the most vulnerable to poverty, with 23 males (39.0%) and 11 females (34.4%) in their respective age groups living below the poverty level.
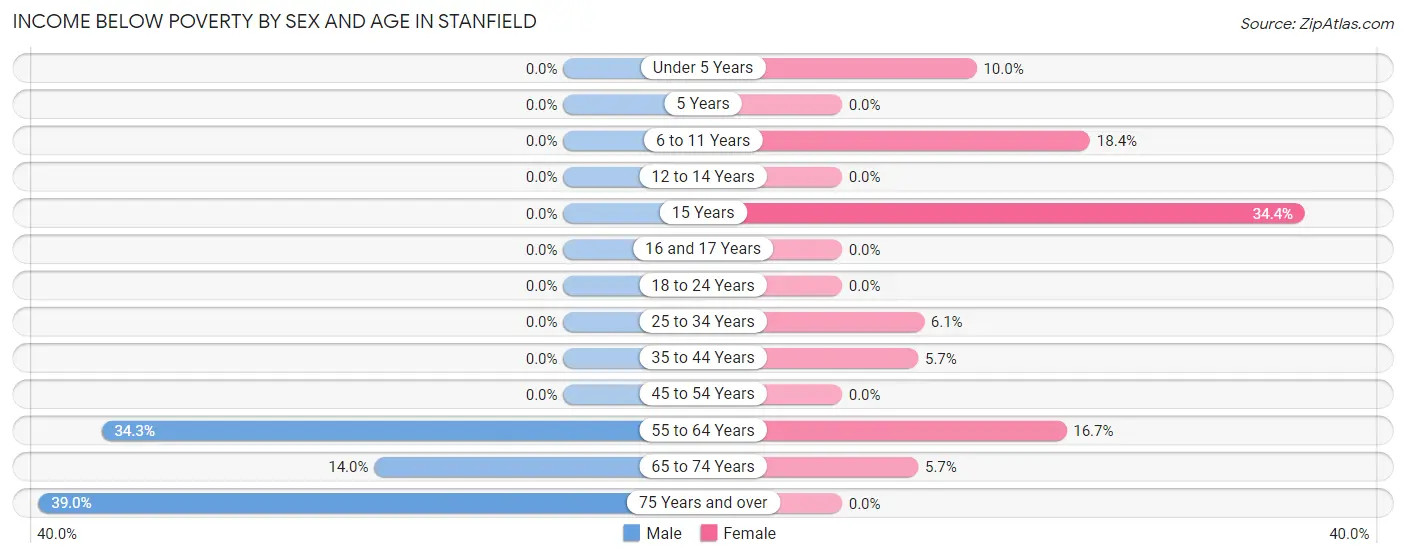
| Age Bracket | Male | Female |
| Under 5 Years | 0 (0.0%) | 7 (10.0%) |
| 5 Years | 0 (0.0%) | 0 (0.0%) |
| 6 to 11 Years | 0 (0.0%) | 7 (18.4%) |
| 12 to 14 Years | 0 (0.0%) | 0 (0.0%) |
| 15 Years | 0 (0.0%) | 11 (34.4%) |
| 16 and 17 Years | 0 (0.0%) | 0 (0.0%) |
| 18 to 24 Years | 0 (0.0%) | 0 (0.0%) |
| 25 to 34 Years | 0 (0.0%) | 7 (6.1%) |
| 35 to 44 Years | 0 (0.0%) | 3 (5.7%) |
| 45 to 54 Years | 0 (0.0%) | 0 (0.0%) |
| 55 to 64 Years | 48 (34.3%) | 16 (16.7%) |
| 65 to 74 Years | 8 (14.0%) | 3 (5.7%) |
| 75 Years and over | 23 (39.0%) | 0 (0.0%) |
| Total | 79 (10.7%) | 54 (7.7%) |
Income Above Poverty by Sex and Age in Stanfield
According to the poverty statistics in Stanfield, males aged under 5 years and females aged 5 years are the age groups that are most secure financially, with 100.0% of males and 100.0% of females in these age groups living above the poverty line.
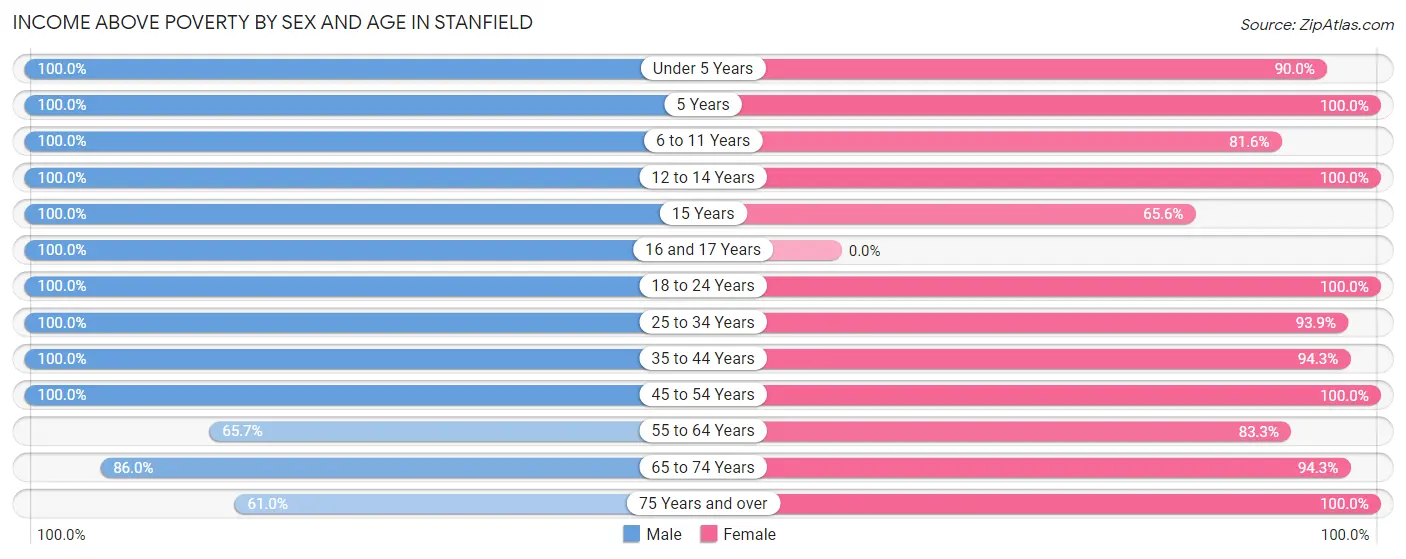
| Age Bracket | Male | Female |
| Under 5 Years | 33 (100.0%) | 63 (90.0%) |
| 5 Years | 20 (100.0%) | 2 (100.0%) |
| 6 to 11 Years | 61 (100.0%) | 31 (81.6%) |
| 12 to 14 Years | 22 (100.0%) | 25 (100.0%) |
| 15 Years | 2 (100.0%) | 21 (65.6%) |
| 16 and 17 Years | 3 (100.0%) | 0 (0.0%) |
| 18 to 24 Years | 44 (100.0%) | 43 (100.0%) |
| 25 to 34 Years | 133 (100.0%) | 108 (93.9%) |
| 35 to 44 Years | 77 (100.0%) | 50 (94.3%) |
| 45 to 54 Years | 86 (100.0%) | 135 (100.0%) |
| 55 to 64 Years | 92 (65.7%) | 80 (83.3%) |
| 65 to 74 Years | 49 (86.0%) | 50 (94.3%) |
| 75 Years and over | 36 (61.0%) | 35 (100.0%) |
| Total | 658 (89.3%) | 643 (92.2%) |
Income Below Poverty Among Married-Couple Families in Stanfield
The poverty statistics for married-couple families in Stanfield show that 4.3% or 13 of the total 305 families live below the poverty line. Families with no children have the highest poverty rate of 7.2%, comprising of 13 families. On the other hand, families with 1 or 2 children have the lowest poverty rate of 0.0%, which includes 0 families.
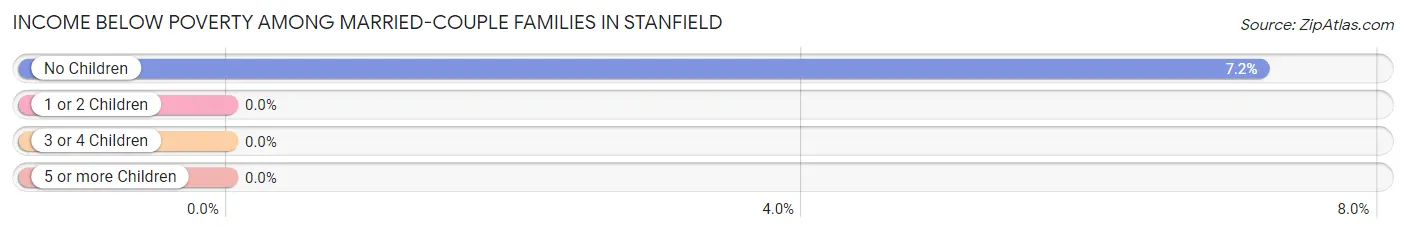
| Children | Above Poverty | Below Poverty |
| No Children | 168 (92.8%) | 13 (7.2%) |
| 1 or 2 Children | 92 (100.0%) | 0 (0.0%) |
| 3 or 4 Children | 32 (100.0%) | 0 (0.0%) |
| 5 or more Children | 0 (0.0%) | 0 (0.0%) |
| Total | 292 (95.7%) | 13 (4.3%) |
Income Below Poverty Among Single-Parent Households in Stanfield
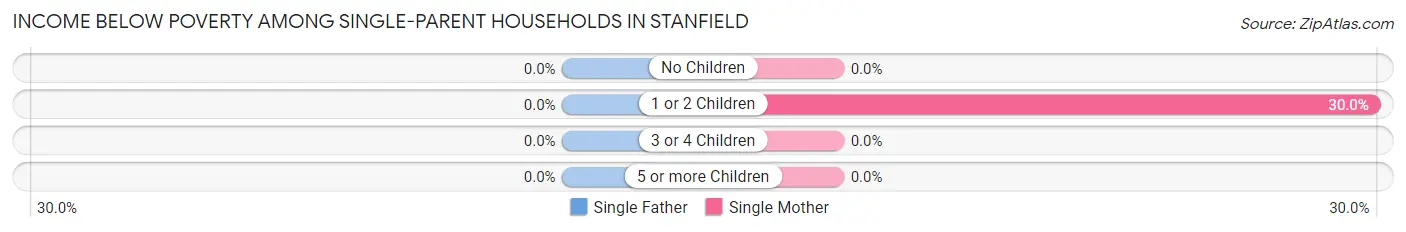
| Children | Single Father | Single Mother |
| No Children | 0 (0.0%) | 0 (0.0%) |
| 1 or 2 Children | 0 (0.0%) | 6 (30.0%) |
| 3 or 4 Children | 0 (0.0%) | 0 (0.0%) |
| 5 or more Children | 0 (0.0%) | 0 (0.0%) |
| Total | 0 (0.0%) | 6 (13.0%) |
Income Below Poverty Among Married-Couple vs Single-Parent Households in Stanfield
The poverty data for Stanfield shows that 13 of the married-couple family households (4.3%) and 6 of the single-parent households (7.0%) are living below the poverty level. Within the married-couple family households, those with no children have the highest poverty rate, with 13 households (7.2%) falling below the poverty line. Among the single-parent households, those with 1 or 2 children have the highest poverty rate, with 6 household (11.1%) living below poverty.
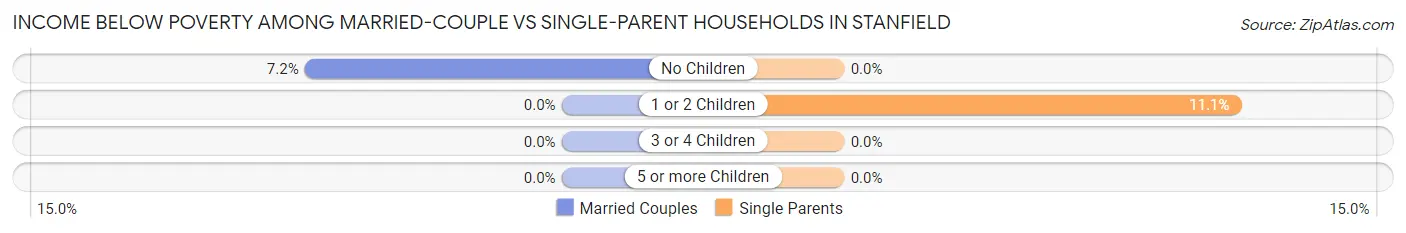
| Children | Married-Couple Families | Single-Parent Households |
| No Children | 13 (7.2%) | 0 (0.0%) |
| 1 or 2 Children | 0 (0.0%) | 6 (11.1%) |
| 3 or 4 Children | 0 (0.0%) | 0 (0.0%) |
| 5 or more Children | 0 (0.0%) | 0 (0.0%) |
| Total | 13 (4.3%) | 6 (7.0%) |
Employment Characteristics in Stanfield
Employment by Class of Employer in Stanfield
Among the 730 employed individuals in Stanfield, private company employees (500 | 68.5%), not-for-profit organizations (74 | 10.1%), and self-employed (not incorporated) (55 | 7.5%) make up the most common classes of employment.
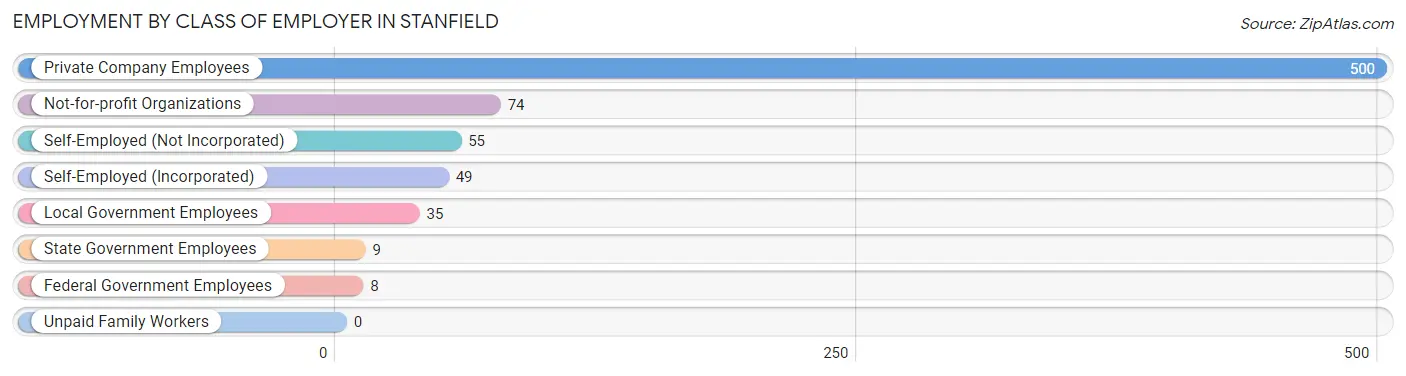
| Employer Class | # Employees | % Employees |
| Private Company Employees | 500 | 68.5% |
| Self-Employed (Incorporated) | 49 | 6.7% |
| Self-Employed (Not Incorporated) | 55 | 7.5% |
| Not-for-profit Organizations | 74 | 10.1% |
| Local Government Employees | 35 | 4.8% |
| State Government Employees | 9 | 1.2% |
| Federal Government Employees | 8 | 1.1% |
| Unpaid Family Workers | 0 | 0.0% |
| Total | 730 | 100.0% |
Employment Status by Age in Stanfield
According to the labor force statistics for Stanfield, out of the total population over 16 years of age (1,129), 72.6% or 820 individuals are in the labor force, with 9.1% or 75 of them unemployed. The age group with the highest labor force participation rate is 25 to 29 years, with 94.4% or 118 individuals in the labor force. Within the labor force, the 16 to 19 years age range has the highest percentage of unemployed individuals, with 58.8% or 10 of them being unemployed.
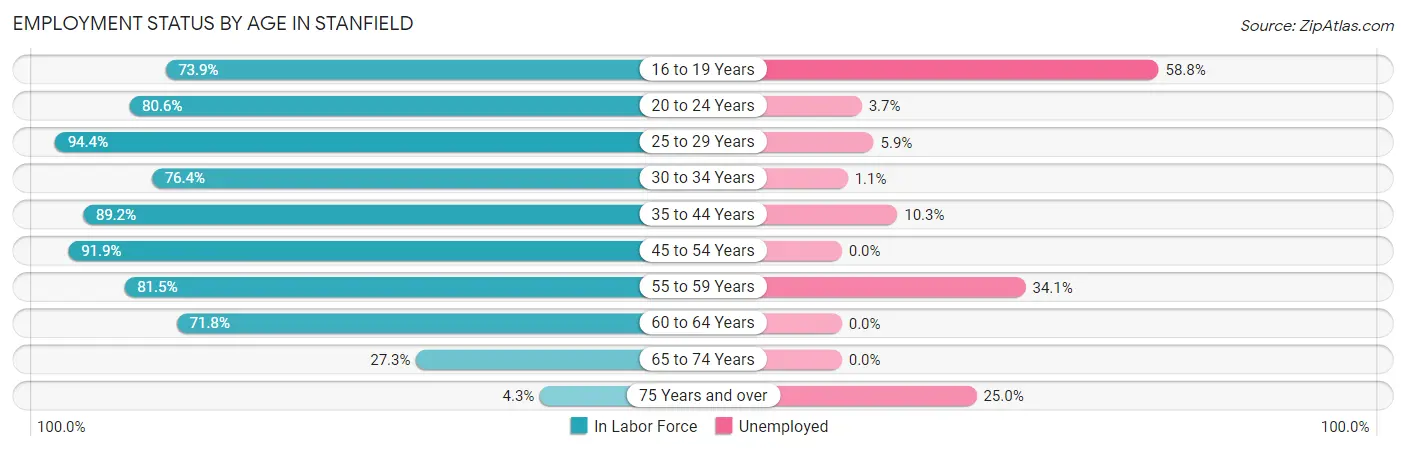
| Age Bracket | In Labor Force | Unemployed |
| 16 to 19 Years | 17 (73.9%) | 10 (58.8%) |
| 20 to 24 Years | 54 (80.6%) | 2 (3.7%) |
| 25 to 29 Years | 118 (94.4%) | 7 (5.9%) |
| 30 to 34 Years | 94 (76.4%) | 1 (1.1%) |
| 35 to 44 Years | 116 (89.2%) | 12 (10.3%) |
| 45 to 54 Years | 203 (91.9%) | 0 (0.0%) |
| 55 to 59 Years | 123 (81.5%) | 42 (34.1%) |
| 60 to 64 Years | 61 (71.8%) | 0 (0.0%) |
| 65 to 74 Years | 30 (27.3%) | 0 (0.0%) |
| 75 Years and over | 4 (4.3%) | 1 (25.0%) |
| Total | 820 (72.6%) | 75 (9.1%) |
Employment Status by Educational Attainment in Stanfield
According to labor force statistics for Stanfield, 85.6% of individuals (715) out of the total population between 25 and 64 years of age (835) are in the labor force, with 8.7% or 62 of them being unemployed. The group with the highest labor force participation rate are those with the educational attainment of college / associate degree, with 90.3% or 326 individuals in the labor force. Within the labor force, individuals with high school diploma education have the highest percentage of unemployment, with 22.2% or 52 of them being unemployed.
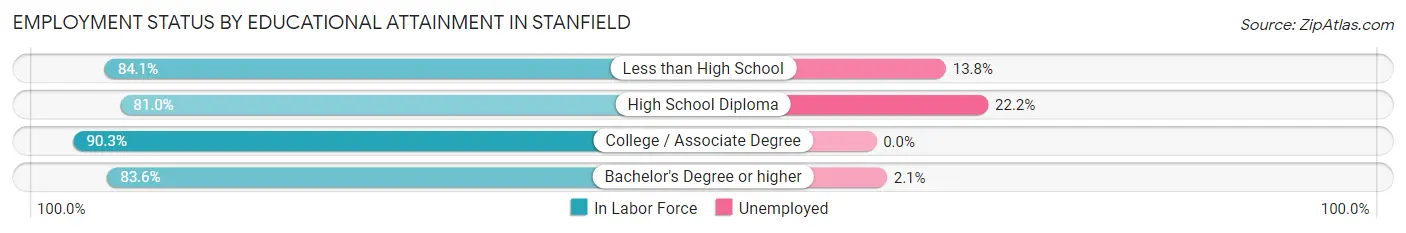
| Educational Attainment | In Labor Force | Unemployed |
| Less than High School | 58 (84.1%) | 10 (13.8%) |
| High School Diploma | 234 (81.0%) | 64 (22.2%) |
| College / Associate Degree | 326 (90.3%) | 0 (0.0%) |
| Bachelor's Degree or higher | 97 (83.6%) | 2 (2.1%) |
| Total | 715 (85.6%) | 73 (8.7%) |
Employment Occupations by Sex in Stanfield
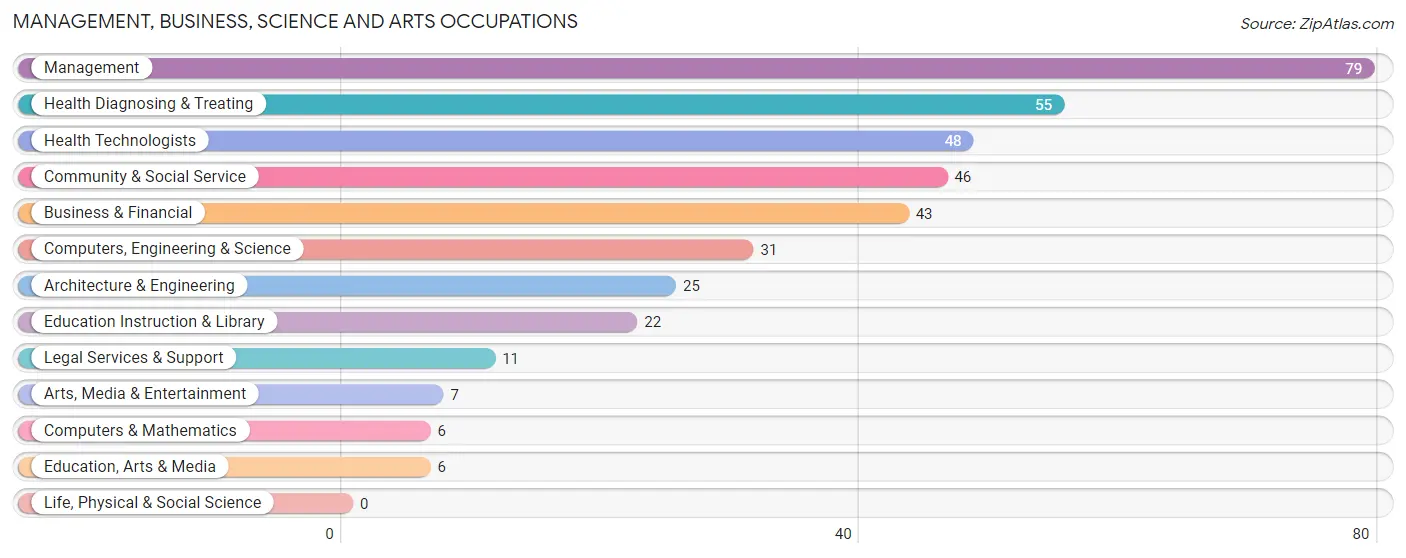
Management, Business, Science and Arts Occupations
The most common Management, Business, Science and Arts occupations in Stanfield are Management (79 | 10.6%), Health Diagnosing & Treating (55 | 7.4%), Health Technologists (48 | 6.4%), Community & Social Service (46 | 6.2%), and Business & Financial (43 | 5.8%).
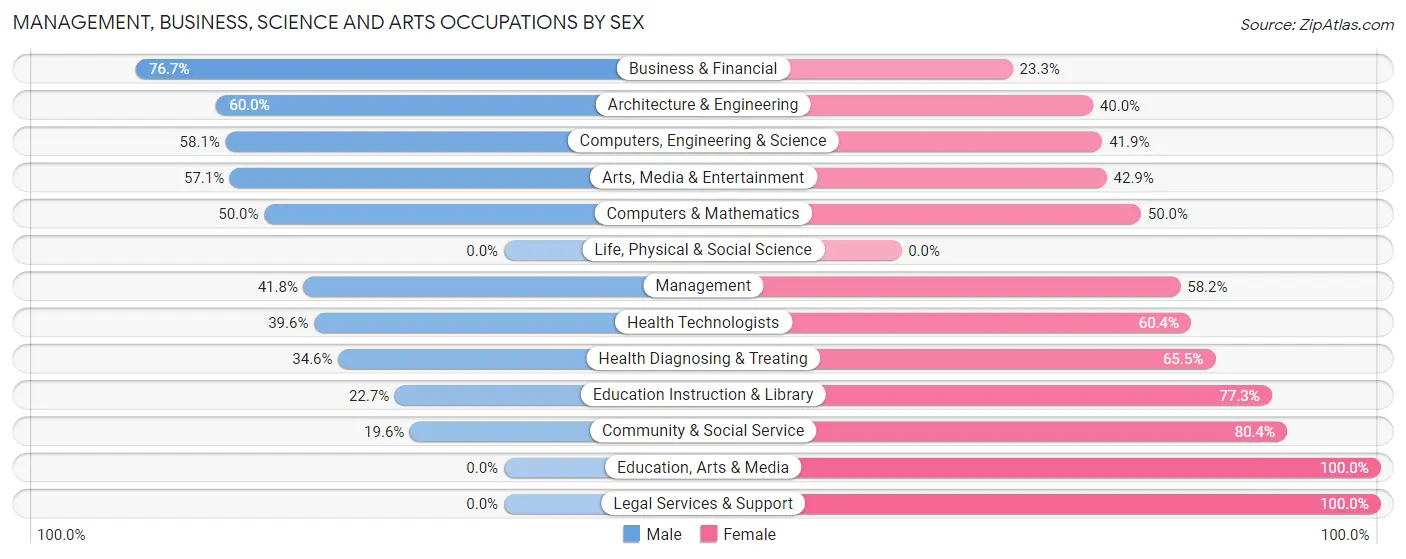
Management, Business, Science and Arts Occupations by Sex
Within the Management, Business, Science and Arts occupations in Stanfield, the most male-oriented occupations are Business & Financial (76.7%), Architecture & Engineering (60.0%), and Computers, Engineering & Science (58.1%), while the most female-oriented occupations are Education, Arts & Media (100.0%), Legal Services & Support (100.0%), and Community & Social Service (80.4%).
| Occupation | Male | Female |
| Management | 33 (41.8%) | 46 (58.2%) |
| Business & Financial | 33 (76.7%) | 10 (23.3%) |
| Computers, Engineering & Science | 18 (58.1%) | 13 (41.9%) |
| Computers & Mathematics | 3 (50.0%) | 3 (50.0%) |
| Architecture & Engineering | 15 (60.0%) | 10 (40.0%) |
| Life, Physical & Social Science | 0 (0.0%) | 0 (0.0%) |
| Community & Social Service | 9 (19.6%) | 37 (80.4%) |
| Education, Arts & Media | 0 (0.0%) | 6 (100.0%) |
| Legal Services & Support | 0 (0.0%) | 11 (100.0%) |
| Education Instruction & Library | 5 (22.7%) | 17 (77.3%) |
| Arts, Media & Entertainment | 4 (57.1%) | 3 (42.9%) |
| Health Diagnosing & Treating | 19 (34.5%) | 36 (65.4%) |
| Health Technologists | 19 (39.6%) | 29 (60.4%) |
| Total (Category) | 112 (44.1%) | 142 (55.9%) |
| Total (Overall) | 419 (56.2%) | 326 (43.8%) |
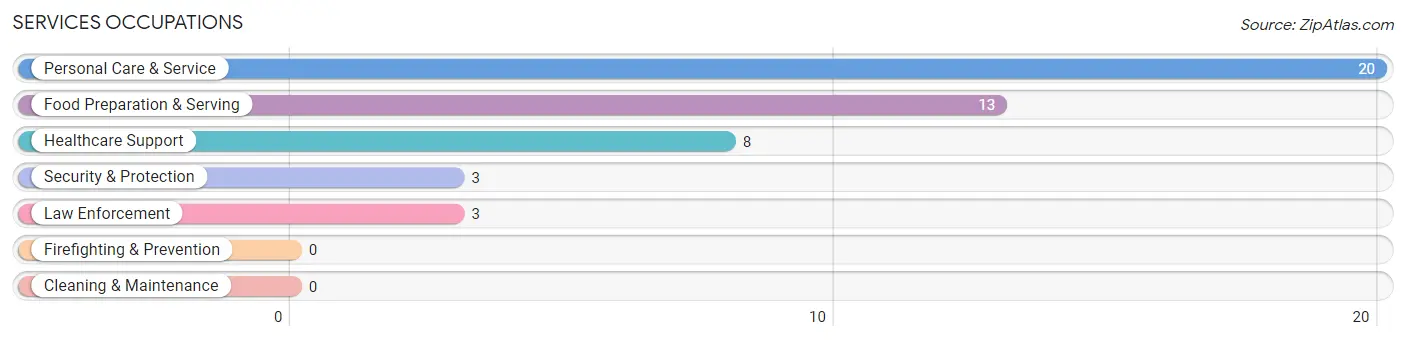
Services Occupations
The most common Services occupations in Stanfield are Personal Care & Service (20 | 2.7%), Food Preparation & Serving (13 | 1.7%), Healthcare Support (8 | 1.1%), Security & Protection (3 | 0.4%), and Law Enforcement (3 | 0.4%).
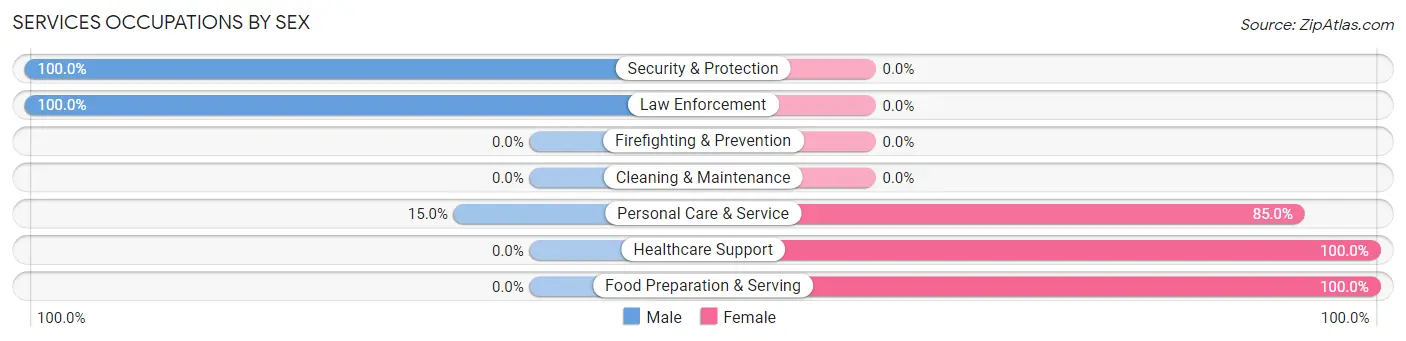
Services Occupations by Sex
Within the Services occupations in Stanfield, the most male-oriented occupations are Security & Protection (100.0%), Law Enforcement (100.0%), and Personal Care & Service (15.0%), while the most female-oriented occupations are Healthcare Support (100.0%), Food Preparation & Serving (100.0%), and Personal Care & Service (85.0%).
| Occupation | Male | Female |
| Healthcare Support | 0 (0.0%) | 8 (100.0%) |
| Security & Protection | 3 (100.0%) | 0 (0.0%) |
| Firefighting & Prevention | 0 (0.0%) | 0 (0.0%) |
| Law Enforcement | 3 (100.0%) | 0 (0.0%) |
| Food Preparation & Serving | 0 (0.0%) | 13 (100.0%) |
| Cleaning & Maintenance | 0 (0.0%) | 0 (0.0%) |
| Personal Care & Service | 3 (15.0%) | 17 (85.0%) |
| Total (Category) | 6 (13.6%) | 38 (86.4%) |
| Total (Overall) | 419 (56.2%) | 326 (43.8%) |
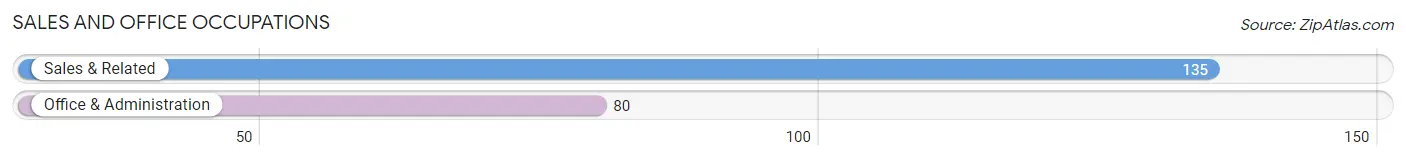
Sales and Office Occupations
The most common Sales and Office occupations in Stanfield are Sales & Related (135 | 18.1%), and Office & Administration (80 | 10.7%).
Sales and Office Occupations by Sex
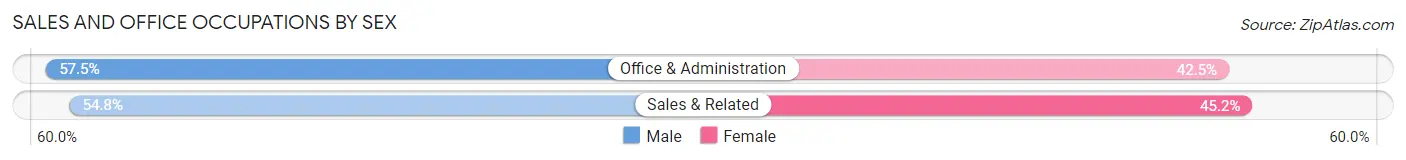
| Occupation | Male | Female |
| Sales & Related | 74 (54.8%) | 61 (45.2%) |
| Office & Administration | 46 (57.5%) | 34 (42.5%) |
| Total (Category) | 120 (55.8%) | 95 (44.2%) |
| Total (Overall) | 419 (56.2%) | 326 (43.8%) |
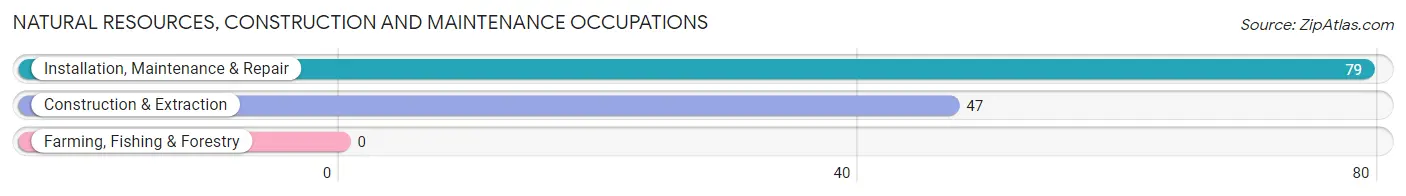
Natural Resources, Construction and Maintenance Occupations
The most common Natural Resources, Construction and Maintenance occupations in Stanfield are Installation, Maintenance & Repair (79 | 10.6%), and Construction & Extraction (47 | 6.3%).
Natural Resources, Construction and Maintenance Occupations by Sex
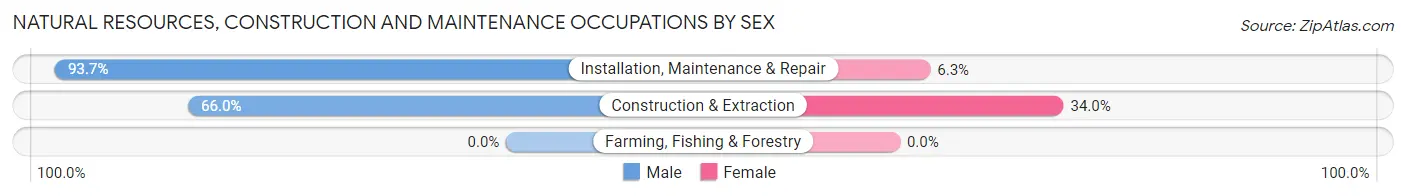
| Occupation | Male | Female |
| Farming, Fishing & Forestry | 0 (0.0%) | 0 (0.0%) |
| Construction & Extraction | 31 (66.0%) | 16 (34.0%) |
| Installation, Maintenance & Repair | 74 (93.7%) | 5 (6.3%) |
| Total (Category) | 105 (83.3%) | 21 (16.7%) |
| Total (Overall) | 419 (56.2%) | 326 (43.8%) |
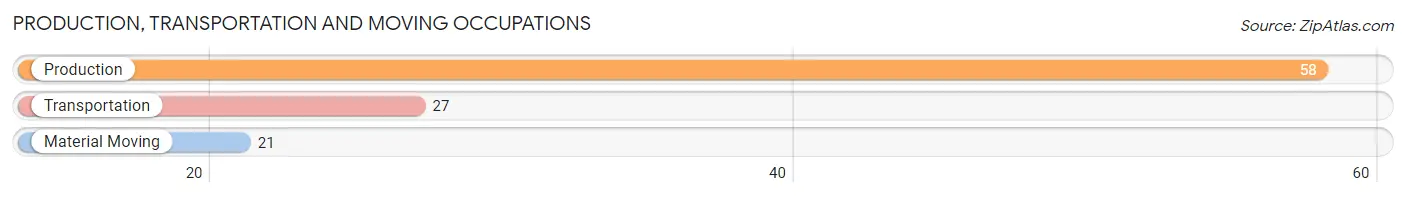
Production, Transportation and Moving Occupations
The most common Production, Transportation and Moving occupations in Stanfield are Production (58 | 7.8%), Transportation (27 | 3.6%), and Material Moving (21 | 2.8%).
Production, Transportation and Moving Occupations by Sex
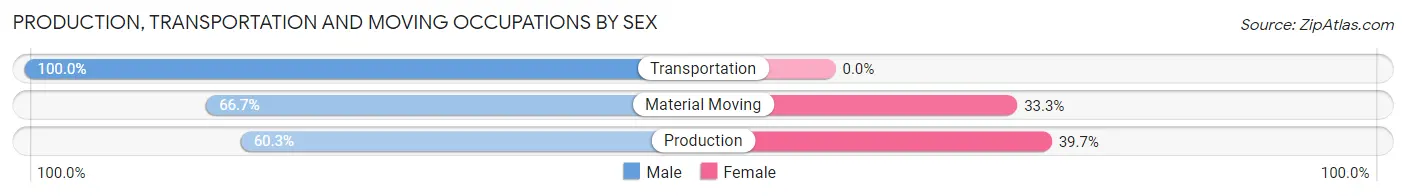
| Occupation | Male | Female |
| Production | 35 (60.3%) | 23 (39.7%) |
| Transportation | 27 (100.0%) | 0 (0.0%) |
| Material Moving | 14 (66.7%) | 7 (33.3%) |
| Total (Category) | 76 (71.7%) | 30 (28.3%) |
| Total (Overall) | 419 (56.2%) | 326 (43.8%) |
Employment Industries by Sex in Stanfield
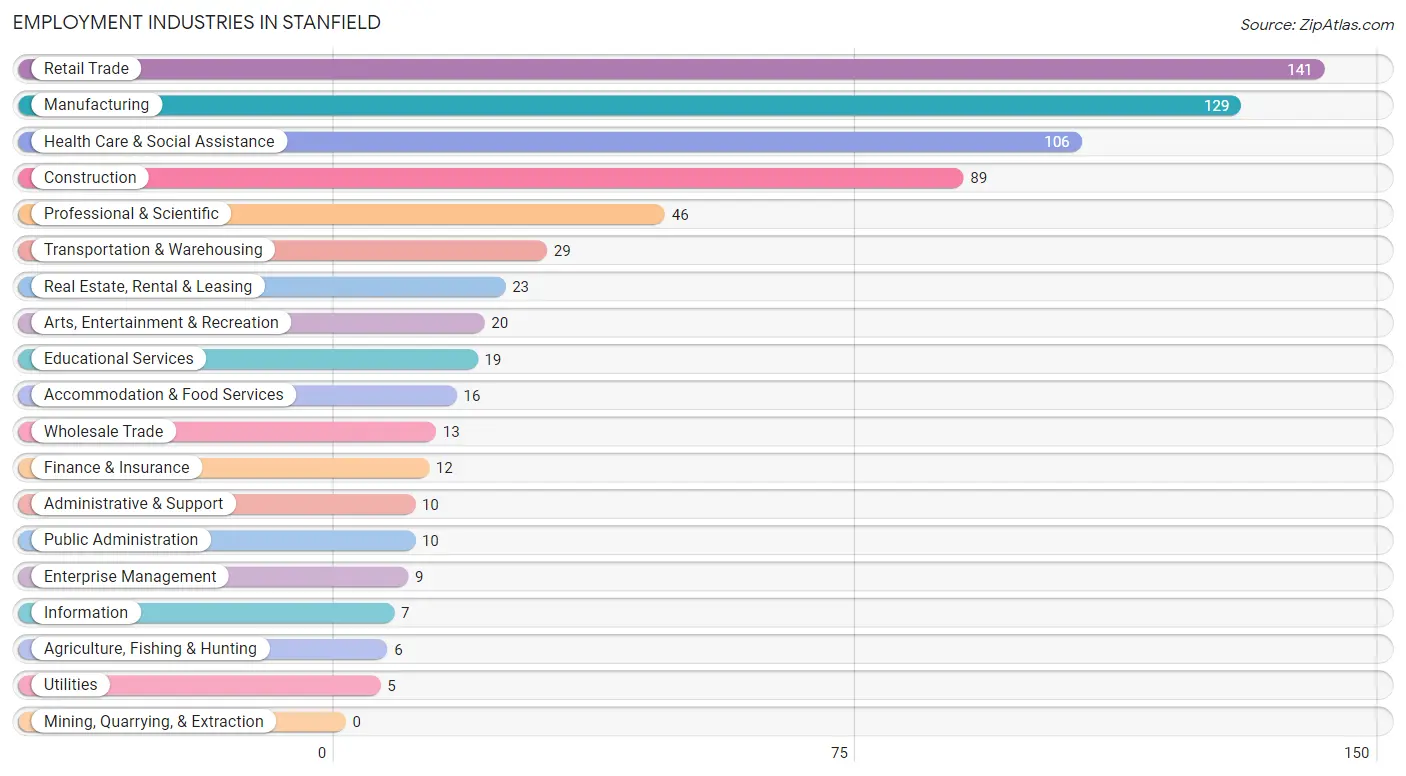
Employment Industries in Stanfield
The major employment industries in Stanfield include Retail Trade (141 | 18.9%), Manufacturing (129 | 17.3%), Health Care & Social Assistance (106 | 14.2%), Construction (89 | 11.9%), and Professional & Scientific (46 | 6.2%).
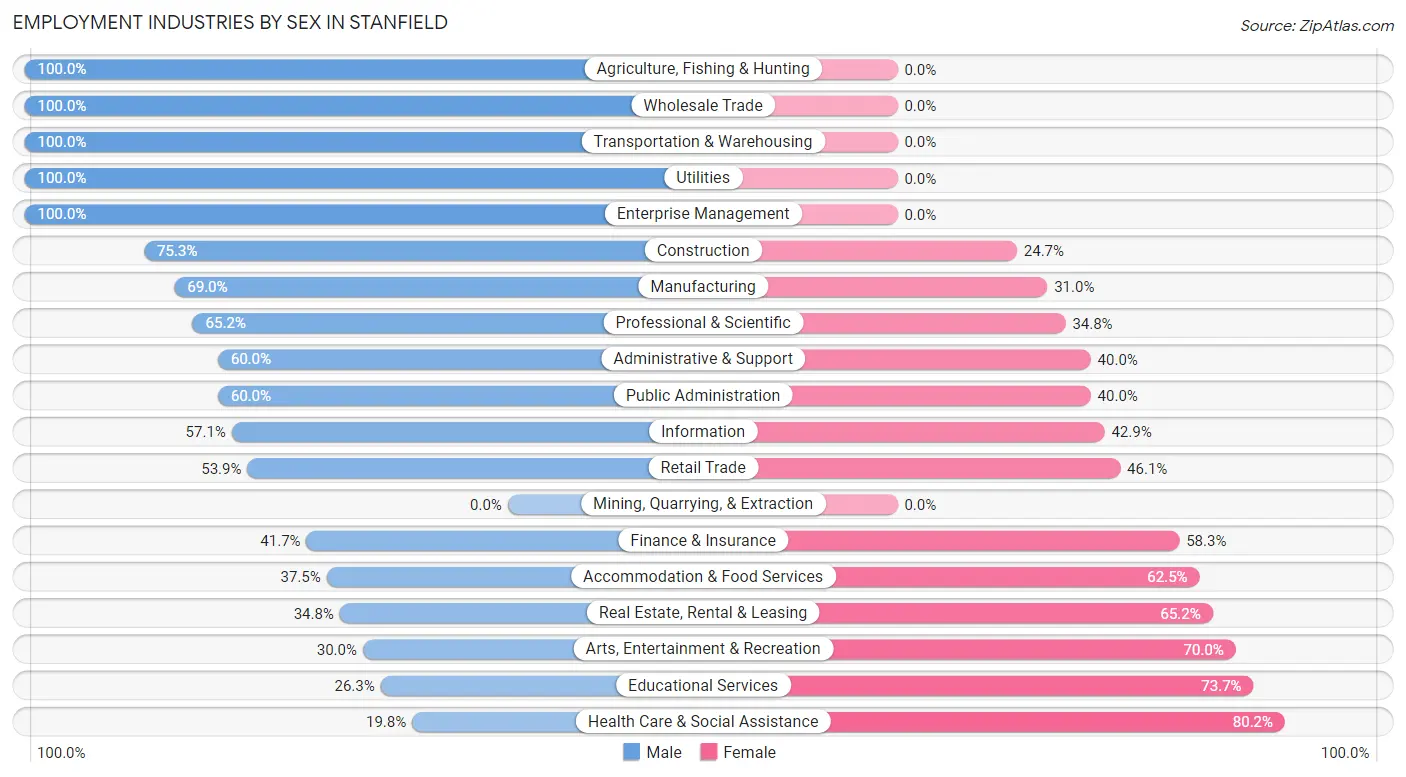
Employment Industries by Sex in Stanfield
The Stanfield industries that see more men than women are Agriculture, Fishing & Hunting (100.0%), Wholesale Trade (100.0%), and Transportation & Warehousing (100.0%), whereas the industries that tend to have a higher number of women are Health Care & Social Assistance (80.2%), Educational Services (73.7%), and Arts, Entertainment & Recreation (70.0%).
| Industry | Male | Female |
| Agriculture, Fishing & Hunting | 6 (100.0%) | 0 (0.0%) |
| Mining, Quarrying, & Extraction | 0 (0.0%) | 0 (0.0%) |
| Construction | 67 (75.3%) | 22 (24.7%) |
| Manufacturing | 89 (69.0%) | 40 (31.0%) |
| Wholesale Trade | 13 (100.0%) | 0 (0.0%) |
| Retail Trade | 76 (53.9%) | 65 (46.1%) |
| Transportation & Warehousing | 29 (100.0%) | 0 (0.0%) |
| Utilities | 5 (100.0%) | 0 (0.0%) |
| Information | 4 (57.1%) | 3 (42.9%) |
| Finance & Insurance | 5 (41.7%) | 7 (58.3%) |
| Real Estate, Rental & Leasing | 8 (34.8%) | 15 (65.2%) |
| Professional & Scientific | 30 (65.2%) | 16 (34.8%) |
| Enterprise Management | 9 (100.0%) | 0 (0.0%) |
| Administrative & Support | 6 (60.0%) | 4 (40.0%) |
| Educational Services | 5 (26.3%) | 14 (73.7%) |
| Health Care & Social Assistance | 21 (19.8%) | 85 (80.2%) |
| Arts, Entertainment & Recreation | 6 (30.0%) | 14 (70.0%) |
| Accommodation & Food Services | 6 (37.5%) | 10 (62.5%) |
| Public Administration | 6 (60.0%) | 4 (40.0%) |
| Total | 419 (56.2%) | 326 (43.8%) |
Education in Stanfield
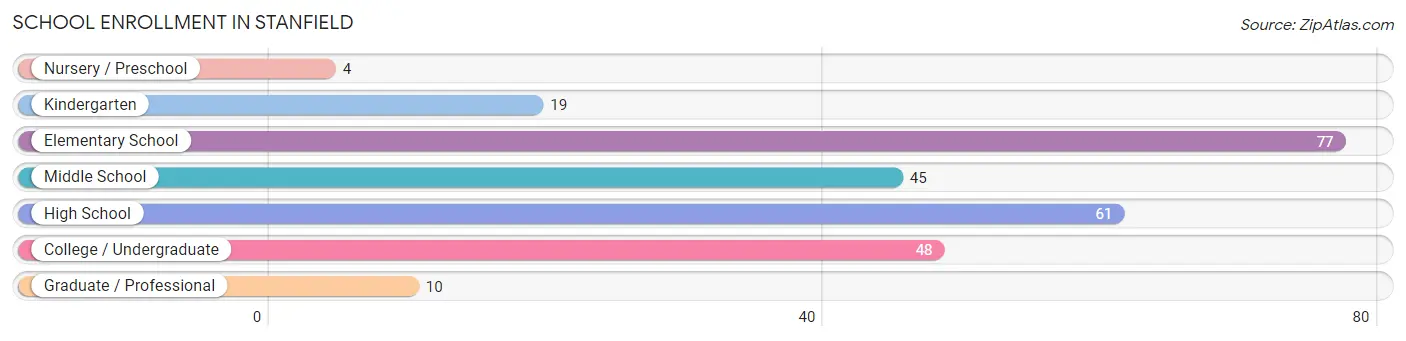
School Enrollment in Stanfield
The most common levels of schooling among the 264 students in Stanfield are elementary school (77 | 29.2%), high school (61 | 23.1%), and college / undergraduate (48 | 18.2%).
| School Level | # Students | % Students |
| Nursery / Preschool | 4 | 1.5% |
| Kindergarten | 19 | 7.2% |
| Elementary School | 77 | 29.2% |
| Middle School | 45 | 17.1% |
| High School | 61 | 23.1% |
| College / Undergraduate | 48 | 18.2% |
| Graduate / Professional | 10 | 3.8% |
| Total | 264 | 100.0% |
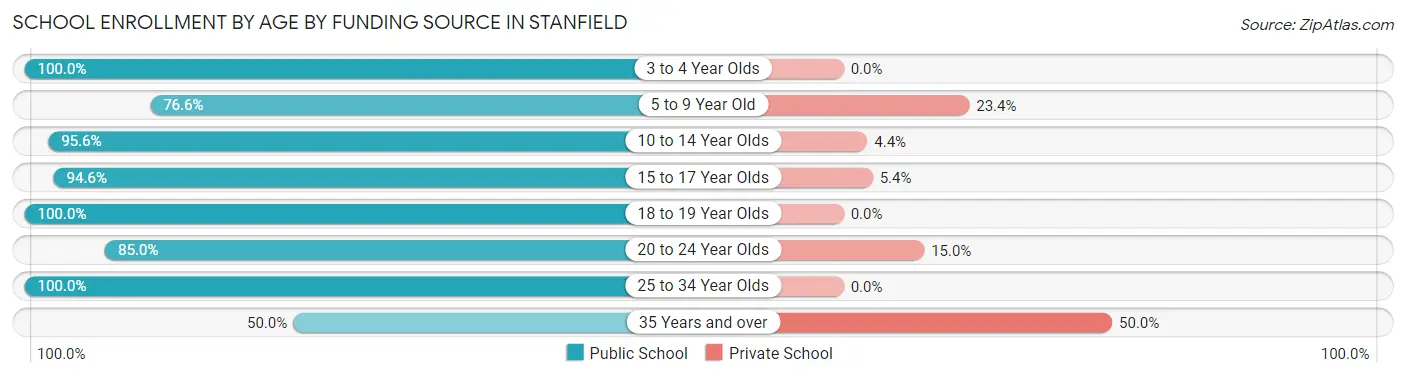
School Enrollment by Age by Funding Source in Stanfield
Out of a total of 264 students who are enrolled in schools in Stanfield, 33 (12.5%) attend a private institution, while the remaining 231 (87.5%) are enrolled in public schools. The age group of 35 years and over has the highest likelihood of being enrolled in private schools, with 3 (50.0% in the age bracket) enrolled. Conversely, the age group of 3 to 4 year olds has the lowest likelihood of being enrolled in a private school, with 1 (100.0% in the age bracket) attending a public institution.
| Age Bracket | Public School | Private School |
| 3 to 4 Year Olds | 1 (100.0%) | 0 (0.0%) |
| 5 to 9 Year Old | 72 (76.6%) | 22 (23.4%) |
| 10 to 14 Year Olds | 65 (95.6%) | 3 (4.4%) |
| 15 to 17 Year Olds | 35 (94.6%) | 2 (5.4%) |
| 18 to 19 Year Olds | 10 (100.0%) | 0 (0.0%) |
| 20 to 24 Year Olds | 17 (85.0%) | 3 (15.0%) |
| 25 to 34 Year Olds | 28 (100.0%) | 0 (0.0%) |
| 35 Years and over | 3 (50.0%) | 3 (50.0%) |
| Total | 231 (87.5%) | 33 (12.5%) |
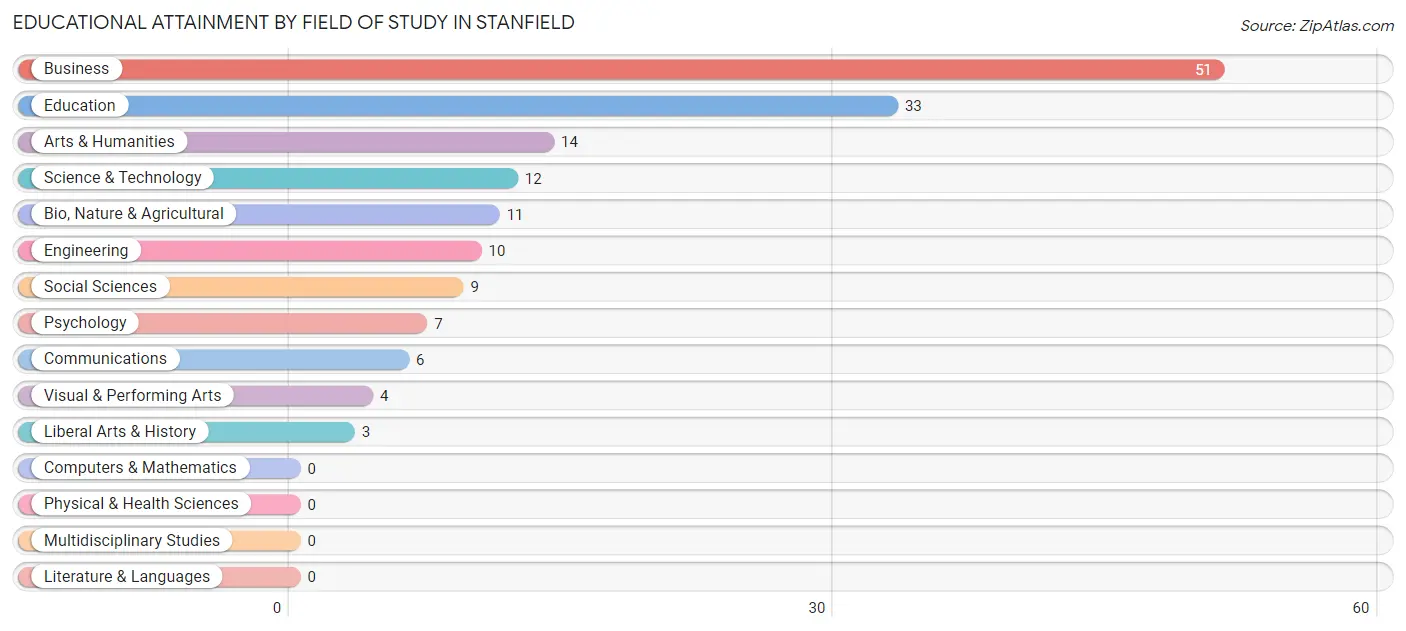
Educational Attainment by Field of Study in Stanfield
Business (51 | 31.9%), education (33 | 20.6%), arts & humanities (14 | 8.7%), science & technology (12 | 7.5%), and bio, nature & agricultural (11 | 6.9%) are the most common fields of study among 160 individuals in Stanfield who have obtained a bachelor's degree or higher.
| Field of Study | # Graduates | % Graduates |
| Computers & Mathematics | 0 | 0.0% |
| Bio, Nature & Agricultural | 11 | 6.9% |
| Physical & Health Sciences | 0 | 0.0% |
| Psychology | 7 | 4.4% |
| Social Sciences | 9 | 5.6% |
| Engineering | 10 | 6.2% |
| Multidisciplinary Studies | 0 | 0.0% |
| Science & Technology | 12 | 7.5% |
| Business | 51 | 31.9% |
| Education | 33 | 20.6% |
| Literature & Languages | 0 | 0.0% |
| Liberal Arts & History | 3 | 1.9% |
| Visual & Performing Arts | 4 | 2.5% |
| Communications | 6 | 3.7% |
| Arts & Humanities | 14 | 8.7% |
| Total | 160 | 100.0% |
Transportation & Commute in Stanfield
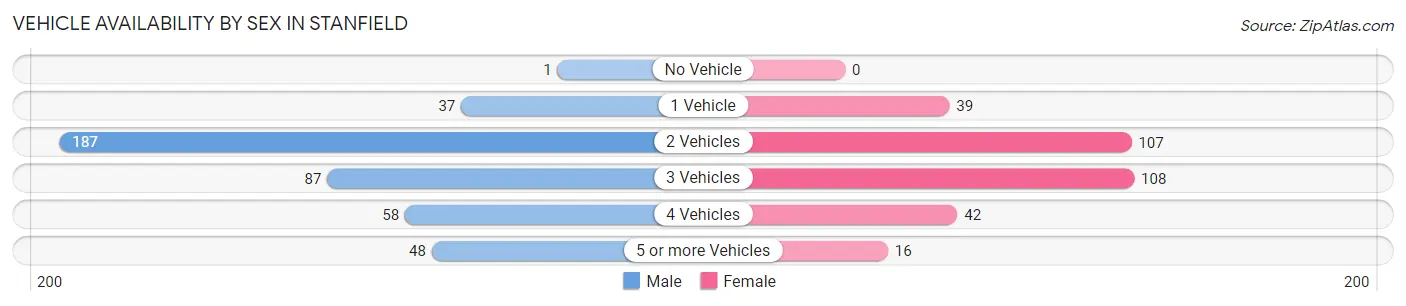
Vehicle Availability by Sex in Stanfield
The most prevalent vehicle ownership categories in Stanfield are males with 2 vehicles (187, accounting for 44.7%) and females with 2 vehicles (107, making up 59.9%).
| Vehicles Available | Male | Female |
| No Vehicle | 1 (0.2%) | 0 (0.0%) |
| 1 Vehicle | 37 (8.8%) | 39 (12.5%) |
| 2 Vehicles | 187 (44.7%) | 107 (34.3%) |
| 3 Vehicles | 87 (20.8%) | 108 (34.6%) |
| 4 Vehicles | 58 (13.9%) | 42 (13.5%) |
| 5 or more Vehicles | 48 (11.5%) | 16 (5.1%) |
| Total | 418 (100.0%) | 312 (100.0%) |
Commute Time in Stanfield
The most frequently occuring commute durations in Stanfield are 45 to 59 minutes (149 commuters, 21.9%), 5 to 9 minutes (92 commuters, 13.6%), and 30 to 34 minutes (63 commuters, 9.3%).
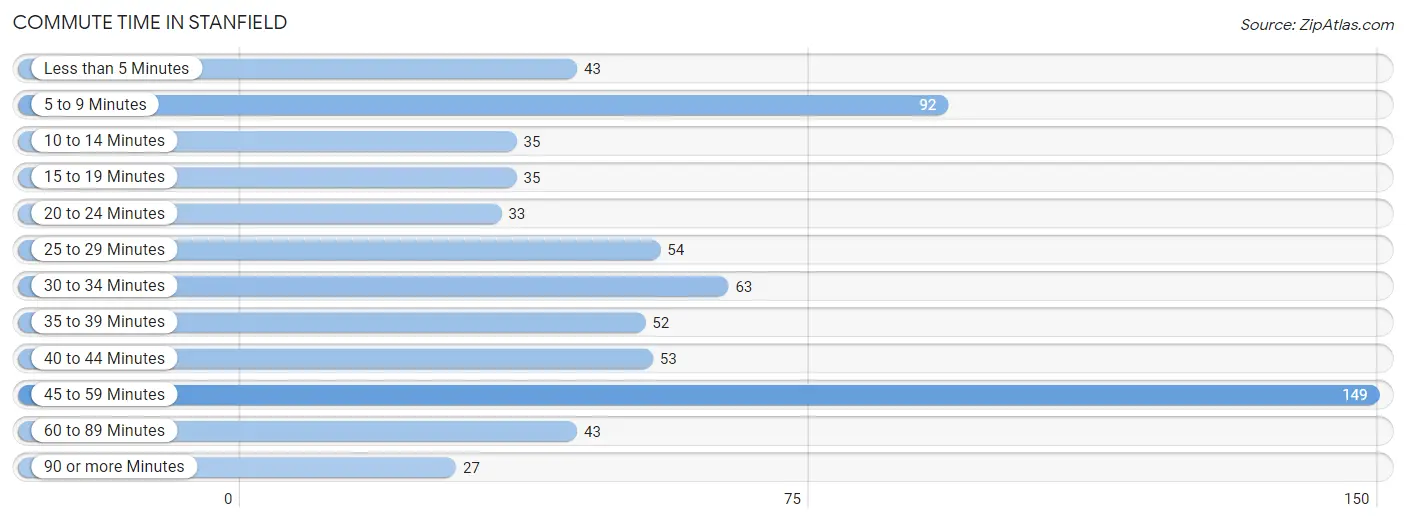
| Commute Time | # Commuters | % Commuters |
| Less than 5 Minutes | 43 | 6.3% |
| 5 to 9 Minutes | 92 | 13.6% |
| 10 to 14 Minutes | 35 | 5.1% |
| 15 to 19 Minutes | 35 | 5.1% |
| 20 to 24 Minutes | 33 | 4.9% |
| 25 to 29 Minutes | 54 | 8.0% |
| 30 to 34 Minutes | 63 | 9.3% |
| 35 to 39 Minutes | 52 | 7.7% |
| 40 to 44 Minutes | 53 | 7.8% |
| 45 to 59 Minutes | 149 | 21.9% |
| 60 to 89 Minutes | 43 | 6.3% |
| 90 or more Minutes | 27 | 4.0% |
Commute Time by Sex in Stanfield
The most common commute times in Stanfield are 45 to 59 minutes (117 commuters, 30.6%) for males and 5 to 9 minutes (40 commuters, 13.5%) for females.
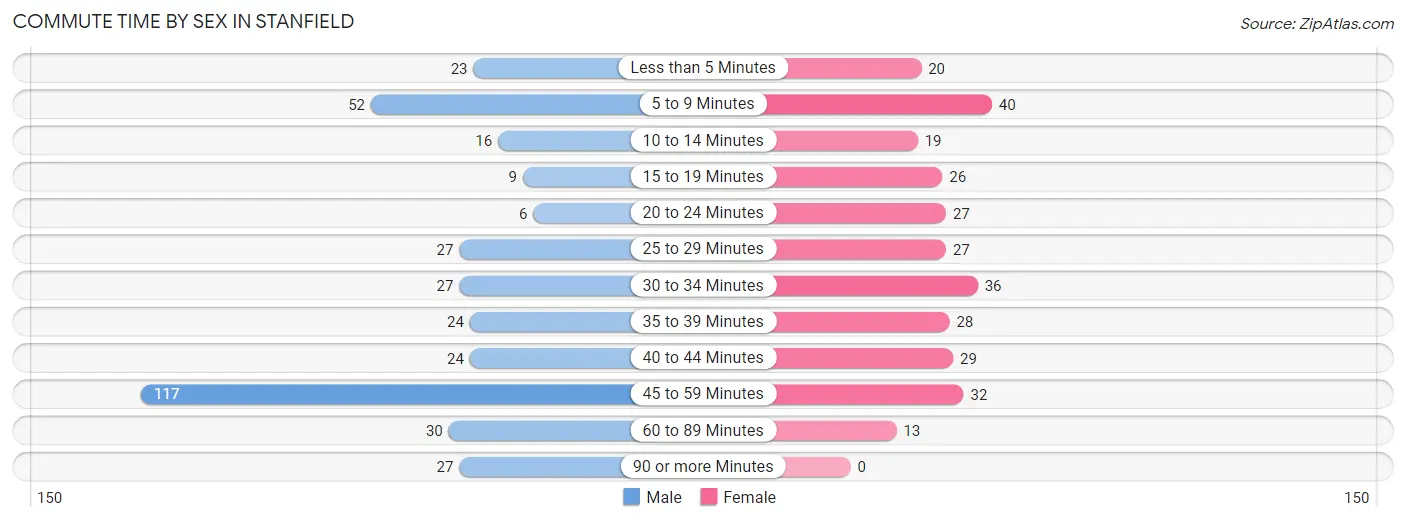
| Commute Time | Male | Female |
| Less than 5 Minutes | 23 (6.0%) | 20 (6.7%) |
| 5 to 9 Minutes | 52 (13.6%) | 40 (13.5%) |
| 10 to 14 Minutes | 16 (4.2%) | 19 (6.4%) |
| 15 to 19 Minutes | 9 (2.4%) | 26 (8.7%) |
| 20 to 24 Minutes | 6 (1.6%) | 27 (9.1%) |
| 25 to 29 Minutes | 27 (7.1%) | 27 (9.1%) |
| 30 to 34 Minutes | 27 (7.1%) | 36 (12.1%) |
| 35 to 39 Minutes | 24 (6.3%) | 28 (9.4%) |
| 40 to 44 Minutes | 24 (6.3%) | 29 (9.8%) |
| 45 to 59 Minutes | 117 (30.6%) | 32 (10.8%) |
| 60 to 89 Minutes | 30 (7.9%) | 13 (4.4%) |
| 90 or more Minutes | 27 (7.1%) | 0 (0.0%) |
Time of Departure to Work by Sex in Stanfield
The most frequent times of departure to work in Stanfield are 7:00 AM to 7:29 AM (87, 22.8%) for males and 6:30 AM to 6:59 AM (55, 18.5%) for females.
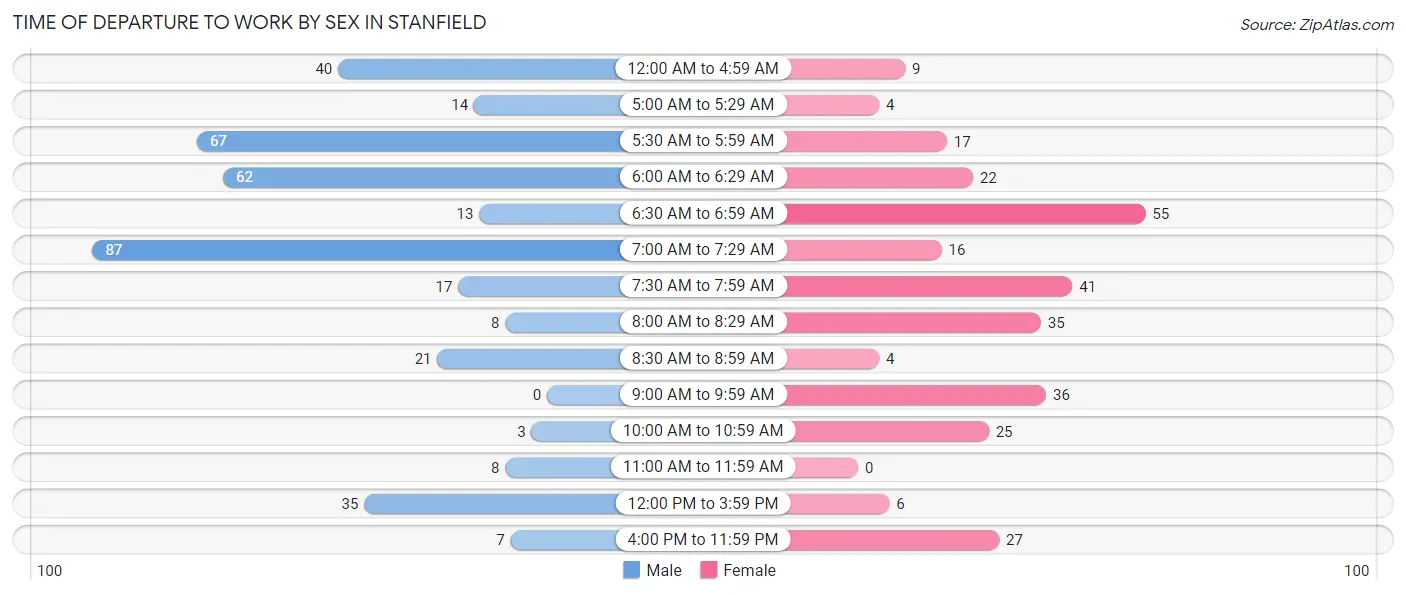
| Time of Departure | Male | Female |
| 12:00 AM to 4:59 AM | 40 (10.5%) | 9 (3.0%) |
| 5:00 AM to 5:29 AM | 14 (3.7%) | 4 (1.3%) |
| 5:30 AM to 5:59 AM | 67 (17.5%) | 17 (5.7%) |
| 6:00 AM to 6:29 AM | 62 (16.2%) | 22 (7.4%) |
| 6:30 AM to 6:59 AM | 13 (3.4%) | 55 (18.5%) |
| 7:00 AM to 7:29 AM | 87 (22.8%) | 16 (5.4%) |
| 7:30 AM to 7:59 AM | 17 (4.4%) | 41 (13.8%) |
| 8:00 AM to 8:29 AM | 8 (2.1%) | 35 (11.8%) |
| 8:30 AM to 8:59 AM | 21 (5.5%) | 4 (1.3%) |
| 9:00 AM to 9:59 AM | 0 (0.0%) | 36 (12.1%) |
| 10:00 AM to 10:59 AM | 3 (0.8%) | 25 (8.4%) |
| 11:00 AM to 11:59 AM | 8 (2.1%) | 0 (0.0%) |
| 12:00 PM to 3:59 PM | 35 (9.2%) | 6 (2.0%) |
| 4:00 PM to 11:59 PM | 7 (1.8%) | 27 (9.1%) |
| Total | 382 (100.0%) | 297 (100.0%) |
Housing Occupancy in Stanfield
Occupancy by Ownership in Stanfield
Of the total 591 dwellings in Stanfield, owner-occupied units account for 484 (81.9%), while renter-occupied units make up 107 (18.1%).
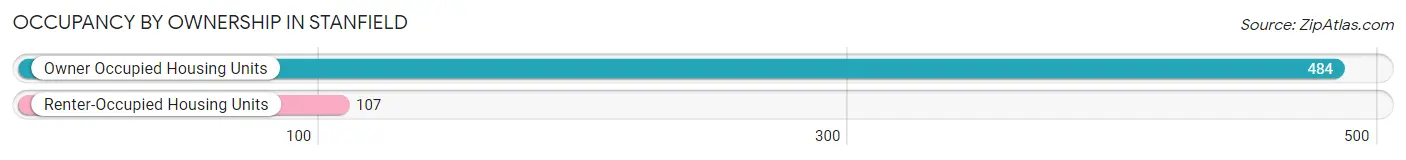
| Occupancy | # Housing Units | % Housing Units |
| Owner Occupied Housing Units | 484 | 81.9% |
| Renter-Occupied Housing Units | 107 | 18.1% |
| Total Occupied Housing Units | 591 | 100.0% |
Occupancy by Household Size in Stanfield
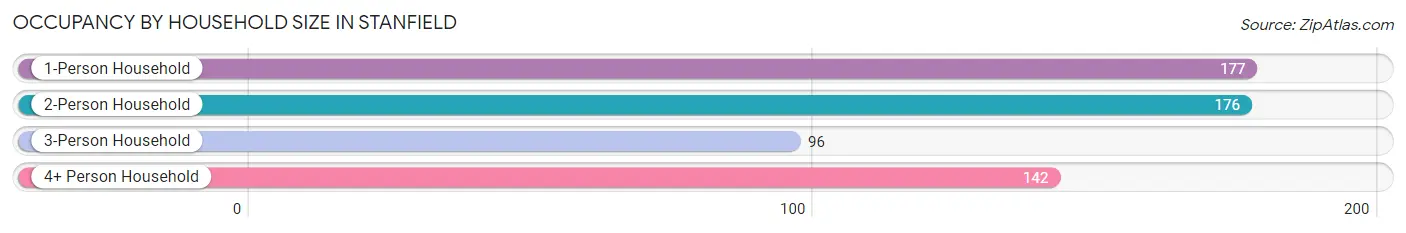
| Household Size | # Housing Units | % Housing Units |
| 1-Person Household | 177 | 29.9% |
| 2-Person Household | 176 | 29.8% |
| 3-Person Household | 96 | 16.2% |
| 4+ Person Household | 142 | 24.0% |
| Total Housing Units | 591 | 100.0% |
Occupancy by Ownership by Household Size in Stanfield
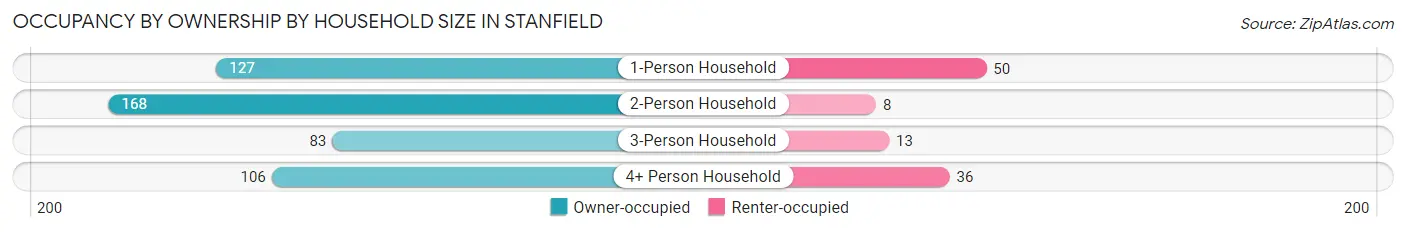
| Household Size | Owner-occupied | Renter-occupied |
| 1-Person Household | 127 (71.8%) | 50 (28.2%) |
| 2-Person Household | 168 (95.5%) | 8 (4.5%) |
| 3-Person Household | 83 (86.5%) | 13 (13.5%) |
| 4+ Person Household | 106 (74.7%) | 36 (25.4%) |
| Total Housing Units | 484 (81.9%) | 107 (18.1%) |
Occupancy by Educational Attainment in Stanfield
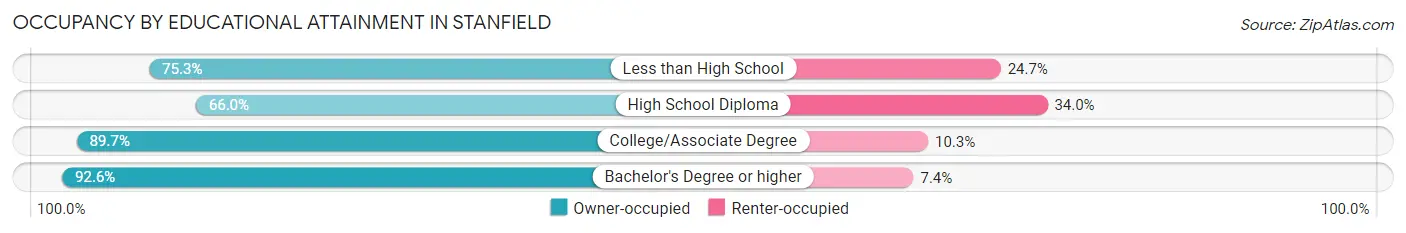
| Household Size | Owner-occupied | Renter-occupied |
| Less than High School | 61 (75.3%) | 20 (24.7%) |
| High School Diploma | 105 (66.0%) | 54 (34.0%) |
| College/Associate Degree | 218 (89.7%) | 25 (10.3%) |
| Bachelor's Degree or higher | 100 (92.6%) | 8 (7.4%) |
Occupancy by Age of Householder in Stanfield
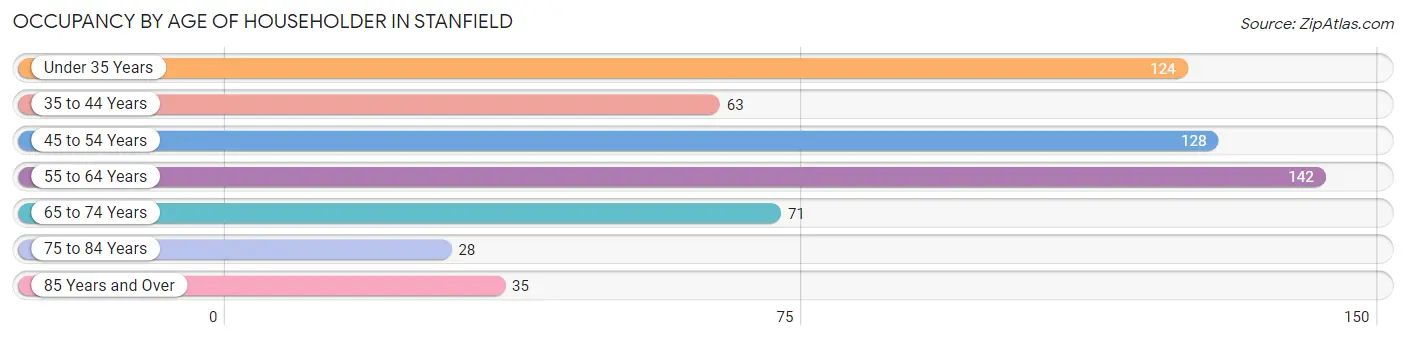
| Age Bracket | # Households | % Households |
| Under 35 Years | 124 | 21.0% |
| 35 to 44 Years | 63 | 10.7% |
| 45 to 54 Years | 128 | 21.7% |
| 55 to 64 Years | 142 | 24.0% |
| 65 to 74 Years | 71 | 12.0% |
| 75 to 84 Years | 28 | 4.7% |
| 85 Years and Over | 35 | 5.9% |
| Total | 591 | 100.0% |
Housing Finances in Stanfield
Median Income by Occupancy in Stanfield
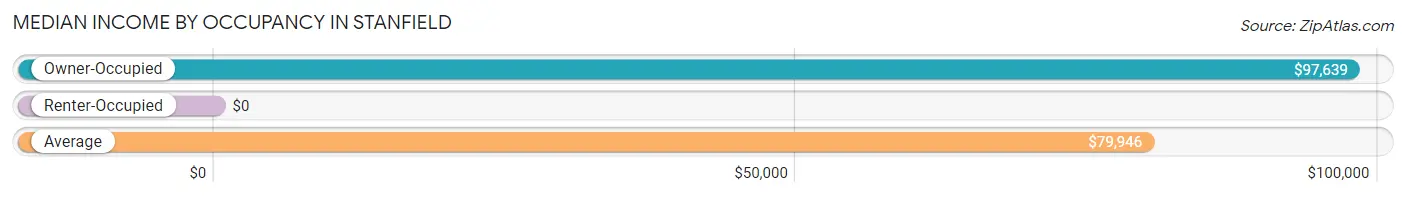
| Occupancy Type | # Households | Median Income |
| Owner-Occupied | 484 (81.9%) | $97,639 |
| Renter-Occupied | 107 (18.1%) | $0 |
| Average | 591 (100.0%) | $79,946 |
Occupancy by Householder Income Bracket in Stanfield
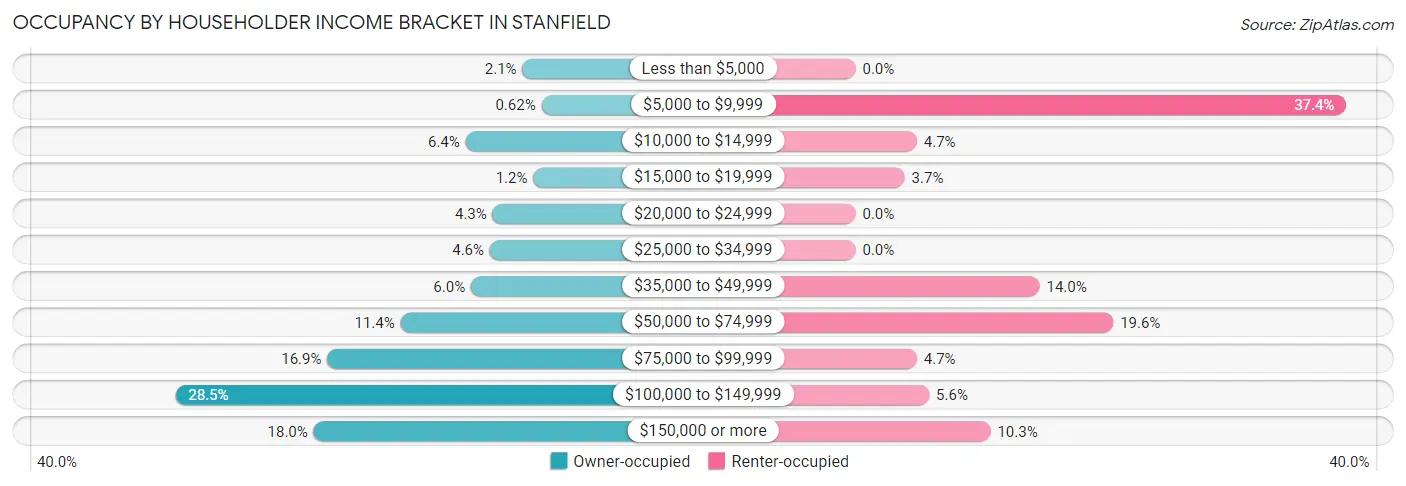
| Income Bracket | Owner-occupied | Renter-occupied |
| Less than $5,000 | 10 (2.1%) | 0 (0.0%) |
| $5,000 to $9,999 | 3 (0.6%) | 40 (37.4%) |
| $10,000 to $14,999 | 31 (6.4%) | 5 (4.7%) |
| $15,000 to $19,999 | 6 (1.2%) | 4 (3.7%) |
| $20,000 to $24,999 | 21 (4.3%) | 0 (0.0%) |
| $25,000 to $34,999 | 22 (4.5%) | 0 (0.0%) |
| $35,000 to $49,999 | 29 (6.0%) | 15 (14.0%) |
| $50,000 to $74,999 | 55 (11.4%) | 21 (19.6%) |
| $75,000 to $99,999 | 82 (16.9%) | 5 (4.7%) |
| $100,000 to $149,999 | 138 (28.5%) | 6 (5.6%) |
| $150,000 or more | 87 (18.0%) | 11 (10.3%) |
| Total | 484 (100.0%) | 107 (100.0%) |
Monthly Housing Cost Tiers in Stanfield
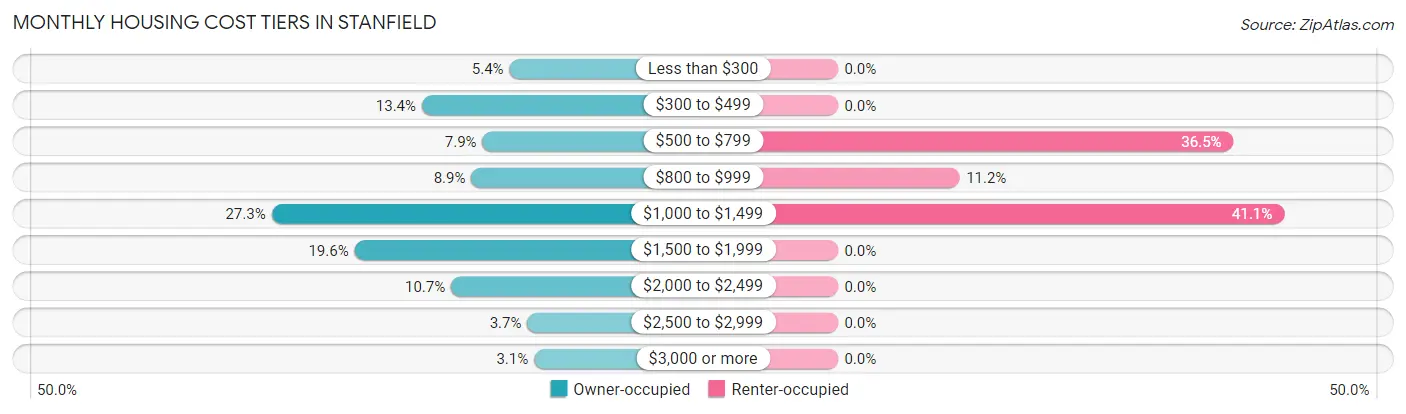
| Monthly Cost | Owner-occupied | Renter-occupied |
| Less than $300 | 26 (5.4%) | 0 (0.0%) |
| $300 to $499 | 65 (13.4%) | 0 (0.0%) |
| $500 to $799 | 38 (7.9%) | 39 (36.4%) |
| $800 to $999 | 43 (8.9%) | 12 (11.2%) |
| $1,000 to $1,499 | 132 (27.3%) | 44 (41.1%) |
| $1,500 to $1,999 | 95 (19.6%) | 0 (0.0%) |
| $2,000 to $2,499 | 52 (10.7%) | 0 (0.0%) |
| $2,500 to $2,999 | 18 (3.7%) | 0 (0.0%) |
| $3,000 or more | 15 (3.1%) | 0 (0.0%) |
| Total | 484 (100.0%) | 107 (100.0%) |
Physical Housing Characteristics in Stanfield
Housing Structures in Stanfield
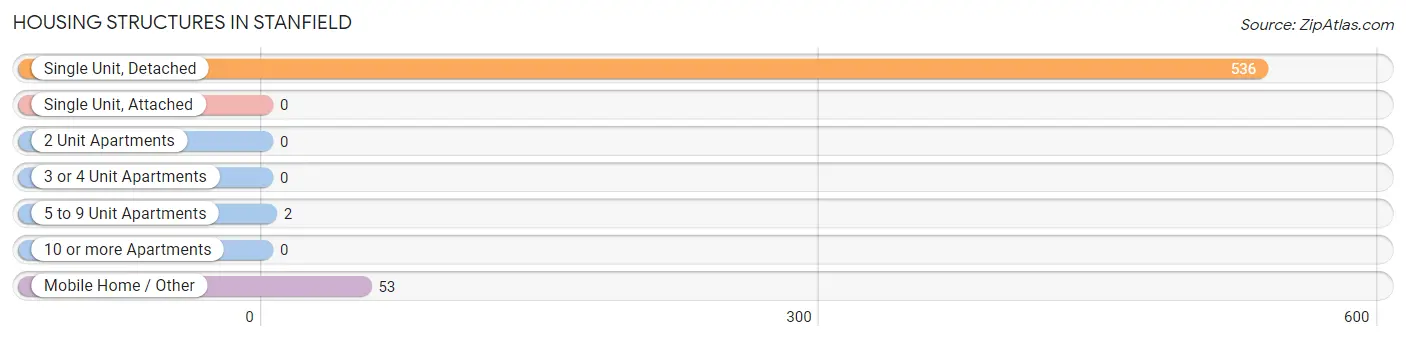
| Structure Type | # Housing Units | % Housing Units |
| Single Unit, Detached | 536 | 90.7% |
| Single Unit, Attached | 0 | 0.0% |
| 2 Unit Apartments | 0 | 0.0% |
| 3 or 4 Unit Apartments | 0 | 0.0% |
| 5 to 9 Unit Apartments | 2 | 0.3% |
| 10 or more Apartments | 0 | 0.0% |
| Mobile Home / Other | 53 | 9.0% |
| Total | 591 | 100.0% |
Housing Structures by Occupancy in Stanfield
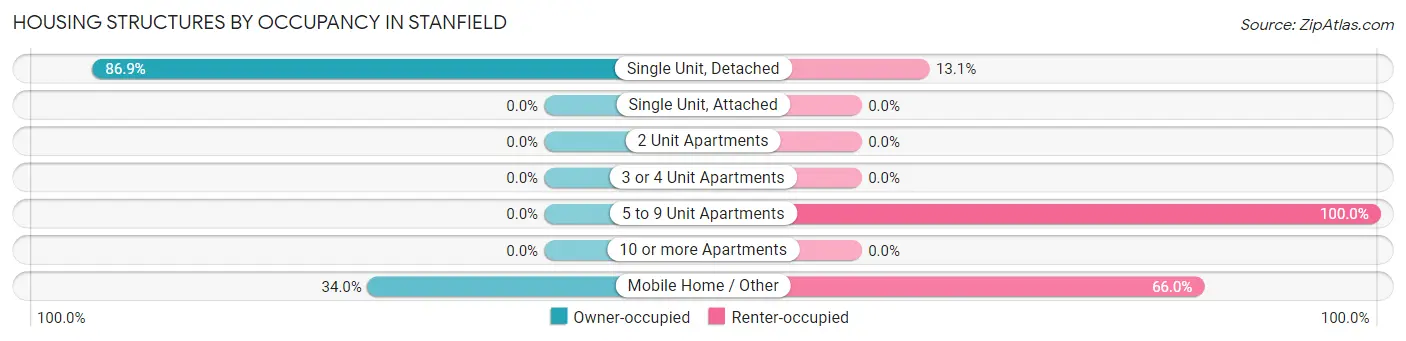
| Structure Type | Owner-occupied | Renter-occupied |
| Single Unit, Detached | 466 (86.9%) | 70 (13.1%) |
| Single Unit, Attached | 0 (0.0%) | 0 (0.0%) |
| 2 Unit Apartments | 0 (0.0%) | 0 (0.0%) |
| 3 or 4 Unit Apartments | 0 (0.0%) | 0 (0.0%) |
| 5 to 9 Unit Apartments | 0 (0.0%) | 2 (100.0%) |
| 10 or more Apartments | 0 (0.0%) | 0 (0.0%) |
| Mobile Home / Other | 18 (34.0%) | 35 (66.0%) |
| Total | 484 (81.9%) | 107 (18.1%) |
Housing Structures by Number of Rooms in Stanfield
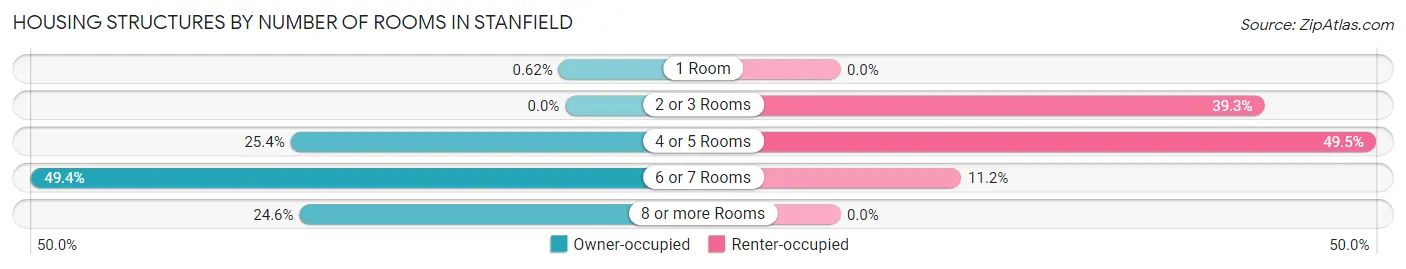
| Number of Rooms | Owner-occupied | Renter-occupied |
| 1 Room | 3 (0.6%) | 0 (0.0%) |
| 2 or 3 Rooms | 0 (0.0%) | 42 (39.3%) |
| 4 or 5 Rooms | 123 (25.4%) | 53 (49.5%) |
| 6 or 7 Rooms | 239 (49.4%) | 12 (11.2%) |
| 8 or more Rooms | 119 (24.6%) | 0 (0.0%) |
| Total | 484 (100.0%) | 107 (100.0%) |
Housing Structure by Heating Type in Stanfield
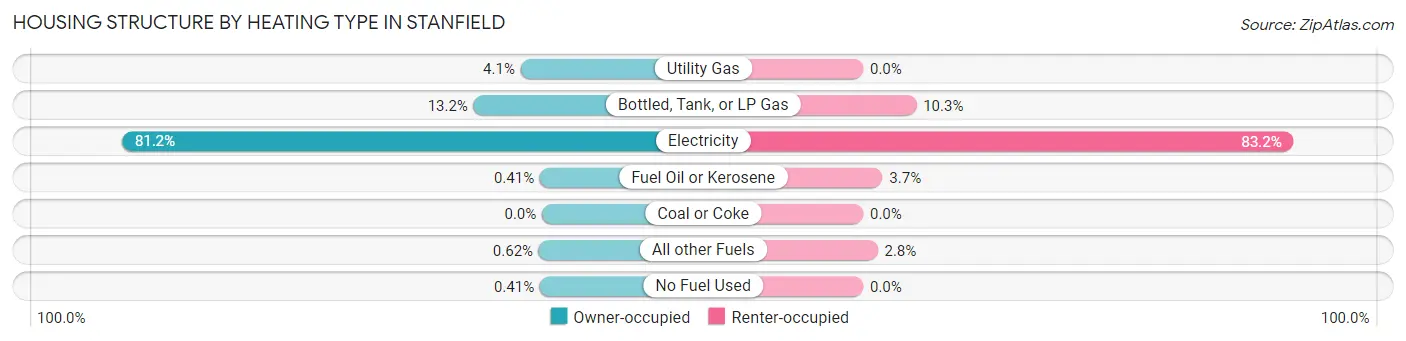
| Heating Type | Owner-occupied | Renter-occupied |
| Utility Gas | 20 (4.1%) | 0 (0.0%) |
| Bottled, Tank, or LP Gas | 64 (13.2%) | 11 (10.3%) |
| Electricity | 393 (81.2%) | 89 (83.2%) |
| Fuel Oil or Kerosene | 2 (0.4%) | 4 (3.7%) |
| Coal or Coke | 0 (0.0%) | 0 (0.0%) |
| All other Fuels | 3 (0.6%) | 3 (2.8%) |
| No Fuel Used | 2 (0.4%) | 0 (0.0%) |
| Total | 484 (100.0%) | 107 (100.0%) |
Household Vehicle Usage in Stanfield
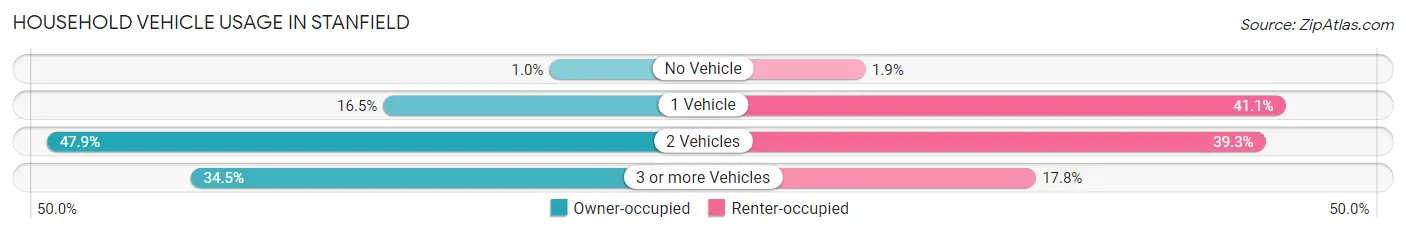
| Vehicles per Household | Owner-occupied | Renter-occupied |
| No Vehicle | 5 (1.0%) | 2 (1.9%) |
| 1 Vehicle | 80 (16.5%) | 44 (41.1%) |
| 2 Vehicles | 232 (47.9%) | 42 (39.3%) |
| 3 or more Vehicles | 167 (34.5%) | 19 (17.8%) |
| Total | 484 (100.0%) | 107 (100.0%) |
Real Estate & Mortgages in Stanfield
Real Estate and Mortgage Overview in Stanfield
| Characteristic | Without Mortgage | With Mortgage |
| Housing Units | 147 | 337 |
| Median Property Value | $267,500 | $278,700 |
| Median Household Income | $69,583 | $67 |
| Monthly Housing Costs | $433 | $15 |
| Real Estate Taxes | $1,523 | $0 |
Property Value by Mortgage Status in Stanfield
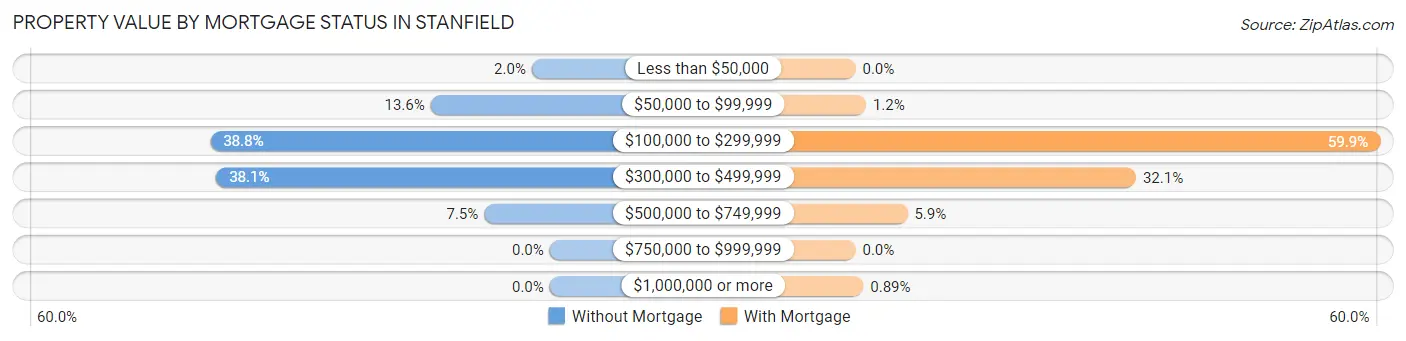
| Property Value | Without Mortgage | With Mortgage |
| Less than $50,000 | 3 (2.0%) | 0 (0.0%) |
| $50,000 to $99,999 | 20 (13.6%) | 4 (1.2%) |
| $100,000 to $299,999 | 57 (38.8%) | 202 (59.9%) |
| $300,000 to $499,999 | 56 (38.1%) | 108 (32.1%) |
| $500,000 to $749,999 | 11 (7.5%) | 20 (5.9%) |
| $750,000 to $999,999 | 0 (0.0%) | 0 (0.0%) |
| $1,000,000 or more | 0 (0.0%) | 3 (0.9%) |
| Total | 147 (100.0%) | 337 (100.0%) |
Household Income by Mortgage Status in Stanfield
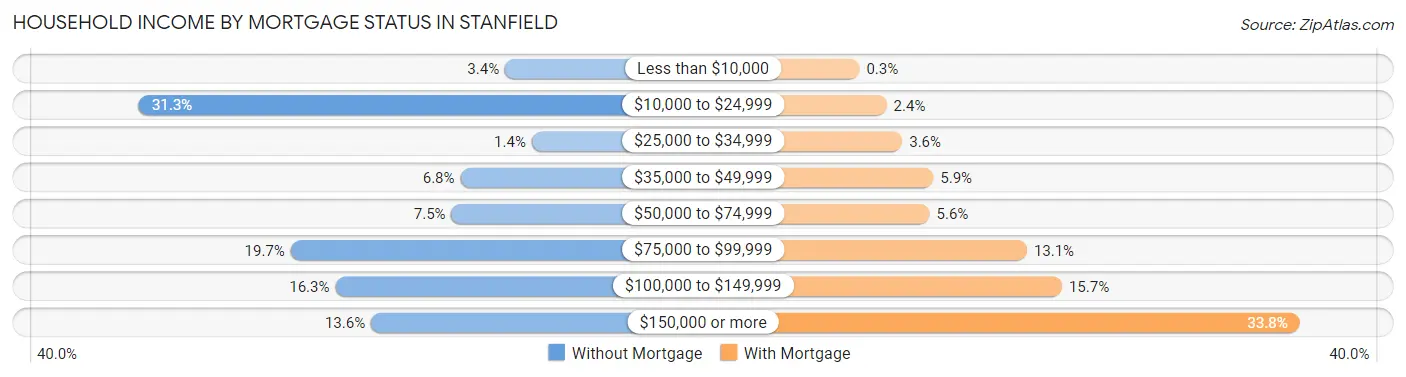
| Household Income | Without Mortgage | With Mortgage |
| Less than $10,000 | 5 (3.4%) | 1 (0.3%) |
| $10,000 to $24,999 | 46 (31.3%) | 8 (2.4%) |
| $25,000 to $34,999 | 2 (1.4%) | 12 (3.6%) |
| $35,000 to $49,999 | 10 (6.8%) | 20 (5.9%) |
| $50,000 to $74,999 | 11 (7.5%) | 19 (5.6%) |
| $75,000 to $99,999 | 29 (19.7%) | 44 (13.1%) |
| $100,000 to $149,999 | 24 (16.3%) | 53 (15.7%) |
| $150,000 or more | 20 (13.6%) | 114 (33.8%) |
| Total | 147 (100.0%) | 337 (100.0%) |
Property Value to Household Income Ratio in Stanfield
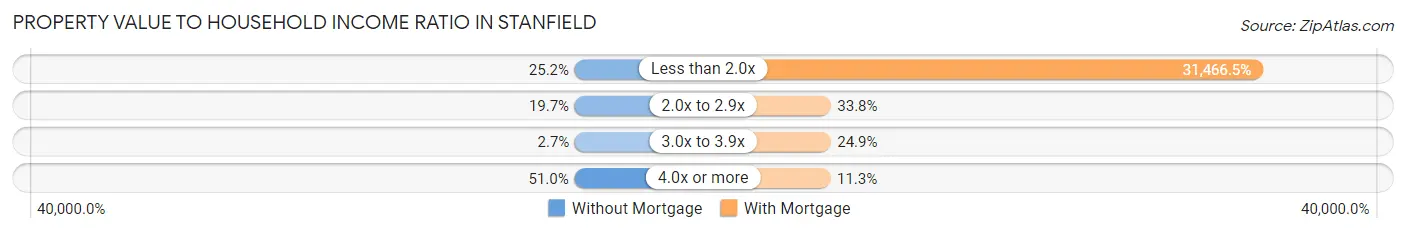
| Value-to-Income Ratio | Without Mortgage | With Mortgage |
| Less than 2.0x | 37 (25.2%) | 106,042 (31,466.5%) |
| 2.0x to 2.9x | 29 (19.7%) | 114 (33.8%) |
| 3.0x to 3.9x | 4 (2.7%) | 84 (24.9%) |
| 4.0x or more | 75 (51.0%) | 38 (11.3%) |
| Total | 147 (100.0%) | 337 (100.0%) |
Real Estate Taxes by Mortgage Status in Stanfield
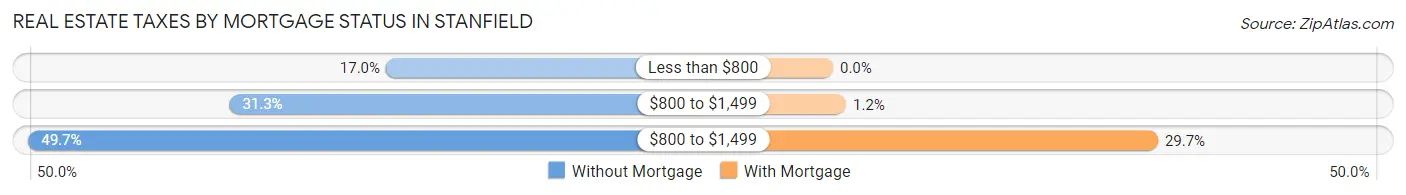
| Property Taxes | Without Mortgage | With Mortgage |
| Less than $800 | 25 (17.0%) | 0 (0.0%) |
| $800 to $1,499 | 46 (31.3%) | 4 (1.2%) |
| $800 to $1,499 | 73 (49.7%) | 100 (29.7%) |
| Total | 147 (100.0%) | 337 (100.0%) |
Health & Disability in Stanfield
Health Insurance Coverage by Age in Stanfield
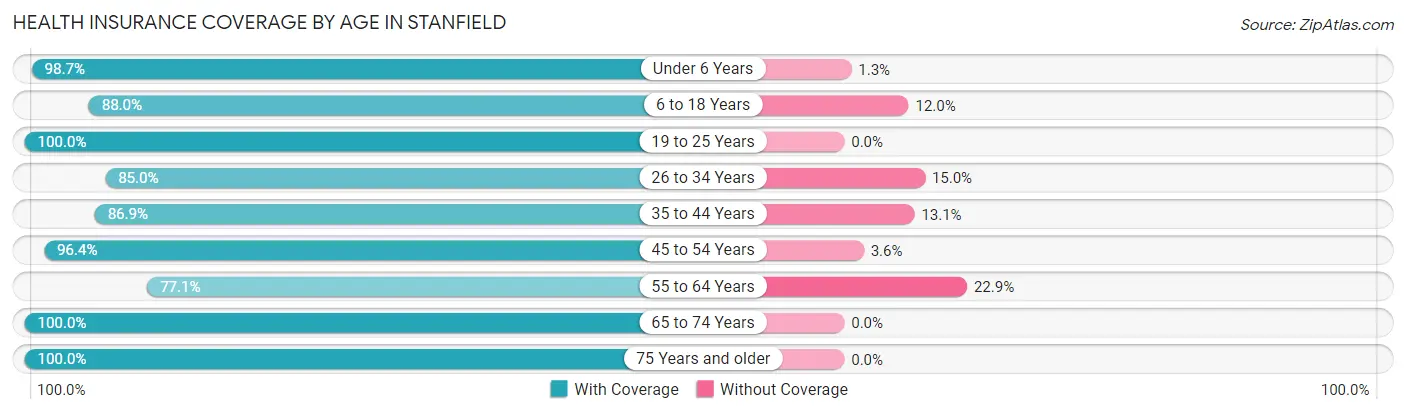
| Age Bracket | With Coverage | Without Coverage |
| Under 6 Years | 149 (98.7%) | 2 (1.3%) |
| 6 to 18 Years | 169 (88.0%) | 23 (12.0%) |
| 19 to 25 Years | 103 (100.0%) | 0 (0.0%) |
| 26 to 34 Years | 192 (85.0%) | 34 (15.0%) |
| 35 to 44 Years | 113 (86.9%) | 17 (13.1%) |
| 45 to 54 Years | 213 (96.4%) | 8 (3.6%) |
| 55 to 64 Years | 182 (77.1%) | 54 (22.9%) |
| 65 to 74 Years | 110 (100.0%) | 0 (0.0%) |
| 75 Years and older | 94 (100.0%) | 0 (0.0%) |
| Total | 1,325 (90.6%) | 138 (9.4%) |
Health Insurance Coverage by Citizenship Status in Stanfield
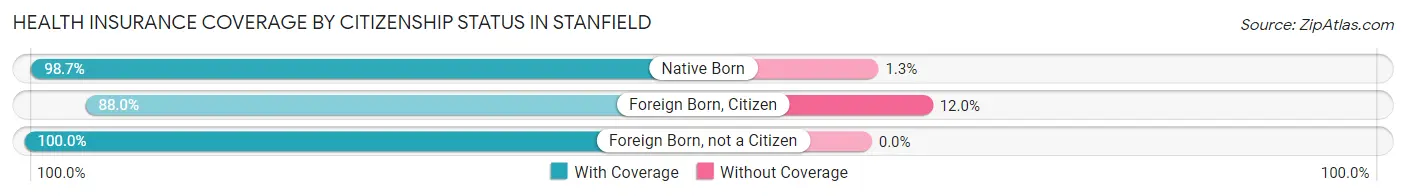
| Citizenship Status | With Coverage | Without Coverage |
| Native Born | 149 (98.7%) | 2 (1.3%) |
| Foreign Born, Citizen | 169 (88.0%) | 23 (12.0%) |
| Foreign Born, not a Citizen | 103 (100.0%) | 0 (0.0%) |
Health Insurance Coverage by Household Income in Stanfield
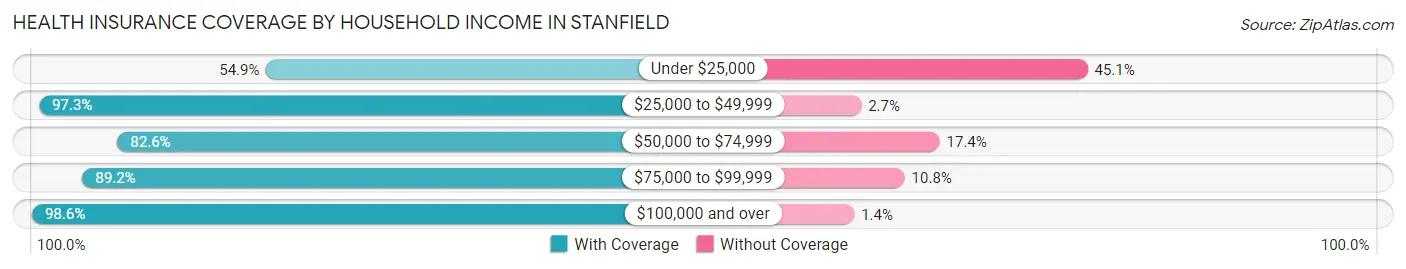
| Household Income | With Coverage | Without Coverage |
| Under $25,000 | 84 (54.9%) | 69 (45.1%) |
| $25,000 to $49,999 | 144 (97.3%) | 4 (2.7%) |
| $50,000 to $74,999 | 171 (82.6%) | 36 (17.4%) |
| $75,000 to $99,999 | 148 (89.2%) | 18 (10.8%) |
| $100,000 and over | 778 (98.6%) | 11 (1.4%) |
Public vs Private Health Insurance Coverage by Age in Stanfield
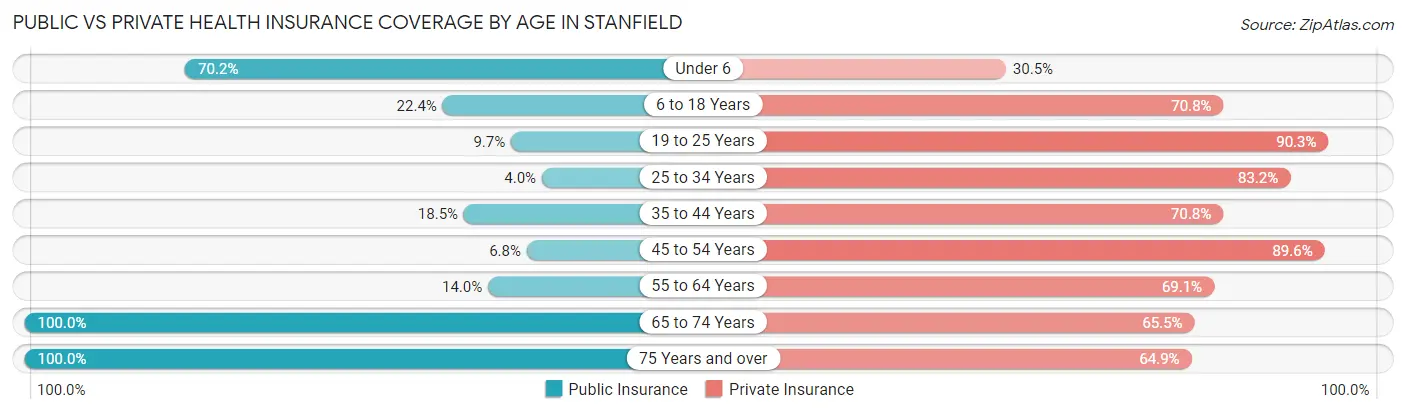
| Age Bracket | Public Insurance | Private Insurance |
| Under 6 | 106 (70.2%) | 46 (30.5%) |
| 6 to 18 Years | 43 (22.4%) | 136 (70.8%) |
| 19 to 25 Years | 10 (9.7%) | 93 (90.3%) |
| 25 to 34 Years | 9 (4.0%) | 188 (83.2%) |
| 35 to 44 Years | 24 (18.5%) | 92 (70.8%) |
| 45 to 54 Years | 15 (6.8%) | 198 (89.6%) |
| 55 to 64 Years | 33 (14.0%) | 163 (69.1%) |
| 65 to 74 Years | 110 (100.0%) | 72 (65.4%) |
| 75 Years and over | 94 (100.0%) | 61 (64.9%) |
| Total | 444 (30.3%) | 1,049 (71.7%) |
Disability Status by Sex by Age in Stanfield
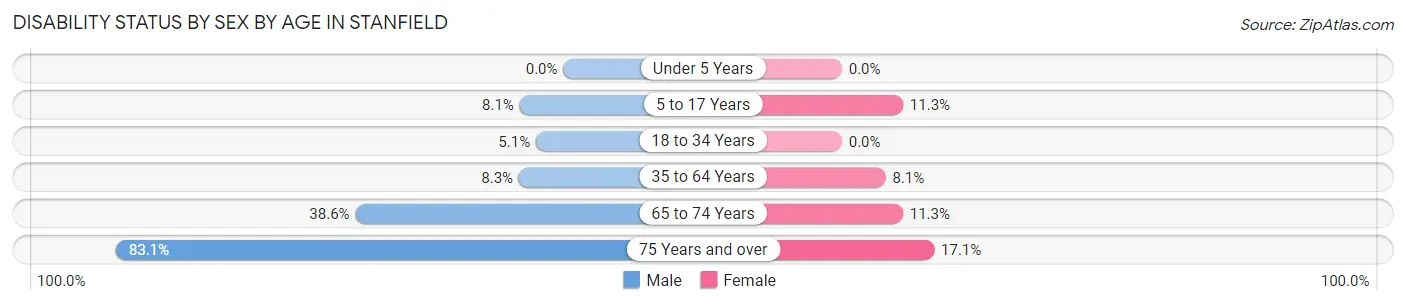
| Age Bracket | Male | Female |
| Under 5 Years | 0 (0.0%) | 0 (0.0%) |
| 5 to 17 Years | 9 (8.1%) | 11 (11.3%) |
| 18 to 34 Years | 9 (5.1%) | 0 (0.0%) |
| 35 to 64 Years | 25 (8.3%) | 23 (8.1%) |
| 65 to 74 Years | 22 (38.6%) | 6 (11.3%) |
| 75 Years and over | 49 (83.1%) | 6 (17.1%) |
Disability Class by Sex by Age in Stanfield
Disability Class: Hearing Difficulty
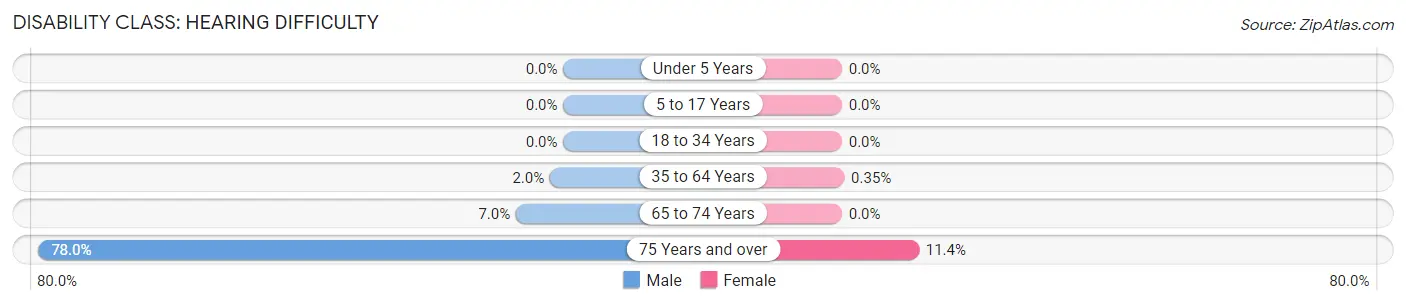
| Age Bracket | Male | Female |
| Under 5 Years | 0 (0.0%) | 0 (0.0%) |
| 5 to 17 Years | 0 (0.0%) | 0 (0.0%) |
| 18 to 34 Years | 0 (0.0%) | 0 (0.0%) |
| 35 to 64 Years | 6 (2.0%) | 1 (0.4%) |
| 65 to 74 Years | 4 (7.0%) | 0 (0.0%) |
| 75 Years and over | 46 (78.0%) | 4 (11.4%) |
Disability Class: Vision Difficulty
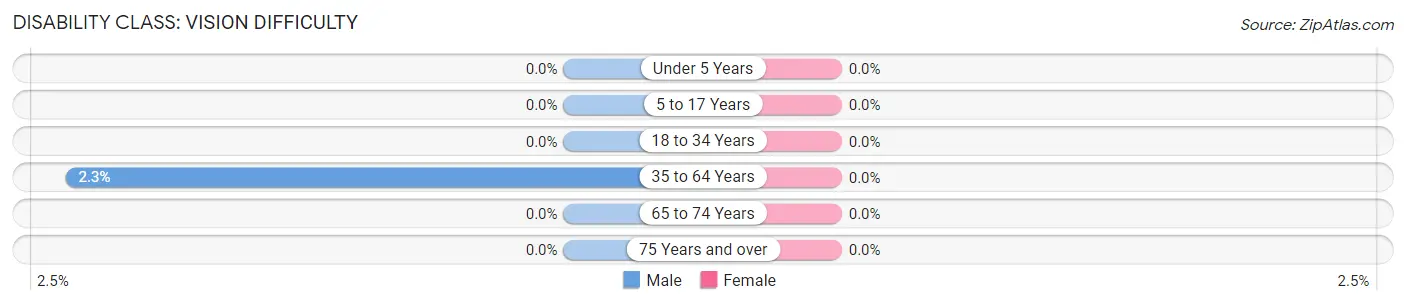
| Age Bracket | Male | Female |
| Under 5 Years | 0 (0.0%) | 0 (0.0%) |
| 5 to 17 Years | 0 (0.0%) | 0 (0.0%) |
| 18 to 34 Years | 0 (0.0%) | 0 (0.0%) |
| 35 to 64 Years | 7 (2.3%) | 0 (0.0%) |
| 65 to 74 Years | 0 (0.0%) | 0 (0.0%) |
| 75 Years and over | 0 (0.0%) | 0 (0.0%) |
Disability Class: Cognitive Difficulty
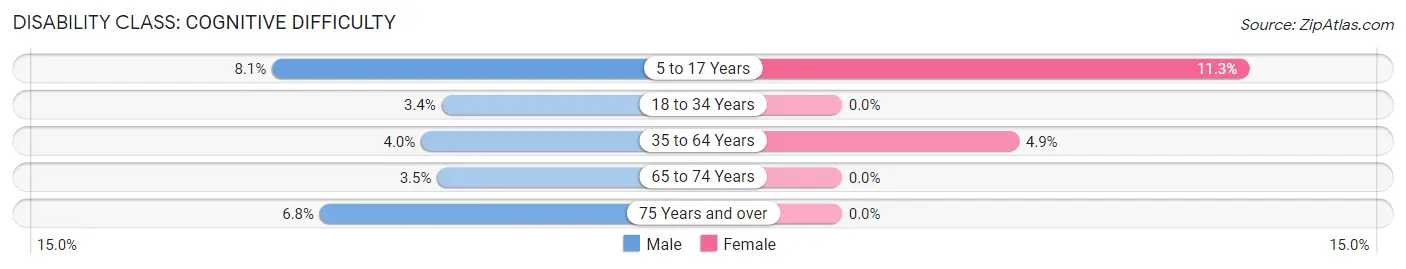
| Age Bracket | Male | Female |
| 5 to 17 Years | 9 (8.1%) | 11 (11.3%) |
| 18 to 34 Years | 6 (3.4%) | 0 (0.0%) |
| 35 to 64 Years | 12 (4.0%) | 14 (4.9%) |
| 65 to 74 Years | 2 (3.5%) | 0 (0.0%) |
| 75 Years and over | 4 (6.8%) | 0 (0.0%) |
Disability Class: Ambulatory Difficulty
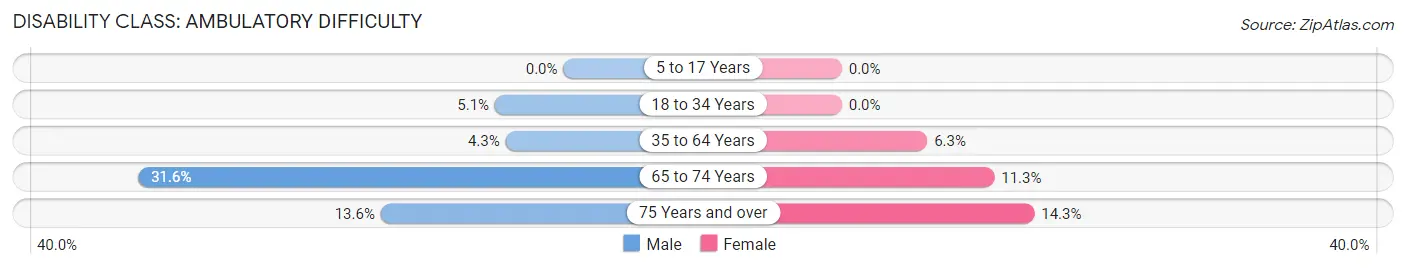
| Age Bracket | Male | Female |
| 5 to 17 Years | 0 (0.0%) | 0 (0.0%) |
| 18 to 34 Years | 9 (5.1%) | 0 (0.0%) |
| 35 to 64 Years | 13 (4.3%) | 18 (6.3%) |
| 65 to 74 Years | 18 (31.6%) | 6 (11.3%) |
| 75 Years and over | 8 (13.6%) | 5 (14.3%) |
Disability Class: Self-Care Difficulty
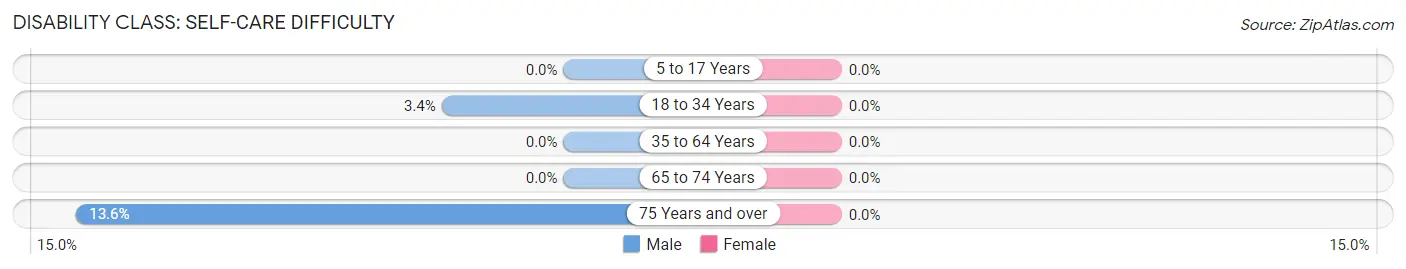
| Age Bracket | Male | Female |
| 5 to 17 Years | 0 (0.0%) | 0 (0.0%) |
| 18 to 34 Years | 6 (3.4%) | 0 (0.0%) |
| 35 to 64 Years | 0 (0.0%) | 0 (0.0%) |
| 65 to 74 Years | 0 (0.0%) | 0 (0.0%) |
| 75 Years and over | 8 (13.6%) | 0 (0.0%) |
Technology Access in Stanfield
Computing Device Access in Stanfield
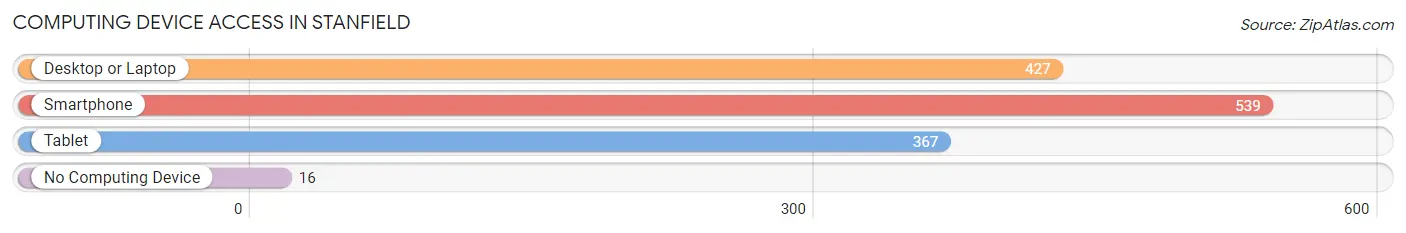
| Device Type | # Households | % Households |
| Desktop or Laptop | 427 | 72.3% |
| Smartphone | 539 | 91.2% |
| Tablet | 367 | 62.1% |
| No Computing Device | 16 | 2.7% |
| Total | 591 | 100.0% |
Internet Access in Stanfield
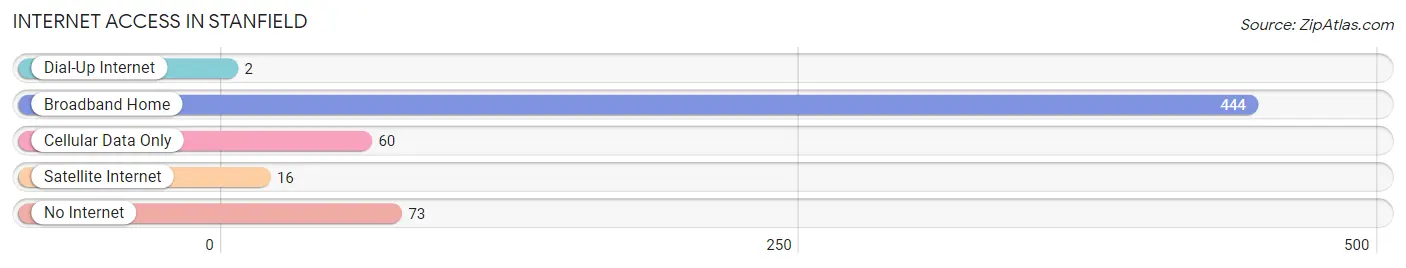
| Internet Type | # Households | % Households |
| Dial-Up Internet | 2 | 0.3% |
| Broadband Home | 444 | 75.1% |
| Cellular Data Only | 60 | 10.2% |
| Satellite Internet | 16 | 2.7% |
| No Internet | 73 | 12.3% |
| Total | 591 | 100.0% |
Stanfield Summary
Stanfield, North Carolina is a small town located in Stanly County, North Carolina. It is situated in the Piedmont region of the state, approximately 30 miles east of Charlotte. The town was founded in 1887 and has a population of approximately 1,500 people.
Geography
Stanfield is located in the Piedmont region of North Carolina, which is characterized by rolling hills and flat plains. The town is situated on the banks of the Yadkin River, which is a major tributary of the Catawba River. The town is located in the foothills of the Uwharrie Mountains, which are the oldest mountain range in North America. The town is also located near the Uwharrie National Forest, which is a popular destination for outdoor recreation.
The climate in Stanfield is humid subtropical, with hot summers and mild winters. The average annual temperature is around 60 degrees Fahrenheit, with an average high of around 80 degrees in the summer and an average low of around 40 degrees in the winter. The town receives an average of around 45 inches of precipitation per year, with most of it falling in the summer months.
Economy
The economy of Stanfield is largely based on agriculture and manufacturing. The town is home to several large farms, which produce a variety of crops including corn, soybeans, wheat, and tobacco. The town is also home to several manufacturing companies, which produce a variety of products including furniture, textiles, and automotive parts.
The town is also home to several small businesses, including restaurants, retail stores, and service providers. The town is also home to a small airport, which serves the surrounding area.
Demographics
As of the 2010 census, the population of Stanfield was 1,500 people. The racial makeup of the town was 94.7% White, 2.7% African American, 0.7% Native American, 0.3% Asian, and 1.6% from other races. The median household income was $37,500, and the median family income was $45,000.
The town is served by the Stanly County School District, which includes two elementary schools, one middle school, and one high school. The town is also home to a branch of the Stanly Community College.
Conclusion
Stanfield, North Carolina is a small town located in Stanly County, North Carolina. It is situated in the Piedmont region of the state, approximately 30 miles east of Charlotte. The town was founded in 1887 and has a population of approximately 1,500 people. The economy of Stanfield is largely based on agriculture and manufacturing, and the town is home to several small businesses. The racial makeup of the town is 94.7% White, 2.7% African American, 0.7% Native American, 0.3% Asian, and 1.6% from other races. The median household income was $37,500, and the median family income was $45,000. The town is served by the Stanly County School District, which includes two elementary schools, one middle school, and one high school. The town is also home to a branch of the Stanly Community College.
Common Questions
What is the Total Population of Stanfield?
Total Population of Stanfield is 1,463.
What is the Total Male Population of Stanfield?
Total Male Population of Stanfield is 764.
What is the Total Female Population of Stanfield?
Total Female Population of Stanfield is 699.
What is the Ratio of Males per 100 Females in Stanfield?
There are 109.30 Males per 100 Females in Stanfield.
What is the Ratio of Females per 100 Males in Stanfield?
There are 91.49 Females per 100 Males in Stanfield.
What is the Median Population Age in Stanfield?
Median Population Age in Stanfield is 38.0 Years.
What is the Average Family Size in Stanfield
Average Family Size in Stanfield is 3.0 People.
What is the Average Household Size in Stanfield
Average Household Size in Stanfield is 2.5 People.
What is Per Capita Income in Stanfield?
Per Capita income in Stanfield is $39,027.
What is the Median Family Income in Stanfield?
Median Family Income in Stanfield is $104,018.
What is the Median Household income in Stanfield?
Median Household Income in Stanfield is $79,946.
What is Income or Wage Gap in Stanfield?
Income or Wage Gap in Stanfield is 36.7%.
Women in Stanfield earn 63.3 cents for every dollar earned by a man.
What is Inequality or Gini Index in Stanfield?
Inequality or Gini Index in Stanfield is 0.44.
How Large is the Labor Force in Stanfield?
There are 820 People in the Labor Forcein in Stanfield.
What is the Percentage of People in the Labor Force in Stanfield?
72.6% of People are in the Labor Force in Stanfield.
What is the Unemployment Rate in Stanfield?
Unemployment Rate in Stanfield is 9.1%.