Skippers Corner, NC
Skippers Corner Map
Skippers Corner Overview
3,599
TOTAL POPULATION
1,957
MALE POPULATION
1,642
FEMALE POPULATION
119.18
MALES / 100 FEMALES
83.90
FEMALES / 100 MALES
40.2
MEDIAN AGE
3.0
AVG FAMILY SIZE
2.5
AVG HOUSEHOLD SIZE
$27,928
PER CAPITA INCOME
$59,000
AVG FAMILY INCOME
$58,821
AVG HOUSEHOLD INCOME
0.44
INEQUALITY / GINI INDEX
1,447
LABOR FORCE [ PEOPLE ]
47.0%
PERCENT IN LABOR FORCE
1.2%
UNEMPLOYMENT RATE
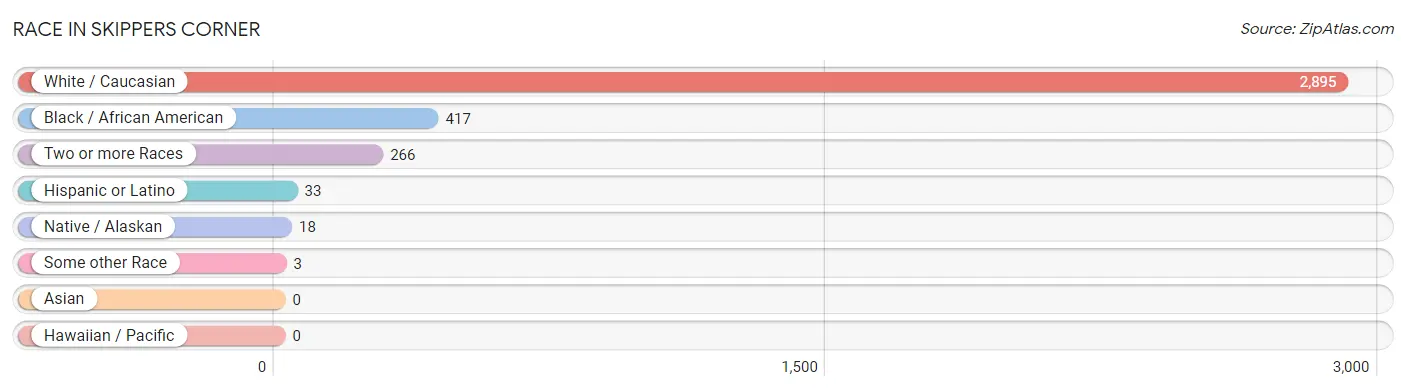
Race in Skippers Corner
The most populous races in Skippers Corner are White / Caucasian (2,895 | 80.4%), Black / African American (417 | 11.6%), and Two or more Races (266 | 7.4%).
| Race | # Population | % Population |
| Asian | 0 | 0.0% |
| Black / African American | 417 | 11.6% |
| Hawaiian / Pacific | 0 | 0.0% |
| Hispanic or Latino | 33 | 0.9% |
| Native / Alaskan | 18 | 0.5% |
| White / Caucasian | 2,895 | 80.4% |
| Two or more Races | 266 | 7.4% |
| Some other Race | 3 | 0.1% |
| Total | 3,599 | 100.0% |
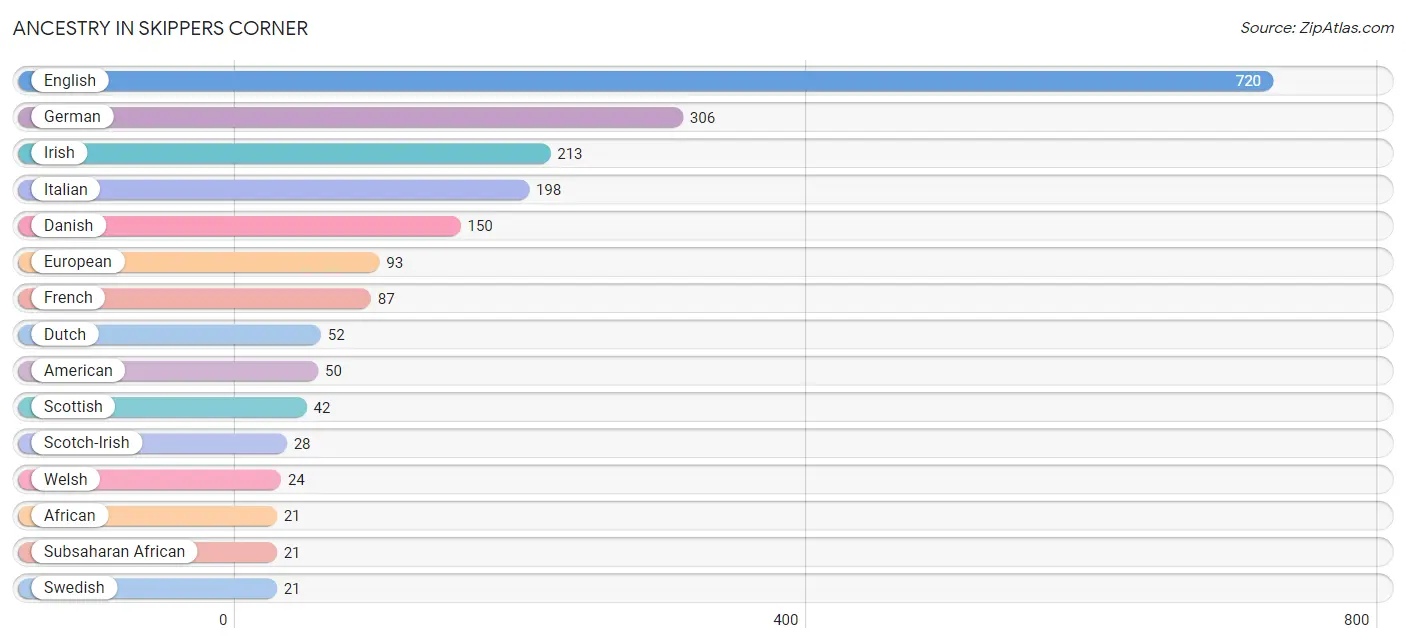
Ancestry in Skippers Corner
The most populous ancestries reported in Skippers Corner are English (720 | 20.0%), German (306 | 8.5%), Irish (213 | 5.9%), Italian (198 | 5.5%), and Danish (150 | 4.2%), together accounting for 44.1% of all Skippers Corner residents.
| Ancestry | # Population | % Population |
| African | 21 | 0.6% |
| Albanian | 19 | 0.5% |
| American | 50 | 1.4% |
| Australian | 17 | 0.5% |
| Cherokee | 13 | 0.4% |
| Danish | 150 | 4.2% |
| Dutch | 52 | 1.4% |
| English | 720 | 20.0% |
| European | 93 | 2.6% |
| Finnish | 9 | 0.3% |
| French | 87 | 2.4% |
| German | 306 | 8.5% |
| Haitian | 9 | 0.3% |
| Hungarian | 15 | 0.4% |
| Irish | 213 | 5.9% |
| Italian | 198 | 5.5% |
| Mexican | 10 | 0.3% |
| Polish | 18 | 0.5% |
| Puerto Rican | 20 | 0.6% |
| Scotch-Irish | 28 | 0.8% |
| Scottish | 42 | 1.2% |
| Slovene | 11 | 0.3% |
| Subsaharan African | 21 | 0.6% |
| Swedish | 21 | 0.6% |
| Welsh | 24 | 0.7% | View All 25 Rows |
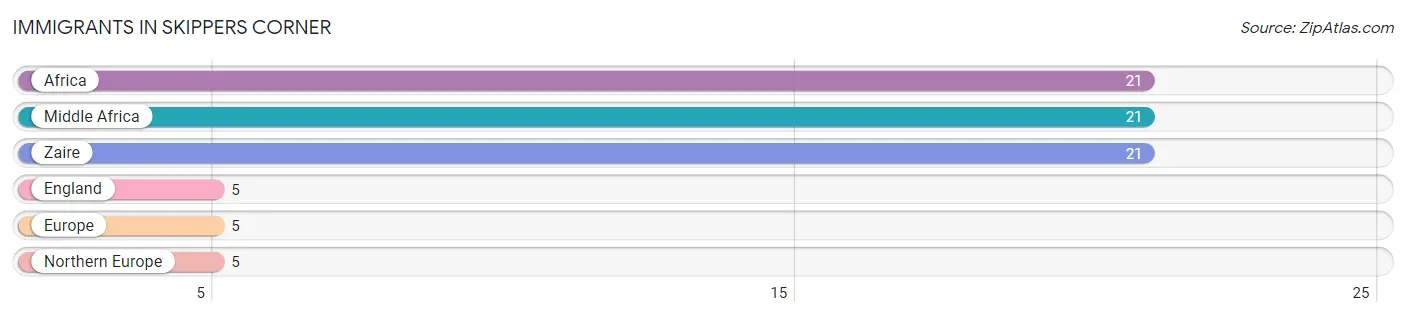
Immigrants in Skippers Corner
The most numerous immigrant groups reported in Skippers Corner came from Africa (21 | 0.6%), Middle Africa (21 | 0.6%), Zaire (21 | 0.6%), England (5 | 0.1%), and Europe (5 | 0.1%), together accounting for 2.0% of all Skippers Corner residents.
| Immigration Origin | # Population | % Population |
| Africa | 21 | 0.6% |
| England | 5 | 0.1% |
| Europe | 5 | 0.1% |
| Middle Africa | 21 | 0.6% |
| Northern Europe | 5 | 0.1% |
| Zaire | 21 | 0.6% | View All 6 Rows |
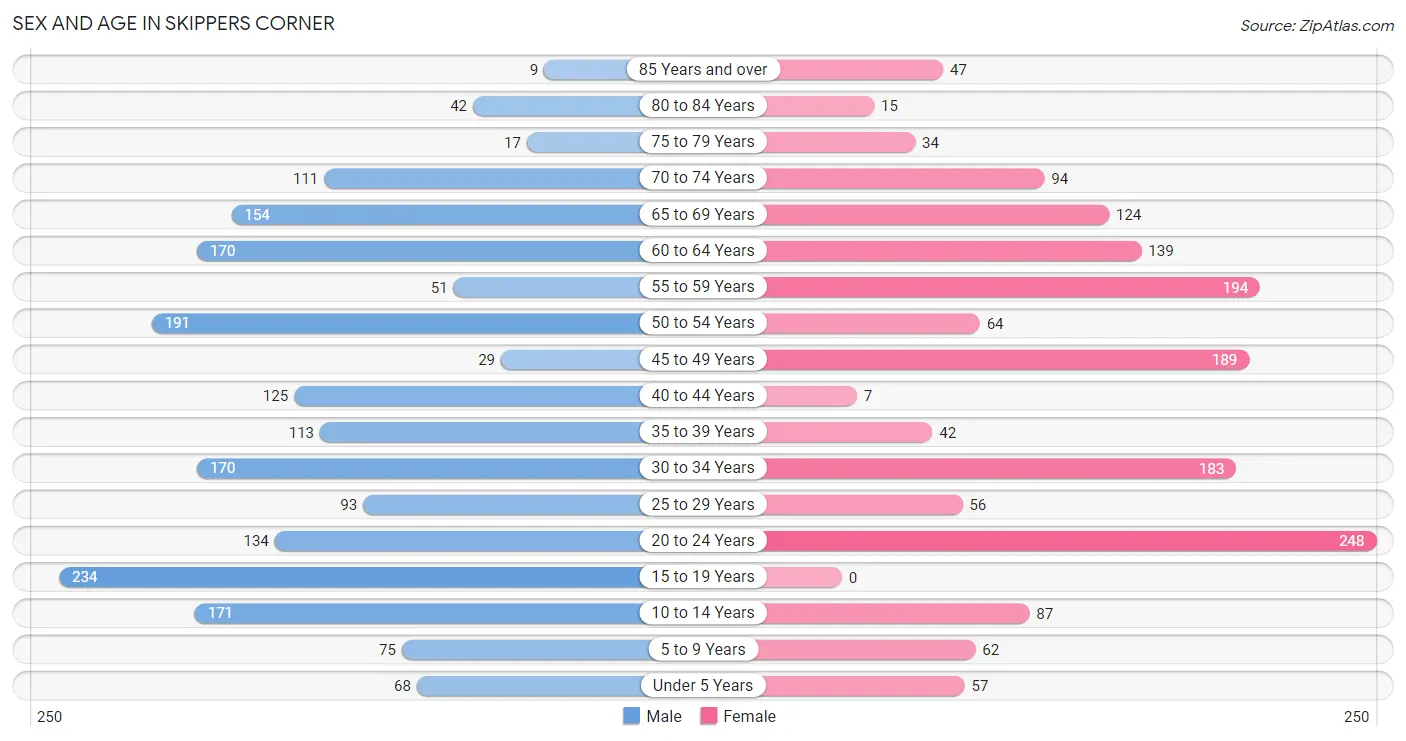
Sex and Age in Skippers Corner
Sex and Age in Skippers Corner
The most populous age groups in Skippers Corner are 15 to 19 Years (234 | 12.0%) for men and 20 to 24 Years (248 | 15.1%) for women.
| Age Bracket | Male | Female |
| Under 5 Years | 68 (3.5%) | 57 (3.5%) |
| 5 to 9 Years | 75 (3.8%) | 62 (3.8%) |
| 10 to 14 Years | 171 (8.7%) | 87 (5.3%) |
| 15 to 19 Years | 234 (12.0%) | 0 (0.0%) |
| 20 to 24 Years | 134 (6.9%) | 248 (15.1%) |
| 25 to 29 Years | 93 (4.8%) | 56 (3.4%) |
| 30 to 34 Years | 170 (8.7%) | 183 (11.1%) |
| 35 to 39 Years | 113 (5.8%) | 42 (2.6%) |
| 40 to 44 Years | 125 (6.4%) | 7 (0.4%) |
| 45 to 49 Years | 29 (1.5%) | 189 (11.5%) |
| 50 to 54 Years | 191 (9.8%) | 64 (3.9%) |
| 55 to 59 Years | 51 (2.6%) | 194 (11.8%) |
| 60 to 64 Years | 170 (8.7%) | 139 (8.5%) |
| 65 to 69 Years | 154 (7.9%) | 124 (7.5%) |
| 70 to 74 Years | 111 (5.7%) | 94 (5.7%) |
| 75 to 79 Years | 17 (0.9%) | 34 (2.1%) |
| 80 to 84 Years | 42 (2.1%) | 15 (0.9%) |
| 85 Years and over | 9 (0.5%) | 47 (2.9%) |
| Total | 1,957 (100.0%) | 1,642 (100.0%) |
Families and Households in Skippers Corner
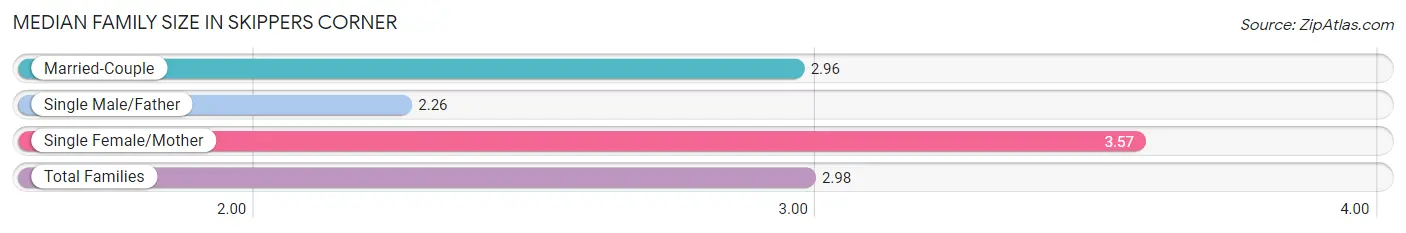
Median Family Size in Skippers Corner
The median family size in Skippers Corner is 2.98 persons per family, with single female/mother families (177 | 20.7%) accounting for the largest median family size of 3.57 persons per family. On the other hand, single male/father families (122 | 14.3%) represent the smallest median family size with 2.26 persons per family.
| Family Type | # Families | Family Size |
| Married-Couple | 555 (65.0%) | 2.96 |
| Single Male/Father | 122 (14.3%) | 2.26 |
| Single Female/Mother | 177 (20.7%) | 3.57 |
| Total Families | 854 (100.0%) | 2.98 |
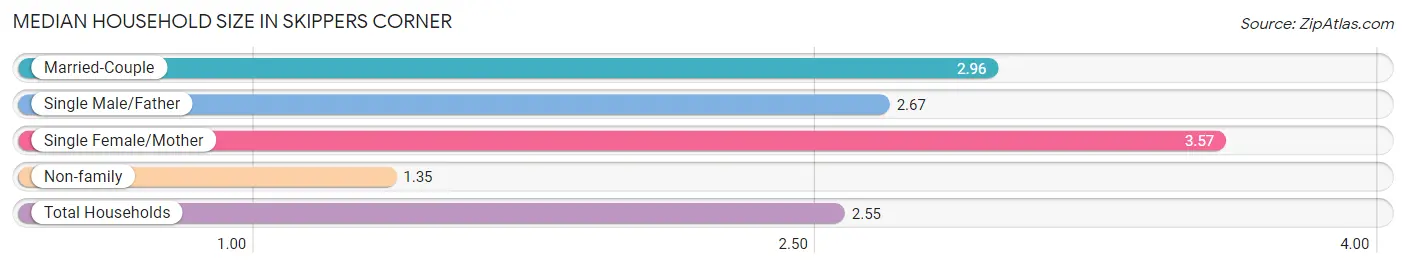
Median Household Size in Skippers Corner
The median household size in Skippers Corner is 2.55 persons per household, with single female/mother households (177 | 14.7%) accounting for the largest median household size of 3.57 persons per household. non-family households (350 | 29.1%) represent the smallest median household size with 1.35 persons per household.
| Household Type | # Households | Household Size |
| Married-Couple | 555 (46.1%) | 2.96 |
| Single Male/Father | 122 (10.1%) | 2.67 |
| Single Female/Mother | 177 (14.7%) | 3.57 |
| Non-family | 350 (29.1%) | 1.35 |
| Total Households | 1,204 (100.0%) | 2.55 |
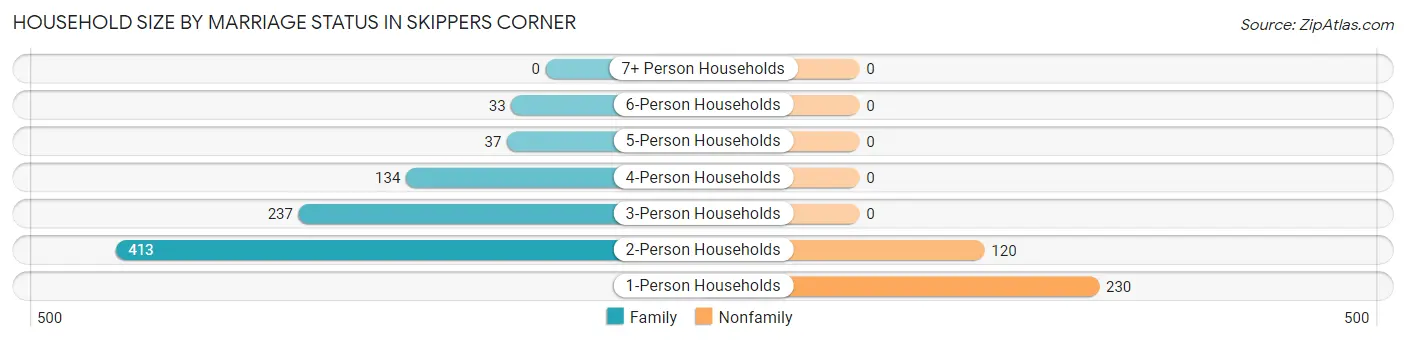
Household Size by Marriage Status in Skippers Corner
Out of a total of 1,204 households in Skippers Corner, 854 (70.9%) are family households, while 350 (29.1%) are nonfamily households. The most numerous type of family households are 2-person households, comprising 413, and the most common type of nonfamily households are 1-person households, comprising 230.
| Household Size | Family Households | Nonfamily Households |
| 1-Person Households | - | 230 (19.1%) |
| 2-Person Households | 413 (34.3%) | 120 (10.0%) |
| 3-Person Households | 237 (19.7%) | 0 (0.0%) |
| 4-Person Households | 134 (11.1%) | 0 (0.0%) |
| 5-Person Households | 37 (3.1%) | 0 (0.0%) |
| 6-Person Households | 33 (2.7%) | 0 (0.0%) |
| 7+ Person Households | 0 (0.0%) | 0 (0.0%) |
| Total | 854 (70.9%) | 350 (29.1%) |
Female Fertility in Skippers Corner
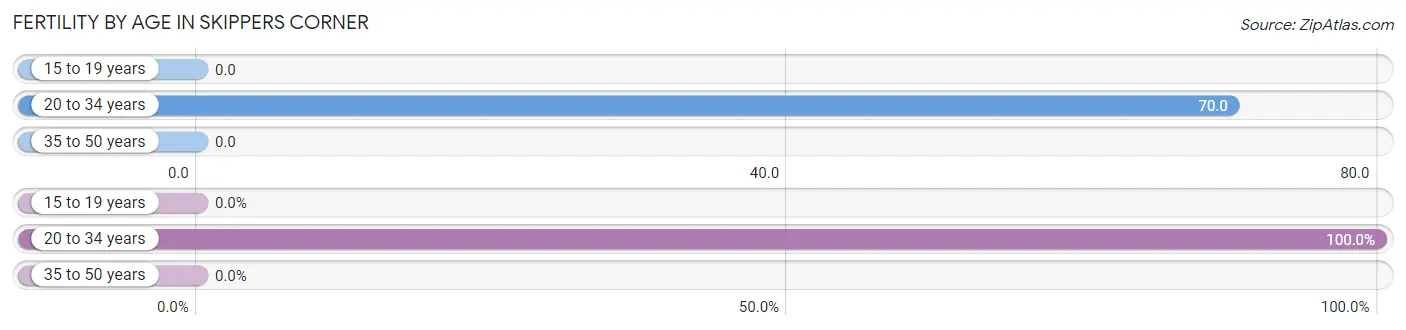
Fertility by Age in Skippers Corner
Average fertility rate in Skippers Corner is 46.0 births per 1,000 women. Women in the age bracket of 20 to 34 years have the highest fertility rate with 70.0 births per 1,000 women. Women in the age bracket of 20 to 34 years acount for 100.0% of all women with births.
| Age Bracket | Women with Births | Births / 1,000 Women |
| 15 to 19 years | 0 (0.0%) | 0.0 |
| 20 to 34 years | 34 (100.0%) | 70.0 |
| 35 to 50 years | 0 (0.0%) | 0.0 |
| Total | 34 (100.0%) | 46.0 |
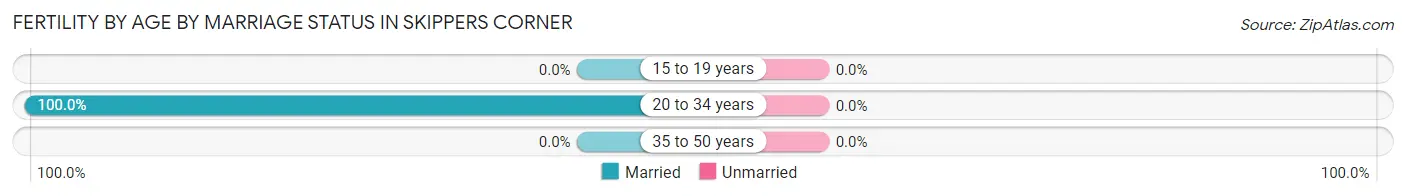
Fertility by Age by Marriage Status in Skippers Corner
| Age Bracket | Married | Unmarried |
| 15 to 19 years | 0 (0.0%) | 0 (0.0%) |
| 20 to 34 years | 34 (100.0%) | 0 (0.0%) |
| 35 to 50 years | 0 (0.0%) | 0 (0.0%) |
| Total | 34 (100.0%) | 0 (0.0%) |
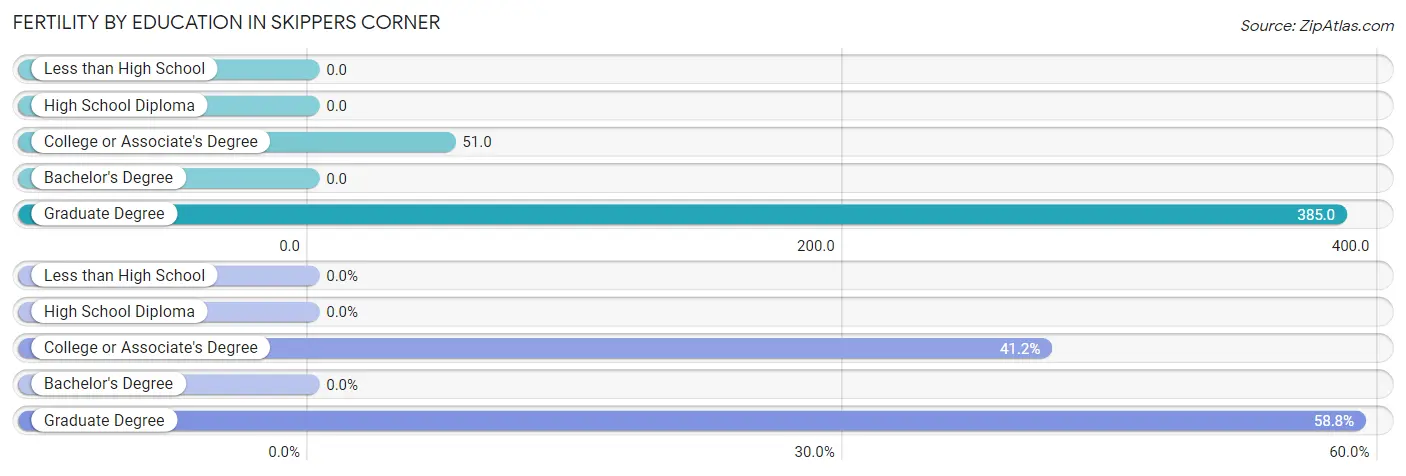
Fertility by Education in Skippers Corner
| Educational Attainment | Women with Births | Births / 1,000 Women |
| Less than High School | 0 (0.0%) | 0.0 |
| High School Diploma | 0 (0.0%) | 0.0 |
| College or Associate's Degree | 14 (41.2%) | 51.0 |
| Bachelor's Degree | 0 (0.0%) | 0.0 |
| Graduate Degree | 20 (58.8%) | 385.0 |
| Total | 34 (100.0%) | 46.0 |
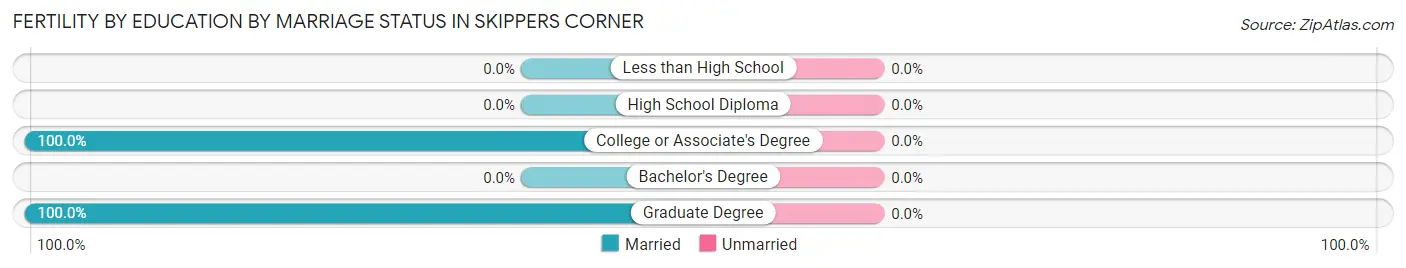
Fertility by Education by Marriage Status in Skippers Corner
| Educational Attainment | Married | Unmarried |
| Less than High School | 0 (0.0%) | 0 (0.0%) |
| High School Diploma | 0 (0.0%) | 0 (0.0%) |
| College or Associate's Degree | 14 (100.0%) | 0 (0.0%) |
| Bachelor's Degree | 0 (0.0%) | 0 (0.0%) |
| Graduate Degree | 20 (100.0%) | 0 (0.0%) |
| Total | 34 (100.0%) | 0 (0.0%) |
Income in Skippers Corner
Income Overview in Skippers Corner
Per Capita Income in Skippers Corner is $27,928, while median incomes of families and households are $59,000 and $58,821 respectively.
| Characteristic | Number | Measure |
| Per Capita Income | 3,599 | $27,928 |
| Median Family Income | 854 | $59,000 |
| Mean Family Income | 854 | $82,300 |
| Median Household Income | 1,204 | $58,821 |
| Mean Household Income | 1,204 | $74,937 |
| Income Deficit | 854 | $0 |
| Wage / Income Gap (%) | 3,599 | 0.00% |
| Wage / Income Gap ($) | 3,599 | 100.00¢ per $1 |
| Gini / Inequality Index | 3,599 | 0.44 |
Earnings by Sex in Skippers Corner
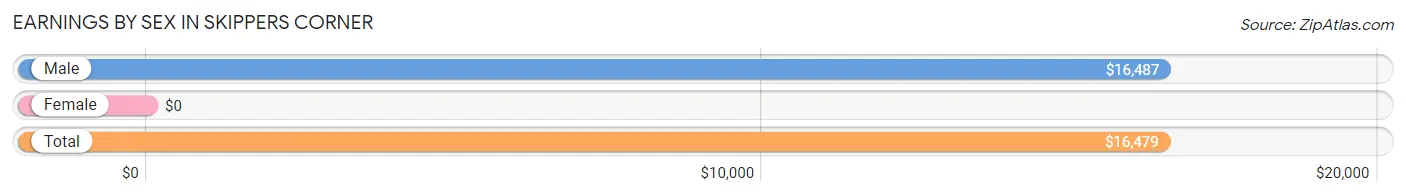
| Sex | Number | Average Earnings |
| Male | 1,135 (54.5%) | $16,487 |
| Female | 948 (45.5%) | $0 |
| Total | 2,083 (100.0%) | $16,479 |
Earnings by Sex by Income Bracket in Skippers Corner
The most common earnings brackets in Skippers Corner are $5,000 to $7,499 for men (142 | 12.5%) and $10,000 to $12,499 for women (280 | 29.5%).
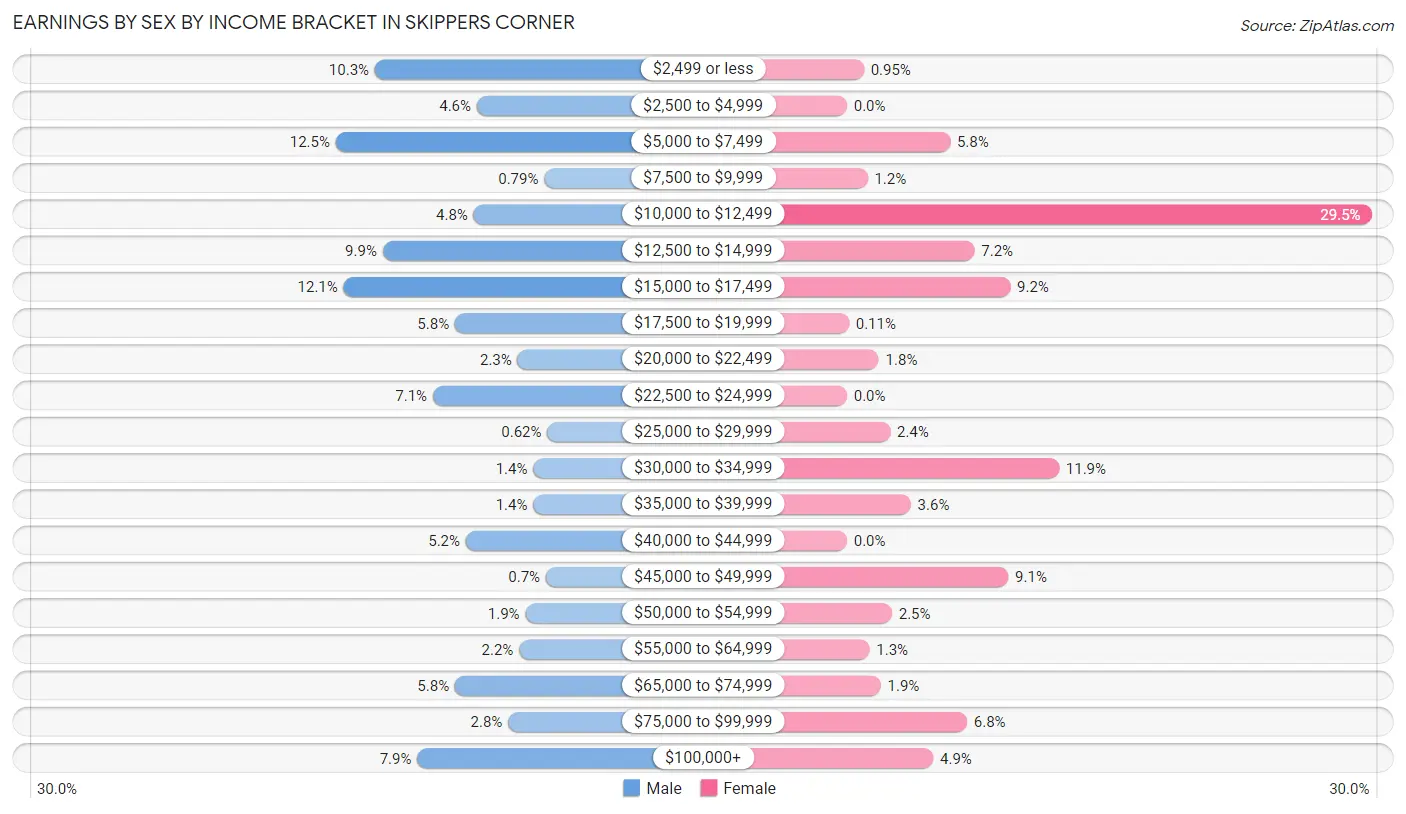
| Income | Male | Female |
| $2,499 or less | 117 (10.3%) | 9 (0.9%) |
| $2,500 to $4,999 | 52 (4.6%) | 0 (0.0%) |
| $5,000 to $7,499 | 142 (12.5%) | 55 (5.8%) |
| $7,500 to $9,999 | 9 (0.8%) | 11 (1.2%) |
| $10,000 to $12,499 | 54 (4.8%) | 280 (29.5%) |
| $12,500 to $14,999 | 112 (9.9%) | 68 (7.2%) |
| $15,000 to $17,499 | 137 (12.1%) | 87 (9.2%) |
| $17,500 to $19,999 | 66 (5.8%) | 1 (0.1%) |
| $20,000 to $22,499 | 26 (2.3%) | 17 (1.8%) |
| $22,500 to $24,999 | 80 (7.0%) | 0 (0.0%) |
| $25,000 to $29,999 | 7 (0.6%) | 23 (2.4%) |
| $30,000 to $34,999 | 16 (1.4%) | 113 (11.9%) |
| $35,000 to $39,999 | 16 (1.4%) | 34 (3.6%) |
| $40,000 to $44,999 | 59 (5.2%) | 0 (0.0%) |
| $45,000 to $49,999 | 8 (0.7%) | 86 (9.1%) |
| $50,000 to $54,999 | 21 (1.8%) | 24 (2.5%) |
| $55,000 to $64,999 | 25 (2.2%) | 12 (1.3%) |
| $65,000 to $74,999 | 66 (5.8%) | 18 (1.9%) |
| $75,000 to $99,999 | 32 (2.8%) | 64 (6.8%) |
| $100,000+ | 90 (7.9%) | 46 (4.9%) |
| Total | 1,135 (100.0%) | 948 (100.0%) |
Earnings by Sex by Educational Attainment in Skippers Corner
Average earnings in Skippers Corner are $22,594 for men and $31,786 for women, a difference of 28.9%. Men with an educational attainment of bachelor's degree enjoy the highest average annual earnings of $51,012, while those with less than high school education earn the least with $14,005. Women with an educational attainment of bachelor's degree earn the most with the average annual earnings of $84,129, while those with high school diploma education have the smallest earnings of $12,740.

| Educational Attainment | Male Income | Female Income |
| Less than High School | $14,005 | $13,047 |
| High School Diploma | - | - |
| College or Associate's Degree | $18,750 | $33,125 |
| Bachelor's Degree | $51,012 | $84,129 |
| Graduate Degree | - | - |
| Total | $22,594 | $31,786 |
Family Income in Skippers Corner
Family Income Brackets in Skippers Corner
According to the Skippers Corner family income data, there are 197 families falling into the $50,000 to $74,999 income range, which is the most common income bracket and makes up 23.1% of all families. Conversely, the $10,000 to $14,999 income bracket is the least frequent group with only 26 families (3.0%) belonging to this category.
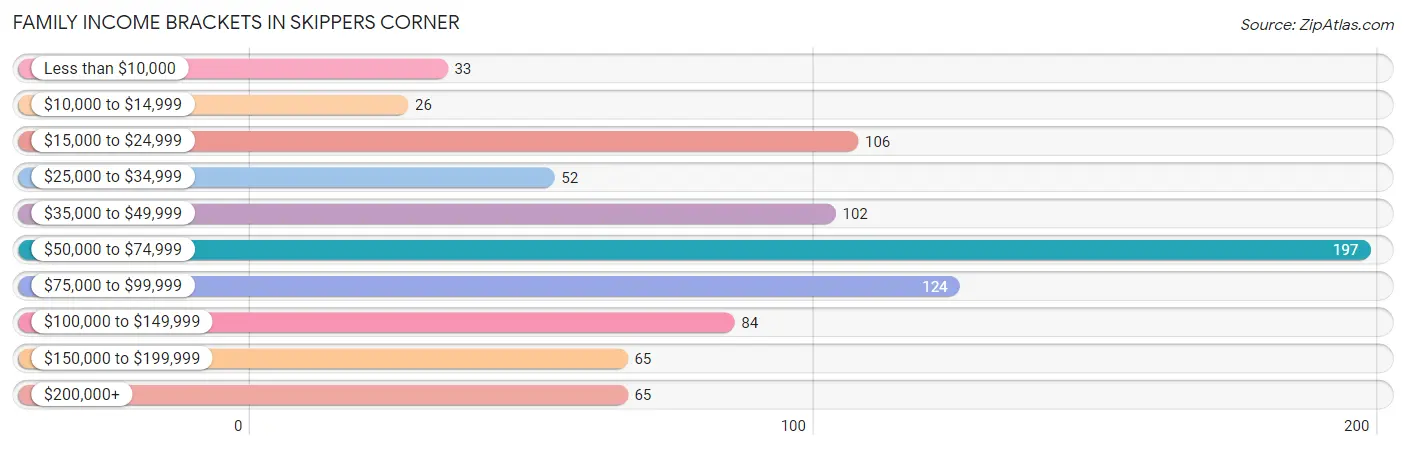
| Income Bracket | # Families | % Families |
| Less than $10,000 | 33 | 3.9% |
| $10,000 to $14,999 | 26 | 3.0% |
| $15,000 to $24,999 | 106 | 12.4% |
| $25,000 to $34,999 | 52 | 6.1% |
| $35,000 to $49,999 | 102 | 11.9% |
| $50,000 to $74,999 | 197 | 23.1% |
| $75,000 to $99,999 | 124 | 14.5% |
| $100,000 to $149,999 | 84 | 9.8% |
| $150,000 to $199,999 | 65 | 7.6% |
| $200,000+ | 65 | 7.6% |
Family Income by Famaliy Size in Skippers Corner
2-person families (469 | 54.9%) account for the highest median family income in Skippers Corner with $77,337 per family, while 2-person families (469 | 54.9%) have the highest median income of $38,668 per family member.
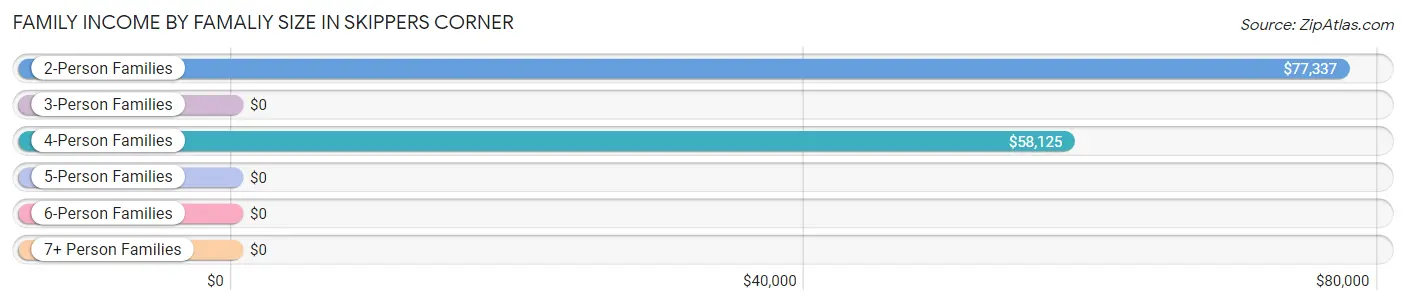
| Income Bracket | # Families | Median Income |
| 2-Person Families | 469 (54.9%) | $77,337 |
| 3-Person Families | 181 (21.2%) | $0 |
| 4-Person Families | 134 (15.7%) | $58,125 |
| 5-Person Families | 37 (4.3%) | $0 |
| 6-Person Families | 33 (3.9%) | $0 |
| 7+ Person Families | 0 (0.0%) | $0 |
| Total | 854 (100.0%) | $59,000 |
Family Income by Number of Earners in Skippers Corner
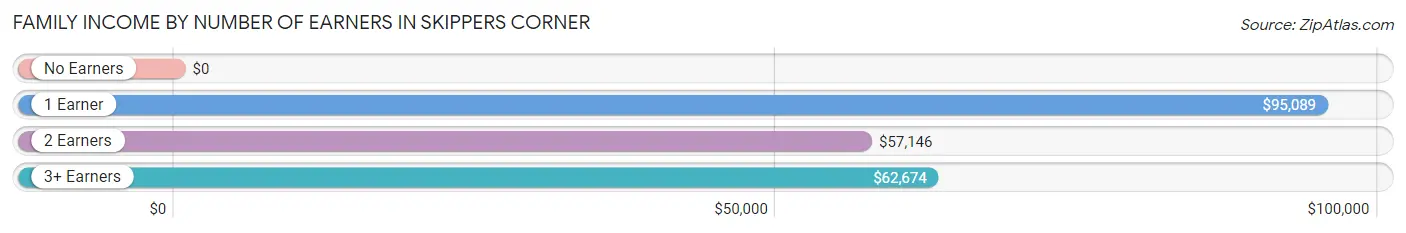
| Number of Earners | # Families | Median Income |
| No Earners | 215 (25.2%) | $0 |
| 1 Earner | 121 (14.2%) | $95,089 |
| 2 Earners | 401 (47.0%) | $57,146 |
| 3+ Earners | 117 (13.7%) | $62,674 |
| Total | 854 (100.0%) | $59,000 |
Household Income in Skippers Corner
Household Income Brackets in Skippers Corner
With 279 households falling in the category, the $50,000 to $74,999 income range is the most frequent in Skippers Corner, accounting for 23.2% of all households. In contrast, only 33 households (2.7%) fall into the less than $10,000 income bracket, making it the least populous group.
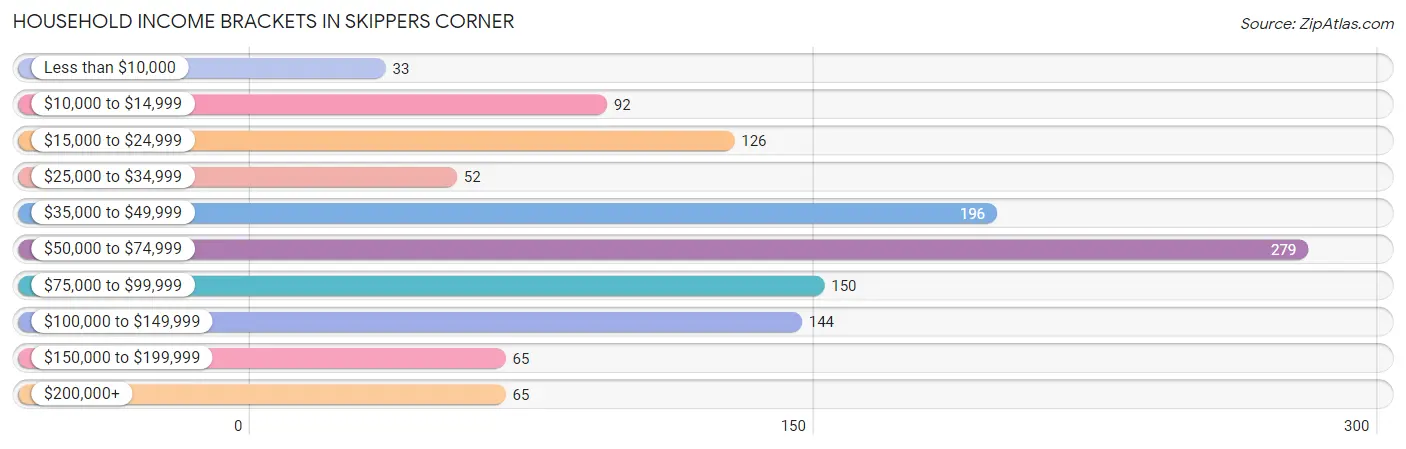
| Income Bracket | # Households | % Households |
| Less than $10,000 | 33 | 2.7% |
| $10,000 to $14,999 | 92 | 7.6% |
| $15,000 to $24,999 | 126 | 10.5% |
| $25,000 to $34,999 | 52 | 4.3% |
| $35,000 to $49,999 | 196 | 16.3% |
| $50,000 to $74,999 | 279 | 23.2% |
| $75,000 to $99,999 | 150 | 12.5% |
| $100,000 to $149,999 | 144 | 12.0% |
| $150,000 to $199,999 | 65 | 5.4% |
| $200,000+ | 65 | 5.4% |
Household Income by Householder Age in Skippers Corner
The median household income in Skippers Corner is $58,821, with the highest median household income of $80,438 found in the 25 to 44 years age bracket for the primary householder. A total of 237 households (19.7%) fall into this category.
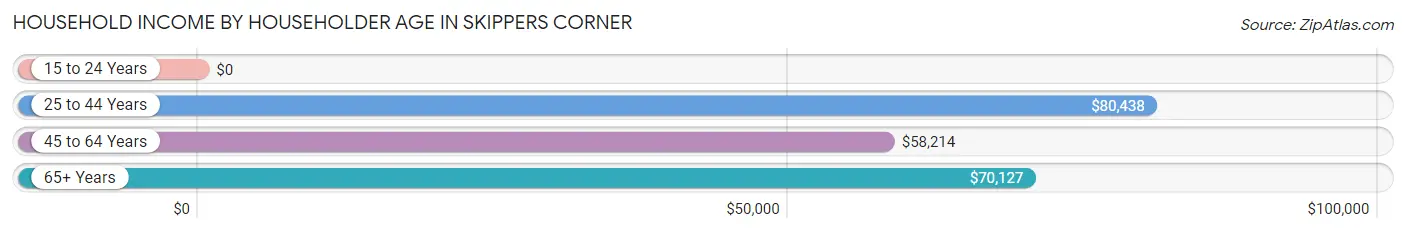
| Income Bracket | # Households | Median Income |
| 15 to 24 Years | 0 (0.0%) | $0 |
| 25 to 44 Years | 237 (19.7%) | $80,438 |
| 45 to 64 Years | 580 (48.2%) | $58,214 |
| 65+ Years | 387 (32.1%) | $70,127 |
| Total | 1,204 (100.0%) | $58,821 |
Poverty in Skippers Corner
Income Below Poverty by Sex and Age in Skippers Corner
With 23.5% poverty level for males and 25.1% for females among the residents of Skippers Corner, 12 to 14 year old males and 18 to 24 year old females are the most vulnerable to poverty, with 150 males (100.0%) and 145 females (62.5%) in their respective age groups living below the poverty level.
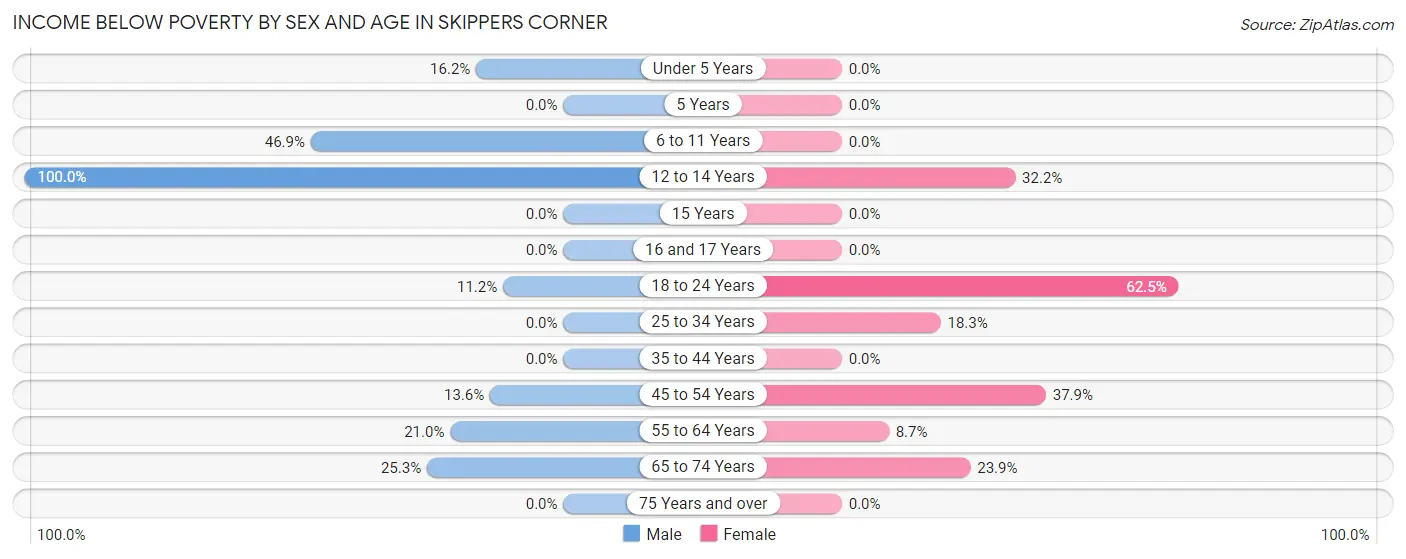
| Age Bracket | Male | Female |
| Under 5 Years | 11 (16.2%) | 0 (0.0%) |
| 5 Years | 0 (0.0%) | 0 (0.0%) |
| 6 to 11 Years | 45 (46.9%) | 0 (0.0%) |
| 12 to 14 Years | 150 (100.0%) | 28 (32.2%) |
| 15 Years | 0 (0.0%) | 0 (0.0%) |
| 16 and 17 Years | 0 (0.0%) | 0 (0.0%) |
| 18 to 24 Years | 30 (11.2%) | 145 (62.5%) |
| 25 to 34 Years | 0 (0.0%) | 33 (18.3%) |
| 35 to 44 Years | 0 (0.0%) | 0 (0.0%) |
| 45 to 54 Years | 26 (13.6%) | 89 (37.9%) |
| 55 to 64 Years | 46 (21.0%) | 29 (8.7%) |
| 65 to 74 Years | 62 (25.3%) | 52 (23.8%) |
| 75 Years and over | 0 (0.0%) | 0 (0.0%) |
| Total | 370 (23.5%) | 376 (25.1%) |
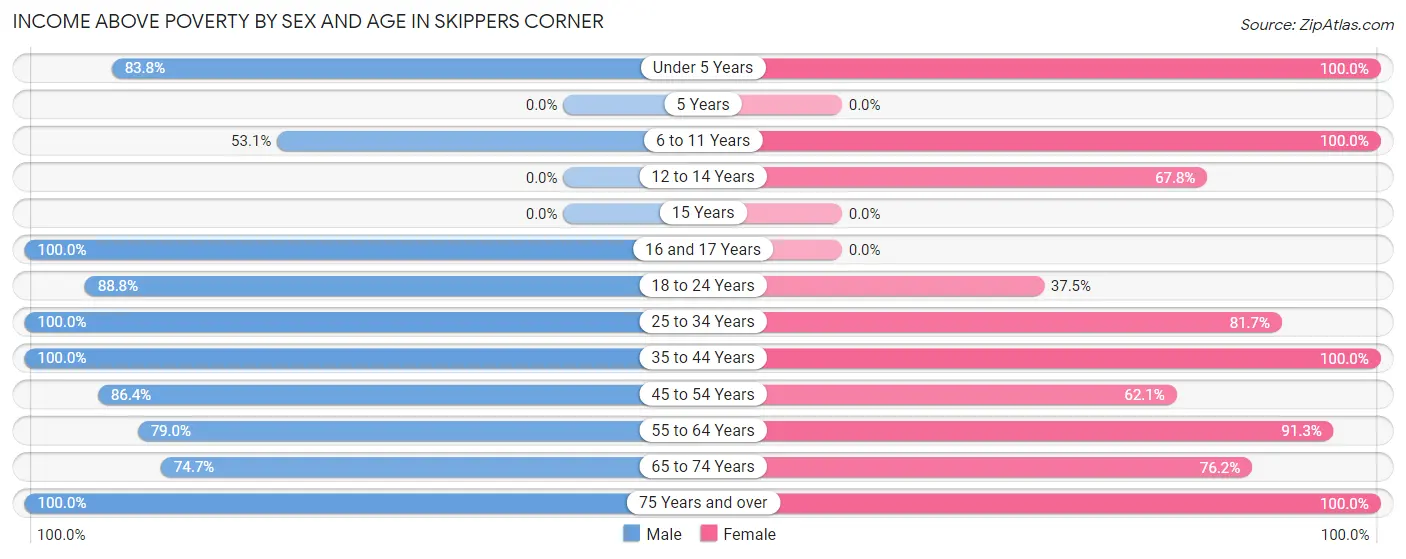
Income Above Poverty by Sex and Age in Skippers Corner
According to the poverty statistics in Skippers Corner, males aged 16 and 17 years and females aged under 5 years are the age groups that are most secure financially, with 100.0% of males and 100.0% of females in these age groups living above the poverty line.
| Age Bracket | Male | Female |
| Under 5 Years | 57 (83.8%) | 57 (100.0%) |
| 5 Years | 0 (0.0%) | 0 (0.0%) |
| 6 to 11 Years | 51 (53.1%) | 62 (100.0%) |
| 12 to 14 Years | 0 (0.0%) | 59 (67.8%) |
| 15 Years | 0 (0.0%) | 0 (0.0%) |
| 16 and 17 Years | 63 (100.0%) | 0 (0.0%) |
| 18 to 24 Years | 238 (88.8%) | 87 (37.5%) |
| 25 to 34 Years | 91 (100.0%) | 147 (81.7%) |
| 35 to 44 Years | 137 (100.0%) | 24 (100.0%) |
| 45 to 54 Years | 165 (86.4%) | 146 (62.1%) |
| 55 to 64 Years | 173 (79.0%) | 304 (91.3%) |
| 65 to 74 Years | 183 (74.7%) | 166 (76.1%) |
| 75 Years and over | 44 (100.0%) | 70 (100.0%) |
| Total | 1,202 (76.5%) | 1,122 (74.9%) |
Income Below Poverty Among Married-Couple Families in Skippers Corner
| Children | Above Poverty | Below Poverty |
| No Children | 391 (100.0%) | 0 (0.0%) |
| 1 or 2 Children | 127 (100.0%) | 0 (0.0%) |
| 3 or 4 Children | 37 (100.0%) | 0 (0.0%) |
| 5 or more Children | 0 (0.0%) | 0 (0.0%) |
| Total | 555 (100.0%) | 0 (0.0%) |
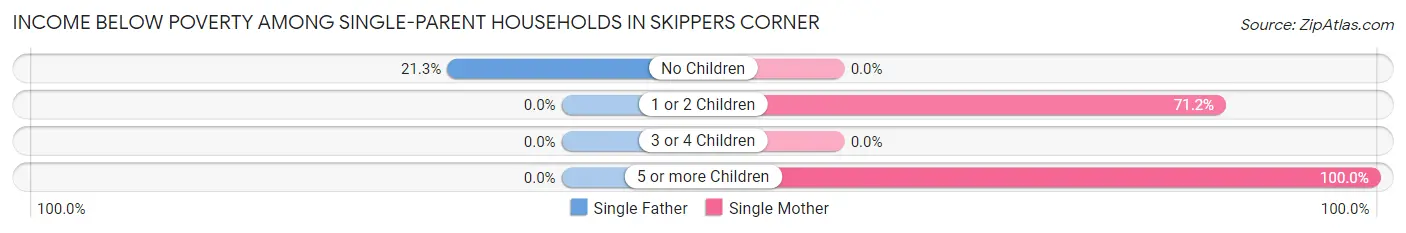
Income Below Poverty Among Single-Parent Households in Skippers Corner
According to the poverty data in Skippers Corner, 21.3% or 26 single-father households and 68.9% or 122 single-mother households are living below the poverty line. Among single-father households, those with no children have the highest poverty rate, with 26 households (21.3%) experiencing poverty. Likewise, among single-mother households, those with 5 or more children have the highest poverty rate, with 33 households (100.0%) falling below the poverty line.
| Children | Single Father | Single Mother |
| No Children | 26 (21.3%) | 0 (0.0%) |
| 1 or 2 Children | 0 (0.0%) | 89 (71.2%) |
| 3 or 4 Children | 0 (0.0%) | 0 (0.0%) |
| 5 or more Children | 0 (0.0%) | 33 (100.0%) |
| Total | 26 (21.3%) | 122 (68.9%) |
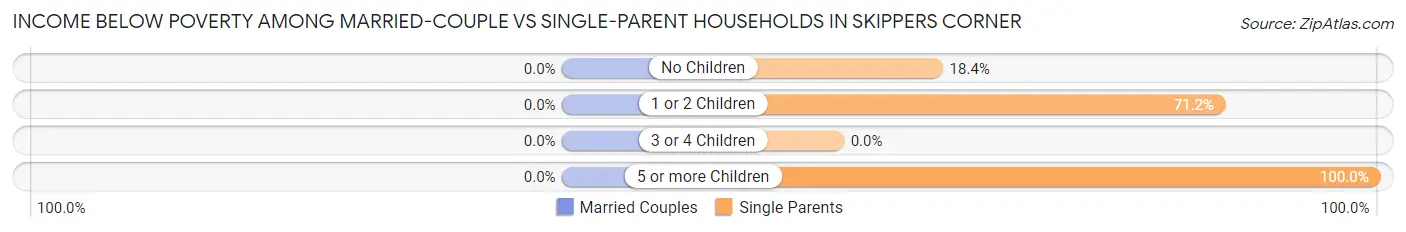
Income Below Poverty Among Married-Couple vs Single-Parent Households in Skippers Corner
| Children | Married-Couple Families | Single-Parent Households |
| No Children | 0 (0.0%) | 26 (18.4%) |
| 1 or 2 Children | 0 (0.0%) | 89 (71.2%) |
| 3 or 4 Children | 0 (0.0%) | 0 (0.0%) |
| 5 or more Children | 0 (0.0%) | 33 (100.0%) |
| Total | 0 (0.0%) | 148 (49.5%) |
Employment Characteristics in Skippers Corner
Employment by Class of Employer in Skippers Corner
Among the 1,419 employed individuals in Skippers Corner, private company employees (857 | 60.4%), not-for-profit organizations (192 | 13.5%), and self-employed (not incorporated) (169 | 11.9%) make up the most common classes of employment.
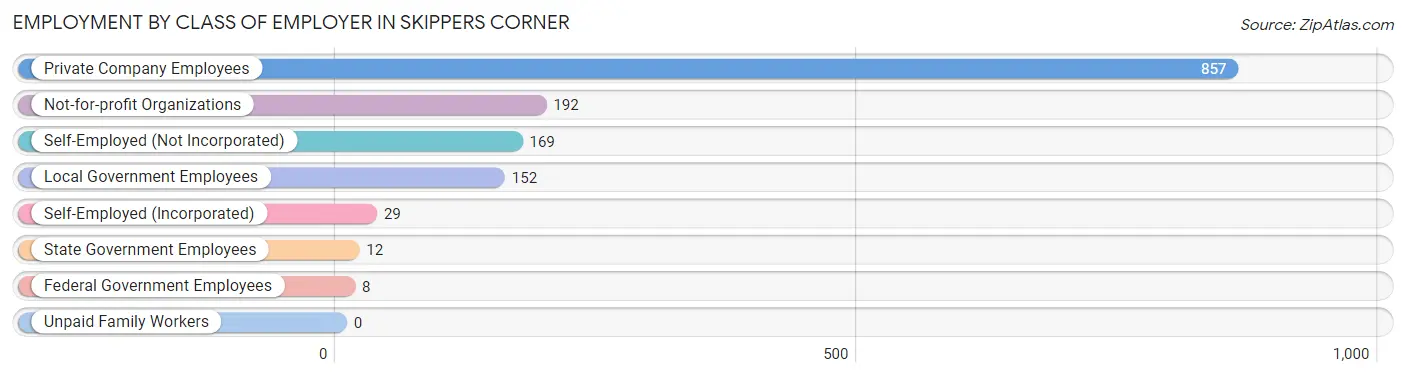
| Employer Class | # Employees | % Employees |
| Private Company Employees | 857 | 60.4% |
| Self-Employed (Incorporated) | 29 | 2.0% |
| Self-Employed (Not Incorporated) | 169 | 11.9% |
| Not-for-profit Organizations | 192 | 13.5% |
| Local Government Employees | 152 | 10.7% |
| State Government Employees | 12 | 0.9% |
| Federal Government Employees | 8 | 0.6% |
| Unpaid Family Workers | 0 | 0.0% |
| Total | 1,419 | 100.0% |
Employment Status by Age in Skippers Corner
According to the labor force statistics for Skippers Corner, out of the total population over 16 years of age (3,079), 47.0% or 1,447 individuals are in the labor force, with 1.2% or 17 of them unemployed. The age group with the highest labor force participation rate is 55 to 59 years, with 81.6% or 200 individuals in the labor force. Within the labor force, the 16 to 19 years age range has the highest percentage of unemployed individuals, with 5.8% or 9 of them being unemployed.
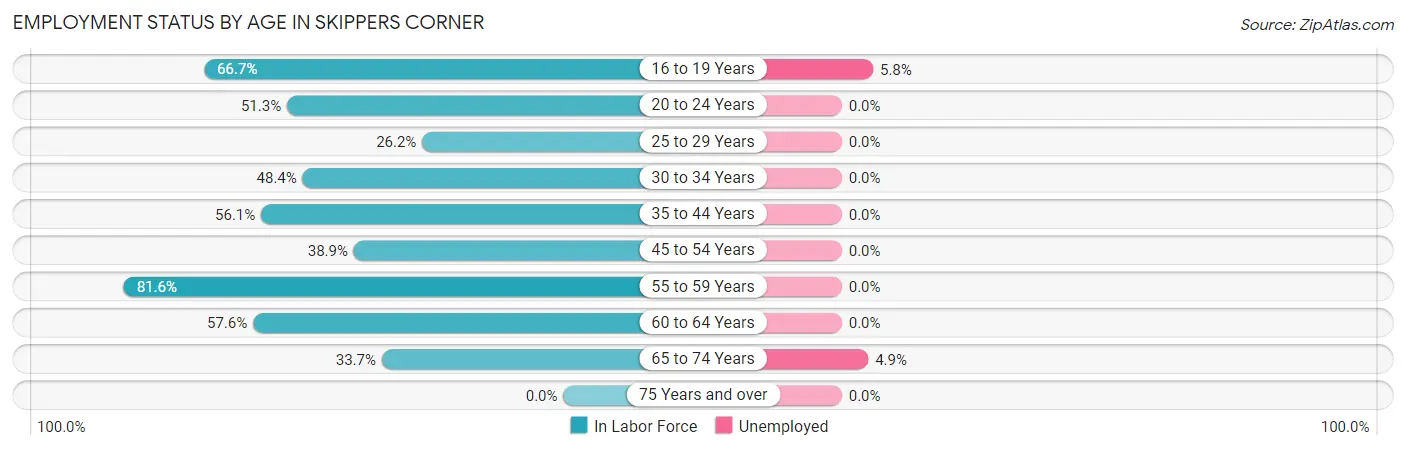
| Age Bracket | In Labor Force | Unemployed |
| 16 to 19 Years | 156 (66.7%) | 9 (5.8%) |
| 20 to 24 Years | 196 (51.3%) | 0 (0.0%) |
| 25 to 29 Years | 39 (26.2%) | 0 (0.0%) |
| 30 to 34 Years | 171 (48.4%) | 0 (0.0%) |
| 35 to 44 Years | 161 (56.1%) | 0 (0.0%) |
| 45 to 54 Years | 184 (38.9%) | 0 (0.0%) |
| 55 to 59 Years | 200 (81.6%) | 0 (0.0%) |
| 60 to 64 Years | 178 (57.6%) | 0 (0.0%) |
| 65 to 74 Years | 163 (33.7%) | 8 (4.9%) |
| 75 Years and over | 0 (0.0%) | 0 (0.0%) |
| Total | 1,447 (47.0%) | 17 (1.2%) |
Employment Status by Educational Attainment in Skippers Corner
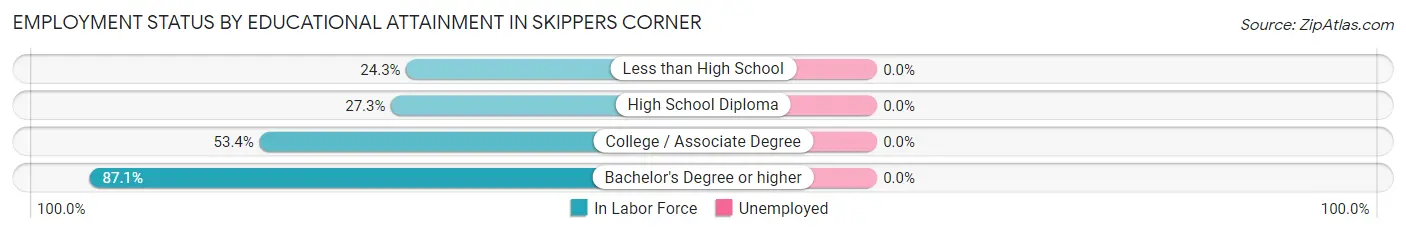
| Educational Attainment | In Labor Force | Unemployed |
| Less than High School | 49 (24.3%) | 0 (0.0%) |
| High School Diploma | 119 (27.3%) | 0 (0.0%) |
| College / Associate Degree | 413 (53.4%) | 0 (0.0%) |
| Bachelor's Degree or higher | 352 (87.1%) | 0 (0.0%) |
| Total | 933 (51.4%) | 0 (0.0%) |
Employment Occupations by Sex in Skippers Corner
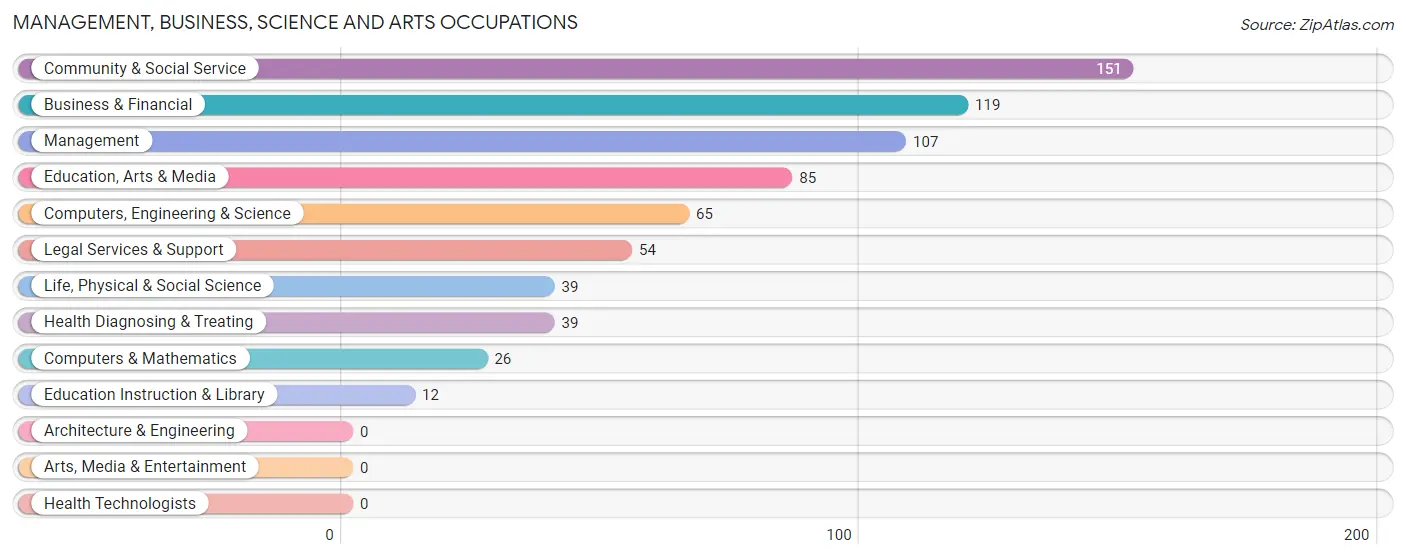
Management, Business, Science and Arts Occupations
The most common Management, Business, Science and Arts occupations in Skippers Corner are Community & Social Service (151 | 10.5%), Business & Financial (119 | 8.3%), Management (107 | 7.5%), Education, Arts & Media (85 | 5.9%), and Computers, Engineering & Science (65 | 4.5%).
Management, Business, Science and Arts Occupations by Sex
Within the Management, Business, Science and Arts occupations in Skippers Corner, the most male-oriented occupations are Computers, Engineering & Science (100.0%), Computers & Mathematics (100.0%), and Life, Physical & Social Science (100.0%), while the most female-oriented occupations are Education Instruction & Library (100.0%), Health Diagnosing & Treating (100.0%), and Education, Arts & Media (75.3%).
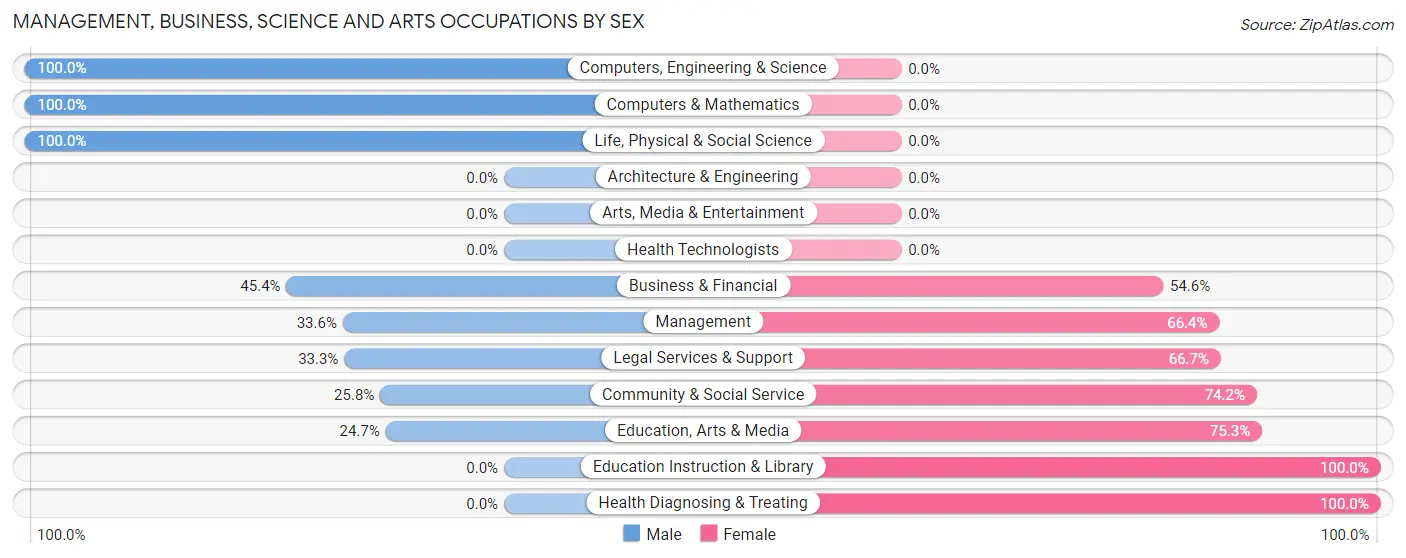
| Occupation | Male | Female |
| Management | 36 (33.6%) | 71 (66.4%) |
| Business & Financial | 54 (45.4%) | 65 (54.6%) |
| Computers, Engineering & Science | 65 (100.0%) | 0 (0.0%) |
| Computers & Mathematics | 26 (100.0%) | 0 (0.0%) |
| Architecture & Engineering | 0 (0.0%) | 0 (0.0%) |
| Life, Physical & Social Science | 39 (100.0%) | 0 (0.0%) |
| Community & Social Service | 39 (25.8%) | 112 (74.2%) |
| Education, Arts & Media | 21 (24.7%) | 64 (75.3%) |
| Legal Services & Support | 18 (33.3%) | 36 (66.7%) |
| Education Instruction & Library | 0 (0.0%) | 12 (100.0%) |
| Arts, Media & Entertainment | 0 (0.0%) | 0 (0.0%) |
| Health Diagnosing & Treating | 0 (0.0%) | 39 (100.0%) |
| Health Technologists | 0 (0.0%) | 0 (0.0%) |
| Total (Category) | 194 (40.3%) | 287 (59.7%) |
| Total (Overall) | 812 (56.7%) | 619 (43.3%) |
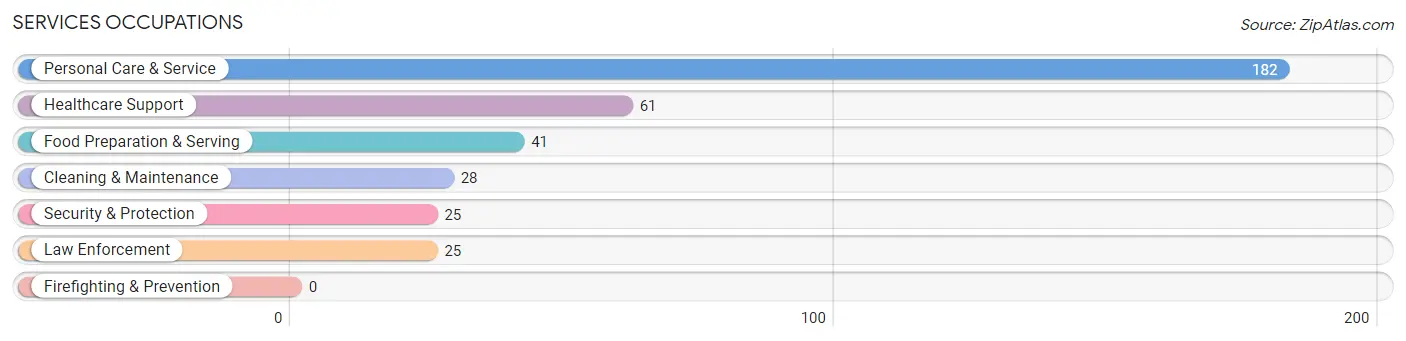
Services Occupations
The most common Services occupations in Skippers Corner are Personal Care & Service (182 | 12.7%), Healthcare Support (61 | 4.3%), Food Preparation & Serving (41 | 2.9%), Cleaning & Maintenance (28 | 2.0%), and Security & Protection (25 | 1.8%).
Services Occupations by Sex
Within the Services occupations in Skippers Corner, the most male-oriented occupations are Security & Protection (100.0%), Law Enforcement (100.0%), and Cleaning & Maintenance (100.0%), while the most female-oriented occupations are Food Preparation & Serving (56.1%), Personal Care & Service (28.6%), and Healthcare Support (24.6%).
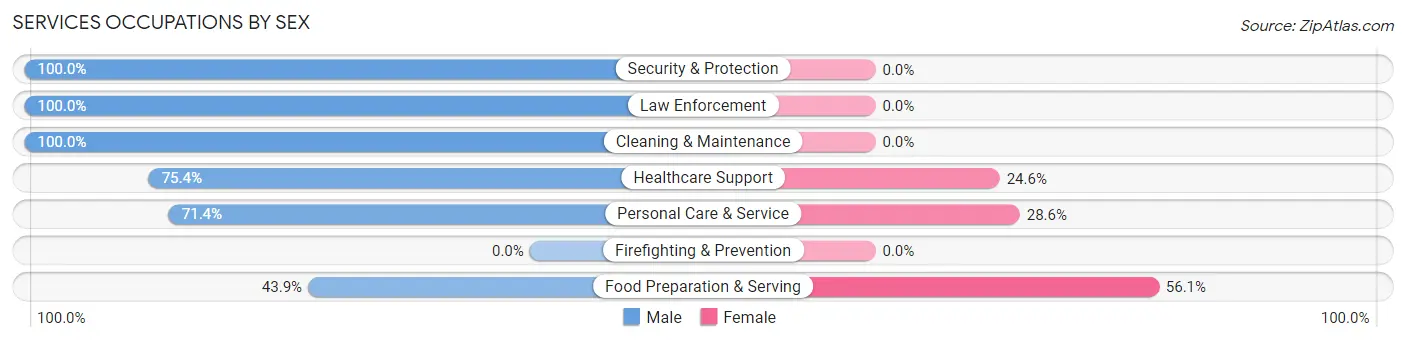
| Occupation | Male | Female |
| Healthcare Support | 46 (75.4%) | 15 (24.6%) |
| Security & Protection | 25 (100.0%) | 0 (0.0%) |
| Firefighting & Prevention | 0 (0.0%) | 0 (0.0%) |
| Law Enforcement | 25 (100.0%) | 0 (0.0%) |
| Food Preparation & Serving | 18 (43.9%) | 23 (56.1%) |
| Cleaning & Maintenance | 28 (100.0%) | 0 (0.0%) |
| Personal Care & Service | 130 (71.4%) | 52 (28.6%) |
| Total (Category) | 247 (73.3%) | 90 (26.7%) |
| Total (Overall) | 812 (56.7%) | 619 (43.3%) |
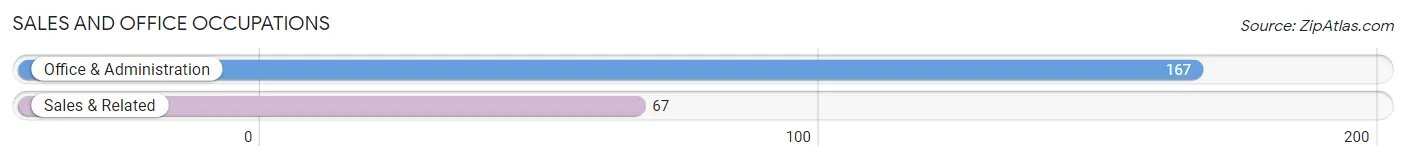
Sales and Office Occupations
The most common Sales and Office occupations in Skippers Corner are Office & Administration (167 | 11.7%), and Sales & Related (67 | 4.7%).
Sales and Office Occupations by Sex
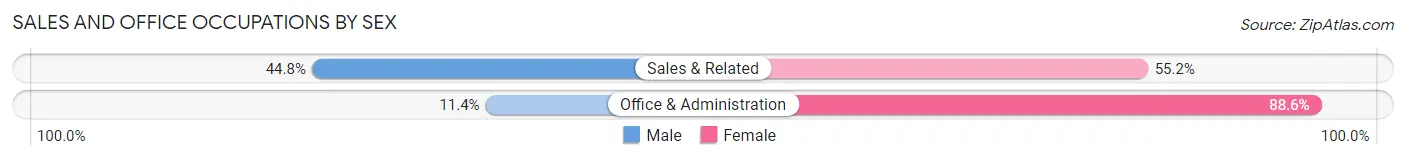
| Occupation | Male | Female |
| Sales & Related | 30 (44.8%) | 37 (55.2%) |
| Office & Administration | 19 (11.4%) | 148 (88.6%) |
| Total (Category) | 49 (20.9%) | 185 (79.1%) |
| Total (Overall) | 812 (56.7%) | 619 (43.3%) |
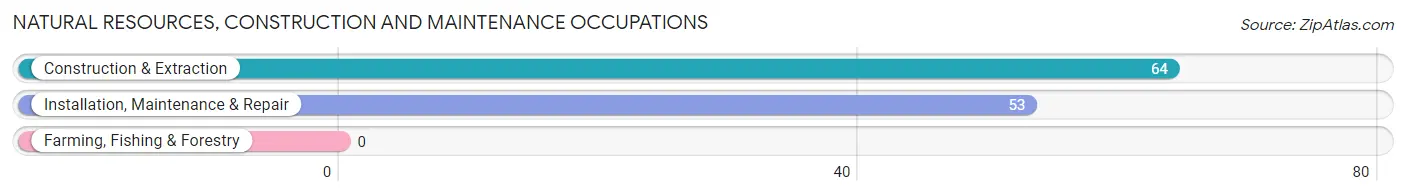
Natural Resources, Construction and Maintenance Occupations
The most common Natural Resources, Construction and Maintenance occupations in Skippers Corner are Construction & Extraction (64 | 4.5%), and Installation, Maintenance & Repair (53 | 3.7%).
Natural Resources, Construction and Maintenance Occupations by Sex
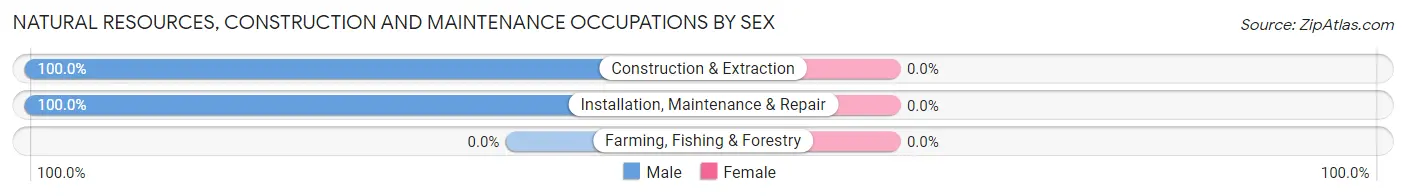
| Occupation | Male | Female |
| Farming, Fishing & Forestry | 0 (0.0%) | 0 (0.0%) |
| Construction & Extraction | 64 (100.0%) | 0 (0.0%) |
| Installation, Maintenance & Repair | 53 (100.0%) | 0 (0.0%) |
| Total (Category) | 117 (100.0%) | 0 (0.0%) |
| Total (Overall) | 812 (56.7%) | 619 (43.3%) |
Production, Transportation and Moving Occupations
The most common Production, Transportation and Moving occupations in Skippers Corner are Production (136 | 9.5%), Material Moving (69 | 4.8%), and Transportation (57 | 4.0%).
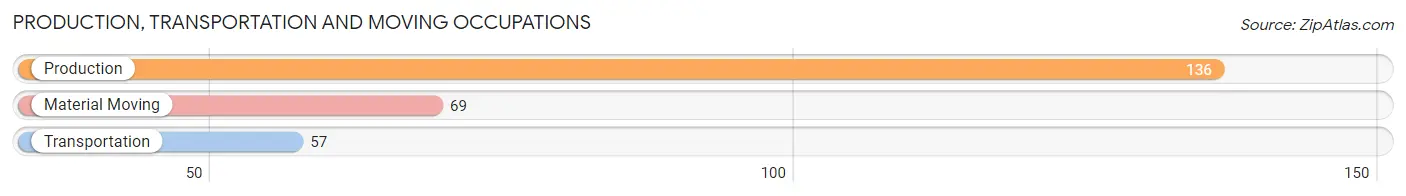
Production, Transportation and Moving Occupations by Sex
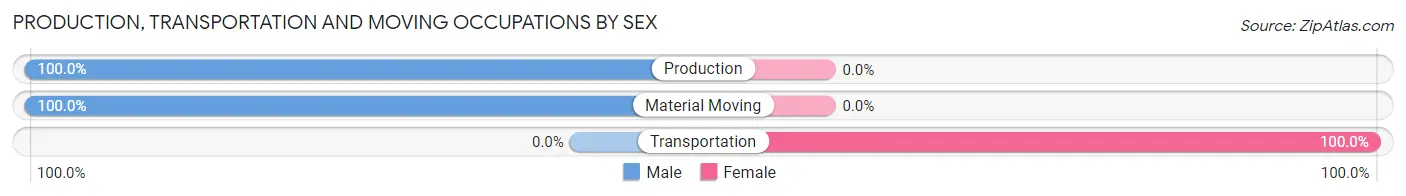
| Occupation | Male | Female |
| Production | 136 (100.0%) | 0 (0.0%) |
| Transportation | 0 (0.0%) | 57 (100.0%) |
| Material Moving | 69 (100.0%) | 0 (0.0%) |
| Total (Category) | 205 (78.2%) | 57 (21.8%) |
| Total (Overall) | 812 (56.7%) | 619 (43.3%) |
Employment Industries by Sex in Skippers Corner
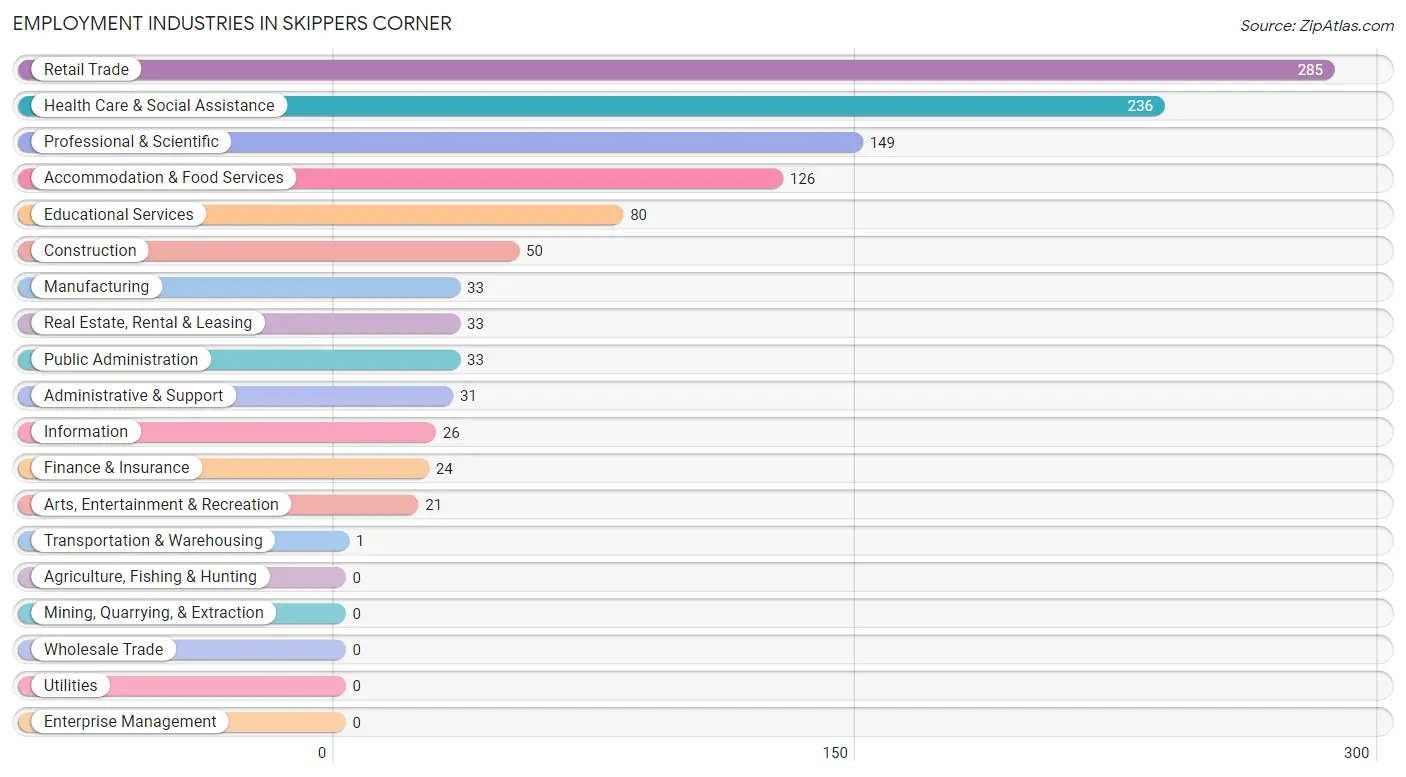
Employment Industries in Skippers Corner
The major employment industries in Skippers Corner include Retail Trade (285 | 19.9%), Health Care & Social Assistance (236 | 16.5%), Professional & Scientific (149 | 10.4%), Accommodation & Food Services (126 | 8.8%), and Educational Services (80 | 5.6%).
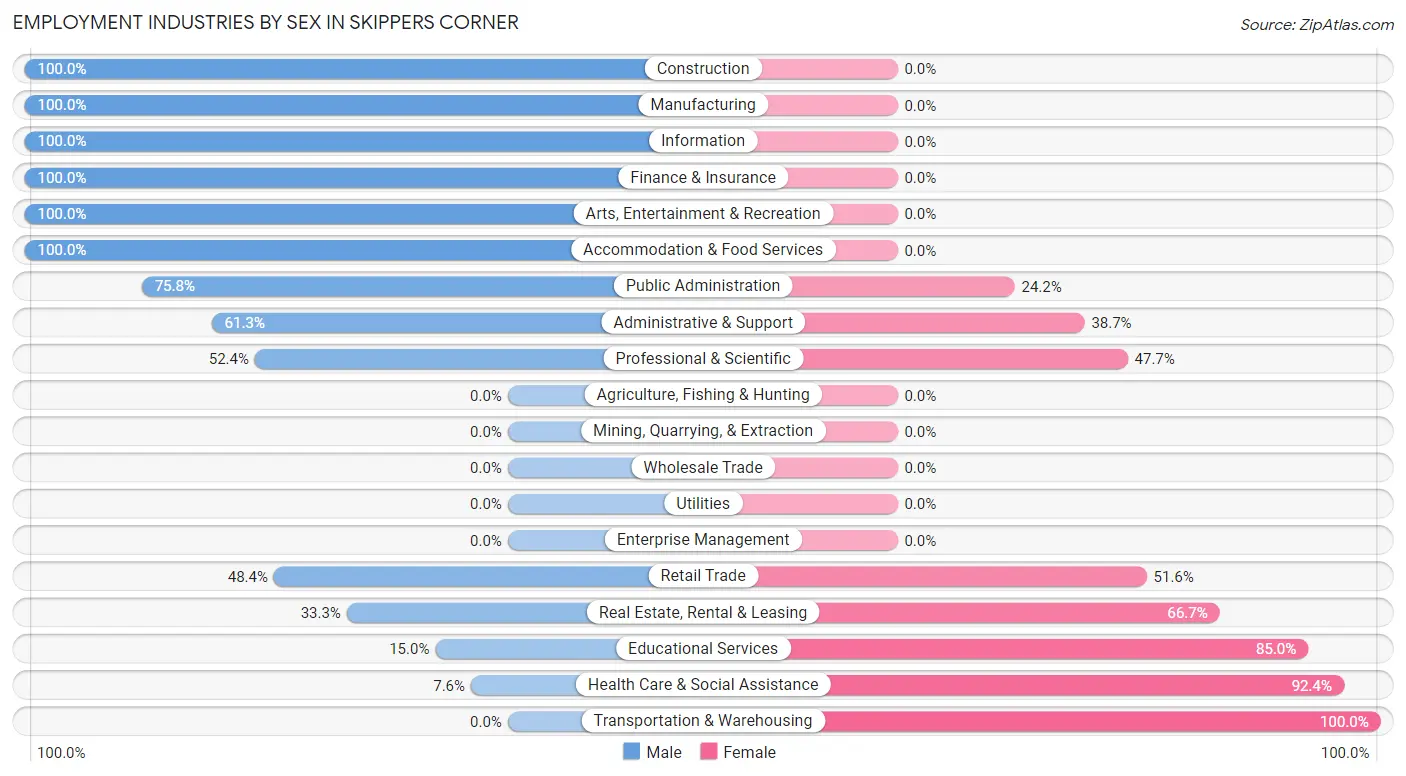
Employment Industries by Sex in Skippers Corner
The Skippers Corner industries that see more men than women are Construction (100.0%), Manufacturing (100.0%), and Information (100.0%), whereas the industries that tend to have a higher number of women are Transportation & Warehousing (100.0%), Health Care & Social Assistance (92.4%), and Educational Services (85.0%).
| Industry | Male | Female |
| Agriculture, Fishing & Hunting | 0 (0.0%) | 0 (0.0%) |
| Mining, Quarrying, & Extraction | 0 (0.0%) | 0 (0.0%) |
| Construction | 50 (100.0%) | 0 (0.0%) |
| Manufacturing | 33 (100.0%) | 0 (0.0%) |
| Wholesale Trade | 0 (0.0%) | 0 (0.0%) |
| Retail Trade | 138 (48.4%) | 147 (51.6%) |
| Transportation & Warehousing | 0 (0.0%) | 1 (100.0%) |
| Utilities | 0 (0.0%) | 0 (0.0%) |
| Information | 26 (100.0%) | 0 (0.0%) |
| Finance & Insurance | 24 (100.0%) | 0 (0.0%) |
| Real Estate, Rental & Leasing | 11 (33.3%) | 22 (66.7%) |
| Professional & Scientific | 78 (52.3%) | 71 (47.6%) |
| Enterprise Management | 0 (0.0%) | 0 (0.0%) |
| Administrative & Support | 19 (61.3%) | 12 (38.7%) |
| Educational Services | 12 (15.0%) | 68 (85.0%) |
| Health Care & Social Assistance | 18 (7.6%) | 218 (92.4%) |
| Arts, Entertainment & Recreation | 21 (100.0%) | 0 (0.0%) |
| Accommodation & Food Services | 126 (100.0%) | 0 (0.0%) |
| Public Administration | 25 (75.8%) | 8 (24.2%) |
| Total | 812 (56.7%) | 619 (43.3%) |
Education in Skippers Corner
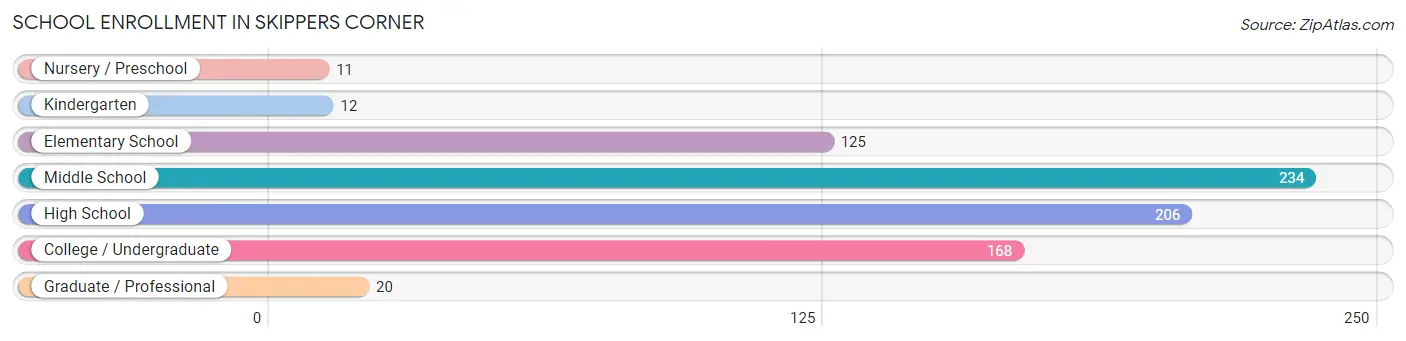
School Enrollment in Skippers Corner
The most common levels of schooling among the 776 students in Skippers Corner are middle school (234 | 30.1%), high school (206 | 26.6%), and college / undergraduate (168 | 21.6%).
| School Level | # Students | % Students |
| Nursery / Preschool | 11 | 1.4% |
| Kindergarten | 12 | 1.5% |
| Elementary School | 125 | 16.1% |
| Middle School | 234 | 30.1% |
| High School | 206 | 26.6% |
| College / Undergraduate | 168 | 21.6% |
| Graduate / Professional | 20 | 2.6% |
| Total | 776 | 100.0% |
School Enrollment by Age by Funding Source in Skippers Corner
Out of a total of 776 students who are enrolled in schools in Skippers Corner, 102 (13.1%) attend a private institution, while the remaining 674 (86.9%) are enrolled in public schools. The age group of 3 to 4 year olds has the highest likelihood of being enrolled in private schools, with 11 (100.0% in the age bracket) enrolled. Conversely, the age group of 15 to 17 year olds has the lowest likelihood of being enrolled in a private school, with 65 (100.0% in the age bracket) attending a public institution.
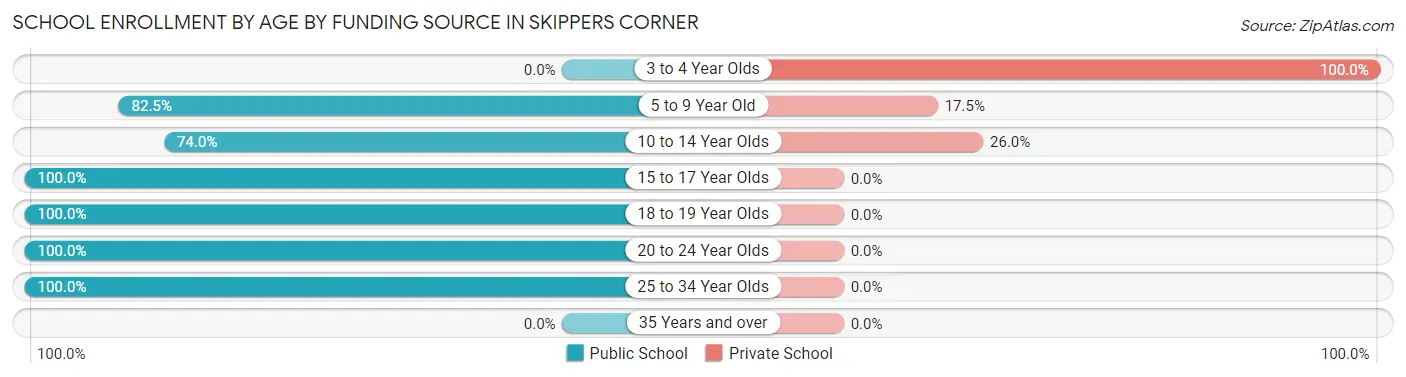
| Age Bracket | Public School | Private School |
| 3 to 4 Year Olds | 0 (0.0%) | 11 (100.0%) |
| 5 to 9 Year Old | 113 (82.5%) | 24 (17.5%) |
| 10 to 14 Year Olds | 191 (74.0%) | 67 (26.0%) |
| 15 to 17 Year Olds | 65 (100.0%) | 0 (0.0%) |
| 18 to 19 Year Olds | 168 (100.0%) | 0 (0.0%) |
| 20 to 24 Year Olds | 117 (100.0%) | 0 (0.0%) |
| 25 to 34 Year Olds | 20 (100.0%) | 0 (0.0%) |
| 35 Years and over | 0 (0.0%) | 0 (0.0%) |
| Total | 674 (86.9%) | 102 (13.1%) |
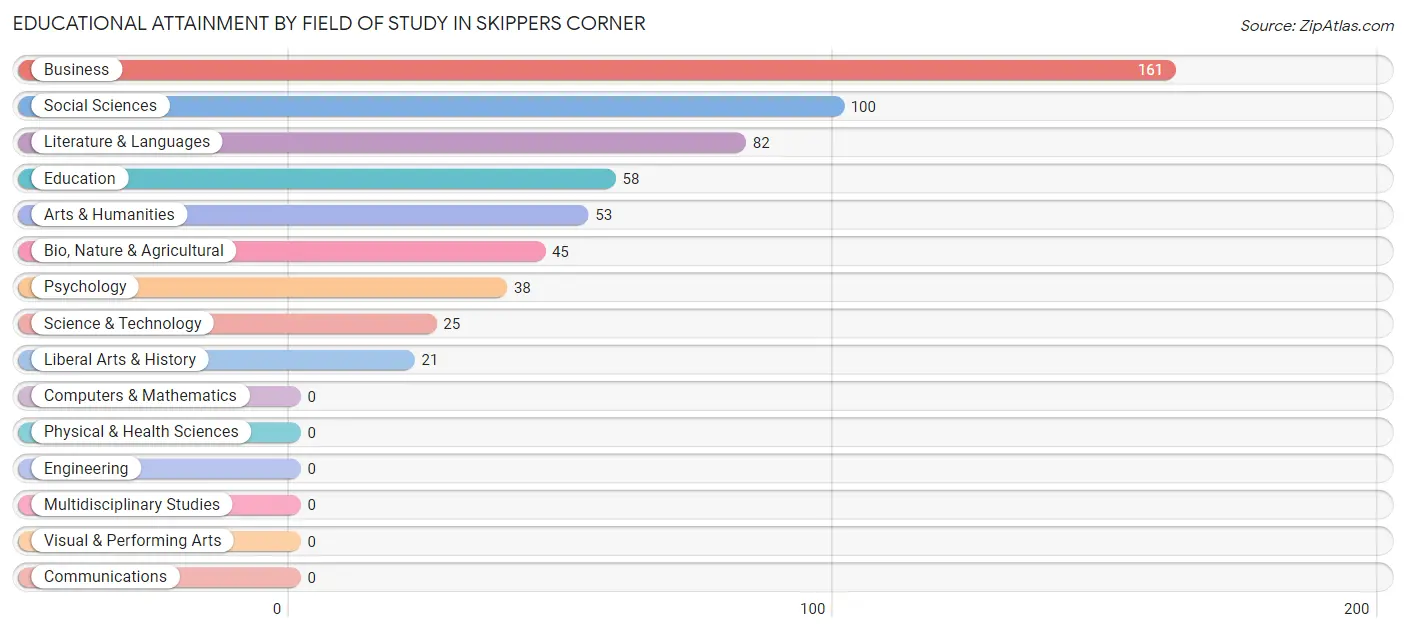
Educational Attainment by Field of Study in Skippers Corner
Business (161 | 27.6%), social sciences (100 | 17.2%), literature & languages (82 | 14.1%), education (58 | 10.0%), and arts & humanities (53 | 9.1%) are the most common fields of study among 583 individuals in Skippers Corner who have obtained a bachelor's degree or higher.
| Field of Study | # Graduates | % Graduates |
| Computers & Mathematics | 0 | 0.0% |
| Bio, Nature & Agricultural | 45 | 7.7% |
| Physical & Health Sciences | 0 | 0.0% |
| Psychology | 38 | 6.5% |
| Social Sciences | 100 | 17.2% |
| Engineering | 0 | 0.0% |
| Multidisciplinary Studies | 0 | 0.0% |
| Science & Technology | 25 | 4.3% |
| Business | 161 | 27.6% |
| Education | 58 | 10.0% |
| Literature & Languages | 82 | 14.1% |
| Liberal Arts & History | 21 | 3.6% |
| Visual & Performing Arts | 0 | 0.0% |
| Communications | 0 | 0.0% |
| Arts & Humanities | 53 | 9.1% |
| Total | 583 | 100.0% |
Transportation & Commute in Skippers Corner
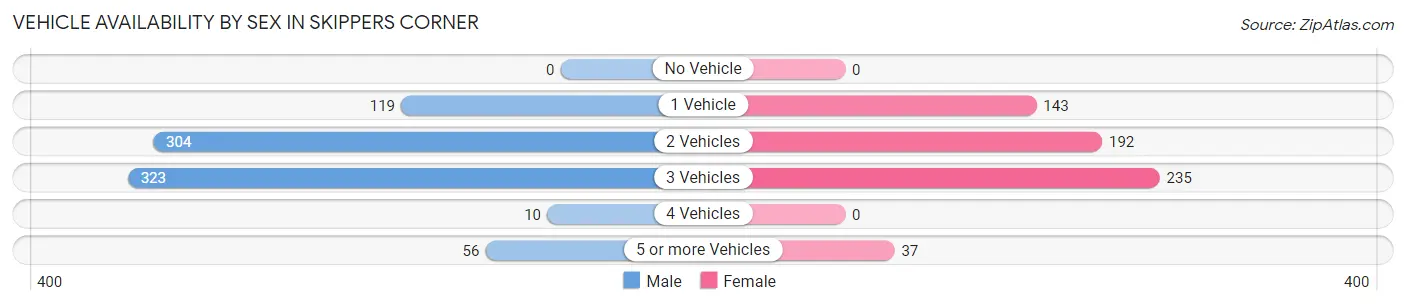
Vehicle Availability by Sex in Skippers Corner
The most prevalent vehicle ownership categories in Skippers Corner are males with 3 vehicles (323, accounting for 39.8%) and females with 3 vehicles (235, making up 53.2%).
| Vehicles Available | Male | Female |
| No Vehicle | 0 (0.0%) | 0 (0.0%) |
| 1 Vehicle | 119 (14.7%) | 143 (23.6%) |
| 2 Vehicles | 304 (37.4%) | 192 (31.6%) |
| 3 Vehicles | 323 (39.8%) | 235 (38.7%) |
| 4 Vehicles | 10 (1.2%) | 0 (0.0%) |
| 5 or more Vehicles | 56 (6.9%) | 37 (6.1%) |
| Total | 812 (100.0%) | 607 (100.0%) |
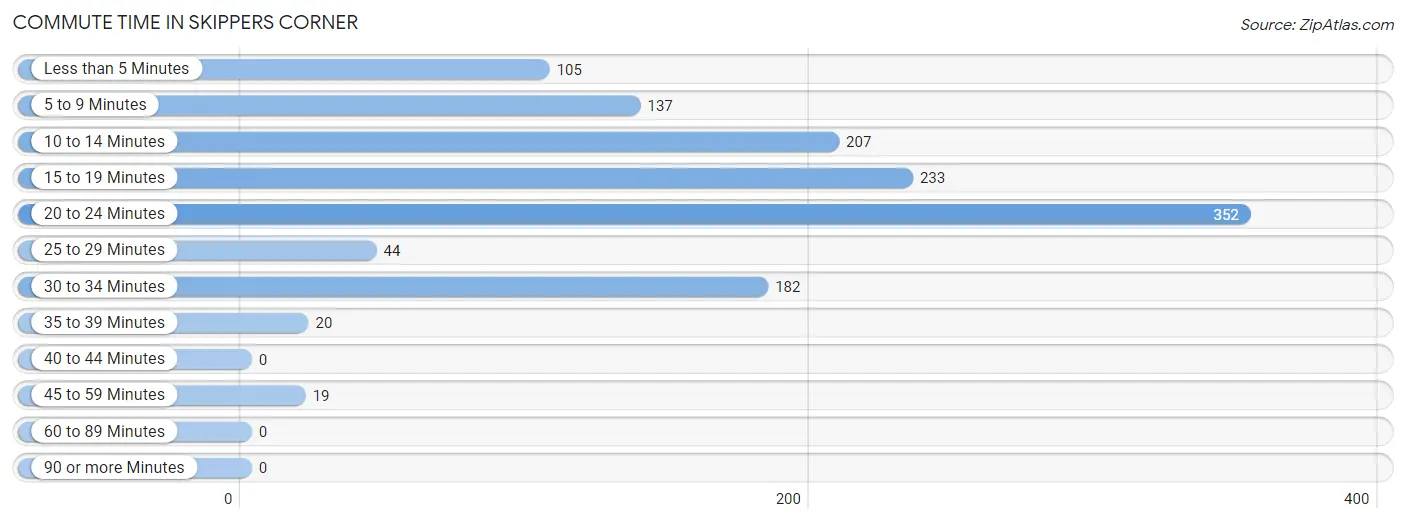
Commute Time in Skippers Corner
The most frequently occuring commute durations in Skippers Corner are 20 to 24 minutes (352 commuters, 27.1%), 15 to 19 minutes (233 commuters, 17.9%), and 10 to 14 minutes (207 commuters, 15.9%).
| Commute Time | # Commuters | % Commuters |
| Less than 5 Minutes | 105 | 8.1% |
| 5 to 9 Minutes | 137 | 10.5% |
| 10 to 14 Minutes | 207 | 15.9% |
| 15 to 19 Minutes | 233 | 17.9% |
| 20 to 24 Minutes | 352 | 27.1% |
| 25 to 29 Minutes | 44 | 3.4% |
| 30 to 34 Minutes | 182 | 14.0% |
| 35 to 39 Minutes | 20 | 1.5% |
| 40 to 44 Minutes | 0 | 0.0% |
| 45 to 59 Minutes | 19 | 1.5% |
| 60 to 89 Minutes | 0 | 0.0% |
| 90 or more Minutes | 0 | 0.0% |
Commute Time by Sex in Skippers Corner
The most common commute times in Skippers Corner are 20 to 24 minutes (235 commuters, 29.6%) for males and 20 to 24 minutes (117 commuters, 23.1%) for females.
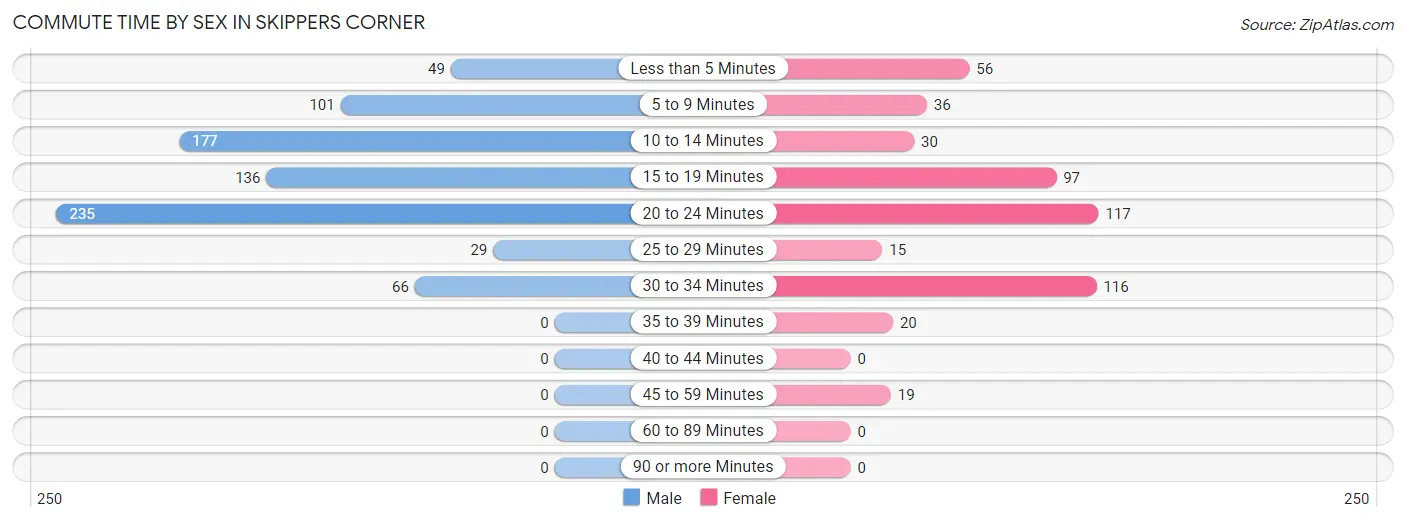
| Commute Time | Male | Female |
| Less than 5 Minutes | 49 (6.2%) | 56 (11.1%) |
| 5 to 9 Minutes | 101 (12.7%) | 36 (7.1%) |
| 10 to 14 Minutes | 177 (22.3%) | 30 (5.9%) |
| 15 to 19 Minutes | 136 (17.2%) | 97 (19.2%) |
| 20 to 24 Minutes | 235 (29.6%) | 117 (23.1%) |
| 25 to 29 Minutes | 29 (3.7%) | 15 (3.0%) |
| 30 to 34 Minutes | 66 (8.3%) | 116 (22.9%) |
| 35 to 39 Minutes | 0 (0.0%) | 20 (4.0%) |
| 40 to 44 Minutes | 0 (0.0%) | 0 (0.0%) |
| 45 to 59 Minutes | 0 (0.0%) | 19 (3.7%) |
| 60 to 89 Minutes | 0 (0.0%) | 0 (0.0%) |
| 90 or more Minutes | 0 (0.0%) | 0 (0.0%) |
Time of Departure to Work by Sex in Skippers Corner
The most frequent times of departure to work in Skippers Corner are 9:00 AM to 9:59 AM (139, 17.5%) for males and 7:30 AM to 7:59 AM (150, 29.6%) for females.
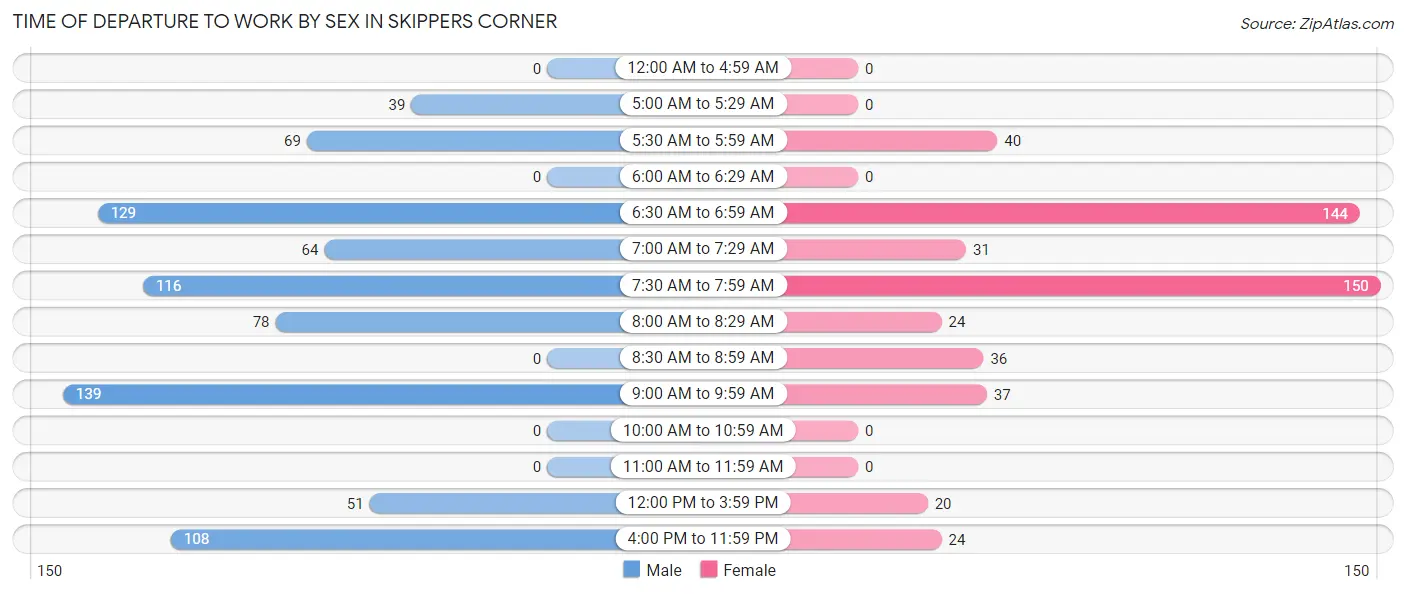
| Time of Departure | Male | Female |
| 12:00 AM to 4:59 AM | 0 (0.0%) | 0 (0.0%) |
| 5:00 AM to 5:29 AM | 39 (4.9%) | 0 (0.0%) |
| 5:30 AM to 5:59 AM | 69 (8.7%) | 40 (7.9%) |
| 6:00 AM to 6:29 AM | 0 (0.0%) | 0 (0.0%) |
| 6:30 AM to 6:59 AM | 129 (16.3%) | 144 (28.5%) |
| 7:00 AM to 7:29 AM | 64 (8.1%) | 31 (6.1%) |
| 7:30 AM to 7:59 AM | 116 (14.6%) | 150 (29.6%) |
| 8:00 AM to 8:29 AM | 78 (9.8%) | 24 (4.7%) |
| 8:30 AM to 8:59 AM | 0 (0.0%) | 36 (7.1%) |
| 9:00 AM to 9:59 AM | 139 (17.5%) | 37 (7.3%) |
| 10:00 AM to 10:59 AM | 0 (0.0%) | 0 (0.0%) |
| 11:00 AM to 11:59 AM | 0 (0.0%) | 0 (0.0%) |
| 12:00 PM to 3:59 PM | 51 (6.4%) | 20 (4.0%) |
| 4:00 PM to 11:59 PM | 108 (13.6%) | 24 (4.7%) |
| Total | 793 (100.0%) | 506 (100.0%) |
Housing Occupancy in Skippers Corner
Occupancy by Ownership in Skippers Corner
Of the total 1,204 dwellings in Skippers Corner, owner-occupied units account for 1,006 (83.6%), while renter-occupied units make up 198 (16.5%).
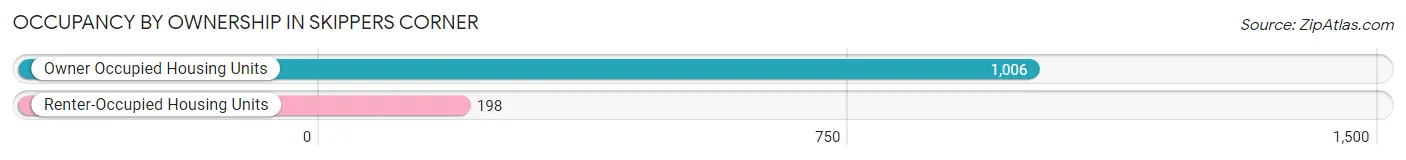
| Occupancy | # Housing Units | % Housing Units |
| Owner Occupied Housing Units | 1,006 | 83.6% |
| Renter-Occupied Housing Units | 198 | 16.5% |
| Total Occupied Housing Units | 1,204 | 100.0% |
Occupancy by Household Size in Skippers Corner
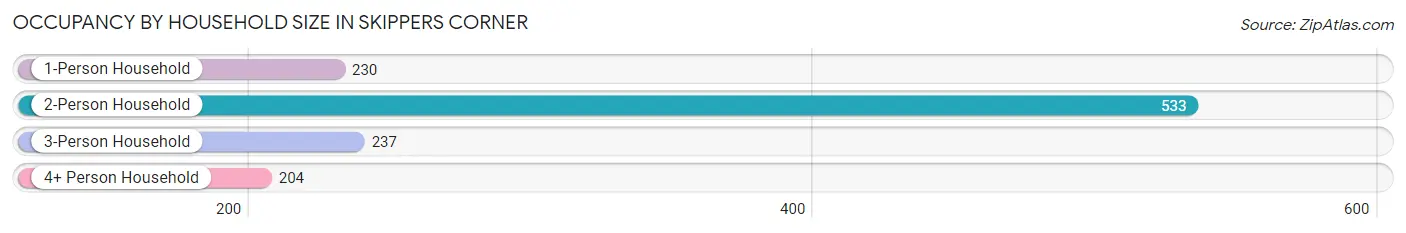
| Household Size | # Housing Units | % Housing Units |
| 1-Person Household | 230 | 19.1% |
| 2-Person Household | 533 | 44.3% |
| 3-Person Household | 237 | 19.7% |
| 4+ Person Household | 204 | 16.9% |
| Total Housing Units | 1,204 | 100.0% |
Occupancy by Ownership by Household Size in Skippers Corner
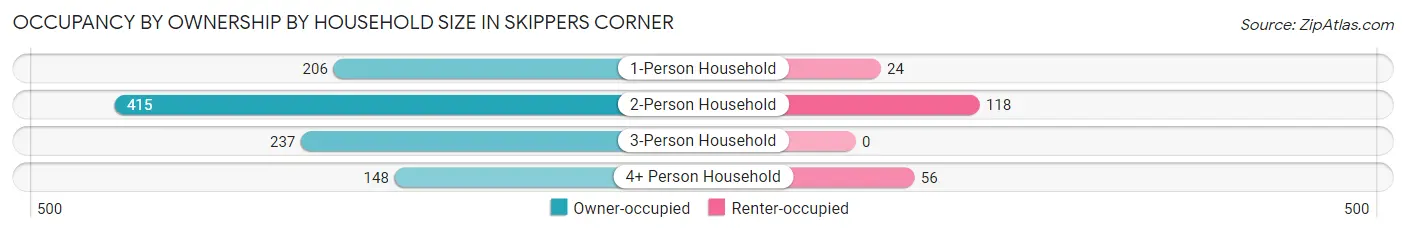
| Household Size | Owner-occupied | Renter-occupied |
| 1-Person Household | 206 (89.6%) | 24 (10.4%) |
| 2-Person Household | 415 (77.9%) | 118 (22.1%) |
| 3-Person Household | 237 (100.0%) | 0 (0.0%) |
| 4+ Person Household | 148 (72.6%) | 56 (27.5%) |
| Total Housing Units | 1,006 (83.6%) | 198 (16.5%) |
Occupancy by Educational Attainment in Skippers Corner
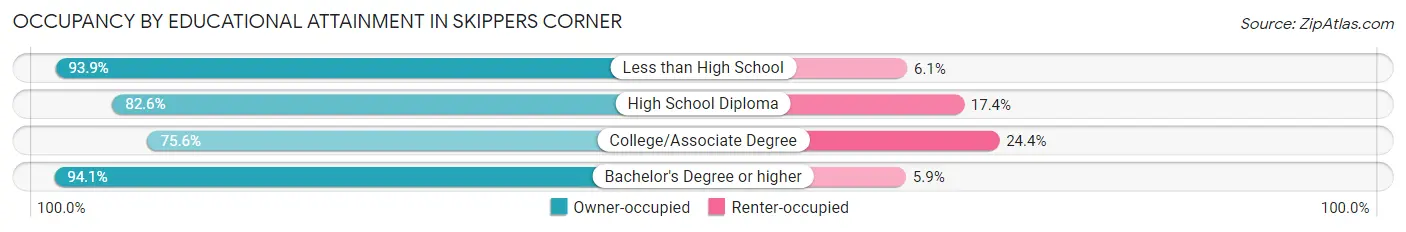
| Household Size | Owner-occupied | Renter-occupied |
| Less than High School | 46 (93.9%) | 3 (6.1%) |
| High School Diploma | 247 (82.6%) | 52 (17.4%) |
| College/Associate Degree | 378 (75.6%) | 122 (24.4%) |
| Bachelor's Degree or higher | 335 (94.1%) | 21 (5.9%) |
Occupancy by Age of Householder in Skippers Corner
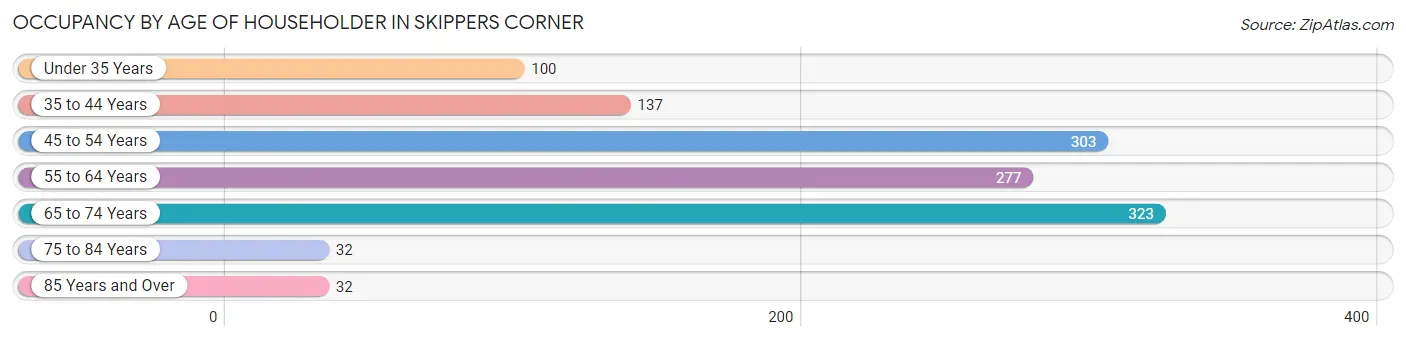
| Age Bracket | # Households | % Households |
| Under 35 Years | 100 | 8.3% |
| 35 to 44 Years | 137 | 11.4% |
| 45 to 54 Years | 303 | 25.2% |
| 55 to 64 Years | 277 | 23.0% |
| 65 to 74 Years | 323 | 26.8% |
| 75 to 84 Years | 32 | 2.7% |
| 85 Years and Over | 32 | 2.7% |
| Total | 1,204 | 100.0% |
Housing Finances in Skippers Corner
Median Income by Occupancy in Skippers Corner
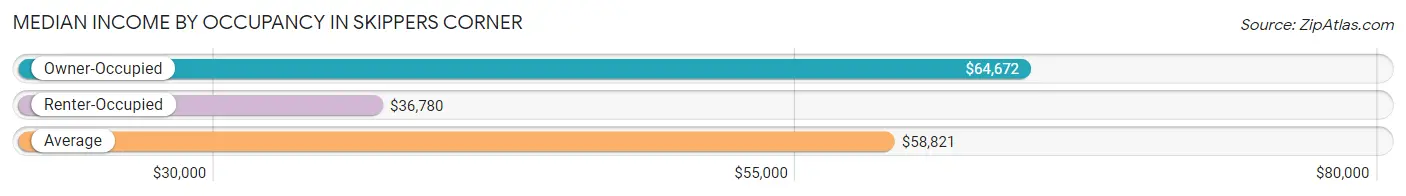
| Occupancy Type | # Households | Median Income |
| Owner-Occupied | 1,006 (83.6%) | $64,672 |
| Renter-Occupied | 198 (16.5%) | $36,780 |
| Average | 1,204 (100.0%) | $58,821 |
Occupancy by Householder Income Bracket in Skippers Corner
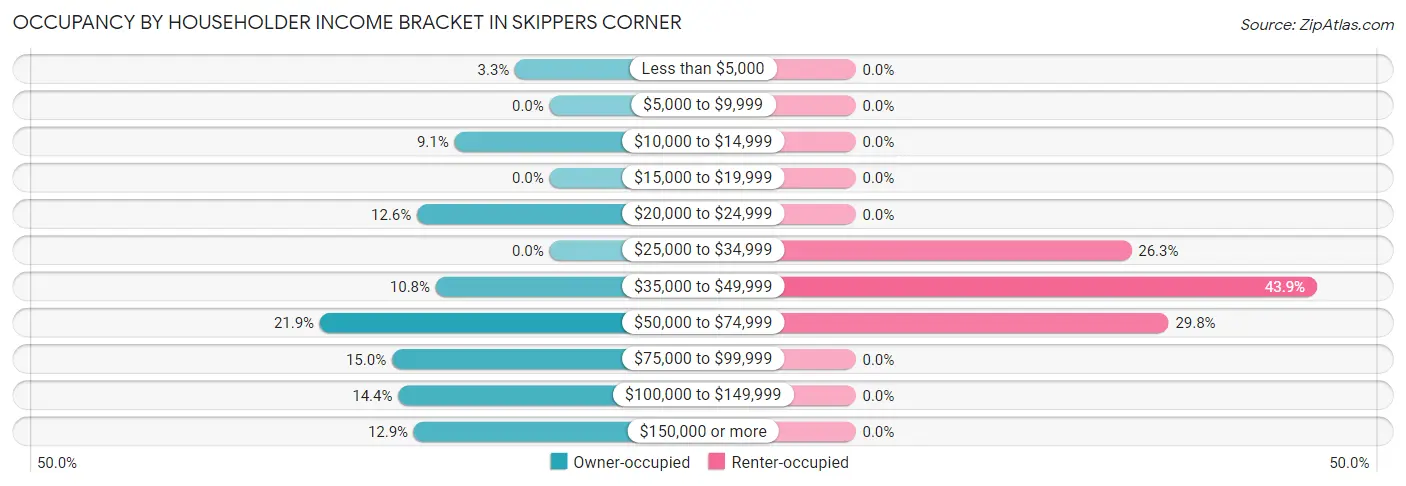
| Income Bracket | Owner-occupied | Renter-occupied |
| Less than $5,000 | 33 (3.3%) | 0 (0.0%) |
| $5,000 to $9,999 | 0 (0.0%) | 0 (0.0%) |
| $10,000 to $14,999 | 91 (9.0%) | 0 (0.0%) |
| $15,000 to $19,999 | 0 (0.0%) | 0 (0.0%) |
| $20,000 to $24,999 | 127 (12.6%) | 0 (0.0%) |
| $25,000 to $34,999 | 0 (0.0%) | 52 (26.3%) |
| $35,000 to $49,999 | 109 (10.8%) | 87 (43.9%) |
| $50,000 to $74,999 | 220 (21.9%) | 59 (29.8%) |
| $75,000 to $99,999 | 151 (15.0%) | 0 (0.0%) |
| $100,000 to $149,999 | 145 (14.4%) | 0 (0.0%) |
| $150,000 or more | 130 (12.9%) | 0 (0.0%) |
| Total | 1,006 (100.0%) | 198 (100.0%) |
Monthly Housing Cost Tiers in Skippers Corner
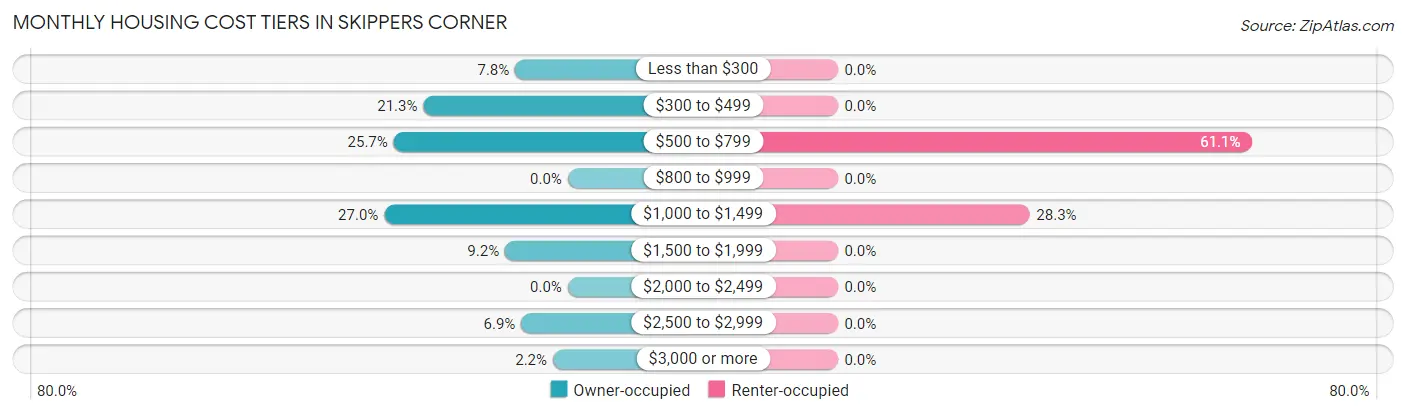
| Monthly Cost | Owner-occupied | Renter-occupied |
| Less than $300 | 78 (7.7%) | 0 (0.0%) |
| $300 to $499 | 214 (21.3%) | 0 (0.0%) |
| $500 to $799 | 258 (25.7%) | 121 (61.1%) |
| $800 to $999 | 0 (0.0%) | 0 (0.0%) |
| $1,000 to $1,499 | 272 (27.0%) | 56 (28.3%) |
| $1,500 to $1,999 | 93 (9.2%) | 0 (0.0%) |
| $2,000 to $2,499 | 0 (0.0%) | 0 (0.0%) |
| $2,500 to $2,999 | 69 (6.9%) | 0 (0.0%) |
| $3,000 or more | 22 (2.2%) | 0 (0.0%) |
| Total | 1,006 (100.0%) | 198 (100.0%) |
Physical Housing Characteristics in Skippers Corner
Housing Structures in Skippers Corner
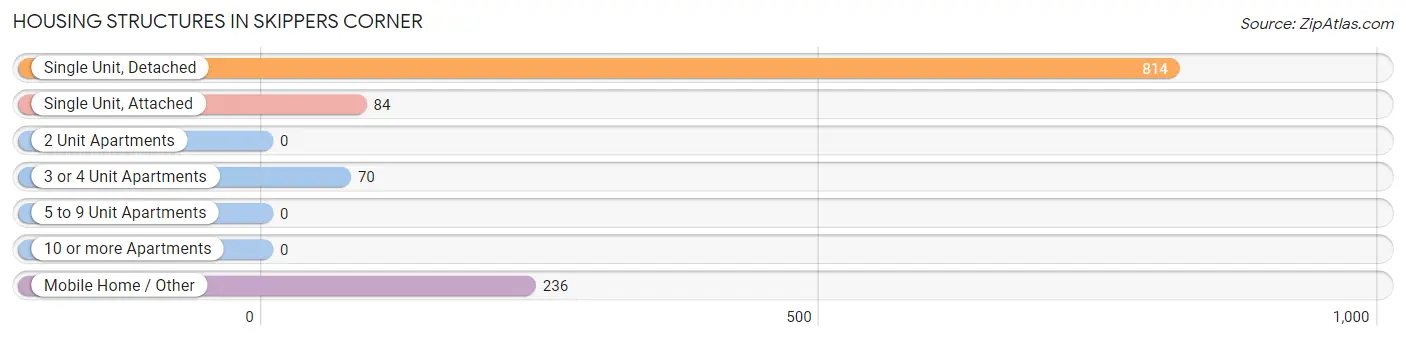
| Structure Type | # Housing Units | % Housing Units |
| Single Unit, Detached | 814 | 67.6% |
| Single Unit, Attached | 84 | 7.0% |
| 2 Unit Apartments | 0 | 0.0% |
| 3 or 4 Unit Apartments | 70 | 5.8% |
| 5 to 9 Unit Apartments | 0 | 0.0% |
| 10 or more Apartments | 0 | 0.0% |
| Mobile Home / Other | 236 | 19.6% |
| Total | 1,204 | 100.0% |
Housing Structures by Occupancy in Skippers Corner
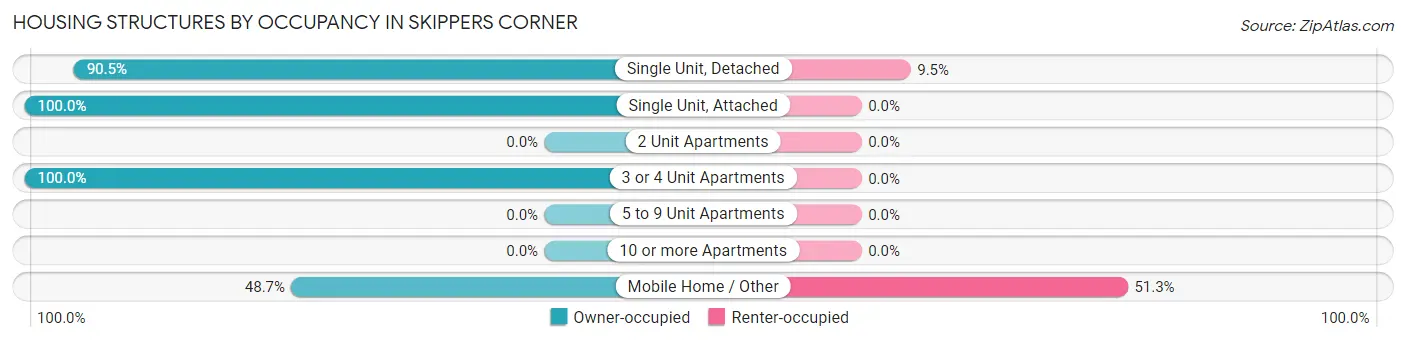
| Structure Type | Owner-occupied | Renter-occupied |
| Single Unit, Detached | 737 (90.5%) | 77 (9.5%) |
| Single Unit, Attached | 84 (100.0%) | 0 (0.0%) |
| 2 Unit Apartments | 0 (0.0%) | 0 (0.0%) |
| 3 or 4 Unit Apartments | 70 (100.0%) | 0 (0.0%) |
| 5 to 9 Unit Apartments | 0 (0.0%) | 0 (0.0%) |
| 10 or more Apartments | 0 (0.0%) | 0 (0.0%) |
| Mobile Home / Other | 115 (48.7%) | 121 (51.3%) |
| Total | 1,006 (83.6%) | 198 (16.5%) |
Housing Structures by Number of Rooms in Skippers Corner
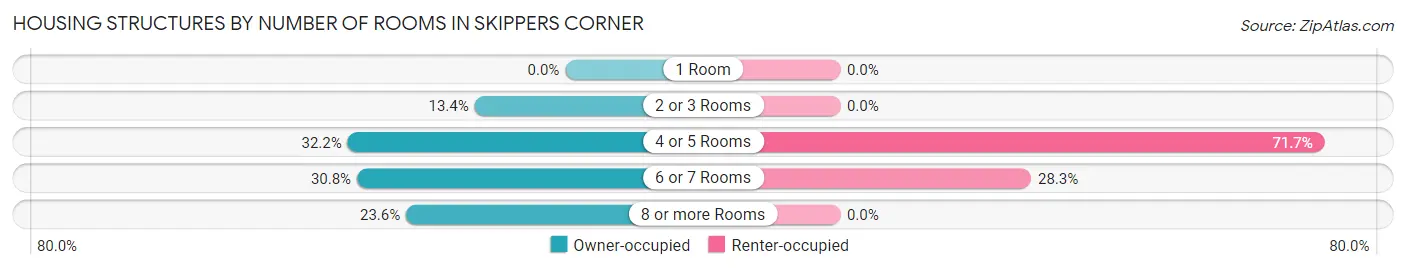
| Number of Rooms | Owner-occupied | Renter-occupied |
| 1 Room | 0 (0.0%) | 0 (0.0%) |
| 2 or 3 Rooms | 135 (13.4%) | 0 (0.0%) |
| 4 or 5 Rooms | 324 (32.2%) | 142 (71.7%) |
| 6 or 7 Rooms | 310 (30.8%) | 56 (28.3%) |
| 8 or more Rooms | 237 (23.6%) | 0 (0.0%) |
| Total | 1,006 (100.0%) | 198 (100.0%) |
Housing Structure by Heating Type in Skippers Corner
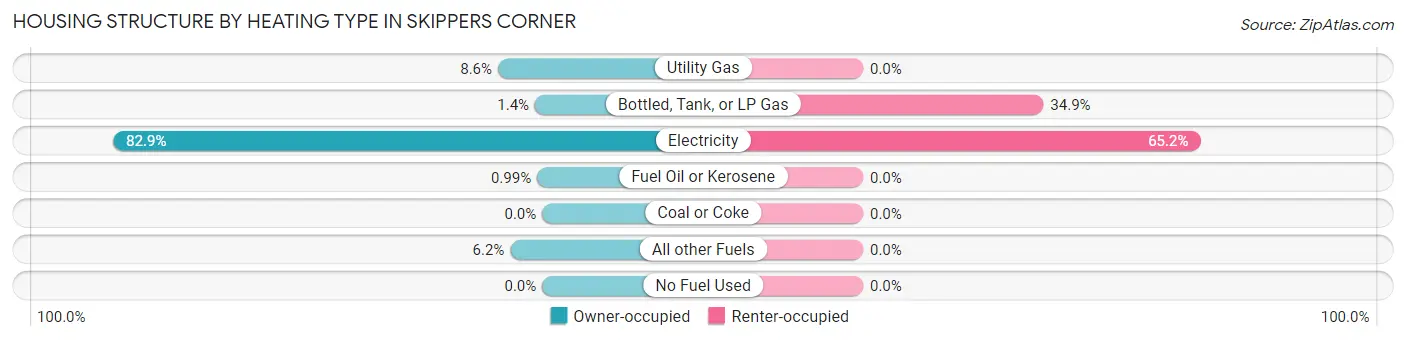
| Heating Type | Owner-occupied | Renter-occupied |
| Utility Gas | 86 (8.6%) | 0 (0.0%) |
| Bottled, Tank, or LP Gas | 14 (1.4%) | 69 (34.8%) |
| Electricity | 834 (82.9%) | 129 (65.1%) |
| Fuel Oil or Kerosene | 10 (1.0%) | 0 (0.0%) |
| Coal or Coke | 0 (0.0%) | 0 (0.0%) |
| All other Fuels | 62 (6.2%) | 0 (0.0%) |
| No Fuel Used | 0 (0.0%) | 0 (0.0%) |
| Total | 1,006 (100.0%) | 198 (100.0%) |
Household Vehicle Usage in Skippers Corner
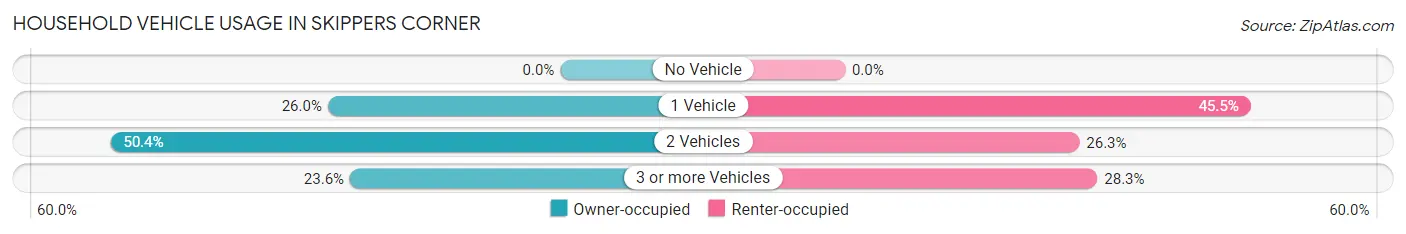
| Vehicles per Household | Owner-occupied | Renter-occupied |
| No Vehicle | 0 (0.0%) | 0 (0.0%) |
| 1 Vehicle | 262 (26.0%) | 90 (45.5%) |
| 2 Vehicles | 507 (50.4%) | 52 (26.3%) |
| 3 or more Vehicles | 237 (23.6%) | 56 (28.3%) |
| Total | 1,006 (100.0%) | 198 (100.0%) |
Real Estate & Mortgages in Skippers Corner
Real Estate and Mortgage Overview in Skippers Corner
| Characteristic | Without Mortgage | With Mortgage |
| Housing Units | 382 | 624 |
| Median Property Value | $226,200 | $186,200 |
| Median Household Income | $38,516 | $109 |
| Monthly Housing Costs | $418 | $22 |
| Real Estate Taxes | $1,269 | $18 |
Property Value by Mortgage Status in Skippers Corner
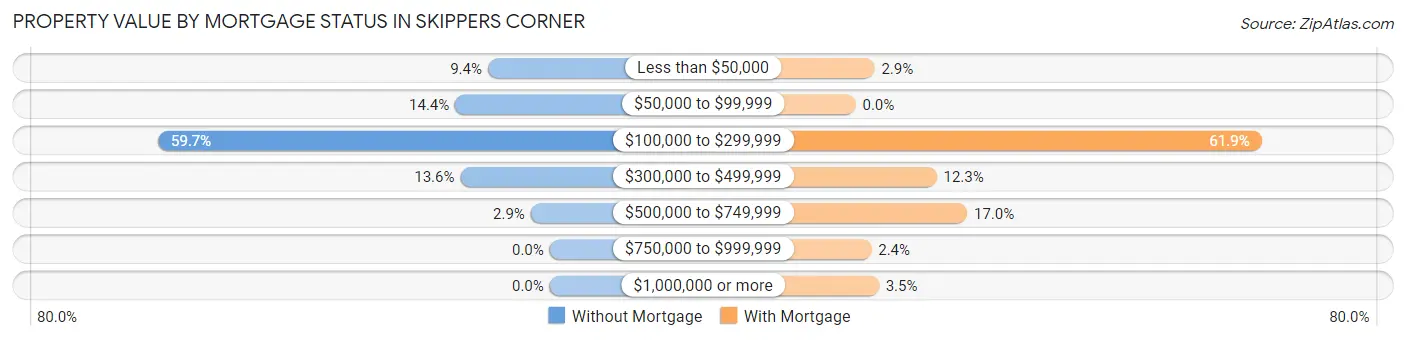
| Property Value | Without Mortgage | With Mortgage |
| Less than $50,000 | 36 (9.4%) | 18 (2.9%) |
| $50,000 to $99,999 | 55 (14.4%) | 0 (0.0%) |
| $100,000 to $299,999 | 228 (59.7%) | 386 (61.9%) |
| $300,000 to $499,999 | 52 (13.6%) | 77 (12.3%) |
| $500,000 to $749,999 | 11 (2.9%) | 106 (17.0%) |
| $750,000 to $999,999 | 0 (0.0%) | 15 (2.4%) |
| $1,000,000 or more | 0 (0.0%) | 22 (3.5%) |
| Total | 382 (100.0%) | 624 (100.0%) |
Household Income by Mortgage Status in Skippers Corner
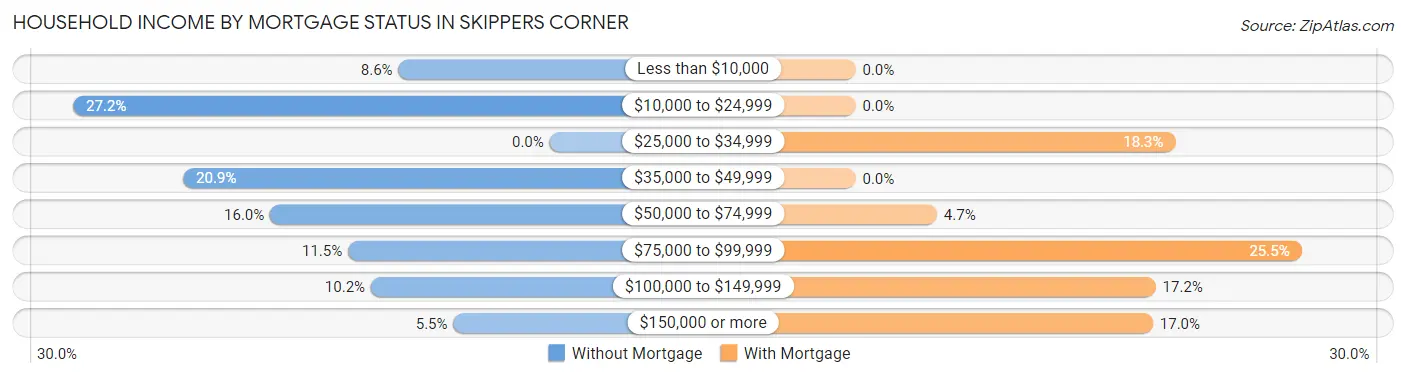
| Household Income | Without Mortgage | With Mortgage |
| Less than $10,000 | 33 (8.6%) | 0 (0.0%) |
| $10,000 to $24,999 | 104 (27.2%) | 0 (0.0%) |
| $25,000 to $34,999 | 0 (0.0%) | 114 (18.3%) |
| $35,000 to $49,999 | 80 (20.9%) | 0 (0.0%) |
| $50,000 to $74,999 | 61 (16.0%) | 29 (4.6%) |
| $75,000 to $99,999 | 44 (11.5%) | 159 (25.5%) |
| $100,000 to $149,999 | 39 (10.2%) | 107 (17.2%) |
| $150,000 or more | 21 (5.5%) | 106 (17.0%) |
| Total | 382 (100.0%) | 624 (100.0%) |
Property Value to Household Income Ratio in Skippers Corner
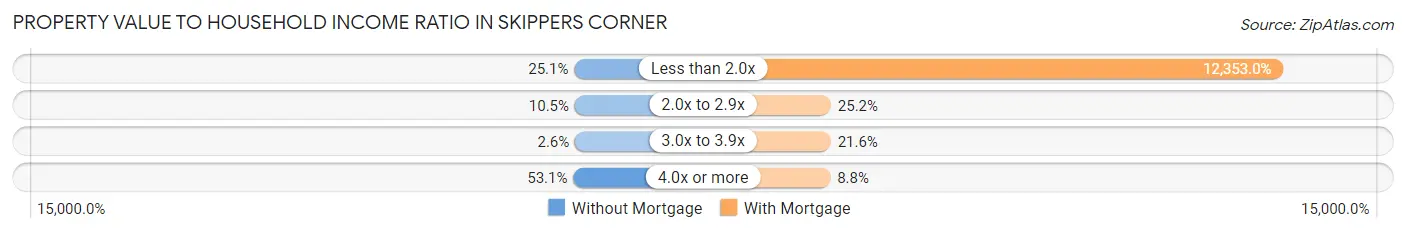
| Value-to-Income Ratio | Without Mortgage | With Mortgage |
| Less than 2.0x | 96 (25.1%) | 77,083 (12,353.0%) |
| 2.0x to 2.9x | 40 (10.5%) | 157 (25.2%) |
| 3.0x to 3.9x | 10 (2.6%) | 135 (21.6%) |
| 4.0x or more | 203 (53.1%) | 55 (8.8%) |
| Total | 382 (100.0%) | 624 (100.0%) |
Real Estate Taxes by Mortgage Status in Skippers Corner
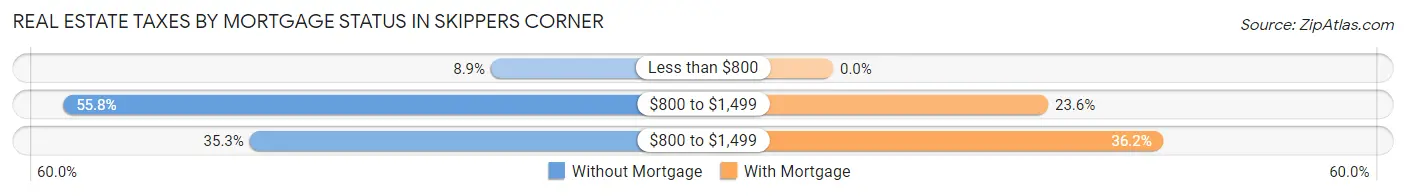
| Property Taxes | Without Mortgage | With Mortgage |
| Less than $800 | 34 (8.9%) | 0 (0.0%) |
| $800 to $1,499 | 213 (55.8%) | 147 (23.6%) |
| $800 to $1,499 | 135 (35.3%) | 226 (36.2%) |
| Total | 382 (100.0%) | 624 (100.0%) |
Health & Disability in Skippers Corner
Health Insurance Coverage by Age in Skippers Corner
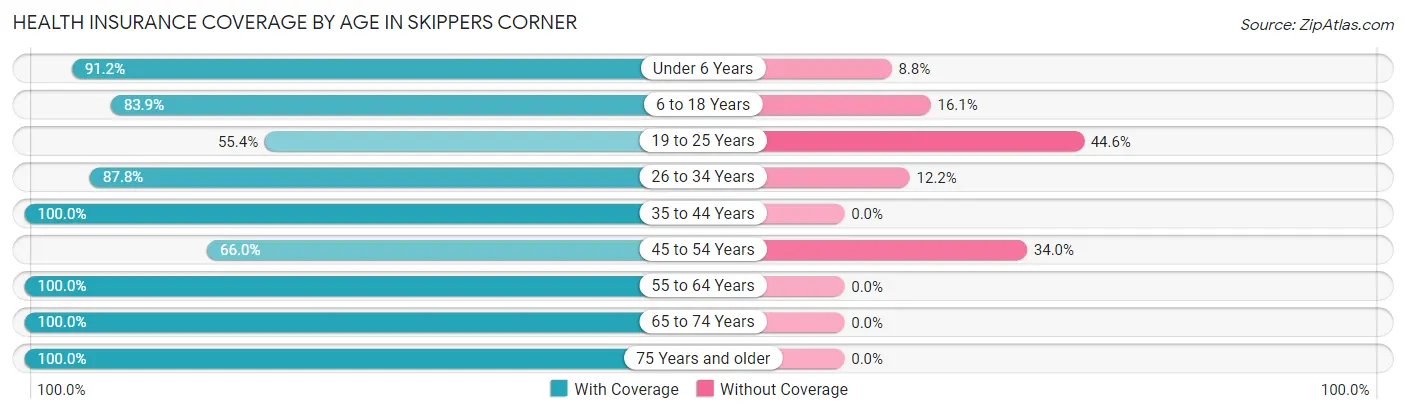
| Age Bracket | With Coverage | Without Coverage |
| Under 6 Years | 114 (91.2%) | 11 (8.8%) |
| 6 to 18 Years | 475 (83.9%) | 91 (16.1%) |
| 19 to 25 Years | 217 (55.4%) | 175 (44.6%) |
| 26 to 34 Years | 238 (87.8%) | 33 (12.2%) |
| 35 to 44 Years | 161 (100.0%) | 0 (0.0%) |
| 45 to 54 Years | 281 (66.0%) | 145 (34.0%) |
| 55 to 64 Years | 552 (100.0%) | 0 (0.0%) |
| 65 to 74 Years | 463 (100.0%) | 0 (0.0%) |
| 75 Years and older | 114 (100.0%) | 0 (0.0%) |
| Total | 2,615 (85.2%) | 455 (14.8%) |
Health Insurance Coverage by Citizenship Status in Skippers Corner
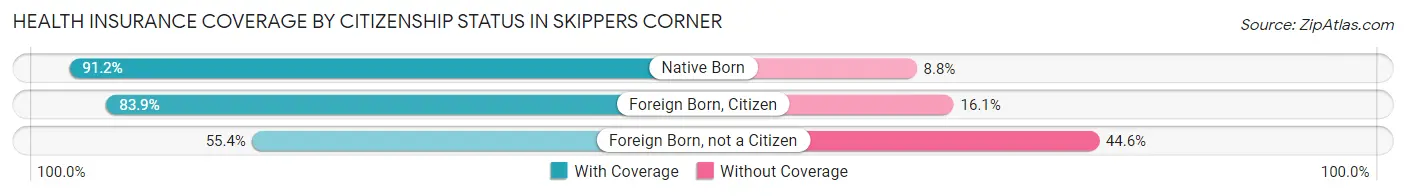
| Citizenship Status | With Coverage | Without Coverage |
| Native Born | 114 (91.2%) | 11 (8.8%) |
| Foreign Born, Citizen | 475 (83.9%) | 91 (16.1%) |
| Foreign Born, not a Citizen | 217 (55.4%) | 175 (44.6%) |
Health Insurance Coverage by Household Income in Skippers Corner
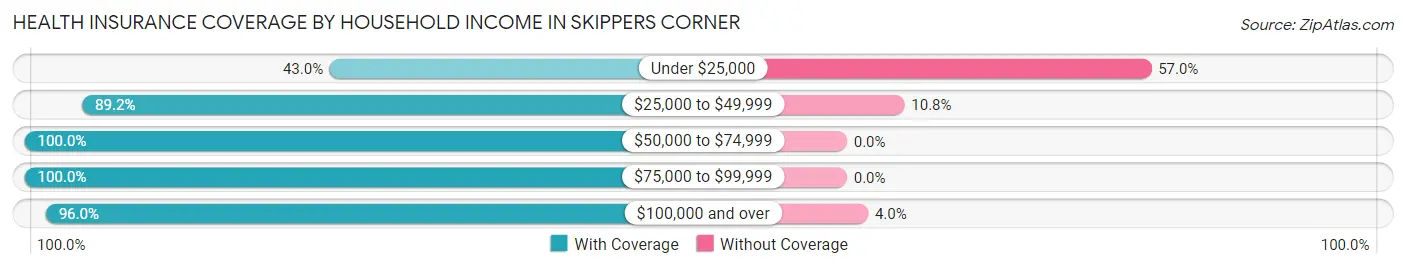
| Household Income | With Coverage | Without Coverage |
| Under $25,000 | 278 (43.0%) | 369 (57.0%) |
| $25,000 to $49,999 | 463 (89.2%) | 56 (10.8%) |
| $50,000 to $74,999 | 886 (100.0%) | 0 (0.0%) |
| $75,000 to $99,999 | 261 (100.0%) | 0 (0.0%) |
| $100,000 and over | 727 (96.0%) | 30 (4.0%) |
Public vs Private Health Insurance Coverage by Age in Skippers Corner
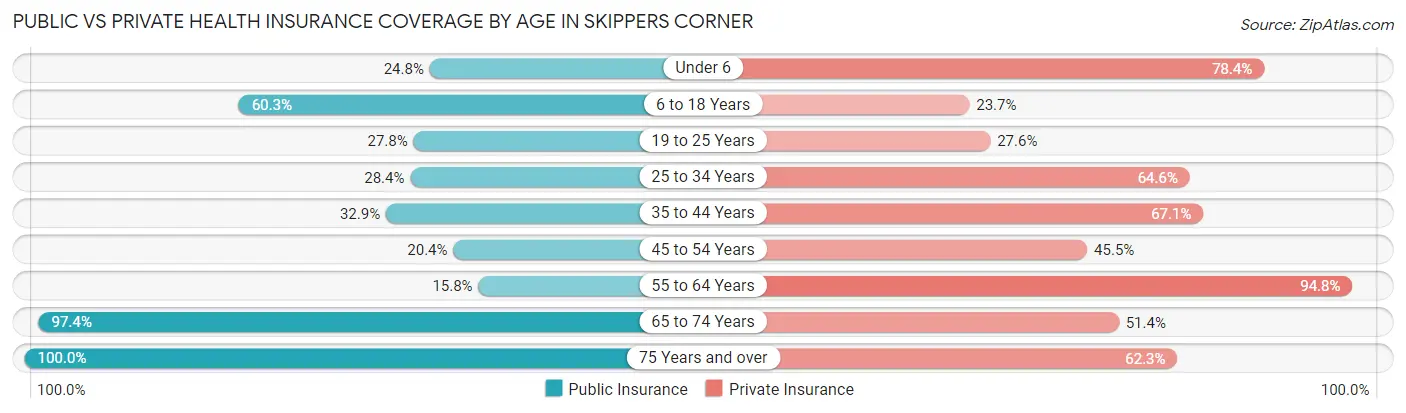
| Age Bracket | Public Insurance | Private Insurance |
| Under 6 | 31 (24.8%) | 98 (78.4%) |
| 6 to 18 Years | 341 (60.3%) | 134 (23.7%) |
| 19 to 25 Years | 109 (27.8%) | 108 (27.6%) |
| 25 to 34 Years | 77 (28.4%) | 175 (64.6%) |
| 35 to 44 Years | 53 (32.9%) | 108 (67.1%) |
| 45 to 54 Years | 87 (20.4%) | 194 (45.5%) |
| 55 to 64 Years | 87 (15.8%) | 523 (94.8%) |
| 65 to 74 Years | 451 (97.4%) | 238 (51.4%) |
| 75 Years and over | 114 (100.0%) | 71 (62.3%) |
| Total | 1,350 (44.0%) | 1,649 (53.7%) |
Disability Status by Sex by Age in Skippers Corner
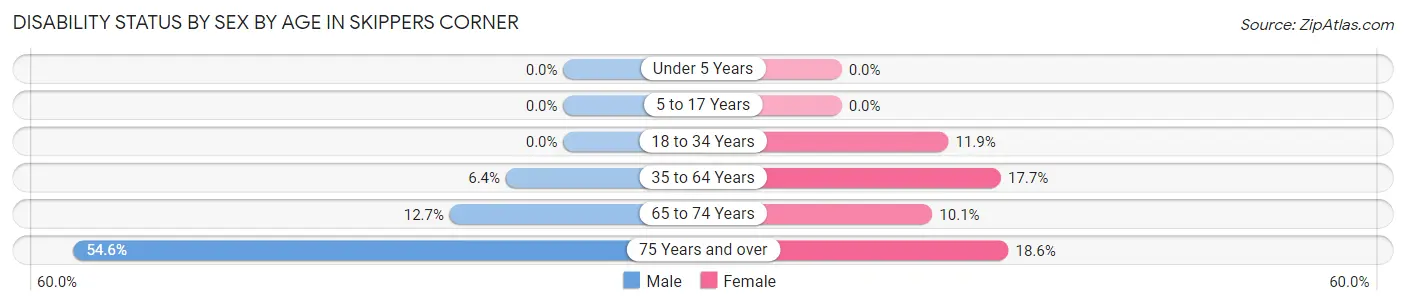
| Age Bracket | Male | Female |
| Under 5 Years | 0 (0.0%) | 0 (0.0%) |
| 5 to 17 Years | 0 (0.0%) | 0 (0.0%) |
| 18 to 34 Years | 0 (0.0%) | 49 (11.9%) |
| 35 to 64 Years | 35 (6.4%) | 105 (17.7%) |
| 65 to 74 Years | 31 (12.7%) | 22 (10.1%) |
| 75 Years and over | 24 (54.5%) | 13 (18.6%) |
Disability Class by Sex by Age in Skippers Corner
Disability Class: Hearing Difficulty
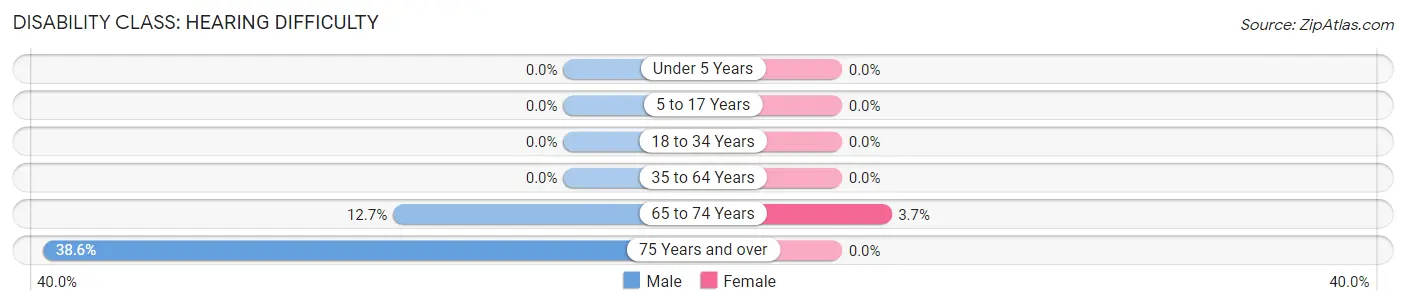
| Age Bracket | Male | Female |
| Under 5 Years | 0 (0.0%) | 0 (0.0%) |
| 5 to 17 Years | 0 (0.0%) | 0 (0.0%) |
| 18 to 34 Years | 0 (0.0%) | 0 (0.0%) |
| 35 to 64 Years | 0 (0.0%) | 0 (0.0%) |
| 65 to 74 Years | 31 (12.7%) | 8 (3.7%) |
| 75 Years and over | 17 (38.6%) | 0 (0.0%) |
Disability Class: Vision Difficulty
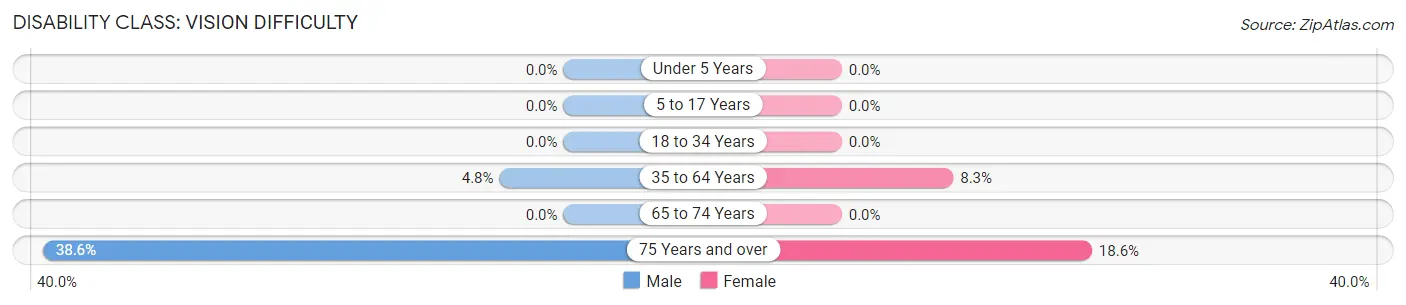
| Age Bracket | Male | Female |
| Under 5 Years | 0 (0.0%) | 0 (0.0%) |
| 5 to 17 Years | 0 (0.0%) | 0 (0.0%) |
| 18 to 34 Years | 0 (0.0%) | 0 (0.0%) |
| 35 to 64 Years | 26 (4.8%) | 49 (8.3%) |
| 65 to 74 Years | 0 (0.0%) | 0 (0.0%) |
| 75 Years and over | 17 (38.6%) | 13 (18.6%) |
Disability Class: Cognitive Difficulty
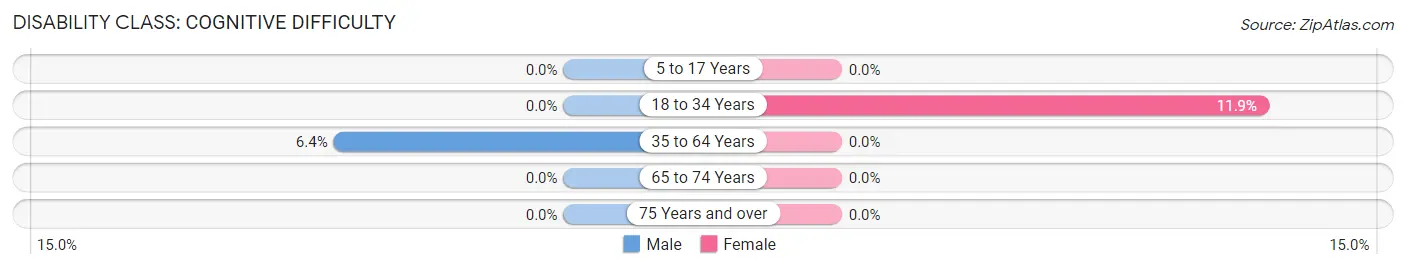
| Age Bracket | Male | Female |
| 5 to 17 Years | 0 (0.0%) | 0 (0.0%) |
| 18 to 34 Years | 0 (0.0%) | 49 (11.9%) |
| 35 to 64 Years | 35 (6.4%) | 0 (0.0%) |
| 65 to 74 Years | 0 (0.0%) | 0 (0.0%) |
| 75 Years and over | 0 (0.0%) | 0 (0.0%) |
Disability Class: Ambulatory Difficulty
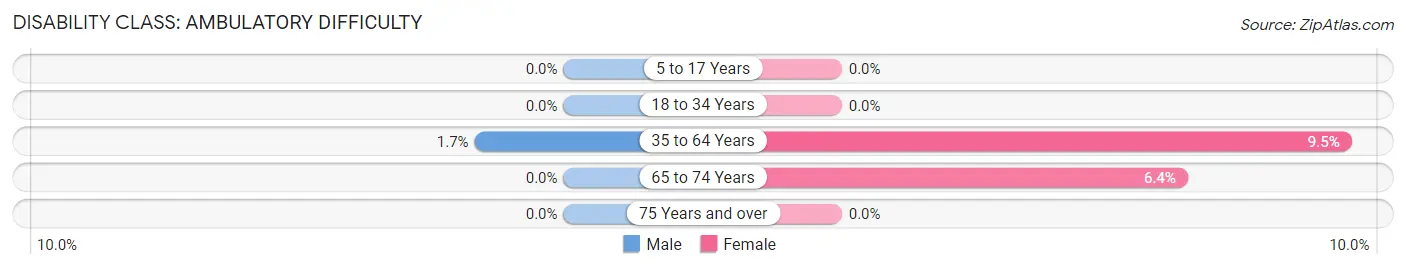
| Age Bracket | Male | Female |
| 5 to 17 Years | 0 (0.0%) | 0 (0.0%) |
| 18 to 34 Years | 0 (0.0%) | 0 (0.0%) |
| 35 to 64 Years | 9 (1.7%) | 56 (9.5%) |
| 65 to 74 Years | 0 (0.0%) | 14 (6.4%) |
| 75 Years and over | 0 (0.0%) | 0 (0.0%) |
Disability Class: Self-Care Difficulty
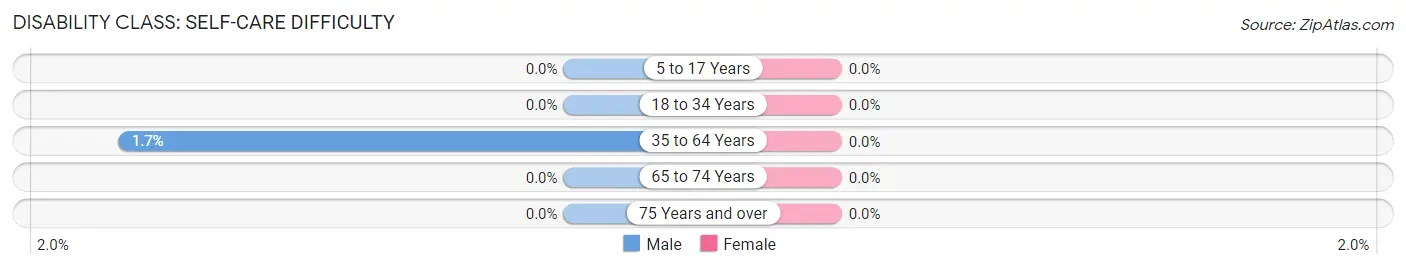
| Age Bracket | Male | Female |
| 5 to 17 Years | 0 (0.0%) | 0 (0.0%) |
| 18 to 34 Years | 0 (0.0%) | 0 (0.0%) |
| 35 to 64 Years | 9 (1.7%) | 0 (0.0%) |
| 65 to 74 Years | 0 (0.0%) | 0 (0.0%) |
| 75 Years and over | 0 (0.0%) | 0 (0.0%) |
Technology Access in Skippers Corner
Computing Device Access in Skippers Corner
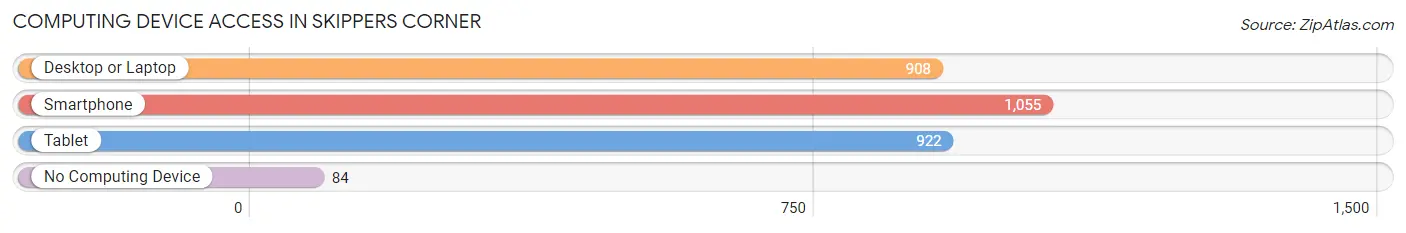
| Device Type | # Households | % Households |
| Desktop or Laptop | 908 | 75.4% |
| Smartphone | 1,055 | 87.6% |
| Tablet | 922 | 76.6% |
| No Computing Device | 84 | 7.0% |
| Total | 1,204 | 100.0% |
Internet Access in Skippers Corner
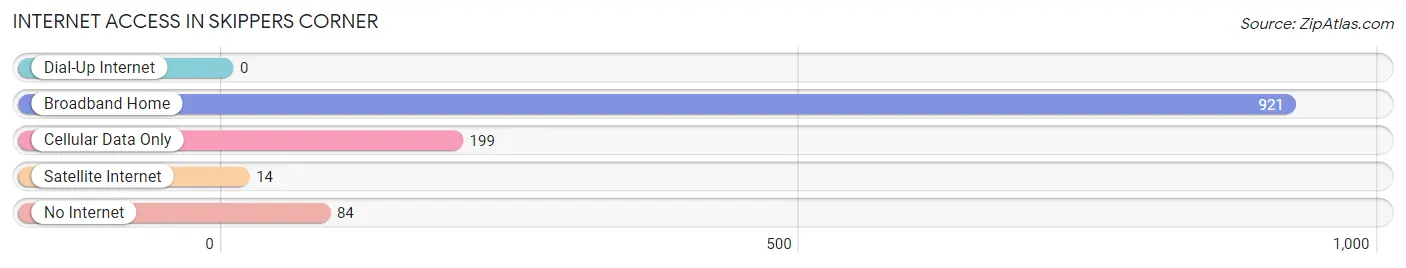
| Internet Type | # Households | % Households |
| Dial-Up Internet | 0 | 0.0% |
| Broadband Home | 921 | 76.5% |
| Cellular Data Only | 199 | 16.5% |
| Satellite Internet | 14 | 1.2% |
| No Internet | 84 | 7.0% |
| Total | 1,204 | 100.0% |
Skippers Corner Summary
Skippers Corner is a small unincorporated community located in Onslow County, North Carolina. It is situated in the southeastern part of the state, approximately 20 miles from the city of Jacksonville. The community is bordered by the White Oak River to the east and the New River to the west.
History
Skippers Corner was first settled in the late 1700s by a group of settlers from Scotland. The settlers named the area after a Scottish term for a small fishing village. The area was primarily used for farming and fishing until the early 1900s when the lumber industry began to take off. The lumber industry provided jobs for many of the residents and helped to grow the population of the area.
In the early 1900s, the area was also home to a number of small businesses, including a general store, a post office, and a sawmill. The sawmill was the largest employer in the area and provided jobs for many of the residents.
Geography
Skippers Corner is located in the southeastern part of Onslow County, North Carolina. It is situated on the White Oak River and is bordered by the New River to the west. The area is mostly rural, with a few small towns and villages scattered throughout. The terrain is mostly flat, with some rolling hills in the area. The climate is humid subtropical, with hot summers and mild winters.
Economy
The economy of Skippers Corner is primarily based on agriculture and fishing. The area is home to a number of small farms, which produce a variety of crops, including corn, soybeans, and cotton. The area is also home to a number of small fishing operations, which provide a variety of seafood to local markets.
In addition to agriculture and fishing, the area is also home to a number of small businesses, including a general store, a post office, and a sawmill. The sawmill is the largest employer in the area and provides jobs for many of the residents.
Demographics
As of the 2010 census, the population of Skippers Corner was 1,845. The population is primarily white (94.3%), with a small African American population (3.2%). The median household income is $37,917, and the median age is 37.7 years.
Conclusion
Skippers Corner is a small unincorporated community located in Onslow County, North Carolina. It is situated in the southeastern part of the state, approximately 20 miles from the city of Jacksonville. The community is bordered by the White Oak River to the east and the New River to the west. The economy of Skippers Corner is primarily based on agriculture and fishing, and the area is home to a number of small businesses. The population of Skippers Corner is primarily white, with a median household income of $37,917 and a median age of 37.7 years.
Common Questions
What is the Total Population of Skippers Corner?
Total Population of Skippers Corner is 3,599.
What is the Total Male Population of Skippers Corner?
Total Male Population of Skippers Corner is 1,957.
What is the Total Female Population of Skippers Corner?
Total Female Population of Skippers Corner is 1,642.
What is the Ratio of Males per 100 Females in Skippers Corner?
There are 119.18 Males per 100 Females in Skippers Corner.
What is the Ratio of Females per 100 Males in Skippers Corner?
There are 83.90 Females per 100 Males in Skippers Corner.
What is the Median Population Age in Skippers Corner?
Median Population Age in Skippers Corner is 40.2 Years.
What is the Average Family Size in Skippers Corner
Average Family Size in Skippers Corner is 3.0 People.
What is the Average Household Size in Skippers Corner
Average Household Size in Skippers Corner is 2.5 People.
What is Per Capita Income in Skippers Corner?
Per Capita income in Skippers Corner is $27,928.
What is the Median Family Income in Skippers Corner?
Median Family Income in Skippers Corner is $59,000.
What is the Median Household income in Skippers Corner?
Median Household Income in Skippers Corner is $58,821.
What is Inequality or Gini Index in Skippers Corner?
Inequality or Gini Index in Skippers Corner is 0.44.
How Large is the Labor Force in Skippers Corner?
There are 1,447 People in the Labor Forcein in Skippers Corner.
What is the Percentage of People in the Labor Force in Skippers Corner?
47.0% of People are in the Labor Force in Skippers Corner.
What is the Unemployment Rate in Skippers Corner?
Unemployment Rate in Skippers Corner is 1.2%.