Sandyfield, NC
Sandyfield Map
Sandyfield Overview
625
TOTAL POPULATION
359
MALE POPULATION
266
FEMALE POPULATION
134.96
MALES / 100 FEMALES
74.09
FEMALES / 100 MALES
36.7
MEDIAN AGE
3.4
AVG FAMILY SIZE
3.1
AVG HOUSEHOLD SIZE
$14,859
PER CAPITA INCOME
$29,722
AVG HOUSEHOLD INCOME
9.6%
WAGE / INCOME GAP [ % ]
90.4¢/ $1
WAGE / INCOME GAP [ $ ]
0.45
INEQUALITY / GINI INDEX
154
LABOR FORCE [ PEOPLE ]
28.5%
PERCENT IN LABOR FORCE
5.2%
UNEMPLOYMENT RATE
Sandyfield Area Codes
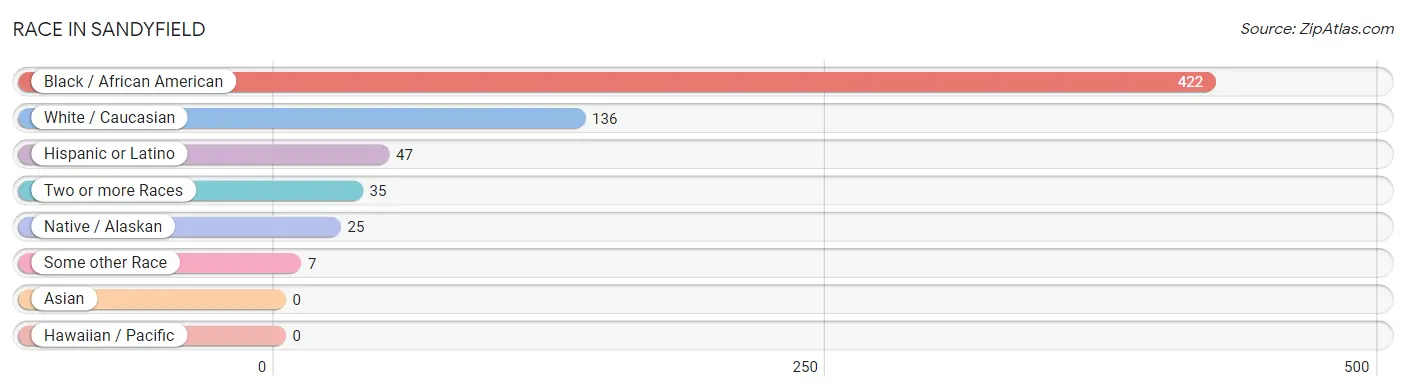
Race in Sandyfield
The most populous races in Sandyfield are Black / African American (422 | 67.5%), White / Caucasian (136 | 21.8%), and Hispanic or Latino (47 | 7.5%).
| Race | # Population | % Population |
| Asian | 0 | 0.0% |
| Black / African American | 422 | 67.5% |
| Hawaiian / Pacific | 0 | 0.0% |
| Hispanic or Latino | 47 | 7.5% |
| Native / Alaskan | 25 | 4.0% |
| White / Caucasian | 136 | 21.8% |
| Two or more Races | 35 | 5.6% |
| Some other Race | 7 | 1.1% |
| Total | 625 | 100.0% |
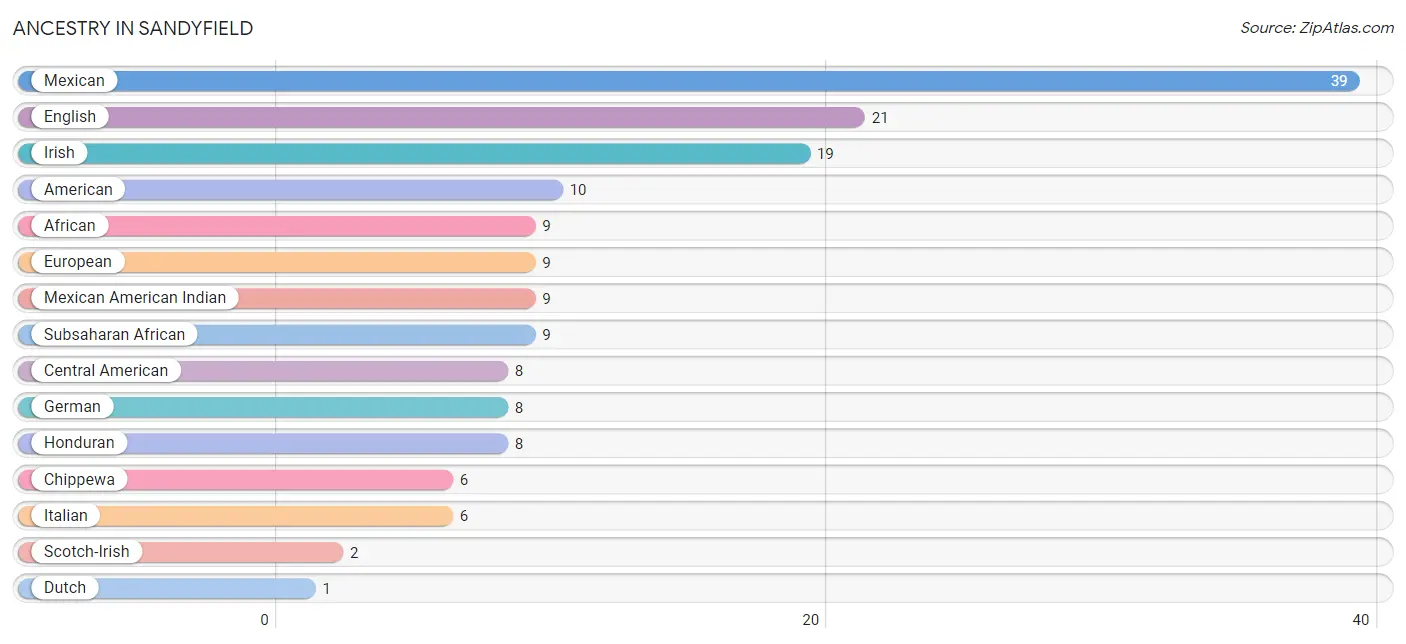
Ancestry in Sandyfield
The most populous ancestries reported in Sandyfield are Mexican (39 | 6.2%), English (21 | 3.4%), Irish (19 | 3.0%), American (10 | 1.6%), and African (9 | 1.4%), together accounting for 15.7% of all Sandyfield residents.
| Ancestry | # Population | % Population |
| African | 9 | 1.4% |
| American | 10 | 1.6% |
| Central American | 8 | 1.3% |
| Chippewa | 6 | 1.0% |
| Dutch | 1 | 0.2% |
| English | 21 | 3.4% |
| European | 9 | 1.4% |
| German | 8 | 1.3% |
| Honduran | 8 | 1.3% |
| Irish | 19 | 3.0% |
| Italian | 6 | 1.0% |
| Mexican | 39 | 6.2% |
| Mexican American Indian | 9 | 1.4% |
| Scotch-Irish | 2 | 0.3% |
| Subsaharan African | 9 | 1.4% | View All 15 Rows |
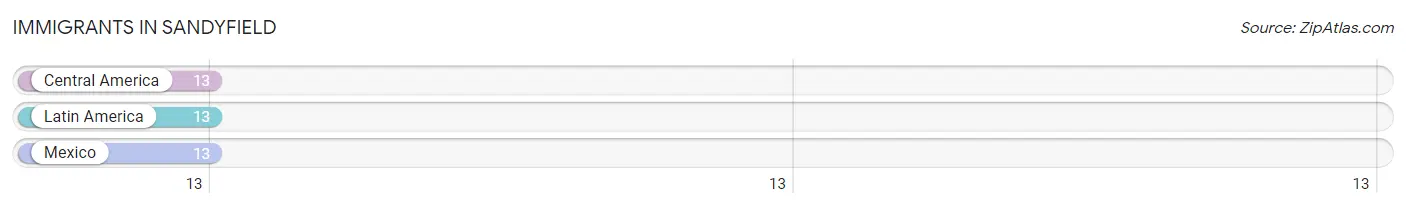
Immigrants in Sandyfield
The most numerous immigrant groups reported in Sandyfield came from Central America (13 | 2.1%), Latin America (13 | 2.1%), and Mexico (13 | 2.1%), together accounting for 6.2% of all Sandyfield residents.
| Immigration Origin | # Population | % Population |
| Central America | 13 | 2.1% |
| Latin America | 13 | 2.1% |
| Mexico | 13 | 2.1% | View All 3 Rows |
Sex and Age in Sandyfield
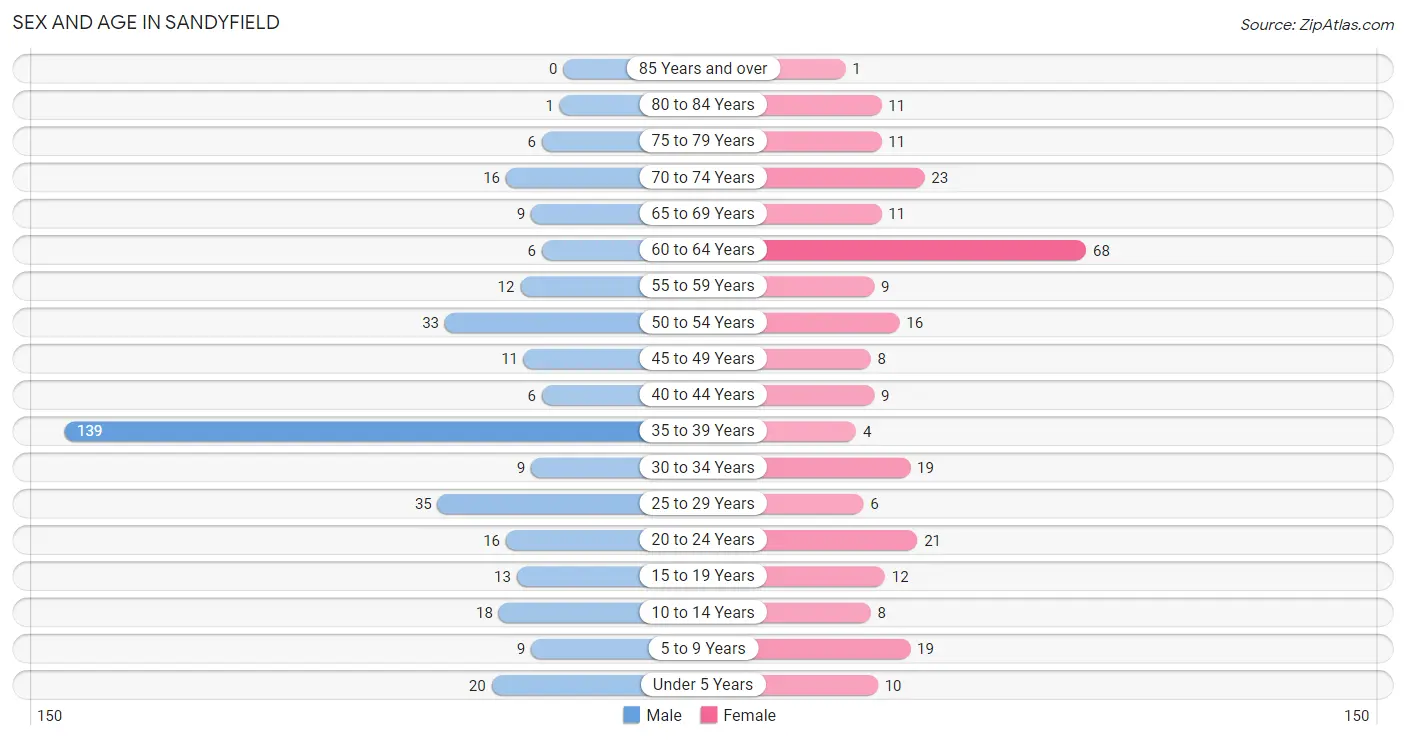
Sex and Age in Sandyfield
The most populous age groups in Sandyfield are 35 to 39 Years (139 | 38.7%) for men and 60 to 64 Years (68 | 25.6%) for women.
| Age Bracket | Male | Female |
| Under 5 Years | 20 (5.6%) | 10 (3.8%) |
| 5 to 9 Years | 9 (2.5%) | 19 (7.1%) |
| 10 to 14 Years | 18 (5.0%) | 8 (3.0%) |
| 15 to 19 Years | 13 (3.6%) | 12 (4.5%) |
| 20 to 24 Years | 16 (4.5%) | 21 (7.9%) |
| 25 to 29 Years | 35 (9.8%) | 6 (2.3%) |
| 30 to 34 Years | 9 (2.5%) | 19 (7.1%) |
| 35 to 39 Years | 139 (38.7%) | 4 (1.5%) |
| 40 to 44 Years | 6 (1.7%) | 9 (3.4%) |
| 45 to 49 Years | 11 (3.1%) | 8 (3.0%) |
| 50 to 54 Years | 33 (9.2%) | 16 (6.0%) |
| 55 to 59 Years | 12 (3.3%) | 9 (3.4%) |
| 60 to 64 Years | 6 (1.7%) | 68 (25.6%) |
| 65 to 69 Years | 9 (2.5%) | 11 (4.1%) |
| 70 to 74 Years | 16 (4.5%) | 23 (8.6%) |
| 75 to 79 Years | 6 (1.7%) | 11 (4.1%) |
| 80 to 84 Years | 1 (0.3%) | 11 (4.1%) |
| 85 Years and over | 0 (0.0%) | 1 (0.4%) |
| Total | 359 (100.0%) | 266 (100.0%) |
Families and Households in Sandyfield
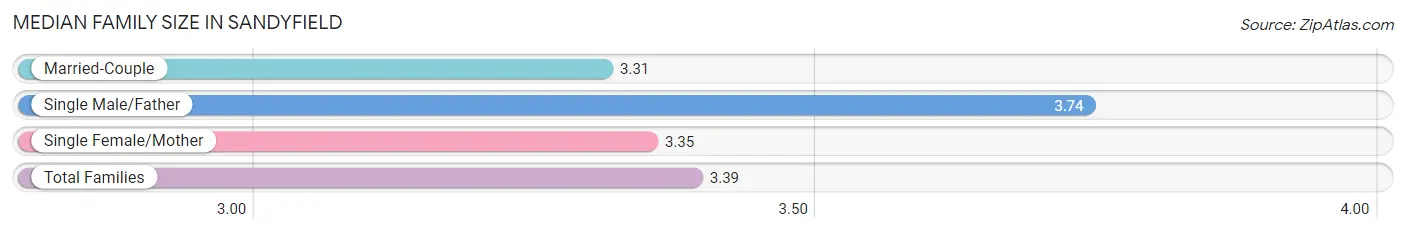
Median Family Size in Sandyfield
The median family size in Sandyfield is 3.39 persons per family, with single male/father families (19 | 11.5%) accounting for the largest median family size of 3.74 persons per family. On the other hand, married-couple families (48 | 28.9%) represent the smallest median family size with 3.31 persons per family.
| Family Type | # Families | Family Size |
| Married-Couple | 48 (28.9%) | 3.31 |
| Single Male/Father | 19 (11.5%) | 3.74 |
| Single Female/Mother | 99 (59.6%) | 3.35 |
| Total Families | 166 (100.0%) | 3.39 |
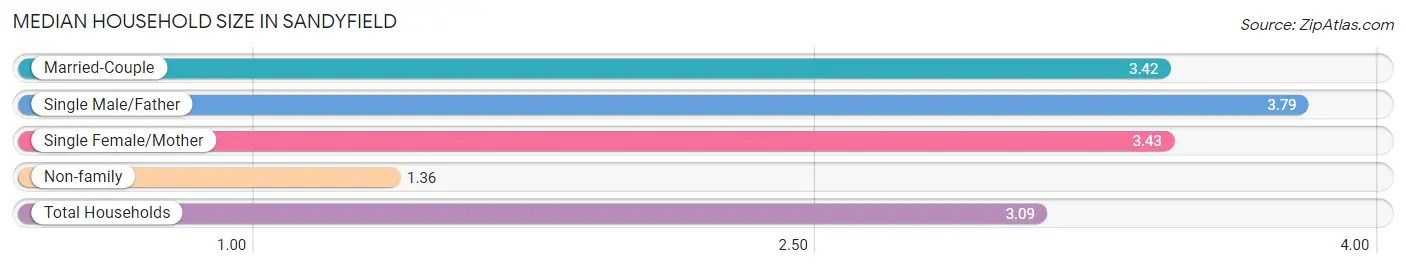
Median Household Size in Sandyfield
The median household size in Sandyfield is 3.09 persons per household, with single male/father households (19 | 9.4%) accounting for the largest median household size of 3.79 persons per household. non-family households (36 | 17.8%) represent the smallest median household size with 1.36 persons per household.
| Household Type | # Households | Household Size |
| Married-Couple | 48 (23.8%) | 3.42 |
| Single Male/Father | 19 (9.4%) | 3.79 |
| Single Female/Mother | 99 (49.0%) | 3.43 |
| Non-family | 36 (17.8%) | 1.36 |
| Total Households | 202 (100.0%) | 3.09 |
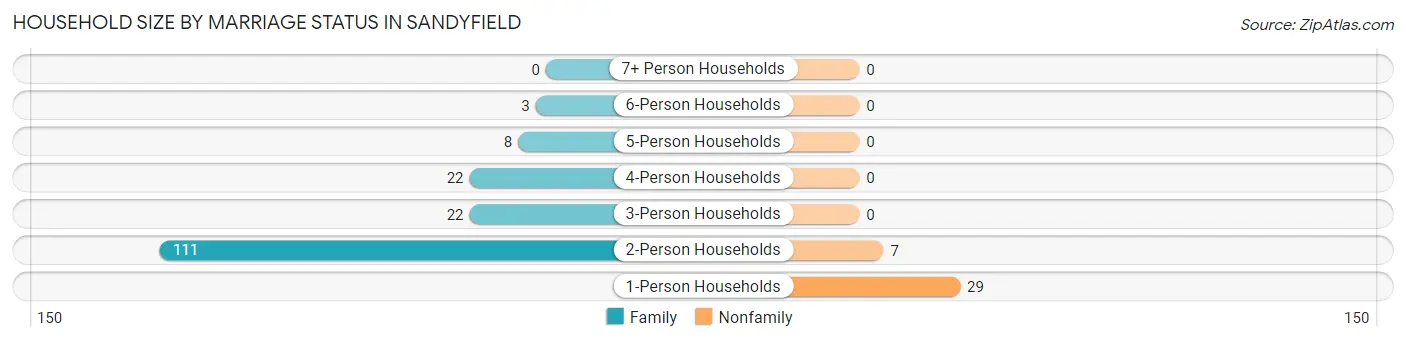
Household Size by Marriage Status in Sandyfield
Out of a total of 202 households in Sandyfield, 166 (82.2%) are family households, while 36 (17.8%) are nonfamily households. The most numerous type of family households are 2-person households, comprising 111, and the most common type of nonfamily households are 1-person households, comprising 29.
| Household Size | Family Households | Nonfamily Households |
| 1-Person Households | - | 29 (14.4%) |
| 2-Person Households | 111 (54.9%) | 7 (3.5%) |
| 3-Person Households | 22 (10.9%) | 0 (0.0%) |
| 4-Person Households | 22 (10.9%) | 0 (0.0%) |
| 5-Person Households | 8 (4.0%) | 0 (0.0%) |
| 6-Person Households | 3 (1.5%) | 0 (0.0%) |
| 7+ Person Households | 0 (0.0%) | 0 (0.0%) |
| Total | 166 (82.2%) | 36 (17.8%) |
Female Fertility in Sandyfield
Fertility by Age in Sandyfield
| Age Bracket | Women with Births | Births / 1,000 Women |
| 15 to 19 years | 0 (0.0%) | 0.0 |
| 20 to 34 years | 0 (0.0%) | 0.0 |
| 35 to 50 years | 0 (0.0%) | 0.0 |
| Total | 0 (0.0%) | 0.0 |
Fertility by Age by Marriage Status in Sandyfield
| Age Bracket | Married | Unmarried |
| 15 to 19 years | 0 (0.0%) | 0 (0.0%) |
| 20 to 34 years | 0 (0.0%) | 0 (0.0%) |
| 35 to 50 years | 0 (0.0%) | 0 (0.0%) |
| Total | 0 (0.0%) | 0 (0.0%) |
Fertility by Education in Sandyfield
| Educational Attainment | Women with Births | Births / 1,000 Women |
| Less than High School | 0 (0.0%) | 0.0 |
| High School Diploma | 0 (0.0%) | 0.0 |
| College or Associate's Degree | 0 (0.0%) | 0.0 |
| Bachelor's Degree | 0 (0.0%) | 0.0 |
| Graduate Degree | 0 (0.0%) | 0.0 |
| Total | 0 (0.0%) | 0.0 |
Fertility by Education by Marriage Status in Sandyfield
| Educational Attainment | Married | Unmarried |
| Less than High School | 0 (0.0%) | 0 (0.0%) |
| High School Diploma | 0 (0.0%) | 0 (0.0%) |
| College or Associate's Degree | 0 (0.0%) | 0 (0.0%) |
| Bachelor's Degree | 0 (0.0%) | 0 (0.0%) |
| Graduate Degree | 0 (0.0%) | 0 (0.0%) |
| Total | 0 (0.0%) | 0 (0.0%) |
Income in Sandyfield
Income Overview in Sandyfield
| Characteristic | Number | Measure |
| Per Capita Income | 625 | $14,859 |
| Median Family Income | 166 | $0 |
| Mean Family Income | 166 | $36,729 |
| Median Household Income | 202 | $29,722 |
| Mean Household Income | 202 | $38,238 |
| Income Deficit | 166 | $0 |
| Wage / Income Gap (%) | 625 | 9.58% |
| Wage / Income Gap ($) | 625 | 90.42¢ per $1 |
| Gini / Inequality Index | 625 | 0.45 |
Earnings by Sex in Sandyfield
Average Earnings in Sandyfield are $31,750, $29,063 for men and $32,143 for women, a difference of 9.6%.
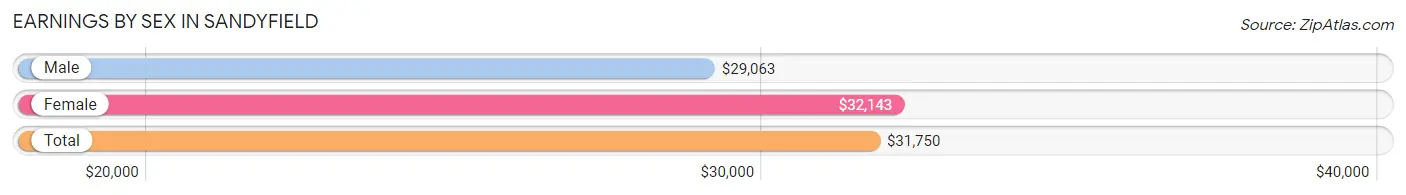
| Sex | Number | Average Earnings |
| Male | 85 (50.3%) | $29,063 |
| Female | 84 (49.7%) | $32,143 |
| Total | 169 (100.0%) | $31,750 |
Earnings by Sex by Income Bracket in Sandyfield
The most common earnings brackets in Sandyfield are $45,000 to $49,999 for men (11 | 12.9%) and $30,000 to $34,999 for women (18 | 21.4%).
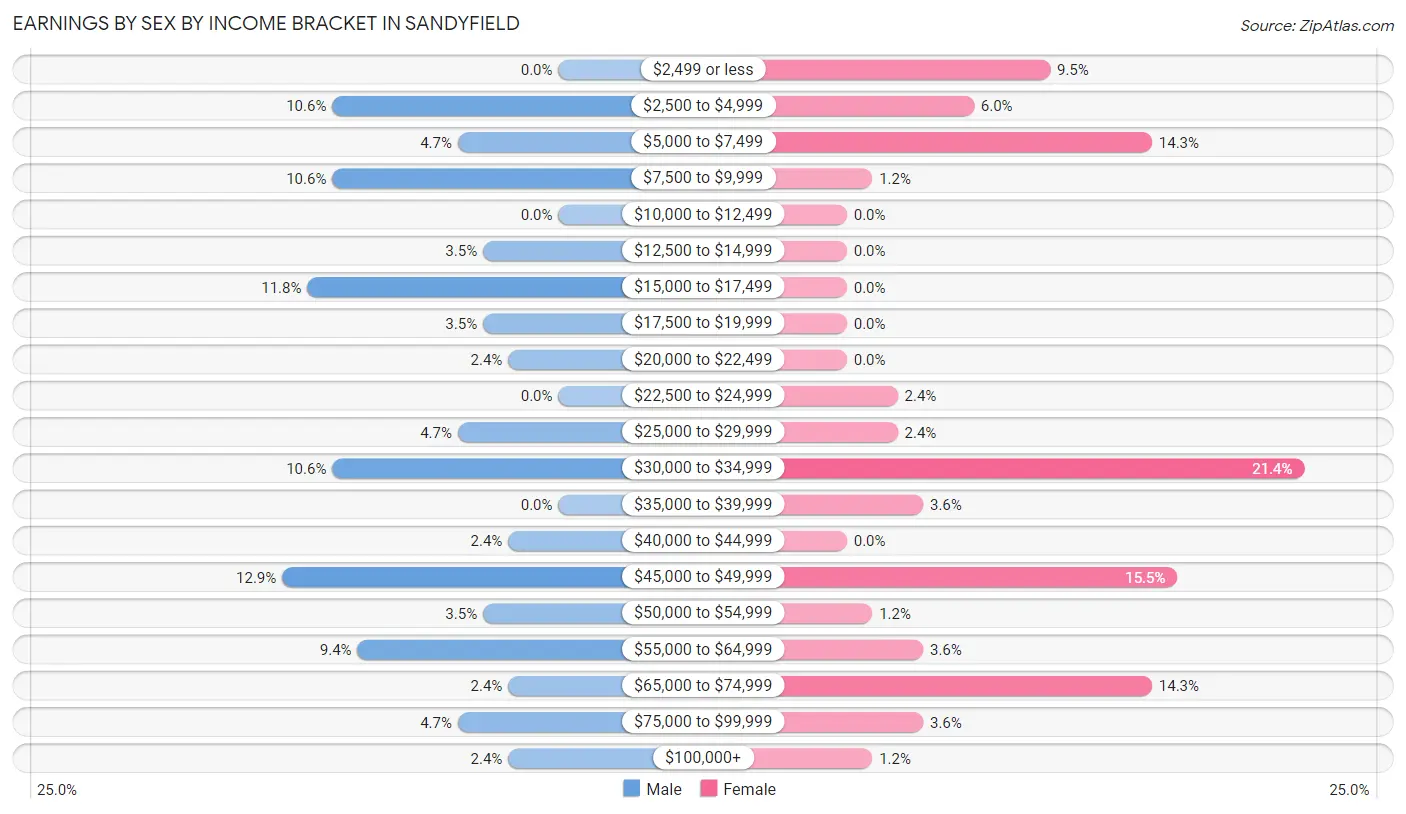
| Income | Male | Female |
| $2,499 or less | 0 (0.0%) | 8 (9.5%) |
| $2,500 to $4,999 | 9 (10.6%) | 5 (5.9%) |
| $5,000 to $7,499 | 4 (4.7%) | 12 (14.3%) |
| $7,500 to $9,999 | 9 (10.6%) | 1 (1.2%) |
| $10,000 to $12,499 | 0 (0.0%) | 0 (0.0%) |
| $12,500 to $14,999 | 3 (3.5%) | 0 (0.0%) |
| $15,000 to $17,499 | 10 (11.8%) | 0 (0.0%) |
| $17,500 to $19,999 | 3 (3.5%) | 0 (0.0%) |
| $20,000 to $22,499 | 2 (2.4%) | 0 (0.0%) |
| $22,500 to $24,999 | 0 (0.0%) | 2 (2.4%) |
| $25,000 to $29,999 | 4 (4.7%) | 2 (2.4%) |
| $30,000 to $34,999 | 9 (10.6%) | 18 (21.4%) |
| $35,000 to $39,999 | 0 (0.0%) | 3 (3.6%) |
| $40,000 to $44,999 | 2 (2.4%) | 0 (0.0%) |
| $45,000 to $49,999 | 11 (12.9%) | 13 (15.5%) |
| $50,000 to $54,999 | 3 (3.5%) | 1 (1.2%) |
| $55,000 to $64,999 | 8 (9.4%) | 3 (3.6%) |
| $65,000 to $74,999 | 2 (2.4%) | 12 (14.3%) |
| $75,000 to $99,999 | 4 (4.7%) | 3 (3.6%) |
| $100,000+ | 2 (2.4%) | 1 (1.2%) |
| Total | 85 (100.0%) | 84 (100.0%) |
Earnings by Sex by Educational Attainment in Sandyfield
Average earnings in Sandyfield are $34,063 for men and $36,875 for women, a difference of 7.6%. Men with an educational attainment of college or associate's degree enjoy the highest average annual earnings of $47,083, while those with less than high school education earn the least with $33,958. Women with an educational attainment of bachelor's degree earn the most with the average annual earnings of $36,250, while those with college or associate's degree education have the smallest earnings of $34,063.
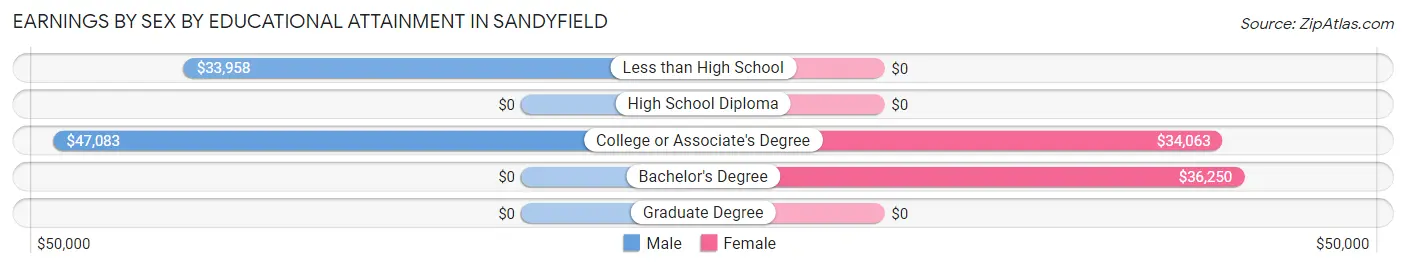
| Educational Attainment | Male Income | Female Income |
| Less than High School | $33,958 | $0 |
| High School Diploma | - | - |
| College or Associate's Degree | $47,083 | $34,063 |
| Bachelor's Degree | - | - |
| Graduate Degree | - | - |
| Total | $34,063 | $36,875 |
Family Income in Sandyfield
Family Income Brackets in Sandyfield
According to the Sandyfield family income data, there are 75 families falling into the $10,000 to $14,999 income range, which is the most common income bracket and makes up 45.2% of all families.
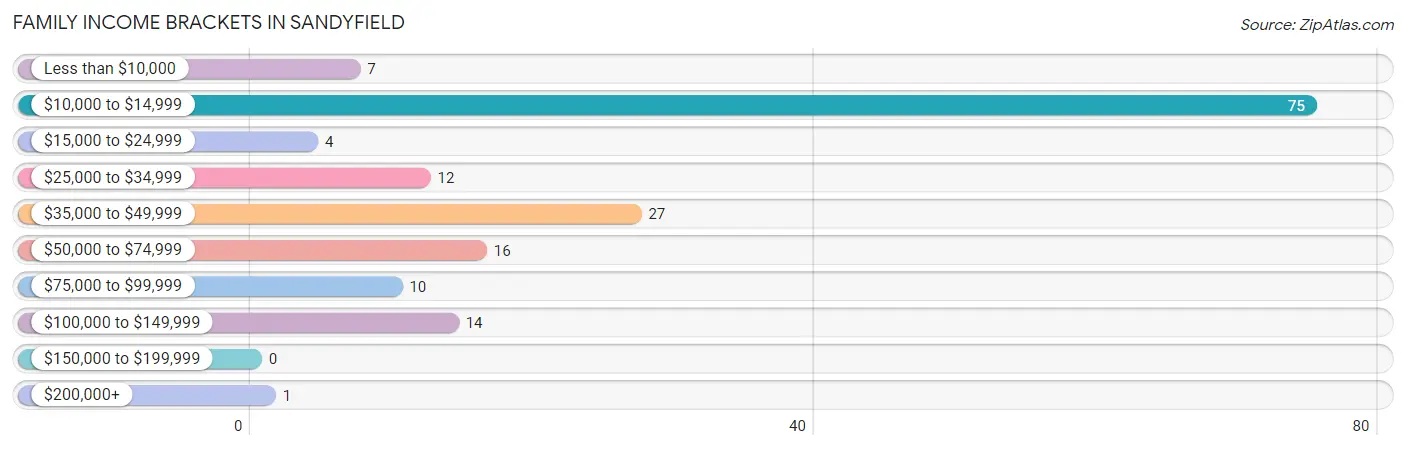
| Income Bracket | # Families | % Families |
| Less than $10,000 | 7 | 4.2% |
| $10,000 to $14,999 | 75 | 45.2% |
| $15,000 to $24,999 | 4 | 2.4% |
| $25,000 to $34,999 | 12 | 7.2% |
| $35,000 to $49,999 | 27 | 16.3% |
| $50,000 to $74,999 | 16 | 9.6% |
| $75,000 to $99,999 | 10 | 6.0% |
| $100,000 to $149,999 | 14 | 8.4% |
| $150,000 to $199,999 | 0 | 0.0% |
| $200,000+ | 1 | 0.6% |
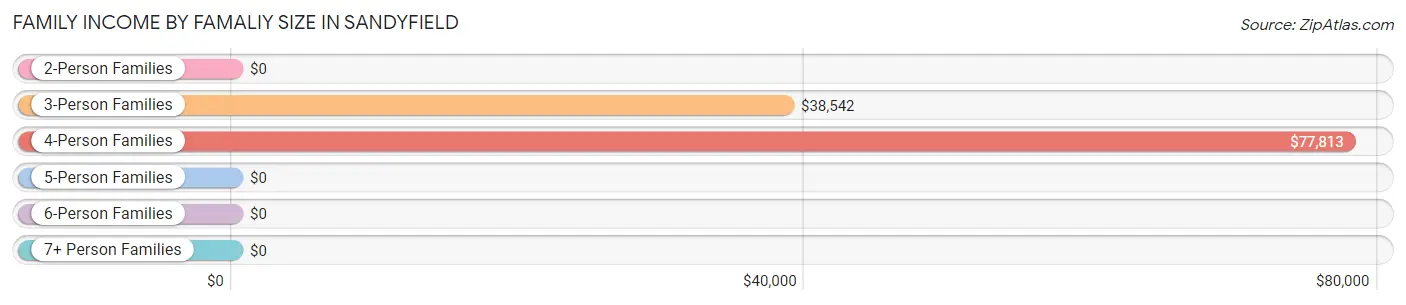
Family Income by Famaliy Size in Sandyfield
4-person families (15 | 9.0%) account for the highest median family income in Sandyfield with $77,813 per family, while 4-person families (15 | 9.0%) have the highest median income of $19,453 per family member.
| Income Bracket | # Families | Median Income |
| 2-Person Families | 116 (69.9%) | $0 |
| 3-Person Families | 25 (15.1%) | $38,542 |
| 4-Person Families | 15 (9.0%) | $77,813 |
| 5-Person Families | 7 (4.2%) | $0 |
| 6-Person Families | 3 (1.8%) | $0 |
| 7+ Person Families | 0 (0.0%) | $0 |
| Total | 166 (100.0%) | $0 |
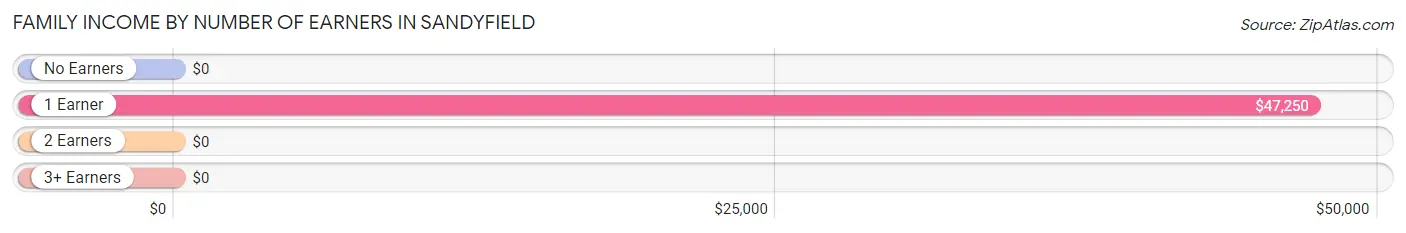
Family Income by Number of Earners in Sandyfield
| Number of Earners | # Families | Median Income |
| No Earners | 99 (59.6%) | $0 |
| 1 Earner | 31 (18.7%) | $47,250 |
| 2 Earners | 35 (21.1%) | $0 |
| 3+ Earners | 1 (0.6%) | $0 |
| Total | 166 (100.0%) | $0 |
Household Income in Sandyfield
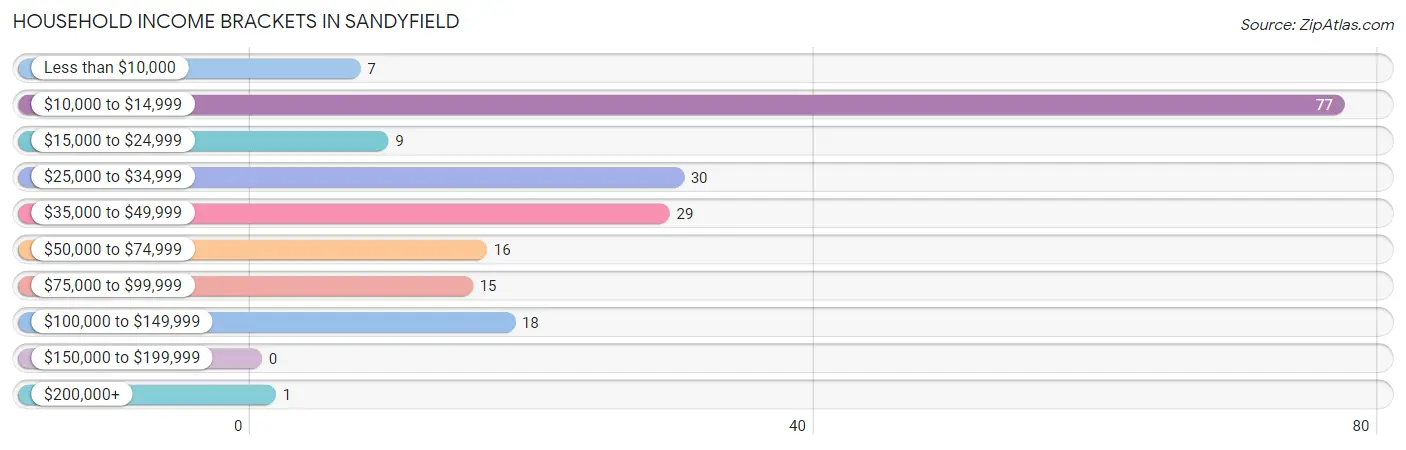
Household Income Brackets in Sandyfield
With 77 households falling in the category, the $10,000 to $14,999 income range is the most frequent in Sandyfield, accounting for 38.1% of all households.
| Income Bracket | # Households | % Households |
| Less than $10,000 | 7 | 3.5% |
| $10,000 to $14,999 | 77 | 38.1% |
| $15,000 to $24,999 | 9 | 4.5% |
| $25,000 to $34,999 | 30 | 14.9% |
| $35,000 to $49,999 | 29 | 14.4% |
| $50,000 to $74,999 | 16 | 7.9% |
| $75,000 to $99,999 | 15 | 7.4% |
| $100,000 to $149,999 | 18 | 8.9% |
| $150,000 to $199,999 | 0 | 0.0% |
| $200,000+ | 1 | 0.5% |
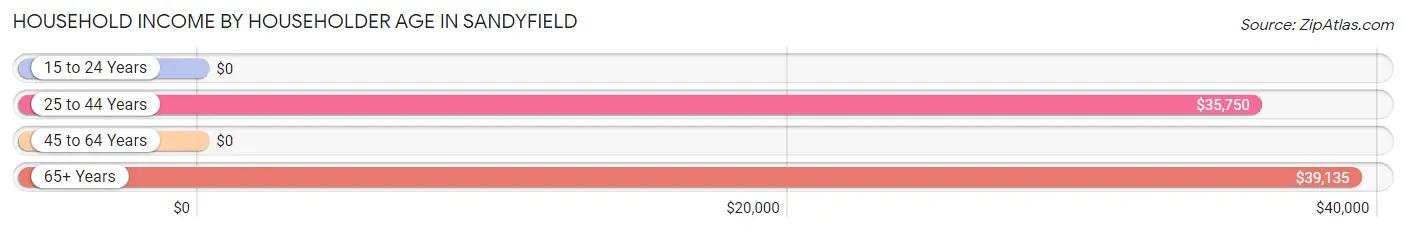
Household Income by Householder Age in Sandyfield
The median household income in Sandyfield is $29,722, with the highest median household income of $39,135 found in the 65+ years age bracket for the primary householder. A total of 53 households (26.2%) fall into this category. Meanwhile, the 15 to 24 years age bracket for the primary householder has the lowest median household income of $0, with 19 households (9.4%) in this group.
| Income Bracket | # Households | Median Income |
| 15 to 24 Years | 19 (9.4%) | $0 |
| 25 to 44 Years | 29 (14.4%) | $35,750 |
| 45 to 64 Years | 101 (50.0%) | $0 |
| 65+ Years | 53 (26.2%) | $39,135 |
| Total | 202 (100.0%) | $29,722 |
Poverty in Sandyfield
Income Below Poverty by Sex and Age in Sandyfield
With 46.5% poverty level for males and 39.1% for females among the residents of Sandyfield, 35 to 44 year old males and 55 to 64 year old females are the most vulnerable to poverty, with 129 males (89.0%) and 56 females (72.7%) in their respective age groups living below the poverty level.
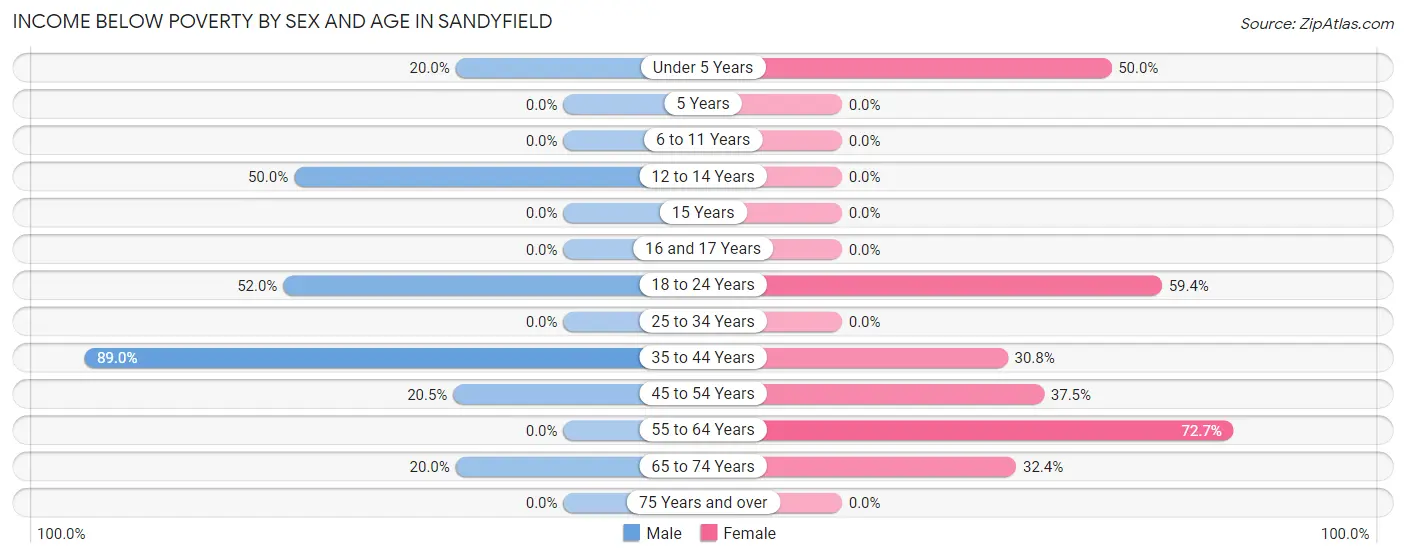
| Age Bracket | Male | Female |
| Under 5 Years | 4 (20.0%) | 5 (50.0%) |
| 5 Years | 0 (0.0%) | 0 (0.0%) |
| 6 to 11 Years | 0 (0.0%) | 0 (0.0%) |
| 12 to 14 Years | 6 (50.0%) | 0 (0.0%) |
| 15 Years | 0 (0.0%) | 0 (0.0%) |
| 16 and 17 Years | 0 (0.0%) | 0 (0.0%) |
| 18 to 24 Years | 13 (52.0%) | 19 (59.4%) |
| 25 to 34 Years | 0 (0.0%) | 0 (0.0%) |
| 35 to 44 Years | 129 (89.0%) | 4 (30.8%) |
| 45 to 54 Years | 9 (20.4%) | 9 (37.5%) |
| 55 to 64 Years | 0 (0.0%) | 56 (72.7%) |
| 65 to 74 Years | 5 (20.0%) | 11 (32.4%) |
| 75 Years and over | 0 (0.0%) | 0 (0.0%) |
| Total | 166 (46.5%) | 104 (39.1%) |
Income Above Poverty by Sex and Age in Sandyfield
According to the poverty statistics in Sandyfield, males aged 6 to 11 years and females aged 5 years are the age groups that are most secure financially, with 100.0% of males and 100.0% of females in these age groups living above the poverty line.
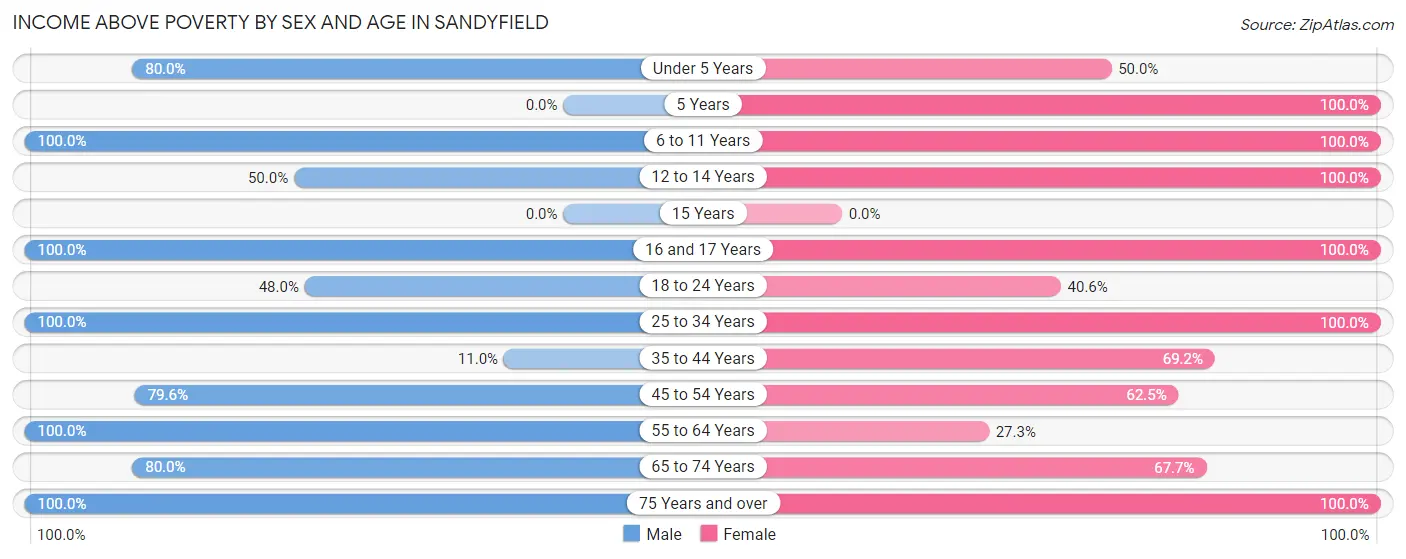
| Age Bracket | Male | Female |
| Under 5 Years | 16 (80.0%) | 5 (50.0%) |
| 5 Years | 0 (0.0%) | 5 (100.0%) |
| 6 to 11 Years | 13 (100.0%) | 19 (100.0%) |
| 12 to 14 Years | 6 (50.0%) | 3 (100.0%) |
| 15 Years | 0 (0.0%) | 0 (0.0%) |
| 16 and 17 Years | 4 (100.0%) | 1 (100.0%) |
| 18 to 24 Years | 12 (48.0%) | 13 (40.6%) |
| 25 to 34 Years | 44 (100.0%) | 25 (100.0%) |
| 35 to 44 Years | 16 (11.0%) | 9 (69.2%) |
| 45 to 54 Years | 35 (79.5%) | 15 (62.5%) |
| 55 to 64 Years | 18 (100.0%) | 21 (27.3%) |
| 65 to 74 Years | 20 (80.0%) | 23 (67.6%) |
| 75 Years and over | 7 (100.0%) | 23 (100.0%) |
| Total | 191 (53.5%) | 162 (60.9%) |
Income Below Poverty Among Married-Couple Families in Sandyfield
The poverty statistics for married-couple families in Sandyfield show that 10.4% or 5 of the total 48 families live below the poverty line. Families with no children have the highest poverty rate of 15.6%, comprising of 5 families. On the other hand, families with 1 or 2 children have the lowest poverty rate of 0.0%, which includes 0 families.
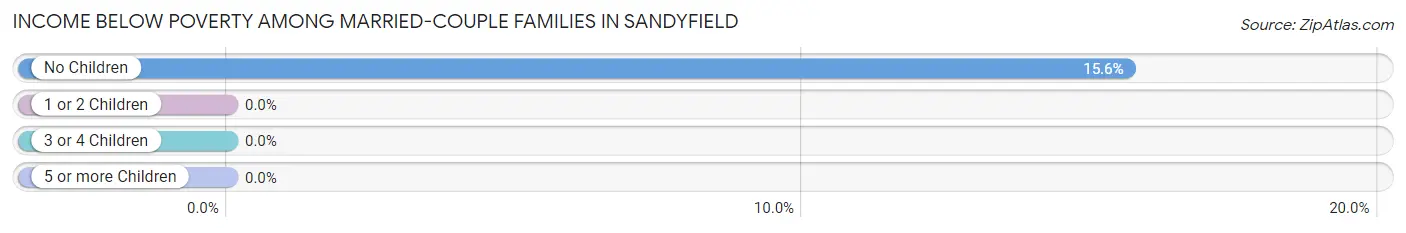
| Children | Above Poverty | Below Poverty |
| No Children | 27 (84.4%) | 5 (15.6%) |
| 1 or 2 Children | 8 (100.0%) | 0 (0.0%) |
| 3 or 4 Children | 8 (100.0%) | 0 (0.0%) |
| 5 or more Children | 0 (0.0%) | 0 (0.0%) |
| Total | 43 (89.6%) | 5 (10.4%) |
Income Below Poverty Among Single-Parent Households in Sandyfield
According to the poverty data in Sandyfield, 21.0% or 4 single-father households and 77.8% or 77 single-mother households are living below the poverty line. Among single-father households, those with 1 or 2 children have the highest poverty rate, with 4 households (57.1%) experiencing poverty. Likewise, among single-mother households, those with no children have the highest poverty rate, with 70 households (81.4%) falling below the poverty line.
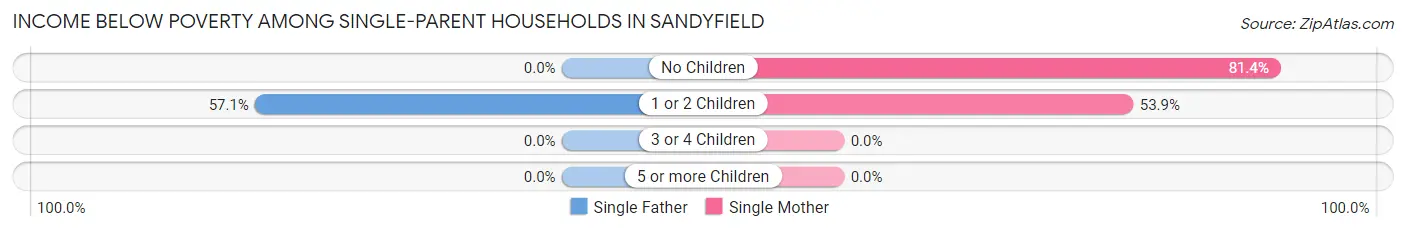
| Children | Single Father | Single Mother |
| No Children | 0 (0.0%) | 70 (81.4%) |
| 1 or 2 Children | 4 (57.1%) | 7 (53.8%) |
| 3 or 4 Children | 0 (0.0%) | 0 (0.0%) |
| 5 or more Children | 0 (0.0%) | 0 (0.0%) |
| Total | 4 (21.0%) | 77 (77.8%) |
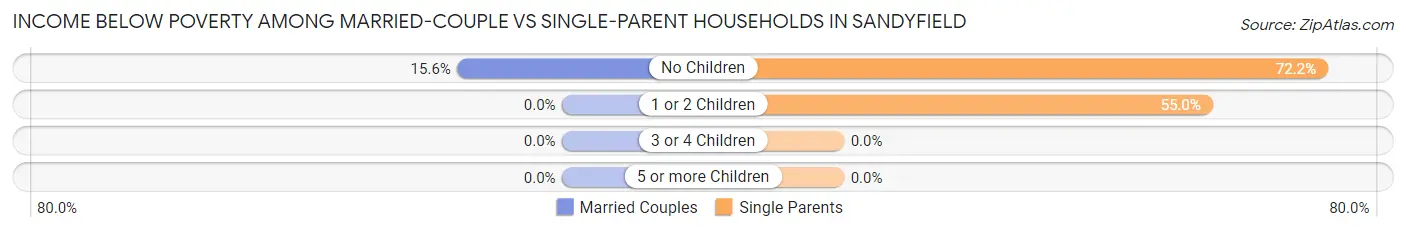
Income Below Poverty Among Married-Couple vs Single-Parent Households in Sandyfield
The poverty data for Sandyfield shows that 5 of the married-couple family households (10.4%) and 81 of the single-parent households (68.6%) are living below the poverty level. Within the married-couple family households, those with no children have the highest poverty rate, with 5 households (15.6%) falling below the poverty line. Among the single-parent households, those with no children have the highest poverty rate, with 70 household (72.2%) living below poverty.
| Children | Married-Couple Families | Single-Parent Households |
| No Children | 5 (15.6%) | 70 (72.2%) |
| 1 or 2 Children | 0 (0.0%) | 11 (55.0%) |
| 3 or 4 Children | 0 (0.0%) | 0 (0.0%) |
| 5 or more Children | 0 (0.0%) | 0 (0.0%) |
| Total | 5 (10.4%) | 81 (68.6%) |
Employment Characteristics in Sandyfield
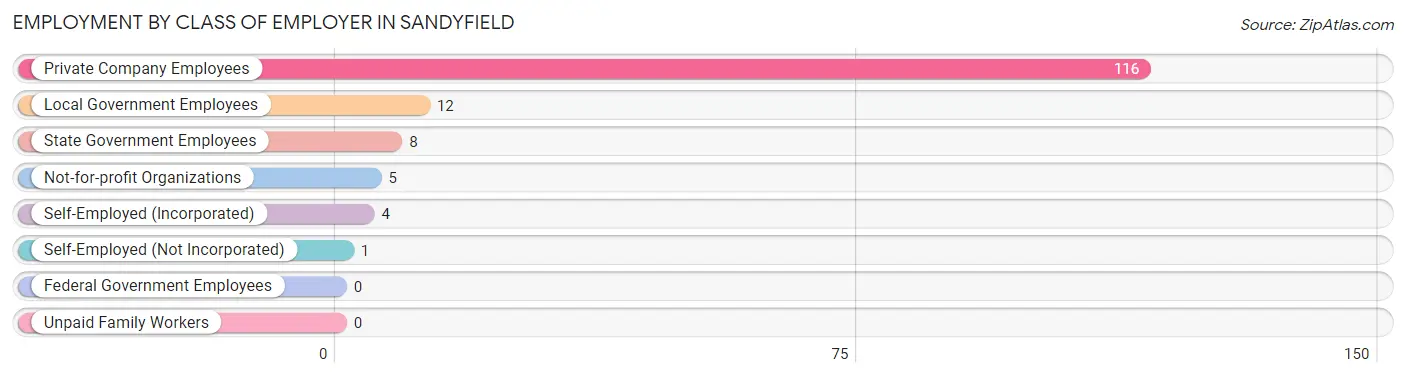
Employment by Class of Employer in Sandyfield
Among the 146 employed individuals in Sandyfield, private company employees (116 | 79.4%), local government employees (12 | 8.2%), and state government employees (8 | 5.5%) make up the most common classes of employment.
| Employer Class | # Employees | % Employees |
| Private Company Employees | 116 | 79.4% |
| Self-Employed (Incorporated) | 4 | 2.7% |
| Self-Employed (Not Incorporated) | 1 | 0.7% |
| Not-for-profit Organizations | 5 | 3.4% |
| Local Government Employees | 12 | 8.2% |
| State Government Employees | 8 | 5.5% |
| Federal Government Employees | 0 | 0.0% |
| Unpaid Family Workers | 0 | 0.0% |
| Total | 146 | 100.0% |
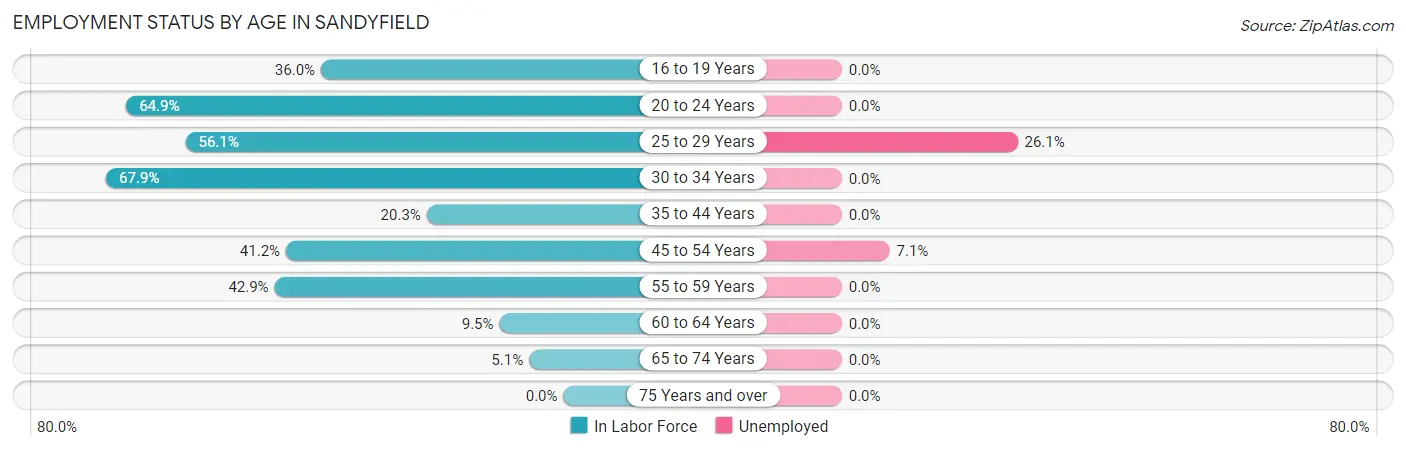
Employment Status by Age in Sandyfield
According to the labor force statistics for Sandyfield, out of the total population over 16 years of age (541), 28.5% or 154 individuals are in the labor force, with 5.2% or 8 of them unemployed. The age group with the highest labor force participation rate is 30 to 34 years, with 67.9% or 19 individuals in the labor force. Within the labor force, the 25 to 29 years age range has the highest percentage of unemployed individuals, with 26.1% or 6 of them being unemployed.
| Age Bracket | In Labor Force | Unemployed |
| 16 to 19 Years | 9 (36.0%) | 0 (0.0%) |
| 20 to 24 Years | 24 (64.9%) | 0 (0.0%) |
| 25 to 29 Years | 23 (56.1%) | 6 (26.1%) |
| 30 to 34 Years | 19 (67.9%) | 0 (0.0%) |
| 35 to 44 Years | 32 (20.3%) | 0 (0.0%) |
| 45 to 54 Years | 28 (41.2%) | 2 (7.1%) |
| 55 to 59 Years | 9 (42.9%) | 0 (0.0%) |
| 60 to 64 Years | 7 (9.5%) | 0 (0.0%) |
| 65 to 74 Years | 3 (5.1%) | 0 (0.0%) |
| 75 Years and over | 0 (0.0%) | 0 (0.0%) |
| Total | 154 (28.5%) | 8 (5.2%) |
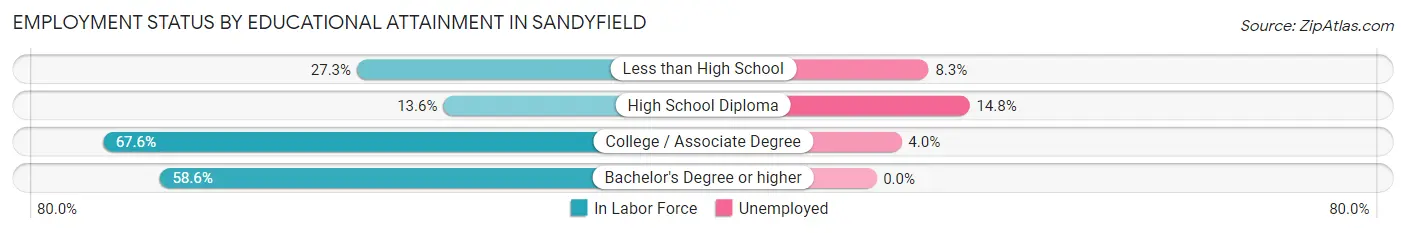
Employment Status by Educational Attainment in Sandyfield
According to labor force statistics for Sandyfield, 30.3% of individuals (118) out of the total population between 25 and 64 years of age (390) are in the labor force, with 6.8% or 8 of them being unemployed. The group with the highest labor force participation rate are those with the educational attainment of college / associate degree, with 67.6% or 50 individuals in the labor force. Within the labor force, individuals with high school diploma education have the highest percentage of unemployment, with 14.8% or 4 of them being unemployed.
| Educational Attainment | In Labor Force | Unemployed |
| Less than High School | 24 (27.3%) | 7 (8.3%) |
| High School Diploma | 27 (13.6%) | 29 (14.8%) |
| College / Associate Degree | 50 (67.6%) | 3 (4.0%) |
| Bachelor's Degree or higher | 17 (58.6%) | 0 (0.0%) |
| Total | 118 (30.3%) | 27 (6.8%) |
Employment Occupations by Sex in Sandyfield
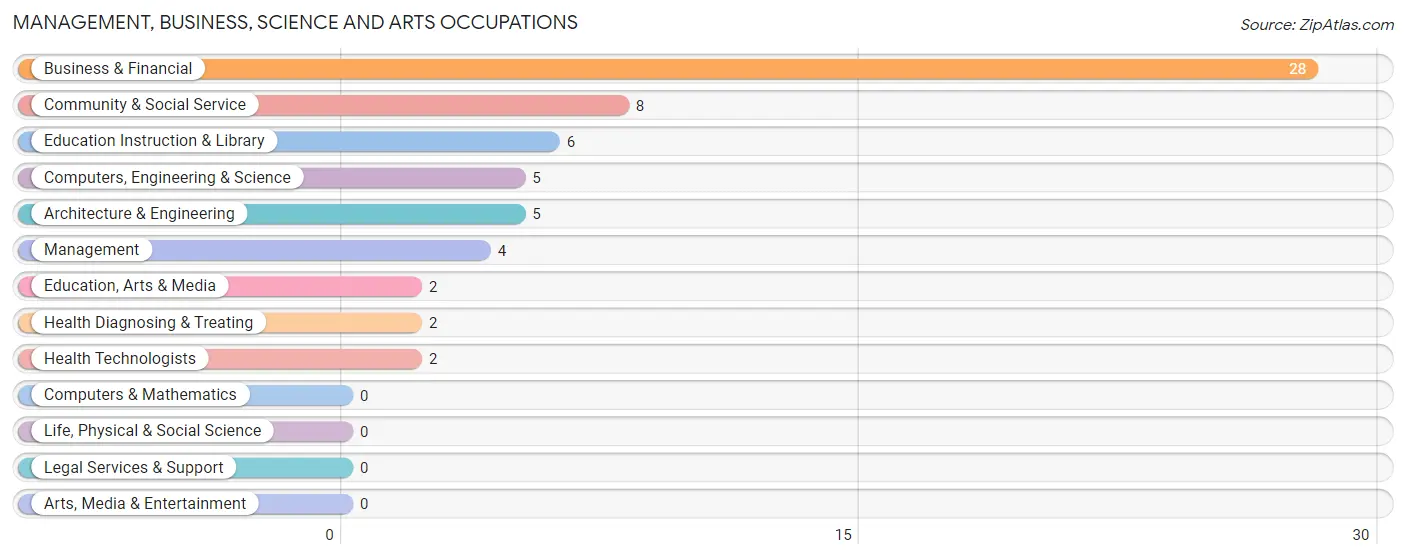
Management, Business, Science and Arts Occupations
The most common Management, Business, Science and Arts occupations in Sandyfield are Business & Financial (28 | 19.2%), Community & Social Service (8 | 5.5%), Education Instruction & Library (6 | 4.1%), Computers, Engineering & Science (5 | 3.4%), and Architecture & Engineering (5 | 3.4%).
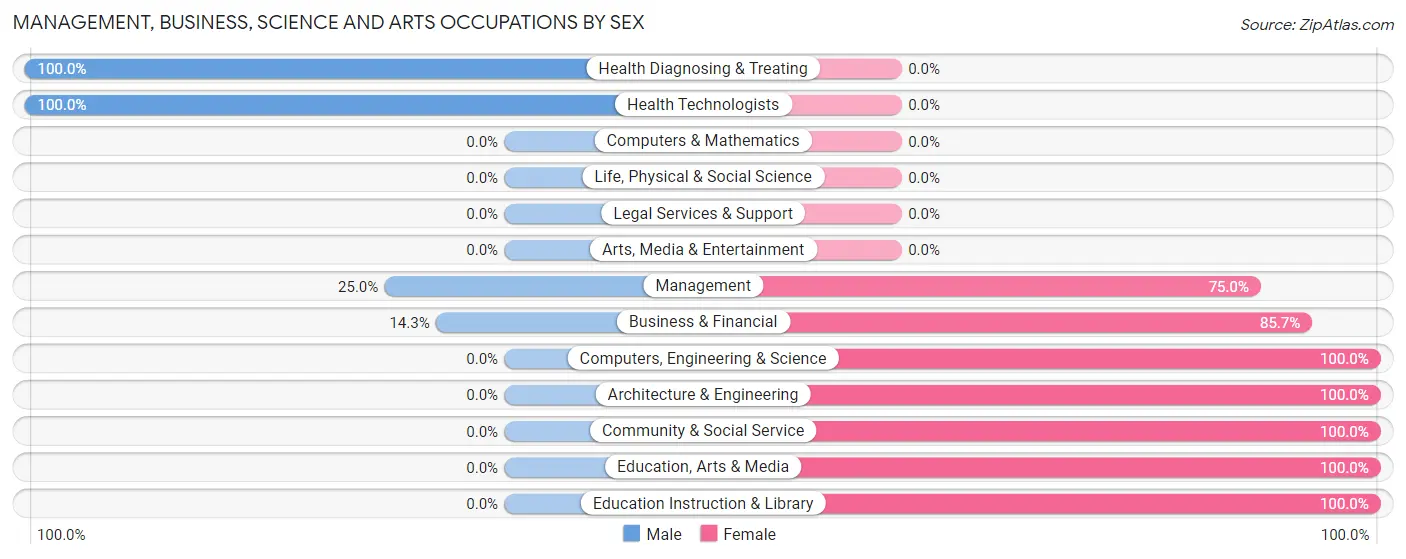
Management, Business, Science and Arts Occupations by Sex
Within the Management, Business, Science and Arts occupations in Sandyfield, the most male-oriented occupations are Health Diagnosing & Treating (100.0%), Health Technologists (100.0%), and Management (25.0%), while the most female-oriented occupations are Computers, Engineering & Science (100.0%), Architecture & Engineering (100.0%), and Community & Social Service (100.0%).
| Occupation | Male | Female |
| Management | 1 (25.0%) | 3 (75.0%) |
| Business & Financial | 4 (14.3%) | 24 (85.7%) |
| Computers, Engineering & Science | 0 (0.0%) | 5 (100.0%) |
| Computers & Mathematics | 0 (0.0%) | 0 (0.0%) |
| Architecture & Engineering | 0 (0.0%) | 5 (100.0%) |
| Life, Physical & Social Science | 0 (0.0%) | 0 (0.0%) |
| Community & Social Service | 0 (0.0%) | 8 (100.0%) |
| Education, Arts & Media | 0 (0.0%) | 2 (100.0%) |
| Legal Services & Support | 0 (0.0%) | 0 (0.0%) |
| Education Instruction & Library | 0 (0.0%) | 6 (100.0%) |
| Arts, Media & Entertainment | 0 (0.0%) | 0 (0.0%) |
| Health Diagnosing & Treating | 2 (100.0%) | 0 (0.0%) |
| Health Technologists | 2 (100.0%) | 0 (0.0%) |
| Total (Category) | 7 (14.9%) | 40 (85.1%) |
| Total (Overall) | 73 (50.0%) | 73 (50.0%) |
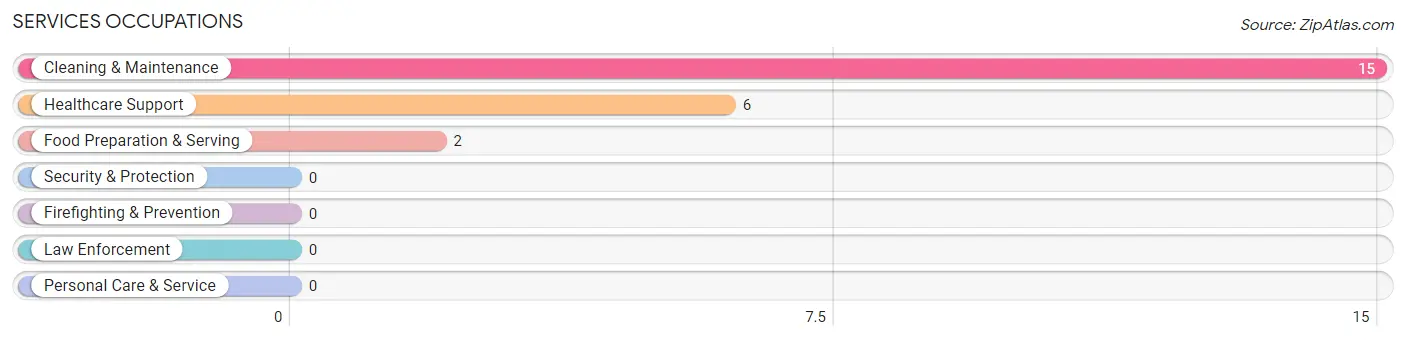
Services Occupations
The most common Services occupations in Sandyfield are Cleaning & Maintenance (15 | 10.3%), Healthcare Support (6 | 4.1%), and Food Preparation & Serving (2 | 1.4%).
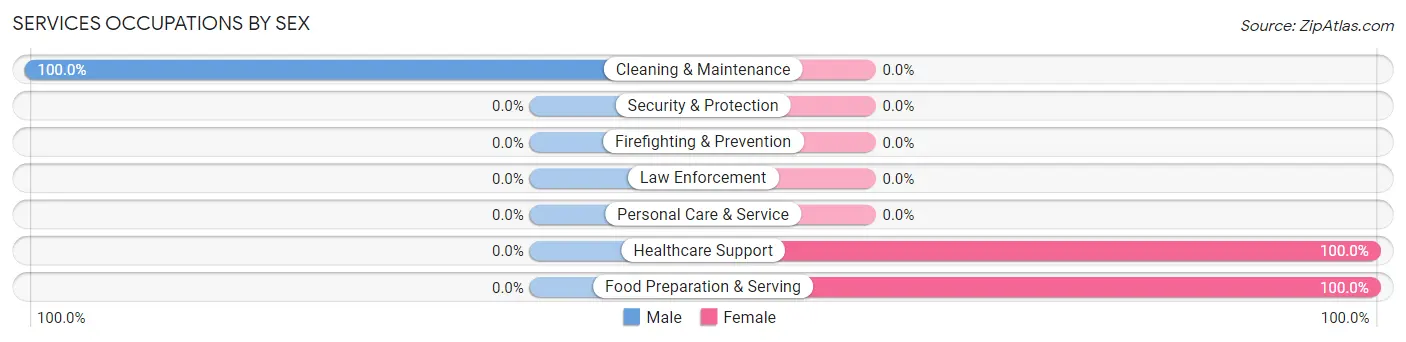
Services Occupations by Sex
| Occupation | Male | Female |
| Healthcare Support | 0 (0.0%) | 6 (100.0%) |
| Security & Protection | 0 (0.0%) | 0 (0.0%) |
| Firefighting & Prevention | 0 (0.0%) | 0 (0.0%) |
| Law Enforcement | 0 (0.0%) | 0 (0.0%) |
| Food Preparation & Serving | 0 (0.0%) | 2 (100.0%) |
| Cleaning & Maintenance | 15 (100.0%) | 0 (0.0%) |
| Personal Care & Service | 0 (0.0%) | 0 (0.0%) |
| Total (Category) | 15 (65.2%) | 8 (34.8%) |
| Total (Overall) | 73 (50.0%) | 73 (50.0%) |
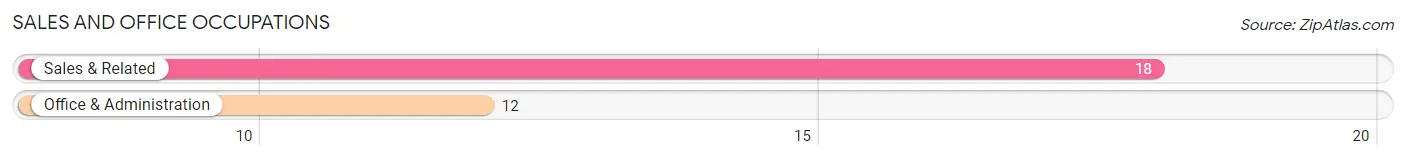
Sales and Office Occupations
The most common Sales and Office occupations in Sandyfield are Sales & Related (18 | 12.3%), and Office & Administration (12 | 8.2%).
Sales and Office Occupations by Sex
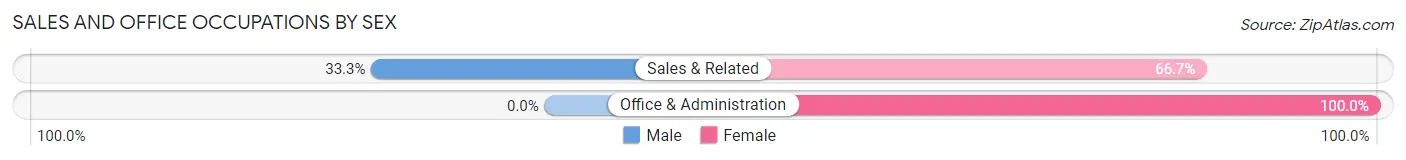
| Occupation | Male | Female |
| Sales & Related | 6 (33.3%) | 12 (66.7%) |
| Office & Administration | 0 (0.0%) | 12 (100.0%) |
| Total (Category) | 6 (20.0%) | 24 (80.0%) |
| Total (Overall) | 73 (50.0%) | 73 (50.0%) |
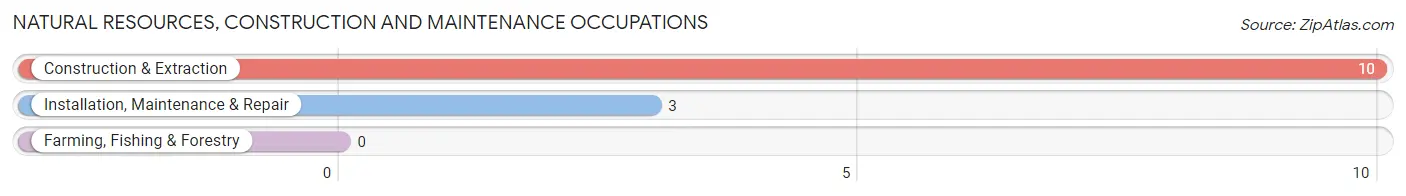
Natural Resources, Construction and Maintenance Occupations
The most common Natural Resources, Construction and Maintenance occupations in Sandyfield are Construction & Extraction (10 | 6.9%), and Installation, Maintenance & Repair (3 | 2.1%).
Natural Resources, Construction and Maintenance Occupations by Sex
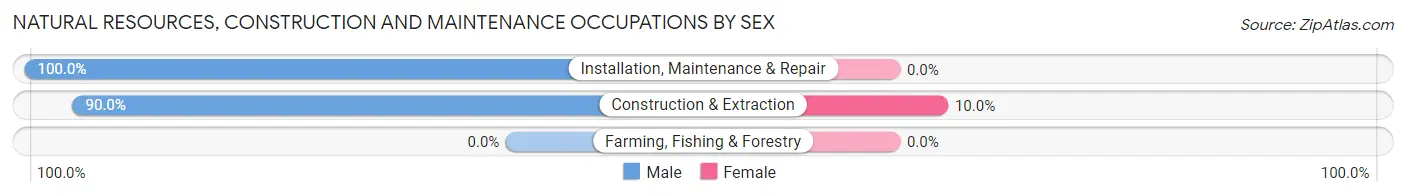
| Occupation | Male | Female |
| Farming, Fishing & Forestry | 0 (0.0%) | 0 (0.0%) |
| Construction & Extraction | 9 (90.0%) | 1 (10.0%) |
| Installation, Maintenance & Repair | 3 (100.0%) | 0 (0.0%) |
| Total (Category) | 12 (92.3%) | 1 (7.7%) |
| Total (Overall) | 73 (50.0%) | 73 (50.0%) |
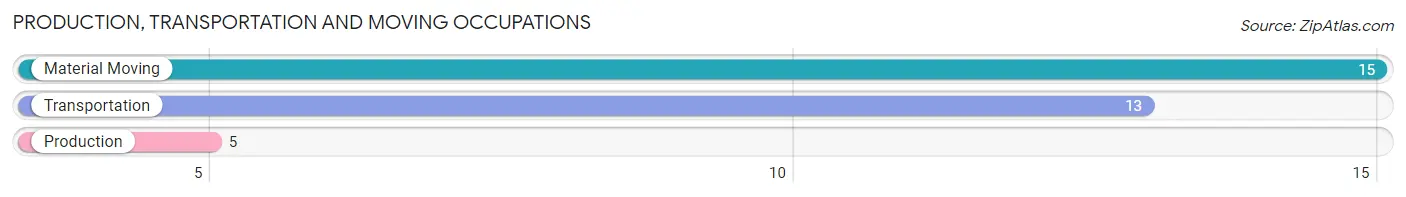
Production, Transportation and Moving Occupations
The most common Production, Transportation and Moving occupations in Sandyfield are Material Moving (15 | 10.3%), Transportation (13 | 8.9%), and Production (5 | 3.4%).
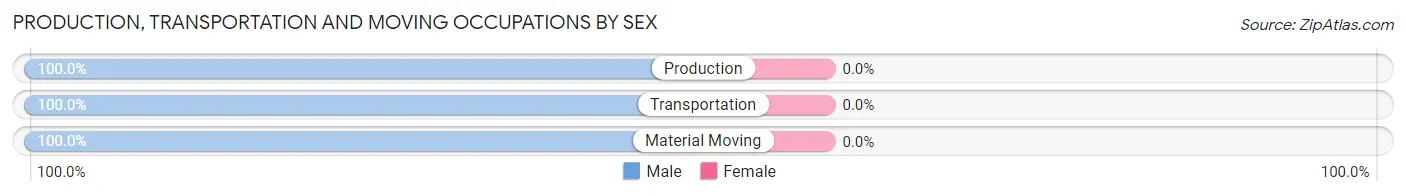
Production, Transportation and Moving Occupations by Sex
| Occupation | Male | Female |
| Production | 5 (100.0%) | 0 (0.0%) |
| Transportation | 13 (100.0%) | 0 (0.0%) |
| Material Moving | 15 (100.0%) | 0 (0.0%) |
| Total (Category) | 33 (100.0%) | 0 (0.0%) |
| Total (Overall) | 73 (50.0%) | 73 (50.0%) |
Employment Industries by Sex in Sandyfield
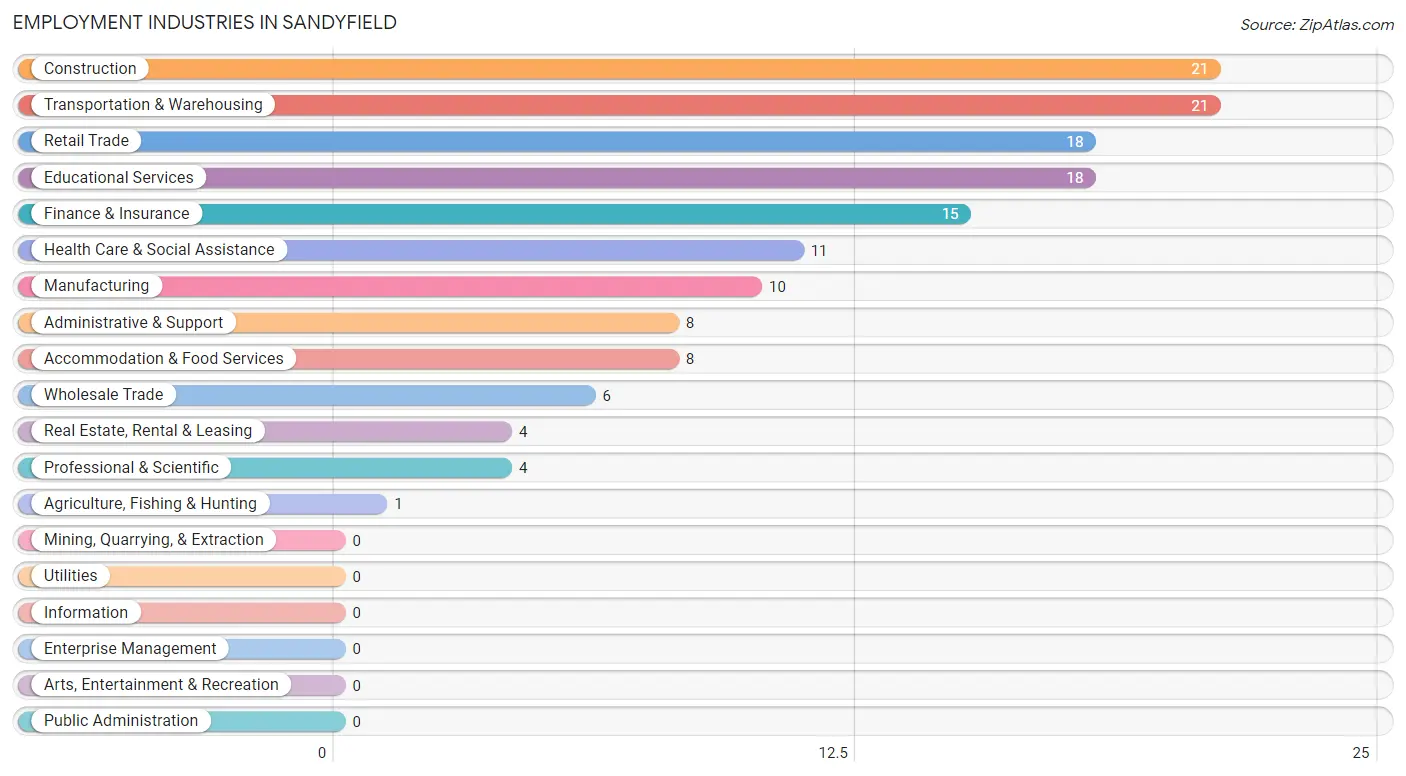
Employment Industries in Sandyfield
The major employment industries in Sandyfield include Construction (21 | 14.4%), Transportation & Warehousing (21 | 14.4%), Retail Trade (18 | 12.3%), Educational Services (18 | 12.3%), and Finance & Insurance (15 | 10.3%).
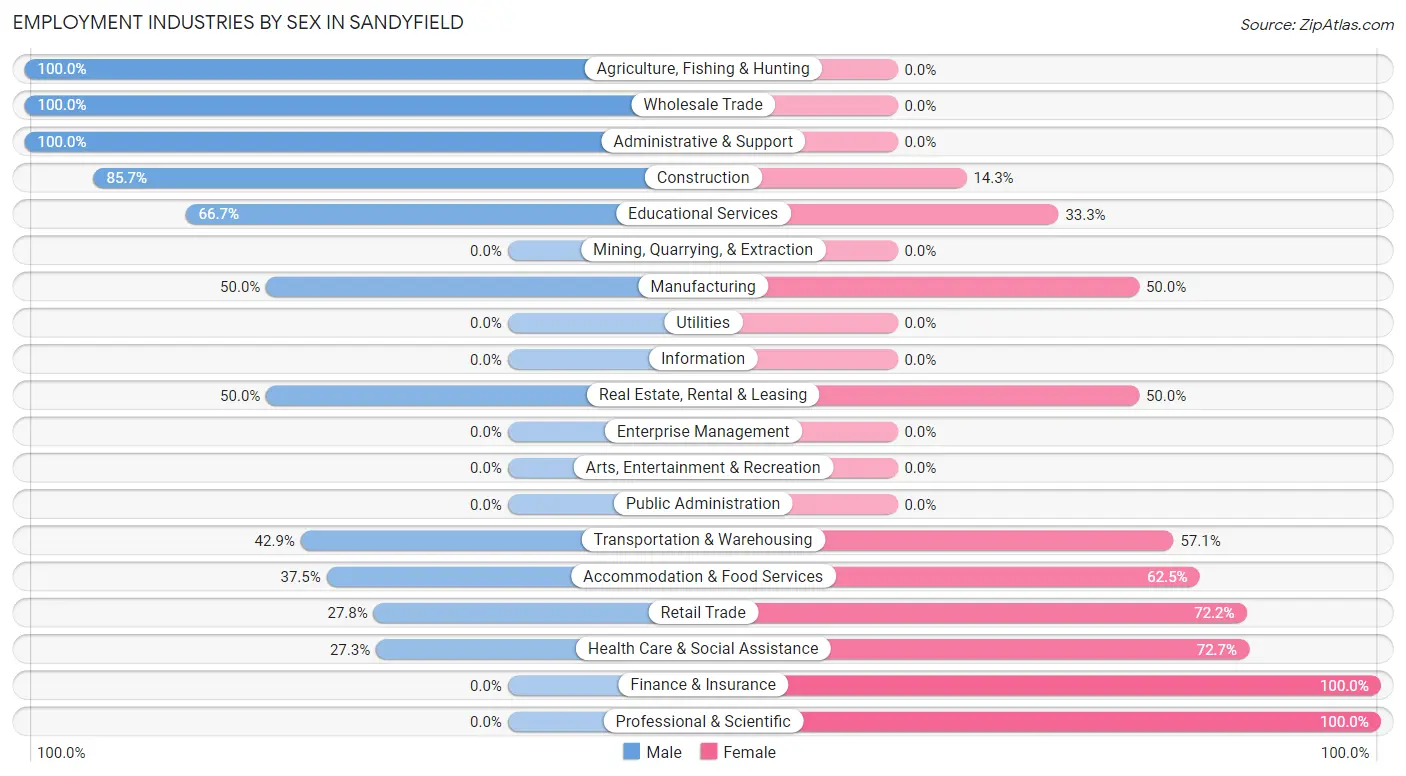
Employment Industries by Sex in Sandyfield
The Sandyfield industries that see more men than women are Agriculture, Fishing & Hunting (100.0%), Wholesale Trade (100.0%), and Administrative & Support (100.0%), whereas the industries that tend to have a higher number of women are Finance & Insurance (100.0%), Professional & Scientific (100.0%), and Health Care & Social Assistance (72.7%).
| Industry | Male | Female |
| Agriculture, Fishing & Hunting | 1 (100.0%) | 0 (0.0%) |
| Mining, Quarrying, & Extraction | 0 (0.0%) | 0 (0.0%) |
| Construction | 18 (85.7%) | 3 (14.3%) |
| Manufacturing | 5 (50.0%) | 5 (50.0%) |
| Wholesale Trade | 6 (100.0%) | 0 (0.0%) |
| Retail Trade | 5 (27.8%) | 13 (72.2%) |
| Transportation & Warehousing | 9 (42.9%) | 12 (57.1%) |
| Utilities | 0 (0.0%) | 0 (0.0%) |
| Information | 0 (0.0%) | 0 (0.0%) |
| Finance & Insurance | 0 (0.0%) | 15 (100.0%) |
| Real Estate, Rental & Leasing | 2 (50.0%) | 2 (50.0%) |
| Professional & Scientific | 0 (0.0%) | 4 (100.0%) |
| Enterprise Management | 0 (0.0%) | 0 (0.0%) |
| Administrative & Support | 8 (100.0%) | 0 (0.0%) |
| Educational Services | 12 (66.7%) | 6 (33.3%) |
| Health Care & Social Assistance | 3 (27.3%) | 8 (72.7%) |
| Arts, Entertainment & Recreation | 0 (0.0%) | 0 (0.0%) |
| Accommodation & Food Services | 3 (37.5%) | 5 (62.5%) |
| Public Administration | 0 (0.0%) | 0 (0.0%) |
| Total | 73 (50.0%) | 73 (50.0%) |
Education in Sandyfield
School Enrollment in Sandyfield
The most common levels of schooling among the 74 students in Sandyfield are elementary school (27 | 36.5%), middle school (18 | 24.3%), and high school (18 | 24.3%).
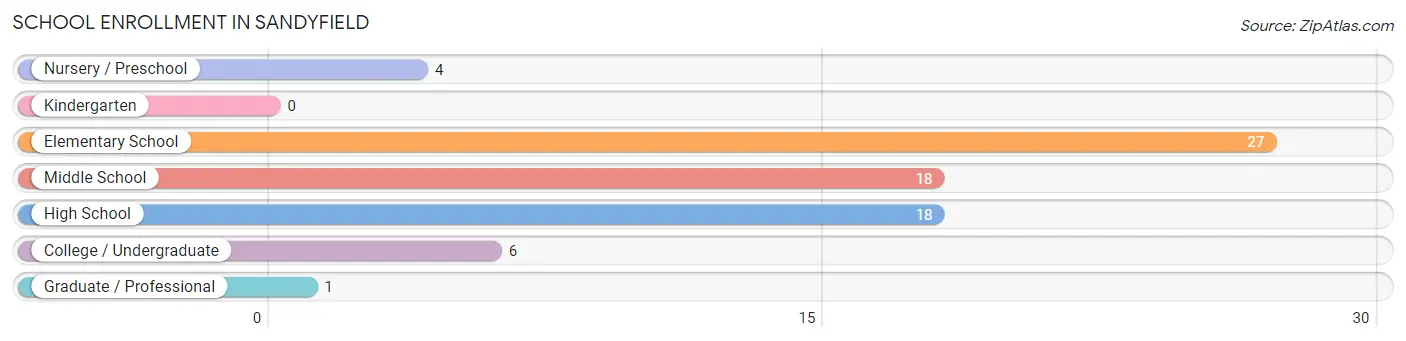
| School Level | # Students | % Students |
| Nursery / Preschool | 4 | 5.4% |
| Kindergarten | 0 | 0.0% |
| Elementary School | 27 | 36.5% |
| Middle School | 18 | 24.3% |
| High School | 18 | 24.3% |
| College / Undergraduate | 6 | 8.1% |
| Graduate / Professional | 1 | 1.3% |
| Total | 74 | 100.0% |
School Enrollment by Age by Funding Source in Sandyfield
Out of a total of 74 students who are enrolled in schools in Sandyfield, 9 (12.2%) attend a private institution, while the remaining 65 (87.8%) are enrolled in public schools. The age group of 15 to 17 year olds has the highest likelihood of being enrolled in private schools, with 3 (60.0% in the age bracket) enrolled. Conversely, the age group of 18 to 19 year olds has the lowest likelihood of being enrolled in a private school, with 9 (100.0% in the age bracket) attending a public institution.
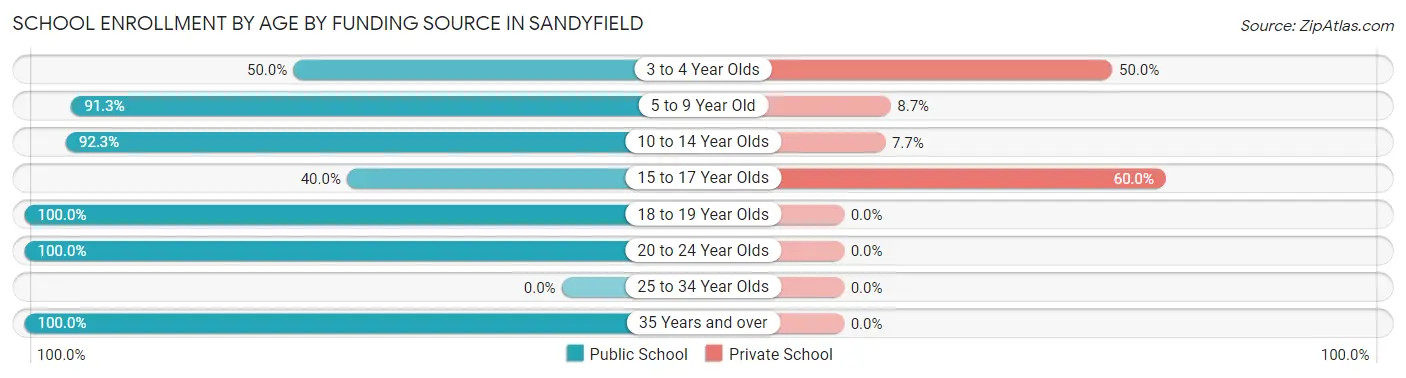
| Age Bracket | Public School | Private School |
| 3 to 4 Year Olds | 2 (50.0%) | 2 (50.0%) |
| 5 to 9 Year Old | 21 (91.3%) | 2 (8.7%) |
| 10 to 14 Year Olds | 24 (92.3%) | 2 (7.7%) |
| 15 to 17 Year Olds | 2 (40.0%) | 3 (60.0%) |
| 18 to 19 Year Olds | 9 (100.0%) | 0 (0.0%) |
| 20 to 24 Year Olds | 6 (100.0%) | 0 (0.0%) |
| 25 to 34 Year Olds | 0 (0.0%) | 0 (0.0%) |
| 35 Years and over | 1 (100.0%) | 0 (0.0%) |
| Total | 65 (87.8%) | 9 (12.2%) |
Educational Attainment by Field of Study in Sandyfield
Business (22 | 38.6%), education (12 | 21.0%), computers & mathematics (11 | 19.3%), liberal arts & history (10 | 17.5%), and literature & languages (1 | 1.8%) are the most common fields of study among 57 individuals in Sandyfield who have obtained a bachelor's degree or higher.
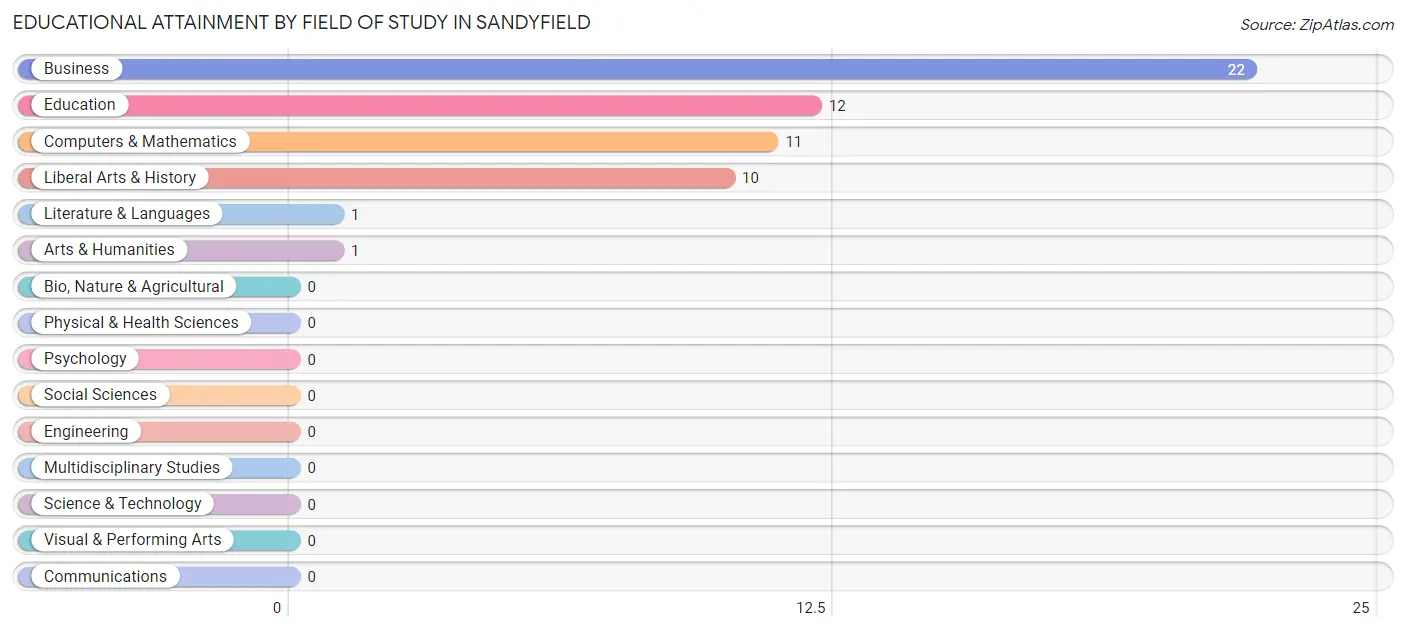
| Field of Study | # Graduates | % Graduates |
| Computers & Mathematics | 11 | 19.3% |
| Bio, Nature & Agricultural | 0 | 0.0% |
| Physical & Health Sciences | 0 | 0.0% |
| Psychology | 0 | 0.0% |
| Social Sciences | 0 | 0.0% |
| Engineering | 0 | 0.0% |
| Multidisciplinary Studies | 0 | 0.0% |
| Science & Technology | 0 | 0.0% |
| Business | 22 | 38.6% |
| Education | 12 | 21.0% |
| Literature & Languages | 1 | 1.8% |
| Liberal Arts & History | 10 | 17.5% |
| Visual & Performing Arts | 0 | 0.0% |
| Communications | 0 | 0.0% |
| Arts & Humanities | 1 | 1.8% |
| Total | 57 | 100.0% |
Transportation & Commute in Sandyfield
Vehicle Availability by Sex in Sandyfield
The most prevalent vehicle ownership categories in Sandyfield are males with 2 vehicles (45, accounting for 61.6%) and females with 2 vehicles (30, making up 61.6%).
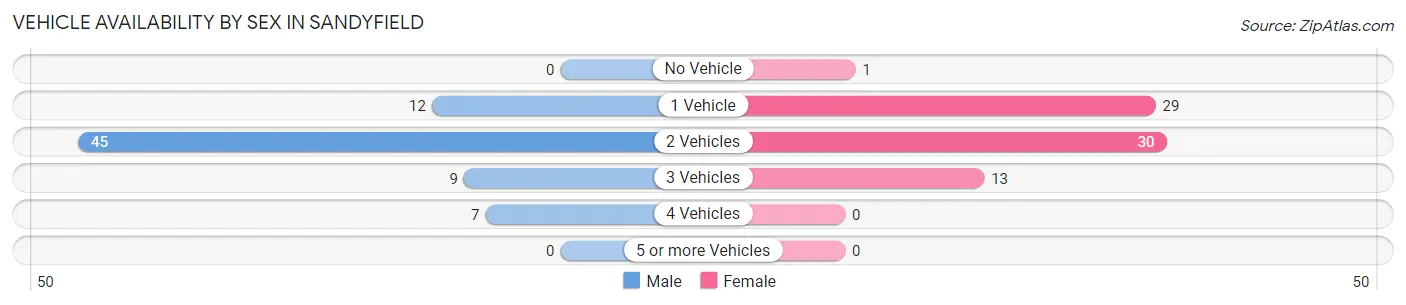
| Vehicles Available | Male | Female |
| No Vehicle | 0 (0.0%) | 1 (1.4%) |
| 1 Vehicle | 12 (16.4%) | 29 (39.7%) |
| 2 Vehicles | 45 (61.6%) | 30 (41.1%) |
| 3 Vehicles | 9 (12.3%) | 13 (17.8%) |
| 4 Vehicles | 7 (9.6%) | 0 (0.0%) |
| 5 or more Vehicles | 0 (0.0%) | 0 (0.0%) |
| Total | 73 (100.0%) | 73 (100.0%) |
Commute Time in Sandyfield
The most frequently occuring commute durations in Sandyfield are 45 to 59 minutes (30 commuters, 22.4%), 20 to 24 minutes (29 commuters, 21.6%), and 30 to 34 minutes (25 commuters, 18.7%).
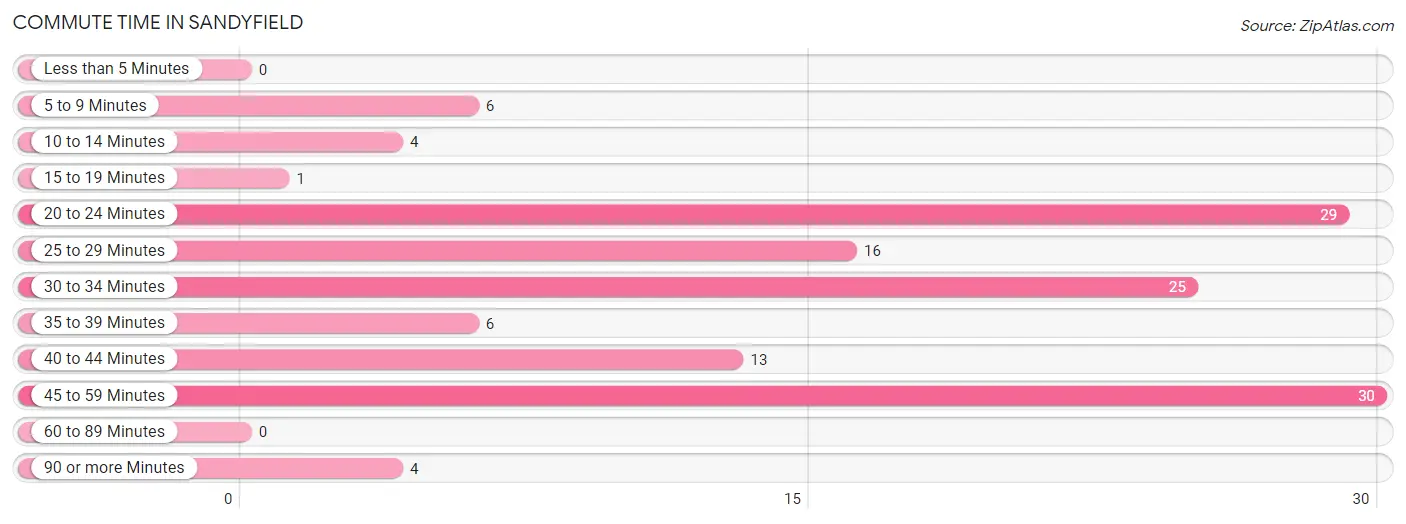
| Commute Time | # Commuters | % Commuters |
| Less than 5 Minutes | 0 | 0.0% |
| 5 to 9 Minutes | 6 | 4.5% |
| 10 to 14 Minutes | 4 | 3.0% |
| 15 to 19 Minutes | 1 | 0.7% |
| 20 to 24 Minutes | 29 | 21.6% |
| 25 to 29 Minutes | 16 | 11.9% |
| 30 to 34 Minutes | 25 | 18.7% |
| 35 to 39 Minutes | 6 | 4.5% |
| 40 to 44 Minutes | 13 | 9.7% |
| 45 to 59 Minutes | 30 | 22.4% |
| 60 to 89 Minutes | 0 | 0.0% |
| 90 or more Minutes | 4 | 3.0% |
Commute Time by Sex in Sandyfield
The most common commute times in Sandyfield are 30 to 34 minutes (17 commuters, 23.3%) for males and 45 to 59 minutes (19 commuters, 31.1%) for females.
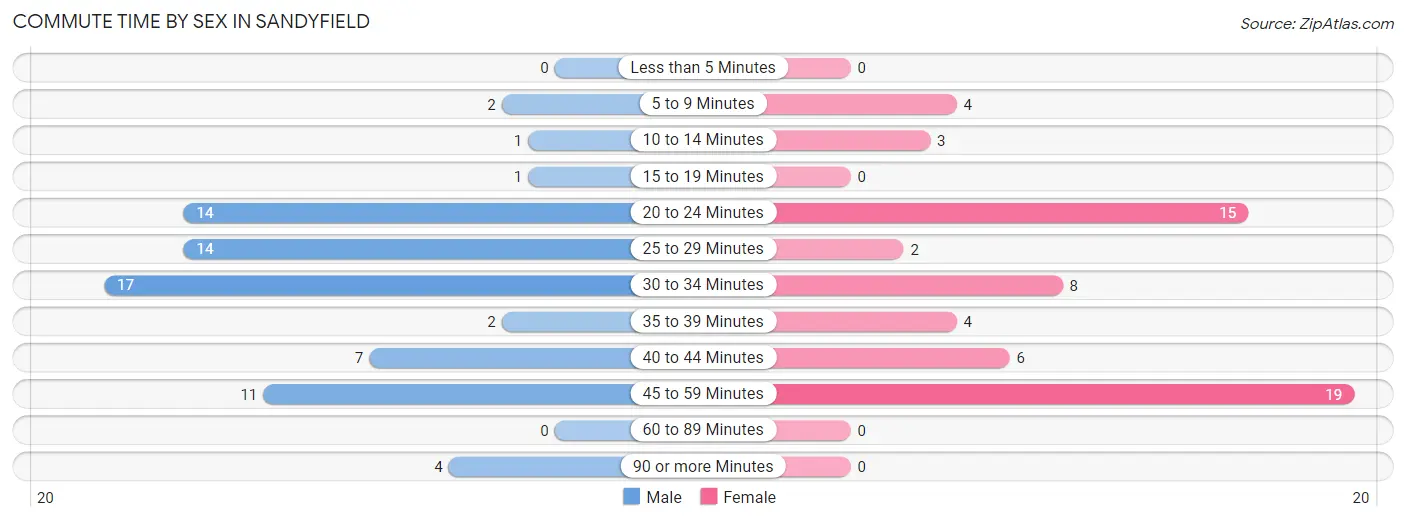
| Commute Time | Male | Female |
| Less than 5 Minutes | 0 (0.0%) | 0 (0.0%) |
| 5 to 9 Minutes | 2 (2.7%) | 4 (6.6%) |
| 10 to 14 Minutes | 1 (1.4%) | 3 (4.9%) |
| 15 to 19 Minutes | 1 (1.4%) | 0 (0.0%) |
| 20 to 24 Minutes | 14 (19.2%) | 15 (24.6%) |
| 25 to 29 Minutes | 14 (19.2%) | 2 (3.3%) |
| 30 to 34 Minutes | 17 (23.3%) | 8 (13.1%) |
| 35 to 39 Minutes | 2 (2.7%) | 4 (6.6%) |
| 40 to 44 Minutes | 7 (9.6%) | 6 (9.8%) |
| 45 to 59 Minutes | 11 (15.1%) | 19 (31.1%) |
| 60 to 89 Minutes | 0 (0.0%) | 0 (0.0%) |
| 90 or more Minutes | 4 (5.5%) | 0 (0.0%) |
Time of Departure to Work by Sex in Sandyfield
The most frequent times of departure to work in Sandyfield are 6:30 AM to 6:59 AM (18, 24.7%) for males and 5:30 AM to 5:59 AM (19, 31.1%) for females.
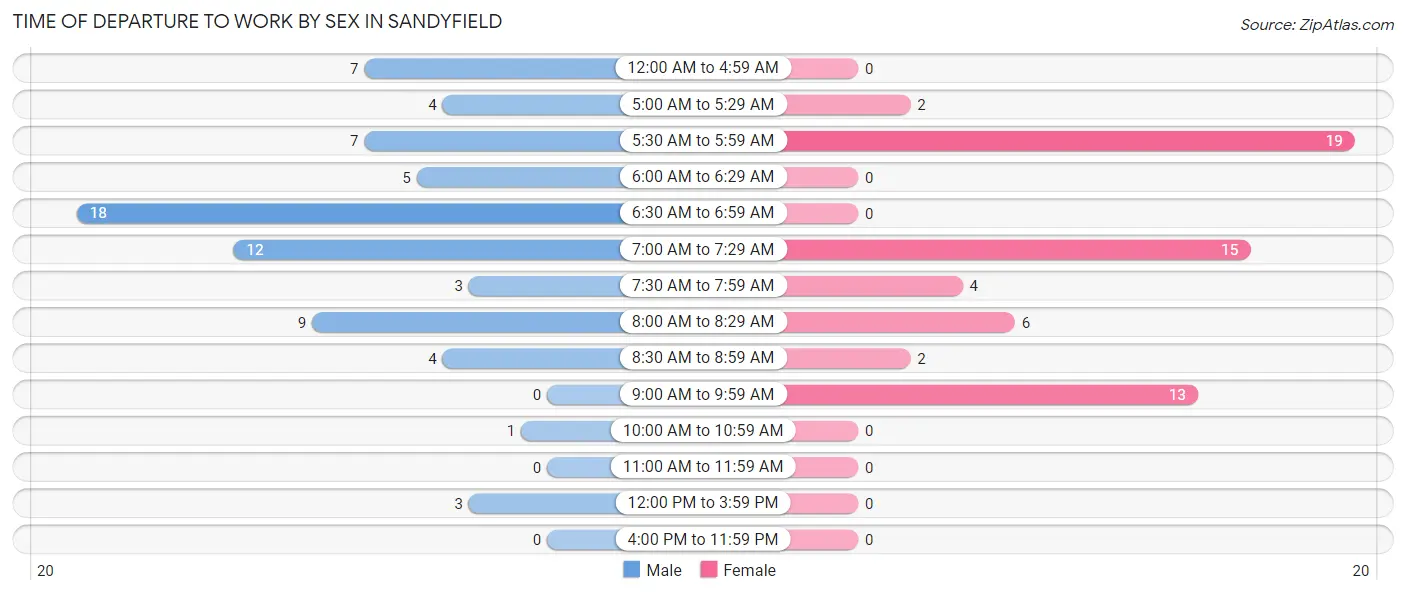
| Time of Departure | Male | Female |
| 12:00 AM to 4:59 AM | 7 (9.6%) | 0 (0.0%) |
| 5:00 AM to 5:29 AM | 4 (5.5%) | 2 (3.3%) |
| 5:30 AM to 5:59 AM | 7 (9.6%) | 19 (31.1%) |
| 6:00 AM to 6:29 AM | 5 (6.9%) | 0 (0.0%) |
| 6:30 AM to 6:59 AM | 18 (24.7%) | 0 (0.0%) |
| 7:00 AM to 7:29 AM | 12 (16.4%) | 15 (24.6%) |
| 7:30 AM to 7:59 AM | 3 (4.1%) | 4 (6.6%) |
| 8:00 AM to 8:29 AM | 9 (12.3%) | 6 (9.8%) |
| 8:30 AM to 8:59 AM | 4 (5.5%) | 2 (3.3%) |
| 9:00 AM to 9:59 AM | 0 (0.0%) | 13 (21.3%) |
| 10:00 AM to 10:59 AM | 1 (1.4%) | 0 (0.0%) |
| 11:00 AM to 11:59 AM | 0 (0.0%) | 0 (0.0%) |
| 12:00 PM to 3:59 PM | 3 (4.1%) | 0 (0.0%) |
| 4:00 PM to 11:59 PM | 0 (0.0%) | 0 (0.0%) |
| Total | 73 (100.0%) | 61 (100.0%) |
Housing Occupancy in Sandyfield
Occupancy by Ownership in Sandyfield
Of the total 202 dwellings in Sandyfield, owner-occupied units account for 152 (75.2%), while renter-occupied units make up 50 (24.7%).
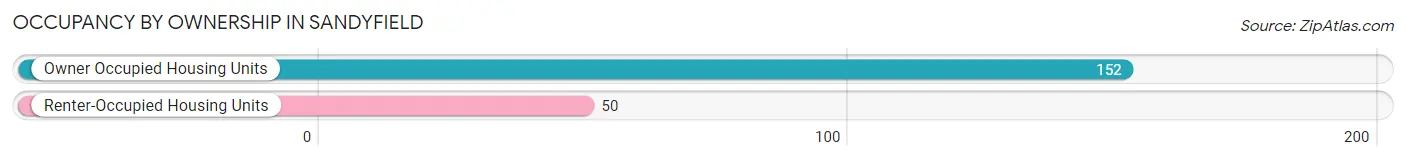
| Occupancy | # Housing Units | % Housing Units |
| Owner Occupied Housing Units | 152 | 75.2% |
| Renter-Occupied Housing Units | 50 | 24.7% |
| Total Occupied Housing Units | 202 | 100.0% |
Occupancy by Household Size in Sandyfield
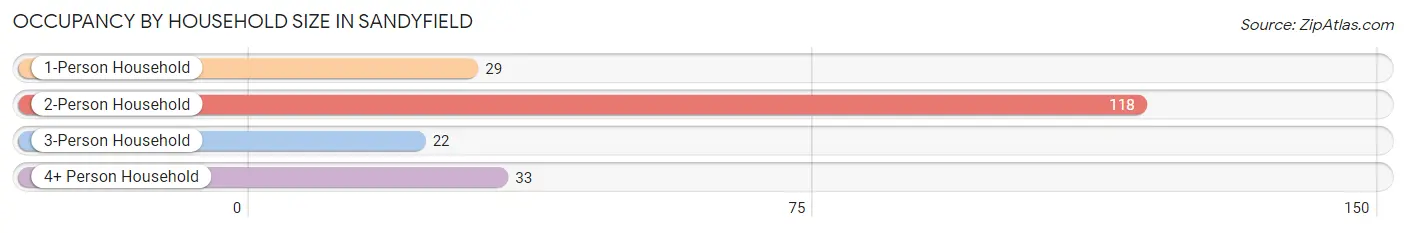
| Household Size | # Housing Units | % Housing Units |
| 1-Person Household | 29 | 14.4% |
| 2-Person Household | 118 | 58.4% |
| 3-Person Household | 22 | 10.9% |
| 4+ Person Household | 33 | 16.3% |
| Total Housing Units | 202 | 100.0% |
Occupancy by Ownership by Household Size in Sandyfield
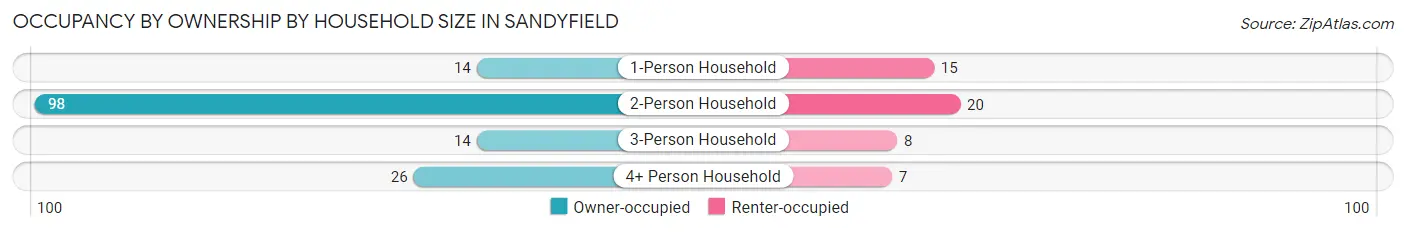
| Household Size | Owner-occupied | Renter-occupied |
| 1-Person Household | 14 (48.3%) | 15 (51.7%) |
| 2-Person Household | 98 (83.1%) | 20 (17.0%) |
| 3-Person Household | 14 (63.6%) | 8 (36.4%) |
| 4+ Person Household | 26 (78.8%) | 7 (21.2%) |
| Total Housing Units | 152 (75.2%) | 50 (24.7%) |
Occupancy by Educational Attainment in Sandyfield
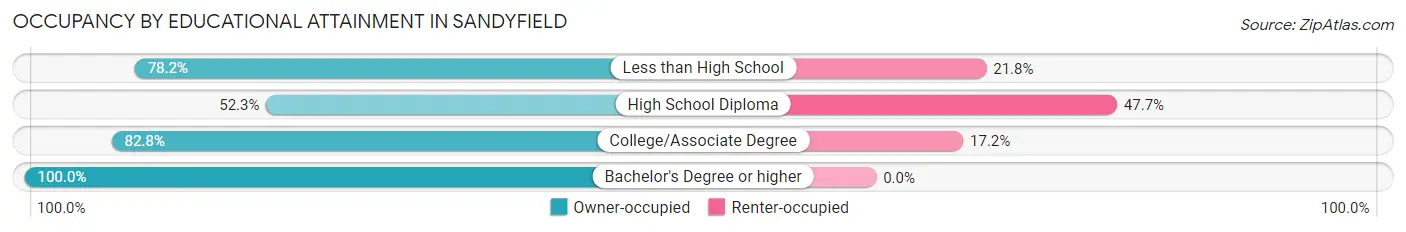
| Household Size | Owner-occupied | Renter-occupied |
| Less than High School | 68 (78.2%) | 19 (21.8%) |
| High School Diploma | 23 (52.3%) | 21 (47.7%) |
| College/Associate Degree | 48 (82.8%) | 10 (17.2%) |
| Bachelor's Degree or higher | 13 (100.0%) | 0 (0.0%) |
Occupancy by Age of Householder in Sandyfield
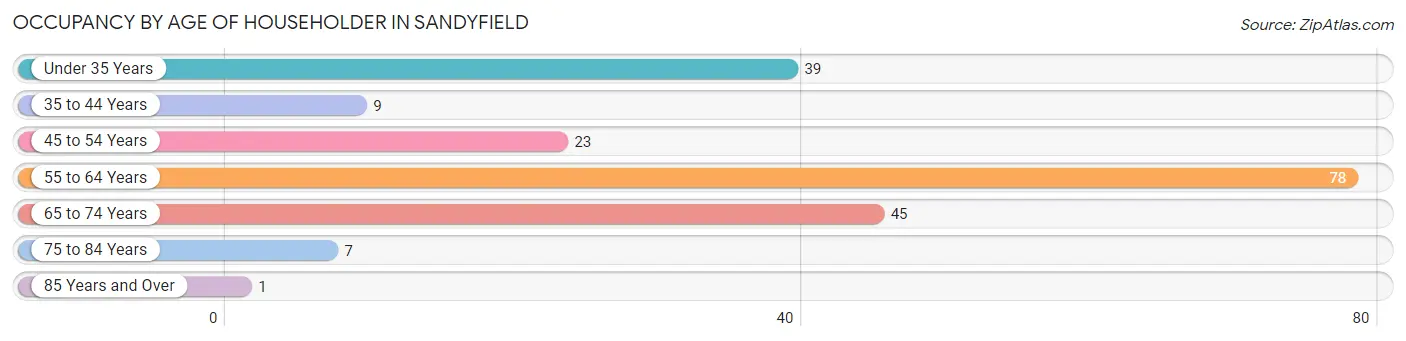
| Age Bracket | # Households | % Households |
| Under 35 Years | 39 | 19.3% |
| 35 to 44 Years | 9 | 4.5% |
| 45 to 54 Years | 23 | 11.4% |
| 55 to 64 Years | 78 | 38.6% |
| 65 to 74 Years | 45 | 22.3% |
| 75 to 84 Years | 7 | 3.5% |
| 85 Years and Over | 1 | 0.5% |
| Total | 202 | 100.0% |
Housing Finances in Sandyfield
Median Income by Occupancy in Sandyfield
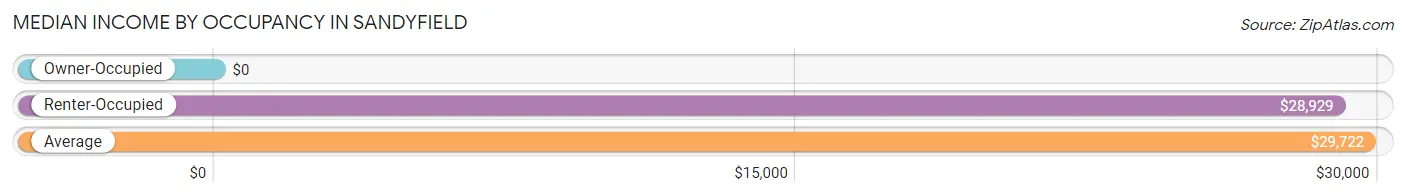
| Occupancy Type | # Households | Median Income |
| Owner-Occupied | 152 (75.2%) | $0 |
| Renter-Occupied | 50 (24.7%) | $28,929 |
| Average | 202 (100.0%) | $29,722 |
Occupancy by Householder Income Bracket in Sandyfield
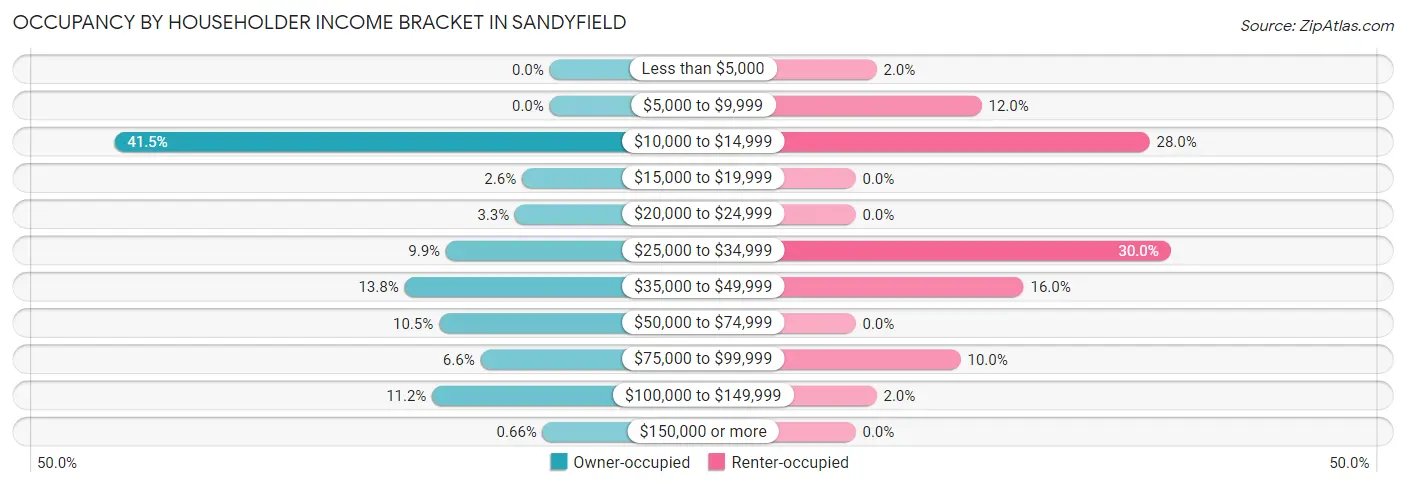
| Income Bracket | Owner-occupied | Renter-occupied |
| Less than $5,000 | 0 (0.0%) | 1 (2.0%) |
| $5,000 to $9,999 | 0 (0.0%) | 6 (12.0%) |
| $10,000 to $14,999 | 63 (41.4%) | 14 (28.0%) |
| $15,000 to $19,999 | 4 (2.6%) | 0 (0.0%) |
| $20,000 to $24,999 | 5 (3.3%) | 0 (0.0%) |
| $25,000 to $34,999 | 15 (9.9%) | 15 (30.0%) |
| $35,000 to $49,999 | 21 (13.8%) | 8 (16.0%) |
| $50,000 to $74,999 | 16 (10.5%) | 0 (0.0%) |
| $75,000 to $99,999 | 10 (6.6%) | 5 (10.0%) |
| $100,000 to $149,999 | 17 (11.2%) | 1 (2.0%) |
| $150,000 or more | 1 (0.7%) | 0 (0.0%) |
| Total | 152 (100.0%) | 50 (100.0%) |
Monthly Housing Cost Tiers in Sandyfield
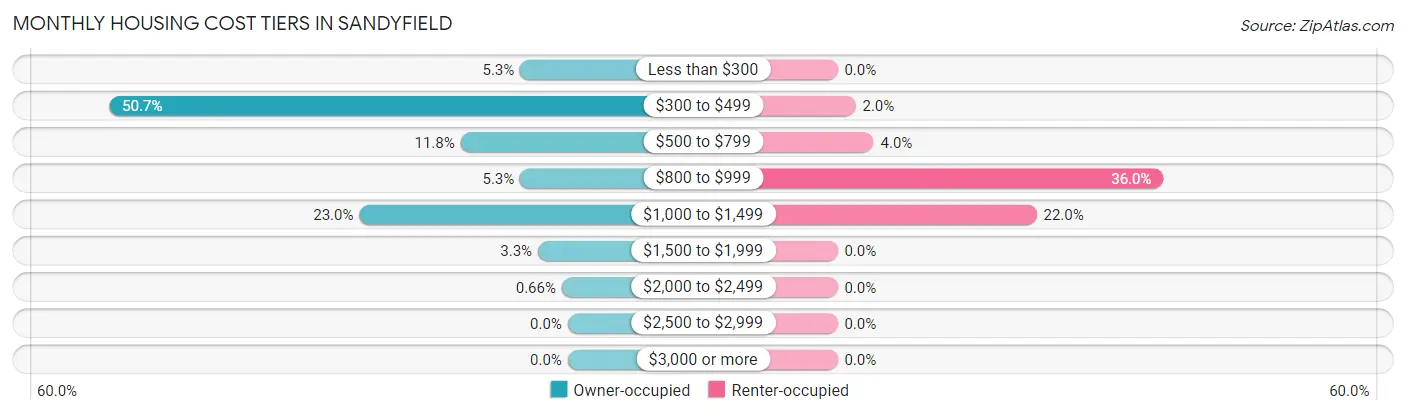
| Monthly Cost | Owner-occupied | Renter-occupied |
| Less than $300 | 8 (5.3%) | 0 (0.0%) |
| $300 to $499 | 77 (50.7%) | 1 (2.0%) |
| $500 to $799 | 18 (11.8%) | 2 (4.0%) |
| $800 to $999 | 8 (5.3%) | 18 (36.0%) |
| $1,000 to $1,499 | 35 (23.0%) | 11 (22.0%) |
| $1,500 to $1,999 | 5 (3.3%) | 0 (0.0%) |
| $2,000 to $2,499 | 1 (0.7%) | 0 (0.0%) |
| $2,500 to $2,999 | 0 (0.0%) | 0 (0.0%) |
| $3,000 or more | 0 (0.0%) | 0 (0.0%) |
| Total | 152 (100.0%) | 50 (100.0%) |
Physical Housing Characteristics in Sandyfield
Housing Structures in Sandyfield
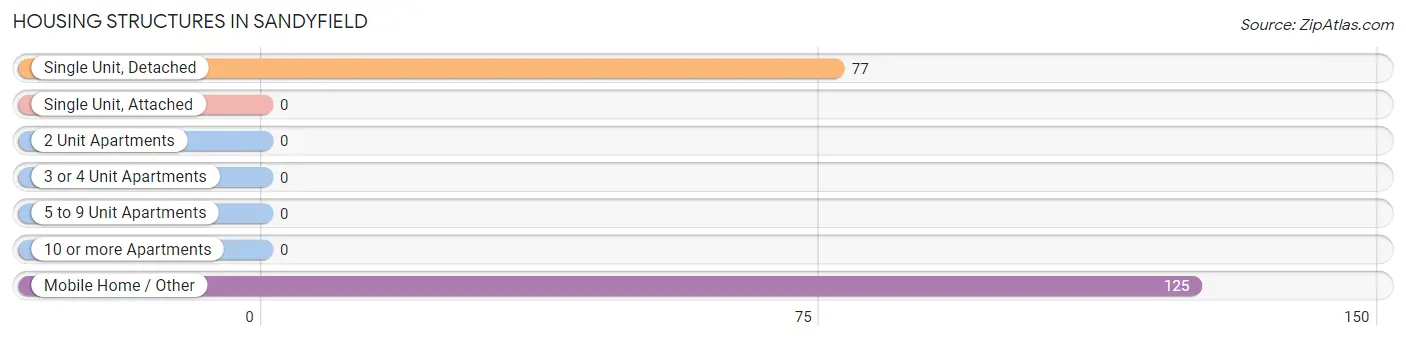
| Structure Type | # Housing Units | % Housing Units |
| Single Unit, Detached | 77 | 38.1% |
| Single Unit, Attached | 0 | 0.0% |
| 2 Unit Apartments | 0 | 0.0% |
| 3 or 4 Unit Apartments | 0 | 0.0% |
| 5 to 9 Unit Apartments | 0 | 0.0% |
| 10 or more Apartments | 0 | 0.0% |
| Mobile Home / Other | 125 | 61.9% |
| Total | 202 | 100.0% |
Housing Structures by Occupancy in Sandyfield
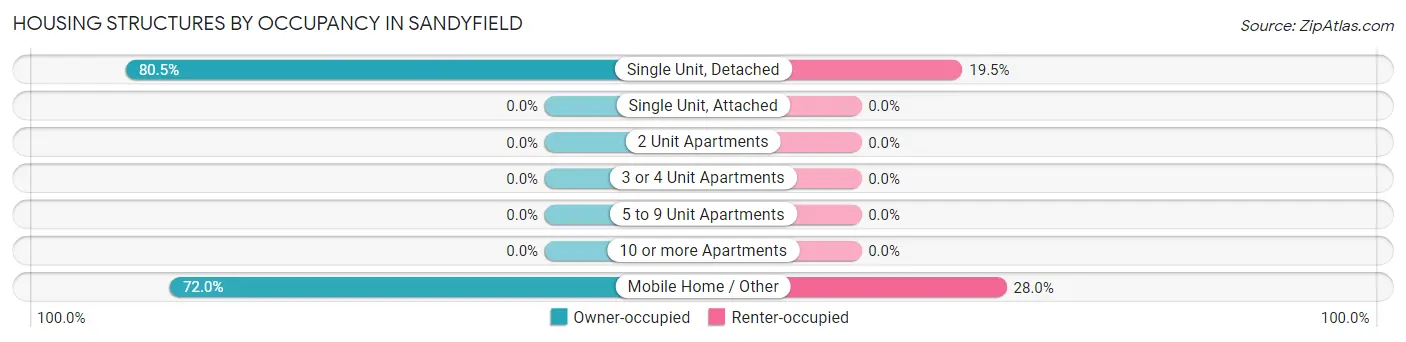
| Structure Type | Owner-occupied | Renter-occupied |
| Single Unit, Detached | 62 (80.5%) | 15 (19.5%) |
| Single Unit, Attached | 0 (0.0%) | 0 (0.0%) |
| 2 Unit Apartments | 0 (0.0%) | 0 (0.0%) |
| 3 or 4 Unit Apartments | 0 (0.0%) | 0 (0.0%) |
| 5 to 9 Unit Apartments | 0 (0.0%) | 0 (0.0%) |
| 10 or more Apartments | 0 (0.0%) | 0 (0.0%) |
| Mobile Home / Other | 90 (72.0%) | 35 (28.0%) |
| Total | 152 (75.2%) | 50 (24.7%) |
Housing Structures by Number of Rooms in Sandyfield
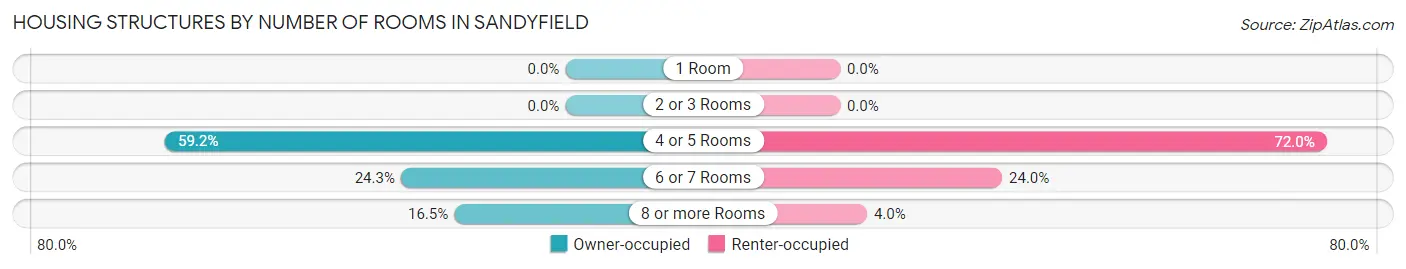
| Number of Rooms | Owner-occupied | Renter-occupied |
| 1 Room | 0 (0.0%) | 0 (0.0%) |
| 2 or 3 Rooms | 0 (0.0%) | 0 (0.0%) |
| 4 or 5 Rooms | 90 (59.2%) | 36 (72.0%) |
| 6 or 7 Rooms | 37 (24.3%) | 12 (24.0%) |
| 8 or more Rooms | 25 (16.5%) | 2 (4.0%) |
| Total | 152 (100.0%) | 50 (100.0%) |
Housing Structure by Heating Type in Sandyfield
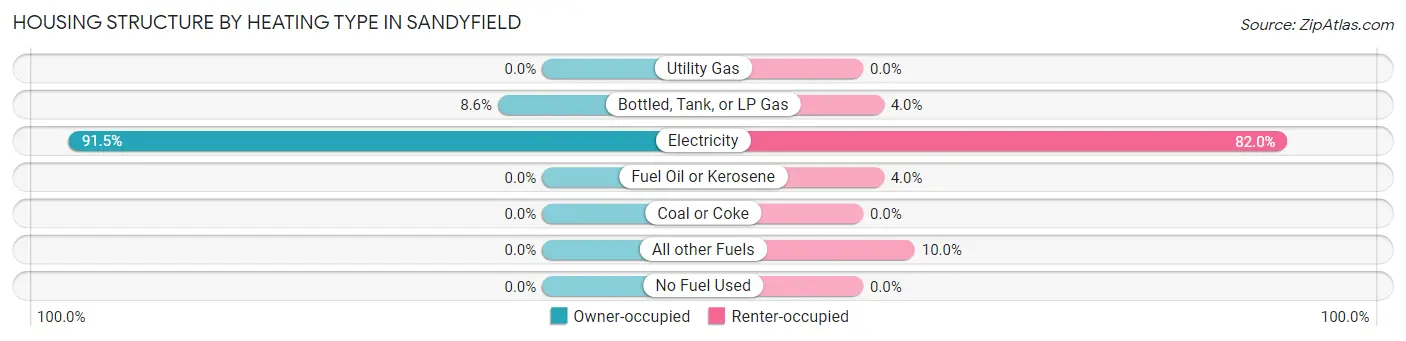
| Heating Type | Owner-occupied | Renter-occupied |
| Utility Gas | 0 (0.0%) | 0 (0.0%) |
| Bottled, Tank, or LP Gas | 13 (8.6%) | 2 (4.0%) |
| Electricity | 139 (91.4%) | 41 (82.0%) |
| Fuel Oil or Kerosene | 0 (0.0%) | 2 (4.0%) |
| Coal or Coke | 0 (0.0%) | 0 (0.0%) |
| All other Fuels | 0 (0.0%) | 5 (10.0%) |
| No Fuel Used | 0 (0.0%) | 0 (0.0%) |
| Total | 152 (100.0%) | 50 (100.0%) |
Household Vehicle Usage in Sandyfield
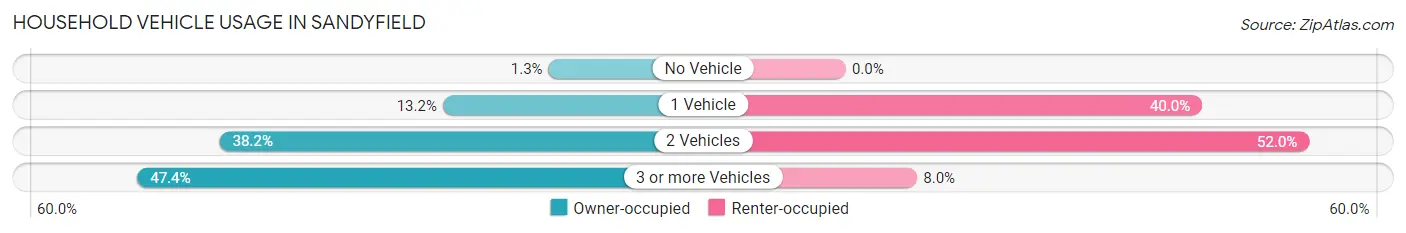
| Vehicles per Household | Owner-occupied | Renter-occupied |
| No Vehicle | 2 (1.3%) | 0 (0.0%) |
| 1 Vehicle | 20 (13.2%) | 20 (40.0%) |
| 2 Vehicles | 58 (38.2%) | 26 (52.0%) |
| 3 or more Vehicles | 72 (47.4%) | 4 (8.0%) |
| Total | 152 (100.0%) | 50 (100.0%) |
Real Estate & Mortgages in Sandyfield
Real Estate and Mortgage Overview in Sandyfield
| Characteristic | Without Mortgage | With Mortgage |
| Housing Units | 92 | 60 |
| Median Property Value | $55,800 | $133,300 |
| Median Household Income | $11,983 | $0 |
| Monthly Housing Costs | $374 | $0 |
| Real Estate Taxes | $898 | $0 |
Property Value by Mortgage Status in Sandyfield
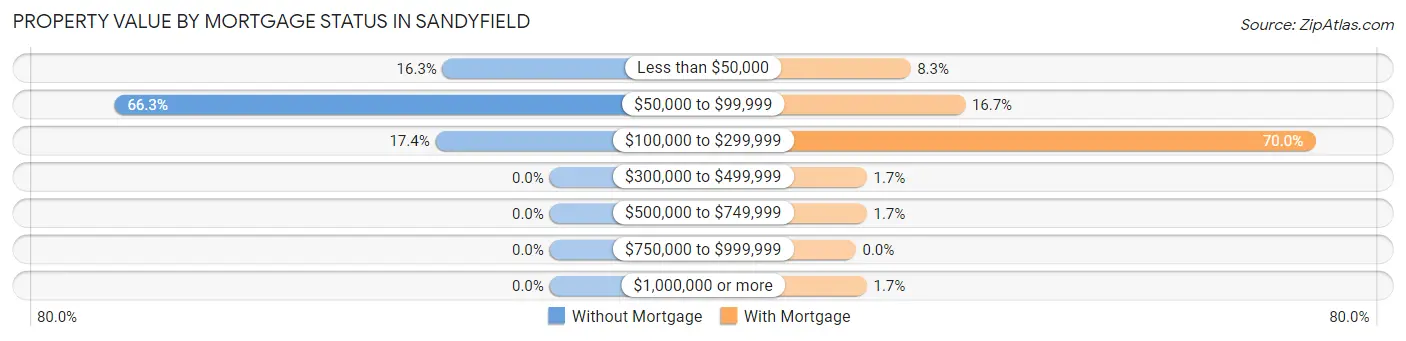
| Property Value | Without Mortgage | With Mortgage |
| Less than $50,000 | 15 (16.3%) | 5 (8.3%) |
| $50,000 to $99,999 | 61 (66.3%) | 10 (16.7%) |
| $100,000 to $299,999 | 16 (17.4%) | 42 (70.0%) |
| $300,000 to $499,999 | 0 (0.0%) | 1 (1.7%) |
| $500,000 to $749,999 | 0 (0.0%) | 1 (1.7%) |
| $750,000 to $999,999 | 0 (0.0%) | 0 (0.0%) |
| $1,000,000 or more | 0 (0.0%) | 1 (1.7%) |
| Total | 92 (100.0%) | 60 (100.0%) |
Household Income by Mortgage Status in Sandyfield
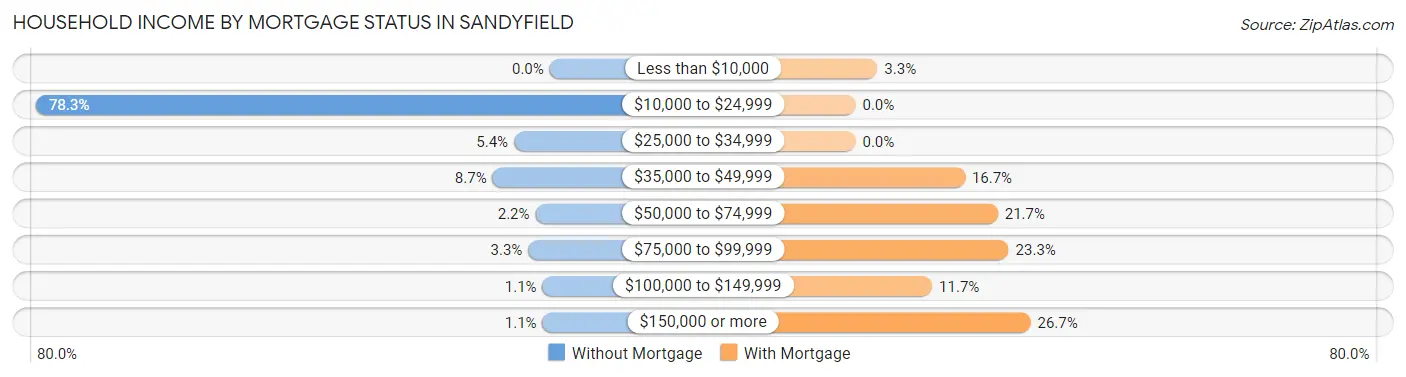
| Household Income | Without Mortgage | With Mortgage |
| Less than $10,000 | 0 (0.0%) | 2 (3.3%) |
| $10,000 to $24,999 | 72 (78.3%) | 0 (0.0%) |
| $25,000 to $34,999 | 5 (5.4%) | 0 (0.0%) |
| $35,000 to $49,999 | 8 (8.7%) | 10 (16.7%) |
| $50,000 to $74,999 | 2 (2.2%) | 13 (21.7%) |
| $75,000 to $99,999 | 3 (3.3%) | 14 (23.3%) |
| $100,000 to $149,999 | 1 (1.1%) | 7 (11.7%) |
| $150,000 or more | 1 (1.1%) | 16 (26.7%) |
| Total | 92 (100.0%) | 60 (100.0%) |
Property Value to Household Income Ratio in Sandyfield
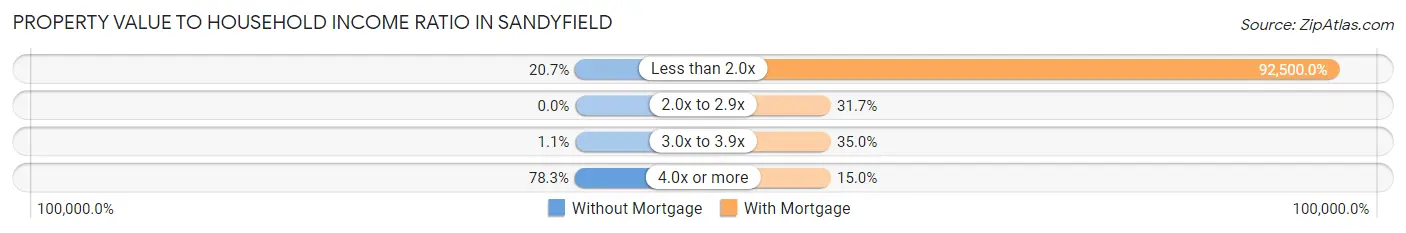
| Value-to-Income Ratio | Without Mortgage | With Mortgage |
| Less than 2.0x | 19 (20.6%) | 55,500 (92,500.0%) |
| 2.0x to 2.9x | 0 (0.0%) | 19 (31.7%) |
| 3.0x to 3.9x | 1 (1.1%) | 21 (35.0%) |
| 4.0x or more | 72 (78.3%) | 9 (15.0%) |
| Total | 92 (100.0%) | 60 (100.0%) |
Real Estate Taxes by Mortgage Status in Sandyfield
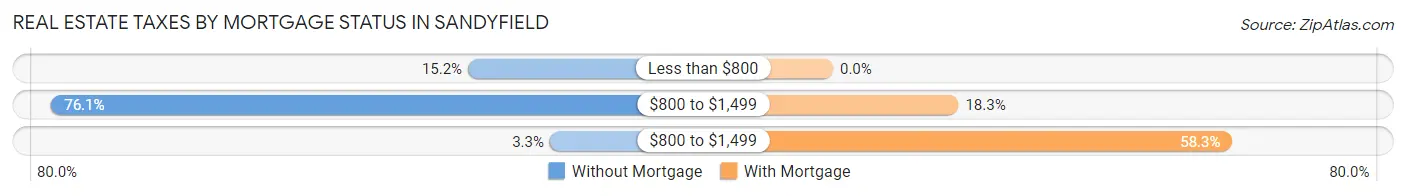
| Property Taxes | Without Mortgage | With Mortgage |
| Less than $800 | 14 (15.2%) | 0 (0.0%) |
| $800 to $1,499 | 70 (76.1%) | 11 (18.3%) |
| $800 to $1,499 | 3 (3.3%) | 35 (58.3%) |
| Total | 92 (100.0%) | 60 (100.0%) |
Health & Disability in Sandyfield
Health Insurance Coverage by Age in Sandyfield
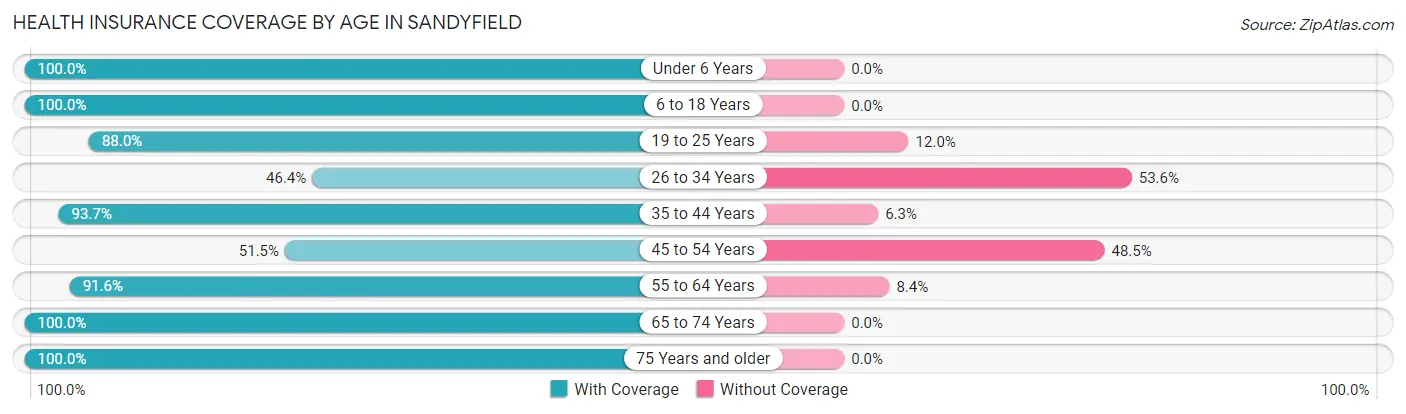
| Age Bracket | With Coverage | Without Coverage |
| Under 6 Years | 35 (100.0%) | 0 (0.0%) |
| 6 to 18 Years | 61 (100.0%) | 0 (0.0%) |
| 19 to 25 Years | 44 (88.0%) | 6 (12.0%) |
| 26 to 34 Years | 32 (46.4%) | 37 (53.6%) |
| 35 to 44 Years | 148 (93.7%) | 10 (6.3%) |
| 45 to 54 Years | 35 (51.5%) | 33 (48.5%) |
| 55 to 64 Years | 87 (91.6%) | 8 (8.4%) |
| 65 to 74 Years | 59 (100.0%) | 0 (0.0%) |
| 75 Years and older | 30 (100.0%) | 0 (0.0%) |
| Total | 531 (85.0%) | 94 (15.0%) |
Health Insurance Coverage by Citizenship Status in Sandyfield
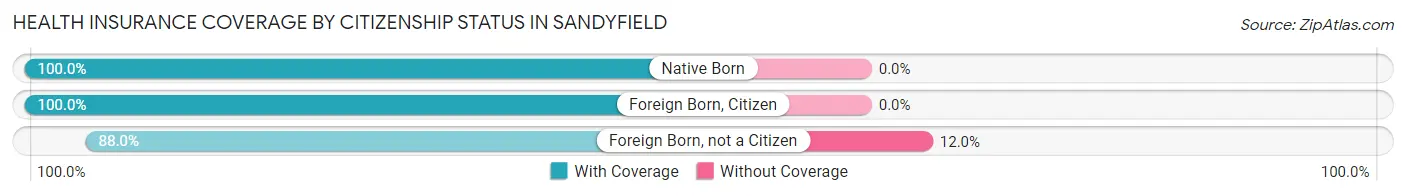
| Citizenship Status | With Coverage | Without Coverage |
| Native Born | 35 (100.0%) | 0 (0.0%) |
| Foreign Born, Citizen | 61 (100.0%) | 0 (0.0%) |
| Foreign Born, not a Citizen | 44 (88.0%) | 6 (12.0%) |
Health Insurance Coverage by Household Income in Sandyfield
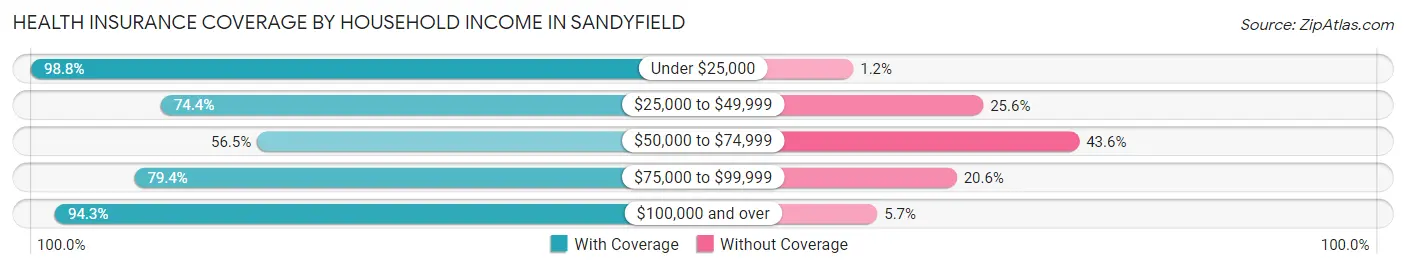
| Household Income | With Coverage | Without Coverage |
| Under $25,000 | 242 (98.8%) | 3 (1.2%) |
| $25,000 to $49,999 | 134 (74.4%) | 46 (25.6%) |
| $50,000 to $74,999 | 35 (56.5%) | 27 (43.5%) |
| $75,000 to $99,999 | 54 (79.4%) | 14 (20.6%) |
| $100,000 and over | 66 (94.3%) | 4 (5.7%) |
Public vs Private Health Insurance Coverage by Age in Sandyfield
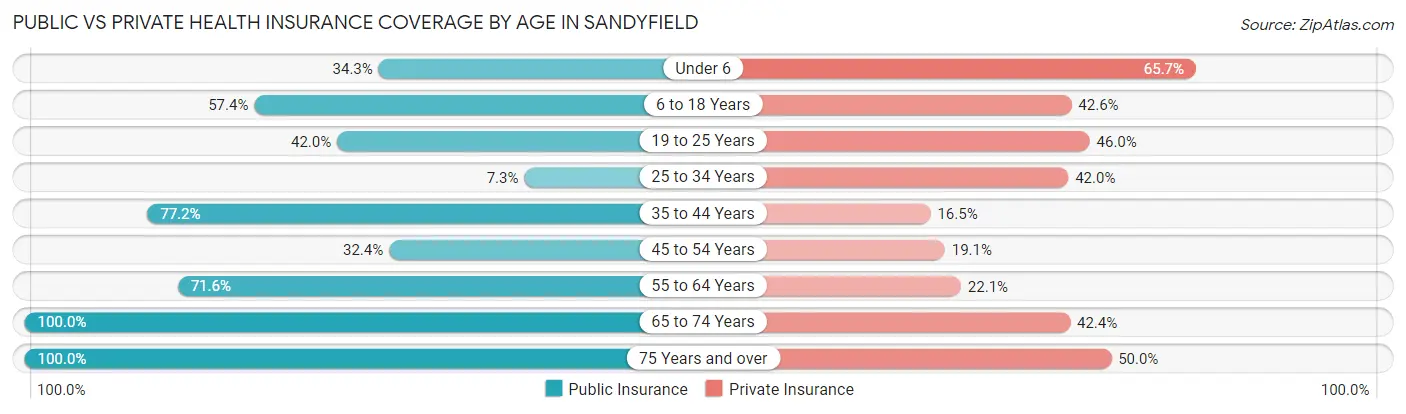
| Age Bracket | Public Insurance | Private Insurance |
| Under 6 | 12 (34.3%) | 23 (65.7%) |
| 6 to 18 Years | 35 (57.4%) | 26 (42.6%) |
| 19 to 25 Years | 21 (42.0%) | 23 (46.0%) |
| 25 to 34 Years | 5 (7.2%) | 29 (42.0%) |
| 35 to 44 Years | 122 (77.2%) | 26 (16.5%) |
| 45 to 54 Years | 22 (32.4%) | 13 (19.1%) |
| 55 to 64 Years | 68 (71.6%) | 21 (22.1%) |
| 65 to 74 Years | 59 (100.0%) | 25 (42.4%) |
| 75 Years and over | 30 (100.0%) | 15 (50.0%) |
| Total | 374 (59.8%) | 201 (32.2%) |
Disability Status by Sex by Age in Sandyfield
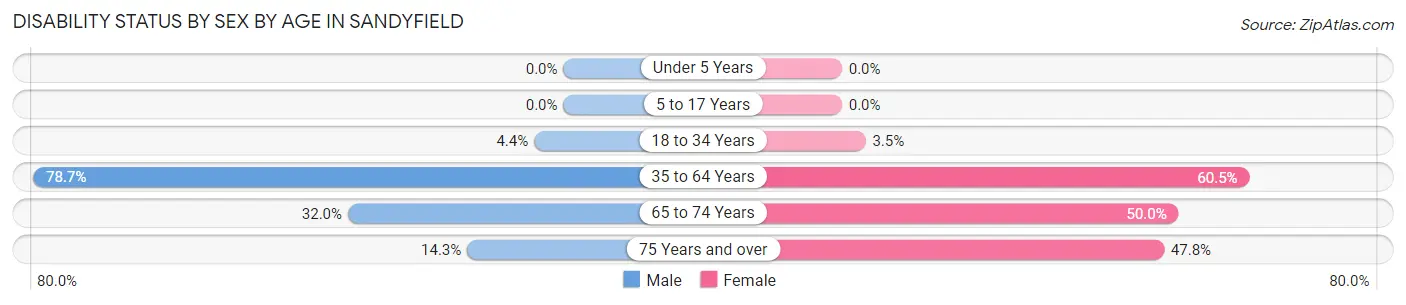
| Age Bracket | Male | Female |
| Under 5 Years | 0 (0.0%) | 0 (0.0%) |
| 5 to 17 Years | 0 (0.0%) | 0 (0.0%) |
| 18 to 34 Years | 3 (4.3%) | 2 (3.5%) |
| 35 to 64 Years | 163 (78.7%) | 69 (60.5%) |
| 65 to 74 Years | 8 (32.0%) | 17 (50.0%) |
| 75 Years and over | 1 (14.3%) | 11 (47.8%) |
Disability Class by Sex by Age in Sandyfield
Disability Class: Hearing Difficulty
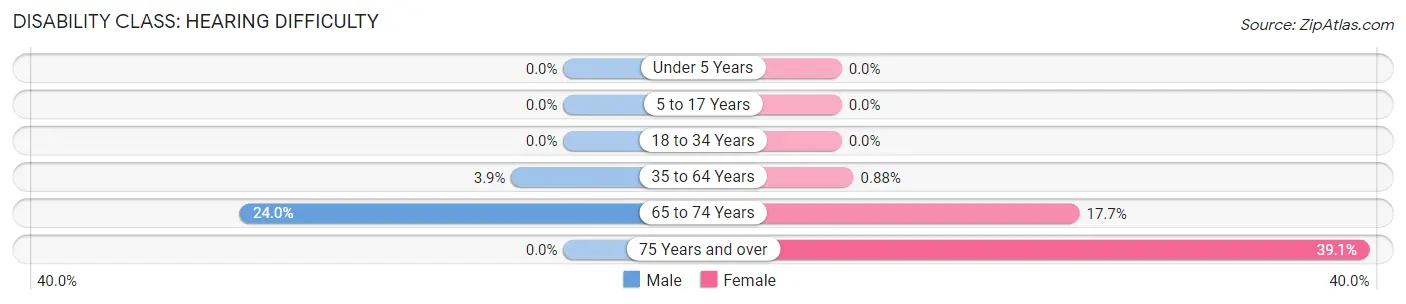
| Age Bracket | Male | Female |
| Under 5 Years | 0 (0.0%) | 0 (0.0%) |
| 5 to 17 Years | 0 (0.0%) | 0 (0.0%) |
| 18 to 34 Years | 0 (0.0%) | 0 (0.0%) |
| 35 to 64 Years | 8 (3.9%) | 1 (0.9%) |
| 65 to 74 Years | 6 (24.0%) | 6 (17.6%) |
| 75 Years and over | 0 (0.0%) | 9 (39.1%) |
Disability Class: Vision Difficulty
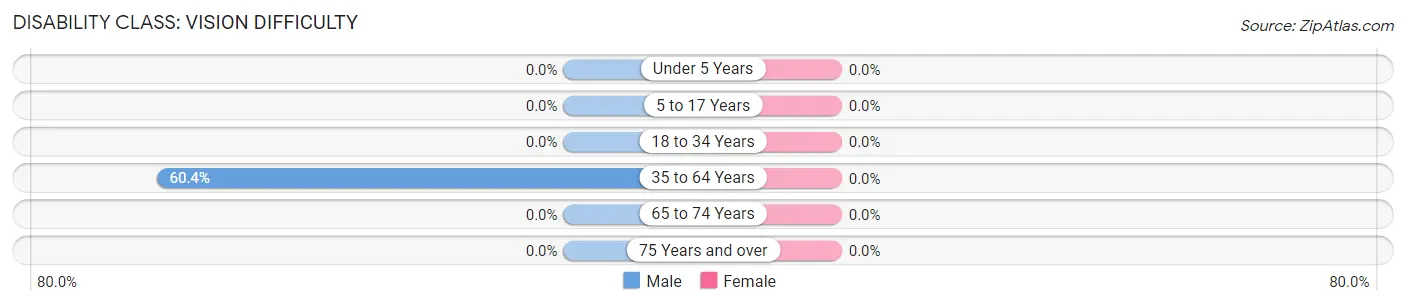
| Age Bracket | Male | Female |
| Under 5 Years | 0 (0.0%) | 0 (0.0%) |
| 5 to 17 Years | 0 (0.0%) | 0 (0.0%) |
| 18 to 34 Years | 0 (0.0%) | 0 (0.0%) |
| 35 to 64 Years | 125 (60.4%) | 0 (0.0%) |
| 65 to 74 Years | 0 (0.0%) | 0 (0.0%) |
| 75 Years and over | 0 (0.0%) | 0 (0.0%) |
Disability Class: Cognitive Difficulty
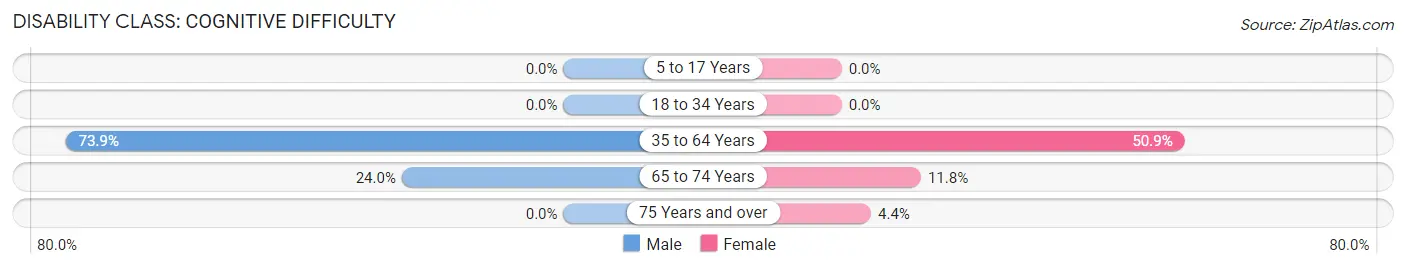
| Age Bracket | Male | Female |
| 5 to 17 Years | 0 (0.0%) | 0 (0.0%) |
| 18 to 34 Years | 0 (0.0%) | 0 (0.0%) |
| 35 to 64 Years | 153 (73.9%) | 58 (50.9%) |
| 65 to 74 Years | 6 (24.0%) | 4 (11.8%) |
| 75 Years and over | 0 (0.0%) | 1 (4.3%) |
Disability Class: Ambulatory Difficulty
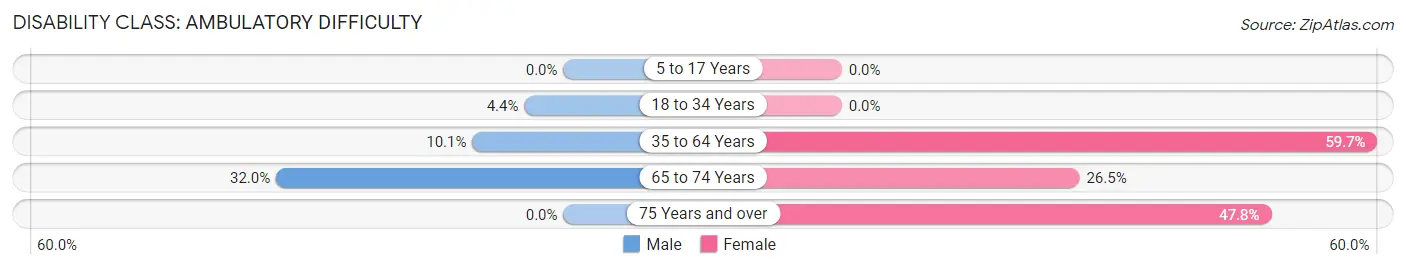
| Age Bracket | Male | Female |
| 5 to 17 Years | 0 (0.0%) | 0 (0.0%) |
| 18 to 34 Years | 3 (4.3%) | 0 (0.0%) |
| 35 to 64 Years | 21 (10.1%) | 68 (59.7%) |
| 65 to 74 Years | 8 (32.0%) | 9 (26.5%) |
| 75 Years and over | 0 (0.0%) | 11 (47.8%) |
Disability Class: Self-Care Difficulty
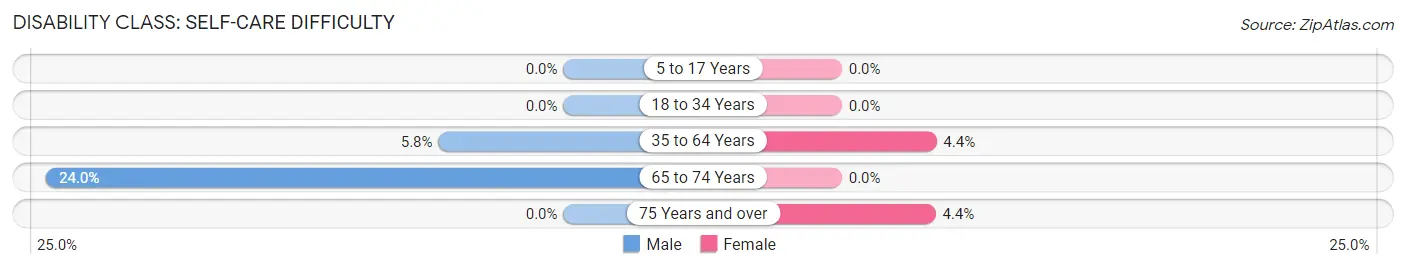
| Age Bracket | Male | Female |
| 5 to 17 Years | 0 (0.0%) | 0 (0.0%) |
| 18 to 34 Years | 0 (0.0%) | 0 (0.0%) |
| 35 to 64 Years | 12 (5.8%) | 5 (4.4%) |
| 65 to 74 Years | 6 (24.0%) | 0 (0.0%) |
| 75 Years and over | 0 (0.0%) | 1 (4.3%) |
Technology Access in Sandyfield
Computing Device Access in Sandyfield
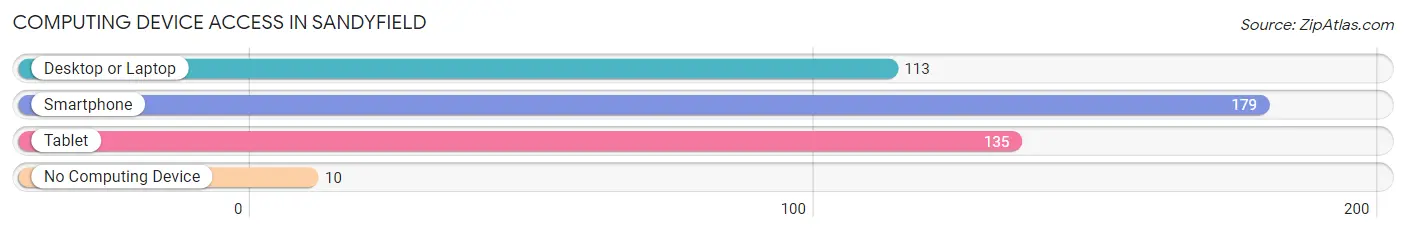
| Device Type | # Households | % Households |
| Desktop or Laptop | 113 | 55.9% |
| Smartphone | 179 | 88.6% |
| Tablet | 135 | 66.8% |
| No Computing Device | 10 | 5.0% |
| Total | 202 | 100.0% |
Internet Access in Sandyfield
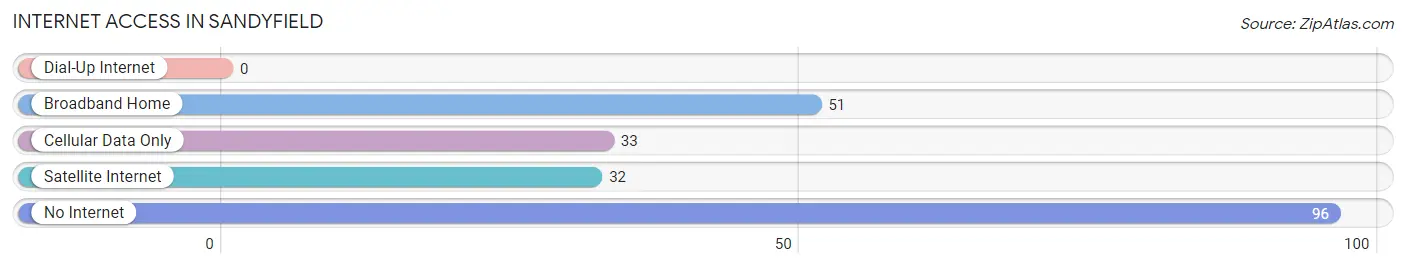
| Internet Type | # Households | % Households |
| Dial-Up Internet | 0 | 0.0% |
| Broadband Home | 51 | 25.3% |
| Cellular Data Only | 33 | 16.3% |
| Satellite Internet | 32 | 15.8% |
| No Internet | 96 | 47.5% |
| Total | 202 | 100.0% |
Sandyfield Summary
Sandyfield is a small unincorporated community located in the northeastern corner of North Carolina, in the United States. It is situated in the county of Onslow, and is part of the Jacksonville Metropolitan Statistical Area. Sandyfield is located on the banks of the New River, and is surrounded by the Croatan National Forest.
History
Sandyfield was first settled in the late 1700s by a group of settlers from Scotland. The settlers were attracted to the area due to its abundance of natural resources, including timber, fish, and game. The settlers established a small farming community, and the area quickly grew in population.
In the early 1800s, the area was home to a number of small sawmills and gristmills, which provided the community with much of its economic activity. The area was also home to a number of small stores, which provided the community with basic necessities.
In the late 1800s, the area was home to a number of small farms, which provided the community with much of its food. The area was also home to a number of small businesses, including a general store, a blacksmith, and a post office.
In the early 1900s, the area was home to a number of small businesses, including a sawmill, a gristmill, and a general store. The area was also home to a number of small farms, which provided the community with much of its food.
In the mid-1900s, the area was home to a number of small businesses, including a sawmill, a gristmill, and a general store. The area was also home to a number of small farms, which provided the community with much of its food.
In the late 1900s, the area was home to a number of small businesses, including a sawmill, a gristmill, and a general store. The area was also home to a number of small farms, which provided the community with much of its food.
Geography
Sandyfield is located in the northeastern corner of North Carolina, in the United States. It is situated in the county of Onslow, and is part of the Jacksonville Metropolitan Statistical Area. Sandyfield is located on the banks of the New River, and is surrounded by the Croatan National Forest.
The area is characterized by rolling hills, dense forests, and numerous creeks and streams. The area is home to a variety of wildlife, including deer, turkey, and a variety of birds.
Economy
The economy of Sandyfield is largely based on agriculture and forestry. The area is home to a number of small farms, which provide the community with much of its food. The area is also home to a number of small businesses, including a sawmill, a gristmill, and a general store.
The area is also home to a number of small businesses, including a sawmill, a gristmill, and a general store. The area is also home to a number of small businesses, including a sawmill, a gristmill, and a general store.
Demographics
As of the 2010 census, the population of Sandyfield was 1,845. The population is largely white (94.3%), with a small percentage of African Americans (3.2%) and Hispanics (2.5%). The median household income is $37,917, and the median age is 38.7 years. The area is largely rural, with a population density of just 28.3 people per square mile.
Common Questions
What is the Total Population of Sandyfield?
Total Population of Sandyfield is 625.
What is the Total Male Population of Sandyfield?
Total Male Population of Sandyfield is 359.
What is the Total Female Population of Sandyfield?
Total Female Population of Sandyfield is 266.
What is the Ratio of Males per 100 Females in Sandyfield?
There are 134.96 Males per 100 Females in Sandyfield.
What is the Ratio of Females per 100 Males in Sandyfield?
There are 74.09 Females per 100 Males in Sandyfield.
What is the Median Population Age in Sandyfield?
Median Population Age in Sandyfield is 36.7 Years.
What is the Average Family Size in Sandyfield
Average Family Size in Sandyfield is 3.4 People.
What is the Average Household Size in Sandyfield
Average Household Size in Sandyfield is 3.1 People.
What is Per Capita Income in Sandyfield?
Per Capita income in Sandyfield is $14,859.
What is the Median Household income in Sandyfield?
Median Household Income in Sandyfield is $29,722.
What is Income or Wage Gap in Sandyfield?
Income or Wage Gap in Sandyfield is 9.6%.
Women in Sandyfield earn 90.4 cents for every dollar earned by a man.
What is Inequality or Gini Index in Sandyfield?
Inequality or Gini Index in Sandyfield is 0.45.
How Large is the Labor Force in Sandyfield?
There are 154 People in the Labor Forcein in Sandyfield.
What is the Percentage of People in the Labor Force in Sandyfield?
28.5% of People are in the Labor Force in Sandyfield.
What is the Unemployment Rate in Sandyfield?
Unemployment Rate in Sandyfield is 5.2%.