Powellsville, NC
Powellsville Map
Powellsville Overview
161
TOTAL POPULATION
91
MALE POPULATION
70
FEMALE POPULATION
130.00
MALES / 100 FEMALES
76.92
FEMALES / 100 MALES
71.3
MEDIAN AGE
2.2
AVG FAMILY SIZE
1.8
AVG HOUSEHOLD SIZE
$25,403
PER CAPITA INCOME
$50,772
AVG FAMILY INCOME
$42,188
AVG HOUSEHOLD INCOME
0.13
INEQUALITY / GINI INDEX
20
LABOR FORCE [ PEOPLE ]
12.8%
PERCENT IN LABOR FORCE
Powellsville Zip Codes
Powellsville Area Codes
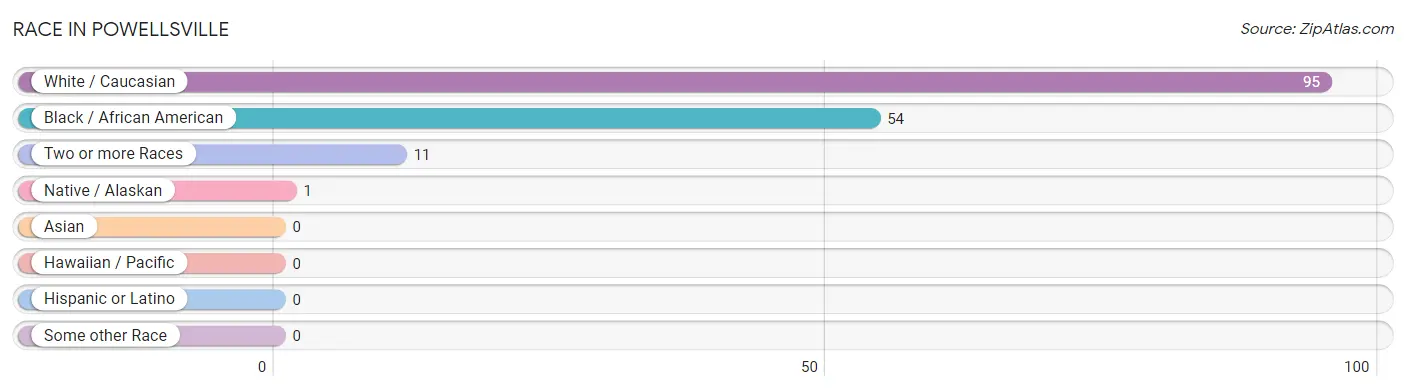
Race in Powellsville
The most populous races in Powellsville are White / Caucasian (95 | 59.0%), Black / African American (54 | 33.5%), and Two or more Races (11 | 6.8%).
| Race | # Population | % Population |
| Asian | 0 | 0.0% |
| Black / African American | 54 | 33.5% |
| Hawaiian / Pacific | 0 | 0.0% |
| Hispanic or Latino | 0 | 0.0% |
| Native / Alaskan | 1 | 0.6% |
| White / Caucasian | 95 | 59.0% |
| Two or more Races | 11 | 6.8% |
| Some other Race | 0 | 0.0% |
| Total | 161 | 100.0% |
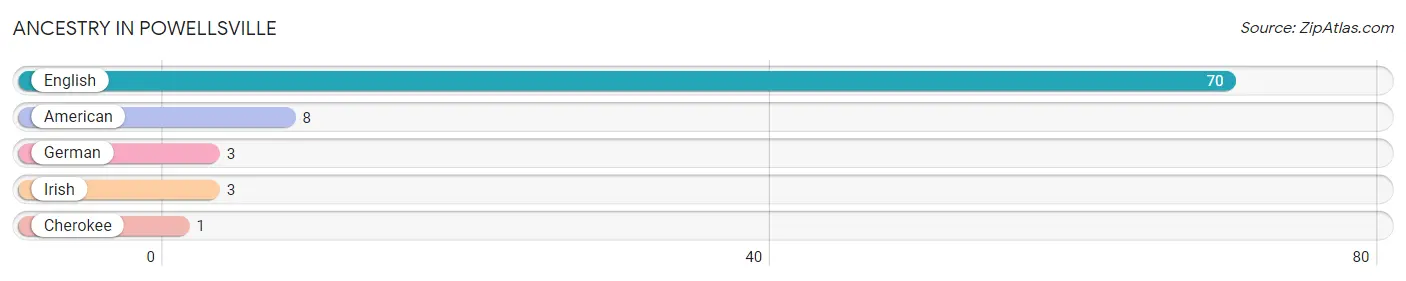
Ancestry in Powellsville
The most populous ancestries reported in Powellsville are English (70 | 43.5%), American (8 | 5.0%), German (3 | 1.9%), Irish (3 | 1.9%), and Cherokee (1 | 0.6%), together accounting for 52.8% of all Powellsville residents.
| Ancestry | # Population | % Population |
| American | 8 | 5.0% |
| Cherokee | 1 | 0.6% |
| English | 70 | 43.5% |
| German | 3 | 1.9% |
| Irish | 3 | 1.9% | View All 5 Rows |
Immigrants in Powellsville

| Immigration Origin | # Population | % Population | View All 0 Rows |
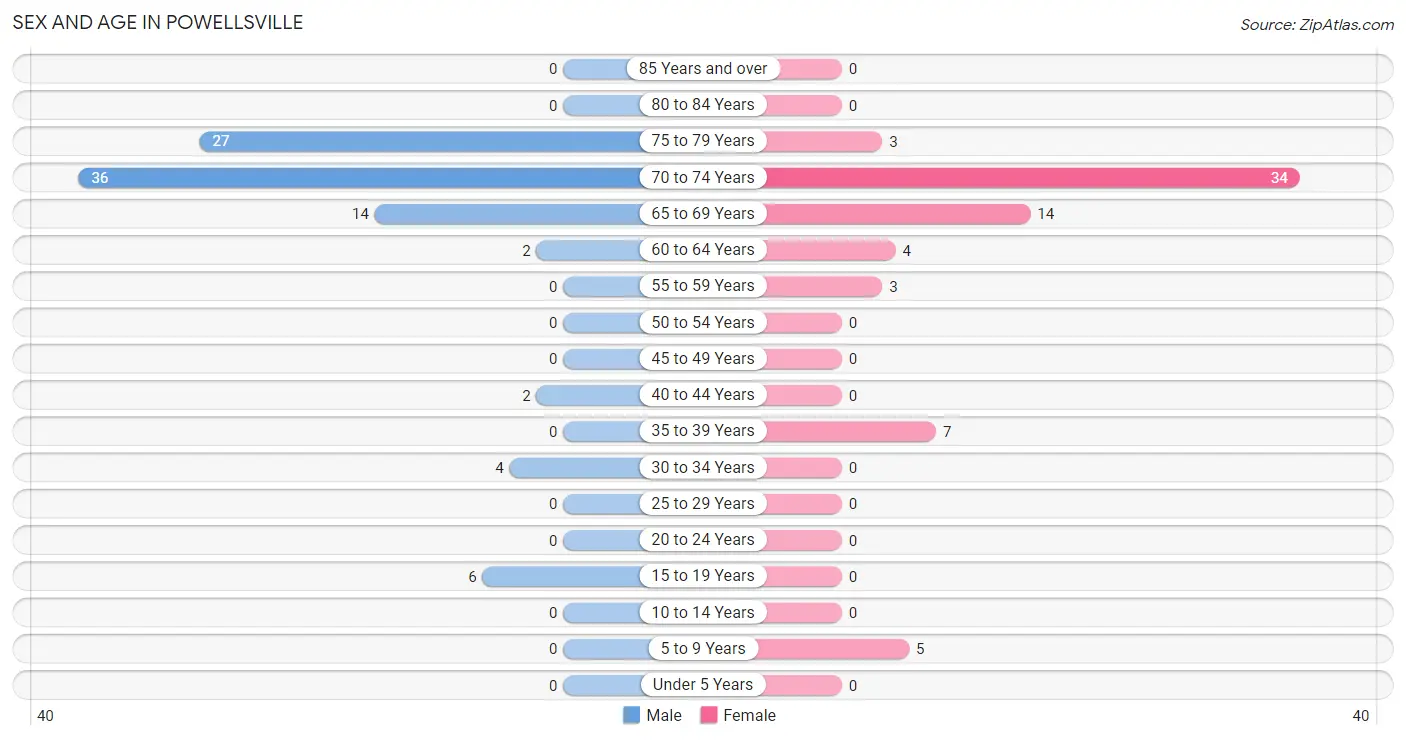
Sex and Age in Powellsville
Sex and Age in Powellsville
The most populous age groups in Powellsville are 70 to 74 Years (36 | 39.6%) for men and 70 to 74 Years (34 | 48.6%) for women.
| Age Bracket | Male | Female |
| Under 5 Years | 0 (0.0%) | 0 (0.0%) |
| 5 to 9 Years | 0 (0.0%) | 5 (7.1%) |
| 10 to 14 Years | 0 (0.0%) | 0 (0.0%) |
| 15 to 19 Years | 6 (6.6%) | 0 (0.0%) |
| 20 to 24 Years | 0 (0.0%) | 0 (0.0%) |
| 25 to 29 Years | 0 (0.0%) | 0 (0.0%) |
| 30 to 34 Years | 4 (4.4%) | 0 (0.0%) |
| 35 to 39 Years | 0 (0.0%) | 7 (10.0%) |
| 40 to 44 Years | 2 (2.2%) | 0 (0.0%) |
| 45 to 49 Years | 0 (0.0%) | 0 (0.0%) |
| 50 to 54 Years | 0 (0.0%) | 0 (0.0%) |
| 55 to 59 Years | 0 (0.0%) | 3 (4.3%) |
| 60 to 64 Years | 2 (2.2%) | 4 (5.7%) |
| 65 to 69 Years | 14 (15.4%) | 14 (20.0%) |
| 70 to 74 Years | 36 (39.6%) | 34 (48.6%) |
| 75 to 79 Years | 27 (29.7%) | 3 (4.3%) |
| 80 to 84 Years | 0 (0.0%) | 0 (0.0%) |
| 85 Years and over | 0 (0.0%) | 0 (0.0%) |
| Total | 91 (100.0%) | 70 (100.0%) |
Families and Households in Powellsville
Median Family Size in Powellsville
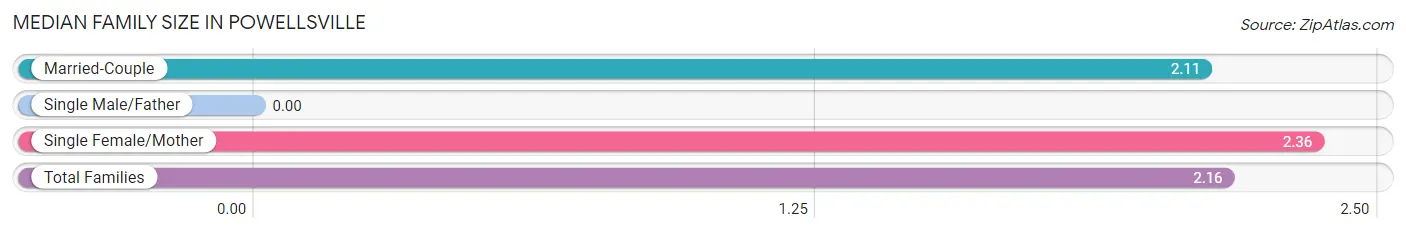
| Family Type | # Families | Family Size |
| Married-Couple | 44 (80.0%) | 2.11 |
| Single Male/Father | 0 (0.0%) | - |
| Single Female/Mother | 11 (20.0%) | 2.36 |
| Total Families | 55 (100.0%) | 2.16 |
Median Household Size in Powellsville
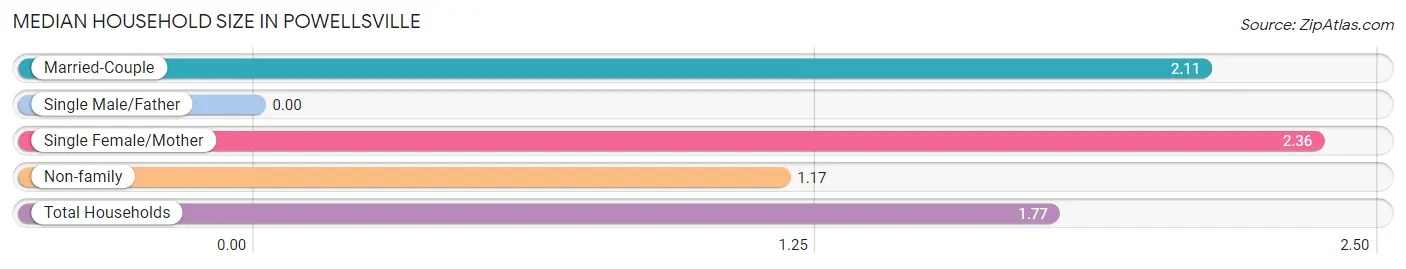
| Household Type | # Households | Household Size |
| Married-Couple | 44 (48.3%) | 2.11 |
| Single Male/Father | 0 (0.0%) | - |
| Single Female/Mother | 11 (12.1%) | 2.36 |
| Non-family | 36 (39.6%) | 1.17 |
| Total Households | 91 (100.0%) | 1.77 |
Household Size by Marriage Status in Powellsville
Out of a total of 91 households in Powellsville, 55 (60.4%) are family households, while 36 (39.6%) are nonfamily households. The most numerous type of family households are 2-person households, comprising 45, and the most common type of nonfamily households are 1-person households, comprising 31.
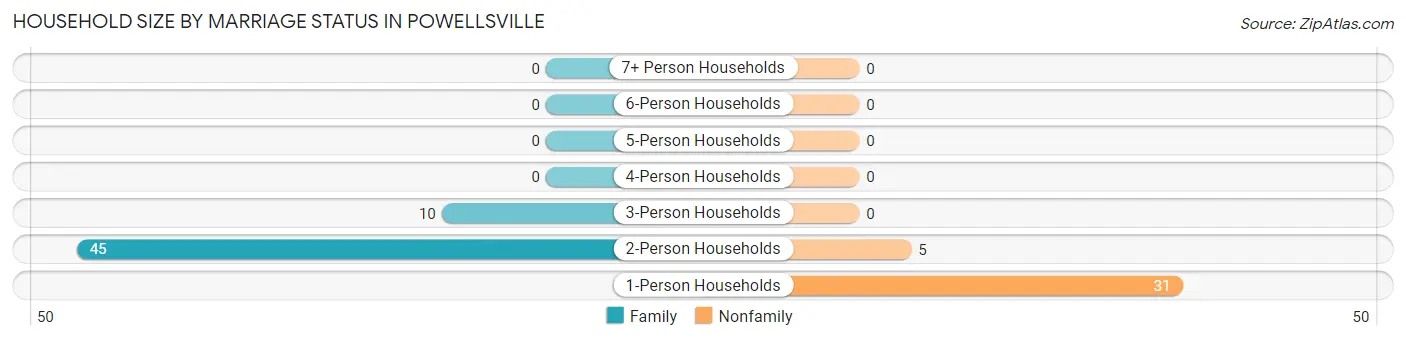
| Household Size | Family Households | Nonfamily Households |
| 1-Person Households | - | 31 (34.1%) |
| 2-Person Households | 45 (49.4%) | 5 (5.5%) |
| 3-Person Households | 10 (11.0%) | 0 (0.0%) |
| 4-Person Households | 0 (0.0%) | 0 (0.0%) |
| 5-Person Households | 0 (0.0%) | 0 (0.0%) |
| 6-Person Households | 0 (0.0%) | 0 (0.0%) |
| 7+ Person Households | 0 (0.0%) | 0 (0.0%) |
| Total | 55 (60.4%) | 36 (39.6%) |
Female Fertility in Powellsville
Fertility by Age in Powellsville
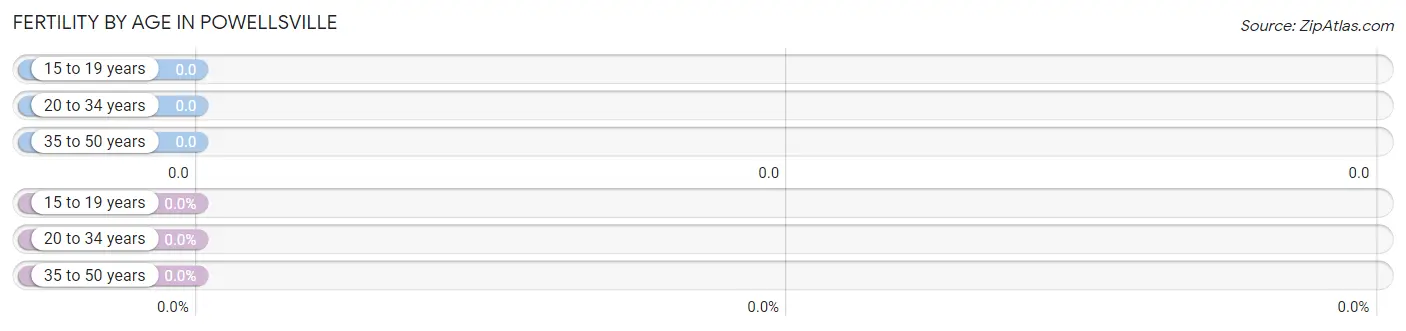
| Age Bracket | Women with Births | Births / 1,000 Women |
| 15 to 19 years | 0 (0.0%) | 0.0 |
| 20 to 34 years | 0 (0.0%) | 0.0 |
| 35 to 50 years | 0 (0.0%) | 0.0 |
| Total | 0 (0.0%) | 0.0 |
Fertility by Age by Marriage Status in Powellsville
| Age Bracket | Married | Unmarried |
| 15 to 19 years | 0 (0.0%) | 0 (0.0%) |
| 20 to 34 years | 0 (0.0%) | 0 (0.0%) |
| 35 to 50 years | 0 (0.0%) | 0 (0.0%) |
| Total | 0 (0.0%) | 0 (0.0%) |
Fertility by Education in Powellsville
| Educational Attainment | Women with Births | Births / 1,000 Women |
| Less than High School | 0 (0.0%) | 0.0 |
| High School Diploma | 0 (0.0%) | 0.0 |
| College or Associate's Degree | 0 (0.0%) | 0.0 |
| Bachelor's Degree | 0 (0.0%) | 0.0 |
| Graduate Degree | 0 (0.0%) | 0.0 |
| Total | 0 (0.0%) | 0.0 |
Fertility by Education by Marriage Status in Powellsville
| Educational Attainment | Married | Unmarried |
| Less than High School | 0 (0.0%) | 0 (0.0%) |
| High School Diploma | 0 (0.0%) | 0 (0.0%) |
| College or Associate's Degree | 0 (0.0%) | 0 (0.0%) |
| Bachelor's Degree | 0 (0.0%) | 0 (0.0%) |
| Graduate Degree | 0 (0.0%) | 0 (0.0%) |
| Total | 0 (0.0%) | 0 (0.0%) |
Income in Powellsville
Income Overview in Powellsville
Per Capita Income in Powellsville is $25,403, while median incomes of families and households are $50,772 and $42,188 respectively.
| Characteristic | Number | Measure |
| Per Capita Income | 161 | $25,403 |
| Median Family Income | 55 | $50,772 |
| Mean Family Income | 55 | $50,627 |
| Median Household Income | 91 | $42,188 |
| Mean Household Income | 91 | $43,985 |
| Income Deficit | 55 | $0 |
| Wage / Income Gap (%) | 161 | 0.00% |
| Wage / Income Gap ($) | 161 | 100.00¢ per $1 |
| Gini / Inequality Index | 161 | 0.13 |
Earnings by Sex in Powellsville
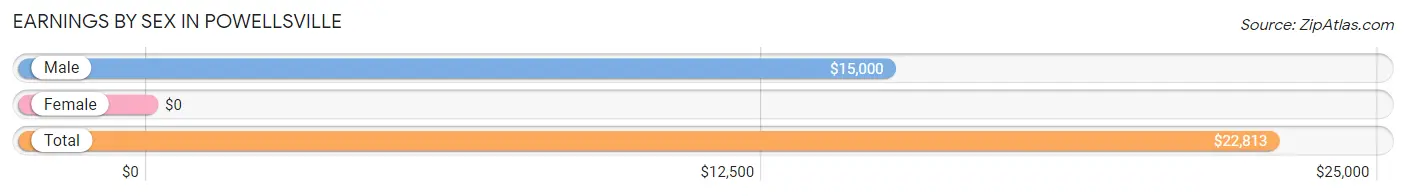
| Sex | Number | Average Earnings |
| Male | 18 (62.1%) | $15,000 |
| Female | 11 (37.9%) | $0 |
| Total | 29 (100.0%) | $22,813 |
Earnings by Sex by Income Bracket in Powellsville
The most common earnings brackets in Powellsville are $2,500 to $4,999 for men (6 | 33.3%) and $35,000 to $39,999 for women (7 | 63.6%).
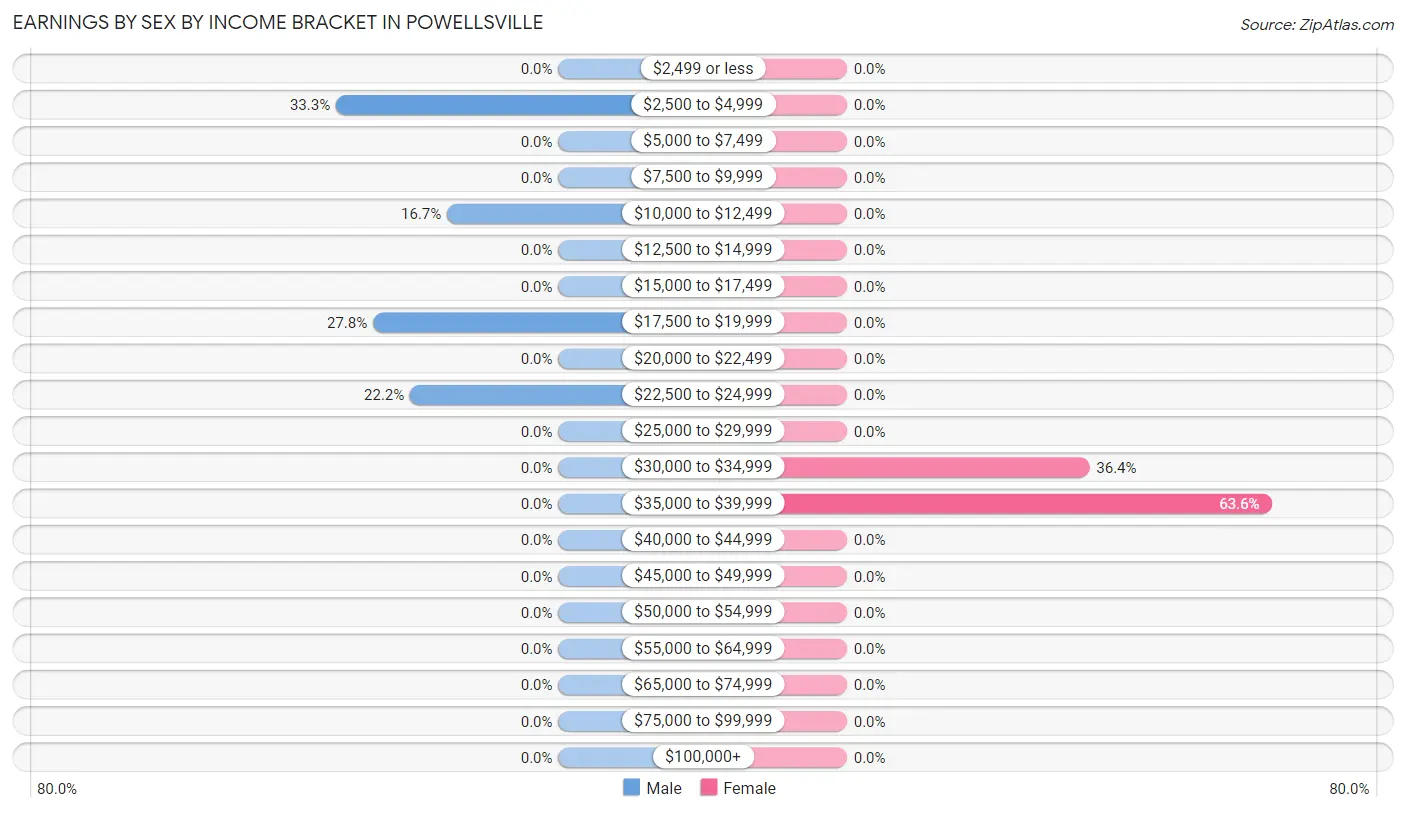
| Income | Male | Female |
| $2,499 or less | 0 (0.0%) | 0 (0.0%) |
| $2,500 to $4,999 | 6 (33.3%) | 0 (0.0%) |
| $5,000 to $7,499 | 0 (0.0%) | 0 (0.0%) |
| $7,500 to $9,999 | 0 (0.0%) | 0 (0.0%) |
| $10,000 to $12,499 | 3 (16.7%) | 0 (0.0%) |
| $12,500 to $14,999 | 0 (0.0%) | 0 (0.0%) |
| $15,000 to $17,499 | 0 (0.0%) | 0 (0.0%) |
| $17,500 to $19,999 | 5 (27.8%) | 0 (0.0%) |
| $20,000 to $22,499 | 0 (0.0%) | 0 (0.0%) |
| $22,500 to $24,999 | 4 (22.2%) | 0 (0.0%) |
| $25,000 to $29,999 | 0 (0.0%) | 0 (0.0%) |
| $30,000 to $34,999 | 0 (0.0%) | 4 (36.4%) |
| $35,000 to $39,999 | 0 (0.0%) | 7 (63.6%) |
| $40,000 to $44,999 | 0 (0.0%) | 0 (0.0%) |
| $45,000 to $49,999 | 0 (0.0%) | 0 (0.0%) |
| $50,000 to $54,999 | 0 (0.0%) | 0 (0.0%) |
| $55,000 to $64,999 | 0 (0.0%) | 0 (0.0%) |
| $65,000 to $74,999 | 0 (0.0%) | 0 (0.0%) |
| $75,000 to $99,999 | 0 (0.0%) | 0 (0.0%) |
| $100,000+ | 0 (0.0%) | 0 (0.0%) |
| Total | 18 (100.0%) | 11 (100.0%) |
Earnings by Sex by Educational Attainment in Powellsville
| Educational Attainment | Male Income | Female Income |
| Less than High School | - | - |
| High School Diploma | - | - |
| College or Associate's Degree | - | - |
| Bachelor's Degree | - | - |
| Graduate Degree | - | - |
| Total | $19,000 | $0 |
Family Income in Powellsville
Family Income Brackets in Powellsville
According to the Powellsville family income data, there are 34 families falling into the $50,000 to $74,999 income range, which is the most common income bracket and makes up 61.8% of all families.
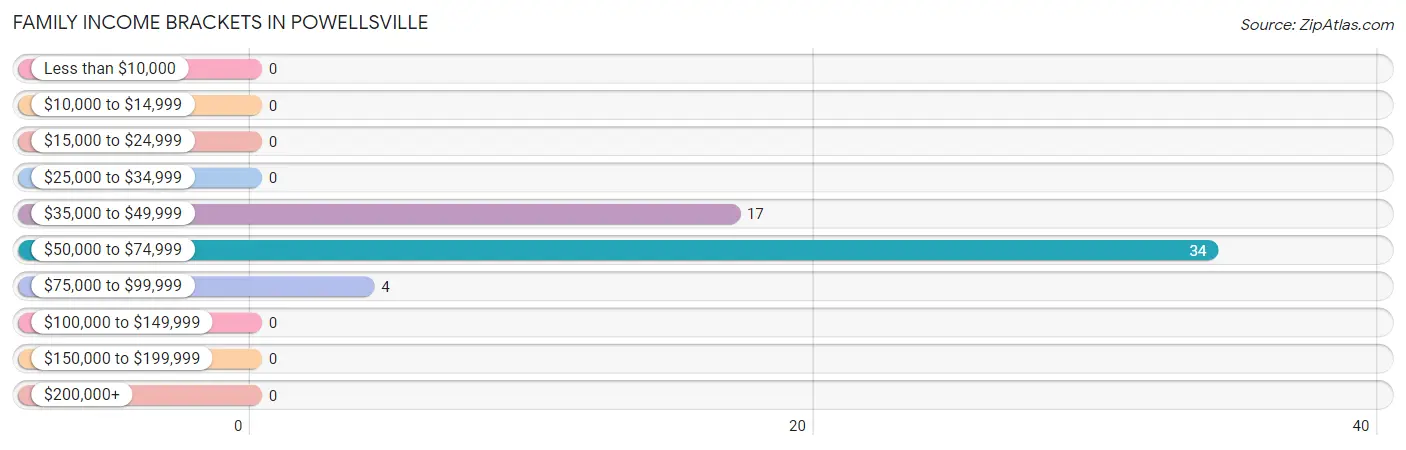
| Income Bracket | # Families | % Families |
| Less than $10,000 | 0 | 0.0% |
| $10,000 to $14,999 | 0 | 0.0% |
| $15,000 to $24,999 | 0 | 0.0% |
| $25,000 to $34,999 | 0 | 0.0% |
| $35,000 to $49,999 | 17 | 30.9% |
| $50,000 to $74,999 | 34 | 61.8% |
| $75,000 to $99,999 | 4 | 7.3% |
| $100,000 to $149,999 | 0 | 0.0% |
| $150,000 to $199,999 | 0 | 0.0% |
| $200,000+ | 0 | 0.0% |
Family Income by Famaliy Size in Powellsville
2-person families (45 | 81.8%) account for the highest median family income in Powellsville with $51,140 per family, while 2-person families (45 | 81.8%) have the highest median income of $25,570 per family member.
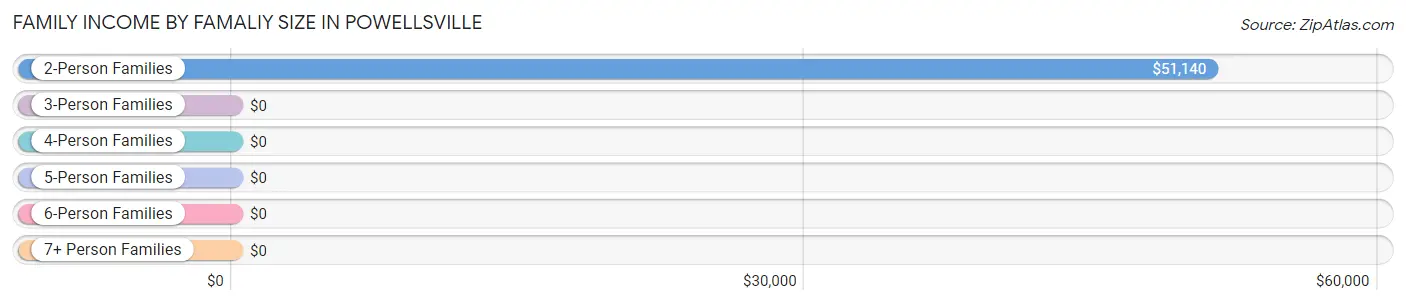
| Income Bracket | # Families | Median Income |
| 2-Person Families | 45 (81.8%) | $51,140 |
| 3-Person Families | 10 (18.2%) | $0 |
| 4-Person Families | 0 (0.0%) | $0 |
| 5-Person Families | 0 (0.0%) | $0 |
| 6-Person Families | 0 (0.0%) | $0 |
| 7+ Person Families | 0 (0.0%) | $0 |
| Total | 55 (100.0%) | $50,772 |
Family Income by Number of Earners in Powellsville
| Number of Earners | # Families | Median Income |
| No Earners | 37 (67.3%) | $0 |
| 1 Earner | 7 (12.7%) | $0 |
| 2 Earners | 11 (20.0%) | $0 |
| 3+ Earners | 0 (0.0%) | $0 |
| Total | 55 (100.0%) | $50,772 |
Household Income in Powellsville
Household Income Brackets in Powellsville
With 34 households falling in the category, the $50,000 to $74,999 income range is the most frequent in Powellsville, accounting for 37.4% of all households.
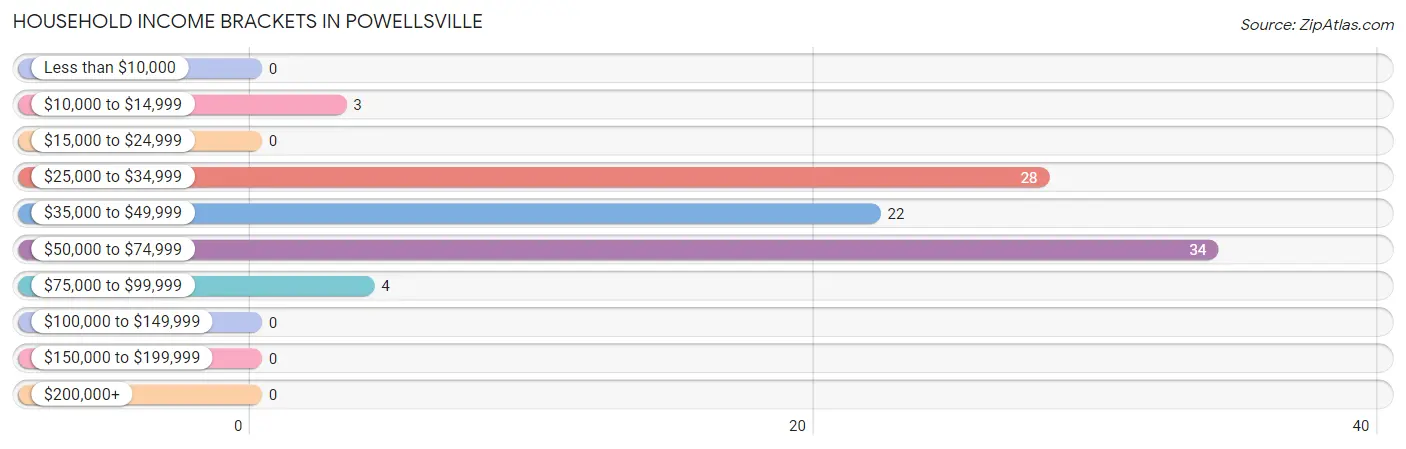
| Income Bracket | # Households | % Households |
| Less than $10,000 | 0 | 0.0% |
| $10,000 to $14,999 | 3 | 3.3% |
| $15,000 to $24,999 | 0 | 0.0% |
| $25,000 to $34,999 | 28 | 30.8% |
| $35,000 to $49,999 | 22 | 24.2% |
| $50,000 to $74,999 | 34 | 37.4% |
| $75,000 to $99,999 | 4 | 4.4% |
| $100,000 to $149,999 | 0 | 0.0% |
| $150,000 to $199,999 | 0 | 0.0% |
| $200,000+ | 0 | 0.0% |
Household Income by Householder Age in Powellsville
The median household income in Powellsville is $42,188, with the highest median household income of $41,750 found in the 65+ years age bracket for the primary householder. A total of 77 households (84.6%) fall into this category.
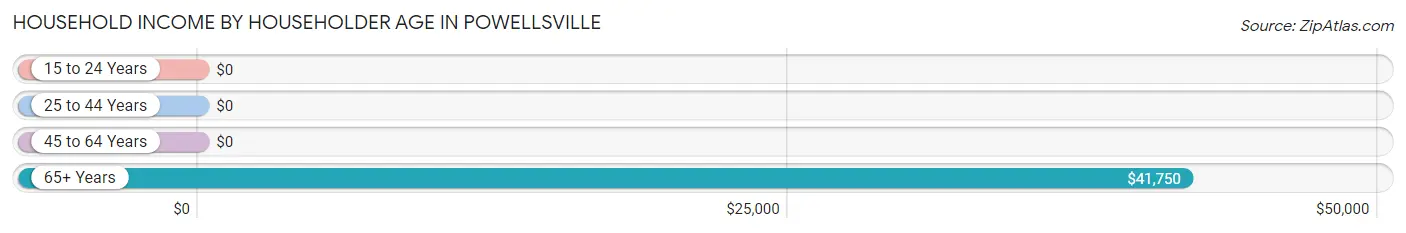
| Income Bracket | # Households | Median Income |
| 15 to 24 Years | 0 (0.0%) | $0 |
| 25 to 44 Years | 7 (7.7%) | $0 |
| 45 to 64 Years | 7 (7.7%) | $0 |
| 65+ Years | 77 (84.6%) | $41,750 |
| Total | 91 (100.0%) | $42,188 |
Poverty in Powellsville
Income Below Poverty by Sex and Age in Powellsville
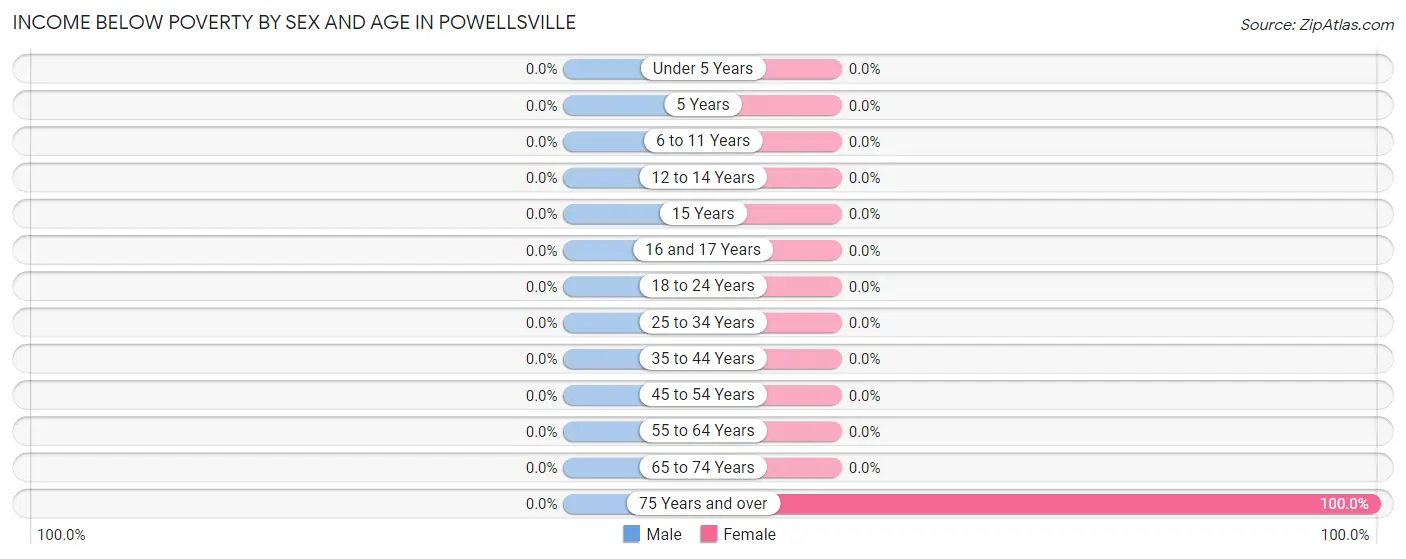
| Age Bracket | Male | Female |
| Under 5 Years | 0 (0.0%) | 0 (0.0%) |
| 5 Years | 0 (0.0%) | 0 (0.0%) |
| 6 to 11 Years | 0 (0.0%) | 0 (0.0%) |
| 12 to 14 Years | 0 (0.0%) | 0 (0.0%) |
| 15 Years | 0 (0.0%) | 0 (0.0%) |
| 16 and 17 Years | 0 (0.0%) | 0 (0.0%) |
| 18 to 24 Years | 0 (0.0%) | 0 (0.0%) |
| 25 to 34 Years | 0 (0.0%) | 0 (0.0%) |
| 35 to 44 Years | 0 (0.0%) | 0 (0.0%) |
| 45 to 54 Years | 0 (0.0%) | 0 (0.0%) |
| 55 to 64 Years | 0 (0.0%) | 0 (0.0%) |
| 65 to 74 Years | 0 (0.0%) | 0 (0.0%) |
| 75 Years and over | 0 (0.0%) | 3 (100.0%) |
| Total | 0 (0.0%) | 3 (4.3%) |
Income Above Poverty by Sex and Age in Powellsville
According to the poverty statistics in Powellsville, males aged 16 and 17 years and females aged 6 to 11 years are the age groups that are most secure financially, with 100.0% of males and 100.0% of females in these age groups living above the poverty line.
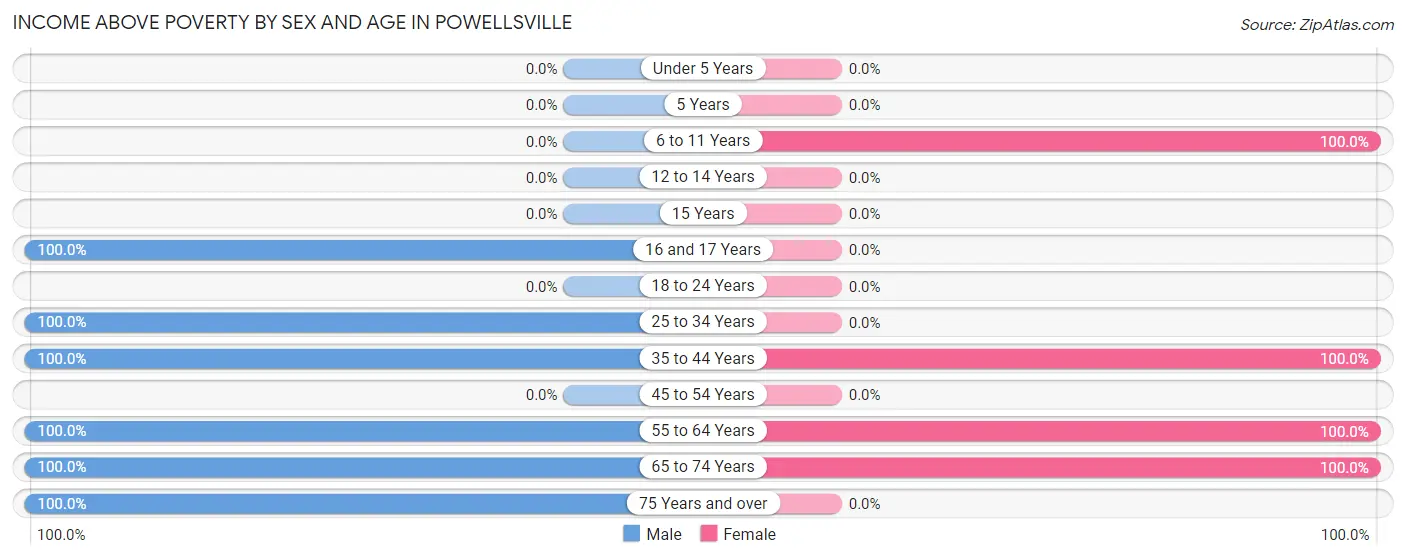
| Age Bracket | Male | Female |
| Under 5 Years | 0 (0.0%) | 0 (0.0%) |
| 5 Years | 0 (0.0%) | 0 (0.0%) |
| 6 to 11 Years | 0 (0.0%) | 5 (100.0%) |
| 12 to 14 Years | 0 (0.0%) | 0 (0.0%) |
| 15 Years | 0 (0.0%) | 0 (0.0%) |
| 16 and 17 Years | 6 (100.0%) | 0 (0.0%) |
| 18 to 24 Years | 0 (0.0%) | 0 (0.0%) |
| 25 to 34 Years | 4 (100.0%) | 0 (0.0%) |
| 35 to 44 Years | 2 (100.0%) | 7 (100.0%) |
| 45 to 54 Years | 0 (0.0%) | 0 (0.0%) |
| 55 to 64 Years | 2 (100.0%) | 7 (100.0%) |
| 65 to 74 Years | 50 (100.0%) | 48 (100.0%) |
| 75 Years and over | 27 (100.0%) | 0 (0.0%) |
| Total | 91 (100.0%) | 67 (95.7%) |
Income Below Poverty Among Married-Couple Families in Powellsville
| Children | Above Poverty | Below Poverty |
| No Children | 44 (100.0%) | 0 (0.0%) |
| 1 or 2 Children | 0 (0.0%) | 0 (0.0%) |
| 3 or 4 Children | 0 (0.0%) | 0 (0.0%) |
| 5 or more Children | 0 (0.0%) | 0 (0.0%) |
| Total | 44 (100.0%) | 0 (0.0%) |
Income Below Poverty Among Single-Parent Households in Powellsville
| Children | Single Father | Single Mother |
| No Children | 0 (0.0%) | 0 (0.0%) |
| 1 or 2 Children | 0 (0.0%) | 0 (0.0%) |
| 3 or 4 Children | 0 (0.0%) | 0 (0.0%) |
| 5 or more Children | 0 (0.0%) | 0 (0.0%) |
| Total | 0 (0.0%) | 0 (0.0%) |
Income Below Poverty Among Married-Couple vs Single-Parent Households in Powellsville
| Children | Married-Couple Families | Single-Parent Households |
| No Children | 0 (0.0%) | 0 (0.0%) |
| 1 or 2 Children | 0 (0.0%) | 0 (0.0%) |
| 3 or 4 Children | 0 (0.0%) | 0 (0.0%) |
| 5 or more Children | 0 (0.0%) | 0 (0.0%) |
| Total | 0 (0.0%) | 0 (0.0%) |
Employment Characteristics in Powellsville
Employment by Class of Employer in Powellsville
Among the 20 employed individuals in Powellsville, private company employees (19 | 95.0%), and not-for-profit organizations (1 | 5.0%) make up the most common classes of employment.
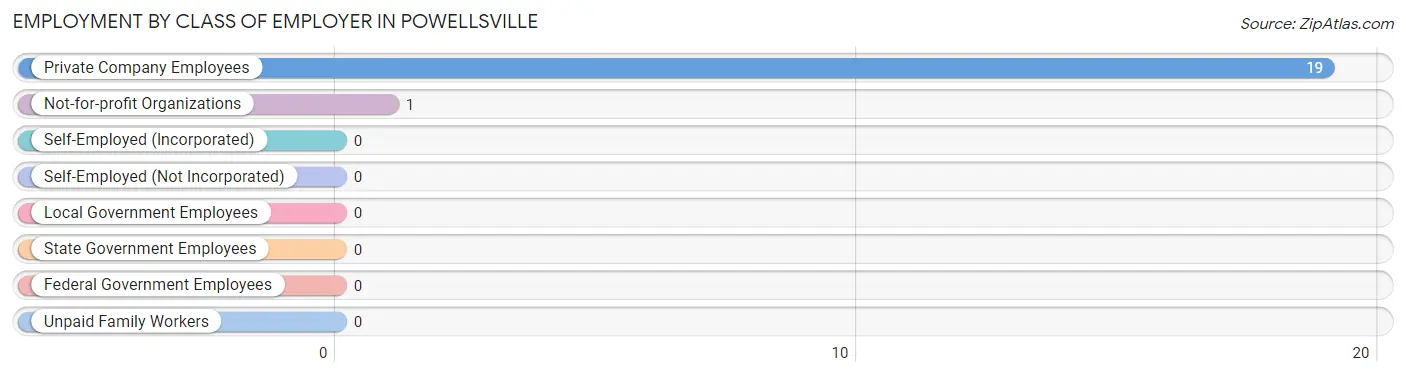
| Employer Class | # Employees | % Employees |
| Private Company Employees | 19 | 95.0% |
| Self-Employed (Incorporated) | 0 | 0.0% |
| Self-Employed (Not Incorporated) | 0 | 0.0% |
| Not-for-profit Organizations | 1 | 5.0% |
| Local Government Employees | 0 | 0.0% |
| State Government Employees | 0 | 0.0% |
| Federal Government Employees | 0 | 0.0% |
| Unpaid Family Workers | 0 | 0.0% |
| Total | 20 | 100.0% |
Employment Status by Age in Powellsville
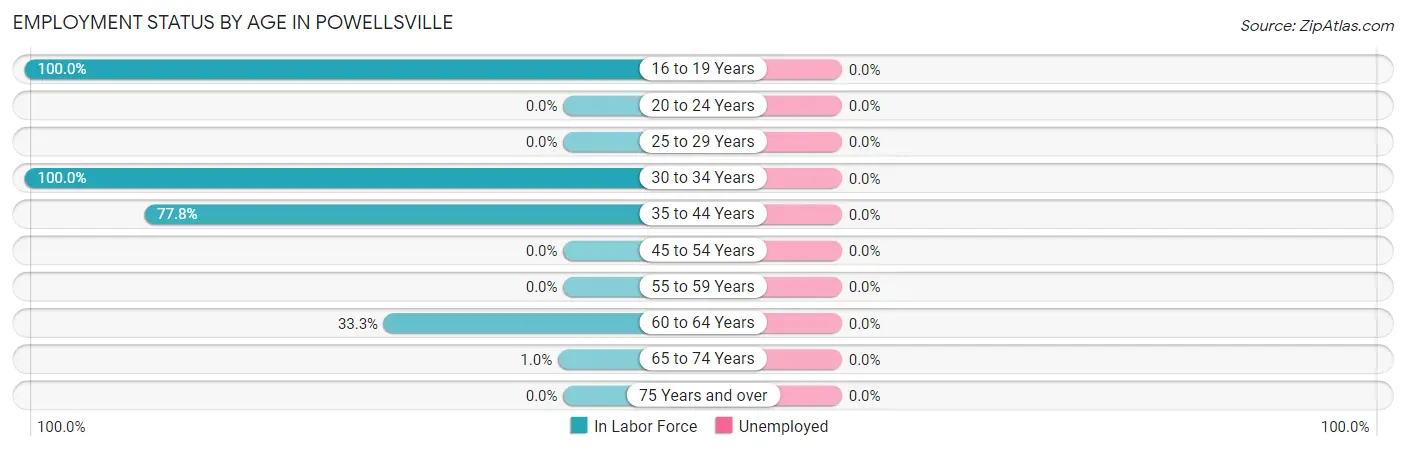
| Age Bracket | In Labor Force | Unemployed |
| 16 to 19 Years | 6 (100.0%) | 0 (0.0%) |
| 20 to 24 Years | 0 (0.0%) | 0 (0.0%) |
| 25 to 29 Years | 0 (0.0%) | 0 (0.0%) |
| 30 to 34 Years | 4 (100.0%) | 0 (0.0%) |
| 35 to 44 Years | 7 (77.8%) | 0 (0.0%) |
| 45 to 54 Years | 0 (0.0%) | 0 (0.0%) |
| 55 to 59 Years | 0 (0.0%) | 0 (0.0%) |
| 60 to 64 Years | 2 (33.3%) | 0 (0.0%) |
| 65 to 74 Years | 1 (1.0%) | 0 (0.0%) |
| 75 Years and over | 0 (0.0%) | 0 (0.0%) |
| Total | 20 (12.8%) | 0 (0.0%) |
Employment Status by Educational Attainment in Powellsville
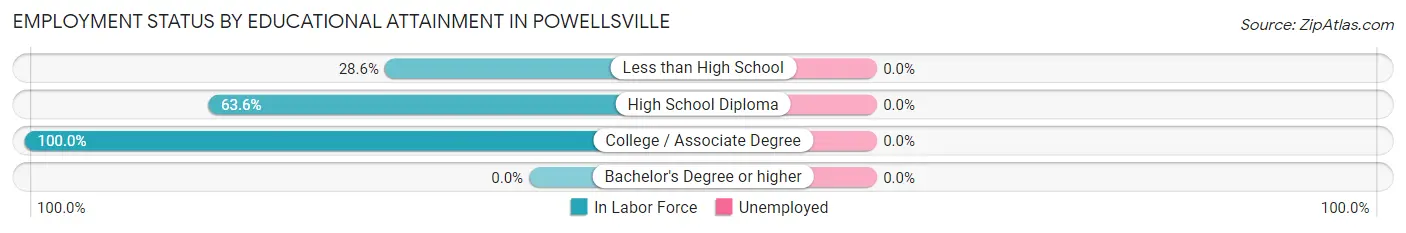
| Educational Attainment | In Labor Force | Unemployed |
| Less than High School | 2 (28.6%) | 0 (0.0%) |
| High School Diploma | 7 (63.6%) | 0 (0.0%) |
| College / Associate Degree | 4 (100.0%) | 0 (0.0%) |
| Bachelor's Degree or higher | 0 (0.0%) | 0 (0.0%) |
| Total | 13 (59.1%) | 0 (0.0%) |
Employment Occupations by Sex in Powellsville
Management, Business, Science and Arts Occupations
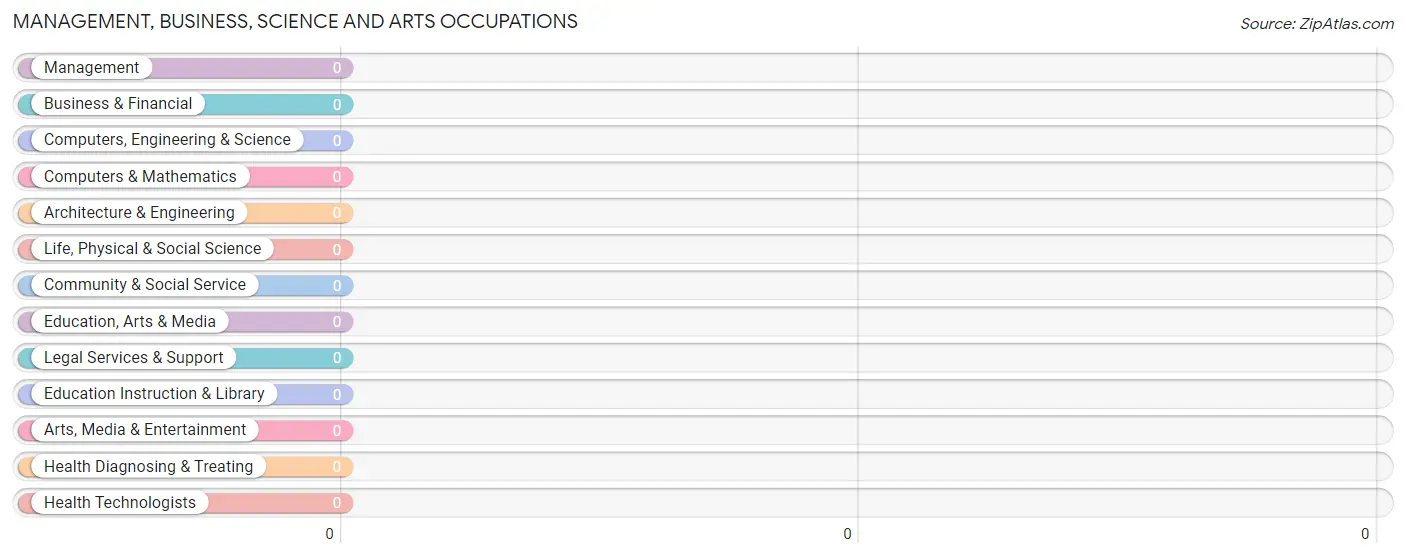
Management, Business, Science and Arts Occupations by Sex
| Occupation | Male | Female |
| Management | 0 (0.0%) | 0 (0.0%) |
| Business & Financial | 0 (0.0%) | 0 (0.0%) |
| Computers, Engineering & Science | 0 (0.0%) | 0 (0.0%) |
| Computers & Mathematics | 0 (0.0%) | 0 (0.0%) |
| Architecture & Engineering | 0 (0.0%) | 0 (0.0%) |
| Life, Physical & Social Science | 0 (0.0%) | 0 (0.0%) |
| Community & Social Service | 0 (0.0%) | 0 (0.0%) |
| Education, Arts & Media | 0 (0.0%) | 0 (0.0%) |
| Legal Services & Support | 0 (0.0%) | 0 (0.0%) |
| Education Instruction & Library | 0 (0.0%) | 0 (0.0%) |
| Arts, Media & Entertainment | 0 (0.0%) | 0 (0.0%) |
| Health Diagnosing & Treating | 0 (0.0%) | 0 (0.0%) |
| Health Technologists | 0 (0.0%) | 0 (0.0%) |
| Total (Category) | 0 (0.0%) | 0 (0.0%) |
| Total (Overall) | 13 (65.0%) | 7 (35.0%) |
Services Occupations
The most common Services occupations in Powellsville are , and Cleaning & Maintenance (1 | 5.0%).
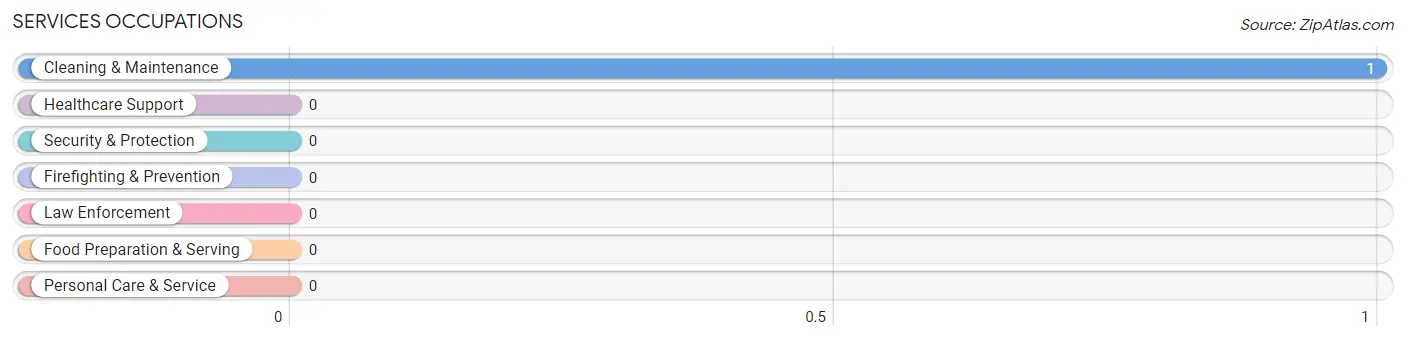
Services Occupations by Sex
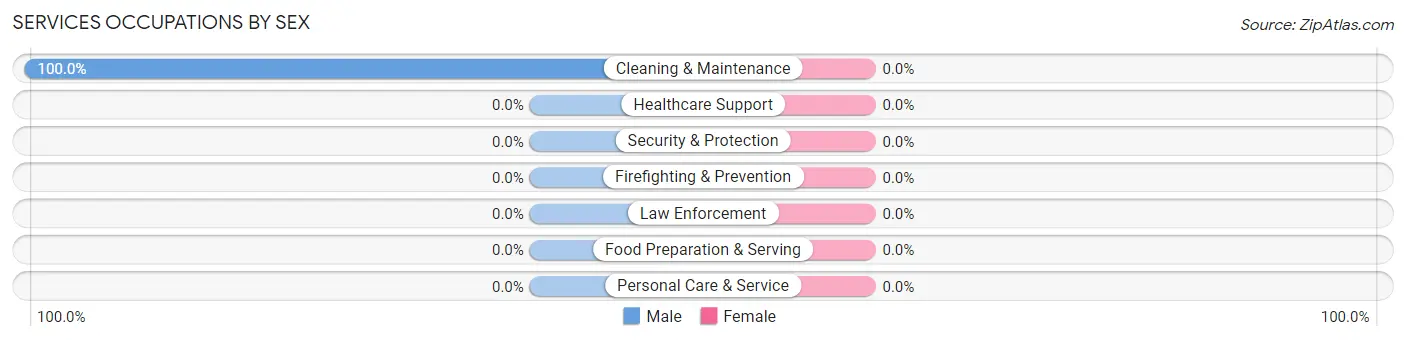
| Occupation | Male | Female |
| Healthcare Support | 0 (0.0%) | 0 (0.0%) |
| Security & Protection | 0 (0.0%) | 0 (0.0%) |
| Firefighting & Prevention | 0 (0.0%) | 0 (0.0%) |
| Law Enforcement | 0 (0.0%) | 0 (0.0%) |
| Food Preparation & Serving | 0 (0.0%) | 0 (0.0%) |
| Cleaning & Maintenance | 1 (100.0%) | 0 (0.0%) |
| Personal Care & Service | 0 (0.0%) | 0 (0.0%) |
| Total (Category) | 1 (100.0%) | 0 (0.0%) |
| Total (Overall) | 13 (65.0%) | 7 (35.0%) |
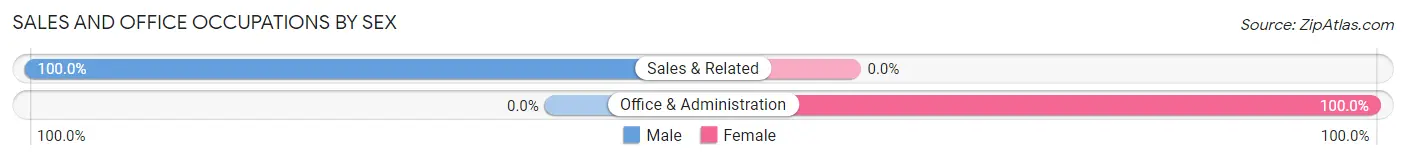
Sales and Office Occupations
The most common Sales and Office occupations in Powellsville are Sales & Related (10 | 50.0%), and Office & Administration (7 | 35.0%).
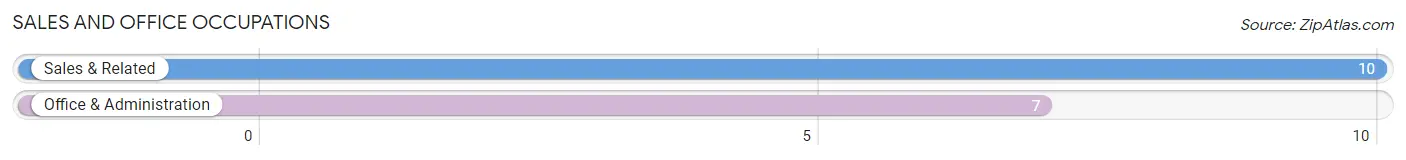
Sales and Office Occupations by Sex
| Occupation | Male | Female |
| Sales & Related | 10 (100.0%) | 0 (0.0%) |
| Office & Administration | 0 (0.0%) | 7 (100.0%) |
| Total (Category) | 10 (58.8%) | 7 (41.2%) |
| Total (Overall) | 13 (65.0%) | 7 (35.0%) |
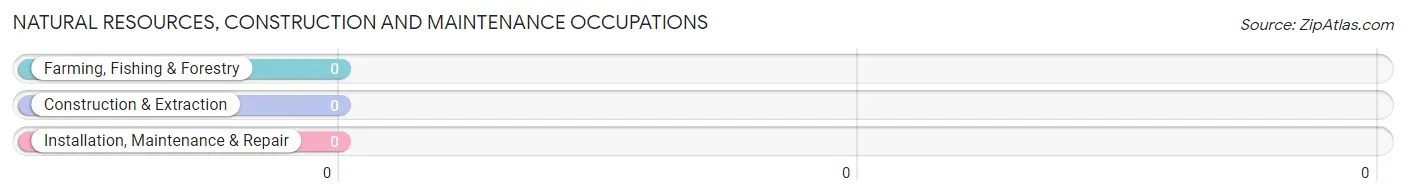
Natural Resources, Construction and Maintenance Occupations
Natural Resources, Construction and Maintenance Occupations by Sex
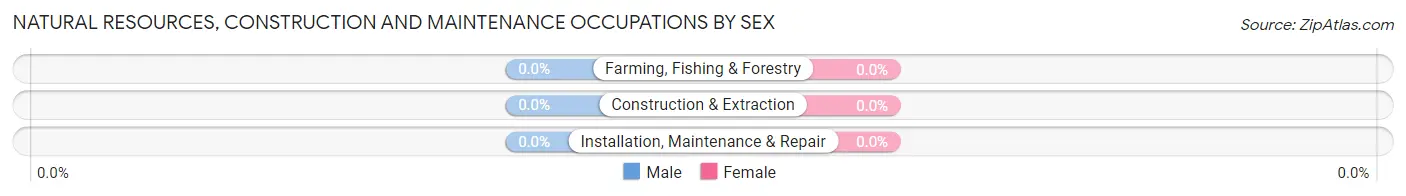
| Occupation | Male | Female |
| Farming, Fishing & Forestry | 0 (0.0%) | 0 (0.0%) |
| Construction & Extraction | 0 (0.0%) | 0 (0.0%) |
| Installation, Maintenance & Repair | 0 (0.0%) | 0 (0.0%) |
| Total (Category) | 0 (0.0%) | 0 (0.0%) |
| Total (Overall) | 13 (65.0%) | 7 (35.0%) |
Production, Transportation and Moving Occupations
The most common Production, Transportation and Moving occupations in Powellsville are , and Material Moving (2 | 10.0%).
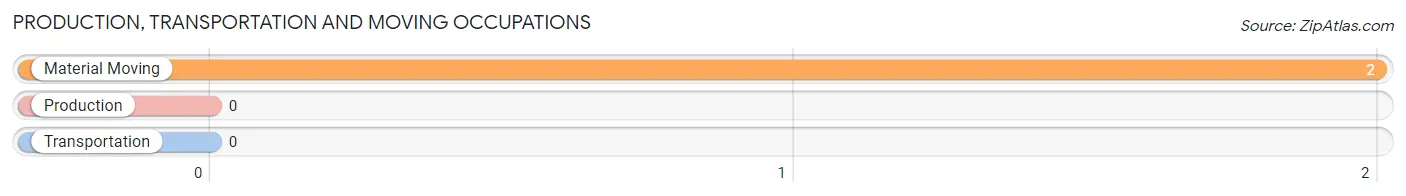
Production, Transportation and Moving Occupations by Sex
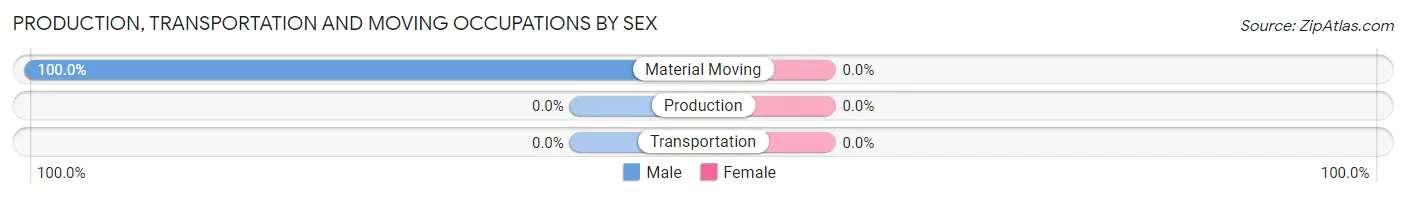
| Occupation | Male | Female |
| Production | 0 (0.0%) | 0 (0.0%) |
| Transportation | 0 (0.0%) | 0 (0.0%) |
| Material Moving | 2 (100.0%) | 0 (0.0%) |
| Total (Category) | 2 (100.0%) | 0 (0.0%) |
| Total (Overall) | 13 (65.0%) | 7 (35.0%) |
Employment Industries by Sex in Powellsville
Employment Industries in Powellsville
The major employment industries in Powellsville include Finance & Insurance (7 | 35.0%), Retail Trade (6 | 30.0%), and Accommodation & Food Services (6 | 30.0%).
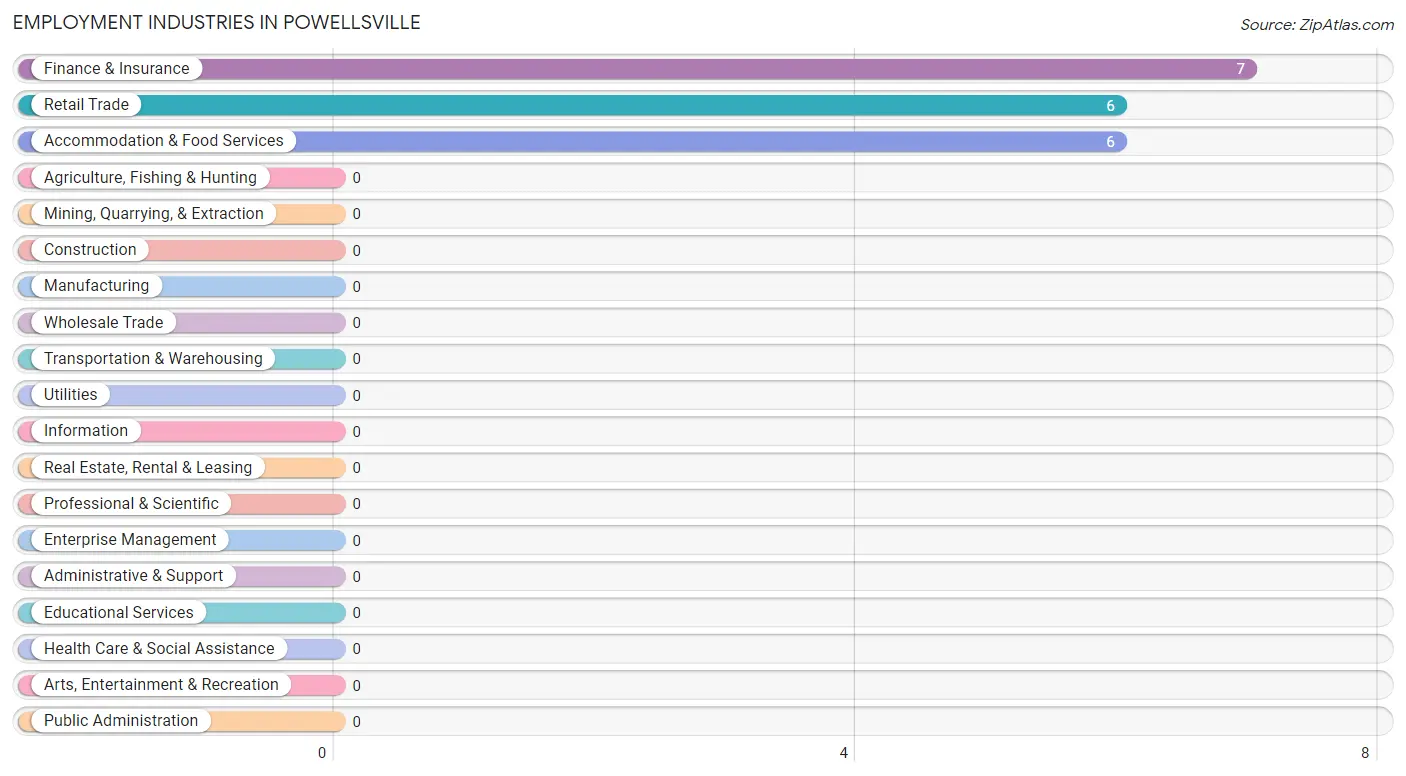
Employment Industries by Sex in Powellsville
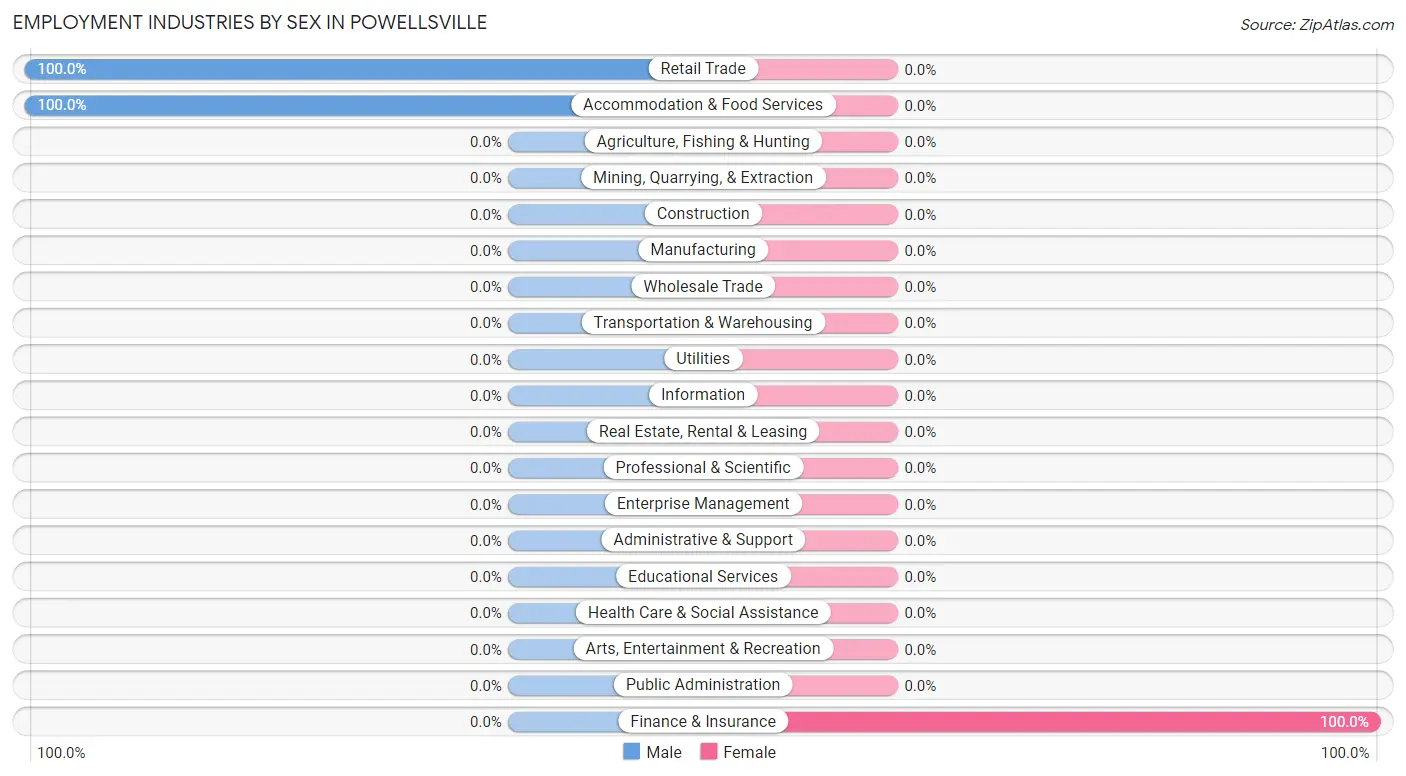
| Industry | Male | Female |
| Agriculture, Fishing & Hunting | 0 (0.0%) | 0 (0.0%) |
| Mining, Quarrying, & Extraction | 0 (0.0%) | 0 (0.0%) |
| Construction | 0 (0.0%) | 0 (0.0%) |
| Manufacturing | 0 (0.0%) | 0 (0.0%) |
| Wholesale Trade | 0 (0.0%) | 0 (0.0%) |
| Retail Trade | 6 (100.0%) | 0 (0.0%) |
| Transportation & Warehousing | 0 (0.0%) | 0 (0.0%) |
| Utilities | 0 (0.0%) | 0 (0.0%) |
| Information | 0 (0.0%) | 0 (0.0%) |
| Finance & Insurance | 0 (0.0%) | 7 (100.0%) |
| Real Estate, Rental & Leasing | 0 (0.0%) | 0 (0.0%) |
| Professional & Scientific | 0 (0.0%) | 0 (0.0%) |
| Enterprise Management | 0 (0.0%) | 0 (0.0%) |
| Administrative & Support | 0 (0.0%) | 0 (0.0%) |
| Educational Services | 0 (0.0%) | 0 (0.0%) |
| Health Care & Social Assistance | 0 (0.0%) | 0 (0.0%) |
| Arts, Entertainment & Recreation | 0 (0.0%) | 0 (0.0%) |
| Accommodation & Food Services | 6 (100.0%) | 0 (0.0%) |
| Public Administration | 0 (0.0%) | 0 (0.0%) |
| Total | 13 (65.0%) | 7 (35.0%) |
Education in Powellsville
School Enrollment in Powellsville
The most common levels of schooling among the 11 students in Powellsville are high school (6 | 54.5%), and elementary school (5 | 45.5%).
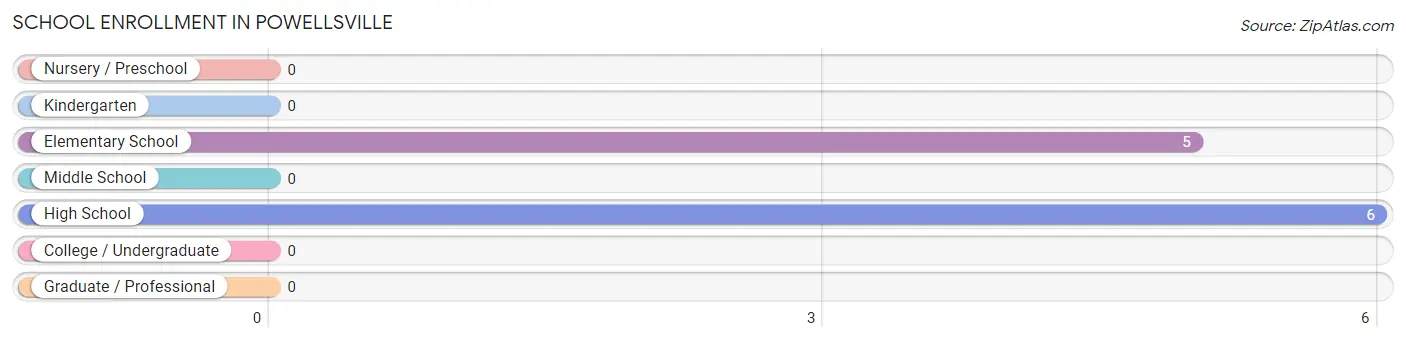
| School Level | # Students | % Students |
| Nursery / Preschool | 0 | 0.0% |
| Kindergarten | 0 | 0.0% |
| Elementary School | 5 | 45.5% |
| Middle School | 0 | 0.0% |
| High School | 6 | 54.5% |
| College / Undergraduate | 0 | 0.0% |
| Graduate / Professional | 0 | 0.0% |
| Total | 11 | 100.0% |
School Enrollment by Age by Funding Source in Powellsville
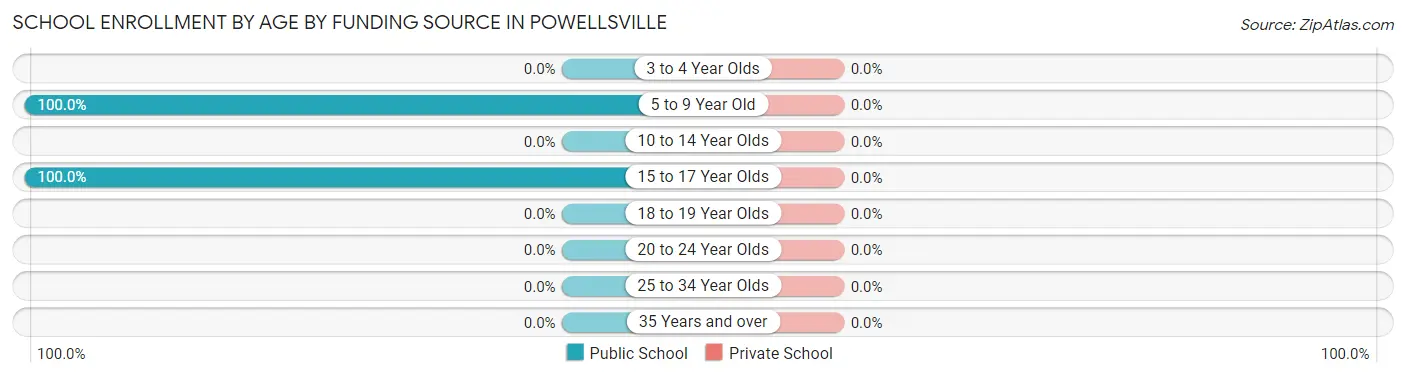
| Age Bracket | Public School | Private School |
| 3 to 4 Year Olds | 0 (0.0%) | 0 (0.0%) |
| 5 to 9 Year Old | 5 (100.0%) | 0 (0.0%) |
| 10 to 14 Year Olds | 0 (0.0%) | 0 (0.0%) |
| 15 to 17 Year Olds | 6 (100.0%) | 0 (0.0%) |
| 18 to 19 Year Olds | 0 (0.0%) | 0 (0.0%) |
| 20 to 24 Year Olds | 0 (0.0%) | 0 (0.0%) |
| 25 to 34 Year Olds | 0 (0.0%) | 0 (0.0%) |
| 35 Years and over | 0 (0.0%) | 0 (0.0%) |
| Total | 11 (100.0%) | 0 (0.0%) |
Educational Attainment by Field of Study in Powellsville
, and business (11 | 100.0%) are the most common fields of study among 11 individuals in Powellsville who have obtained a bachelor's degree or higher.
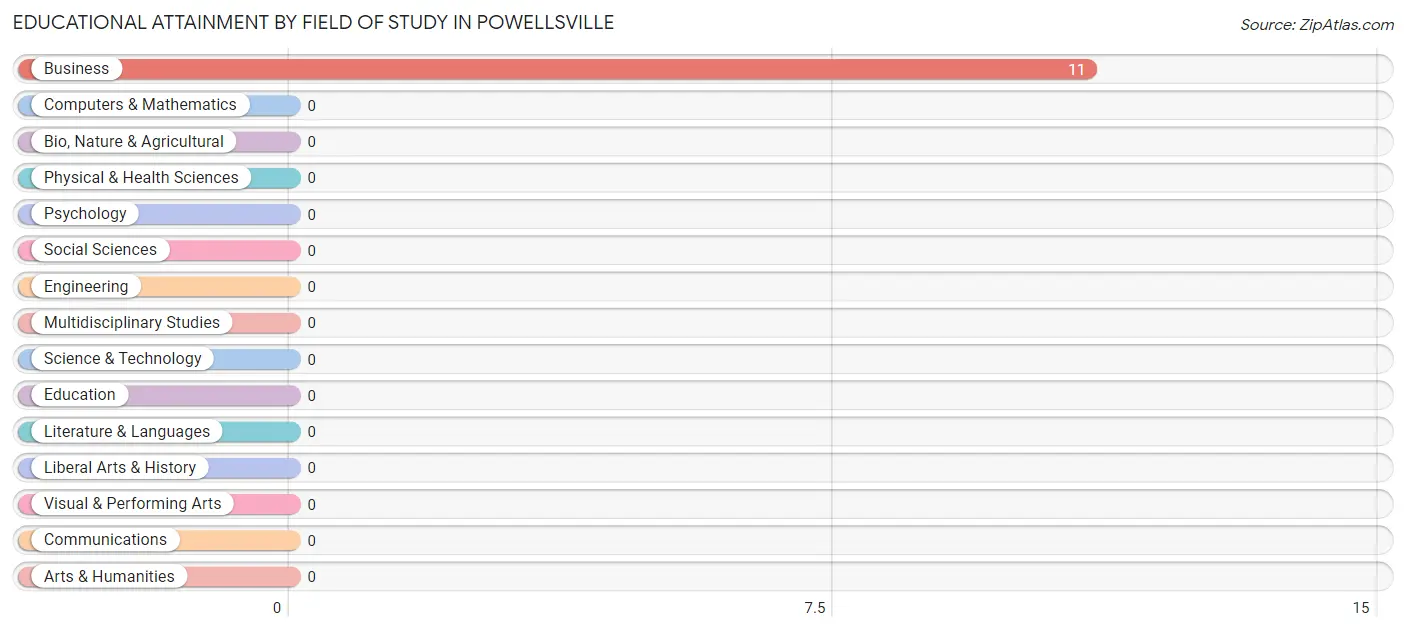
| Field of Study | # Graduates | % Graduates |
| Computers & Mathematics | 0 | 0.0% |
| Bio, Nature & Agricultural | 0 | 0.0% |
| Physical & Health Sciences | 0 | 0.0% |
| Psychology | 0 | 0.0% |
| Social Sciences | 0 | 0.0% |
| Engineering | 0 | 0.0% |
| Multidisciplinary Studies | 0 | 0.0% |
| Science & Technology | 0 | 0.0% |
| Business | 11 | 100.0% |
| Education | 0 | 0.0% |
| Literature & Languages | 0 | 0.0% |
| Liberal Arts & History | 0 | 0.0% |
| Visual & Performing Arts | 0 | 0.0% |
| Communications | 0 | 0.0% |
| Arts & Humanities | 0 | 0.0% |
| Total | 11 | 100.0% |
Transportation & Commute in Powellsville
Vehicle Availability by Sex in Powellsville
The most prevalent vehicle ownership categories in Powellsville are males with 1 vehicle (13, accounting for 100.0%) and females with 1 vehicle (7, making up 185.7%).
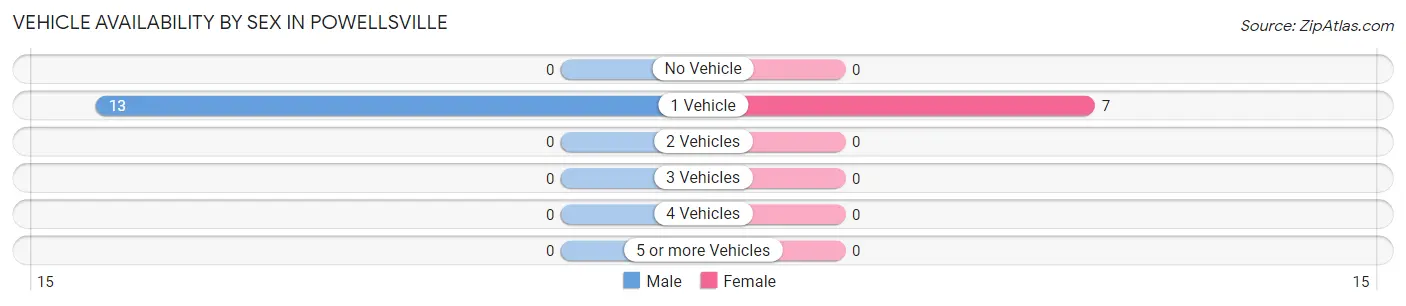
| Vehicles Available | Male | Female |
| No Vehicle | 0 (0.0%) | 0 (0.0%) |
| 1 Vehicle | 13 (100.0%) | 7 (100.0%) |
| 2 Vehicles | 0 (0.0%) | 0 (0.0%) |
| 3 Vehicles | 0 (0.0%) | 0 (0.0%) |
| 4 Vehicles | 0 (0.0%) | 0 (0.0%) |
| 5 or more Vehicles | 0 (0.0%) | 0 (0.0%) |
| Total | 13 (100.0%) | 7 (100.0%) |
Commute Time in Powellsville
The most frequently occuring commute durations in Powellsville are 90 or more minutes (7 commuters, 43.8%), less than 5 minutes (6 commuters, 37.5%), and 10 to 14 minutes (2 commuters, 12.5%).
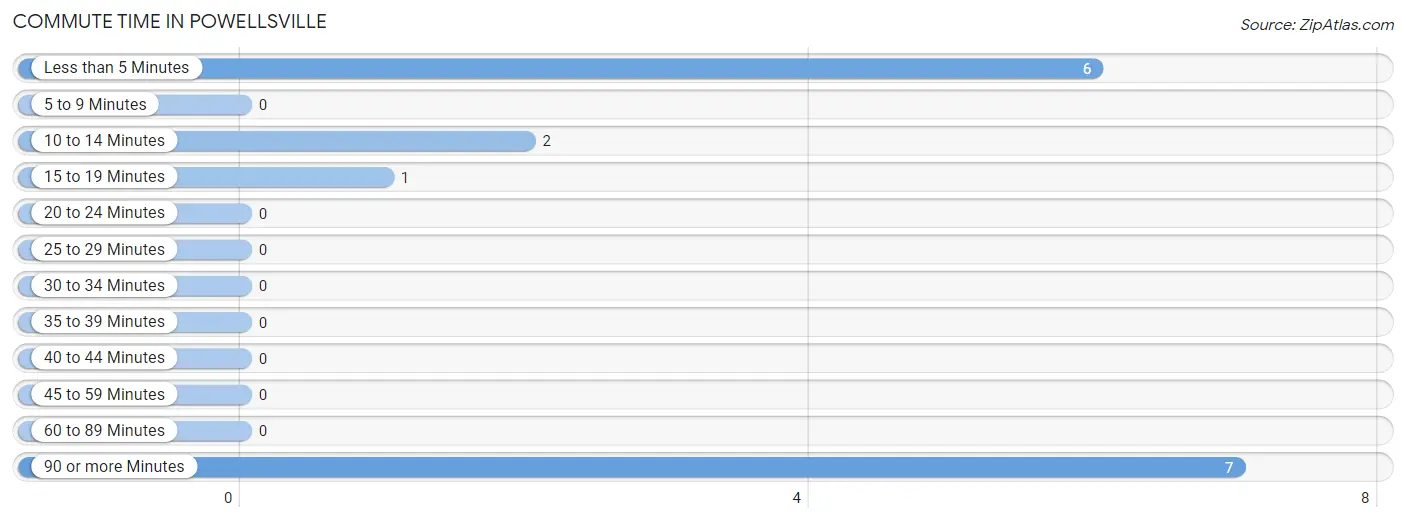
| Commute Time | # Commuters | % Commuters |
| Less than 5 Minutes | 6 | 37.5% |
| 5 to 9 Minutes | 0 | 0.0% |
| 10 to 14 Minutes | 2 | 12.5% |
| 15 to 19 Minutes | 1 | 6.2% |
| 20 to 24 Minutes | 0 | 0.0% |
| 25 to 29 Minutes | 0 | 0.0% |
| 30 to 34 Minutes | 0 | 0.0% |
| 35 to 39 Minutes | 0 | 0.0% |
| 40 to 44 Minutes | 0 | 0.0% |
| 45 to 59 Minutes | 0 | 0.0% |
| 60 to 89 Minutes | 0 | 0.0% |
| 90 or more Minutes | 7 | 43.8% |
Commute Time by Sex in Powellsville
The most common commute times in Powellsville are less than 5 minutes (6 commuters, 66.7%) for males and 90 or more minutes (7 commuters, 100.0%) for females.
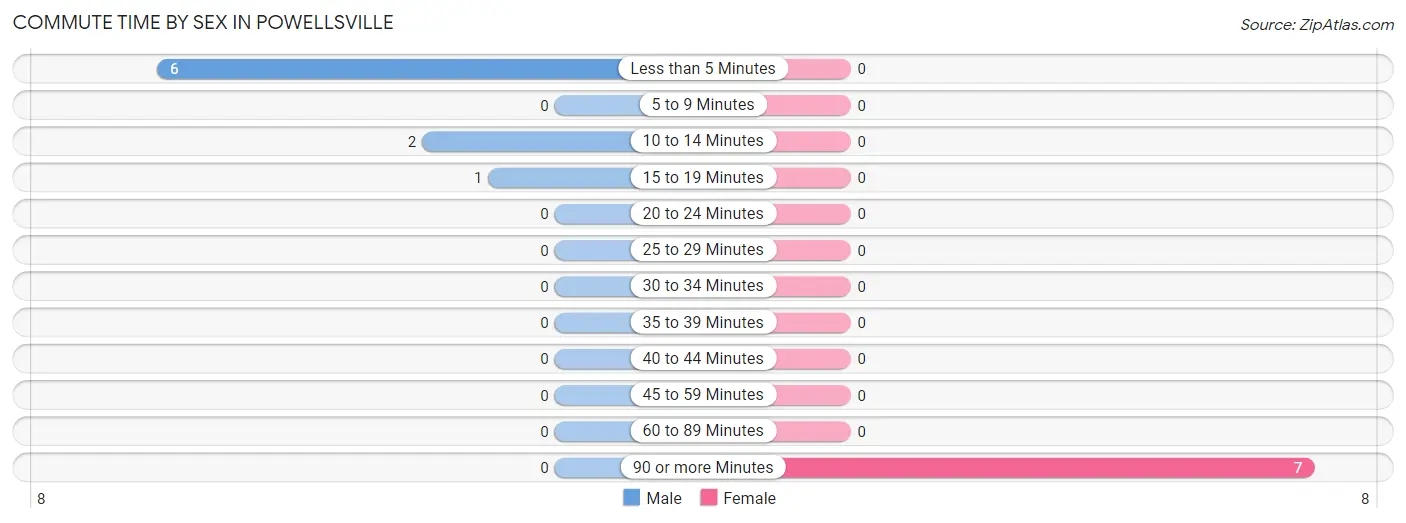
| Commute Time | Male | Female |
| Less than 5 Minutes | 6 (66.7%) | 0 (0.0%) |
| 5 to 9 Minutes | 0 (0.0%) | 0 (0.0%) |
| 10 to 14 Minutes | 2 (22.2%) | 0 (0.0%) |
| 15 to 19 Minutes | 1 (11.1%) | 0 (0.0%) |
| 20 to 24 Minutes | 0 (0.0%) | 0 (0.0%) |
| 25 to 29 Minutes | 0 (0.0%) | 0 (0.0%) |
| 30 to 34 Minutes | 0 (0.0%) | 0 (0.0%) |
| 35 to 39 Minutes | 0 (0.0%) | 0 (0.0%) |
| 40 to 44 Minutes | 0 (0.0%) | 0 (0.0%) |
| 45 to 59 Minutes | 0 (0.0%) | 0 (0.0%) |
| 60 to 89 Minutes | 0 (0.0%) | 0 (0.0%) |
| 90 or more Minutes | 0 (0.0%) | 7 (100.0%) |
Time of Departure to Work by Sex in Powellsville
The most frequent times of departure to work in Powellsville are 5:30 AM to 5:59 AM (6, 66.7%) for males and 8:00 AM to 8:29 AM (7, 100.0%) for females.
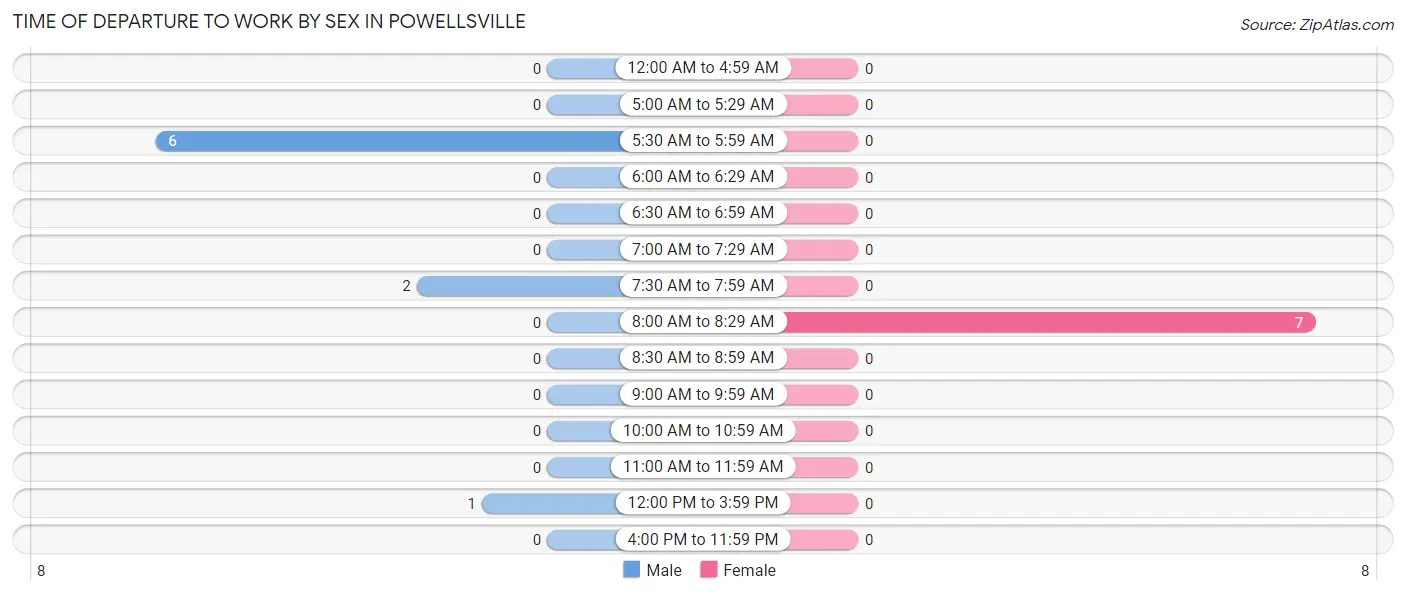
| Time of Departure | Male | Female |
| 12:00 AM to 4:59 AM | 0 (0.0%) | 0 (0.0%) |
| 5:00 AM to 5:29 AM | 0 (0.0%) | 0 (0.0%) |
| 5:30 AM to 5:59 AM | 6 (66.7%) | 0 (0.0%) |
| 6:00 AM to 6:29 AM | 0 (0.0%) | 0 (0.0%) |
| 6:30 AM to 6:59 AM | 0 (0.0%) | 0 (0.0%) |
| 7:00 AM to 7:29 AM | 0 (0.0%) | 0 (0.0%) |
| 7:30 AM to 7:59 AM | 2 (22.2%) | 0 (0.0%) |
| 8:00 AM to 8:29 AM | 0 (0.0%) | 7 (100.0%) |
| 8:30 AM to 8:59 AM | 0 (0.0%) | 0 (0.0%) |
| 9:00 AM to 9:59 AM | 0 (0.0%) | 0 (0.0%) |
| 10:00 AM to 10:59 AM | 0 (0.0%) | 0 (0.0%) |
| 11:00 AM to 11:59 AM | 0 (0.0%) | 0 (0.0%) |
| 12:00 PM to 3:59 PM | 1 (11.1%) | 0 (0.0%) |
| 4:00 PM to 11:59 PM | 0 (0.0%) | 0 (0.0%) |
| Total | 9 (100.0%) | 7 (100.0%) |
Housing Occupancy in Powellsville
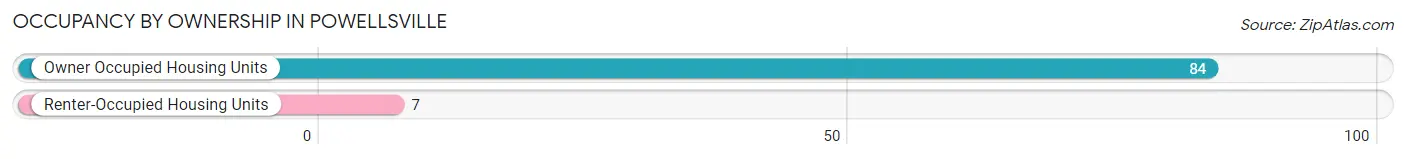
Occupancy by Ownership in Powellsville
Of the total 91 dwellings in Powellsville, owner-occupied units account for 84 (92.3%), while renter-occupied units make up 7 (7.7%).
| Occupancy | # Housing Units | % Housing Units |
| Owner Occupied Housing Units | 84 | 92.3% |
| Renter-Occupied Housing Units | 7 | 7.7% |
| Total Occupied Housing Units | 91 | 100.0% |
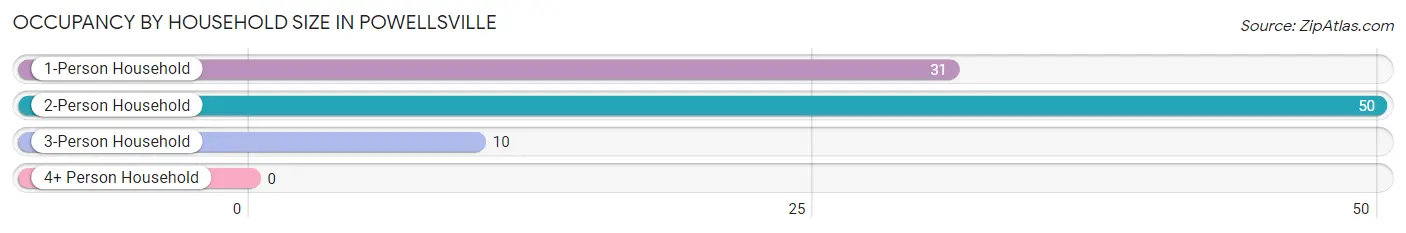
Occupancy by Household Size in Powellsville
| Household Size | # Housing Units | % Housing Units |
| 1-Person Household | 31 | 34.1% |
| 2-Person Household | 50 | 54.9% |
| 3-Person Household | 10 | 11.0% |
| 4+ Person Household | 0 | 0.0% |
| Total Housing Units | 91 | 100.0% |
Occupancy by Ownership by Household Size in Powellsville
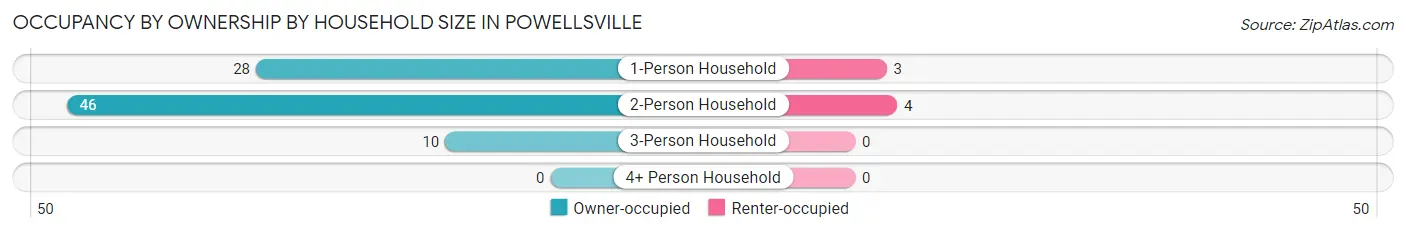
| Household Size | Owner-occupied | Renter-occupied |
| 1-Person Household | 28 (90.3%) | 3 (9.7%) |
| 2-Person Household | 46 (92.0%) | 4 (8.0%) |
| 3-Person Household | 10 (100.0%) | 0 (0.0%) |
| 4+ Person Household | 0 (0.0%) | 0 (0.0%) |
| Total Housing Units | 84 (92.3%) | 7 (7.7%) |
Occupancy by Educational Attainment in Powellsville
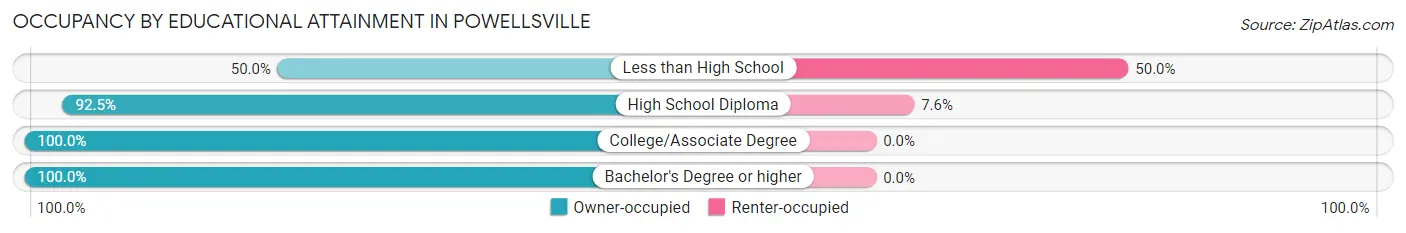
| Household Size | Owner-occupied | Renter-occupied |
| Less than High School | 3 (50.0%) | 3 (50.0%) |
| High School Diploma | 49 (92.4%) | 4 (7.5%) |
| College/Associate Degree | 27 (100.0%) | 0 (0.0%) |
| Bachelor's Degree or higher | 5 (100.0%) | 0 (0.0%) |
Occupancy by Age of Householder in Powellsville
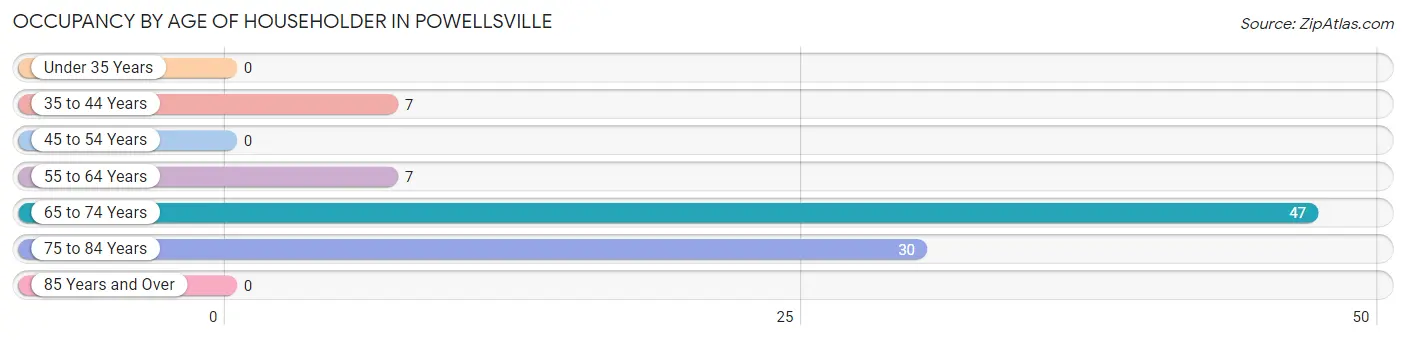
| Age Bracket | # Households | % Households |
| Under 35 Years | 0 | 0.0% |
| 35 to 44 Years | 7 | 7.7% |
| 45 to 54 Years | 0 | 0.0% |
| 55 to 64 Years | 7 | 7.7% |
| 65 to 74 Years | 47 | 51.6% |
| 75 to 84 Years | 30 | 33.0% |
| 85 Years and Over | 0 | 0.0% |
| Total | 91 | 100.0% |
Housing Finances in Powellsville
Median Income by Occupancy in Powellsville
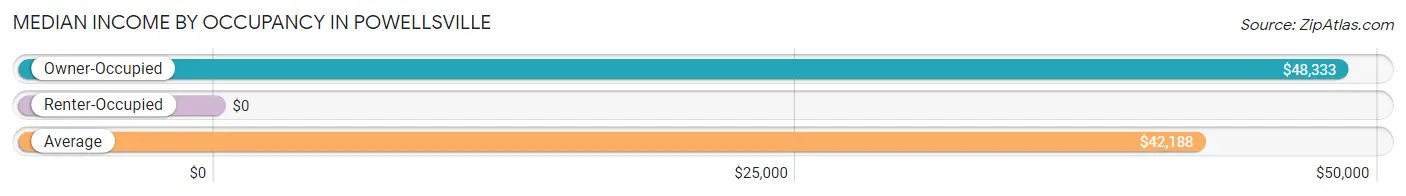
| Occupancy Type | # Households | Median Income |
| Owner-Occupied | 84 (92.3%) | $48,333 |
| Renter-Occupied | 7 (7.7%) | $0 |
| Average | 91 (100.0%) | $42,188 |
Occupancy by Householder Income Bracket in Powellsville
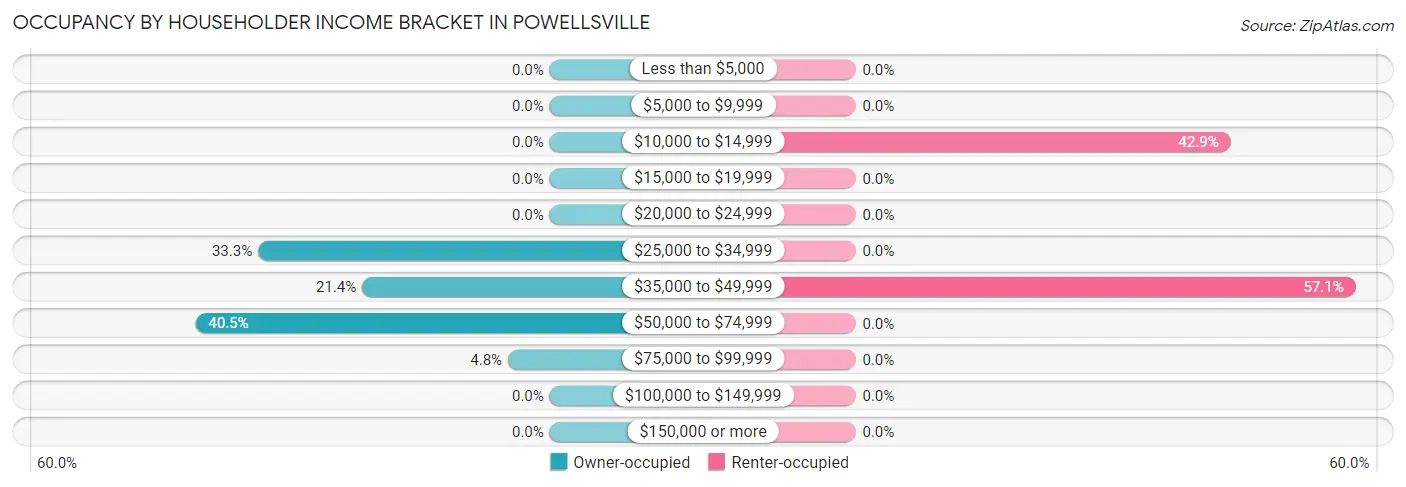
| Income Bracket | Owner-occupied | Renter-occupied |
| Less than $5,000 | 0 (0.0%) | 0 (0.0%) |
| $5,000 to $9,999 | 0 (0.0%) | 0 (0.0%) |
| $10,000 to $14,999 | 0 (0.0%) | 3 (42.9%) |
| $15,000 to $19,999 | 0 (0.0%) | 0 (0.0%) |
| $20,000 to $24,999 | 0 (0.0%) | 0 (0.0%) |
| $25,000 to $34,999 | 28 (33.3%) | 0 (0.0%) |
| $35,000 to $49,999 | 18 (21.4%) | 4 (57.1%) |
| $50,000 to $74,999 | 34 (40.5%) | 0 (0.0%) |
| $75,000 to $99,999 | 4 (4.8%) | 0 (0.0%) |
| $100,000 to $149,999 | 0 (0.0%) | 0 (0.0%) |
| $150,000 or more | 0 (0.0%) | 0 (0.0%) |
| Total | 84 (100.0%) | 7 (100.0%) |
Monthly Housing Cost Tiers in Powellsville
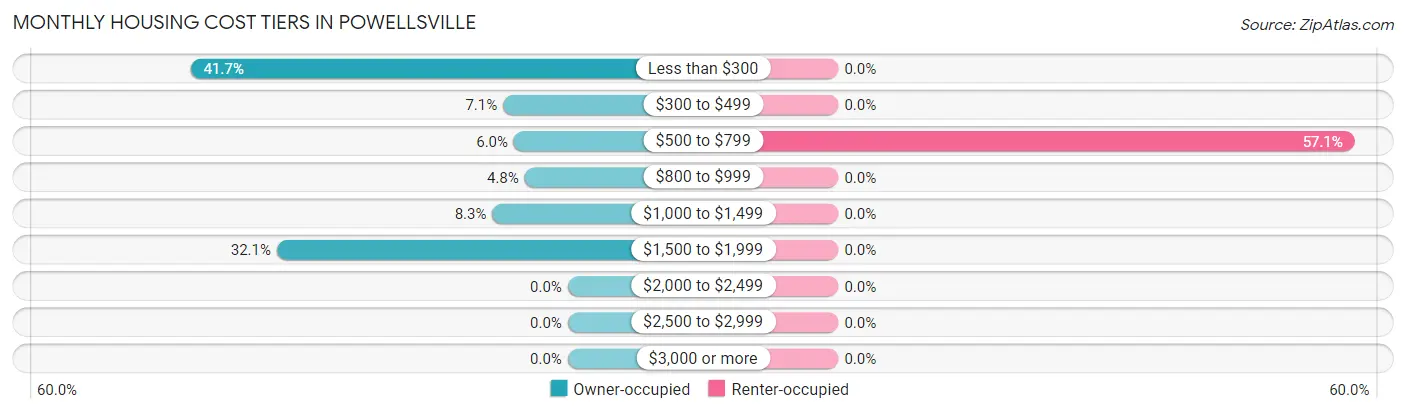
| Monthly Cost | Owner-occupied | Renter-occupied |
| Less than $300 | 35 (41.7%) | 0 (0.0%) |
| $300 to $499 | 6 (7.1%) | 0 (0.0%) |
| $500 to $799 | 5 (5.9%) | 4 (57.1%) |
| $800 to $999 | 4 (4.8%) | 0 (0.0%) |
| $1,000 to $1,499 | 7 (8.3%) | 0 (0.0%) |
| $1,500 to $1,999 | 27 (32.1%) | 0 (0.0%) |
| $2,000 to $2,499 | 0 (0.0%) | 0 (0.0%) |
| $2,500 to $2,999 | 0 (0.0%) | 0 (0.0%) |
| $3,000 or more | 0 (0.0%) | 0 (0.0%) |
| Total | 84 (100.0%) | 7 (100.0%) |
Physical Housing Characteristics in Powellsville
Housing Structures in Powellsville
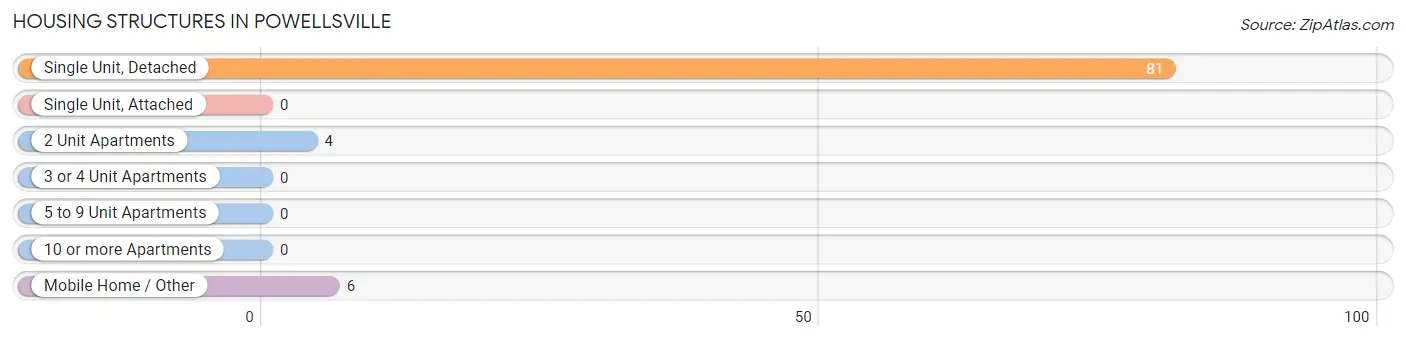
| Structure Type | # Housing Units | % Housing Units |
| Single Unit, Detached | 81 | 89.0% |
| Single Unit, Attached | 0 | 0.0% |
| 2 Unit Apartments | 4 | 4.4% |
| 3 or 4 Unit Apartments | 0 | 0.0% |
| 5 to 9 Unit Apartments | 0 | 0.0% |
| 10 or more Apartments | 0 | 0.0% |
| Mobile Home / Other | 6 | 6.6% |
| Total | 91 | 100.0% |
Housing Structures by Occupancy in Powellsville
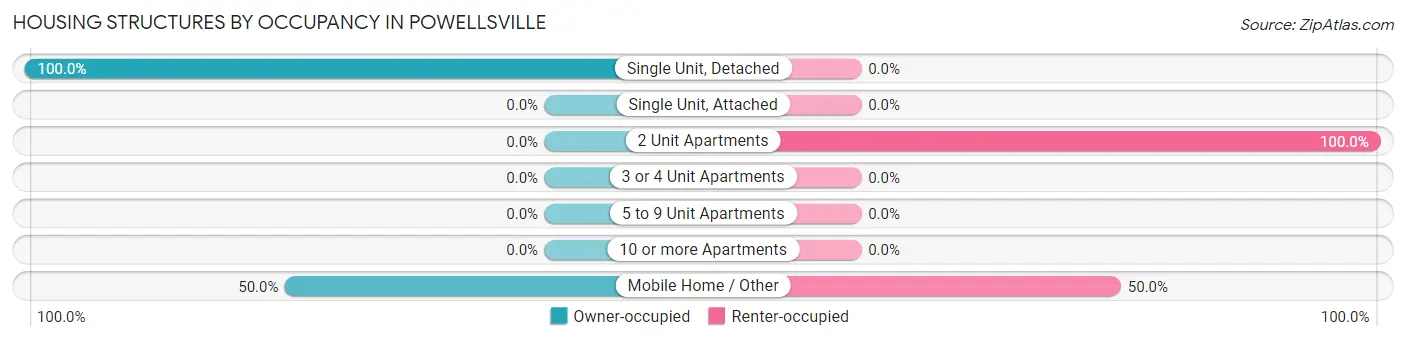
| Structure Type | Owner-occupied | Renter-occupied |
| Single Unit, Detached | 81 (100.0%) | 0 (0.0%) |
| Single Unit, Attached | 0 (0.0%) | 0 (0.0%) |
| 2 Unit Apartments | 0 (0.0%) | 4 (100.0%) |
| 3 or 4 Unit Apartments | 0 (0.0%) | 0 (0.0%) |
| 5 to 9 Unit Apartments | 0 (0.0%) | 0 (0.0%) |
| 10 or more Apartments | 0 (0.0%) | 0 (0.0%) |
| Mobile Home / Other | 3 (50.0%) | 3 (50.0%) |
| Total | 84 (92.3%) | 7 (7.7%) |
Housing Structures by Number of Rooms in Powellsville
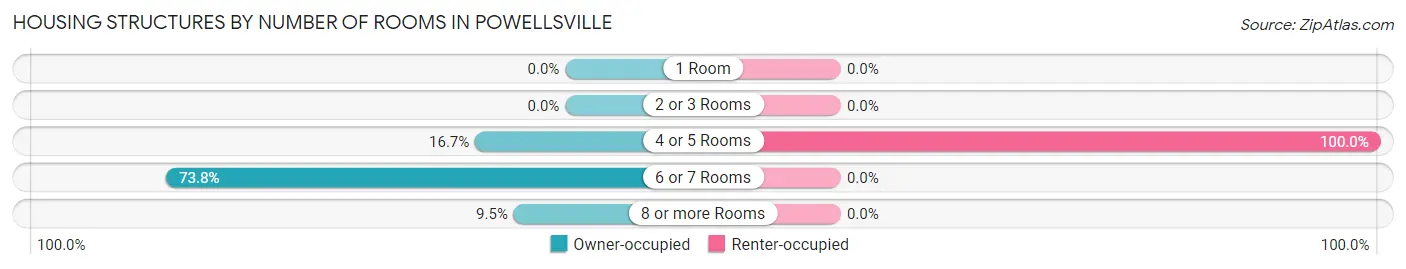
| Number of Rooms | Owner-occupied | Renter-occupied |
| 1 Room | 0 (0.0%) | 0 (0.0%) |
| 2 or 3 Rooms | 0 (0.0%) | 0 (0.0%) |
| 4 or 5 Rooms | 14 (16.7%) | 7 (100.0%) |
| 6 or 7 Rooms | 62 (73.8%) | 0 (0.0%) |
| 8 or more Rooms | 8 (9.5%) | 0 (0.0%) |
| Total | 84 (100.0%) | 7 (100.0%) |
Housing Structure by Heating Type in Powellsville
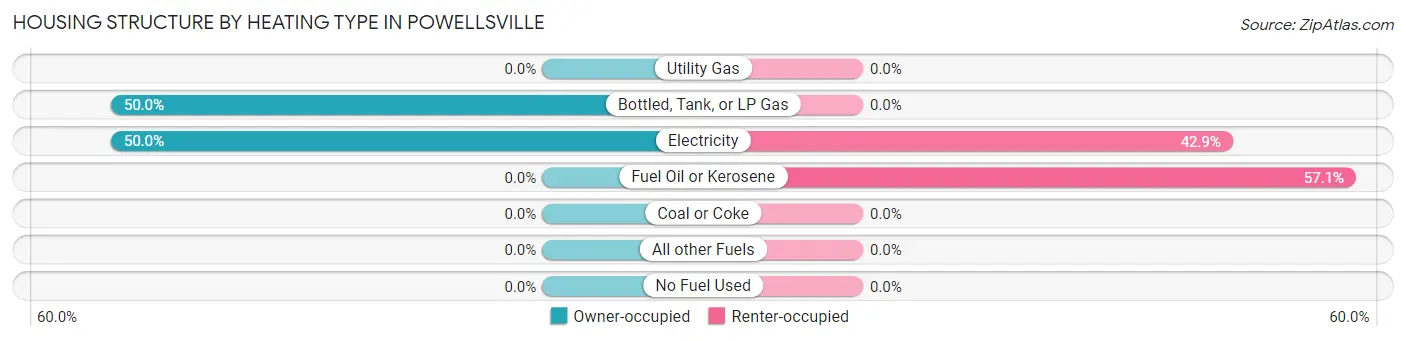
| Heating Type | Owner-occupied | Renter-occupied |
| Utility Gas | 0 (0.0%) | 0 (0.0%) |
| Bottled, Tank, or LP Gas | 42 (50.0%) | 0 (0.0%) |
| Electricity | 42 (50.0%) | 3 (42.9%) |
| Fuel Oil or Kerosene | 0 (0.0%) | 4 (57.1%) |
| Coal or Coke | 0 (0.0%) | 0 (0.0%) |
| All other Fuels | 0 (0.0%) | 0 (0.0%) |
| No Fuel Used | 0 (0.0%) | 0 (0.0%) |
| Total | 84 (100.0%) | 7 (100.0%) |
Household Vehicle Usage in Powellsville
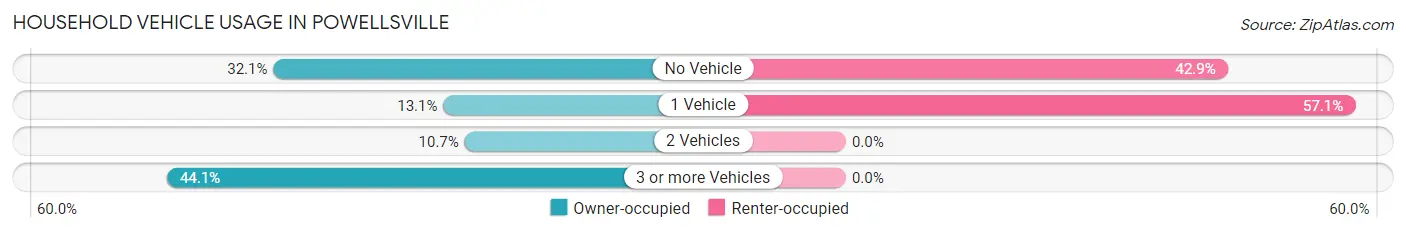
| Vehicles per Household | Owner-occupied | Renter-occupied |
| No Vehicle | 27 (32.1%) | 3 (42.9%) |
| 1 Vehicle | 11 (13.1%) | 4 (57.1%) |
| 2 Vehicles | 9 (10.7%) | 0 (0.0%) |
| 3 or more Vehicles | 37 (44.1%) | 0 (0.0%) |
| Total | 84 (100.0%) | 7 (100.0%) |
Real Estate & Mortgages in Powellsville
Real Estate and Mortgage Overview in Powellsville
| Characteristic | Without Mortgage | With Mortgage |
| Housing Units | 46 | 38 |
| Median Property Value | $161,800 | $77,000 |
| Median Household Income | $50,809 | $0 |
| Monthly Housing Costs | $282 | $0 |
| Real Estate Taxes | $912 | $0 |
Property Value by Mortgage Status in Powellsville
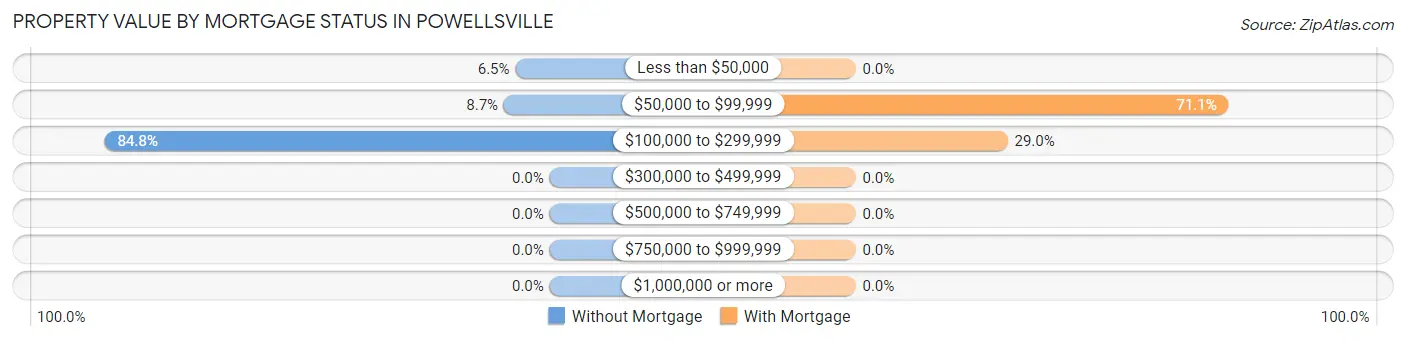
| Property Value | Without Mortgage | With Mortgage |
| Less than $50,000 | 3 (6.5%) | 0 (0.0%) |
| $50,000 to $99,999 | 4 (8.7%) | 27 (71.1%) |
| $100,000 to $299,999 | 39 (84.8%) | 11 (28.9%) |
| $300,000 to $499,999 | 0 (0.0%) | 0 (0.0%) |
| $500,000 to $749,999 | 0 (0.0%) | 0 (0.0%) |
| $750,000 to $999,999 | 0 (0.0%) | 0 (0.0%) |
| $1,000,000 or more | 0 (0.0%) | 0 (0.0%) |
| Total | 46 (100.0%) | 38 (100.0%) |
Household Income by Mortgage Status in Powellsville
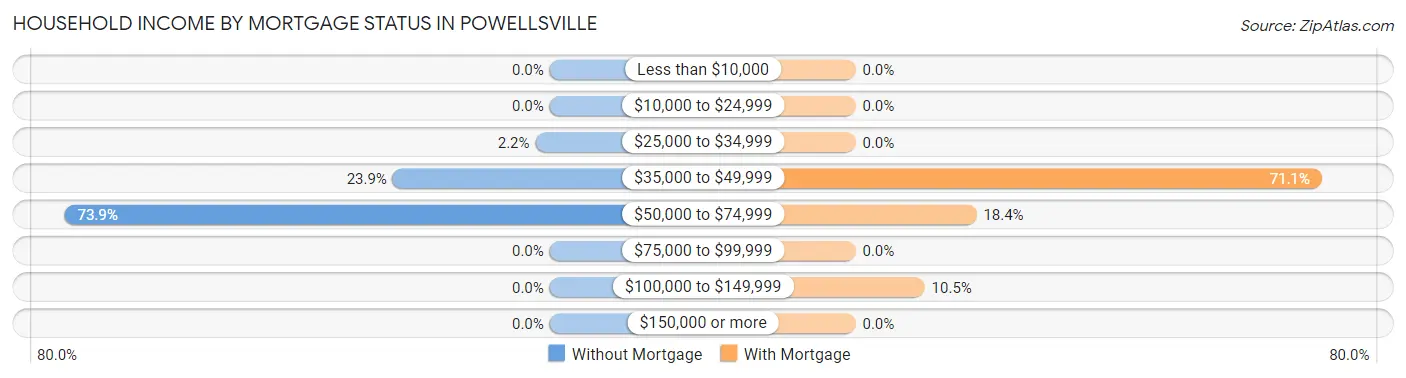
| Household Income | Without Mortgage | With Mortgage |
| Less than $10,000 | 0 (0.0%) | 0 (0.0%) |
| $10,000 to $24,999 | 0 (0.0%) | 0 (0.0%) |
| $25,000 to $34,999 | 1 (2.2%) | 0 (0.0%) |
| $35,000 to $49,999 | 11 (23.9%) | 27 (71.1%) |
| $50,000 to $74,999 | 34 (73.9%) | 7 (18.4%) |
| $75,000 to $99,999 | 0 (0.0%) | 0 (0.0%) |
| $100,000 to $149,999 | 0 (0.0%) | 4 (10.5%) |
| $150,000 or more | 0 (0.0%) | 0 (0.0%) |
| Total | 46 (100.0%) | 38 (100.0%) |
Property Value to Household Income Ratio in Powellsville
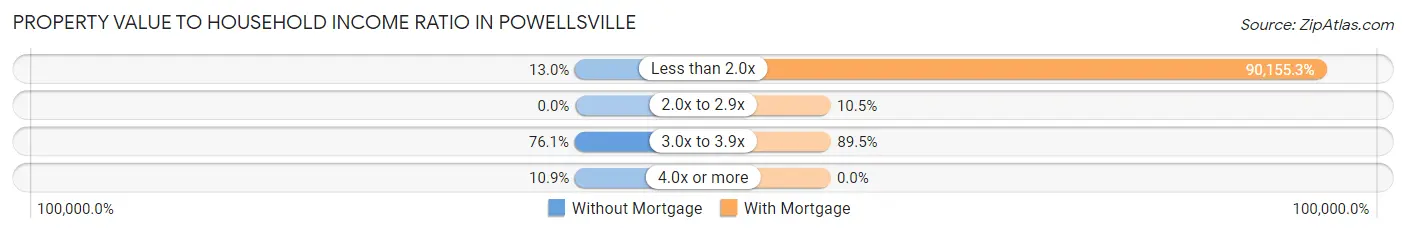
| Value-to-Income Ratio | Without Mortgage | With Mortgage |
| Less than 2.0x | 6 (13.0%) | 34,259 (90,155.3%) |
| 2.0x to 2.9x | 0 (0.0%) | 4 (10.5%) |
| 3.0x to 3.9x | 35 (76.1%) | 34 (89.5%) |
| 4.0x or more | 5 (10.9%) | 0 (0.0%) |
| Total | 46 (100.0%) | 38 (100.0%) |
Real Estate Taxes by Mortgage Status in Powellsville
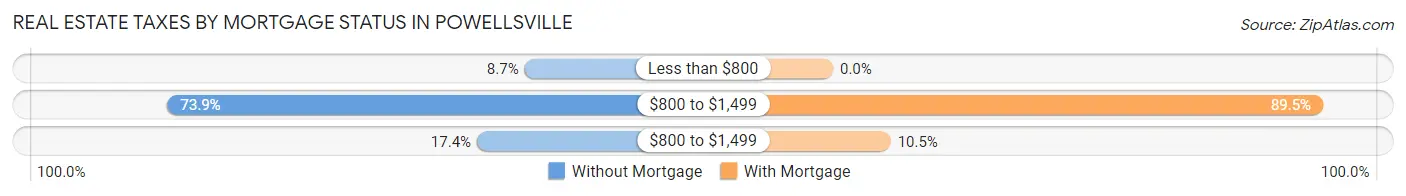
| Property Taxes | Without Mortgage | With Mortgage |
| Less than $800 | 4 (8.7%) | 0 (0.0%) |
| $800 to $1,499 | 34 (73.9%) | 34 (89.5%) |
| $800 to $1,499 | 8 (17.4%) | 4 (10.5%) |
| Total | 46 (100.0%) | 38 (100.0%) |
Health & Disability in Powellsville
Health Insurance Coverage by Age in Powellsville
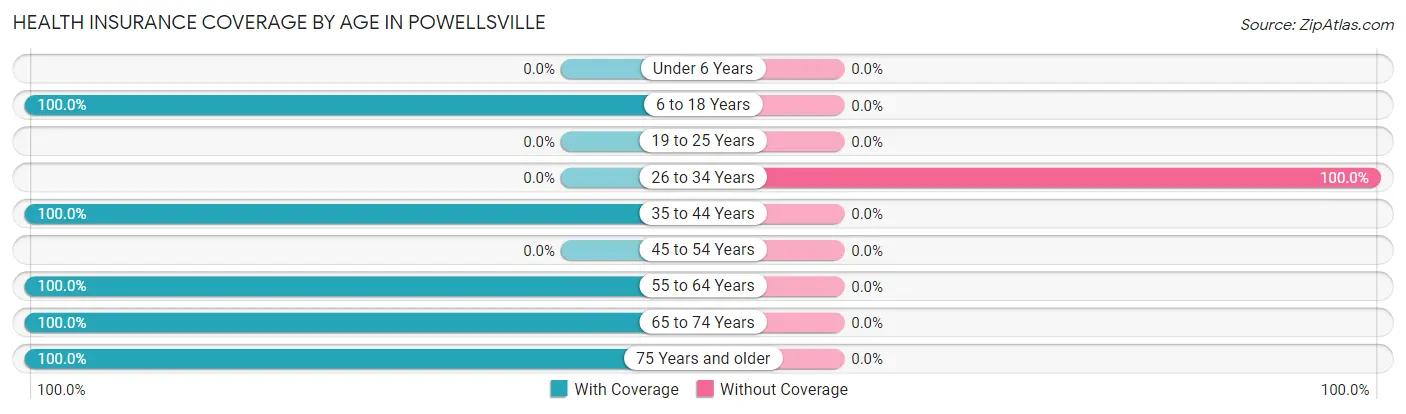
| Age Bracket | With Coverage | Without Coverage |
| Under 6 Years | 0 (0.0%) | 0 (0.0%) |
| 6 to 18 Years | 11 (100.0%) | 0 (0.0%) |
| 19 to 25 Years | 0 (0.0%) | 0 (0.0%) |
| 26 to 34 Years | 0 (0.0%) | 4 (100.0%) |
| 35 to 44 Years | 9 (100.0%) | 0 (0.0%) |
| 45 to 54 Years | 0 (0.0%) | 0 (0.0%) |
| 55 to 64 Years | 9 (100.0%) | 0 (0.0%) |
| 65 to 74 Years | 98 (100.0%) | 0 (0.0%) |
| 75 Years and older | 30 (100.0%) | 0 (0.0%) |
| Total | 157 (97.5%) | 4 (2.5%) |
Health Insurance Coverage by Citizenship Status in Powellsville
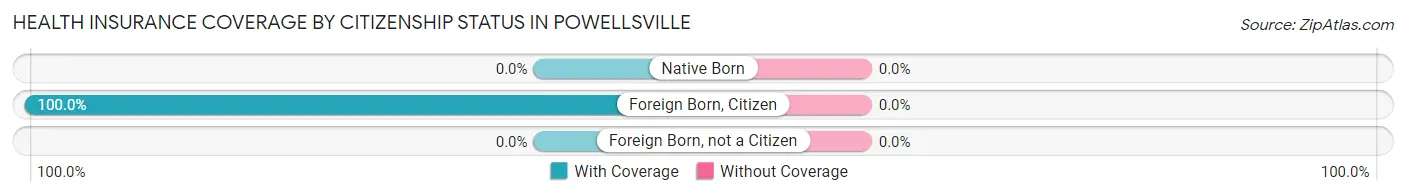
| Citizenship Status | With Coverage | Without Coverage |
| Native Born | 0 (0.0%) | 0 (0.0%) |
| Foreign Born, Citizen | 11 (100.0%) | 0 (0.0%) |
| Foreign Born, not a Citizen | 0 (0.0%) | 0 (0.0%) |
Health Insurance Coverage by Household Income in Powellsville
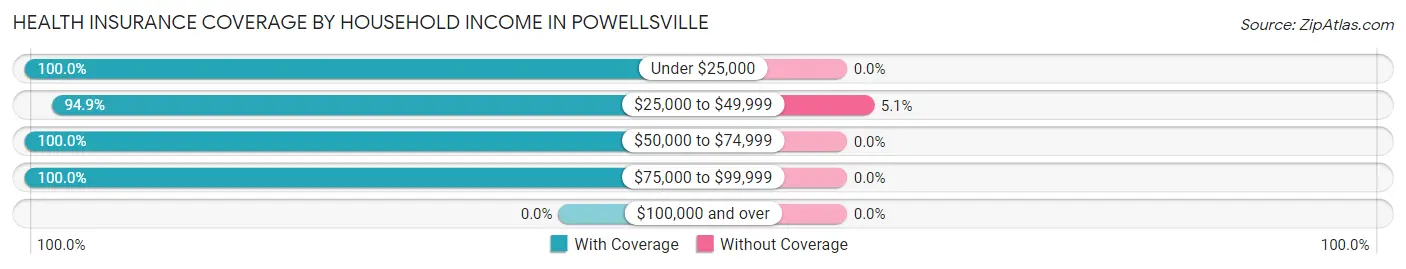
| Household Income | With Coverage | Without Coverage |
| Under $25,000 | 3 (100.0%) | 0 (0.0%) |
| $25,000 to $49,999 | 75 (94.9%) | 4 (5.1%) |
| $50,000 to $74,999 | 70 (100.0%) | 0 (0.0%) |
| $75,000 to $99,999 | 9 (100.0%) | 0 (0.0%) |
| $100,000 and over | 0 (0.0%) | 0 (0.0%) |
Public vs Private Health Insurance Coverage by Age in Powellsville
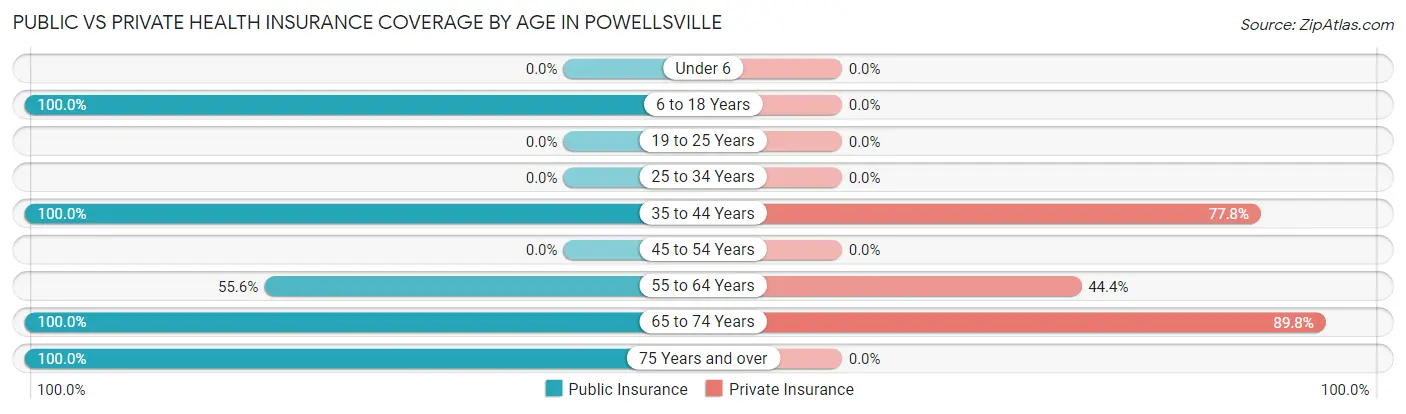
| Age Bracket | Public Insurance | Private Insurance |
| Under 6 | 0 (0.0%) | 0 (0.0%) |
| 6 to 18 Years | 11 (100.0%) | 0 (0.0%) |
| 19 to 25 Years | 0 (0.0%) | 0 (0.0%) |
| 25 to 34 Years | 0 (0.0%) | 0 (0.0%) |
| 35 to 44 Years | 9 (100.0%) | 7 (77.8%) |
| 45 to 54 Years | 0 (0.0%) | 0 (0.0%) |
| 55 to 64 Years | 5 (55.6%) | 4 (44.4%) |
| 65 to 74 Years | 98 (100.0%) | 88 (89.8%) |
| 75 Years and over | 30 (100.0%) | 0 (0.0%) |
| Total | 153 (95.0%) | 99 (61.5%) |
Disability Status by Sex by Age in Powellsville
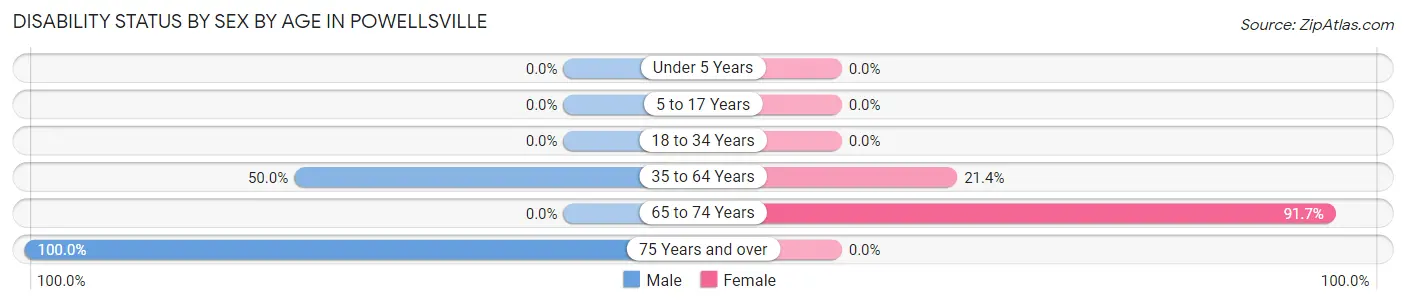
| Age Bracket | Male | Female |
| Under 5 Years | 0 (0.0%) | 0 (0.0%) |
| 5 to 17 Years | 0 (0.0%) | 0 (0.0%) |
| 18 to 34 Years | 0 (0.0%) | 0 (0.0%) |
| 35 to 64 Years | 2 (50.0%) | 3 (21.4%) |
| 65 to 74 Years | 0 (0.0%) | 44 (91.7%) |
| 75 Years and over | 27 (100.0%) | 0 (0.0%) |
Disability Class by Sex by Age in Powellsville
Disability Class: Hearing Difficulty
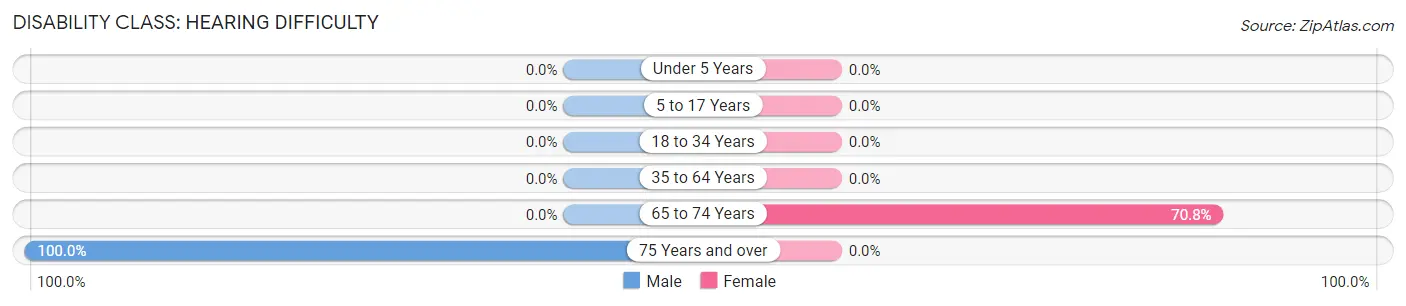
| Age Bracket | Male | Female |
| Under 5 Years | 0 (0.0%) | 0 (0.0%) |
| 5 to 17 Years | 0 (0.0%) | 0 (0.0%) |
| 18 to 34 Years | 0 (0.0%) | 0 (0.0%) |
| 35 to 64 Years | 0 (0.0%) | 0 (0.0%) |
| 65 to 74 Years | 0 (0.0%) | 34 (70.8%) |
| 75 Years and over | 27 (100.0%) | 0 (0.0%) |
Disability Class: Vision Difficulty
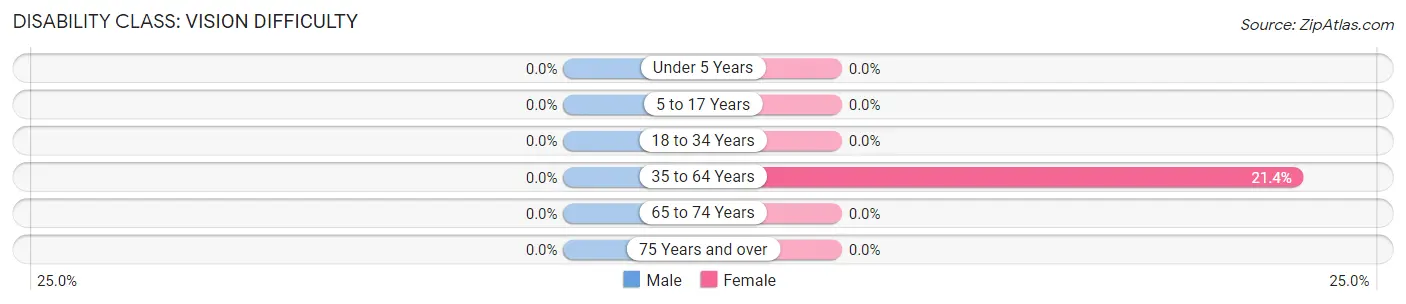
| Age Bracket | Male | Female |
| Under 5 Years | 0 (0.0%) | 0 (0.0%) |
| 5 to 17 Years | 0 (0.0%) | 0 (0.0%) |
| 18 to 34 Years | 0 (0.0%) | 0 (0.0%) |
| 35 to 64 Years | 0 (0.0%) | 3 (21.4%) |
| 65 to 74 Years | 0 (0.0%) | 0 (0.0%) |
| 75 Years and over | 0 (0.0%) | 0 (0.0%) |
Disability Class: Cognitive Difficulty
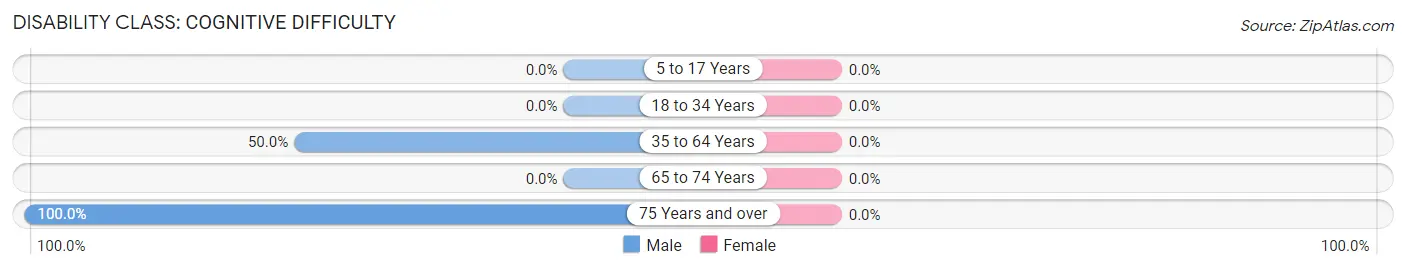
| Age Bracket | Male | Female |
| 5 to 17 Years | 0 (0.0%) | 0 (0.0%) |
| 18 to 34 Years | 0 (0.0%) | 0 (0.0%) |
| 35 to 64 Years | 2 (50.0%) | 0 (0.0%) |
| 65 to 74 Years | 0 (0.0%) | 0 (0.0%) |
| 75 Years and over | 27 (100.0%) | 0 (0.0%) |
Disability Class: Ambulatory Difficulty
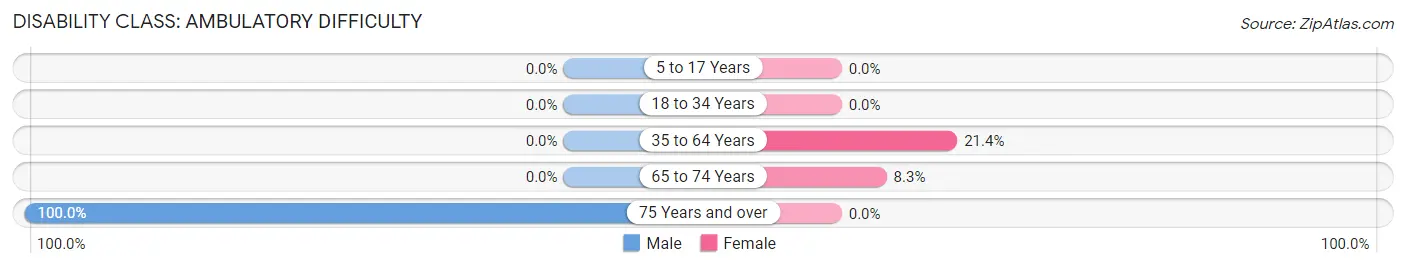
| Age Bracket | Male | Female |
| 5 to 17 Years | 0 (0.0%) | 0 (0.0%) |
| 18 to 34 Years | 0 (0.0%) | 0 (0.0%) |
| 35 to 64 Years | 0 (0.0%) | 3 (21.4%) |
| 65 to 74 Years | 0 (0.0%) | 4 (8.3%) |
| 75 Years and over | 27 (100.0%) | 0 (0.0%) |
Disability Class: Self-Care Difficulty
| Age Bracket | Male | Female |
| 5 to 17 Years | 0 (0.0%) | 0 (0.0%) |
| 18 to 34 Years | 0 (0.0%) | 0 (0.0%) |
| 35 to 64 Years | 0 (0.0%) | 0 (0.0%) |
| 65 to 74 Years | 0 (0.0%) | 0 (0.0%) |
| 75 Years and over | 0 (0.0%) | 0 (0.0%) |
Technology Access in Powellsville
Computing Device Access in Powellsville
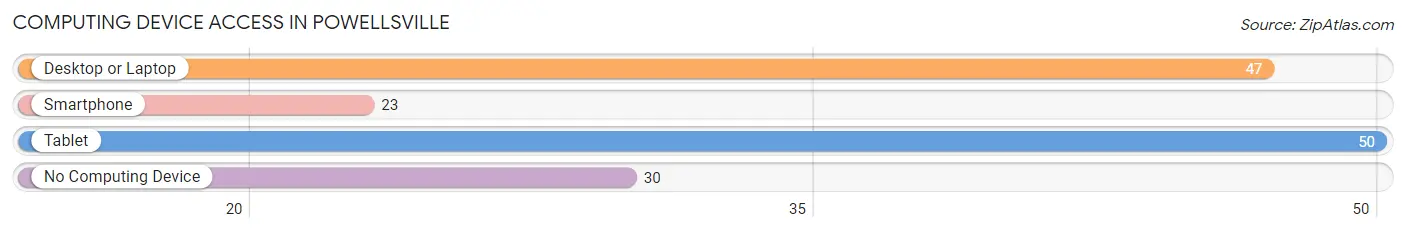
| Device Type | # Households | % Households |
| Desktop or Laptop | 47 | 51.6% |
| Smartphone | 23 | 25.3% |
| Tablet | 50 | 54.9% |
| No Computing Device | 30 | 33.0% |
| Total | 91 | 100.0% |
Internet Access in Powellsville
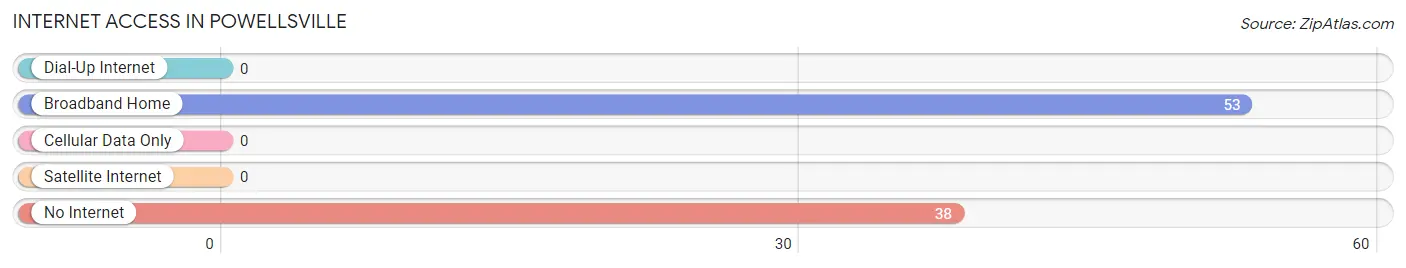
| Internet Type | # Households | % Households |
| Dial-Up Internet | 0 | 0.0% |
| Broadband Home | 53 | 58.2% |
| Cellular Data Only | 0 | 0.0% |
| Satellite Internet | 0 | 0.0% |
| No Internet | 38 | 41.8% |
| Total | 91 | 100.0% |
Powellsville Summary
Powellsville is a small town located in Northampton County, North Carolina. It is situated in the northeastern part of the state, about 30 miles from the Virginia border. The town has a population of approximately 1,000 people and is part of the Roanoke Rapids Micropolitan Statistical Area.
History
Powellsville was founded in 1883 by William Powell, a former slave who had purchased his freedom. He named the town after himself and it quickly became a thriving community. The town was incorporated in 1887 and soon became a center of commerce for the surrounding area. The town was home to several businesses, including a general store, a sawmill, a gristmill, and a cotton gin.
In the early 1900s, the town began to decline as the railroad bypassed it and the economy shifted away from agriculture. The town was nearly abandoned by the 1950s, but in the 1970s, the town began to experience a resurgence. The town was revitalized with the opening of a new school, a library, and a community center.
Geography
Powellsville is located in the northeastern part of Northampton County, about 30 miles from the Virginia border. The town is situated on the Roanoke River, which flows through the town and provides a source of recreation for the residents. The town is surrounded by farmland and is located near the Great Dismal Swamp National Wildlife Refuge.
The town has a humid subtropical climate, with hot, humid summers and mild winters. The average annual temperature is around 70 degrees Fahrenheit, with an average high of around 90 degrees in the summer and an average low of around 50 degrees in the winter.
Economy
The economy of Powellsville is largely based on agriculture. The town is home to several farms, which produce a variety of crops, including corn, soybeans, and cotton. The town is also home to several small businesses, including a general store, a sawmill, and a gristmill.
The town is also home to several manufacturing companies, including a furniture factory and a textile mill. The town is also home to a number of small businesses, including restaurants, shops, and a movie theater.
Demographics
As of the 2010 census, the population of Powellsville was 1,000 people. The town is predominantly white, with a small African American population. The median household income is around $30,000, and the median home value is around $90,000. The town has a low unemployment rate and a high rate of homeownership.
Conclusion
Powellsville is a small town located in Northampton County, North Carolina. It was founded in 1883 by William Powell, a former slave who had purchased his freedom. The town has a population of approximately 1,000 people and is part of the Roanoke Rapids Micropolitan Statistical Area. The town has a humid subtropical climate and is surrounded by farmland. The economy of Powellsville is largely based on agriculture, with several farms producing a variety of crops. The town is also home to several small businesses, including a general store, a sawmill, and a gristmill. The population of Powellsville is predominantly white, with a small African American population. The median household income is around $30,000, and the median home value is around $90,000. The town has a low unemployment rate and a high rate of homeownership.
Common Questions
What is the Total Population of Powellsville?
Total Population of Powellsville is 161.
What is the Total Male Population of Powellsville?
Total Male Population of Powellsville is 91.
What is the Total Female Population of Powellsville?
Total Female Population of Powellsville is 70.
What is the Ratio of Males per 100 Females in Powellsville?
There are 130.00 Males per 100 Females in Powellsville.
What is the Ratio of Females per 100 Males in Powellsville?
There are 76.92 Females per 100 Males in Powellsville.
What is the Median Population Age in Powellsville?
Median Population Age in Powellsville is 71.3 Years.
What is the Average Family Size in Powellsville
Average Family Size in Powellsville is 2.2 People.
What is the Average Household Size in Powellsville
Average Household Size in Powellsville is 1.8 People.
What is Per Capita Income in Powellsville?
Per Capita income in Powellsville is $25,403.
What is the Median Family Income in Powellsville?
Median Family Income in Powellsville is $50,772.
What is the Median Household income in Powellsville?
Median Household Income in Powellsville is $42,188.
What is Inequality or Gini Index in Powellsville?
Inequality or Gini Index in Powellsville is 0.13.
How Large is the Labor Force in Powellsville?
There are 20 People in the Labor Forcein in Powellsville.
What is the Percentage of People in the Labor Force in Powellsville?
12.8% of People are in the Labor Force in Powellsville.