Middlesex, NC
Middlesex Map
Middlesex Overview
963
TOTAL POPULATION
440
MALE POPULATION
523
FEMALE POPULATION
84.13
MALES / 100 FEMALES
118.86
FEMALES / 100 MALES
39.9
MEDIAN AGE
3.4
AVG FAMILY SIZE
2.2
AVG HOUSEHOLD SIZE
$26,437
PER CAPITA INCOME
$66,250
AVG FAMILY INCOME
$42,917
AVG HOUSEHOLD INCOME
6.0%
WAGE / INCOME GAP [ % ]
94.0¢/ $1
WAGE / INCOME GAP [ $ ]
0.44
INEQUALITY / GINI INDEX
501
LABOR FORCE [ PEOPLE ]
62.9%
PERCENT IN LABOR FORCE
0.8%
UNEMPLOYMENT RATE
Middlesex Zip Codes
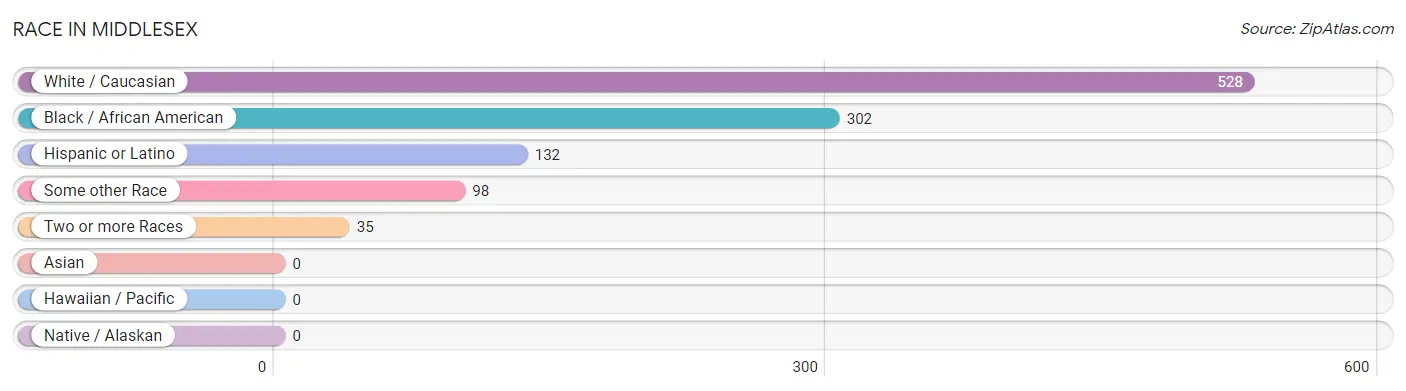
Race in Middlesex
The most populous races in Middlesex are White / Caucasian (528 | 54.8%), Black / African American (302 | 31.4%), and Hispanic or Latino (132 | 13.7%).
| Race | # Population | % Population |
| Asian | 0 | 0.0% |
| Black / African American | 302 | 31.4% |
| Hawaiian / Pacific | 0 | 0.0% |
| Hispanic or Latino | 132 | 13.7% |
| Native / Alaskan | 0 | 0.0% |
| White / Caucasian | 528 | 54.8% |
| Two or more Races | 35 | 3.6% |
| Some other Race | 98 | 10.2% |
| Total | 963 | 100.0% |
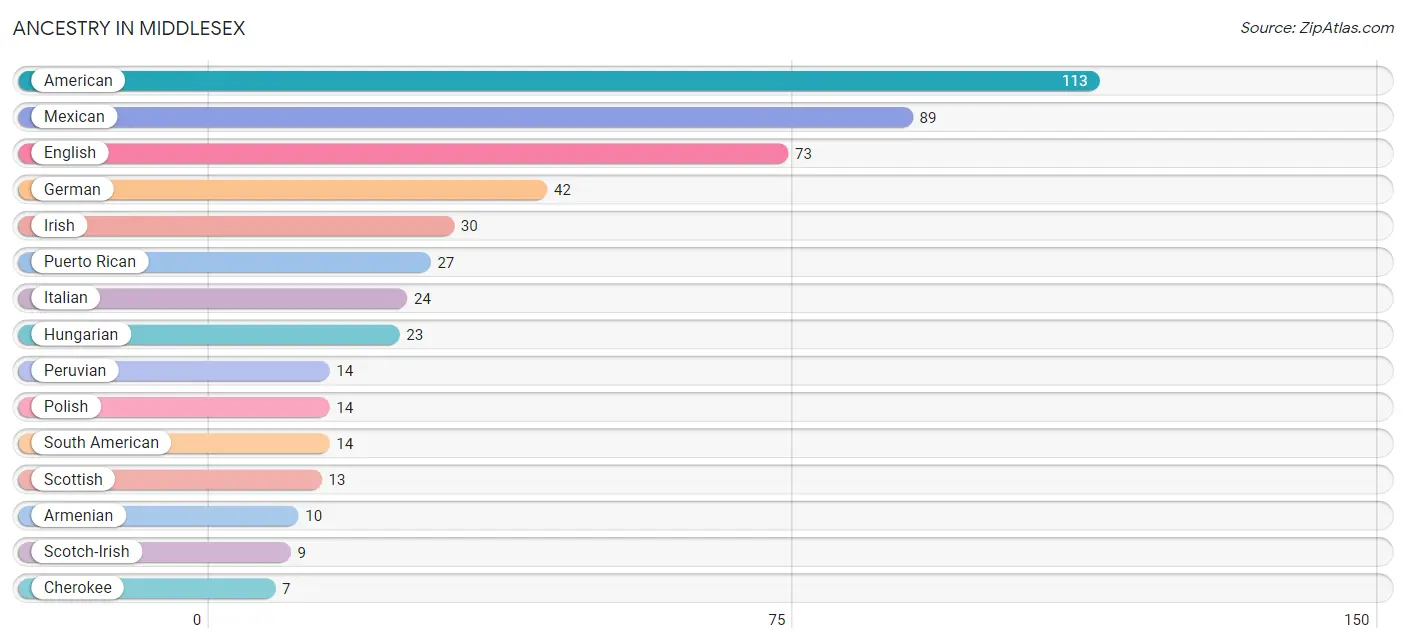
Ancestry in Middlesex
The most populous ancestries reported in Middlesex are American (113 | 11.7%), Mexican (89 | 9.2%), English (73 | 7.6%), German (42 | 4.4%), and Irish (30 | 3.1%), together accounting for 36.0% of all Middlesex residents.
| Ancestry | # Population | % Population |
| American | 113 | 11.7% |
| Armenian | 10 | 1.0% |
| Cherokee | 7 | 0.7% |
| Czech | 4 | 0.4% |
| Dominican | 2 | 0.2% |
| English | 73 | 7.6% |
| French | 2 | 0.2% |
| French American Indian | 5 | 0.5% |
| German | 42 | 4.4% |
| Greek | 6 | 0.6% |
| Hungarian | 23 | 2.4% |
| Irish | 30 | 3.1% |
| Italian | 24 | 2.5% |
| Mexican | 89 | 9.2% |
| Peruvian | 14 | 1.5% |
| Polish | 14 | 1.5% |
| Puerto Rican | 27 | 2.8% |
| Scotch-Irish | 9 | 0.9% |
| Scottish | 13 | 1.3% |
| South American | 14 | 1.5% |
| Welsh | 6 | 0.6% | View All 21 Rows |
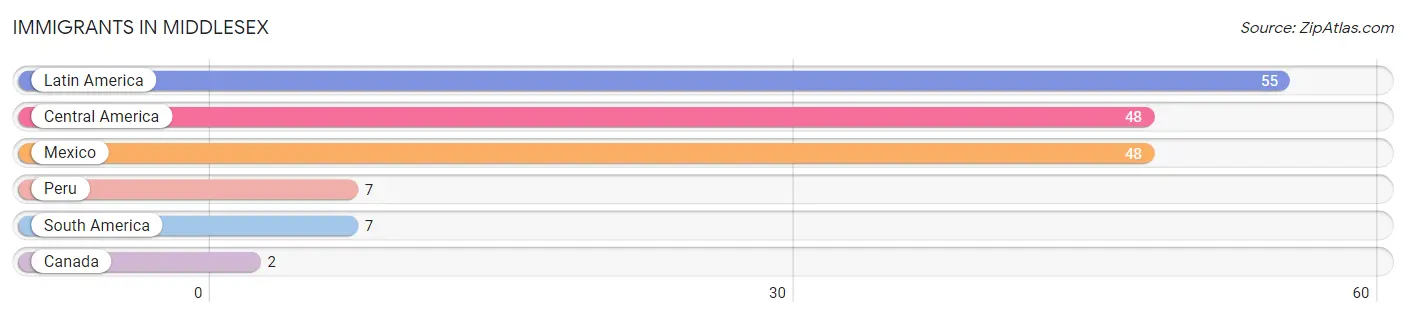
Immigrants in Middlesex
The most numerous immigrant groups reported in Middlesex came from Latin America (55 | 5.7%), Central America (48 | 5.0%), Mexico (48 | 5.0%), Peru (7 | 0.7%), and South America (7 | 0.7%), together accounting for 17.1% of all Middlesex residents.
| Immigration Origin | # Population | % Population |
| Canada | 2 | 0.2% |
| Central America | 48 | 5.0% |
| Latin America | 55 | 5.7% |
| Mexico | 48 | 5.0% |
| Peru | 7 | 0.7% |
| South America | 7 | 0.7% | View All 6 Rows |
Sex and Age in Middlesex
Sex and Age in Middlesex
The most populous age groups in Middlesex are 55 to 59 Years (63 | 14.3%) for men and 55 to 59 Years (66 | 12.6%) for women.
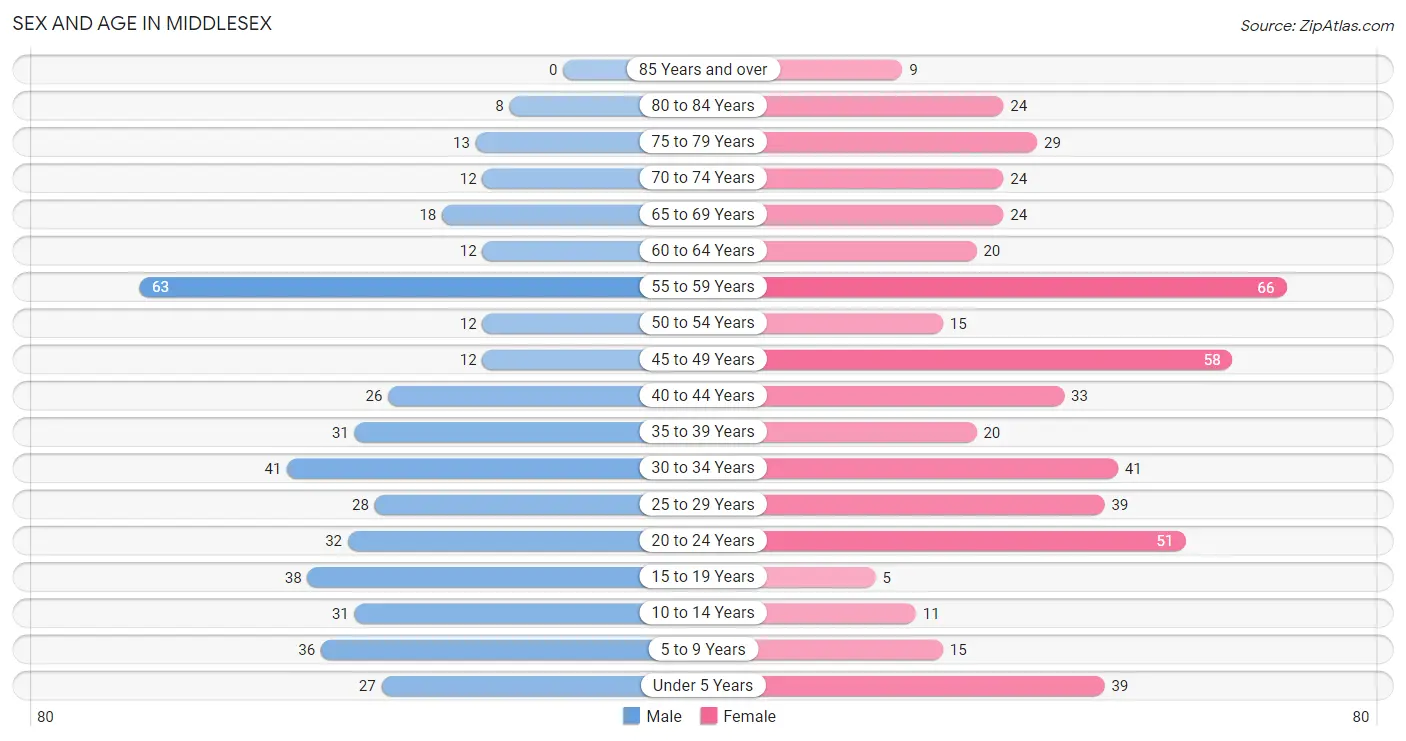
| Age Bracket | Male | Female |
| Under 5 Years | 27 (6.1%) | 39 (7.5%) |
| 5 to 9 Years | 36 (8.2%) | 15 (2.9%) |
| 10 to 14 Years | 31 (7.0%) | 11 (2.1%) |
| 15 to 19 Years | 38 (8.6%) | 5 (1.0%) |
| 20 to 24 Years | 32 (7.3%) | 51 (9.8%) |
| 25 to 29 Years | 28 (6.4%) | 39 (7.5%) |
| 30 to 34 Years | 41 (9.3%) | 41 (7.8%) |
| 35 to 39 Years | 31 (7.0%) | 20 (3.8%) |
| 40 to 44 Years | 26 (5.9%) | 33 (6.3%) |
| 45 to 49 Years | 12 (2.7%) | 58 (11.1%) |
| 50 to 54 Years | 12 (2.7%) | 15 (2.9%) |
| 55 to 59 Years | 63 (14.3%) | 66 (12.6%) |
| 60 to 64 Years | 12 (2.7%) | 20 (3.8%) |
| 65 to 69 Years | 18 (4.1%) | 24 (4.6%) |
| 70 to 74 Years | 12 (2.7%) | 24 (4.6%) |
| 75 to 79 Years | 13 (2.9%) | 29 (5.5%) |
| 80 to 84 Years | 8 (1.8%) | 24 (4.6%) |
| 85 Years and over | 0 (0.0%) | 9 (1.7%) |
| Total | 440 (100.0%) | 523 (100.0%) |
Families and Households in Middlesex
Median Family Size in Middlesex
The median family size in Middlesex is 3.35 persons per family, with single male/father families (33 | 15.5%) accounting for the largest median family size of 4.21 persons per family. On the other hand, single female/mother families (38 | 17.8%) represent the smallest median family size with 3.00 persons per family.
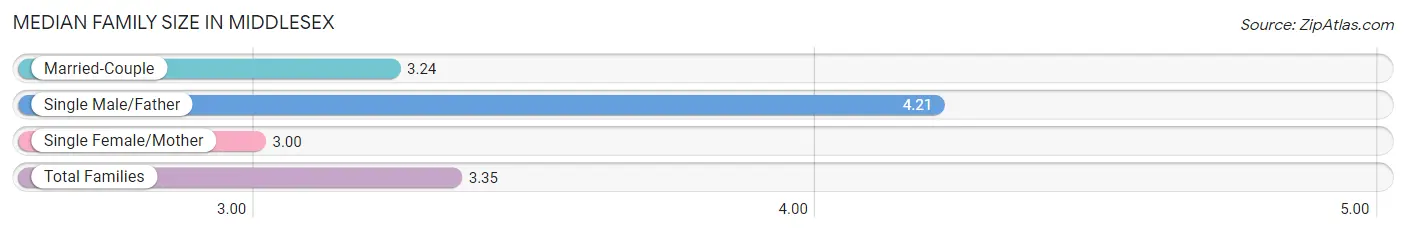
| Family Type | # Families | Family Size |
| Married-Couple | 142 (66.7%) | 3.24 |
| Single Male/Father | 33 (15.5%) | 4.21 |
| Single Female/Mother | 38 (17.8%) | 3.00 |
| Total Families | 213 (100.0%) | 3.35 |
Median Household Size in Middlesex
The median household size in Middlesex is 2.22 persons per household, with single male/father households (33 | 7.6%) accounting for the largest median household size of 4.21 persons per household. non-family households (220 | 50.8%) represent the smallest median household size with 1.11 persons per household.
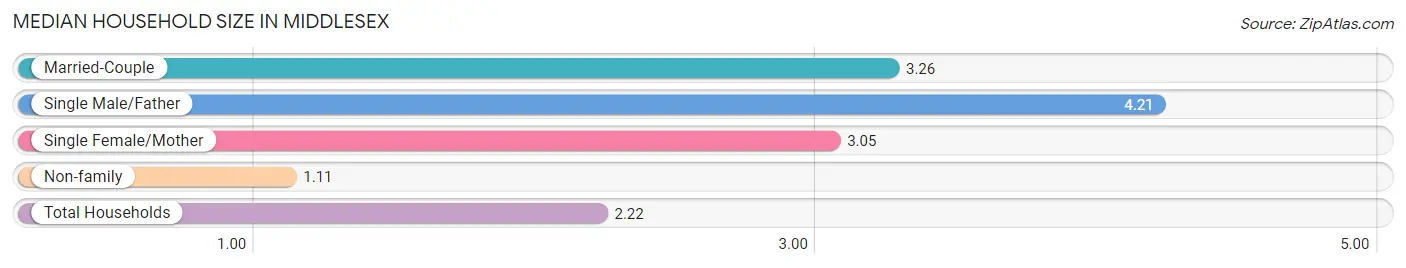
| Household Type | # Households | Household Size |
| Married-Couple | 142 (32.8%) | 3.26 |
| Single Male/Father | 33 (7.6%) | 4.21 |
| Single Female/Mother | 38 (8.8%) | 3.05 |
| Non-family | 220 (50.8%) | 1.11 |
| Total Households | 433 (100.0%) | 2.22 |
Household Size by Marriage Status in Middlesex
Out of a total of 433 households in Middlesex, 213 (49.2%) are family households, while 220 (50.8%) are nonfamily households. The most numerous type of family households are 2-person households, comprising 111, and the most common type of nonfamily households are 1-person households, comprising 187.
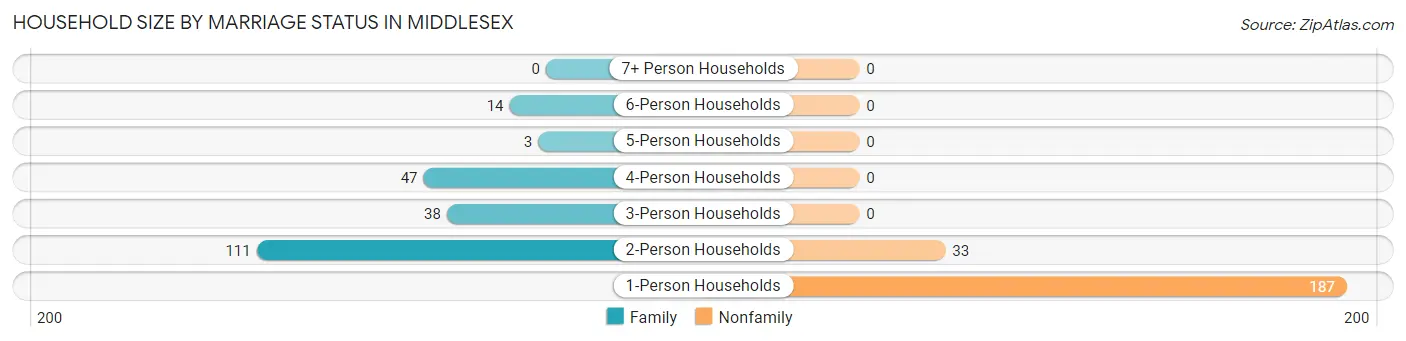
| Household Size | Family Households | Nonfamily Households |
| 1-Person Households | - | 187 (43.2%) |
| 2-Person Households | 111 (25.6%) | 33 (7.6%) |
| 3-Person Households | 38 (8.8%) | 0 (0.0%) |
| 4-Person Households | 47 (10.8%) | 0 (0.0%) |
| 5-Person Households | 3 (0.7%) | 0 (0.0%) |
| 6-Person Households | 14 (3.2%) | 0 (0.0%) |
| 7+ Person Households | 0 (0.0%) | 0 (0.0%) |
| Total | 213 (49.2%) | 220 (50.8%) |
Female Fertility in Middlesex
Fertility by Age in Middlesex
Average fertility rate in Middlesex is 32.0 births per 1,000 women. Women in the age bracket of 20 to 34 years have the highest fertility rate with 61.0 births per 1,000 women. Women in the age bracket of 20 to 34 years acount for 100.0% of all women with births.
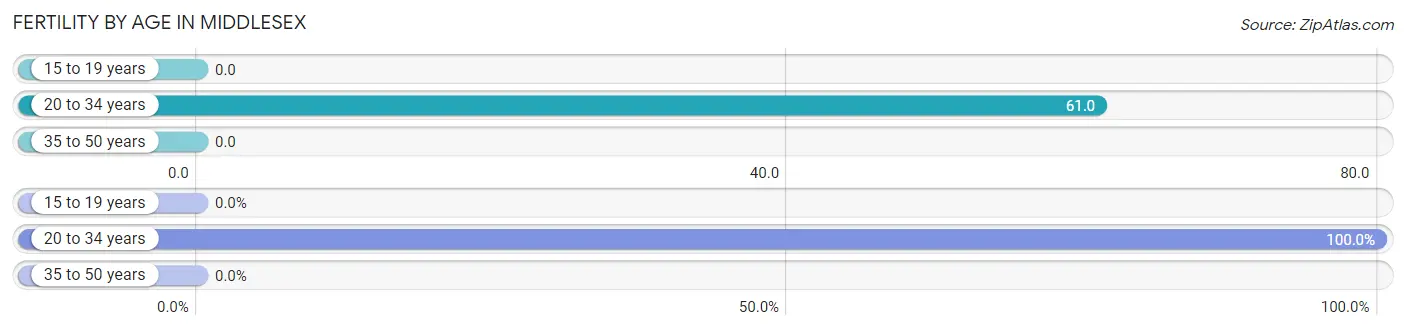
| Age Bracket | Women with Births | Births / 1,000 Women |
| 15 to 19 years | 0 (0.0%) | 0.0 |
| 20 to 34 years | 8 (100.0%) | 61.0 |
| 35 to 50 years | 0 (0.0%) | 0.0 |
| Total | 8 (100.0%) | 32.0 |
Fertility by Age by Marriage Status in Middlesex
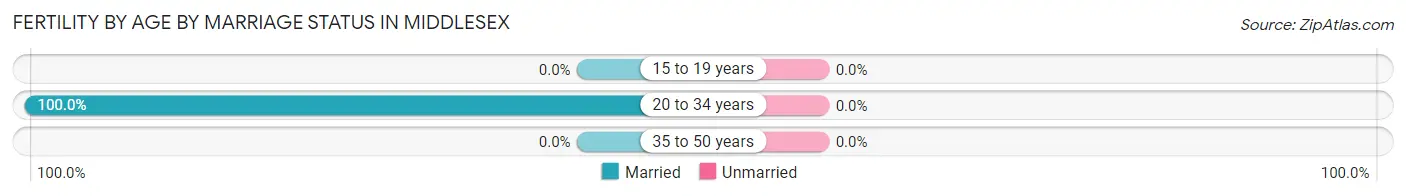
| Age Bracket | Married | Unmarried |
| 15 to 19 years | 0 (0.0%) | 0 (0.0%) |
| 20 to 34 years | 8 (100.0%) | 0 (0.0%) |
| 35 to 50 years | 0 (0.0%) | 0 (0.0%) |
| Total | 8 (100.0%) | 0 (0.0%) |
Fertility by Education in Middlesex
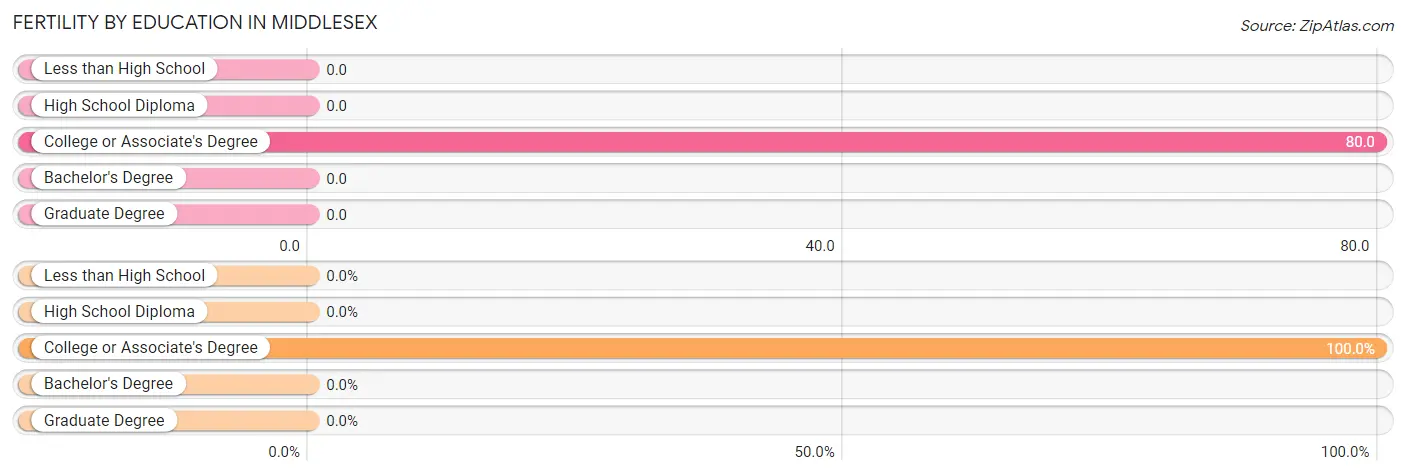
| Educational Attainment | Women with Births | Births / 1,000 Women |
| Less than High School | 0 (0.0%) | 0.0 |
| High School Diploma | 0 (0.0%) | 0.0 |
| College or Associate's Degree | 8 (100.0%) | 80.0 |
| Bachelor's Degree | 0 (0.0%) | 0.0 |
| Graduate Degree | 0 (0.0%) | 0.0 |
| Total | 8 (100.0%) | 32.0 |
Fertility by Education by Marriage Status in Middlesex
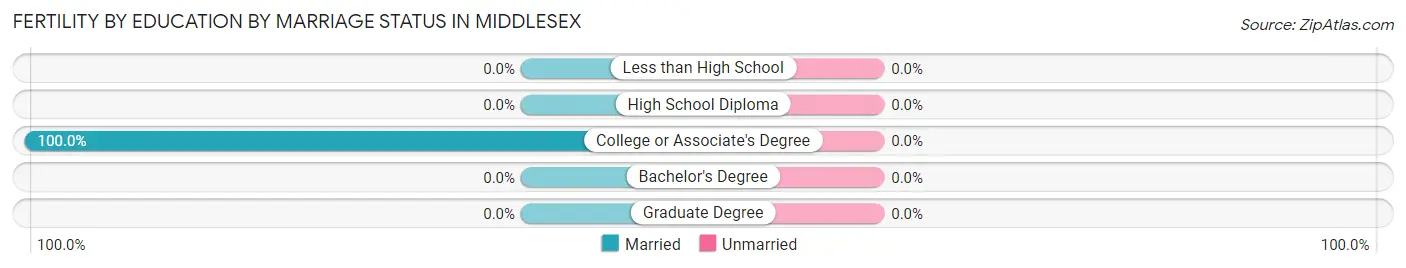
| Educational Attainment | Married | Unmarried |
| Less than High School | 0 (0.0%) | 0 (0.0%) |
| High School Diploma | 0 (0.0%) | 0 (0.0%) |
| College or Associate's Degree | 8 (100.0%) | 0 (0.0%) |
| Bachelor's Degree | 0 (0.0%) | 0 (0.0%) |
| Graduate Degree | 0 (0.0%) | 0 (0.0%) |
| Total | 8 (100.0%) | 0 (0.0%) |
Income in Middlesex
Income Overview in Middlesex
Per Capita Income in Middlesex is $26,437, while median incomes of families and households are $66,250 and $42,917 respectively.
| Characteristic | Number | Measure |
| Per Capita Income | 963 | $26,437 |
| Median Family Income | 213 | $66,250 |
| Mean Family Income | 213 | $80,424 |
| Median Household Income | 433 | $42,917 |
| Mean Household Income | 433 | $56,818 |
| Income Deficit | 213 | $0 |
| Wage / Income Gap (%) | 963 | 5.98% |
| Wage / Income Gap ($) | 963 | 94.02¢ per $1 |
| Gini / Inequality Index | 963 | 0.44 |
Earnings by Sex in Middlesex
Average Earnings in Middlesex are $29,640, $31,161 for men and $29,298 for women, a difference of 6.0%.
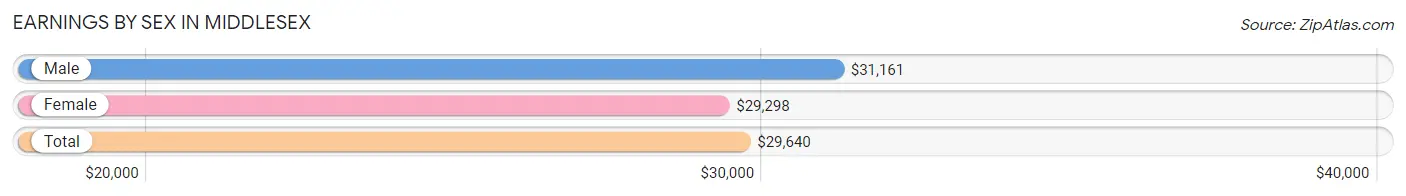
| Sex | Number | Average Earnings |
| Male | 245 (47.8%) | $31,161 |
| Female | 268 (52.2%) | $29,298 |
| Total | 513 (100.0%) | $29,640 |
Earnings by Sex by Income Bracket in Middlesex
The most common earnings brackets in Middlesex are $30,000 to $34,999 for men (50 | 20.4%) and $25,000 to $29,999 for women (67 | 25.0%).
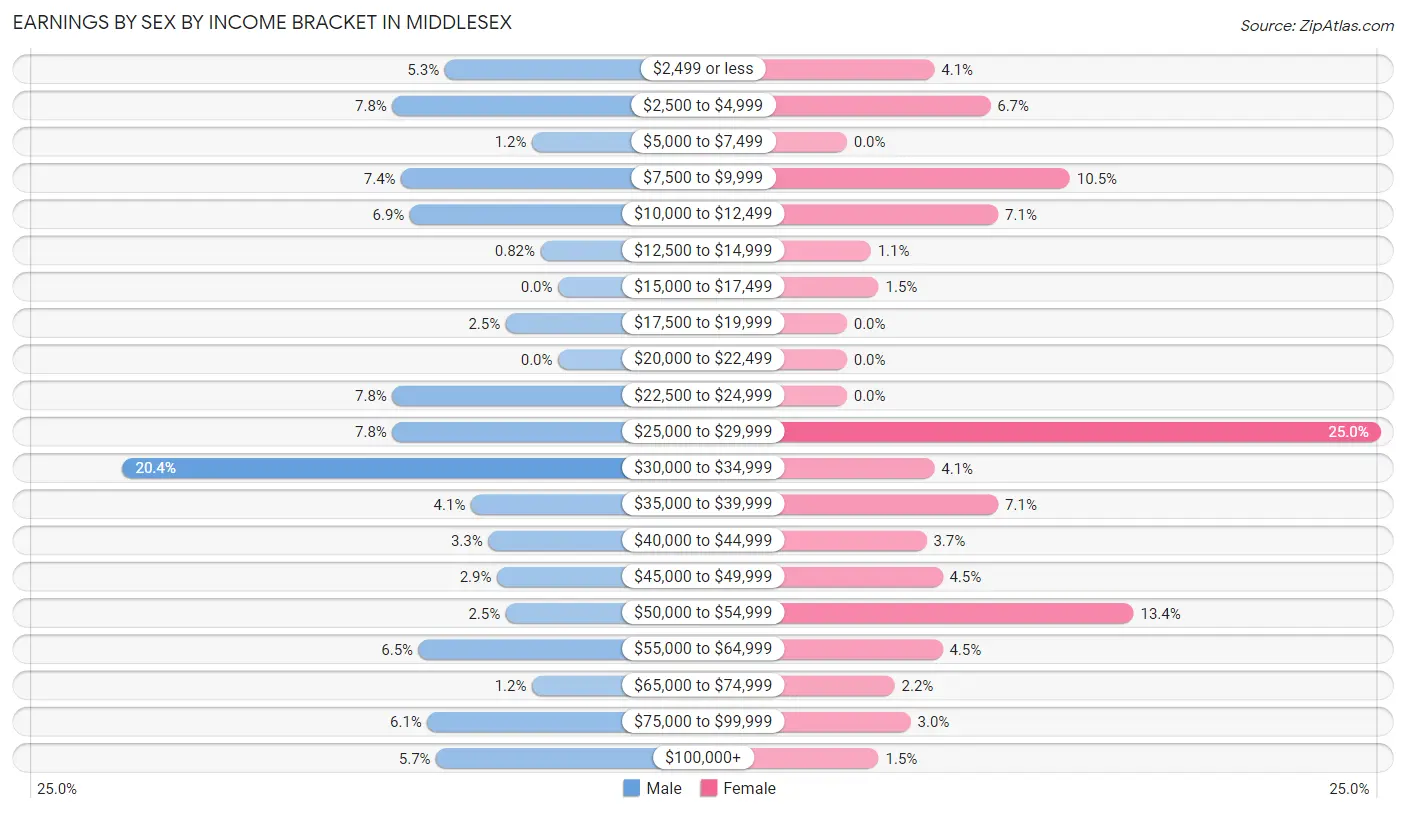
| Income | Male | Female |
| $2,499 or less | 13 (5.3%) | 11 (4.1%) |
| $2,500 to $4,999 | 19 (7.8%) | 18 (6.7%) |
| $5,000 to $7,499 | 3 (1.2%) | 0 (0.0%) |
| $7,500 to $9,999 | 18 (7.3%) | 28 (10.4%) |
| $10,000 to $12,499 | 17 (6.9%) | 19 (7.1%) |
| $12,500 to $14,999 | 2 (0.8%) | 3 (1.1%) |
| $15,000 to $17,499 | 0 (0.0%) | 4 (1.5%) |
| $17,500 to $19,999 | 6 (2.5%) | 0 (0.0%) |
| $20,000 to $22,499 | 0 (0.0%) | 0 (0.0%) |
| $22,500 to $24,999 | 19 (7.8%) | 0 (0.0%) |
| $25,000 to $29,999 | 19 (7.8%) | 67 (25.0%) |
| $30,000 to $34,999 | 50 (20.4%) | 11 (4.1%) |
| $35,000 to $39,999 | 10 (4.1%) | 19 (7.1%) |
| $40,000 to $44,999 | 8 (3.3%) | 10 (3.7%) |
| $45,000 to $49,999 | 7 (2.9%) | 12 (4.5%) |
| $50,000 to $54,999 | 6 (2.5%) | 36 (13.4%) |
| $55,000 to $64,999 | 16 (6.5%) | 12 (4.5%) |
| $65,000 to $74,999 | 3 (1.2%) | 6 (2.2%) |
| $75,000 to $99,999 | 15 (6.1%) | 8 (3.0%) |
| $100,000+ | 14 (5.7%) | 4 (1.5%) |
| Total | 245 (100.0%) | 268 (100.0%) |
Earnings by Sex by Educational Attainment in Middlesex
Average earnings in Middlesex are $30,714 for men and $29,745 for women, a difference of 3.2%. Men with an educational attainment of high school diploma enjoy the highest average annual earnings of $31,964, while those with less than high school education earn the least with $23,611. Women with an educational attainment of high school diploma earn the most with the average annual earnings of $52,765, while those with college or associate's degree education have the smallest earnings of $29,228.
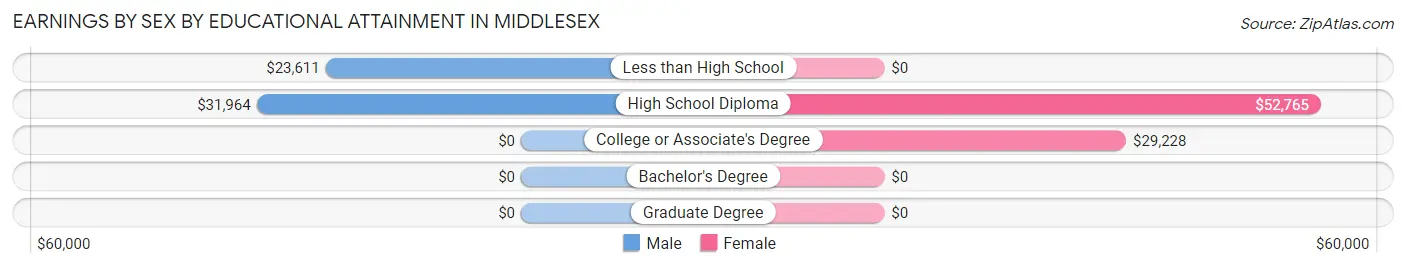
| Educational Attainment | Male Income | Female Income |
| Less than High School | $23,611 | $0 |
| High School Diploma | $31,964 | $52,765 |
| College or Associate's Degree | - | - |
| Bachelor's Degree | - | - |
| Graduate Degree | - | - |
| Total | $30,714 | $29,745 |
Family Income in Middlesex
Family Income Brackets in Middlesex
According to the Middlesex family income data, there are 57 families falling into the $50,000 to $74,999 income range, which is the most common income bracket and makes up 26.8% of all families.
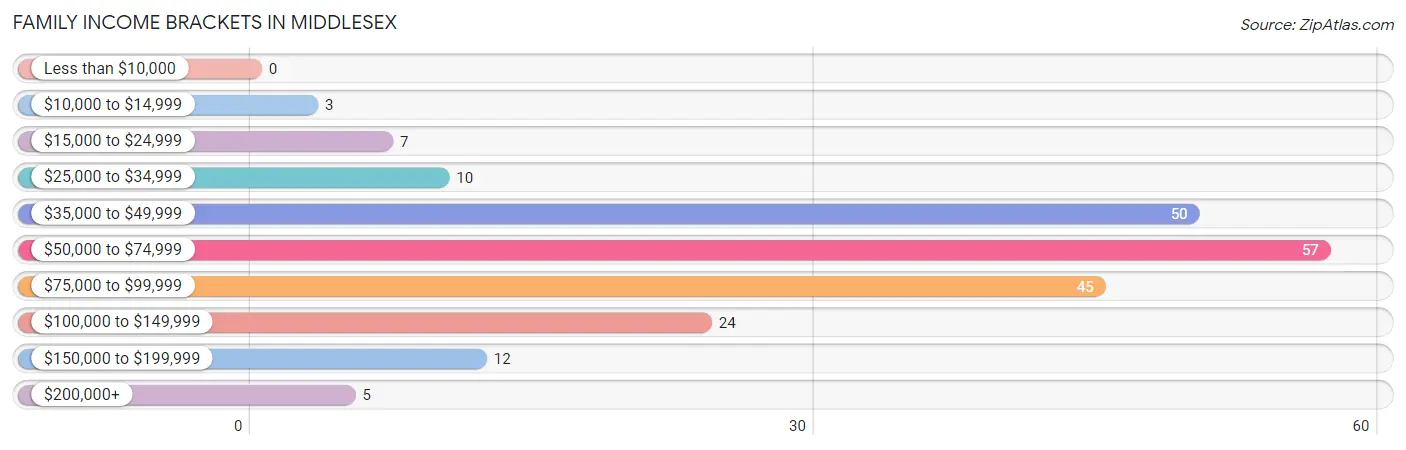
| Income Bracket | # Families | % Families |
| Less than $10,000 | 0 | 0.0% |
| $10,000 to $14,999 | 3 | 1.4% |
| $15,000 to $24,999 | 7 | 3.3% |
| $25,000 to $34,999 | 10 | 4.7% |
| $35,000 to $49,999 | 50 | 23.5% |
| $50,000 to $74,999 | 57 | 26.8% |
| $75,000 to $99,999 | 45 | 21.1% |
| $100,000 to $149,999 | 24 | 11.3% |
| $150,000 to $199,999 | 12 | 5.6% |
| $200,000+ | 5 | 2.3% |
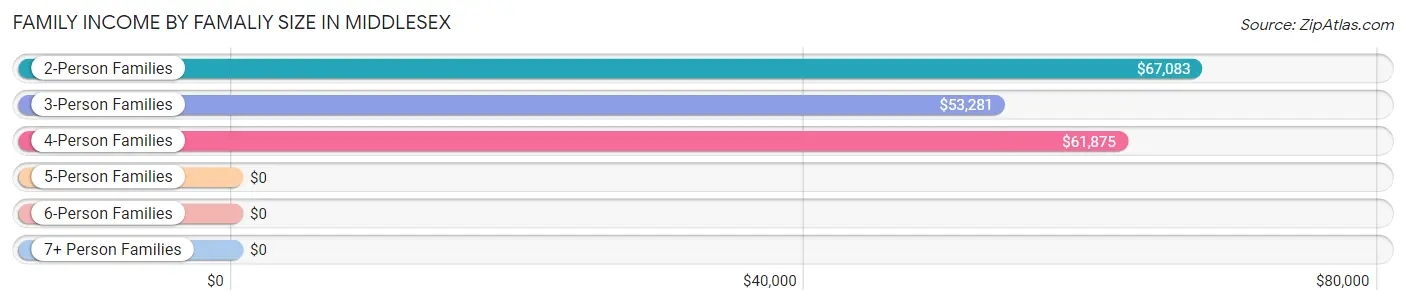
Family Income by Famaliy Size in Middlesex
2-person families (111 | 52.1%) account for the highest median family income in Middlesex with $67,083 per family, while 2-person families (111 | 52.1%) have the highest median income of $33,542 per family member.
| Income Bracket | # Families | Median Income |
| 2-Person Families | 111 (52.1%) | $67,083 |
| 3-Person Families | 43 (20.2%) | $53,281 |
| 4-Person Families | 42 (19.7%) | $61,875 |
| 5-Person Families | 4 (1.9%) | $0 |
| 6-Person Families | 13 (6.1%) | $0 |
| 7+ Person Families | 0 (0.0%) | $0 |
| Total | 213 (100.0%) | $66,250 |
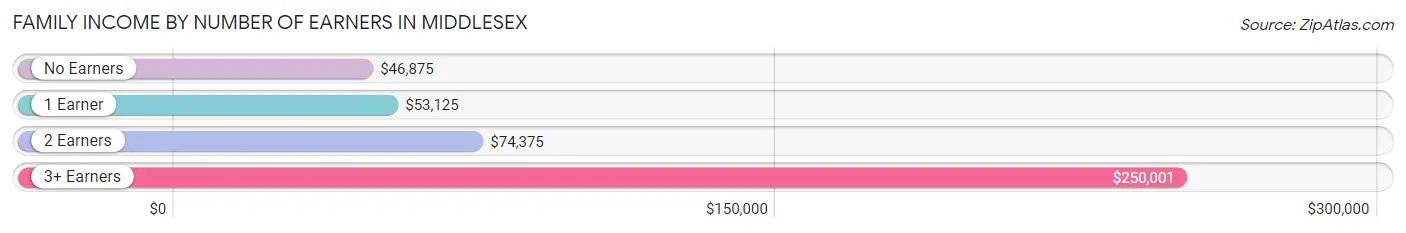
Family Income by Number of Earners in Middlesex
The median family income in Middlesex is $66,250, with families comprising 3+ earners (9) having the highest median family income of $250,001, while families with no earners (29) have the lowest median family income of $46,875, accounting for 4.2% and 13.6% of families, respectively.
| Number of Earners | # Families | Median Income |
| No Earners | 29 (13.6%) | $46,875 |
| 1 Earner | 49 (23.0%) | $53,125 |
| 2 Earners | 126 (59.2%) | $74,375 |
| 3+ Earners | 9 (4.2%) | $250,001 |
| Total | 213 (100.0%) | $66,250 |
Household Income in Middlesex
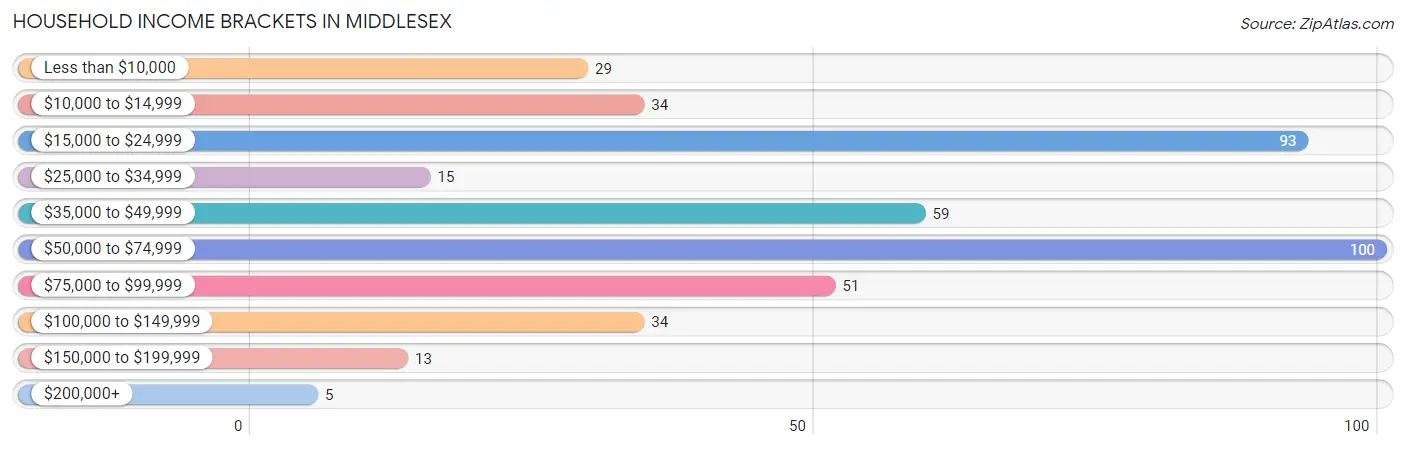
Household Income Brackets in Middlesex
With 100 households falling in the category, the $50,000 to $74,999 income range is the most frequent in Middlesex, accounting for 23.1% of all households. In contrast, only 5 households (1.1%) fall into the $200,000+ income bracket, making it the least populous group.
| Income Bracket | # Households | % Households |
| Less than $10,000 | 29 | 6.7% |
| $10,000 to $14,999 | 34 | 7.9% |
| $15,000 to $24,999 | 93 | 21.5% |
| $25,000 to $34,999 | 15 | 3.5% |
| $35,000 to $49,999 | 59 | 13.6% |
| $50,000 to $74,999 | 100 | 23.1% |
| $75,000 to $99,999 | 51 | 11.8% |
| $100,000 to $149,999 | 34 | 7.9% |
| $150,000 to $199,999 | 13 | 3.0% |
| $200,000+ | 5 | 1.2% |
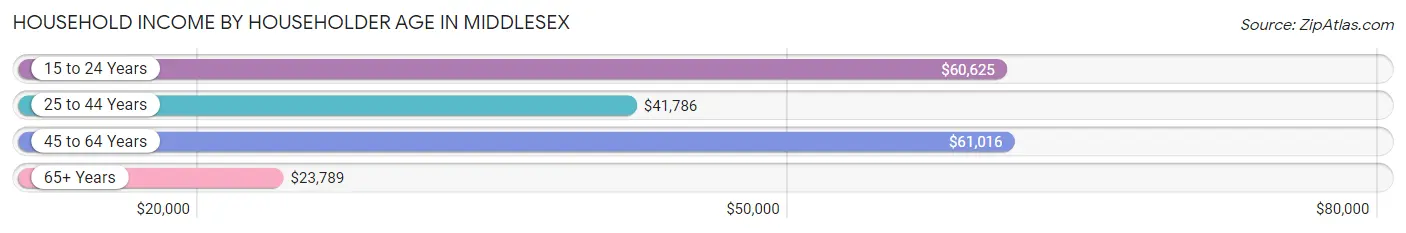
Household Income by Householder Age in Middlesex
The median household income in Middlesex is $42,917, with the highest median household income of $61,016 found in the 45 to 64 years age bracket for the primary householder. A total of 157 households (36.3%) fall into this category. Meanwhile, the 65+ years age bracket for the primary householder has the lowest median household income of $23,789, with 133 households (30.7%) in this group.
| Income Bracket | # Households | Median Income |
| 15 to 24 Years | 23 (5.3%) | $60,625 |
| 25 to 44 Years | 120 (27.7%) | $41,786 |
| 45 to 64 Years | 157 (36.3%) | $61,016 |
| 65+ Years | 133 (30.7%) | $23,789 |
| Total | 433 (100.0%) | $42,917 |
Poverty in Middlesex
Income Below Poverty by Sex and Age in Middlesex
With 5.0% poverty level for males and 16.1% for females among the residents of Middlesex, 6 to 11 year old males and 75 year old and over females are the most vulnerable to poverty, with 4 males (26.7%) and 21 females (33.9%) in their respective age groups living below the poverty level.
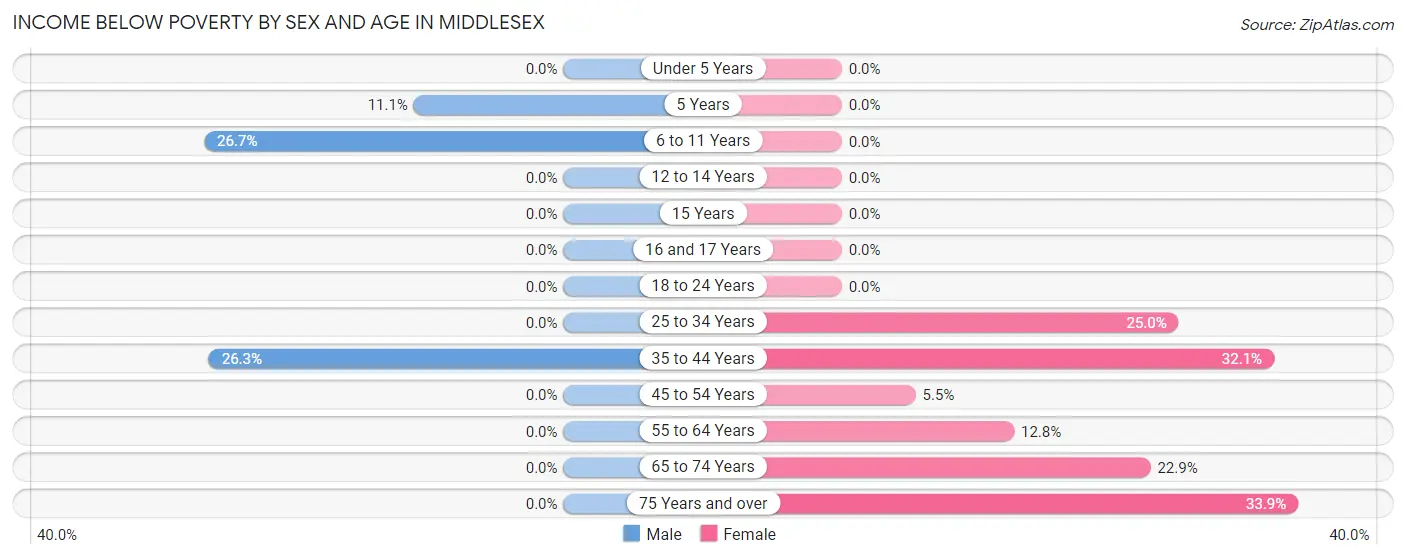
| Age Bracket | Male | Female |
| Under 5 Years | 0 (0.0%) | 0 (0.0%) |
| 5 Years | 3 (11.1%) | 0 (0.0%) |
| 6 to 11 Years | 4 (26.7%) | 0 (0.0%) |
| 12 to 14 Years | 0 (0.0%) | 0 (0.0%) |
| 15 Years | 0 (0.0%) | 0 (0.0%) |
| 16 and 17 Years | 0 (0.0%) | 0 (0.0%) |
| 18 to 24 Years | 0 (0.0%) | 0 (0.0%) |
| 25 to 34 Years | 0 (0.0%) | 20 (25.0%) |
| 35 to 44 Years | 15 (26.3%) | 17 (32.1%) |
| 45 to 54 Years | 0 (0.0%) | 4 (5.5%) |
| 55 to 64 Years | 0 (0.0%) | 11 (12.8%) |
| 65 to 74 Years | 0 (0.0%) | 11 (22.9%) |
| 75 Years and over | 0 (0.0%) | 21 (33.9%) |
| Total | 22 (5.0%) | 84 (16.1%) |
Income Above Poverty by Sex and Age in Middlesex
According to the poverty statistics in Middlesex, males aged under 5 years and females aged under 5 years are the age groups that are most secure financially, with 100.0% of males and 100.0% of females in these age groups living above the poverty line.
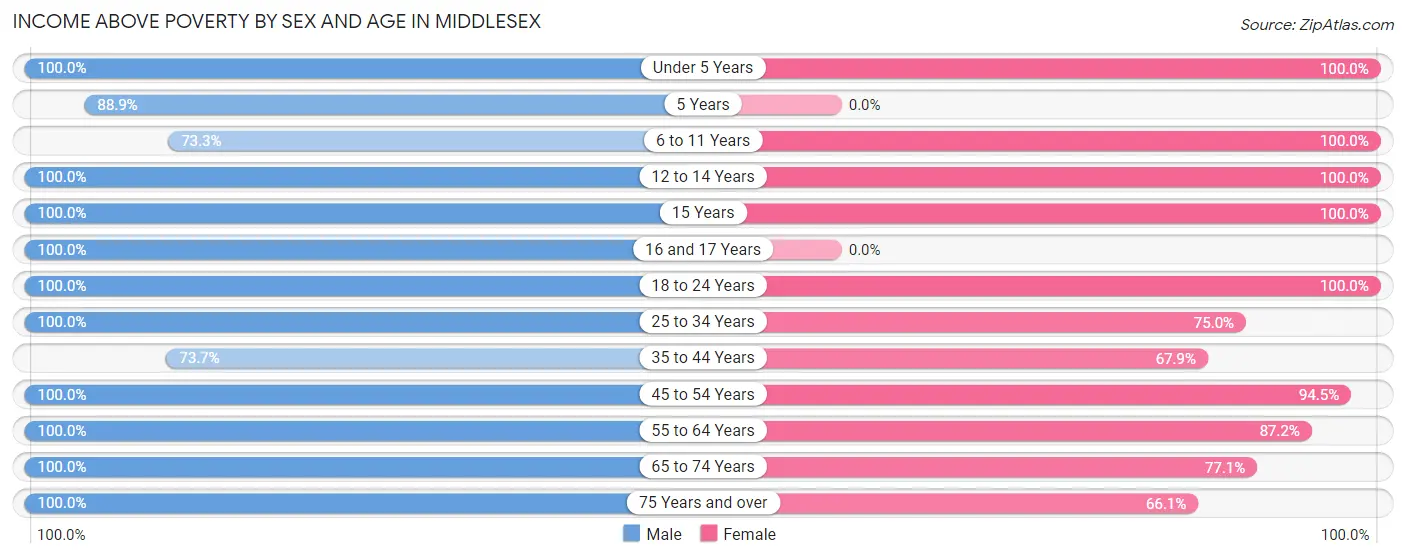
| Age Bracket | Male | Female |
| Under 5 Years | 25 (100.0%) | 39 (100.0%) |
| 5 Years | 24 (88.9%) | 0 (0.0%) |
| 6 to 11 Years | 11 (73.3%) | 15 (100.0%) |
| 12 to 14 Years | 25 (100.0%) | 11 (100.0%) |
| 15 Years | 6 (100.0%) | 2 (100.0%) |
| 16 and 17 Years | 7 (100.0%) | 0 (0.0%) |
| 18 to 24 Years | 57 (100.0%) | 54 (100.0%) |
| 25 to 34 Years | 69 (100.0%) | 60 (75.0%) |
| 35 to 44 Years | 42 (73.7%) | 36 (67.9%) |
| 45 to 54 Years | 24 (100.0%) | 69 (94.5%) |
| 55 to 64 Years | 75 (100.0%) | 75 (87.2%) |
| 65 to 74 Years | 30 (100.0%) | 37 (77.1%) |
| 75 Years and over | 21 (100.0%) | 41 (66.1%) |
| Total | 416 (95.0%) | 439 (83.9%) |
Income Below Poverty Among Married-Couple Families in Middlesex
The poverty statistics for married-couple families in Middlesex show that 2.8% or 4 of the total 142 families live below the poverty line. Families with 1 or 2 children have the highest poverty rate of 7.7%, comprising of 4 families. On the other hand, families with no children have the lowest poverty rate of 0.0%, which includes 0 families.
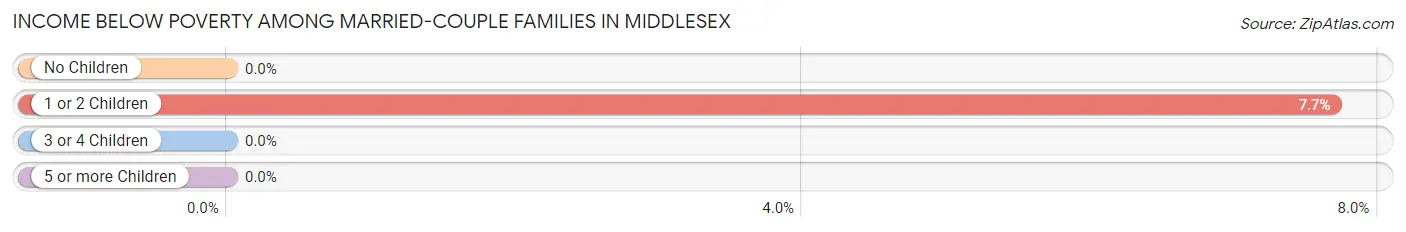
| Children | Above Poverty | Below Poverty |
| No Children | 87 (100.0%) | 0 (0.0%) |
| 1 or 2 Children | 48 (92.3%) | 4 (7.7%) |
| 3 or 4 Children | 3 (100.0%) | 0 (0.0%) |
| 5 or more Children | 0 (0.0%) | 0 (0.0%) |
| Total | 138 (97.2%) | 4 (2.8%) |
Income Below Poverty Among Single-Parent Households in Middlesex
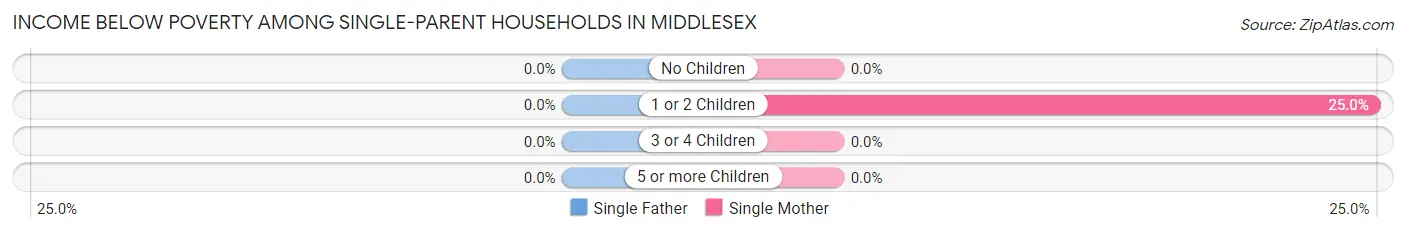
| Children | Single Father | Single Mother |
| No Children | 0 (0.0%) | 0 (0.0%) |
| 1 or 2 Children | 0 (0.0%) | 3 (25.0%) |
| 3 or 4 Children | 0 (0.0%) | 0 (0.0%) |
| 5 or more Children | 0 (0.0%) | 0 (0.0%) |
| Total | 0 (0.0%) | 3 (7.9%) |
Income Below Poverty Among Married-Couple vs Single-Parent Households in Middlesex
The poverty data for Middlesex shows that 4 of the married-couple family households (2.8%) and 3 of the single-parent households (4.2%) are living below the poverty level. Within the married-couple family households, those with 1 or 2 children have the highest poverty rate, with 4 households (7.7%) falling below the poverty line. Among the single-parent households, those with 1 or 2 children have the highest poverty rate, with 3 household (8.3%) living below poverty.
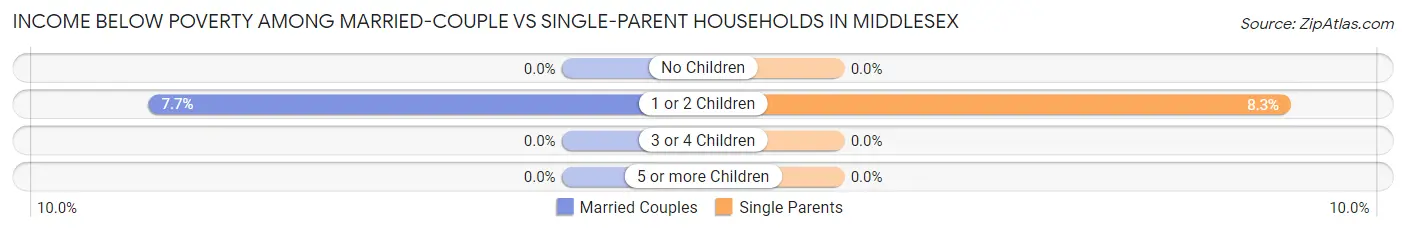
| Children | Married-Couple Families | Single-Parent Households |
| No Children | 0 (0.0%) | 0 (0.0%) |
| 1 or 2 Children | 4 (7.7%) | 3 (8.3%) |
| 3 or 4 Children | 0 (0.0%) | 0 (0.0%) |
| 5 or more Children | 0 (0.0%) | 0 (0.0%) |
| Total | 4 (2.8%) | 3 (4.2%) |
Employment Characteristics in Middlesex
Employment by Class of Employer in Middlesex
Among the 485 employed individuals in Middlesex, private company employees (390 | 80.4%), self-employed (not incorporated) (30 | 6.2%), and not-for-profit organizations (26 | 5.4%) make up the most common classes of employment.
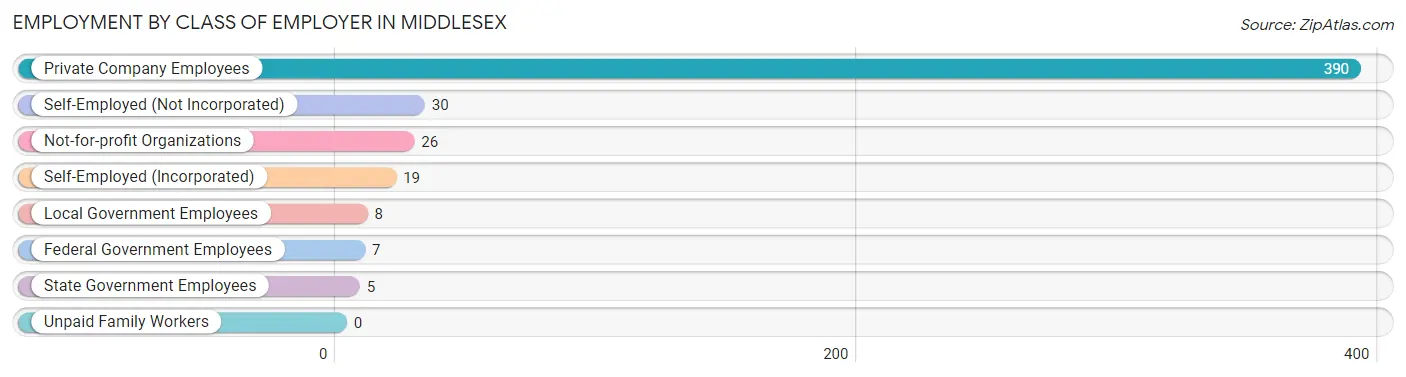
| Employer Class | # Employees | % Employees |
| Private Company Employees | 390 | 80.4% |
| Self-Employed (Incorporated) | 19 | 3.9% |
| Self-Employed (Not Incorporated) | 30 | 6.2% |
| Not-for-profit Organizations | 26 | 5.4% |
| Local Government Employees | 8 | 1.7% |
| State Government Employees | 5 | 1.0% |
| Federal Government Employees | 7 | 1.4% |
| Unpaid Family Workers | 0 | 0.0% |
| Total | 485 | 100.0% |
Employment Status by Age in Middlesex
According to the labor force statistics for Middlesex, out of the total population over 16 years of age (796), 62.9% or 501 individuals are in the labor force, with 0.8% or 4 of them unemployed. The age group with the highest labor force participation rate is 20 to 24 years, with 100.0% or 83 individuals in the labor force. Within the labor force, the 20 to 24 years age range has the highest percentage of unemployed individuals, with 4.8% or 4 of them being unemployed.
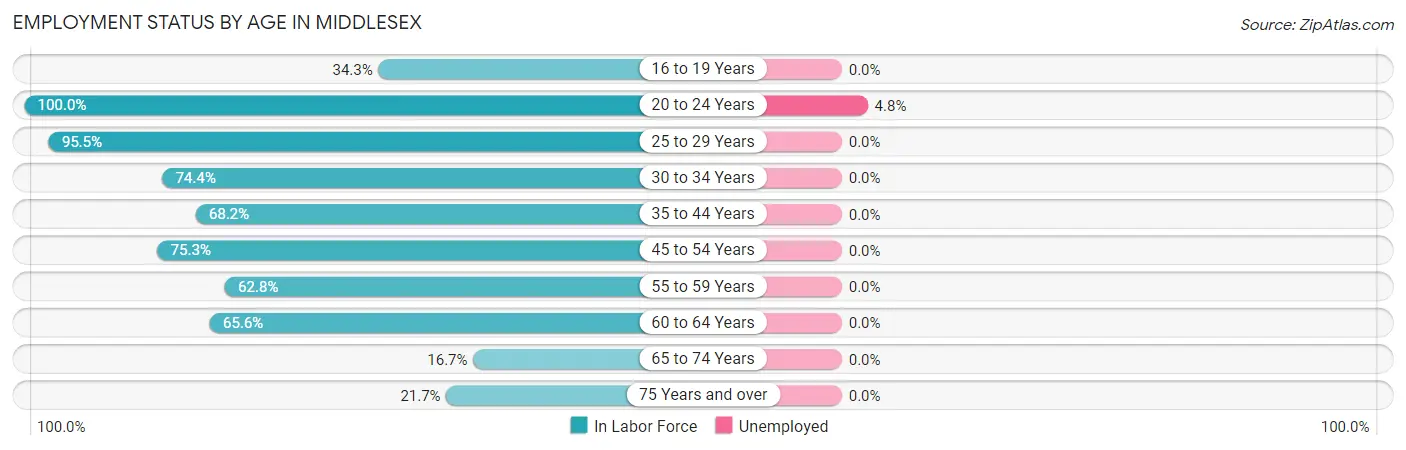
| Age Bracket | In Labor Force | Unemployed |
| 16 to 19 Years | 12 (34.3%) | 0 (0.0%) |
| 20 to 24 Years | 83 (100.0%) | 4 (4.8%) |
| 25 to 29 Years | 64 (95.5%) | 0 (0.0%) |
| 30 to 34 Years | 61 (74.4%) | 0 (0.0%) |
| 35 to 44 Years | 75 (68.2%) | 0 (0.0%) |
| 45 to 54 Years | 73 (75.3%) | 0 (0.0%) |
| 55 to 59 Years | 81 (62.8%) | 0 (0.0%) |
| 60 to 64 Years | 21 (65.6%) | 0 (0.0%) |
| 65 to 74 Years | 13 (16.7%) | 0 (0.0%) |
| 75 Years and over | 18 (21.7%) | 0 (0.0%) |
| Total | 501 (62.9%) | 4 (0.8%) |
Employment Status by Educational Attainment in Middlesex
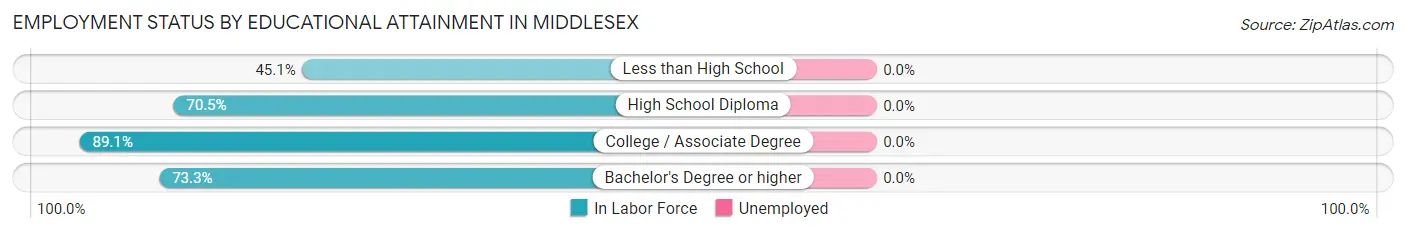
| Educational Attainment | In Labor Force | Unemployed |
| Less than High School | 37 (45.1%) | 0 (0.0%) |
| High School Diploma | 136 (70.5%) | 0 (0.0%) |
| College / Associate Degree | 139 (89.1%) | 0 (0.0%) |
| Bachelor's Degree or higher | 63 (73.3%) | 0 (0.0%) |
| Total | 375 (72.5%) | 0 (0.0%) |
Employment Occupations by Sex in Middlesex
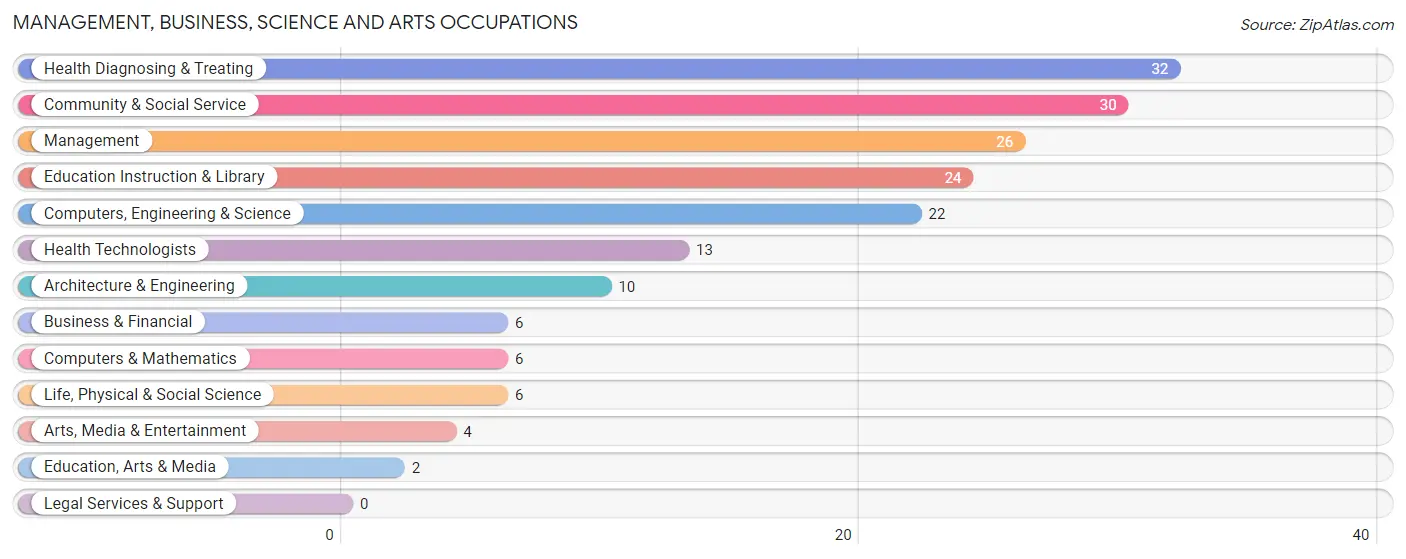
Management, Business, Science and Arts Occupations
The most common Management, Business, Science and Arts occupations in Middlesex are Health Diagnosing & Treating (32 | 6.4%), Community & Social Service (30 | 6.0%), Management (26 | 5.2%), Education Instruction & Library (24 | 4.8%), and Computers, Engineering & Science (22 | 4.4%).
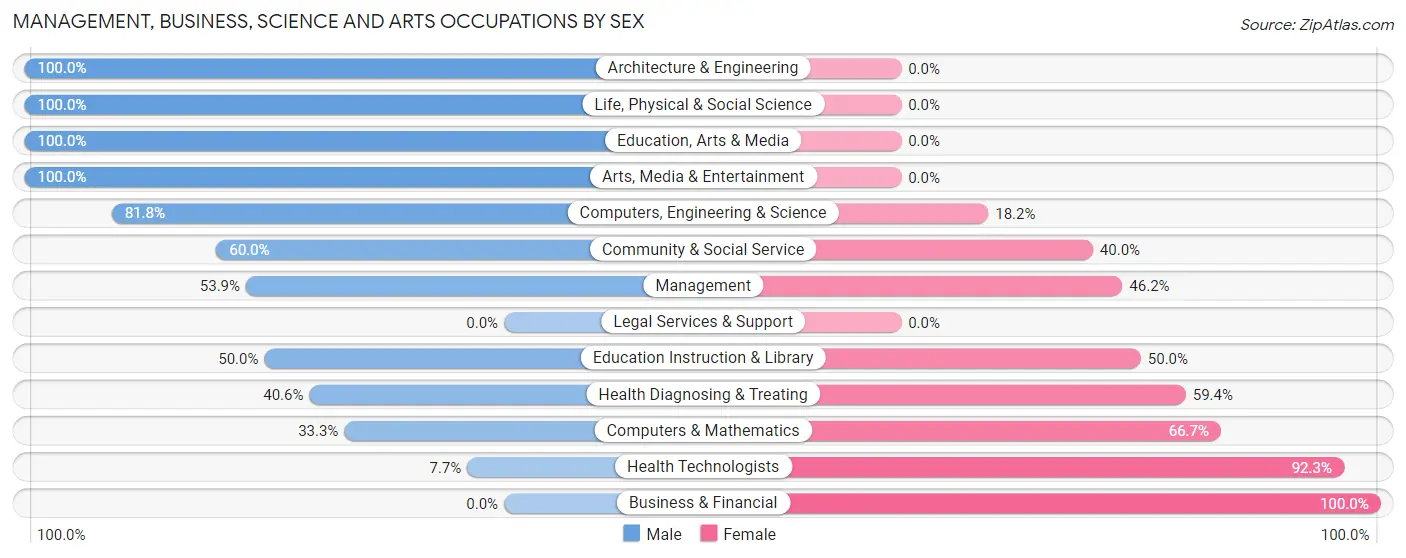
Management, Business, Science and Arts Occupations by Sex
Within the Management, Business, Science and Arts occupations in Middlesex, the most male-oriented occupations are Architecture & Engineering (100.0%), Life, Physical & Social Science (100.0%), and Education, Arts & Media (100.0%), while the most female-oriented occupations are Business & Financial (100.0%), Health Technologists (92.3%), and Computers & Mathematics (66.7%).
| Occupation | Male | Female |
| Management | 14 (53.8%) | 12 (46.2%) |
| Business & Financial | 0 (0.0%) | 6 (100.0%) |
| Computers, Engineering & Science | 18 (81.8%) | 4 (18.2%) |
| Computers & Mathematics | 2 (33.3%) | 4 (66.7%) |
| Architecture & Engineering | 10 (100.0%) | 0 (0.0%) |
| Life, Physical & Social Science | 6 (100.0%) | 0 (0.0%) |
| Community & Social Service | 18 (60.0%) | 12 (40.0%) |
| Education, Arts & Media | 2 (100.0%) | 0 (0.0%) |
| Legal Services & Support | 0 (0.0%) | 0 (0.0%) |
| Education Instruction & Library | 12 (50.0%) | 12 (50.0%) |
| Arts, Media & Entertainment | 4 (100.0%) | 0 (0.0%) |
| Health Diagnosing & Treating | 13 (40.6%) | 19 (59.4%) |
| Health Technologists | 1 (7.7%) | 12 (92.3%) |
| Total (Category) | 63 (54.3%) | 53 (45.7%) |
| Total (Overall) | 237 (47.7%) | 260 (52.3%) |
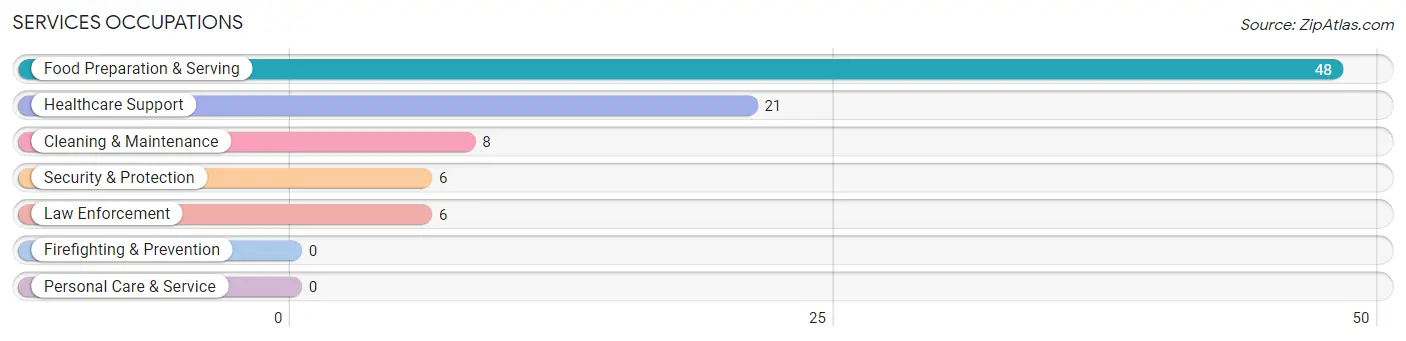
Services Occupations
The most common Services occupations in Middlesex are Food Preparation & Serving (48 | 9.7%), Healthcare Support (21 | 4.2%), Cleaning & Maintenance (8 | 1.6%), Security & Protection (6 | 1.2%), and Law Enforcement (6 | 1.2%).
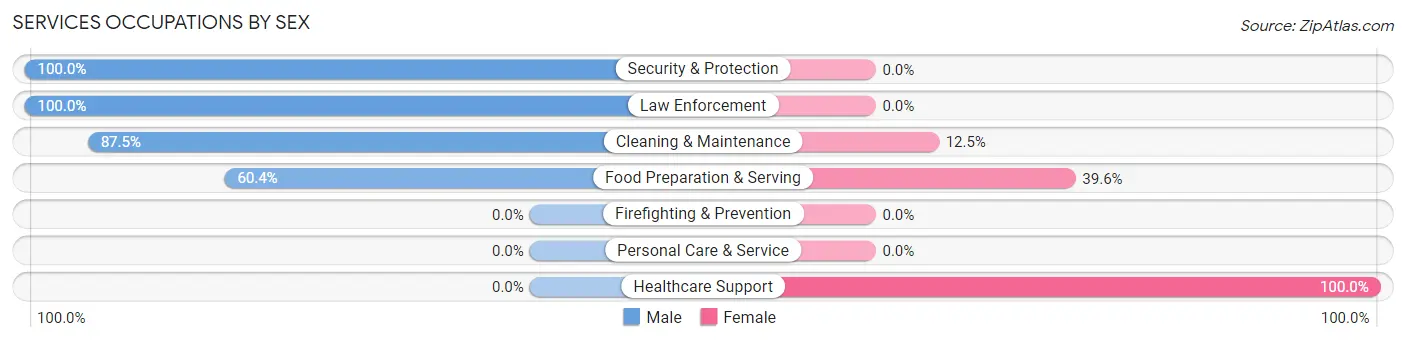
Services Occupations by Sex
Within the Services occupations in Middlesex, the most male-oriented occupations are Security & Protection (100.0%), Law Enforcement (100.0%), and Cleaning & Maintenance (87.5%), while the most female-oriented occupations are Healthcare Support (100.0%), Food Preparation & Serving (39.6%), and Cleaning & Maintenance (12.5%).
| Occupation | Male | Female |
| Healthcare Support | 0 (0.0%) | 21 (100.0%) |
| Security & Protection | 6 (100.0%) | 0 (0.0%) |
| Firefighting & Prevention | 0 (0.0%) | 0 (0.0%) |
| Law Enforcement | 6 (100.0%) | 0 (0.0%) |
| Food Preparation & Serving | 29 (60.4%) | 19 (39.6%) |
| Cleaning & Maintenance | 7 (87.5%) | 1 (12.5%) |
| Personal Care & Service | 0 (0.0%) | 0 (0.0%) |
| Total (Category) | 42 (50.6%) | 41 (49.4%) |
| Total (Overall) | 237 (47.7%) | 260 (52.3%) |
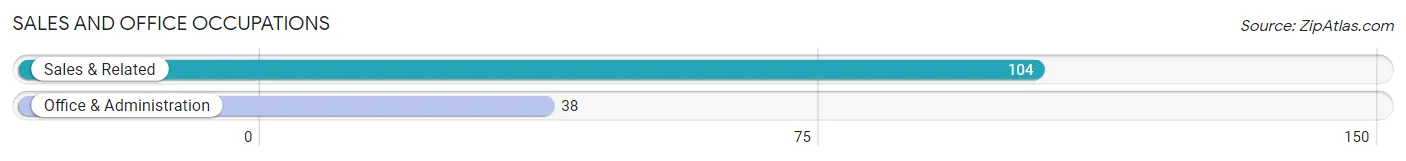
Sales and Office Occupations
The most common Sales and Office occupations in Middlesex are Sales & Related (104 | 20.9%), and Office & Administration (38 | 7.6%).
Sales and Office Occupations by Sex
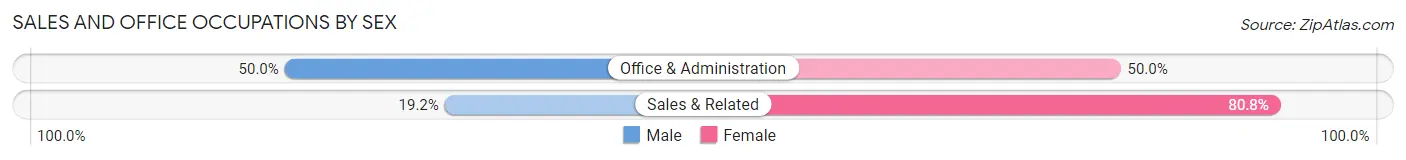
| Occupation | Male | Female |
| Sales & Related | 20 (19.2%) | 84 (80.8%) |
| Office & Administration | 19 (50.0%) | 19 (50.0%) |
| Total (Category) | 39 (27.5%) | 103 (72.5%) |
| Total (Overall) | 237 (47.7%) | 260 (52.3%) |
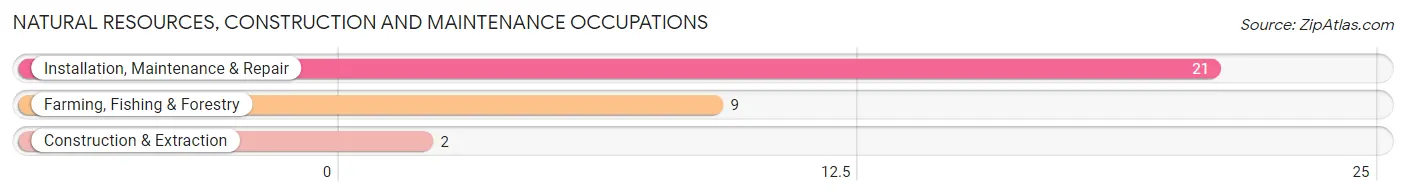
Natural Resources, Construction and Maintenance Occupations
The most common Natural Resources, Construction and Maintenance occupations in Middlesex are Installation, Maintenance & Repair (21 | 4.2%), Farming, Fishing & Forestry (9 | 1.8%), and Construction & Extraction (2 | 0.4%).
Natural Resources, Construction and Maintenance Occupations by Sex
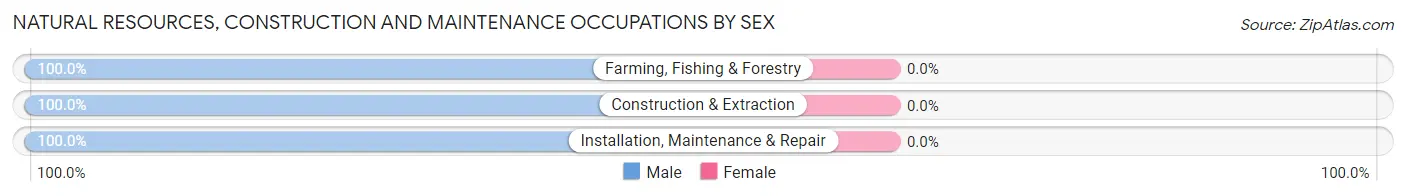
| Occupation | Male | Female |
| Farming, Fishing & Forestry | 9 (100.0%) | 0 (0.0%) |
| Construction & Extraction | 2 (100.0%) | 0 (0.0%) |
| Installation, Maintenance & Repair | 21 (100.0%) | 0 (0.0%) |
| Total (Category) | 32 (100.0%) | 0 (0.0%) |
| Total (Overall) | 237 (47.7%) | 260 (52.3%) |
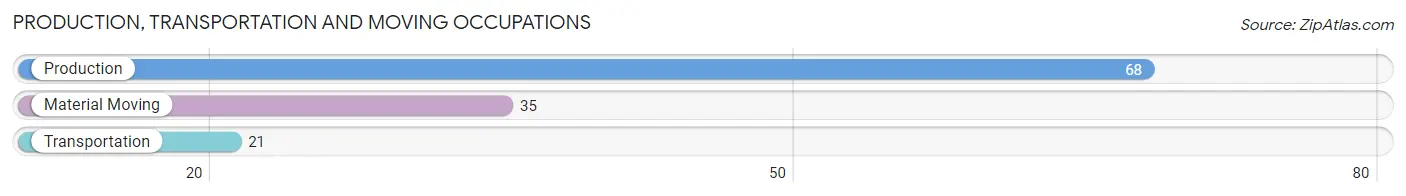
Production, Transportation and Moving Occupations
The most common Production, Transportation and Moving occupations in Middlesex are Production (68 | 13.7%), Material Moving (35 | 7.0%), and Transportation (21 | 4.2%).
Production, Transportation and Moving Occupations by Sex
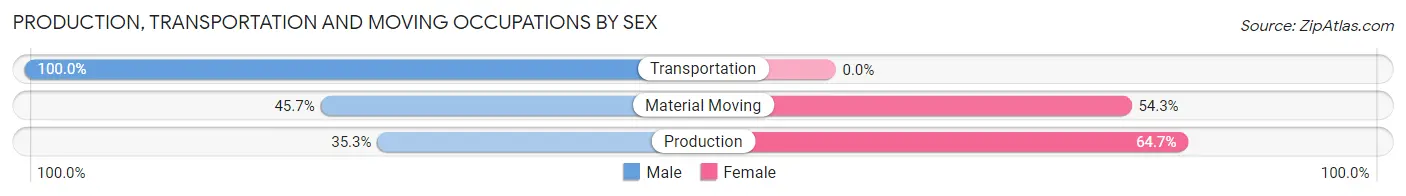
| Occupation | Male | Female |
| Production | 24 (35.3%) | 44 (64.7%) |
| Transportation | 21 (100.0%) | 0 (0.0%) |
| Material Moving | 16 (45.7%) | 19 (54.3%) |
| Total (Category) | 61 (49.2%) | 63 (50.8%) |
| Total (Overall) | 237 (47.7%) | 260 (52.3%) |
Employment Industries by Sex in Middlesex
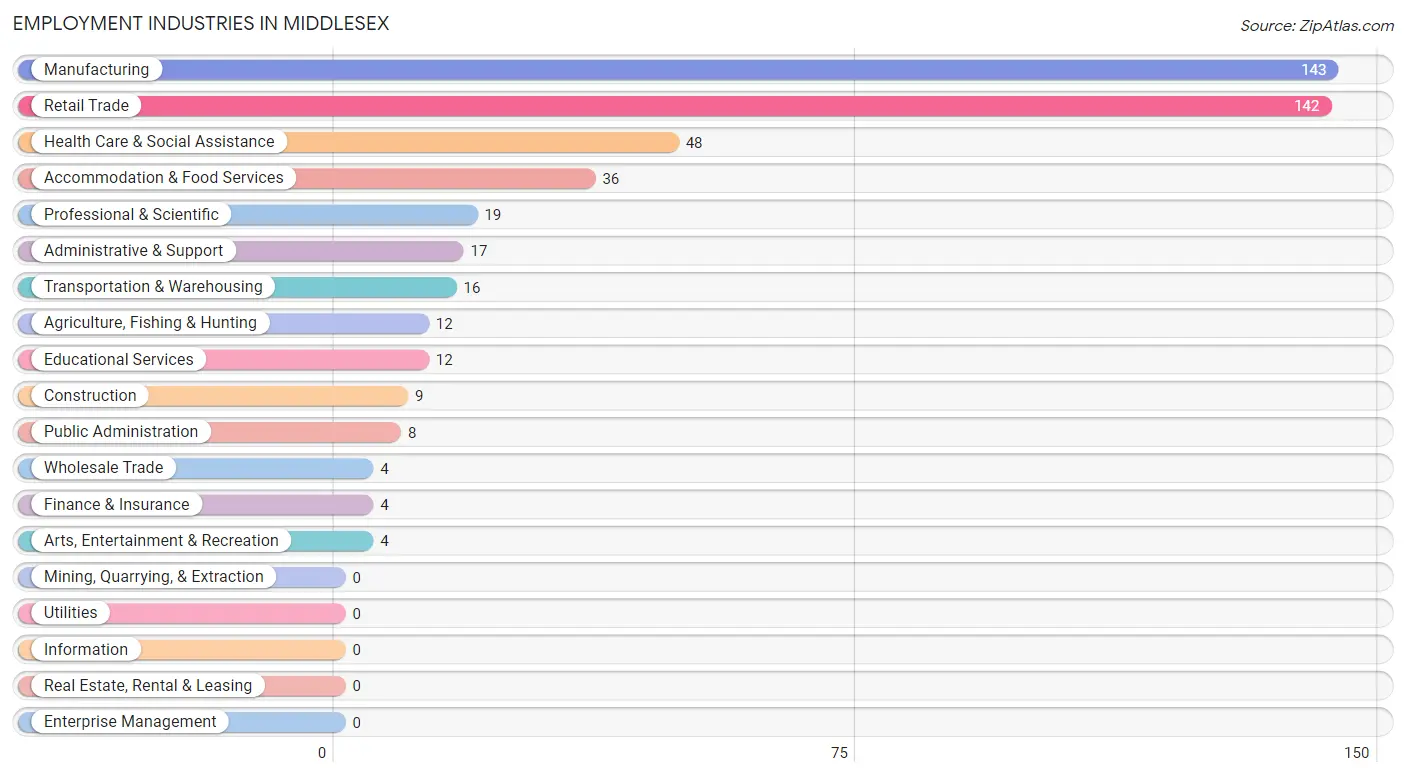
Employment Industries in Middlesex
The major employment industries in Middlesex include Manufacturing (143 | 28.8%), Retail Trade (142 | 28.6%), Health Care & Social Assistance (48 | 9.7%), Accommodation & Food Services (36 | 7.2%), and Professional & Scientific (19 | 3.8%).
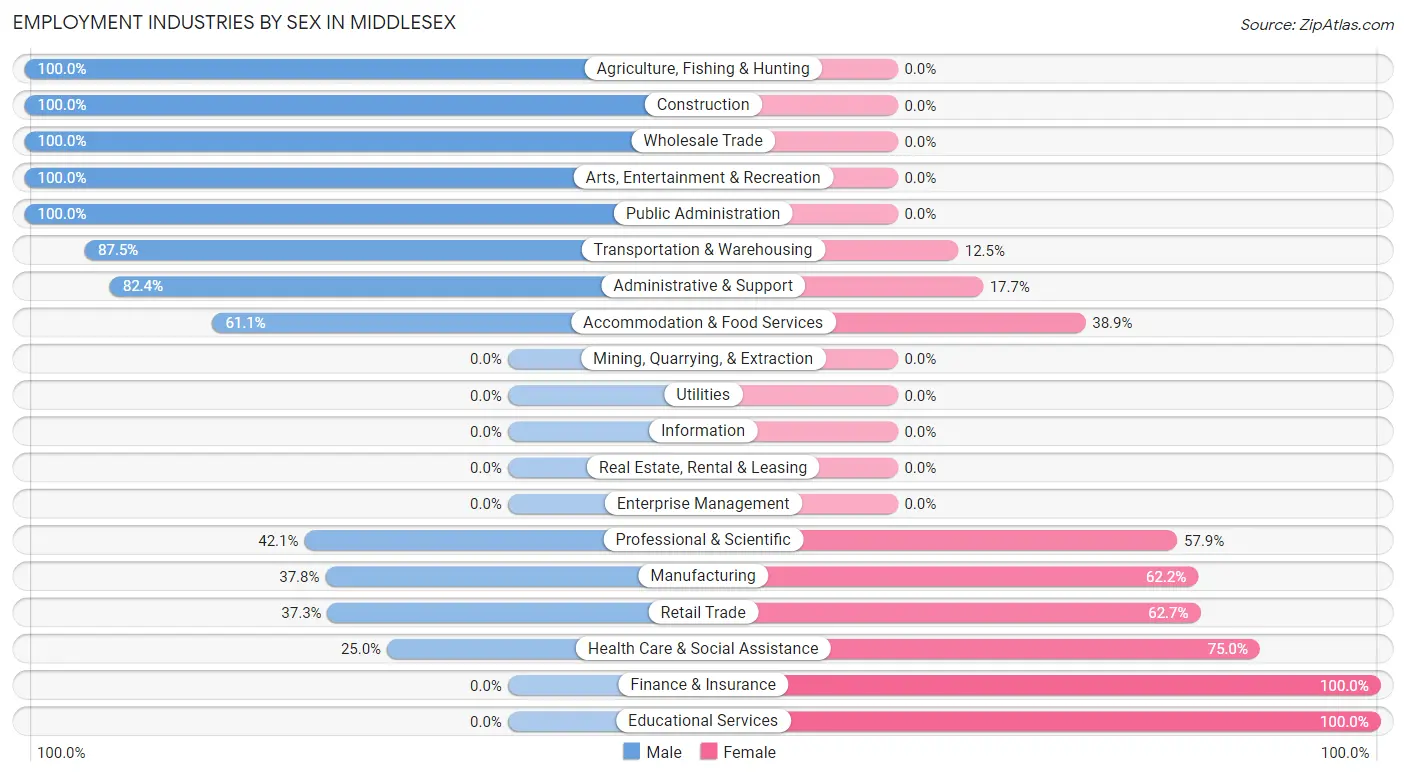
Employment Industries by Sex in Middlesex
The Middlesex industries that see more men than women are Agriculture, Fishing & Hunting (100.0%), Construction (100.0%), and Wholesale Trade (100.0%), whereas the industries that tend to have a higher number of women are Finance & Insurance (100.0%), Educational Services (100.0%), and Health Care & Social Assistance (75.0%).
| Industry | Male | Female |
| Agriculture, Fishing & Hunting | 12 (100.0%) | 0 (0.0%) |
| Mining, Quarrying, & Extraction | 0 (0.0%) | 0 (0.0%) |
| Construction | 9 (100.0%) | 0 (0.0%) |
| Manufacturing | 54 (37.8%) | 89 (62.2%) |
| Wholesale Trade | 4 (100.0%) | 0 (0.0%) |
| Retail Trade | 53 (37.3%) | 89 (62.7%) |
| Transportation & Warehousing | 14 (87.5%) | 2 (12.5%) |
| Utilities | 0 (0.0%) | 0 (0.0%) |
| Information | 0 (0.0%) | 0 (0.0%) |
| Finance & Insurance | 0 (0.0%) | 4 (100.0%) |
| Real Estate, Rental & Leasing | 0 (0.0%) | 0 (0.0%) |
| Professional & Scientific | 8 (42.1%) | 11 (57.9%) |
| Enterprise Management | 0 (0.0%) | 0 (0.0%) |
| Administrative & Support | 14 (82.4%) | 3 (17.6%) |
| Educational Services | 0 (0.0%) | 12 (100.0%) |
| Health Care & Social Assistance | 12 (25.0%) | 36 (75.0%) |
| Arts, Entertainment & Recreation | 4 (100.0%) | 0 (0.0%) |
| Accommodation & Food Services | 22 (61.1%) | 14 (38.9%) |
| Public Administration | 8 (100.0%) | 0 (0.0%) |
| Total | 237 (47.7%) | 260 (52.3%) |
Education in Middlesex
School Enrollment in Middlesex
The most common levels of schooling among the 167 students in Middlesex are college / undergraduate (45 | 27.0%), high school (34 | 20.4%), and kindergarten (31 | 18.6%).
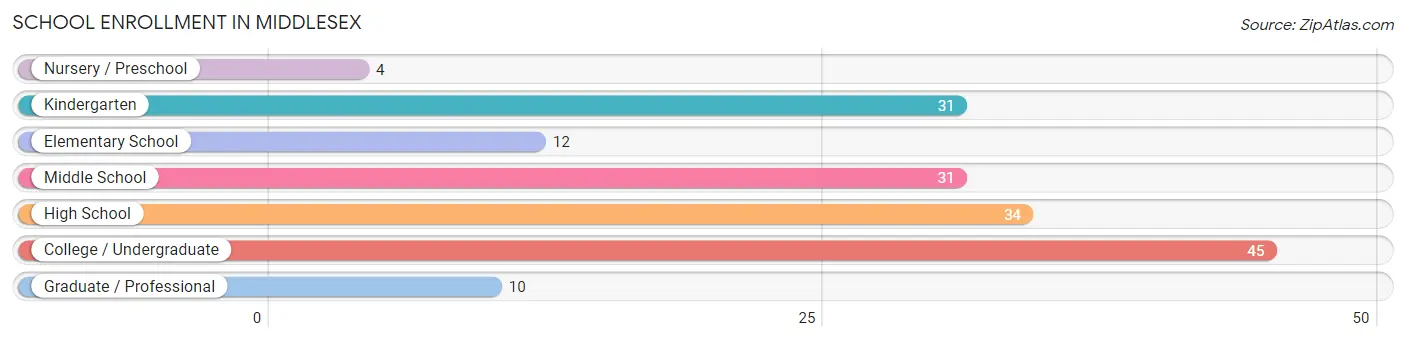
| School Level | # Students | % Students |
| Nursery / Preschool | 4 | 2.4% |
| Kindergarten | 31 | 18.6% |
| Elementary School | 12 | 7.2% |
| Middle School | 31 | 18.6% |
| High School | 34 | 20.4% |
| College / Undergraduate | 45 | 27.0% |
| Graduate / Professional | 10 | 6.0% |
| Total | 167 | 100.0% |
School Enrollment by Age by Funding Source in Middlesex
Out of a total of 167 students who are enrolled in schools in Middlesex, 10 (6.0%) attend a private institution, while the remaining 157 (94.0%) are enrolled in public schools. The age group of 5 to 9 year old has the highest likelihood of being enrolled in private schools, with 10 (23.3% in the age bracket) enrolled. Conversely, the age group of 3 to 4 year olds has the lowest likelihood of being enrolled in a private school, with 4 (100.0% in the age bracket) attending a public institution.
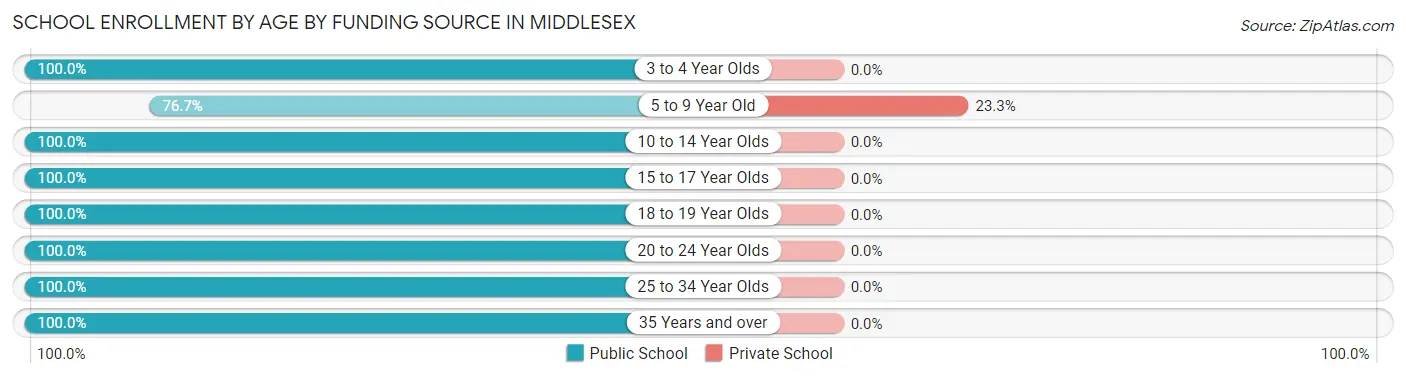
| Age Bracket | Public School | Private School |
| 3 to 4 Year Olds | 4 (100.0%) | 0 (0.0%) |
| 5 to 9 Year Old | 33 (76.7%) | 10 (23.3%) |
| 10 to 14 Year Olds | 42 (100.0%) | 0 (0.0%) |
| 15 to 17 Year Olds | 15 (100.0%) | 0 (0.0%) |
| 18 to 19 Year Olds | 8 (100.0%) | 0 (0.0%) |
| 20 to 24 Year Olds | 32 (100.0%) | 0 (0.0%) |
| 25 to 34 Year Olds | 3 (100.0%) | 0 (0.0%) |
| 35 Years and over | 20 (100.0%) | 0 (0.0%) |
| Total | 157 (94.0%) | 10 (6.0%) |
Educational Attainment by Field of Study in Middlesex
Business (46 | 39.0%), science & technology (24 | 20.3%), arts & humanities (18 | 15.2%), education (11 | 9.3%), and social sciences (6 | 5.1%) are the most common fields of study among 118 individuals in Middlesex who have obtained a bachelor's degree or higher.
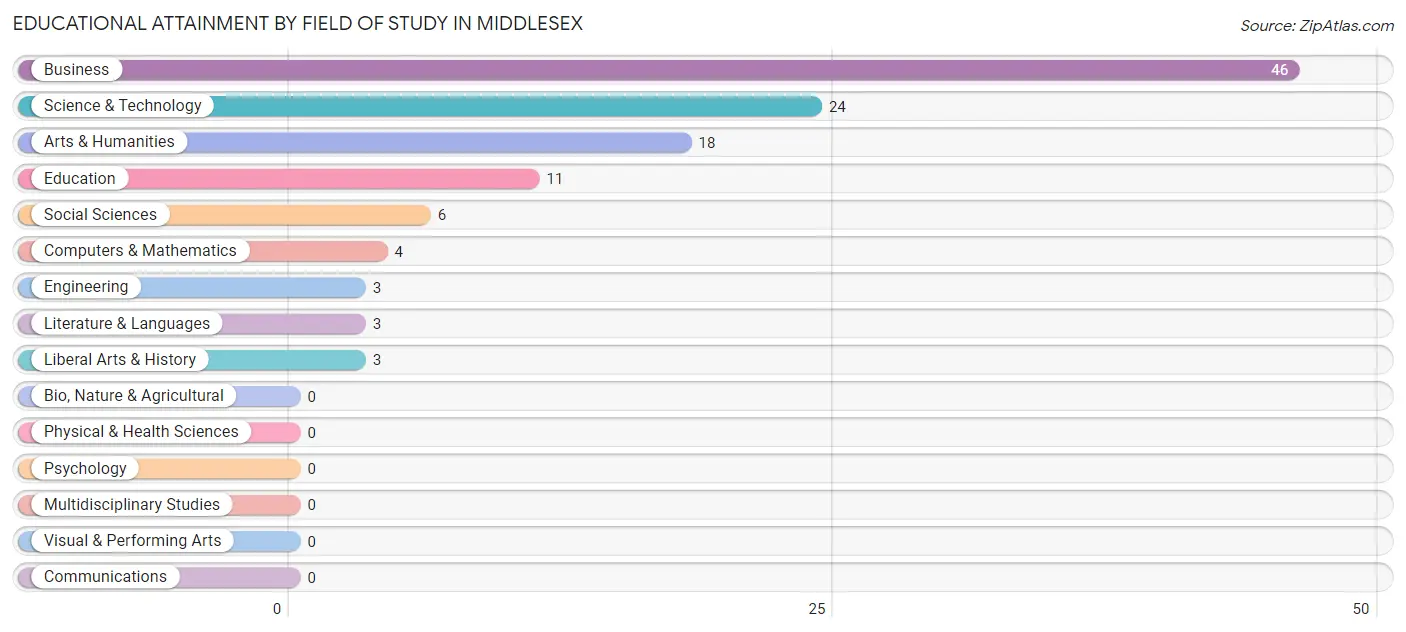
| Field of Study | # Graduates | % Graduates |
| Computers & Mathematics | 4 | 3.4% |
| Bio, Nature & Agricultural | 0 | 0.0% |
| Physical & Health Sciences | 0 | 0.0% |
| Psychology | 0 | 0.0% |
| Social Sciences | 6 | 5.1% |
| Engineering | 3 | 2.5% |
| Multidisciplinary Studies | 0 | 0.0% |
| Science & Technology | 24 | 20.3% |
| Business | 46 | 39.0% |
| Education | 11 | 9.3% |
| Literature & Languages | 3 | 2.5% |
| Liberal Arts & History | 3 | 2.5% |
| Visual & Performing Arts | 0 | 0.0% |
| Communications | 0 | 0.0% |
| Arts & Humanities | 18 | 15.2% |
| Total | 118 | 100.0% |
Transportation & Commute in Middlesex
Vehicle Availability by Sex in Middlesex
The most prevalent vehicle ownership categories in Middlesex are males with 2 vehicles (96, accounting for 42.3%) and females with 2 vehicles (92, making up 37.2%).
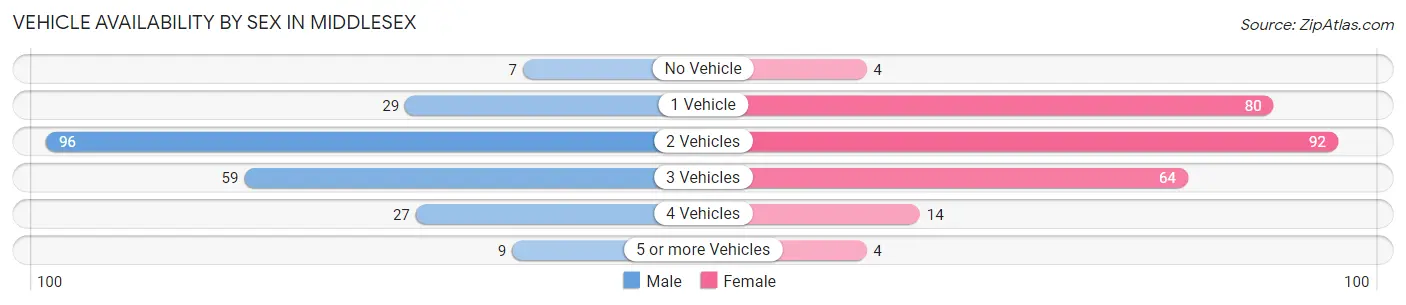
| Vehicles Available | Male | Female |
| No Vehicle | 7 (3.1%) | 4 (1.5%) |
| 1 Vehicle | 29 (12.8%) | 80 (31.0%) |
| 2 Vehicles | 96 (42.3%) | 92 (35.7%) |
| 3 Vehicles | 59 (26.0%) | 64 (24.8%) |
| 4 Vehicles | 27 (11.9%) | 14 (5.4%) |
| 5 or more Vehicles | 9 (4.0%) | 4 (1.5%) |
| Total | 227 (100.0%) | 258 (100.0%) |
Commute Time in Middlesex
The most frequently occuring commute durations in Middlesex are 10 to 14 minutes (71 commuters, 15.2%), 60 to 89 minutes (68 commuters, 14.5%), and 45 to 59 minutes (63 commuters, 13.5%).
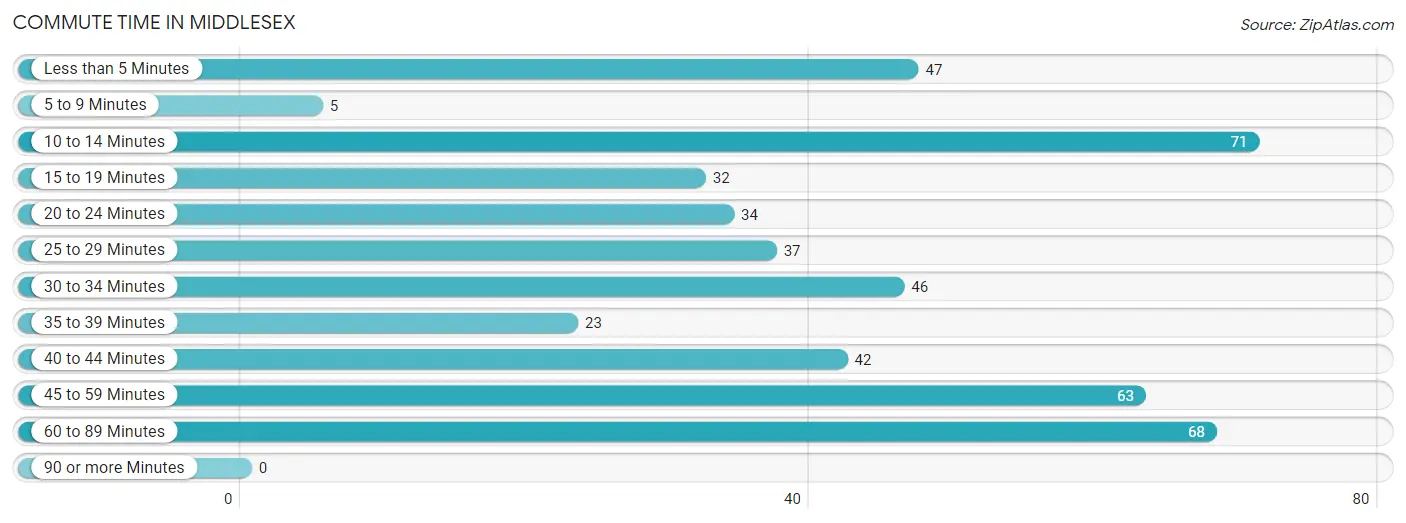
| Commute Time | # Commuters | % Commuters |
| Less than 5 Minutes | 47 | 10.0% |
| 5 to 9 Minutes | 5 | 1.1% |
| 10 to 14 Minutes | 71 | 15.2% |
| 15 to 19 Minutes | 32 | 6.8% |
| 20 to 24 Minutes | 34 | 7.3% |
| 25 to 29 Minutes | 37 | 7.9% |
| 30 to 34 Minutes | 46 | 9.8% |
| 35 to 39 Minutes | 23 | 4.9% |
| 40 to 44 Minutes | 42 | 9.0% |
| 45 to 59 Minutes | 63 | 13.5% |
| 60 to 89 Minutes | 68 | 14.5% |
| 90 or more Minutes | 0 | 0.0% |
Commute Time by Sex in Middlesex
The most common commute times in Middlesex are 45 to 59 minutes (35 commuters, 16.0%) for males and less than 5 minutes (41 commuters, 16.5%) for females.
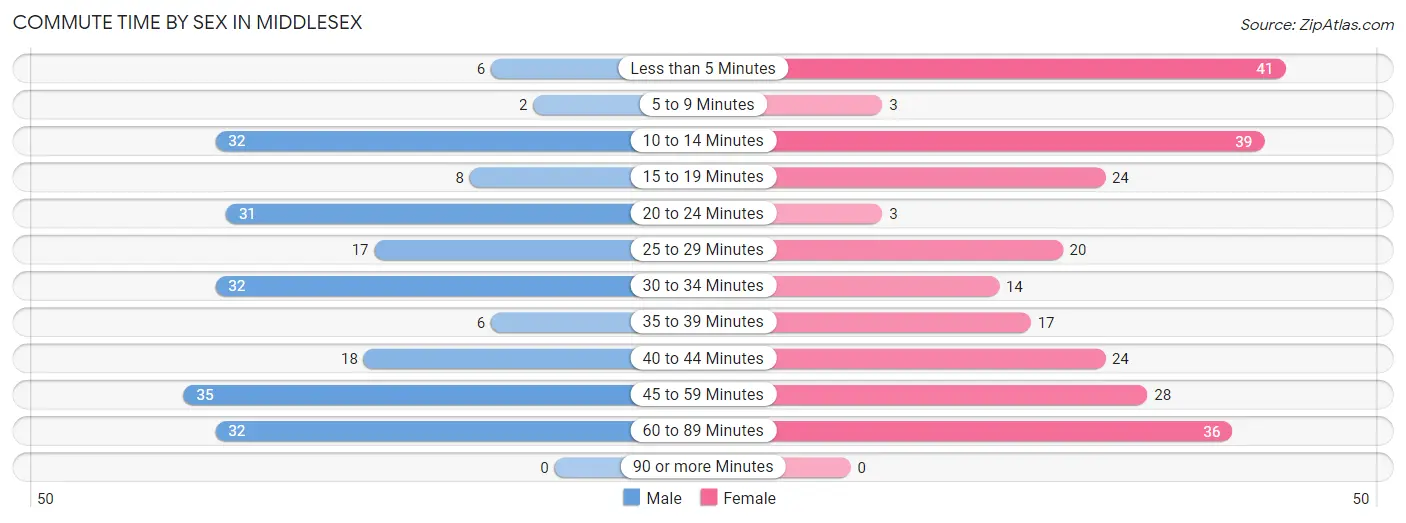
| Commute Time | Male | Female |
| Less than 5 Minutes | 6 (2.7%) | 41 (16.5%) |
| 5 to 9 Minutes | 2 (0.9%) | 3 (1.2%) |
| 10 to 14 Minutes | 32 (14.6%) | 39 (15.7%) |
| 15 to 19 Minutes | 8 (3.6%) | 24 (9.6%) |
| 20 to 24 Minutes | 31 (14.2%) | 3 (1.2%) |
| 25 to 29 Minutes | 17 (7.8%) | 20 (8.0%) |
| 30 to 34 Minutes | 32 (14.6%) | 14 (5.6%) |
| 35 to 39 Minutes | 6 (2.7%) | 17 (6.8%) |
| 40 to 44 Minutes | 18 (8.2%) | 24 (9.6%) |
| 45 to 59 Minutes | 35 (16.0%) | 28 (11.2%) |
| 60 to 89 Minutes | 32 (14.6%) | 36 (14.5%) |
| 90 or more Minutes | 0 (0.0%) | 0 (0.0%) |
Time of Departure to Work by Sex in Middlesex
The most frequent times of departure to work in Middlesex are 7:00 AM to 7:29 AM (43, 19.6%) for males and 9:00 AM to 9:59 AM (53, 21.3%) for females.
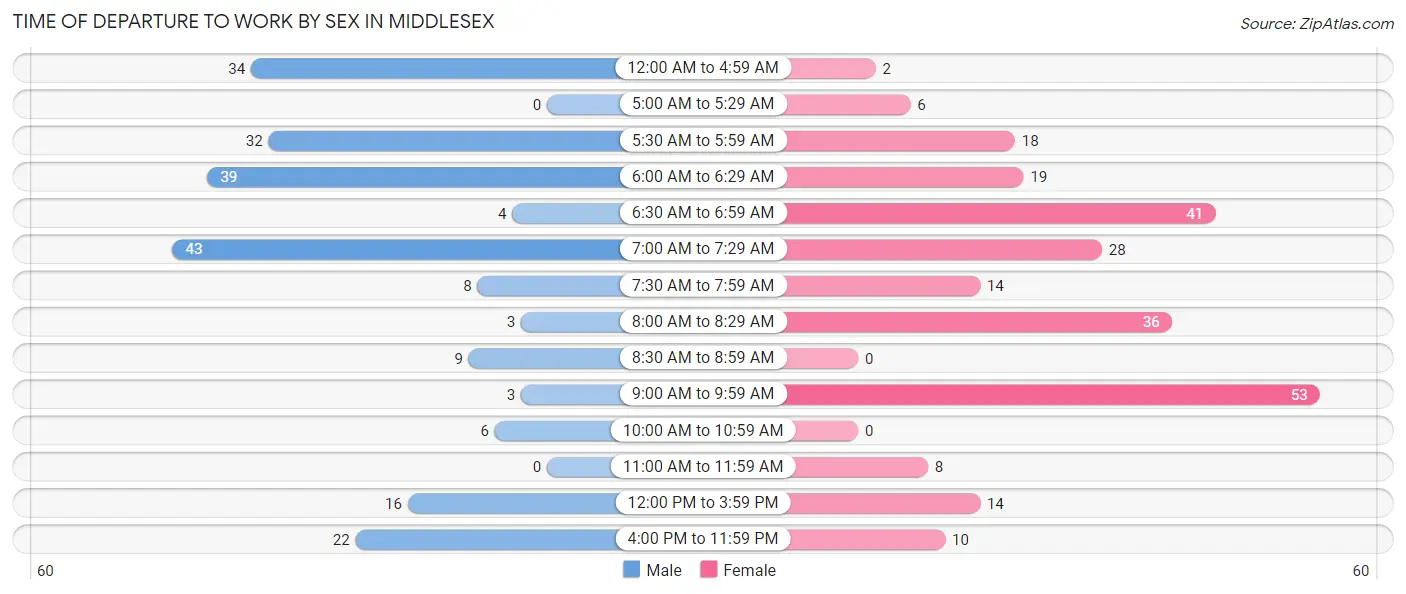
| Time of Departure | Male | Female |
| 12:00 AM to 4:59 AM | 34 (15.5%) | 2 (0.8%) |
| 5:00 AM to 5:29 AM | 0 (0.0%) | 6 (2.4%) |
| 5:30 AM to 5:59 AM | 32 (14.6%) | 18 (7.2%) |
| 6:00 AM to 6:29 AM | 39 (17.8%) | 19 (7.6%) |
| 6:30 AM to 6:59 AM | 4 (1.8%) | 41 (16.5%) |
| 7:00 AM to 7:29 AM | 43 (19.6%) | 28 (11.2%) |
| 7:30 AM to 7:59 AM | 8 (3.6%) | 14 (5.6%) |
| 8:00 AM to 8:29 AM | 3 (1.4%) | 36 (14.5%) |
| 8:30 AM to 8:59 AM | 9 (4.1%) | 0 (0.0%) |
| 9:00 AM to 9:59 AM | 3 (1.4%) | 53 (21.3%) |
| 10:00 AM to 10:59 AM | 6 (2.7%) | 0 (0.0%) |
| 11:00 AM to 11:59 AM | 0 (0.0%) | 8 (3.2%) |
| 12:00 PM to 3:59 PM | 16 (7.3%) | 14 (5.6%) |
| 4:00 PM to 11:59 PM | 22 (10.1%) | 10 (4.0%) |
| Total | 219 (100.0%) | 249 (100.0%) |
Housing Occupancy in Middlesex
Occupancy by Ownership in Middlesex
Of the total 433 dwellings in Middlesex, owner-occupied units account for 254 (58.7%), while renter-occupied units make up 179 (41.3%).
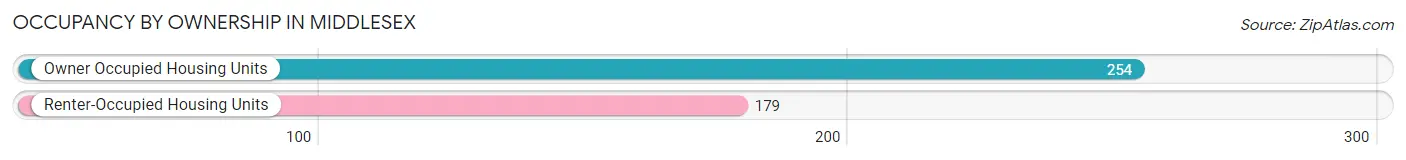
| Occupancy | # Housing Units | % Housing Units |
| Owner Occupied Housing Units | 254 | 58.7% |
| Renter-Occupied Housing Units | 179 | 41.3% |
| Total Occupied Housing Units | 433 | 100.0% |
Occupancy by Household Size in Middlesex
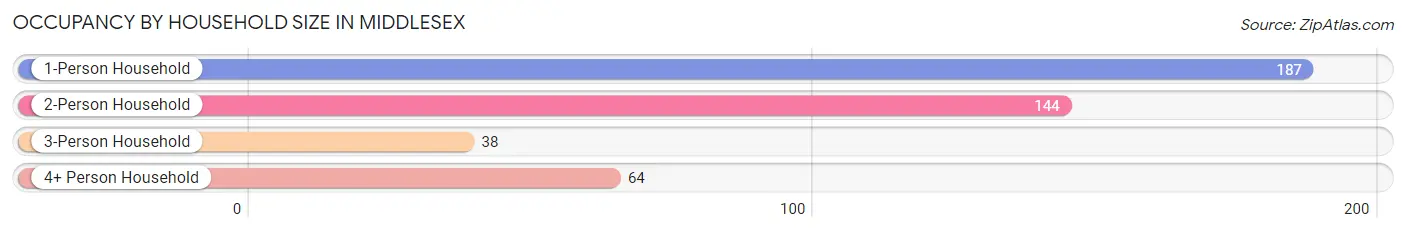
| Household Size | # Housing Units | % Housing Units |
| 1-Person Household | 187 | 43.2% |
| 2-Person Household | 144 | 33.3% |
| 3-Person Household | 38 | 8.8% |
| 4+ Person Household | 64 | 14.8% |
| Total Housing Units | 433 | 100.0% |
Occupancy by Ownership by Household Size in Middlesex
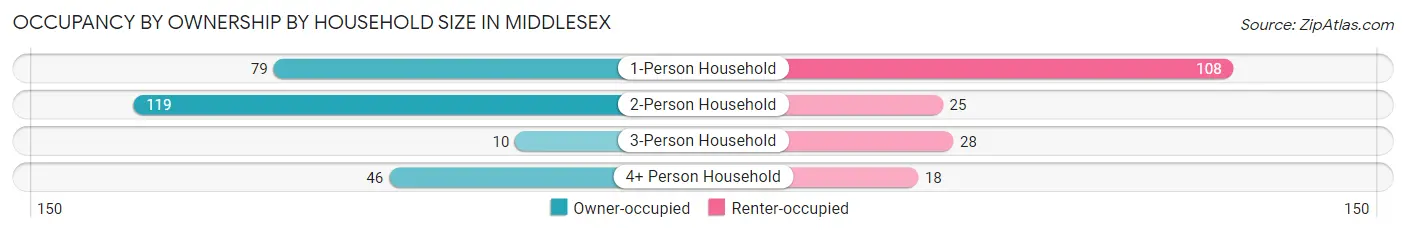
| Household Size | Owner-occupied | Renter-occupied |
| 1-Person Household | 79 (42.2%) | 108 (57.8%) |
| 2-Person Household | 119 (82.6%) | 25 (17.4%) |
| 3-Person Household | 10 (26.3%) | 28 (73.7%) |
| 4+ Person Household | 46 (71.9%) | 18 (28.1%) |
| Total Housing Units | 254 (58.7%) | 179 (41.3%) |
Occupancy by Educational Attainment in Middlesex
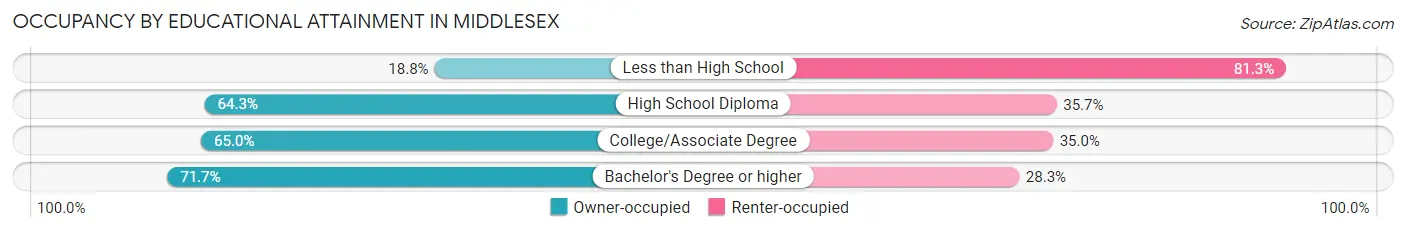
| Household Size | Owner-occupied | Renter-occupied |
| Less than High School | 12 (18.8%) | 52 (81.2%) |
| High School Diploma | 126 (64.3%) | 70 (35.7%) |
| College/Associate Degree | 78 (65.0%) | 42 (35.0%) |
| Bachelor's Degree or higher | 38 (71.7%) | 15 (28.3%) |
Occupancy by Age of Householder in Middlesex
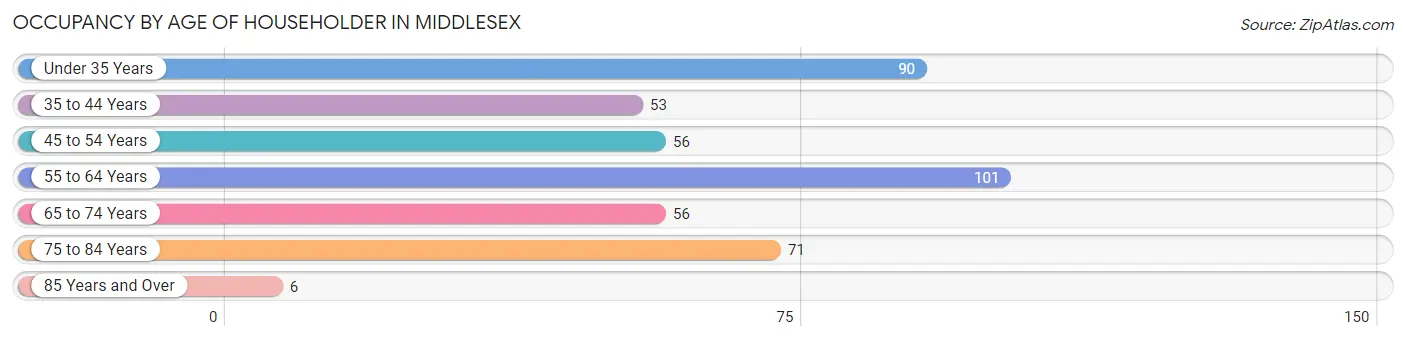
| Age Bracket | # Households | % Households |
| Under 35 Years | 90 | 20.8% |
| 35 to 44 Years | 53 | 12.2% |
| 45 to 54 Years | 56 | 12.9% |
| 55 to 64 Years | 101 | 23.3% |
| 65 to 74 Years | 56 | 12.9% |
| 75 to 84 Years | 71 | 16.4% |
| 85 Years and Over | 6 | 1.4% |
| Total | 433 | 100.0% |
Housing Finances in Middlesex
Median Income by Occupancy in Middlesex
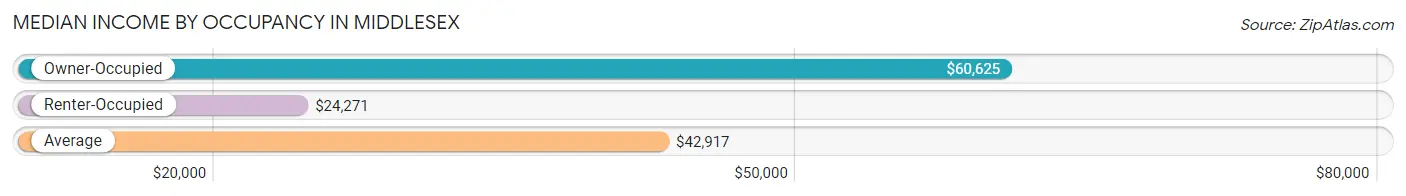
| Occupancy Type | # Households | Median Income |
| Owner-Occupied | 254 (58.7%) | $60,625 |
| Renter-Occupied | 179 (41.3%) | $24,271 |
| Average | 433 (100.0%) | $42,917 |
Occupancy by Householder Income Bracket in Middlesex
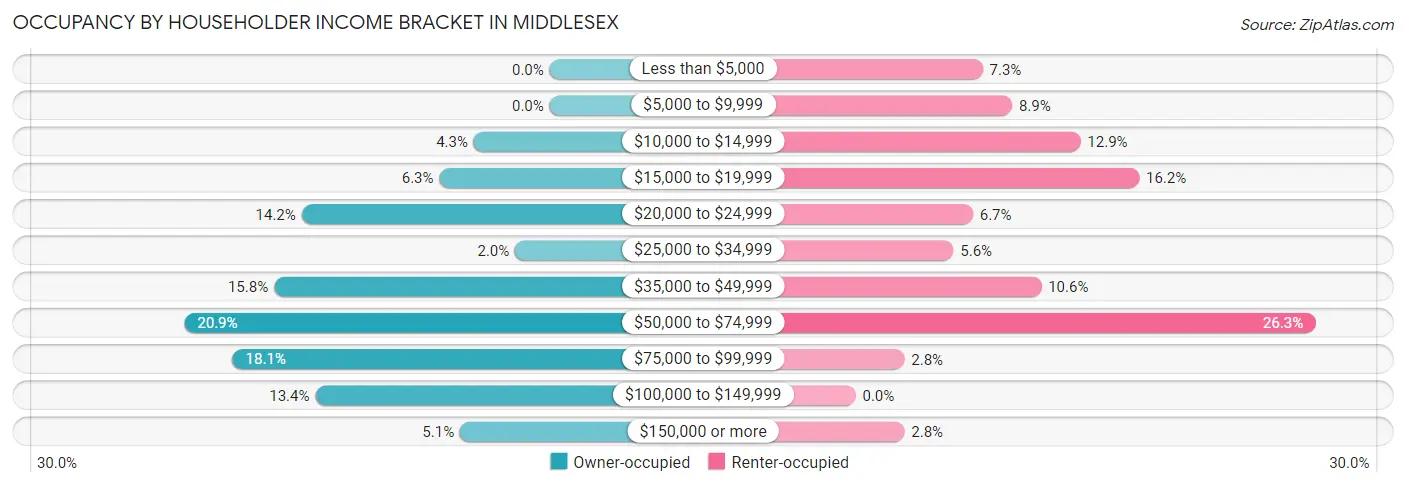
| Income Bracket | Owner-occupied | Renter-occupied |
| Less than $5,000 | 0 (0.0%) | 13 (7.3%) |
| $5,000 to $9,999 | 0 (0.0%) | 16 (8.9%) |
| $10,000 to $14,999 | 11 (4.3%) | 23 (12.9%) |
| $15,000 to $19,999 | 16 (6.3%) | 29 (16.2%) |
| $20,000 to $24,999 | 36 (14.2%) | 12 (6.7%) |
| $25,000 to $34,999 | 5 (2.0%) | 10 (5.6%) |
| $35,000 to $49,999 | 40 (15.8%) | 19 (10.6%) |
| $50,000 to $74,999 | 53 (20.9%) | 47 (26.3%) |
| $75,000 to $99,999 | 46 (18.1%) | 5 (2.8%) |
| $100,000 to $149,999 | 34 (13.4%) | 0 (0.0%) |
| $150,000 or more | 13 (5.1%) | 5 (2.8%) |
| Total | 254 (100.0%) | 179 (100.0%) |
Monthly Housing Cost Tiers in Middlesex
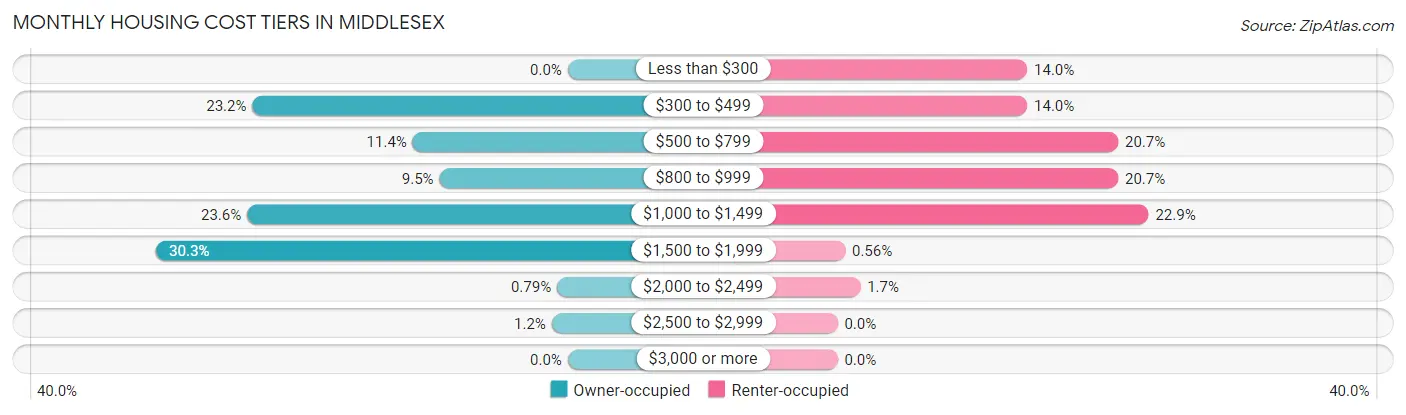
| Monthly Cost | Owner-occupied | Renter-occupied |
| Less than $300 | 0 (0.0%) | 25 (14.0%) |
| $300 to $499 | 59 (23.2%) | 25 (14.0%) |
| $500 to $799 | 29 (11.4%) | 37 (20.7%) |
| $800 to $999 | 24 (9.5%) | 37 (20.7%) |
| $1,000 to $1,499 | 60 (23.6%) | 41 (22.9%) |
| $1,500 to $1,999 | 77 (30.3%) | 1 (0.6%) |
| $2,000 to $2,499 | 2 (0.8%) | 3 (1.7%) |
| $2,500 to $2,999 | 3 (1.2%) | 0 (0.0%) |
| $3,000 or more | 0 (0.0%) | 0 (0.0%) |
| Total | 254 (100.0%) | 179 (100.0%) |
Physical Housing Characteristics in Middlesex
Housing Structures in Middlesex
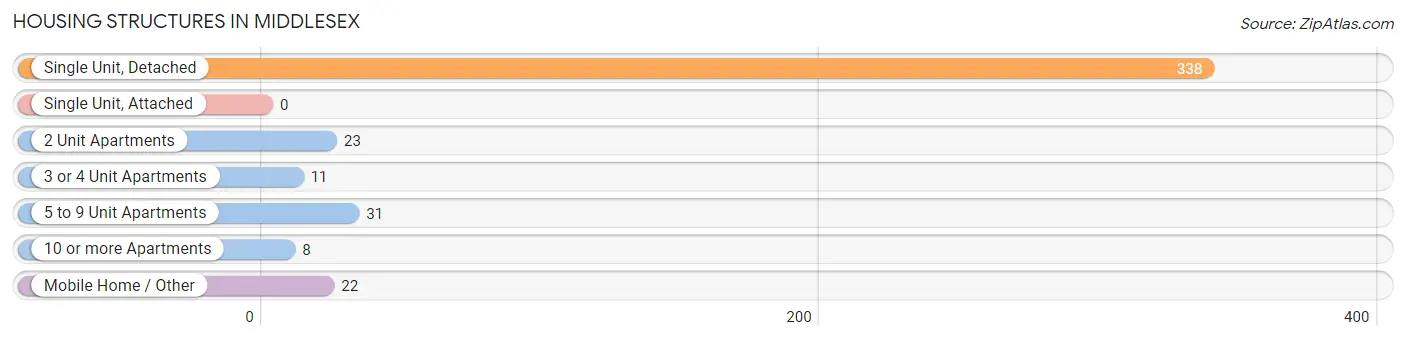
| Structure Type | # Housing Units | % Housing Units |
| Single Unit, Detached | 338 | 78.1% |
| Single Unit, Attached | 0 | 0.0% |
| 2 Unit Apartments | 23 | 5.3% |
| 3 or 4 Unit Apartments | 11 | 2.5% |
| 5 to 9 Unit Apartments | 31 | 7.2% |
| 10 or more Apartments | 8 | 1.8% |
| Mobile Home / Other | 22 | 5.1% |
| Total | 433 | 100.0% |
Housing Structures by Occupancy in Middlesex
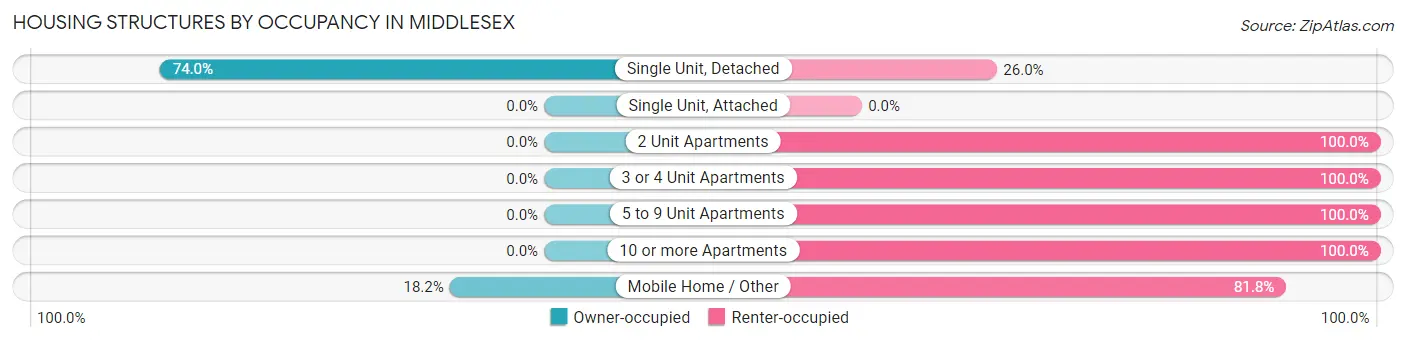
| Structure Type | Owner-occupied | Renter-occupied |
| Single Unit, Detached | 250 (74.0%) | 88 (26.0%) |
| Single Unit, Attached | 0 (0.0%) | 0 (0.0%) |
| 2 Unit Apartments | 0 (0.0%) | 23 (100.0%) |
| 3 or 4 Unit Apartments | 0 (0.0%) | 11 (100.0%) |
| 5 to 9 Unit Apartments | 0 (0.0%) | 31 (100.0%) |
| 10 or more Apartments | 0 (0.0%) | 8 (100.0%) |
| Mobile Home / Other | 4 (18.2%) | 18 (81.8%) |
| Total | 254 (58.7%) | 179 (41.3%) |
Housing Structures by Number of Rooms in Middlesex
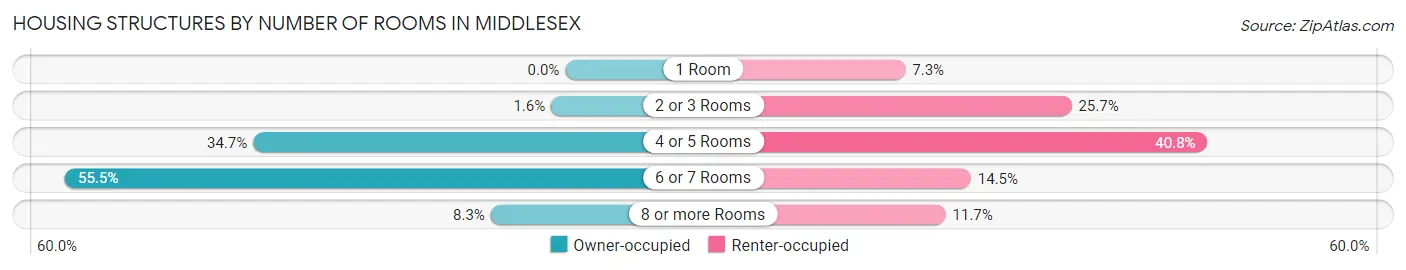
| Number of Rooms | Owner-occupied | Renter-occupied |
| 1 Room | 0 (0.0%) | 13 (7.3%) |
| 2 or 3 Rooms | 4 (1.6%) | 46 (25.7%) |
| 4 or 5 Rooms | 88 (34.6%) | 73 (40.8%) |
| 6 or 7 Rooms | 141 (55.5%) | 26 (14.5%) |
| 8 or more Rooms | 21 (8.3%) | 21 (11.7%) |
| Total | 254 (100.0%) | 179 (100.0%) |
Housing Structure by Heating Type in Middlesex
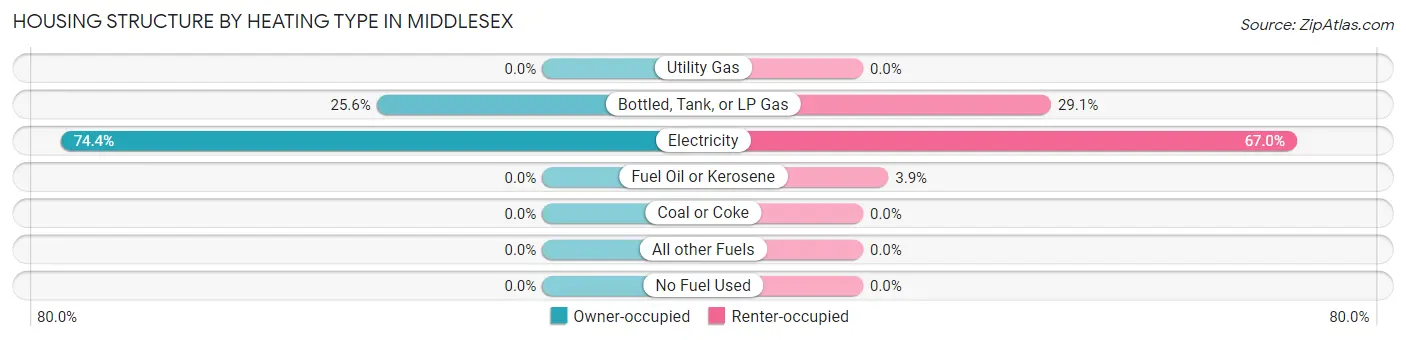
| Heating Type | Owner-occupied | Renter-occupied |
| Utility Gas | 0 (0.0%) | 0 (0.0%) |
| Bottled, Tank, or LP Gas | 65 (25.6%) | 52 (29.0%) |
| Electricity | 189 (74.4%) | 120 (67.0%) |
| Fuel Oil or Kerosene | 0 (0.0%) | 7 (3.9%) |
| Coal or Coke | 0 (0.0%) | 0 (0.0%) |
| All other Fuels | 0 (0.0%) | 0 (0.0%) |
| No Fuel Used | 0 (0.0%) | 0 (0.0%) |
| Total | 254 (100.0%) | 179 (100.0%) |
Household Vehicle Usage in Middlesex
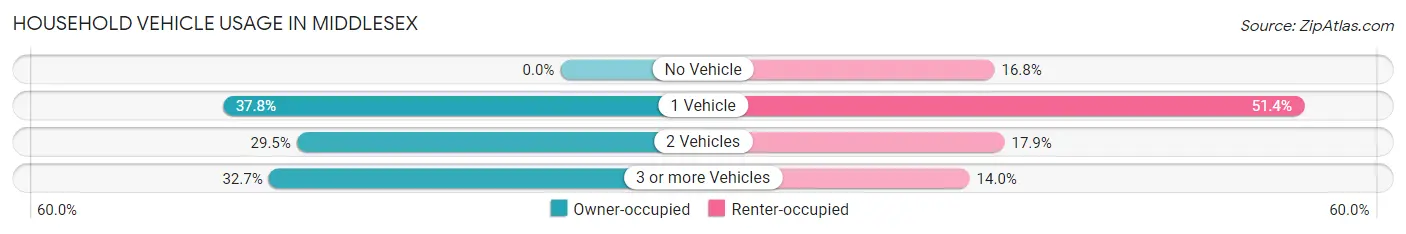
| Vehicles per Household | Owner-occupied | Renter-occupied |
| No Vehicle | 0 (0.0%) | 30 (16.8%) |
| 1 Vehicle | 96 (37.8%) | 92 (51.4%) |
| 2 Vehicles | 75 (29.5%) | 32 (17.9%) |
| 3 or more Vehicles | 83 (32.7%) | 25 (14.0%) |
| Total | 254 (100.0%) | 179 (100.0%) |
Real Estate & Mortgages in Middlesex
Real Estate and Mortgage Overview in Middlesex
| Characteristic | Without Mortgage | With Mortgage |
| Housing Units | 94 | 160 |
| Median Property Value | $132,100 | $210,000 |
| Median Household Income | $39,423 | $13 |
| Monthly Housing Costs | $473 | $0 |
| Real Estate Taxes | $840 | $0 |
Property Value by Mortgage Status in Middlesex
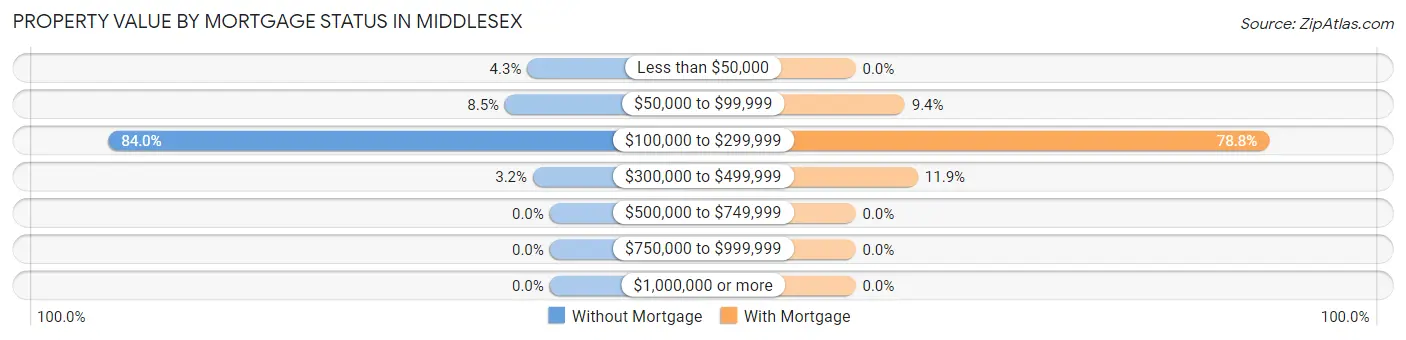
| Property Value | Without Mortgage | With Mortgage |
| Less than $50,000 | 4 (4.3%) | 0 (0.0%) |
| $50,000 to $99,999 | 8 (8.5%) | 15 (9.4%) |
| $100,000 to $299,999 | 79 (84.0%) | 126 (78.7%) |
| $300,000 to $499,999 | 3 (3.2%) | 19 (11.9%) |
| $500,000 to $749,999 | 0 (0.0%) | 0 (0.0%) |
| $750,000 to $999,999 | 0 (0.0%) | 0 (0.0%) |
| $1,000,000 or more | 0 (0.0%) | 0 (0.0%) |
| Total | 94 (100.0%) | 160 (100.0%) |
Household Income by Mortgage Status in Middlesex
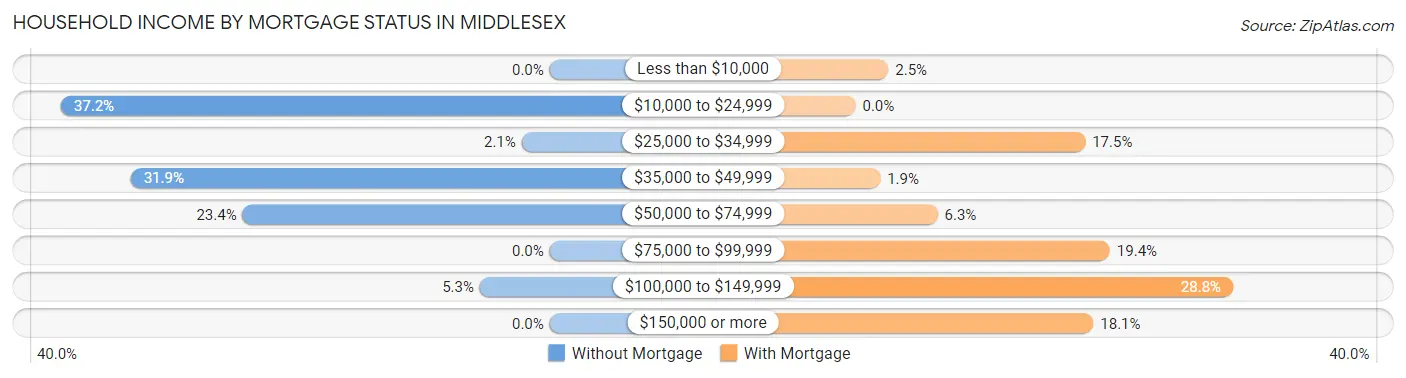
| Household Income | Without Mortgage | With Mortgage |
| Less than $10,000 | 0 (0.0%) | 4 (2.5%) |
| $10,000 to $24,999 | 35 (37.2%) | 0 (0.0%) |
| $25,000 to $34,999 | 2 (2.1%) | 28 (17.5%) |
| $35,000 to $49,999 | 30 (31.9%) | 3 (1.9%) |
| $50,000 to $74,999 | 22 (23.4%) | 10 (6.2%) |
| $75,000 to $99,999 | 0 (0.0%) | 31 (19.4%) |
| $100,000 to $149,999 | 5 (5.3%) | 46 (28.7%) |
| $150,000 or more | 0 (0.0%) | 29 (18.1%) |
| Total | 94 (100.0%) | 160 (100.0%) |
Property Value to Household Income Ratio in Middlesex
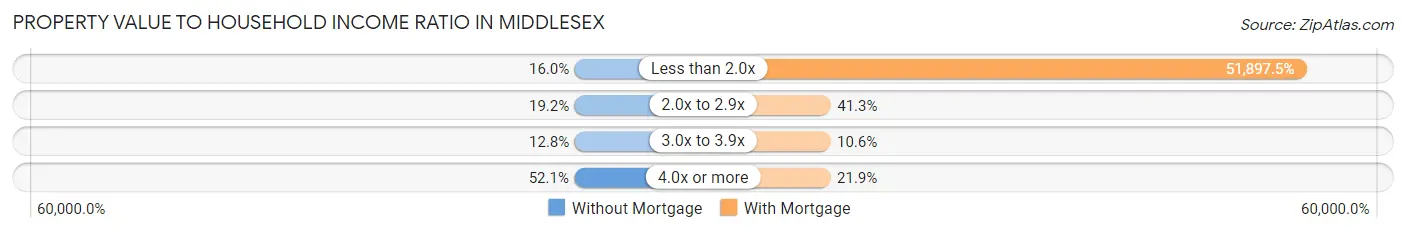
| Value-to-Income Ratio | Without Mortgage | With Mortgage |
| Less than 2.0x | 15 (16.0%) | 83,036 (51,897.5%) |
| 2.0x to 2.9x | 18 (19.2%) | 66 (41.2%) |
| 3.0x to 3.9x | 12 (12.8%) | 17 (10.6%) |
| 4.0x or more | 49 (52.1%) | 35 (21.9%) |
| Total | 94 (100.0%) | 160 (100.0%) |
Real Estate Taxes by Mortgage Status in Middlesex
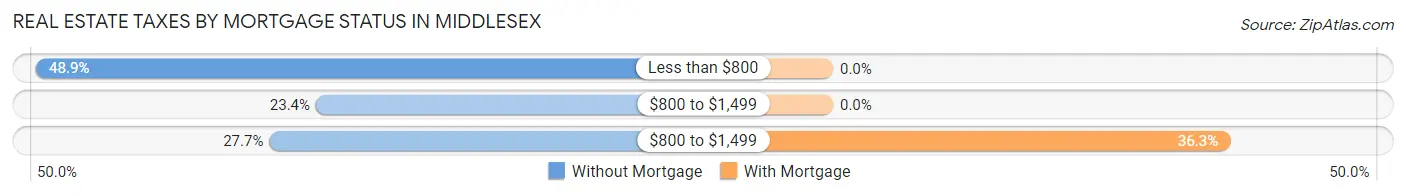
| Property Taxes | Without Mortgage | With Mortgage |
| Less than $800 | 46 (48.9%) | 0 (0.0%) |
| $800 to $1,499 | 22 (23.4%) | 0 (0.0%) |
| $800 to $1,499 | 26 (27.7%) | 58 (36.2%) |
| Total | 94 (100.0%) | 160 (100.0%) |
Health & Disability in Middlesex
Health Insurance Coverage by Age in Middlesex
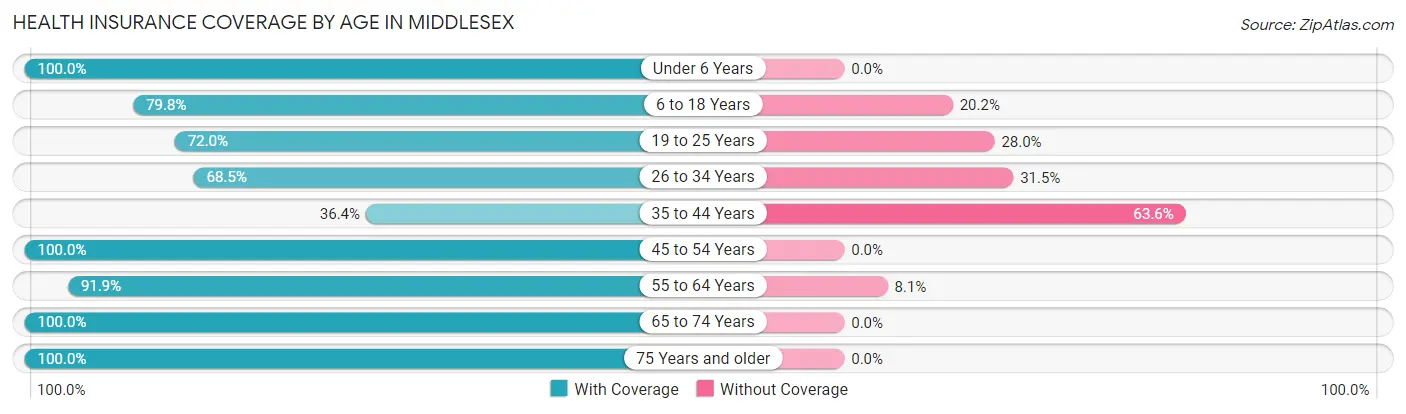
| Age Bracket | With Coverage | Without Coverage |
| Under 6 Years | 93 (100.0%) | 0 (0.0%) |
| 6 to 18 Years | 71 (79.8%) | 18 (20.2%) |
| 19 to 25 Years | 90 (72.0%) | 35 (28.0%) |
| 26 to 34 Years | 87 (68.5%) | 40 (31.5%) |
| 35 to 44 Years | 40 (36.4%) | 70 (63.6%) |
| 45 to 54 Years | 97 (100.0%) | 0 (0.0%) |
| 55 to 64 Years | 148 (91.9%) | 13 (8.1%) |
| 65 to 74 Years | 78 (100.0%) | 0 (0.0%) |
| 75 Years and older | 83 (100.0%) | 0 (0.0%) |
| Total | 787 (81.7%) | 176 (18.3%) |
Health Insurance Coverage by Citizenship Status in Middlesex
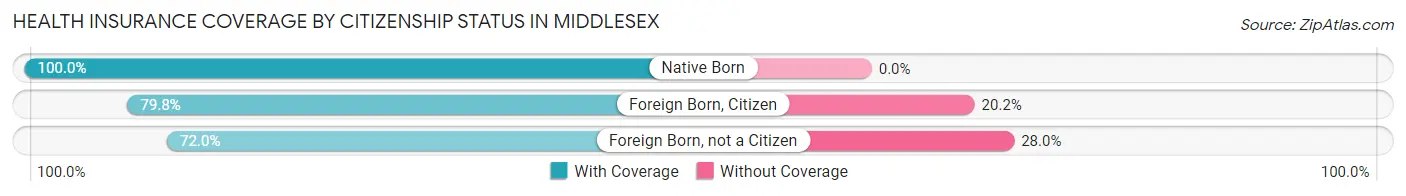
| Citizenship Status | With Coverage | Without Coverage |
| Native Born | 93 (100.0%) | 0 (0.0%) |
| Foreign Born, Citizen | 71 (79.8%) | 18 (20.2%) |
| Foreign Born, not a Citizen | 90 (72.0%) | 35 (28.0%) |
Health Insurance Coverage by Household Income in Middlesex
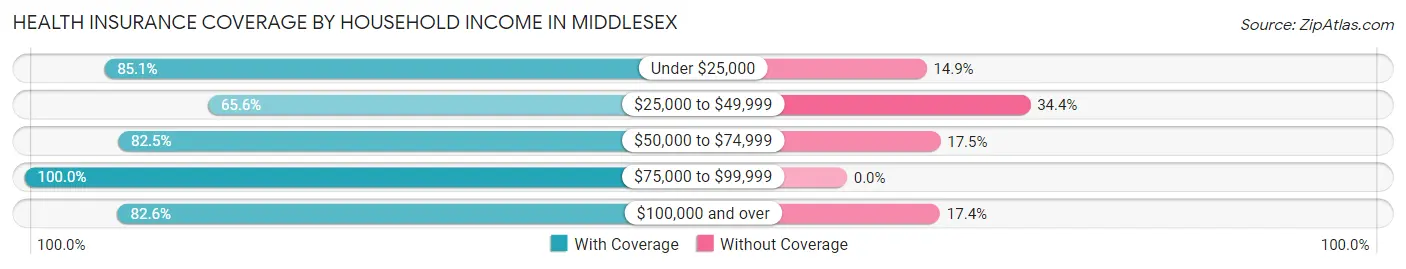
| Household Income | With Coverage | Without Coverage |
| Under $25,000 | 154 (85.1%) | 27 (14.9%) |
| $25,000 to $49,999 | 128 (65.6%) | 67 (34.4%) |
| $50,000 to $74,999 | 226 (82.5%) | 48 (17.5%) |
| $75,000 to $99,999 | 118 (100.0%) | 0 (0.0%) |
| $100,000 and over | 161 (82.6%) | 34 (17.4%) |
Public vs Private Health Insurance Coverage by Age in Middlesex
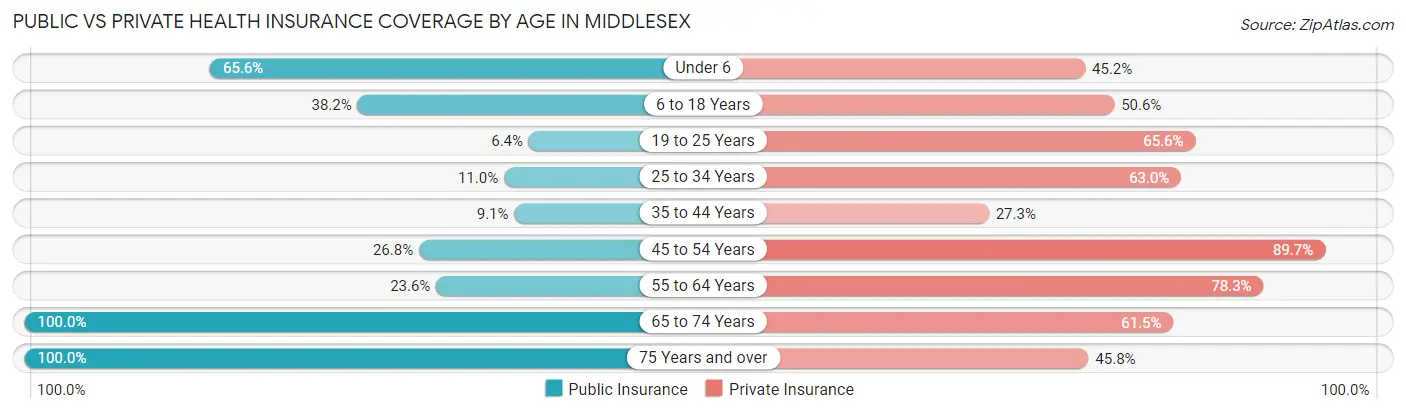
| Age Bracket | Public Insurance | Private Insurance |
| Under 6 | 61 (65.6%) | 42 (45.2%) |
| 6 to 18 Years | 34 (38.2%) | 45 (50.6%) |
| 19 to 25 Years | 8 (6.4%) | 82 (65.6%) |
| 25 to 34 Years | 14 (11.0%) | 80 (63.0%) |
| 35 to 44 Years | 10 (9.1%) | 30 (27.3%) |
| 45 to 54 Years | 26 (26.8%) | 87 (89.7%) |
| 55 to 64 Years | 38 (23.6%) | 126 (78.3%) |
| 65 to 74 Years | 78 (100.0%) | 48 (61.5%) |
| 75 Years and over | 83 (100.0%) | 38 (45.8%) |
| Total | 352 (36.5%) | 578 (60.0%) |
Disability Status by Sex by Age in Middlesex
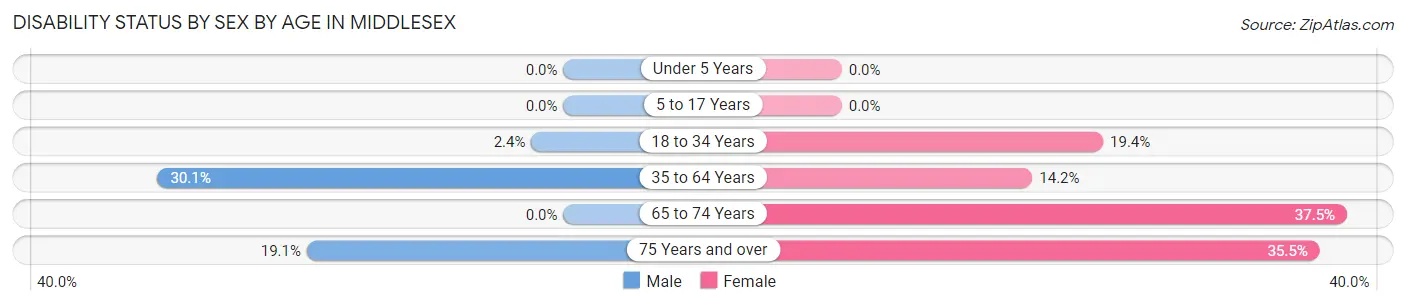
| Age Bracket | Male | Female |
| Under 5 Years | 0 (0.0%) | 0 (0.0%) |
| 5 to 17 Years | 0 (0.0%) | 0 (0.0%) |
| 18 to 34 Years | 3 (2.4%) | 26 (19.4%) |
| 35 to 64 Years | 47 (30.1%) | 30 (14.1%) |
| 65 to 74 Years | 0 (0.0%) | 18 (37.5%) |
| 75 Years and over | 4 (19.1%) | 22 (35.5%) |
Disability Class by Sex by Age in Middlesex
Disability Class: Hearing Difficulty
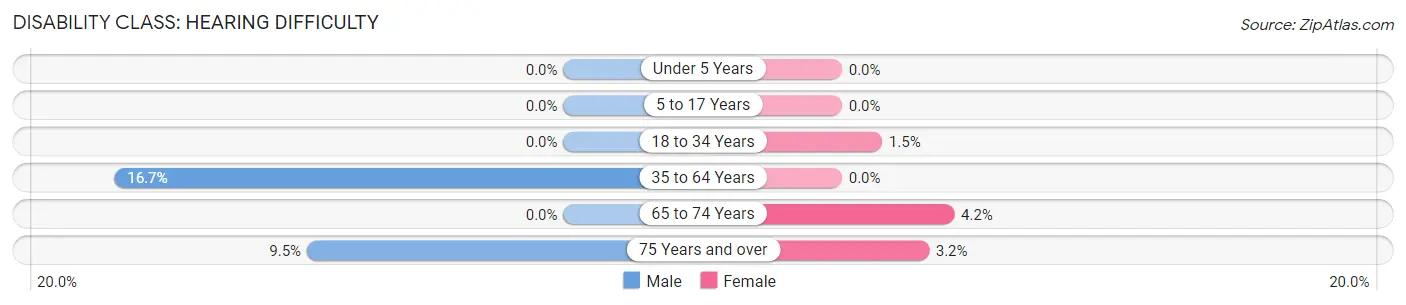
| Age Bracket | Male | Female |
| Under 5 Years | 0 (0.0%) | 0 (0.0%) |
| 5 to 17 Years | 0 (0.0%) | 0 (0.0%) |
| 18 to 34 Years | 0 (0.0%) | 2 (1.5%) |
| 35 to 64 Years | 26 (16.7%) | 0 (0.0%) |
| 65 to 74 Years | 0 (0.0%) | 2 (4.2%) |
| 75 Years and over | 2 (9.5%) | 2 (3.2%) |
Disability Class: Vision Difficulty
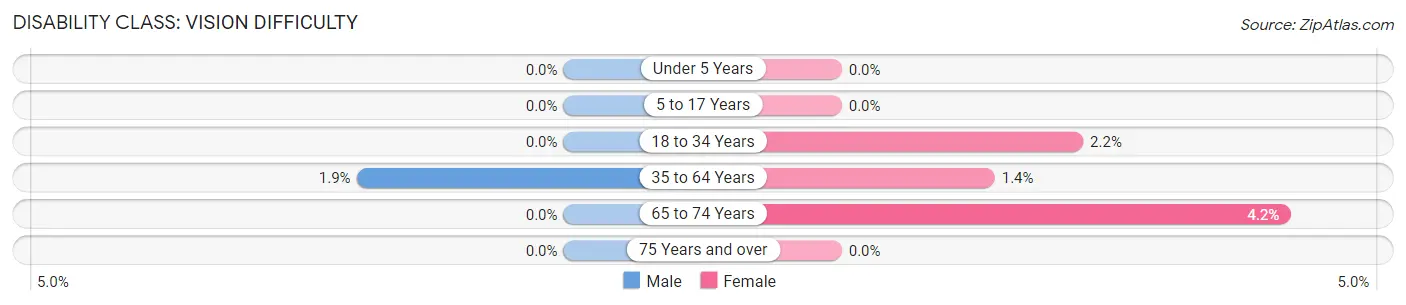
| Age Bracket | Male | Female |
| Under 5 Years | 0 (0.0%) | 0 (0.0%) |
| 5 to 17 Years | 0 (0.0%) | 0 (0.0%) |
| 18 to 34 Years | 0 (0.0%) | 3 (2.2%) |
| 35 to 64 Years | 3 (1.9%) | 3 (1.4%) |
| 65 to 74 Years | 0 (0.0%) | 2 (4.2%) |
| 75 Years and over | 0 (0.0%) | 0 (0.0%) |
Disability Class: Cognitive Difficulty
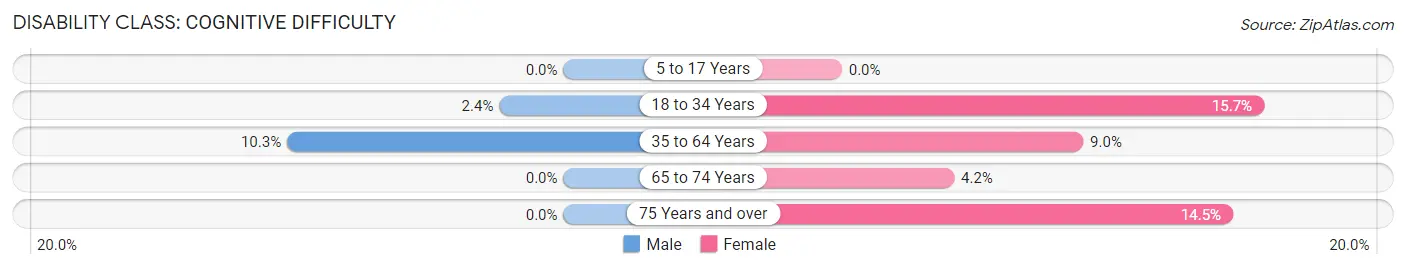
| Age Bracket | Male | Female |
| 5 to 17 Years | 0 (0.0%) | 0 (0.0%) |
| 18 to 34 Years | 3 (2.4%) | 21 (15.7%) |
| 35 to 64 Years | 16 (10.3%) | 19 (9.0%) |
| 65 to 74 Years | 0 (0.0%) | 2 (4.2%) |
| 75 Years and over | 0 (0.0%) | 9 (14.5%) |
Disability Class: Ambulatory Difficulty
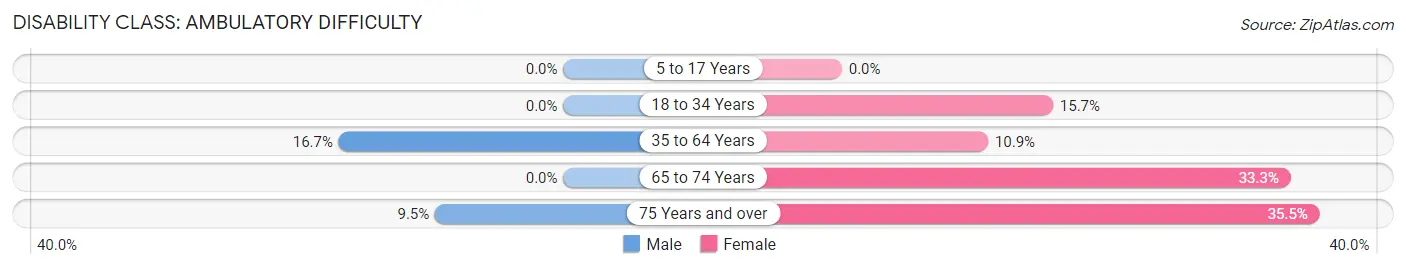
| Age Bracket | Male | Female |
| 5 to 17 Years | 0 (0.0%) | 0 (0.0%) |
| 18 to 34 Years | 0 (0.0%) | 21 (15.7%) |
| 35 to 64 Years | 26 (16.7%) | 23 (10.8%) |
| 65 to 74 Years | 0 (0.0%) | 16 (33.3%) |
| 75 Years and over | 2 (9.5%) | 22 (35.5%) |
Disability Class: Self-Care Difficulty
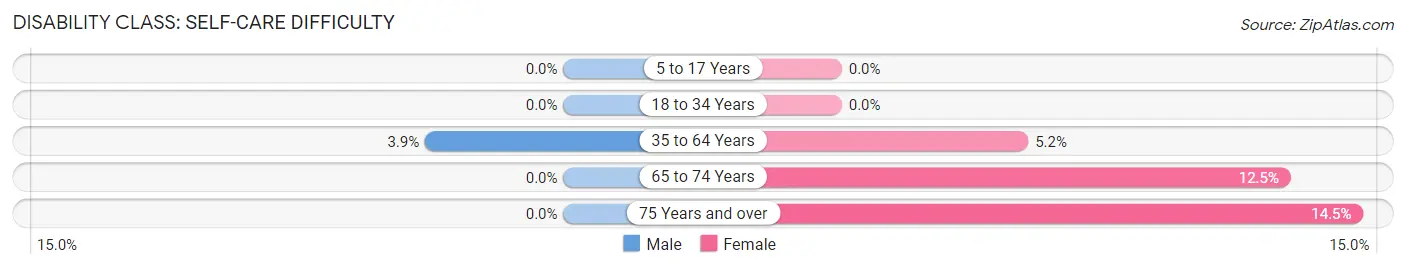
| Age Bracket | Male | Female |
| 5 to 17 Years | 0 (0.0%) | 0 (0.0%) |
| 18 to 34 Years | 0 (0.0%) | 0 (0.0%) |
| 35 to 64 Years | 6 (3.8%) | 11 (5.2%) |
| 65 to 74 Years | 0 (0.0%) | 6 (12.5%) |
| 75 Years and over | 0 (0.0%) | 9 (14.5%) |
Technology Access in Middlesex
Computing Device Access in Middlesex
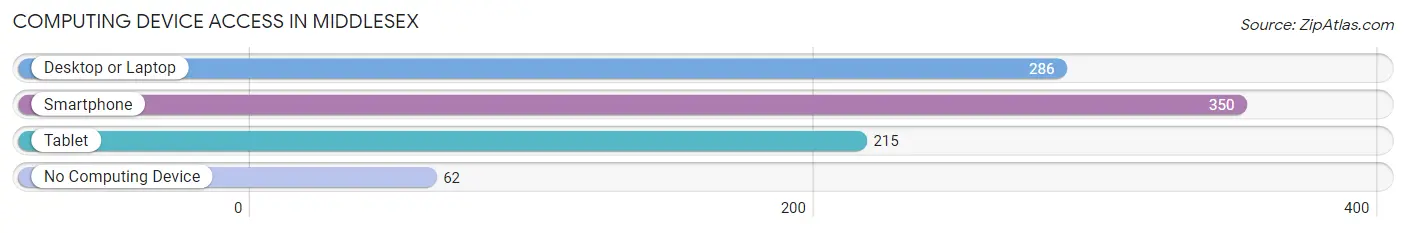
| Device Type | # Households | % Households |
| Desktop or Laptop | 286 | 66.0% |
| Smartphone | 350 | 80.8% |
| Tablet | 215 | 49.6% |
| No Computing Device | 62 | 14.3% |
| Total | 433 | 100.0% |
Internet Access in Middlesex
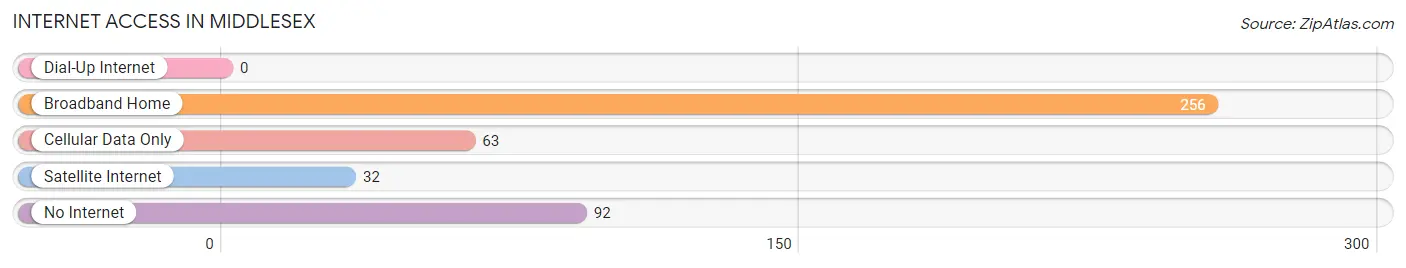
| Internet Type | # Households | % Households |
| Dial-Up Internet | 0 | 0.0% |
| Broadband Home | 256 | 59.1% |
| Cellular Data Only | 63 | 14.5% |
| Satellite Internet | 32 | 7.4% |
| No Internet | 92 | 21.2% |
| Total | 433 | 100.0% |
Middlesex Summary
Middlesex is a small town located in Nash County, North Carolina. It is situated in the northeastern part of the state, about 25 miles east of Raleigh. The town has a population of approximately 1,500 people and is part of the Rocky Mount Metropolitan Statistical Area.
Geography
Middlesex is located in the Coastal Plain region of North Carolina. The town is situated on the banks of the Tar River, which flows through the town and provides a source of recreation for the locals. The town is surrounded by rolling hills and farmland, and is located near the Neuse River. The town is located at an elevation of approximately 200 feet above sea level.
The climate in Middlesex is humid subtropical, with hot, humid summers and mild winters. The average annual temperature is around 70 degrees Fahrenheit, with an average high of around 90 degrees in the summer and an average low of around 50 degrees in the winter. The town receives an average of around 45 inches of precipitation per year, with most of it falling in the summer months.
History
Middlesex was first settled in the late 1700s by a group of settlers from Virginia. The town was originally known as “Middlesex Crossroads” due to its location at the intersection of two major roads. The town was officially incorporated in 1887 and was named after the county in which it is located.
The town was an important stop on the Wilmington and Weldon Railroad, which ran through the town from 1836 to 1868. The railroad was an important factor in the town’s growth and development. The town was also home to a number of mills, which provided employment for many of the town’s residents.
Economy
Middlesex’s economy is largely based on agriculture and manufacturing. The town is home to a number of farms, which produce a variety of crops, including corn, soybeans, cotton, and tobacco. The town is also home to a number of manufacturing companies, which produce a variety of products, including furniture, textiles, and electronics.
The town is also home to a number of small businesses, including restaurants, retail stores, and service providers. The town is also home to a number of government offices, including the Nash County Courthouse and the Nash County Sheriff’s Office.
Demographics
As of the 2010 census, the population of Middlesex was 1,521. The racial makeup of the town was 79.3% White, 17.2% African American, 0.7% Native American, 0.3% Asian, 0.1% Pacific Islander, and 2.4% from other races. The median household income in the town was $37,917, and the median family income was $45,938.
Middlesex is a small town with a rich history and a diverse population. The town is home to a number of farms and manufacturing companies, as well as a number of small businesses. The town is also home to a number of government offices, which provide employment for many of the town’s residents. The town is a great place to live and work, and is a great place to raise a family.
Common Questions
What is the Total Population of Middlesex?
Total Population of Middlesex is 963.
What is the Total Male Population of Middlesex?
Total Male Population of Middlesex is 440.
What is the Total Female Population of Middlesex?
Total Female Population of Middlesex is 523.
What is the Ratio of Males per 100 Females in Middlesex?
There are 84.13 Males per 100 Females in Middlesex.
What is the Ratio of Females per 100 Males in Middlesex?
There are 118.86 Females per 100 Males in Middlesex.
What is the Median Population Age in Middlesex?
Median Population Age in Middlesex is 39.9 Years.
What is the Average Family Size in Middlesex
Average Family Size in Middlesex is 3.4 People.
What is the Average Household Size in Middlesex
Average Household Size in Middlesex is 2.2 People.
What is Per Capita Income in Middlesex?
Per Capita income in Middlesex is $26,437.
What is the Median Family Income in Middlesex?
Median Family Income in Middlesex is $66,250.
What is the Median Household income in Middlesex?
Median Household Income in Middlesex is $42,917.
What is Income or Wage Gap in Middlesex?
Income or Wage Gap in Middlesex is 6.0%.
Women in Middlesex earn 94.0 cents for every dollar earned by a man.
What is Inequality or Gini Index in Middlesex?
Inequality or Gini Index in Middlesex is 0.44.
How Large is the Labor Force in Middlesex?
There are 501 People in the Labor Forcein in Middlesex.
What is the Percentage of People in the Labor Force in Middlesex?
62.9% of People are in the Labor Force in Middlesex.
What is the Unemployment Rate in Middlesex?
Unemployment Rate in Middlesex is 0.8%.