Middleburg, NC
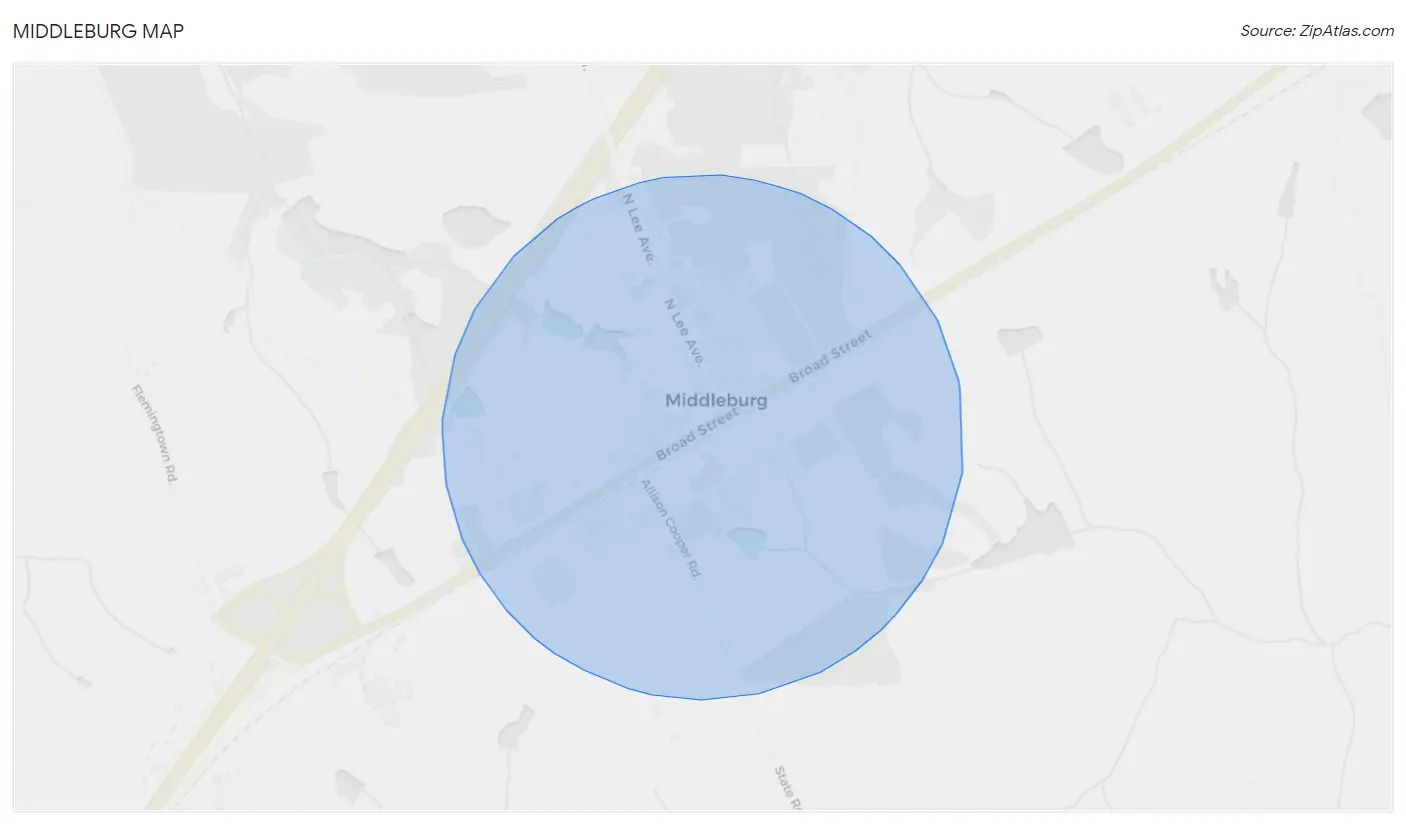
Middleburg Map
Middleburg Overview
223
TOTAL POPULATION
87
MALE POPULATION
136
FEMALE POPULATION
63.97
MALES / 100 FEMALES
156.32
FEMALES / 100 MALES
33.7
MEDIAN AGE
4.3
AVG FAMILY SIZE
2.6
AVG HOUSEHOLD SIZE
$46,078
PER CAPITA INCOME
0.36
INEQUALITY / GINI INDEX
83
LABOR FORCE [ PEOPLE ]
54.6%
PERCENT IN LABOR FORCE
12.0%
UNEMPLOYMENT RATE
Middleburg Zip Codes
Middleburg Area Codes
Race in Middleburg
The most populous races in Middleburg are Black / African American (170 | 76.2%), White / Caucasian (45 | 20.2%), and Two or more Races (8 | 3.6%).
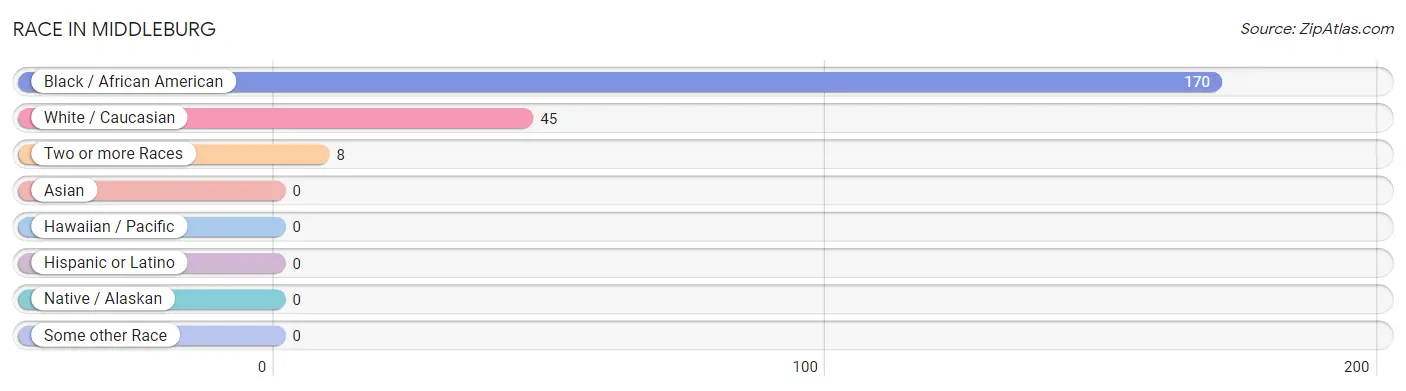
| Race | # Population | % Population |
| Asian | 0 | 0.0% |
| Black / African American | 170 | 76.2% |
| Hawaiian / Pacific | 0 | 0.0% |
| Hispanic or Latino | 0 | 0.0% |
| Native / Alaskan | 0 | 0.0% |
| White / Caucasian | 45 | 20.2% |
| Two or more Races | 8 | 3.6% |
| Some other Race | 0 | 0.0% |
| Total | 223 | 100.0% |
Ancestry in Middleburg
The most populous ancestries reported in Middleburg are American (15 | 6.7%), English (2 | 0.9%), German (2 | 0.9%), and Welsh (2 | 0.9%), together accounting for 9.4% of all Middleburg residents.
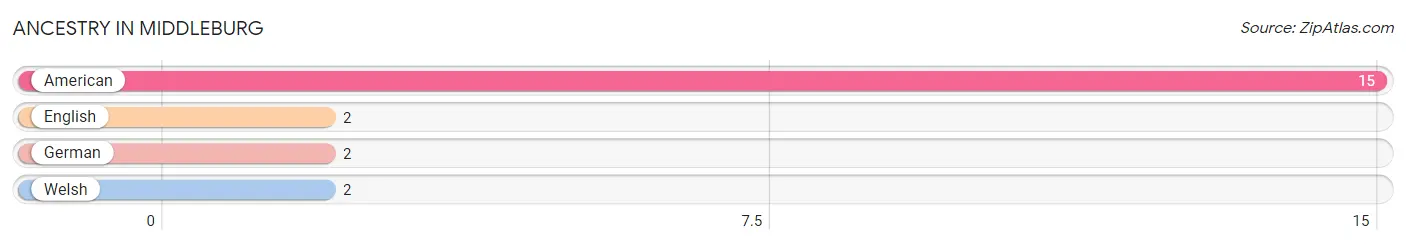
| Ancestry | # Population | % Population |
| American | 15 | 6.7% |
| English | 2 | 0.9% |
| German | 2 | 0.9% |
| Welsh | 2 | 0.9% | View All 4 Rows |
Immigrants in Middleburg
The most numerous immigrant groups reported in Middleburg came from Europe (2 | 0.9%), Germany (2 | 0.9%), and Western Europe (2 | 0.9%), together accounting for 2.7% of all Middleburg residents.
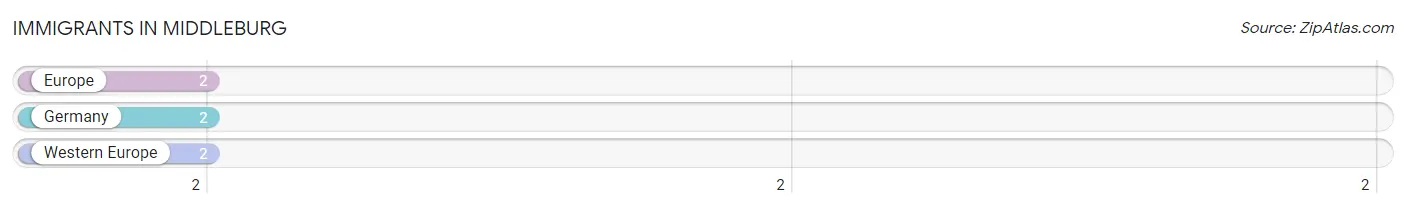
| Immigration Origin | # Population | % Population |
| Europe | 2 | 0.9% |
| Germany | 2 | 0.9% |
| Western Europe | 2 | 0.9% | View All 3 Rows |
Sex and Age in Middleburg
Sex and Age in Middleburg
The most populous age groups in Middleburg are Under 5 Years (43 | 49.4%) for men and 85 Years and over (36 | 26.5%) for women.
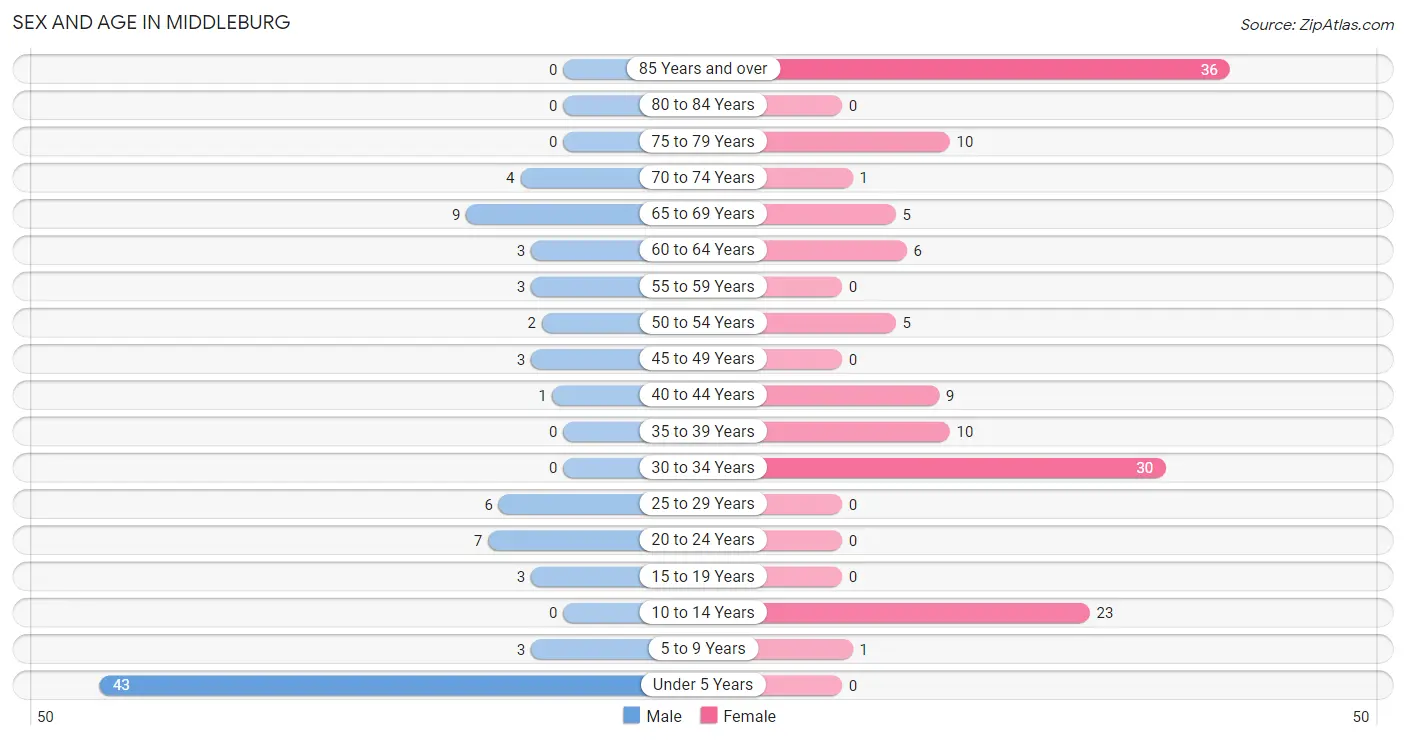
| Age Bracket | Male | Female |
| Under 5 Years | 43 (49.4%) | 0 (0.0%) |
| 5 to 9 Years | 3 (3.5%) | 1 (0.7%) |
| 10 to 14 Years | 0 (0.0%) | 23 (16.9%) |
| 15 to 19 Years | 3 (3.5%) | 0 (0.0%) |
| 20 to 24 Years | 7 (8.1%) | 0 (0.0%) |
| 25 to 29 Years | 6 (6.9%) | 0 (0.0%) |
| 30 to 34 Years | 0 (0.0%) | 30 (22.1%) |
| 35 to 39 Years | 0 (0.0%) | 10 (7.3%) |
| 40 to 44 Years | 1 (1.1%) | 9 (6.6%) |
| 45 to 49 Years | 3 (3.5%) | 0 (0.0%) |
| 50 to 54 Years | 2 (2.3%) | 5 (3.7%) |
| 55 to 59 Years | 3 (3.5%) | 0 (0.0%) |
| 60 to 64 Years | 3 (3.5%) | 6 (4.4%) |
| 65 to 69 Years | 9 (10.3%) | 5 (3.7%) |
| 70 to 74 Years | 4 (4.6%) | 1 (0.7%) |
| 75 to 79 Years | 0 (0.0%) | 10 (7.3%) |
| 80 to 84 Years | 0 (0.0%) | 0 (0.0%) |
| 85 Years and over | 0 (0.0%) | 36 (26.5%) |
| Total | 87 (100.0%) | 136 (100.0%) |
Families and Households in Middleburg
Median Family Size in Middleburg
The median family size in Middleburg is 4.29 persons per family, with single female/mother families (28 | 68.3%) accounting for the largest median family size of 4.61 persons per family. On the other hand, single male/father families (4 | 9.8%) represent the smallest median family size with 2.25 persons per family.
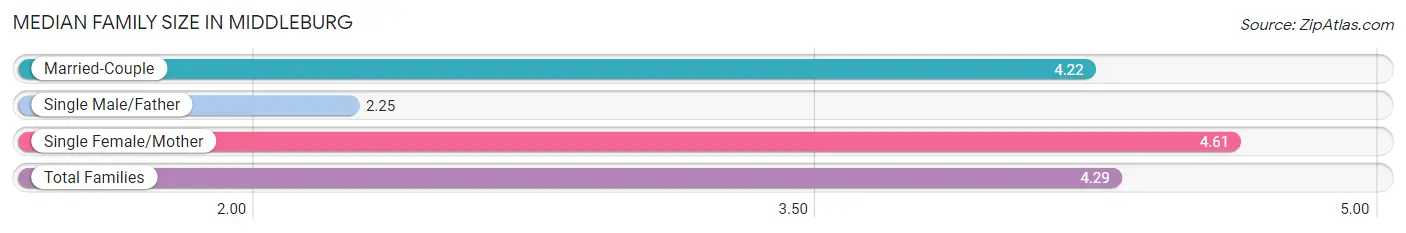
| Family Type | # Families | Family Size |
| Married-Couple | 9 (22.0%) | 4.22 |
| Single Male/Father | 4 (9.8%) | 2.25 |
| Single Female/Mother | 28 (68.3%) | 4.61 |
| Total Families | 41 (100.0%) | 4.29 |
Median Household Size in Middleburg
The median household size in Middleburg is 2.62 persons per household, with single female/mother households (28 | 32.9%) accounting for the largest median household size of 4.61 persons per household. non-family households (44 | 51.8%) represent the smallest median household size with 1.07 persons per household.
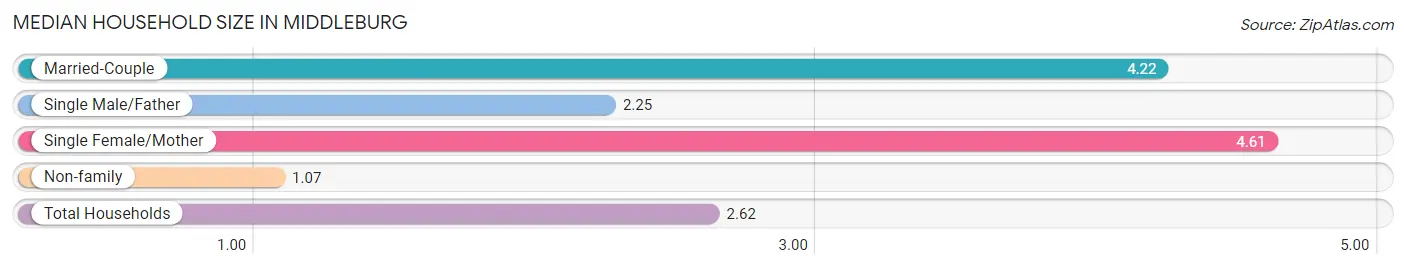
| Household Type | # Households | Household Size |
| Married-Couple | 9 (10.6%) | 4.22 |
| Single Male/Father | 4 (4.7%) | 2.25 |
| Single Female/Mother | 28 (32.9%) | 4.61 |
| Non-family | 44 (51.8%) | 1.07 |
| Total Households | 85 (100.0%) | 2.62 |
Household Size by Marriage Status in Middleburg
Out of a total of 85 households in Middleburg, 41 (48.2%) are family households, while 44 (51.8%) are nonfamily households. The most numerous type of family households are 3-person households, comprising 28, and the most common type of nonfamily households are 1-person households, comprising 37.
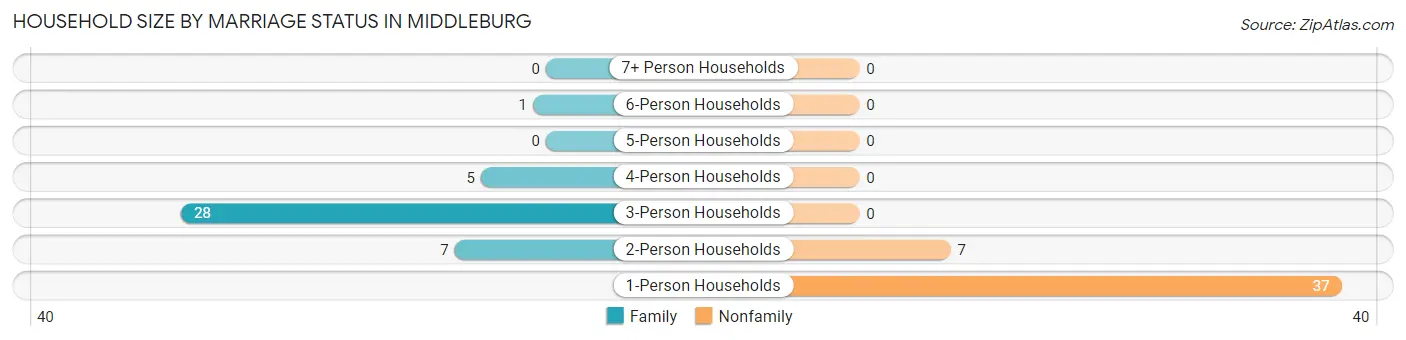
| Household Size | Family Households | Nonfamily Households |
| 1-Person Households | - | 37 (43.5%) |
| 2-Person Households | 7 (8.2%) | 7 (8.2%) |
| 3-Person Households | 28 (32.9%) | 0 (0.0%) |
| 4-Person Households | 5 (5.9%) | 0 (0.0%) |
| 5-Person Households | 0 (0.0%) | 0 (0.0%) |
| 6-Person Households | 1 (1.2%) | 0 (0.0%) |
| 7+ Person Households | 0 (0.0%) | 0 (0.0%) |
| Total | 41 (48.2%) | 44 (51.8%) |
Female Fertility in Middleburg
Fertility by Age in Middleburg

| Age Bracket | Women with Births | Births / 1,000 Women |
| 15 to 19 years | 0 (0.0%) | 0.0 |
| 20 to 34 years | 0 (0.0%) | 0.0 |
| 35 to 50 years | 0 (0.0%) | 0.0 |
| Total | 0 (0.0%) | 0.0 |
Fertility by Age by Marriage Status in Middleburg
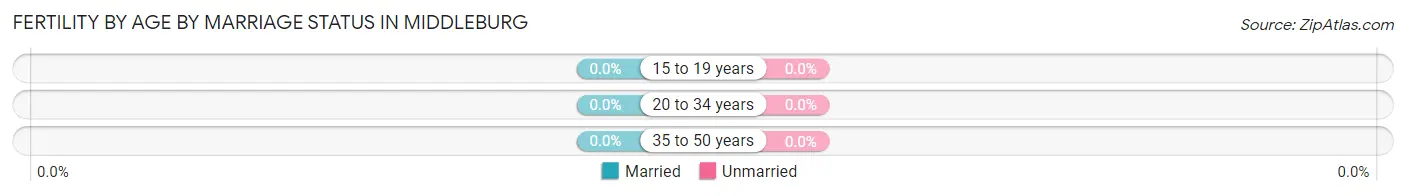
| Age Bracket | Married | Unmarried |
| 15 to 19 years | 0 (0.0%) | 0 (0.0%) |
| 20 to 34 years | 0 (0.0%) | 0 (0.0%) |
| 35 to 50 years | 0 (0.0%) | 0 (0.0%) |
| Total | 0 (0.0%) | 0 (0.0%) |
Fertility by Education in Middleburg
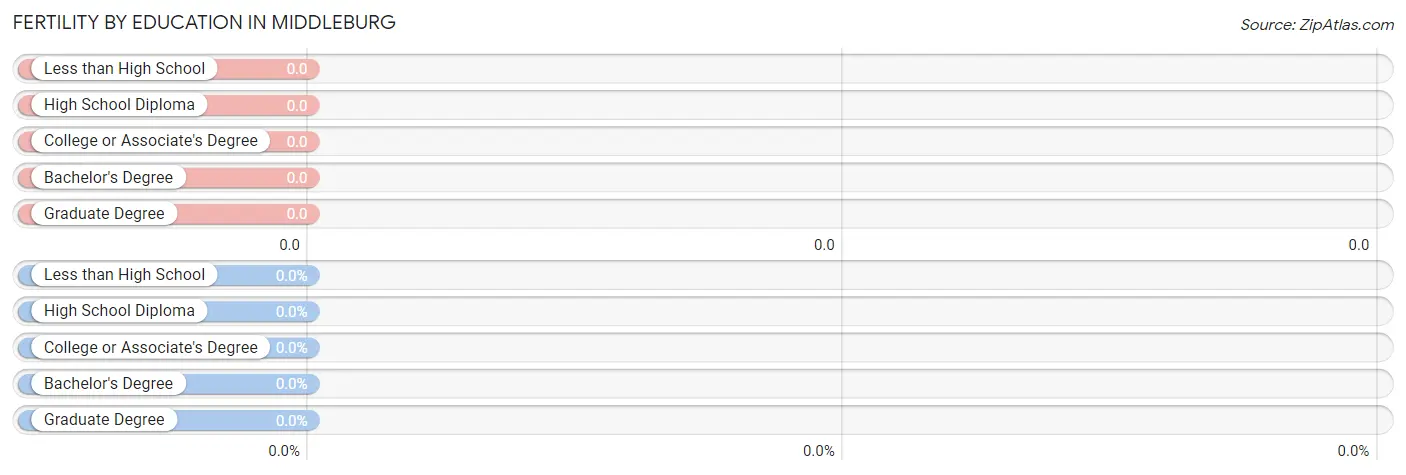
| Educational Attainment | Women with Births | Births / 1,000 Women |
| Less than High School | 0 (0.0%) | 0.0 |
| High School Diploma | 0 (0.0%) | 0.0 |
| College or Associate's Degree | 0 (0.0%) | 0.0 |
| Bachelor's Degree | 0 (0.0%) | 0.0 |
| Graduate Degree | 0 (0.0%) | 0.0 |
| Total | 0 (0.0%) | 0.0 |
Fertility by Education by Marriage Status in Middleburg
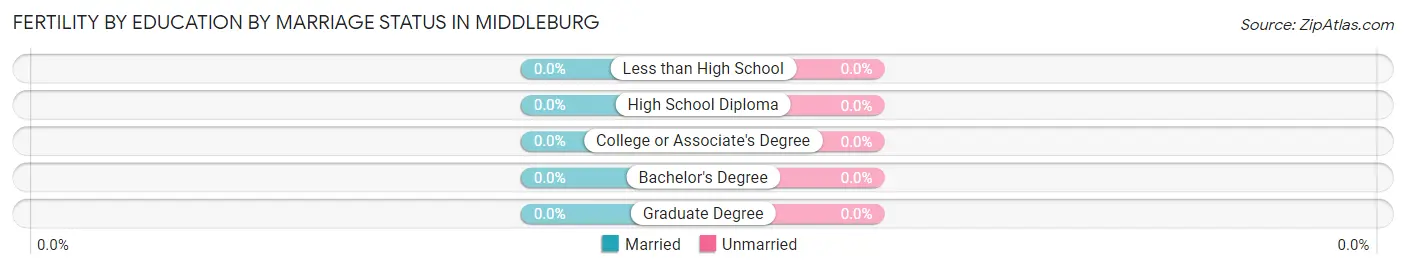
| Educational Attainment | Married | Unmarried |
| Less than High School | 0 (0.0%) | 0 (0.0%) |
| High School Diploma | 0 (0.0%) | 0 (0.0%) |
| College or Associate's Degree | 0 (0.0%) | 0 (0.0%) |
| Bachelor's Degree | 0 (0.0%) | 0 (0.0%) |
| Graduate Degree | 0 (0.0%) | 0 (0.0%) |
| Total | 0 (0.0%) | 0 (0.0%) |
Income in Middleburg
Income Overview in Middleburg
| Characteristic | Number | Measure |
| Per Capita Income | 223 | $46,078 |
| Median Family Income | 41 | $0 |
| Mean Family Income | 41 | $63,495 |
| Median Household Income | 85 | $0 |
| Mean Household Income | 85 | $107,848 |
| Income Deficit | 41 | $0 |
| Wage / Income Gap (%) | 223 | 0.00% |
| Wage / Income Gap ($) | 223 | 100.00¢ per $1 |
| Gini / Inequality Index | 223 | 0.36 |
Earnings by Sex in Middleburg
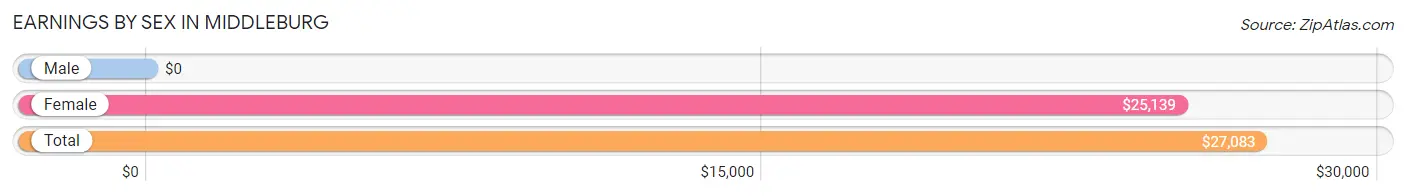
| Sex | Number | Average Earnings |
| Male | 26 (31.3%) | $0 |
| Female | 57 (68.7%) | $25,139 |
| Total | 83 (100.0%) | $27,083 |
Earnings by Sex by Income Bracket in Middleburg
The most common earnings brackets in Middleburg are $30,000 to $34,999 for men (7 | 26.9%) and $7,500 to $9,999 for women (17 | 29.8%).
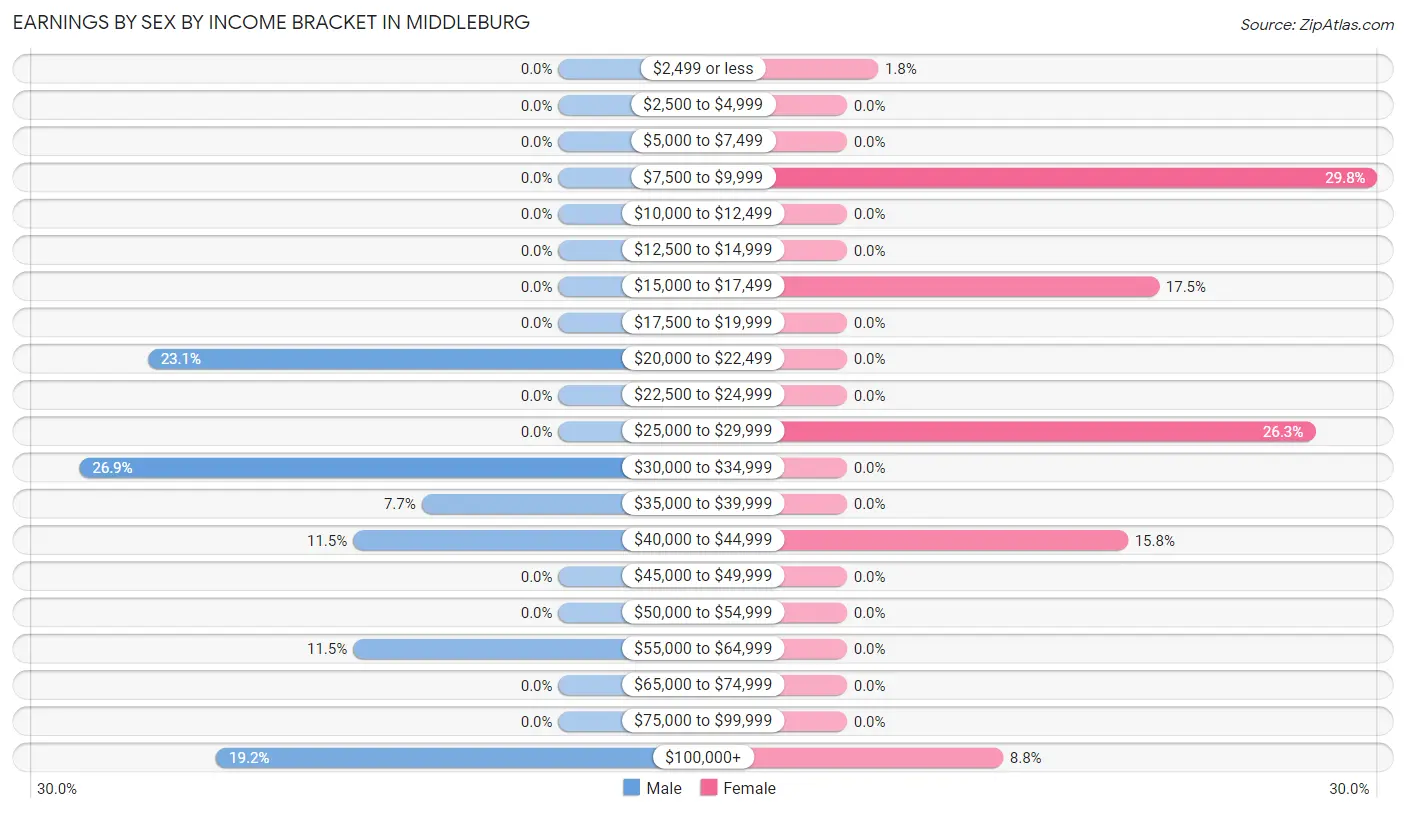
| Income | Male | Female |
| $2,499 or less | 0 (0.0%) | 1 (1.8%) |
| $2,500 to $4,999 | 0 (0.0%) | 0 (0.0%) |
| $5,000 to $7,499 | 0 (0.0%) | 0 (0.0%) |
| $7,500 to $9,999 | 0 (0.0%) | 17 (29.8%) |
| $10,000 to $12,499 | 0 (0.0%) | 0 (0.0%) |
| $12,500 to $14,999 | 0 (0.0%) | 0 (0.0%) |
| $15,000 to $17,499 | 0 (0.0%) | 10 (17.5%) |
| $17,500 to $19,999 | 0 (0.0%) | 0 (0.0%) |
| $20,000 to $22,499 | 6 (23.1%) | 0 (0.0%) |
| $22,500 to $24,999 | 0 (0.0%) | 0 (0.0%) |
| $25,000 to $29,999 | 0 (0.0%) | 15 (26.3%) |
| $30,000 to $34,999 | 7 (26.9%) | 0 (0.0%) |
| $35,000 to $39,999 | 2 (7.7%) | 0 (0.0%) |
| $40,000 to $44,999 | 3 (11.5%) | 9 (15.8%) |
| $45,000 to $49,999 | 0 (0.0%) | 0 (0.0%) |
| $50,000 to $54,999 | 0 (0.0%) | 0 (0.0%) |
| $55,000 to $64,999 | 3 (11.5%) | 0 (0.0%) |
| $65,000 to $74,999 | 0 (0.0%) | 0 (0.0%) |
| $75,000 to $99,999 | 0 (0.0%) | 0 (0.0%) |
| $100,000+ | 5 (19.2%) | 5 (8.8%) |
| Total | 26 (100.0%) | 57 (100.0%) |
Earnings by Sex by Educational Attainment in Middleburg
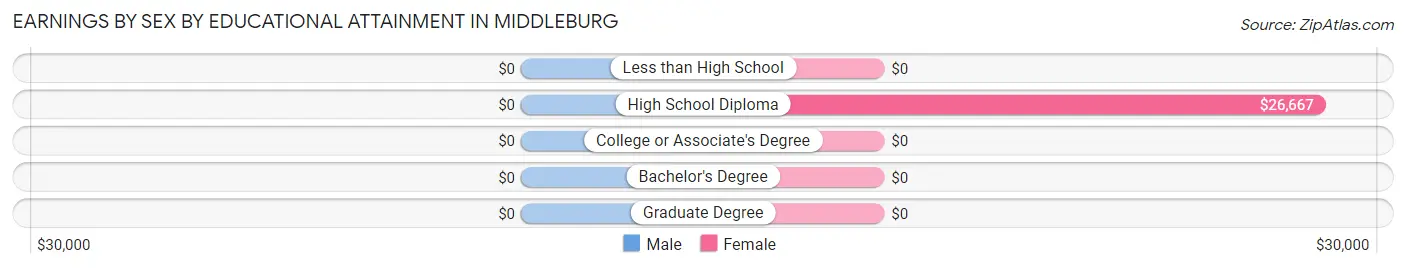
| Educational Attainment | Male Income | Female Income |
| Less than High School | - | - |
| High School Diploma | - | - |
| College or Associate's Degree | - | - |
| Bachelor's Degree | - | - |
| Graduate Degree | - | - |
| Total | - | - |
Family Income in Middleburg
Family Income Brackets in Middleburg
According to the Middleburg family income data, there are 15 families falling into the less than $10,000 income range, which is the most common income bracket and makes up 36.6% of all families.
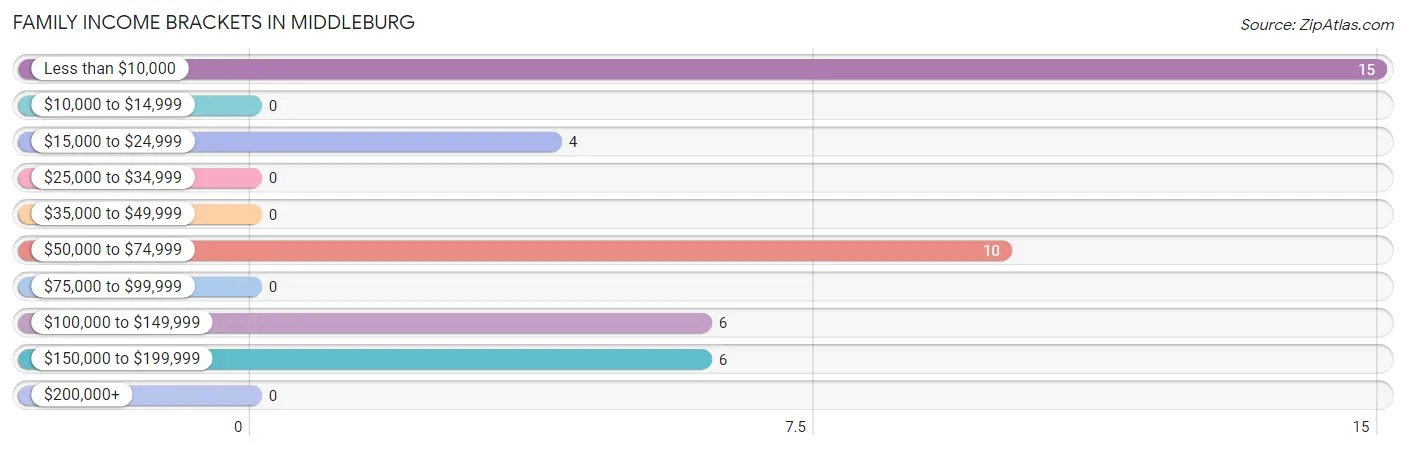
| Income Bracket | # Families | % Families |
| Less than $10,000 | 15 | 36.6% |
| $10,000 to $14,999 | 0 | 0.0% |
| $15,000 to $24,999 | 4 | 9.8% |
| $25,000 to $34,999 | 0 | 0.0% |
| $35,000 to $49,999 | 0 | 0.0% |
| $50,000 to $74,999 | 10 | 24.4% |
| $75,000 to $99,999 | 0 | 0.0% |
| $100,000 to $149,999 | 6 | 14.6% |
| $150,000 to $199,999 | 6 | 14.6% |
| $200,000+ | 0 | 0.0% |
Family Income by Famaliy Size in Middleburg
| Income Bracket | # Families | Median Income |
| 2-Person Families | 7 (17.1%) | $0 |
| 3-Person Families | 28 (68.3%) | $0 |
| 4-Person Families | 5 (12.2%) | $0 |
| 5-Person Families | 0 (0.0%) | $0 |
| 6-Person Families | 1 (2.4%) | $0 |
| 7+ Person Families | 0 (0.0%) | $0 |
| Total | 41 (100.0%) | $0 |
Family Income by Number of Earners in Middleburg
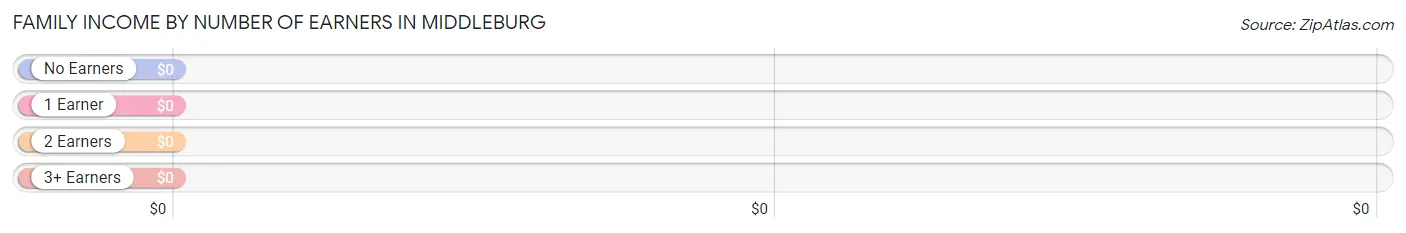
| Number of Earners | # Families | Median Income |
| No Earners | 4 (9.8%) | $0 |
| 1 Earner | 23 (56.1%) | $0 |
| 2 Earners | 11 (26.8%) | $0 |
| 3+ Earners | 3 (7.3%) | $0 |
| Total | 41 (100.0%) | $0 |
Household Income in Middleburg
Household Income Brackets in Middleburg
With 42 households falling in the category, the $150,000 to $199,999 income range is the most frequent in Middleburg, accounting for 49.4% of all households.
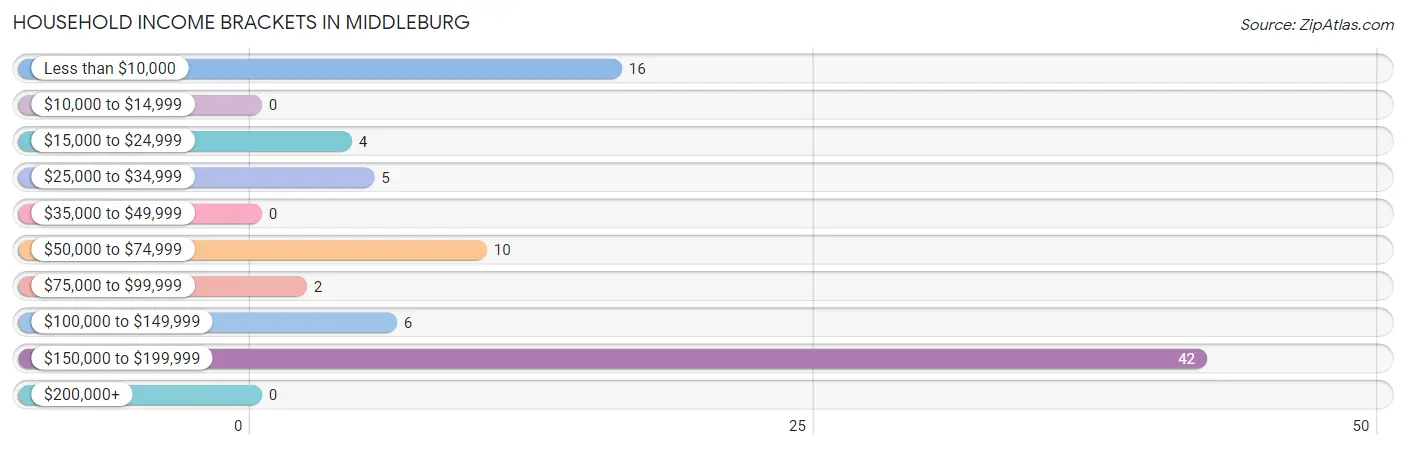
| Income Bracket | # Households | % Households |
| Less than $10,000 | 16 | 18.8% |
| $10,000 to $14,999 | 0 | 0.0% |
| $15,000 to $24,999 | 4 | 4.7% |
| $25,000 to $34,999 | 5 | 5.9% |
| $35,000 to $49,999 | 0 | 0.0% |
| $50,000 to $74,999 | 10 | 11.8% |
| $75,000 to $99,999 | 2 | 2.4% |
| $100,000 to $149,999 | 6 | 7.1% |
| $150,000 to $199,999 | 42 | 49.4% |
| $200,000+ | 0 | 0.0% |
Household Income by Householder Age in Middleburg
The median household income in Middleburg is $0, with the highest median household income of $173,472 found in the 65+ years age bracket for the primary householder. A total of 56 households (65.9%) fall into this category.
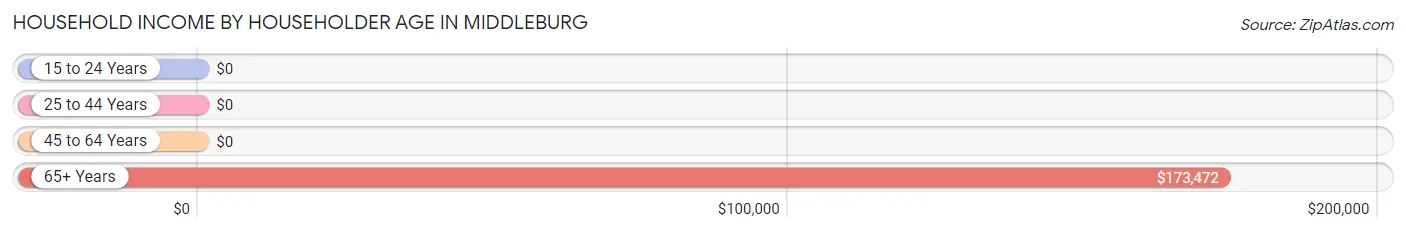
| Income Bracket | # Households | Median Income |
| 15 to 24 Years | 0 (0.0%) | $0 |
| 25 to 44 Years | 15 (17.6%) | $0 |
| 45 to 64 Years | 14 (16.5%) | $0 |
| 65+ Years | 56 (65.9%) | $173,472 |
| Total | 85 (100.0%) | $0 |
Poverty in Middleburg
Income Below Poverty by Sex and Age in Middleburg
With 48.3% poverty level for males and 33.8% for females among the residents of Middleburg, 15 year old males and 6 to 11 year old females are the most vulnerable to poverty, with 1 males (100.0%) and 21 females (100.0%) in their respective age groups living below the poverty level.
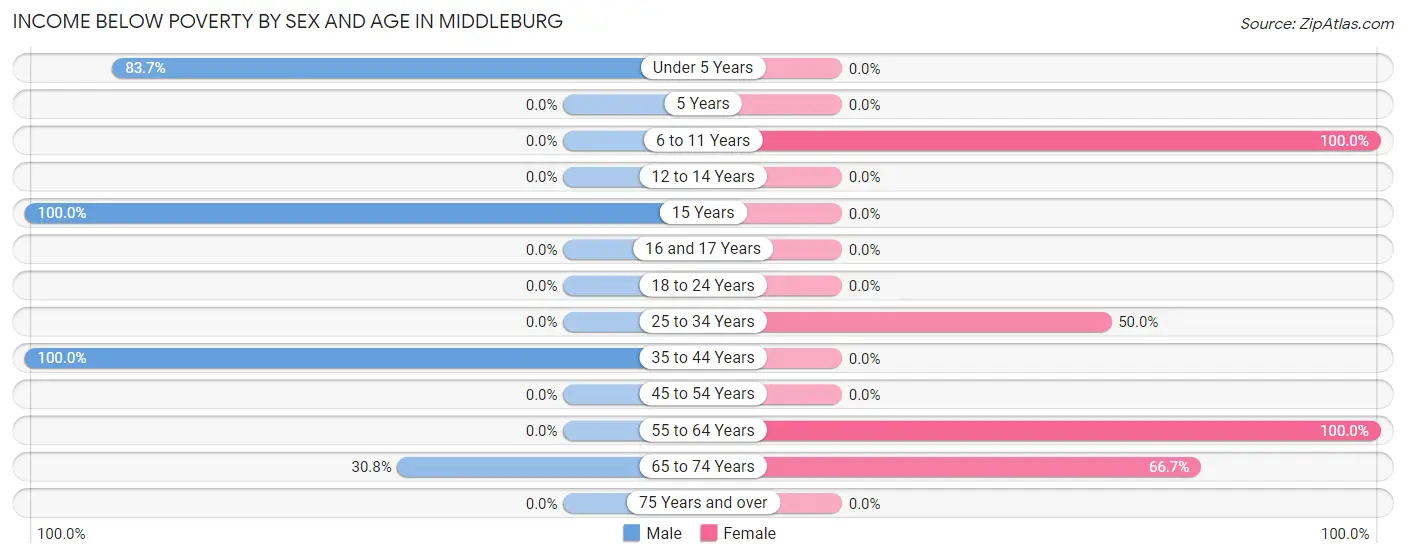
| Age Bracket | Male | Female |
| Under 5 Years | 36 (83.7%) | 0 (0.0%) |
| 5 Years | 0 (0.0%) | 0 (0.0%) |
| 6 to 11 Years | 0 (0.0%) | 21 (100.0%) |
| 12 to 14 Years | 0 (0.0%) | 0 (0.0%) |
| 15 Years | 1 (100.0%) | 0 (0.0%) |
| 16 and 17 Years | 0 (0.0%) | 0 (0.0%) |
| 18 to 24 Years | 0 (0.0%) | 0 (0.0%) |
| 25 to 34 Years | 0 (0.0%) | 15 (50.0%) |
| 35 to 44 Years | 1 (100.0%) | 0 (0.0%) |
| 45 to 54 Years | 0 (0.0%) | 0 (0.0%) |
| 55 to 64 Years | 0 (0.0%) | 6 (100.0%) |
| 65 to 74 Years | 4 (30.8%) | 4 (66.7%) |
| 75 Years and over | 0 (0.0%) | 0 (0.0%) |
| Total | 42 (48.3%) | 46 (33.8%) |
Income Above Poverty by Sex and Age in Middleburg
According to the poverty statistics in Middleburg, males aged 5 years and females aged 12 to 14 years are the age groups that are most secure financially, with 100.0% of males and 100.0% of females in these age groups living above the poverty line.
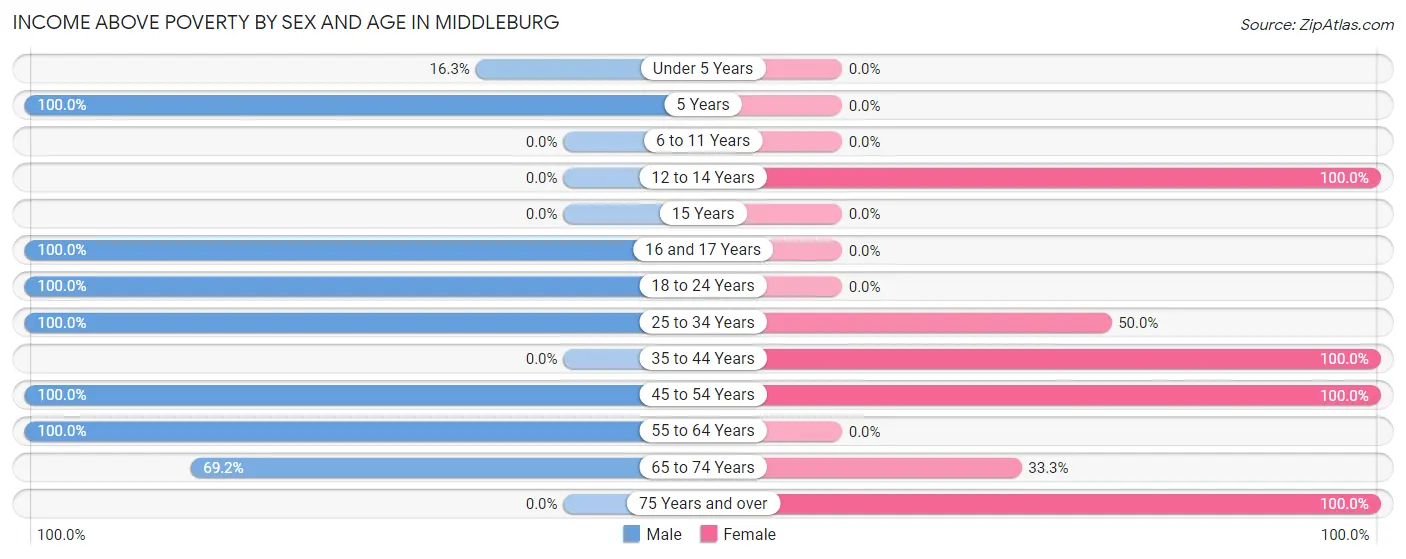
| Age Bracket | Male | Female |
| Under 5 Years | 7 (16.3%) | 0 (0.0%) |
| 5 Years | 3 (100.0%) | 0 (0.0%) |
| 6 to 11 Years | 0 (0.0%) | 0 (0.0%) |
| 12 to 14 Years | 0 (0.0%) | 3 (100.0%) |
| 15 Years | 0 (0.0%) | 0 (0.0%) |
| 16 and 17 Years | 2 (100.0%) | 0 (0.0%) |
| 18 to 24 Years | 7 (100.0%) | 0 (0.0%) |
| 25 to 34 Years | 6 (100.0%) | 15 (50.0%) |
| 35 to 44 Years | 0 (0.0%) | 19 (100.0%) |
| 45 to 54 Years | 5 (100.0%) | 5 (100.0%) |
| 55 to 64 Years | 6 (100.0%) | 0 (0.0%) |
| 65 to 74 Years | 9 (69.2%) | 2 (33.3%) |
| 75 Years and over | 0 (0.0%) | 46 (100.0%) |
| Total | 45 (51.7%) | 90 (66.2%) |
Income Below Poverty Among Married-Couple Families in Middleburg
The poverty statistics for married-couple families in Middleburg show that 33.3% or 3 of the total 9 families live below the poverty line. Families with no children have the highest poverty rate of 50.0%, comprising of 3 families. On the other hand, families with 1 or 2 children have the lowest poverty rate of 0.0%, which includes 0 families.
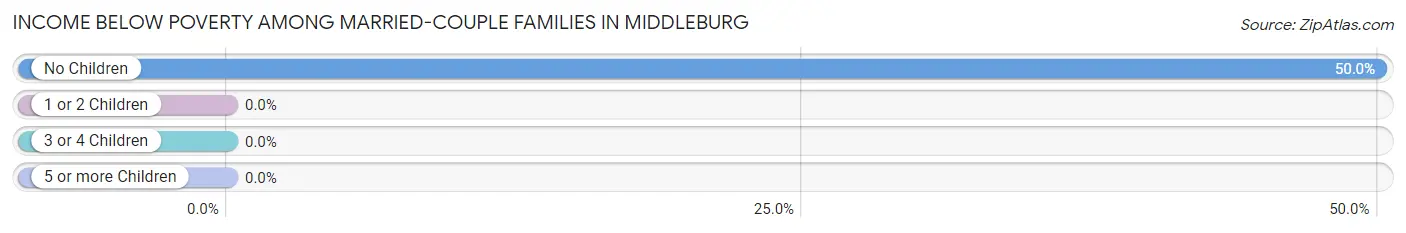
| Children | Above Poverty | Below Poverty |
| No Children | 3 (50.0%) | 3 (50.0%) |
| 1 or 2 Children | 3 (100.0%) | 0 (0.0%) |
| 3 or 4 Children | 0 (0.0%) | 0 (0.0%) |
| 5 or more Children | 0 (0.0%) | 0 (0.0%) |
| Total | 6 (66.7%) | 3 (33.3%) |
Income Below Poverty Among Single-Parent Households in Middleburg
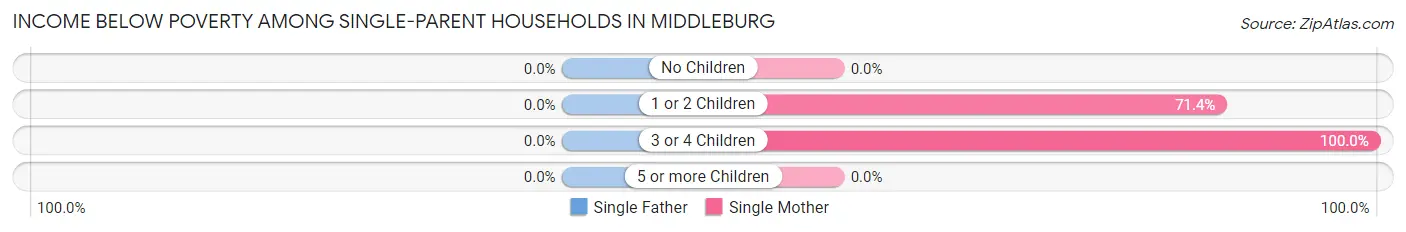
| Children | Single Father | Single Mother |
| No Children | 0 (0.0%) | 0 (0.0%) |
| 1 or 2 Children | 0 (0.0%) | 15 (71.4%) |
| 3 or 4 Children | 0 (0.0%) | 1 (100.0%) |
| 5 or more Children | 0 (0.0%) | 0 (0.0%) |
| Total | 0 (0.0%) | 16 (57.1%) |
Income Below Poverty Among Married-Couple vs Single-Parent Households in Middleburg
The poverty data for Middleburg shows that 3 of the married-couple family households (33.3%) and 16 of the single-parent households (50.0%) are living below the poverty level. Within the married-couple family households, those with no children have the highest poverty rate, with 3 households (50.0%) falling below the poverty line. Among the single-parent households, those with 3 or 4 children have the highest poverty rate, with 1 household (100.0%) living below poverty.
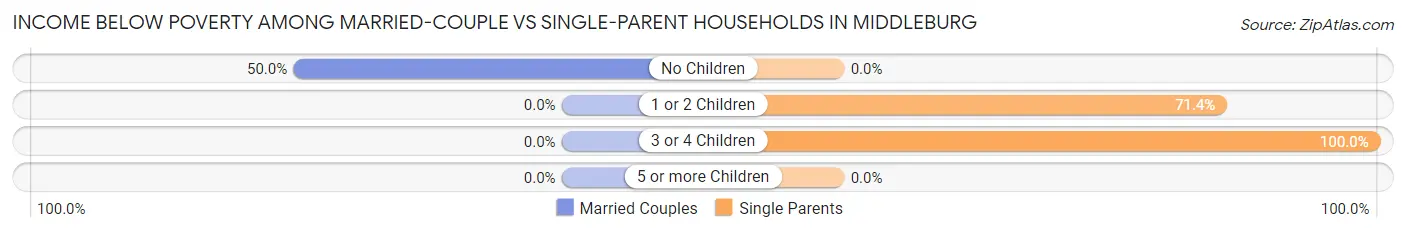
| Children | Married-Couple Families | Single-Parent Households |
| No Children | 3 (50.0%) | 0 (0.0%) |
| 1 or 2 Children | 0 (0.0%) | 15 (71.4%) |
| 3 or 4 Children | 0 (0.0%) | 1 (100.0%) |
| 5 or more Children | 0 (0.0%) | 0 (0.0%) |
| Total | 3 (33.3%) | 16 (50.0%) |
Employment Characteristics in Middleburg
Employment by Class of Employer in Middleburg
Among the 73 employed individuals in Middleburg, private company employees (45 | 61.6%), self-employed (not incorporated) (18 | 24.7%), and state government employees (10 | 13.7%) make up the most common classes of employment.
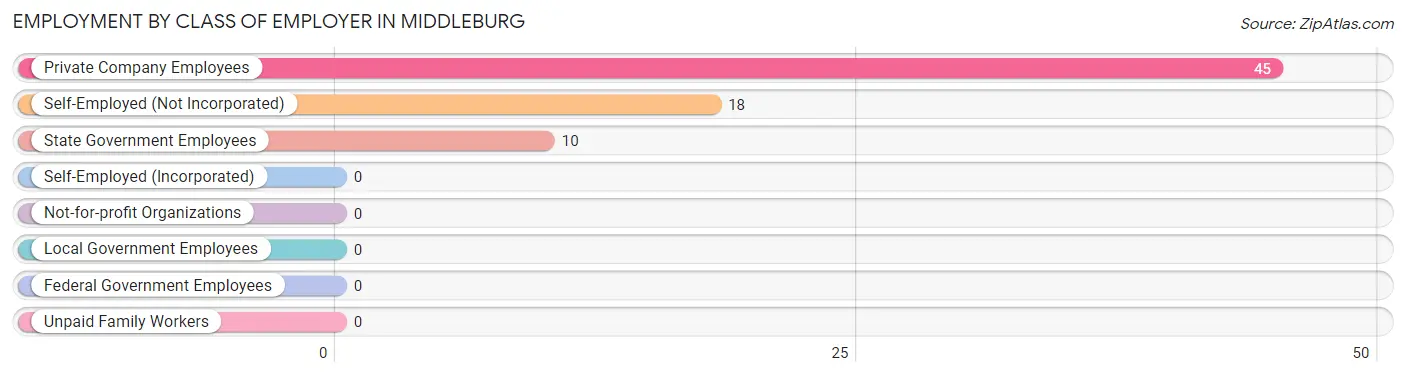
| Employer Class | # Employees | % Employees |
| Private Company Employees | 45 | 61.6% |
| Self-Employed (Incorporated) | 0 | 0.0% |
| Self-Employed (Not Incorporated) | 18 | 24.7% |
| Not-for-profit Organizations | 0 | 0.0% |
| Local Government Employees | 0 | 0.0% |
| State Government Employees | 10 | 13.7% |
| Federal Government Employees | 0 | 0.0% |
| Unpaid Family Workers | 0 | 0.0% |
| Total | 73 | 100.0% |
Employment Status by Age in Middleburg
According to the labor force statistics for Middleburg, out of the total population over 16 years of age (152), 54.6% or 83 individuals are in the labor force, with 12.0% or 10 of them unemployed. The age group with the highest labor force participation rate is 20 to 24 years, with 100.0% or 7 individuals in the labor force. Within the labor force, the 35 to 44 years age range has the highest percentage of unemployed individuals, with 52.6% or 10 of them being unemployed.
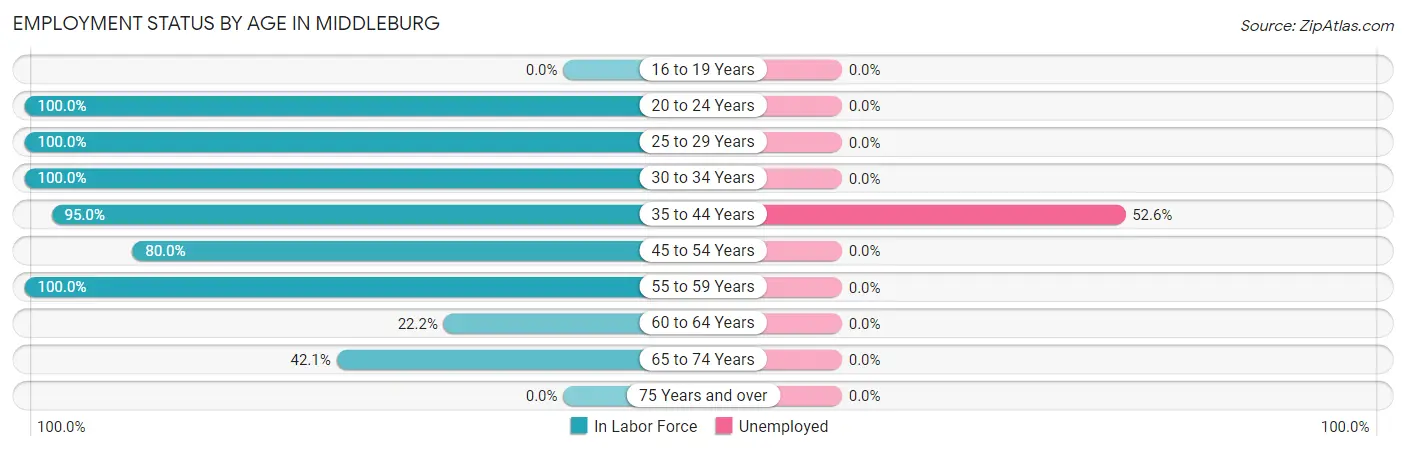
| Age Bracket | In Labor Force | Unemployed |
| 16 to 19 Years | 0 (0.0%) | 0 (0.0%) |
| 20 to 24 Years | 7 (100.0%) | 0 (0.0%) |
| 25 to 29 Years | 6 (100.0%) | 0 (0.0%) |
| 30 to 34 Years | 30 (100.0%) | 0 (0.0%) |
| 35 to 44 Years | 19 (95.0%) | 10 (52.6%) |
| 45 to 54 Years | 8 (80.0%) | 0 (0.0%) |
| 55 to 59 Years | 3 (100.0%) | 0 (0.0%) |
| 60 to 64 Years | 2 (22.2%) | 0 (0.0%) |
| 65 to 74 Years | 8 (42.1%) | 0 (0.0%) |
| 75 Years and over | 0 (0.0%) | 0 (0.0%) |
| Total | 83 (54.6%) | 10 (12.0%) |
Employment Status by Educational Attainment in Middleburg
According to labor force statistics for Middleburg, 87.2% of individuals (68) out of the total population between 25 and 64 years of age (78) are in the labor force, with 14.7% or 10 of them being unemployed. The group with the highest labor force participation rate are those with the educational attainment of high school diploma, with 95.1% or 39 individuals in the labor force. Within the labor force, individuals with high school diploma education have the highest percentage of unemployment, with 25.6% or 10 of them being unemployed.
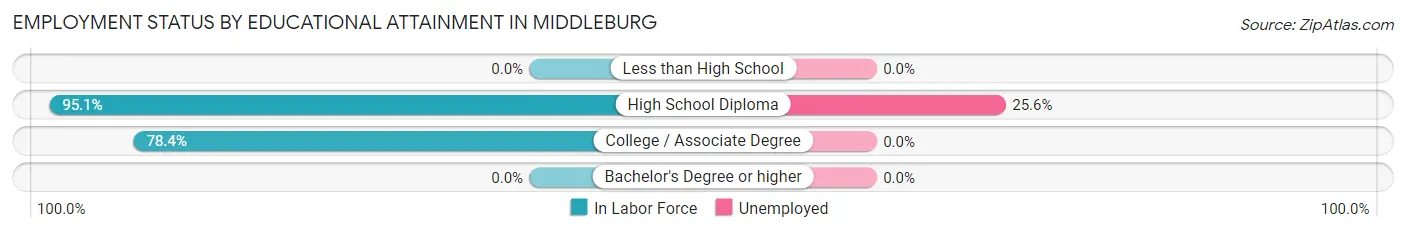
| Educational Attainment | In Labor Force | Unemployed |
| Less than High School | 0 (0.0%) | 0 (0.0%) |
| High School Diploma | 39 (95.1%) | 10 (25.6%) |
| College / Associate Degree | 29 (78.4%) | 0 (0.0%) |
| Bachelor's Degree or higher | 0 (0.0%) | 0 (0.0%) |
| Total | 68 (87.2%) | 11 (14.7%) |
Employment Occupations by Sex in Middleburg
Management, Business, Science and Arts Occupations
The most common Management, Business, Science and Arts occupations in Middleburg are Business & Financial (20 | 27.4%), Community & Social Service (7 | 9.6%), Education Instruction & Library (7 | 9.6%), Health Diagnosing & Treating (7 | 9.6%), and Health Technologists (7 | 9.6%).
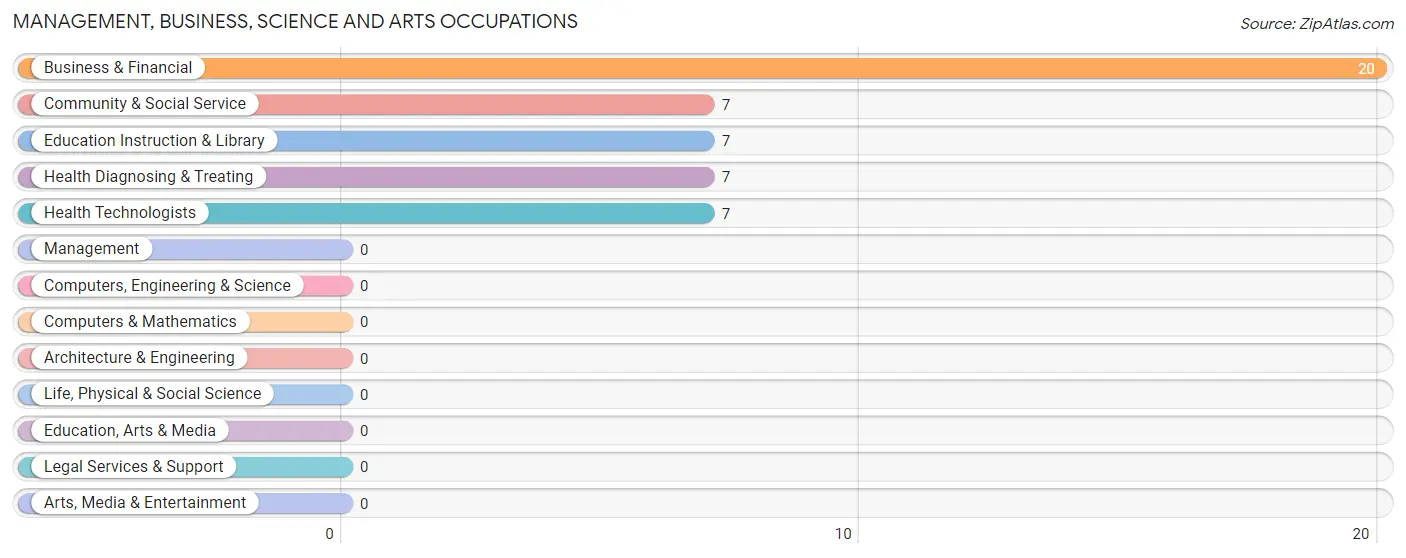
Management, Business, Science and Arts Occupations by Sex
Within the Management, Business, Science and Arts occupations in Middleburg, the most male-oriented occupations are Health Diagnosing & Treating (100.0%), and Health Technologists (100.0%), while the most female-oriented occupations are Business & Financial (100.0%), Community & Social Service (100.0%), and Education Instruction & Library (100.0%).
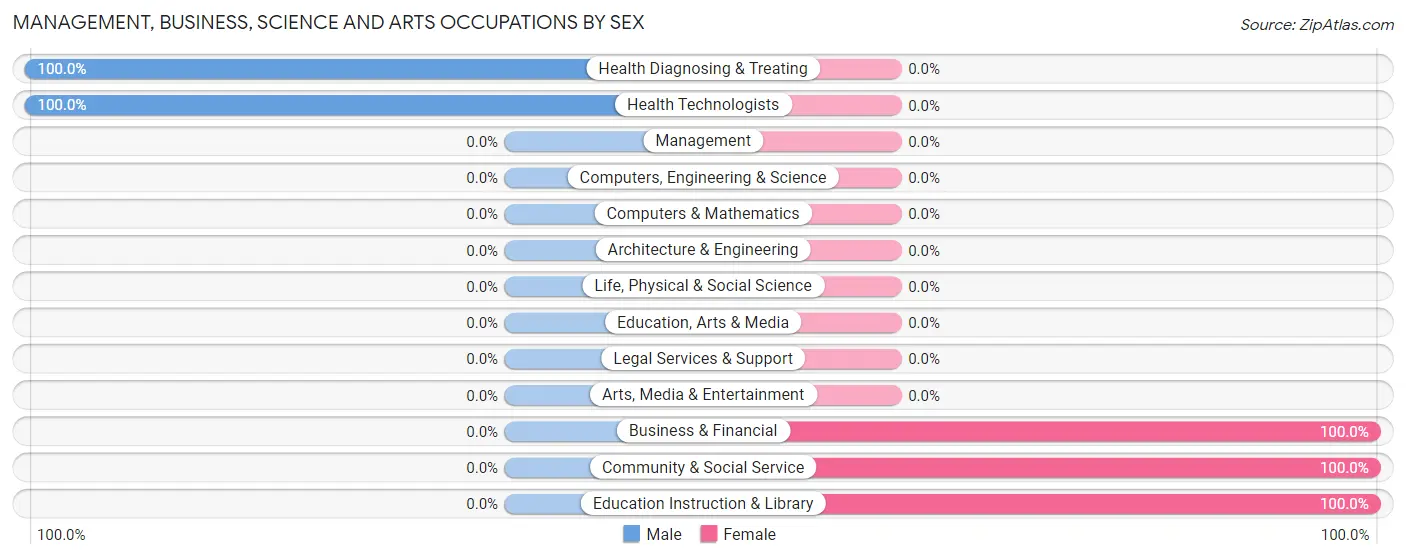
| Occupation | Male | Female |
| Management | 0 (0.0%) | 0 (0.0%) |
| Business & Financial | 0 (0.0%) | 20 (100.0%) |
| Computers, Engineering & Science | 0 (0.0%) | 0 (0.0%) |
| Computers & Mathematics | 0 (0.0%) | 0 (0.0%) |
| Architecture & Engineering | 0 (0.0%) | 0 (0.0%) |
| Life, Physical & Social Science | 0 (0.0%) | 0 (0.0%) |
| Community & Social Service | 0 (0.0%) | 7 (100.0%) |
| Education, Arts & Media | 0 (0.0%) | 0 (0.0%) |
| Legal Services & Support | 0 (0.0%) | 0 (0.0%) |
| Education Instruction & Library | 0 (0.0%) | 7 (100.0%) |
| Arts, Media & Entertainment | 0 (0.0%) | 0 (0.0%) |
| Health Diagnosing & Treating | 7 (100.0%) | 0 (0.0%) |
| Health Technologists | 7 (100.0%) | 0 (0.0%) |
| Total (Category) | 7 (20.6%) | 27 (79.4%) |
| Total (Overall) | 26 (35.6%) | 47 (64.4%) |
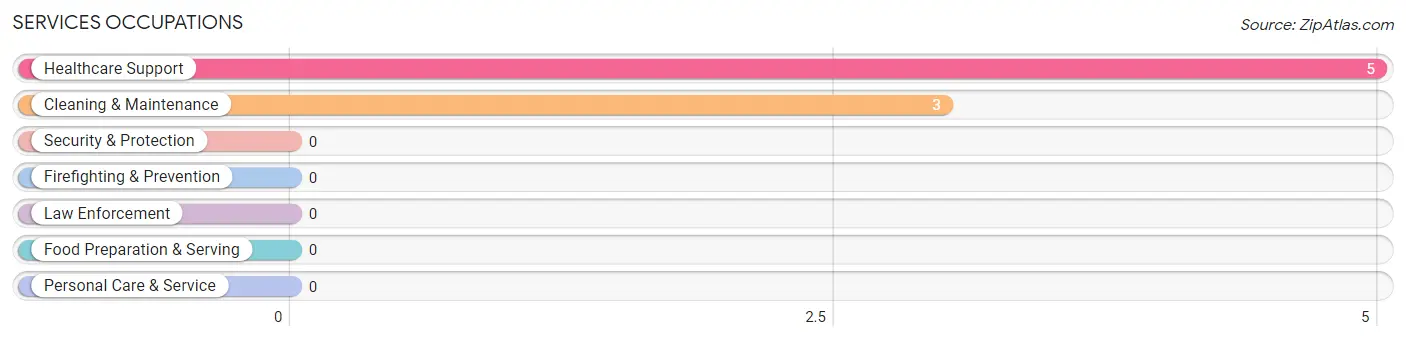
Services Occupations
The most common Services occupations in Middleburg are Healthcare Support (5 | 6.9%), and Cleaning & Maintenance (3 | 4.1%).
Services Occupations by Sex
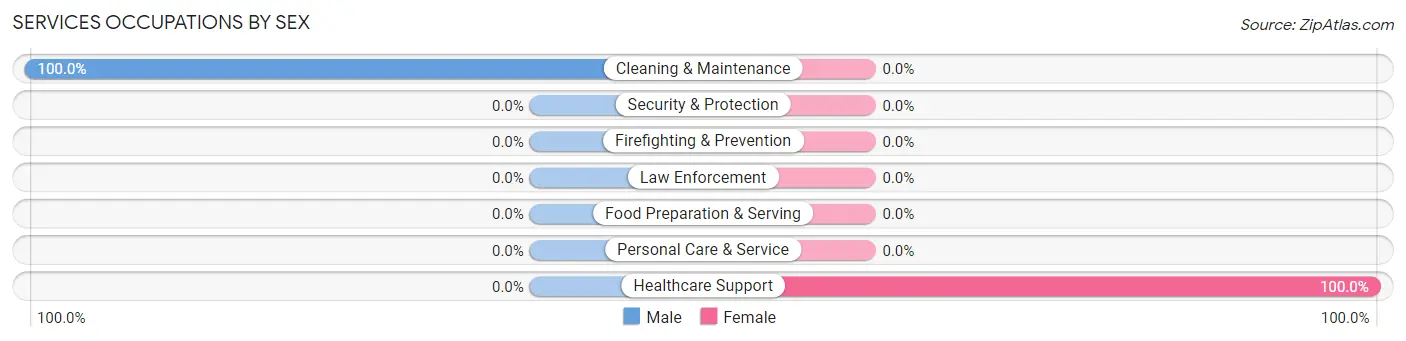
| Occupation | Male | Female |
| Healthcare Support | 0 (0.0%) | 5 (100.0%) |
| Security & Protection | 0 (0.0%) | 0 (0.0%) |
| Firefighting & Prevention | 0 (0.0%) | 0 (0.0%) |
| Law Enforcement | 0 (0.0%) | 0 (0.0%) |
| Food Preparation & Serving | 0 (0.0%) | 0 (0.0%) |
| Cleaning & Maintenance | 3 (100.0%) | 0 (0.0%) |
| Personal Care & Service | 0 (0.0%) | 0 (0.0%) |
| Total (Category) | 3 (37.5%) | 5 (62.5%) |
| Total (Overall) | 26 (35.6%) | 47 (64.4%) |
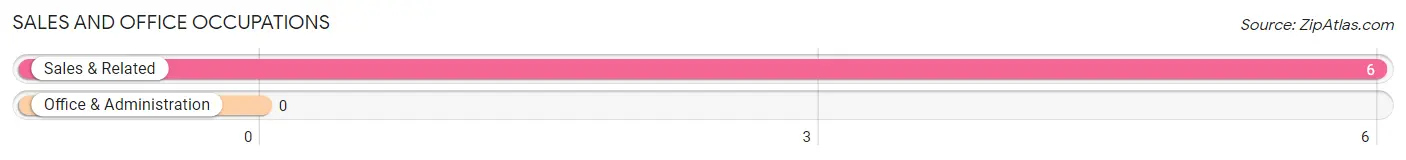
Sales and Office Occupations
The most common Sales and Office occupations in Middleburg are , and Sales & Related (6 | 8.2%).
Sales and Office Occupations by Sex

| Occupation | Male | Female |
| Sales & Related | 6 (100.0%) | 0 (0.0%) |
| Office & Administration | 0 (0.0%) | 0 (0.0%) |
| Total (Category) | 6 (100.0%) | 0 (0.0%) |
| Total (Overall) | 26 (35.6%) | 47 (64.4%) |
Natural Resources, Construction and Maintenance Occupations
The most common Natural Resources, Construction and Maintenance occupations in Middleburg are , and Construction & Extraction (8 | 11.0%).
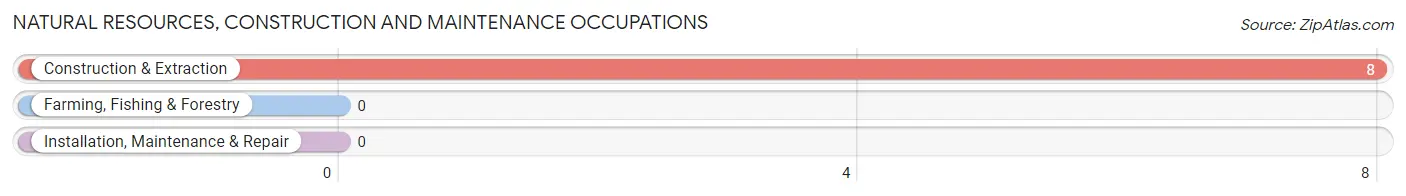
Natural Resources, Construction and Maintenance Occupations by Sex

| Occupation | Male | Female |
| Farming, Fishing & Forestry | 0 (0.0%) | 0 (0.0%) |
| Construction & Extraction | 8 (100.0%) | 0 (0.0%) |
| Installation, Maintenance & Repair | 0 (0.0%) | 0 (0.0%) |
| Total (Category) | 8 (100.0%) | 0 (0.0%) |
| Total (Overall) | 26 (35.6%) | 47 (64.4%) |
Production, Transportation and Moving Occupations
The most common Production, Transportation and Moving occupations in Middleburg are Material Moving (9 | 12.3%), and Production (8 | 11.0%).
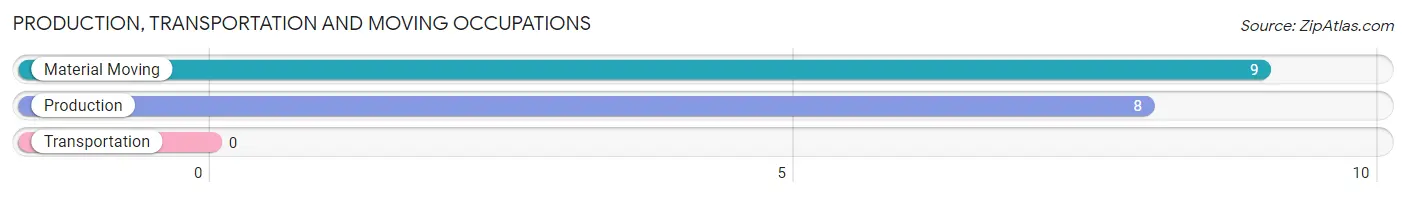
Production, Transportation and Moving Occupations by Sex
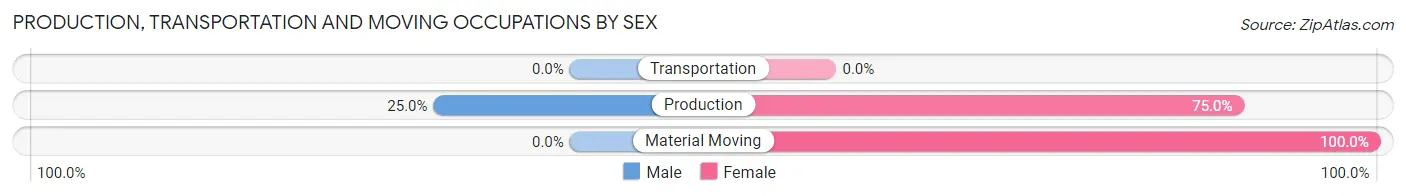
| Occupation | Male | Female |
| Production | 2 (25.0%) | 6 (75.0%) |
| Transportation | 0 (0.0%) | 0 (0.0%) |
| Material Moving | 0 (0.0%) | 9 (100.0%) |
| Total (Category) | 2 (11.8%) | 15 (88.2%) |
| Total (Overall) | 26 (35.6%) | 47 (64.4%) |
Employment Industries by Sex in Middleburg
Employment Industries in Middleburg
The major employment industries in Middleburg include Transportation & Warehousing (15 | 20.5%), Finance & Insurance (15 | 20.5%), Retail Trade (10 | 13.7%), Construction (8 | 11.0%), and Health Care & Social Assistance (8 | 11.0%).
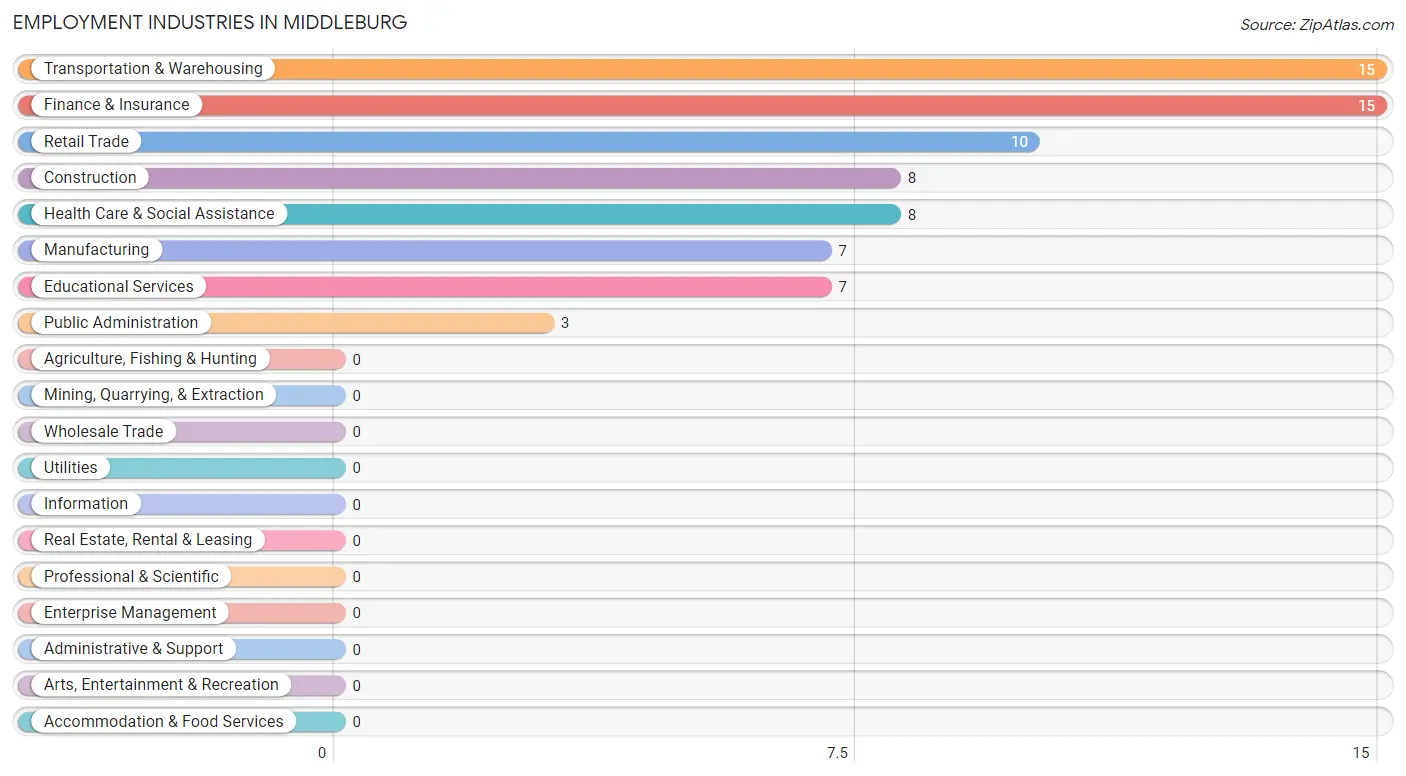
Employment Industries by Sex in Middleburg
The Middleburg industries that see more men than women are Construction (100.0%), Public Administration (100.0%), and Health Care & Social Assistance (87.5%), whereas the industries that tend to have a higher number of women are Transportation & Warehousing (100.0%), Finance & Insurance (100.0%), and Educational Services (100.0%).
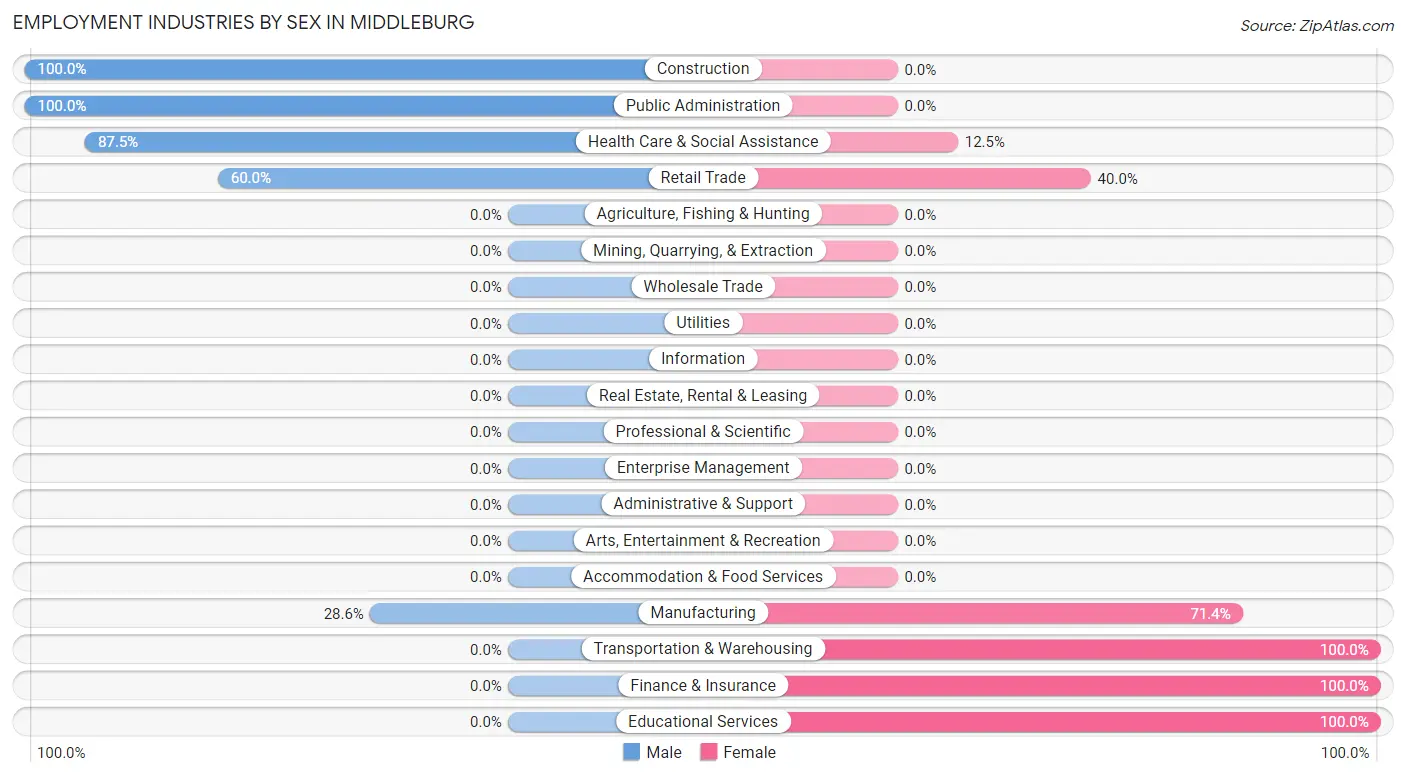
| Industry | Male | Female |
| Agriculture, Fishing & Hunting | 0 (0.0%) | 0 (0.0%) |
| Mining, Quarrying, & Extraction | 0 (0.0%) | 0 (0.0%) |
| Construction | 8 (100.0%) | 0 (0.0%) |
| Manufacturing | 2 (28.6%) | 5 (71.4%) |
| Wholesale Trade | 0 (0.0%) | 0 (0.0%) |
| Retail Trade | 6 (60.0%) | 4 (40.0%) |
| Transportation & Warehousing | 0 (0.0%) | 15 (100.0%) |
| Utilities | 0 (0.0%) | 0 (0.0%) |
| Information | 0 (0.0%) | 0 (0.0%) |
| Finance & Insurance | 0 (0.0%) | 15 (100.0%) |
| Real Estate, Rental & Leasing | 0 (0.0%) | 0 (0.0%) |
| Professional & Scientific | 0 (0.0%) | 0 (0.0%) |
| Enterprise Management | 0 (0.0%) | 0 (0.0%) |
| Administrative & Support | 0 (0.0%) | 0 (0.0%) |
| Educational Services | 0 (0.0%) | 7 (100.0%) |
| Health Care & Social Assistance | 7 (87.5%) | 1 (12.5%) |
| Arts, Entertainment & Recreation | 0 (0.0%) | 0 (0.0%) |
| Accommodation & Food Services | 0 (0.0%) | 0 (0.0%) |
| Public Administration | 3 (100.0%) | 0 (0.0%) |
| Total | 26 (35.6%) | 47 (64.4%) |
Education in Middleburg
School Enrollment in Middleburg
The most common levels of schooling among the 61 students in Middleburg are nursery / preschool (31 | 50.8%), middle school (23 | 37.7%), and kindergarten (4 | 6.6%).
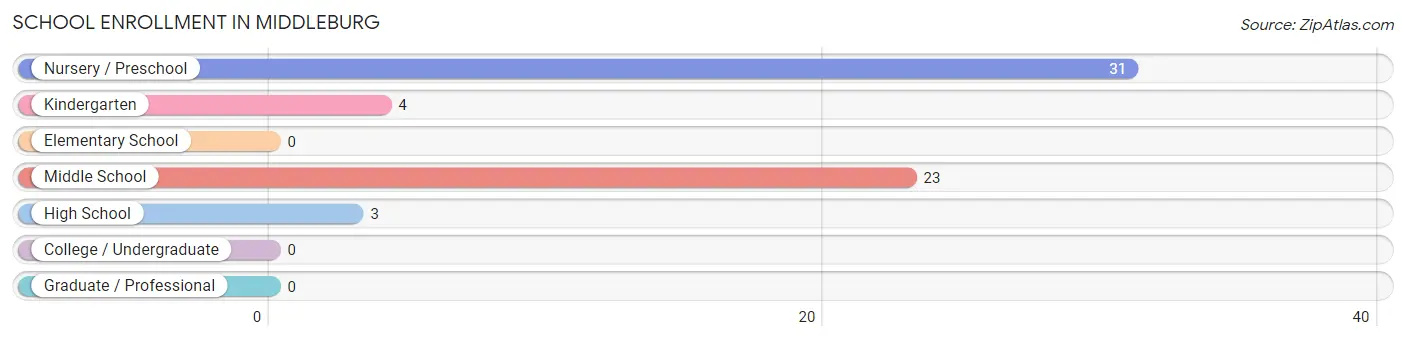
| School Level | # Students | % Students |
| Nursery / Preschool | 31 | 50.8% |
| Kindergarten | 4 | 6.6% |
| Elementary School | 0 | 0.0% |
| Middle School | 23 | 37.7% |
| High School | 3 | 4.9% |
| College / Undergraduate | 0 | 0.0% |
| Graduate / Professional | 0 | 0.0% |
| Total | 61 | 100.0% |
School Enrollment by Age by Funding Source in Middleburg
Out of a total of 61 students who are enrolled in schools in Middleburg, 20 (32.8%) attend a private institution, while the remaining 41 (67.2%) are enrolled in public schools. The age group of 10 to 14 year olds has the highest likelihood of being enrolled in private schools, with 20 (87.0% in the age bracket) enrolled. Conversely, the age group of 3 to 4 year olds has the lowest likelihood of being enrolled in a private school, with 31 (100.0% in the age bracket) attending a public institution.
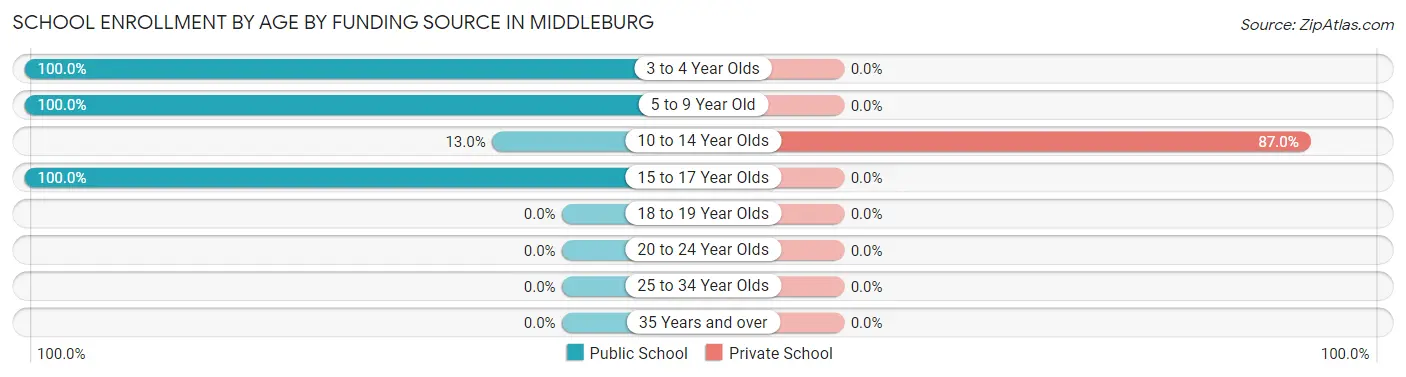
| Age Bracket | Public School | Private School |
| 3 to 4 Year Olds | 31 (100.0%) | 0 (0.0%) |
| 5 to 9 Year Old | 4 (100.0%) | 0 (0.0%) |
| 10 to 14 Year Olds | 3 (13.0%) | 20 (87.0%) |
| 15 to 17 Year Olds | 3 (100.0%) | 0 (0.0%) |
| 18 to 19 Year Olds | 0 (0.0%) | 0 (0.0%) |
| 20 to 24 Year Olds | 0 (0.0%) | 0 (0.0%) |
| 25 to 34 Year Olds | 0 (0.0%) | 0 (0.0%) |
| 35 Years and over | 0 (0.0%) | 0 (0.0%) |
| Total | 41 (67.2%) | 20 (32.8%) |
Educational Attainment by Field of Study in Middleburg
, and education (36 | 100.0%) are the most common fields of study among 36 individuals in Middleburg who have obtained a bachelor's degree or higher.
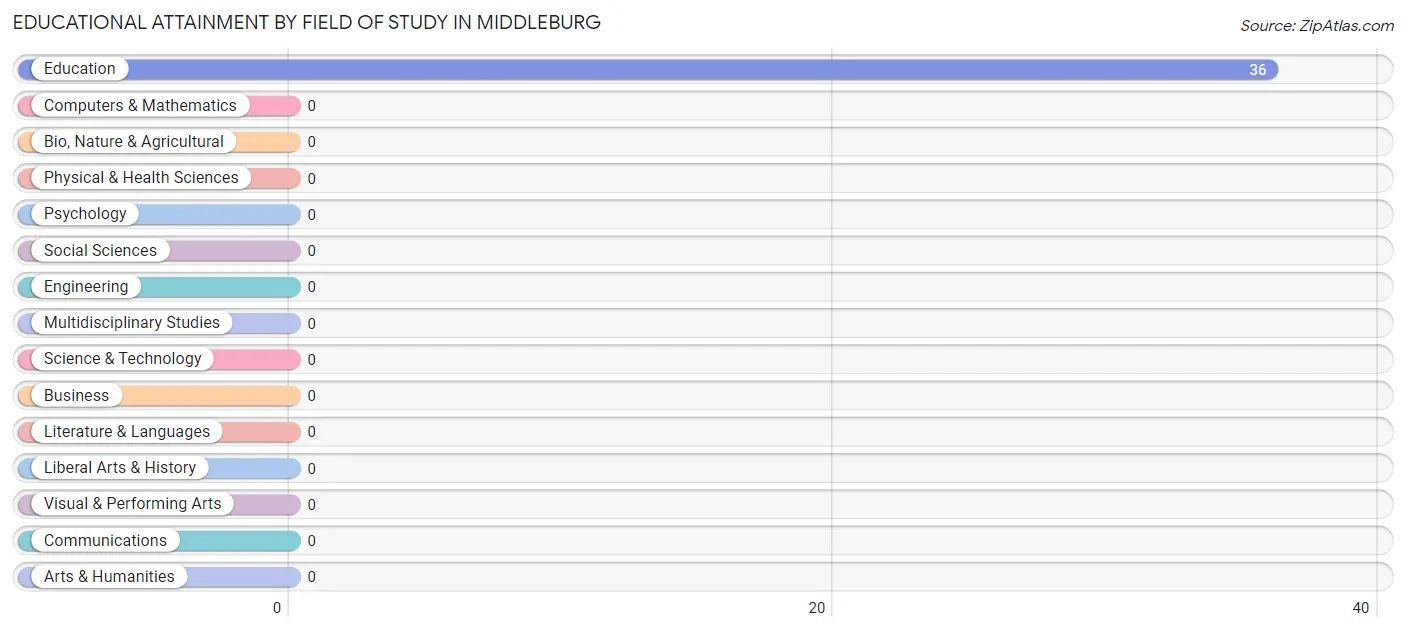
| Field of Study | # Graduates | % Graduates |
| Computers & Mathematics | 0 | 0.0% |
| Bio, Nature & Agricultural | 0 | 0.0% |
| Physical & Health Sciences | 0 | 0.0% |
| Psychology | 0 | 0.0% |
| Social Sciences | 0 | 0.0% |
| Engineering | 0 | 0.0% |
| Multidisciplinary Studies | 0 | 0.0% |
| Science & Technology | 0 | 0.0% |
| Business | 0 | 0.0% |
| Education | 36 | 100.0% |
| Literature & Languages | 0 | 0.0% |
| Liberal Arts & History | 0 | 0.0% |
| Visual & Performing Arts | 0 | 0.0% |
| Communications | 0 | 0.0% |
| Arts & Humanities | 0 | 0.0% |
| Total | 36 | 100.0% |
Transportation & Commute in Middleburg
Vehicle Availability by Sex in Middleburg
The most prevalent vehicle ownership categories in Middleburg are males with 4 vehicles (16, accounting for 61.5%) and females with 4 vehicles (5, making up 34.0%).
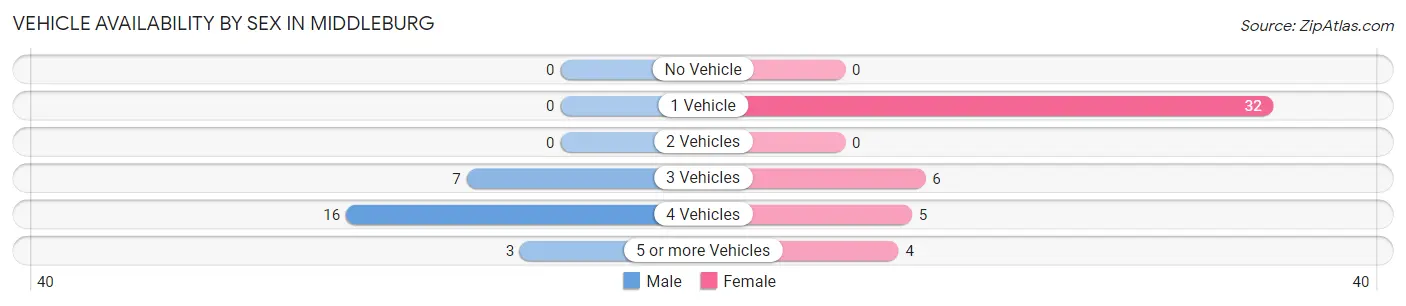
| Vehicles Available | Male | Female |
| No Vehicle | 0 (0.0%) | 0 (0.0%) |
| 1 Vehicle | 0 (0.0%) | 32 (68.1%) |
| 2 Vehicles | 0 (0.0%) | 0 (0.0%) |
| 3 Vehicles | 7 (26.9%) | 6 (12.8%) |
| 4 Vehicles | 16 (61.5%) | 5 (10.6%) |
| 5 or more Vehicles | 3 (11.5%) | 4 (8.5%) |
| Total | 26 (100.0%) | 47 (100.0%) |
Commute Time in Middleburg
The most frequently occuring commute durations in Middleburg are 45 to 59 minutes (15 commuters, 21.7%), 60 to 89 minutes (12 commuters, 17.4%), and 20 to 24 minutes (11 commuters, 15.9%).
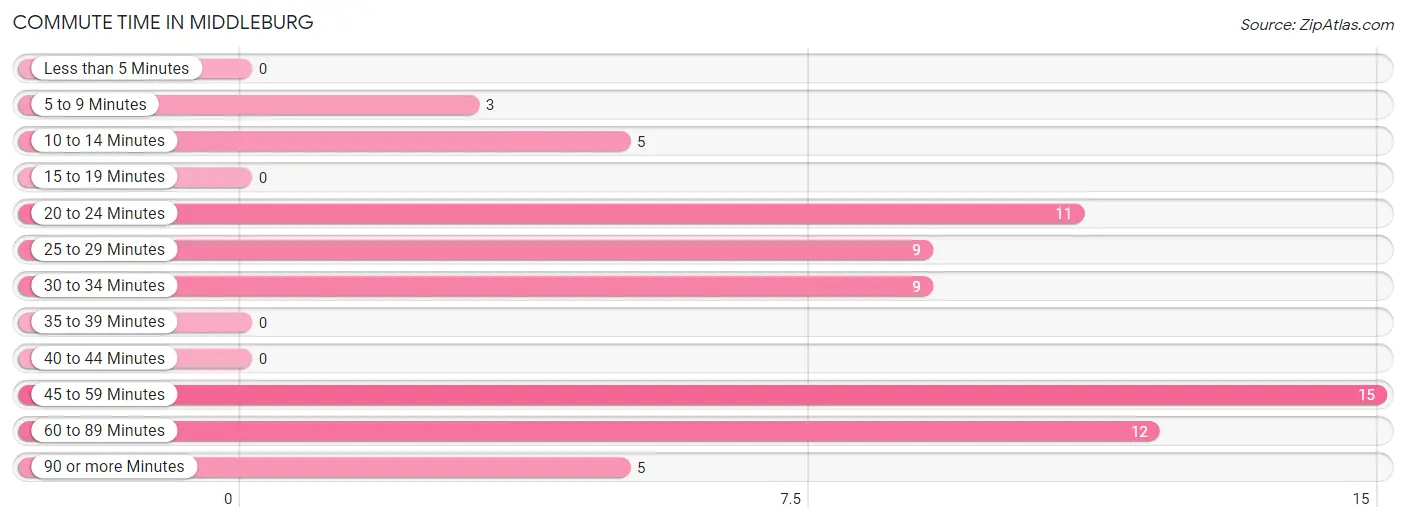
| Commute Time | # Commuters | % Commuters |
| Less than 5 Minutes | 0 | 0.0% |
| 5 to 9 Minutes | 3 | 4.3% |
| 10 to 14 Minutes | 5 | 7.2% |
| 15 to 19 Minutes | 0 | 0.0% |
| 20 to 24 Minutes | 11 | 15.9% |
| 25 to 29 Minutes | 9 | 13.0% |
| 30 to 34 Minutes | 9 | 13.0% |
| 35 to 39 Minutes | 0 | 0.0% |
| 40 to 44 Minutes | 0 | 0.0% |
| 45 to 59 Minutes | 15 | 21.7% |
| 60 to 89 Minutes | 12 | 17.4% |
| 90 or more Minutes | 5 | 7.2% |
Commute Time by Sex in Middleburg
The most common commute times in Middleburg are 60 to 89 minutes (12 commuters, 46.2%) for males and 45 to 59 minutes (15 commuters, 34.9%) for females.
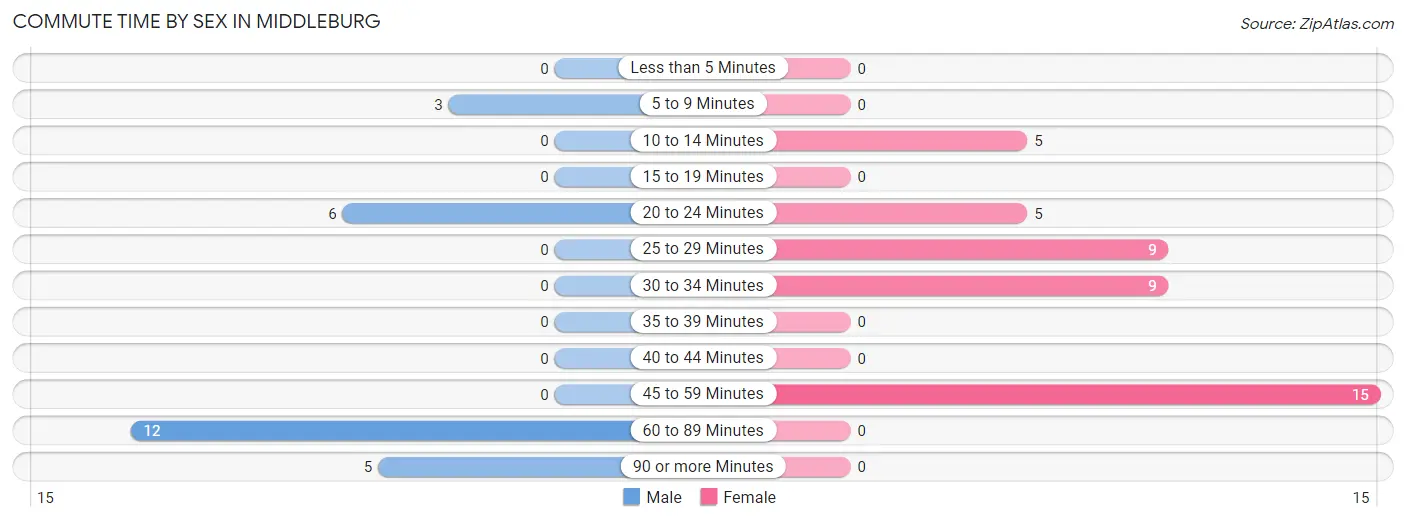
| Commute Time | Male | Female |
| Less than 5 Minutes | 0 (0.0%) | 0 (0.0%) |
| 5 to 9 Minutes | 3 (11.5%) | 0 (0.0%) |
| 10 to 14 Minutes | 0 (0.0%) | 5 (11.6%) |
| 15 to 19 Minutes | 0 (0.0%) | 0 (0.0%) |
| 20 to 24 Minutes | 6 (23.1%) | 5 (11.6%) |
| 25 to 29 Minutes | 0 (0.0%) | 9 (20.9%) |
| 30 to 34 Minutes | 0 (0.0%) | 9 (20.9%) |
| 35 to 39 Minutes | 0 (0.0%) | 0 (0.0%) |
| 40 to 44 Minutes | 0 (0.0%) | 0 (0.0%) |
| 45 to 59 Minutes | 0 (0.0%) | 15 (34.9%) |
| 60 to 89 Minutes | 12 (46.2%) | 0 (0.0%) |
| 90 or more Minutes | 5 (19.2%) | 0 (0.0%) |
Time of Departure to Work by Sex in Middleburg
The most frequent times of departure to work in Middleburg are 12:00 AM to 4:59 AM (17, 65.4%) for males and 12:00 PM to 3:59 PM (20, 46.5%) for females.
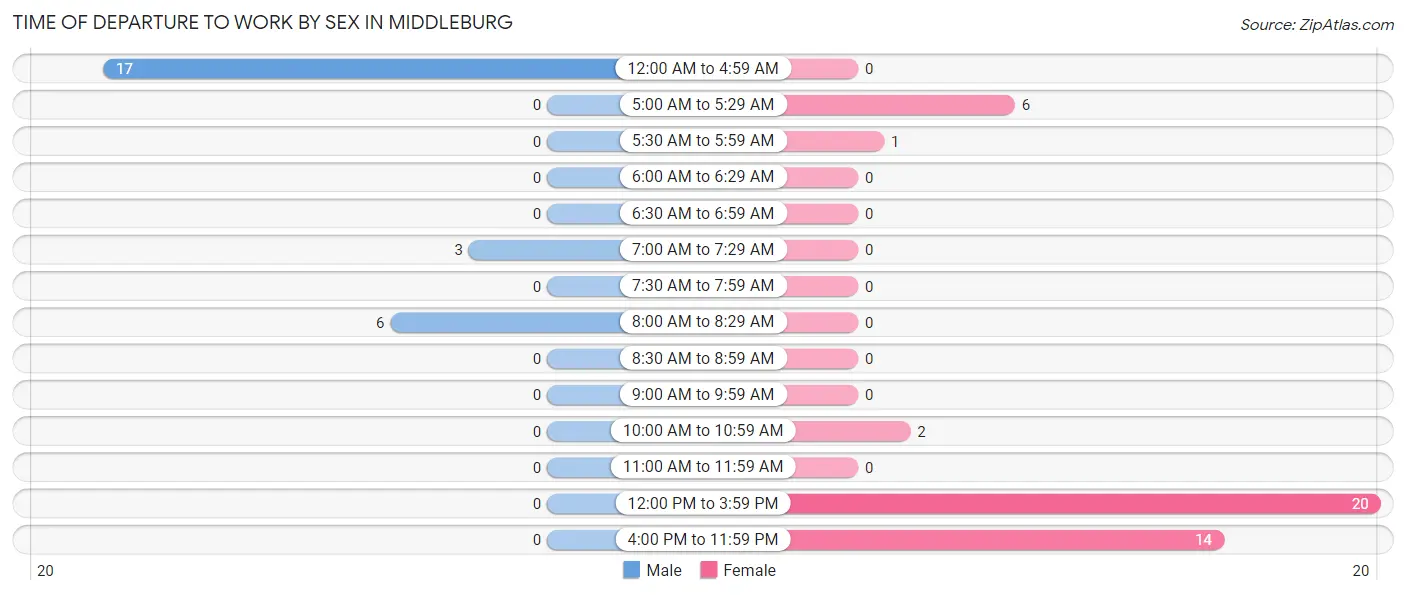
| Time of Departure | Male | Female |
| 12:00 AM to 4:59 AM | 17 (65.4%) | 0 (0.0%) |
| 5:00 AM to 5:29 AM | 0 (0.0%) | 6 (14.0%) |
| 5:30 AM to 5:59 AM | 0 (0.0%) | 1 (2.3%) |
| 6:00 AM to 6:29 AM | 0 (0.0%) | 0 (0.0%) |
| 6:30 AM to 6:59 AM | 0 (0.0%) | 0 (0.0%) |
| 7:00 AM to 7:29 AM | 3 (11.5%) | 0 (0.0%) |
| 7:30 AM to 7:59 AM | 0 (0.0%) | 0 (0.0%) |
| 8:00 AM to 8:29 AM | 6 (23.1%) | 0 (0.0%) |
| 8:30 AM to 8:59 AM | 0 (0.0%) | 0 (0.0%) |
| 9:00 AM to 9:59 AM | 0 (0.0%) | 0 (0.0%) |
| 10:00 AM to 10:59 AM | 0 (0.0%) | 2 (4.6%) |
| 11:00 AM to 11:59 AM | 0 (0.0%) | 0 (0.0%) |
| 12:00 PM to 3:59 PM | 0 (0.0%) | 20 (46.5%) |
| 4:00 PM to 11:59 PM | 0 (0.0%) | 14 (32.6%) |
| Total | 26 (100.0%) | 43 (100.0%) |
Housing Occupancy in Middleburg
Occupancy by Ownership in Middleburg
Of the total 85 dwellings in Middleburg, owner-occupied units account for 69 (81.2%), while renter-occupied units make up 16 (18.8%).
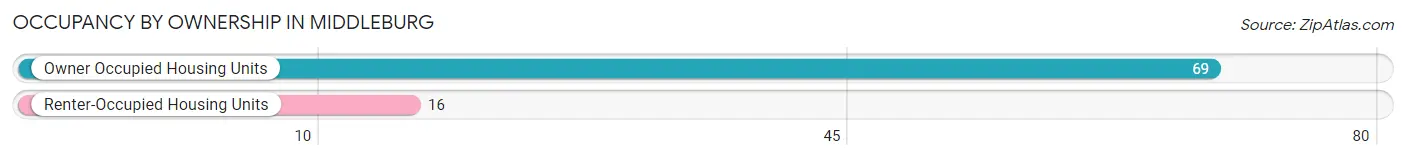
| Occupancy | # Housing Units | % Housing Units |
| Owner Occupied Housing Units | 69 | 81.2% |
| Renter-Occupied Housing Units | 16 | 18.8% |
| Total Occupied Housing Units | 85 | 100.0% |
Occupancy by Household Size in Middleburg
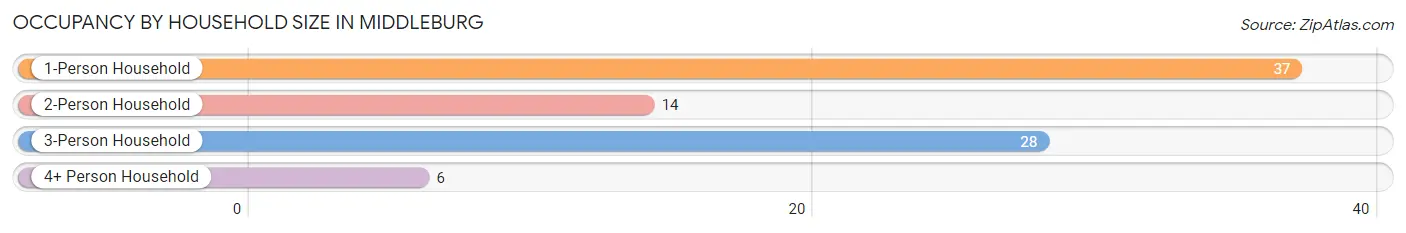
| Household Size | # Housing Units | % Housing Units |
| 1-Person Household | 37 | 43.5% |
| 2-Person Household | 14 | 16.5% |
| 3-Person Household | 28 | 32.9% |
| 4+ Person Household | 6 | 7.1% |
| Total Housing Units | 85 | 100.0% |
Occupancy by Ownership by Household Size in Middleburg
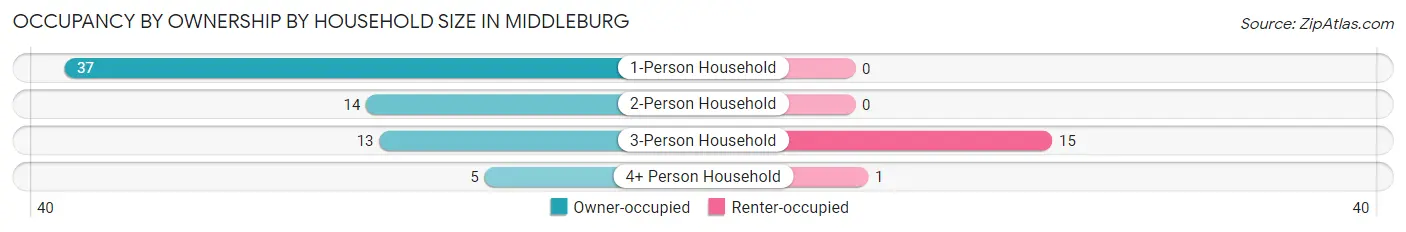
| Household Size | Owner-occupied | Renter-occupied |
| 1-Person Household | 37 (100.0%) | 0 (0.0%) |
| 2-Person Household | 14 (100.0%) | 0 (0.0%) |
| 3-Person Household | 13 (46.4%) | 15 (53.6%) |
| 4+ Person Household | 5 (83.3%) | 1 (16.7%) |
| Total Housing Units | 69 (81.2%) | 16 (18.8%) |
Occupancy by Educational Attainment in Middleburg
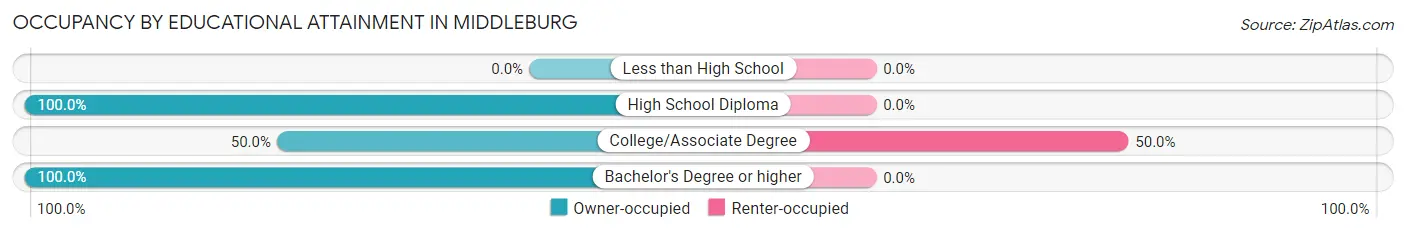
| Household Size | Owner-occupied | Renter-occupied |
| Less than High School | 0 (0.0%) | 0 (0.0%) |
| High School Diploma | 17 (100.0%) | 0 (0.0%) |
| College/Associate Degree | 16 (50.0%) | 16 (50.0%) |
| Bachelor's Degree or higher | 36 (100.0%) | 0 (0.0%) |
Occupancy by Age of Householder in Middleburg
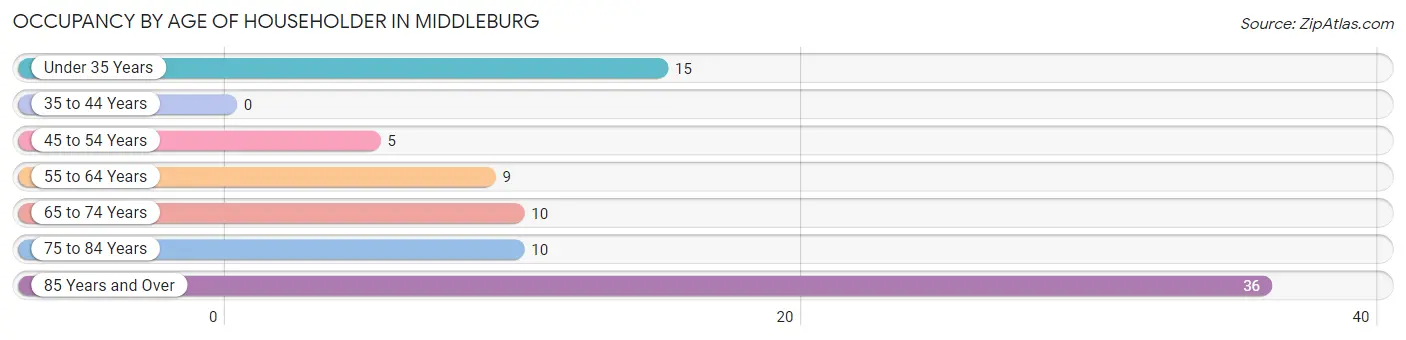
| Age Bracket | # Households | % Households |
| Under 35 Years | 15 | 17.6% |
| 35 to 44 Years | 0 | 0.0% |
| 45 to 54 Years | 5 | 5.9% |
| 55 to 64 Years | 9 | 10.6% |
| 65 to 74 Years | 10 | 11.8% |
| 75 to 84 Years | 10 | 11.8% |
| 85 Years and Over | 36 | 42.3% |
| Total | 85 | 100.0% |
Housing Finances in Middleburg
Median Income by Occupancy in Middleburg
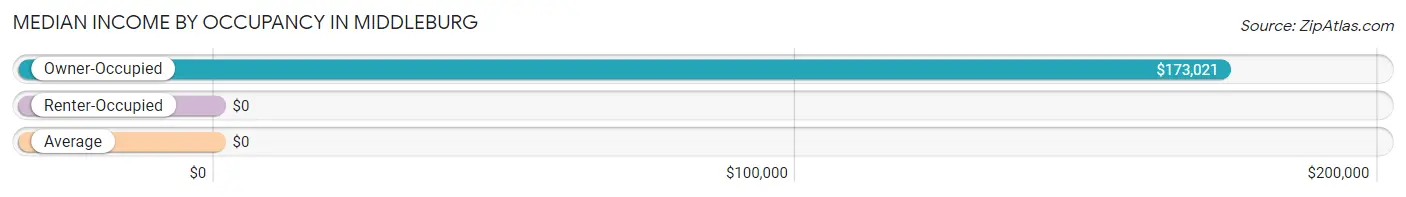
| Occupancy Type | # Households | Median Income |
| Owner-Occupied | 69 (81.2%) | $173,021 |
| Renter-Occupied | 16 (18.8%) | $0 |
| Average | 85 (100.0%) | $0 |
Occupancy by Householder Income Bracket in Middleburg
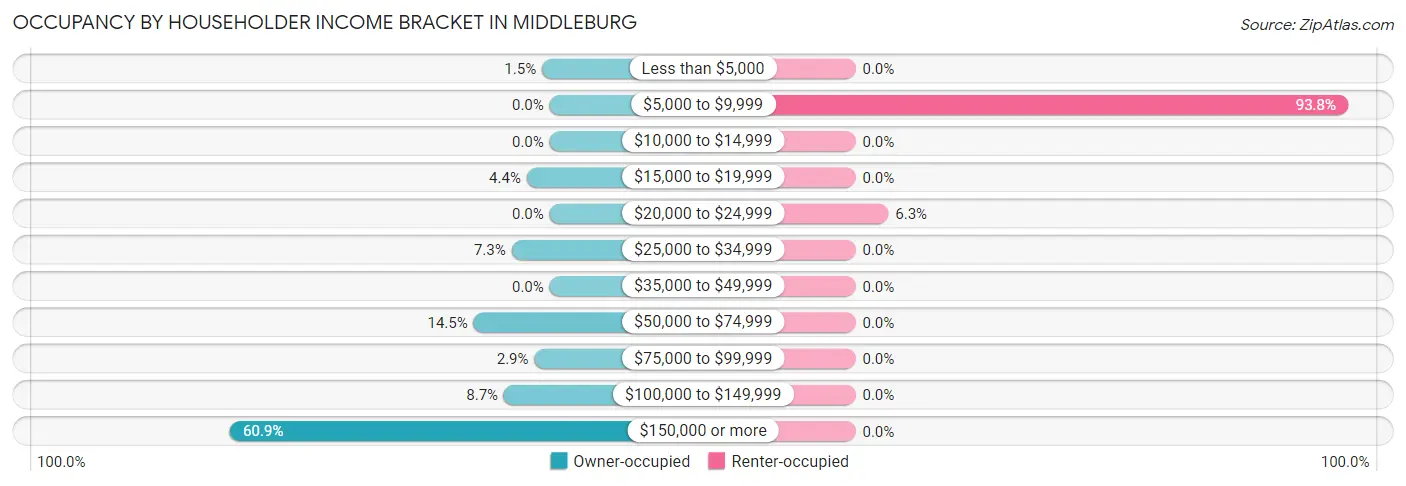
| Income Bracket | Owner-occupied | Renter-occupied |
| Less than $5,000 | 1 (1.5%) | 0 (0.0%) |
| $5,000 to $9,999 | 0 (0.0%) | 15 (93.8%) |
| $10,000 to $14,999 | 0 (0.0%) | 0 (0.0%) |
| $15,000 to $19,999 | 3 (4.3%) | 0 (0.0%) |
| $20,000 to $24,999 | 0 (0.0%) | 1 (6.2%) |
| $25,000 to $34,999 | 5 (7.2%) | 0 (0.0%) |
| $35,000 to $49,999 | 0 (0.0%) | 0 (0.0%) |
| $50,000 to $74,999 | 10 (14.5%) | 0 (0.0%) |
| $75,000 to $99,999 | 2 (2.9%) | 0 (0.0%) |
| $100,000 to $149,999 | 6 (8.7%) | 0 (0.0%) |
| $150,000 or more | 42 (60.9%) | 0 (0.0%) |
| Total | 69 (100.0%) | 16 (100.0%) |
Monthly Housing Cost Tiers in Middleburg
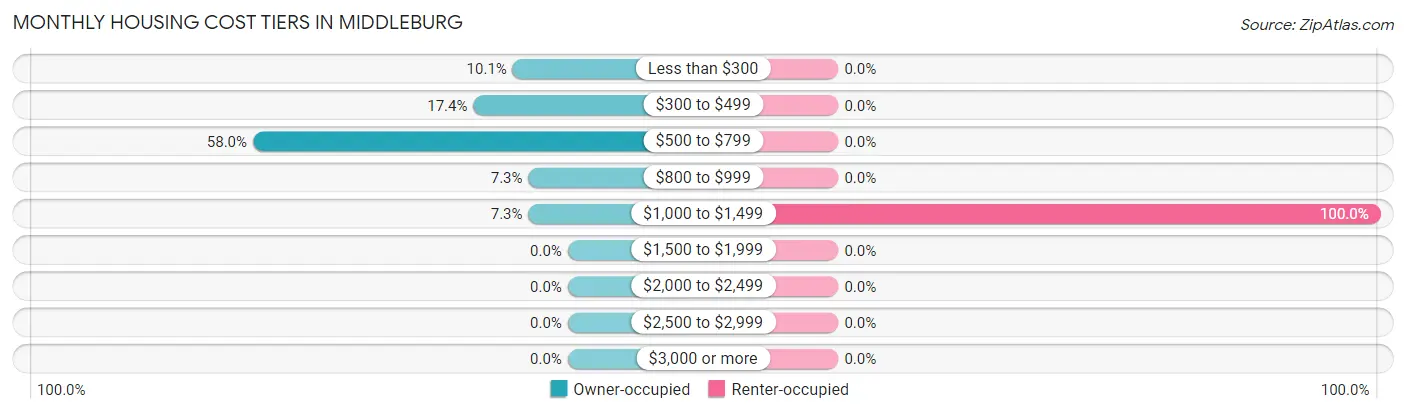
| Monthly Cost | Owner-occupied | Renter-occupied |
| Less than $300 | 7 (10.1%) | 0 (0.0%) |
| $300 to $499 | 12 (17.4%) | 0 (0.0%) |
| $500 to $799 | 40 (58.0%) | 0 (0.0%) |
| $800 to $999 | 5 (7.2%) | 0 (0.0%) |
| $1,000 to $1,499 | 5 (7.2%) | 16 (100.0%) |
| $1,500 to $1,999 | 0 (0.0%) | 0 (0.0%) |
| $2,000 to $2,499 | 0 (0.0%) | 0 (0.0%) |
| $2,500 to $2,999 | 0 (0.0%) | 0 (0.0%) |
| $3,000 or more | 0 (0.0%) | 0 (0.0%) |
| Total | 69 (100.0%) | 16 (100.0%) |
Physical Housing Characteristics in Middleburg
Housing Structures in Middleburg
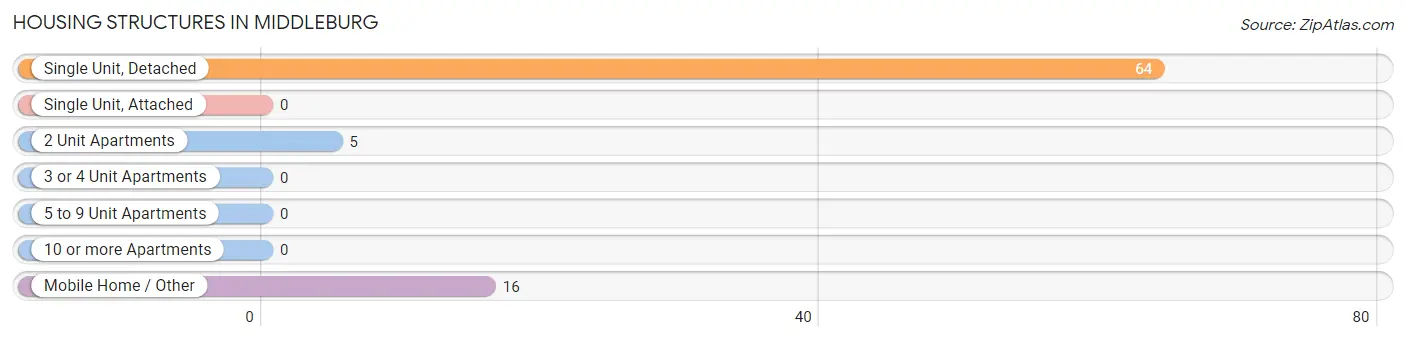
| Structure Type | # Housing Units | % Housing Units |
| Single Unit, Detached | 64 | 75.3% |
| Single Unit, Attached | 0 | 0.0% |
| 2 Unit Apartments | 5 | 5.9% |
| 3 or 4 Unit Apartments | 0 | 0.0% |
| 5 to 9 Unit Apartments | 0 | 0.0% |
| 10 or more Apartments | 0 | 0.0% |
| Mobile Home / Other | 16 | 18.8% |
| Total | 85 | 100.0% |
Housing Structures by Occupancy in Middleburg
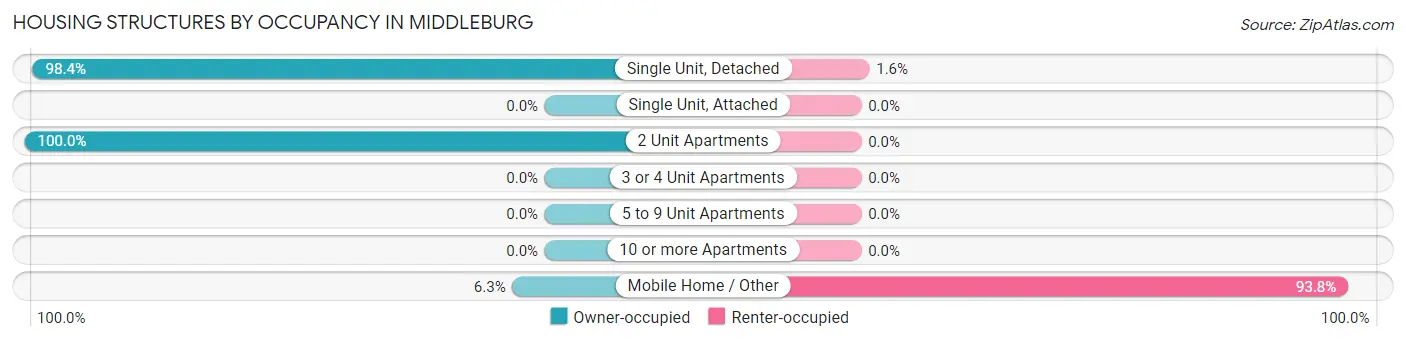
| Structure Type | Owner-occupied | Renter-occupied |
| Single Unit, Detached | 63 (98.4%) | 1 (1.6%) |
| Single Unit, Attached | 0 (0.0%) | 0 (0.0%) |
| 2 Unit Apartments | 5 (100.0%) | 0 (0.0%) |
| 3 or 4 Unit Apartments | 0 (0.0%) | 0 (0.0%) |
| 5 to 9 Unit Apartments | 0 (0.0%) | 0 (0.0%) |
| 10 or more Apartments | 0 (0.0%) | 0 (0.0%) |
| Mobile Home / Other | 1 (6.2%) | 15 (93.8%) |
| Total | 69 (81.2%) | 16 (18.8%) |
Housing Structures by Number of Rooms in Middleburg
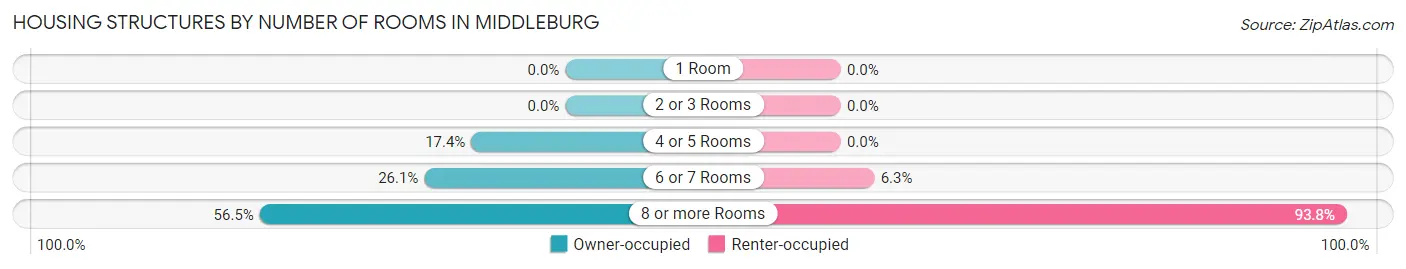
| Number of Rooms | Owner-occupied | Renter-occupied |
| 1 Room | 0 (0.0%) | 0 (0.0%) |
| 2 or 3 Rooms | 0 (0.0%) | 0 (0.0%) |
| 4 or 5 Rooms | 12 (17.4%) | 0 (0.0%) |
| 6 or 7 Rooms | 18 (26.1%) | 1 (6.2%) |
| 8 or more Rooms | 39 (56.5%) | 15 (93.8%) |
| Total | 69 (100.0%) | 16 (100.0%) |
Housing Structure by Heating Type in Middleburg
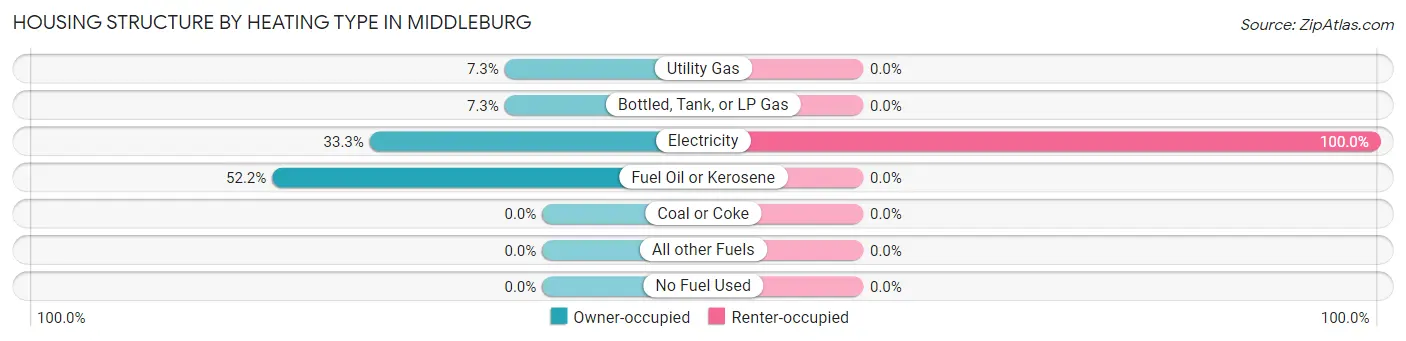
| Heating Type | Owner-occupied | Renter-occupied |
| Utility Gas | 5 (7.2%) | 0 (0.0%) |
| Bottled, Tank, or LP Gas | 5 (7.2%) | 0 (0.0%) |
| Electricity | 23 (33.3%) | 16 (100.0%) |
| Fuel Oil or Kerosene | 36 (52.2%) | 0 (0.0%) |
| Coal or Coke | 0 (0.0%) | 0 (0.0%) |
| All other Fuels | 0 (0.0%) | 0 (0.0%) |
| No Fuel Used | 0 (0.0%) | 0 (0.0%) |
| Total | 69 (100.0%) | 16 (100.0%) |
Household Vehicle Usage in Middleburg
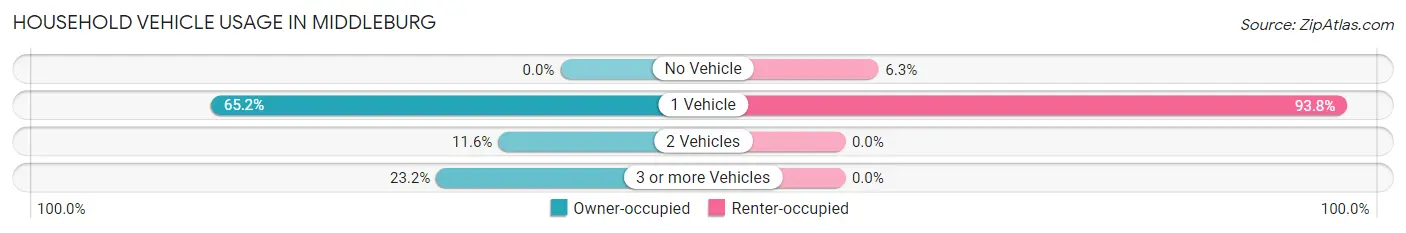
| Vehicles per Household | Owner-occupied | Renter-occupied |
| No Vehicle | 0 (0.0%) | 1 (6.2%) |
| 1 Vehicle | 45 (65.2%) | 15 (93.8%) |
| 2 Vehicles | 8 (11.6%) | 0 (0.0%) |
| 3 or more Vehicles | 16 (23.2%) | 0 (0.0%) |
| Total | 69 (100.0%) | 16 (100.0%) |
Real Estate & Mortgages in Middleburg
Real Estate and Mortgage Overview in Middleburg
| Characteristic | Without Mortgage | With Mortgage |
| Housing Units | 59 | 10 |
| Median Property Value | - | - |
| Median Household Income | $173,229 | $2 |
| Monthly Housing Costs | $529 | $0 |
| Real Estate Taxes | $2,181 | $0 |
Property Value by Mortgage Status in Middleburg
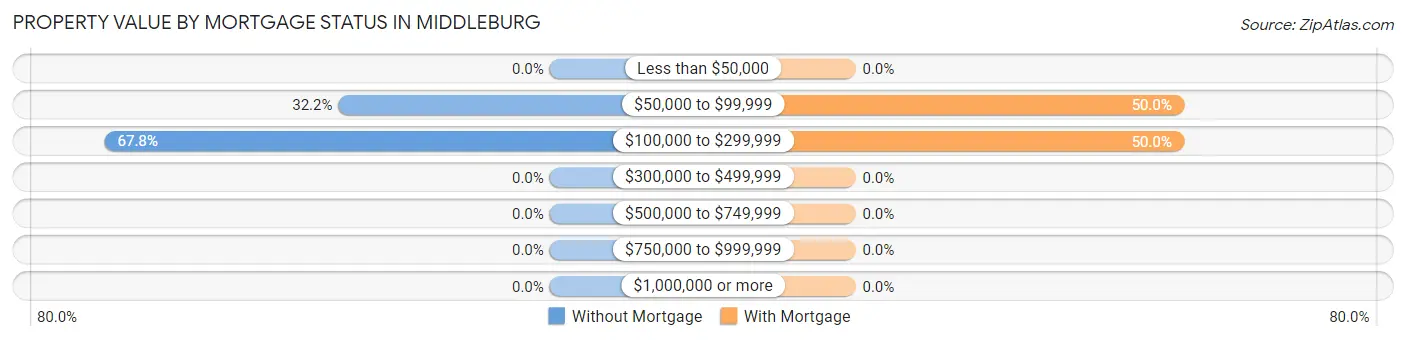
| Property Value | Without Mortgage | With Mortgage |
| Less than $50,000 | 0 (0.0%) | 0 (0.0%) |
| $50,000 to $99,999 | 19 (32.2%) | 5 (50.0%) |
| $100,000 to $299,999 | 40 (67.8%) | 5 (50.0%) |
| $300,000 to $499,999 | 0 (0.0%) | 0 (0.0%) |
| $500,000 to $749,999 | 0 (0.0%) | 0 (0.0%) |
| $750,000 to $999,999 | 0 (0.0%) | 0 (0.0%) |
| $1,000,000 or more | 0 (0.0%) | 0 (0.0%) |
| Total | 59 (100.0%) | 10 (100.0%) |
Household Income by Mortgage Status in Middleburg
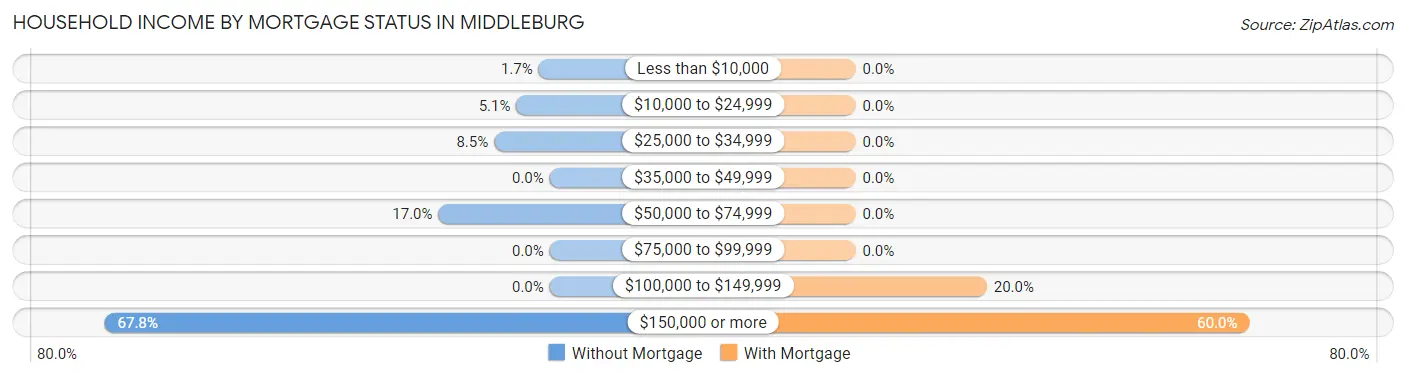
| Household Income | Without Mortgage | With Mortgage |
| Less than $10,000 | 1 (1.7%) | 0 (0.0%) |
| $10,000 to $24,999 | 3 (5.1%) | 0 (0.0%) |
| $25,000 to $34,999 | 5 (8.5%) | 0 (0.0%) |
| $35,000 to $49,999 | 0 (0.0%) | 0 (0.0%) |
| $50,000 to $74,999 | 10 (17.0%) | 0 (0.0%) |
| $75,000 to $99,999 | 0 (0.0%) | 0 (0.0%) |
| $100,000 to $149,999 | 0 (0.0%) | 2 (20.0%) |
| $150,000 or more | 40 (67.8%) | 6 (60.0%) |
| Total | 59 (100.0%) | 10 (100.0%) |
Property Value to Household Income Ratio in Middleburg
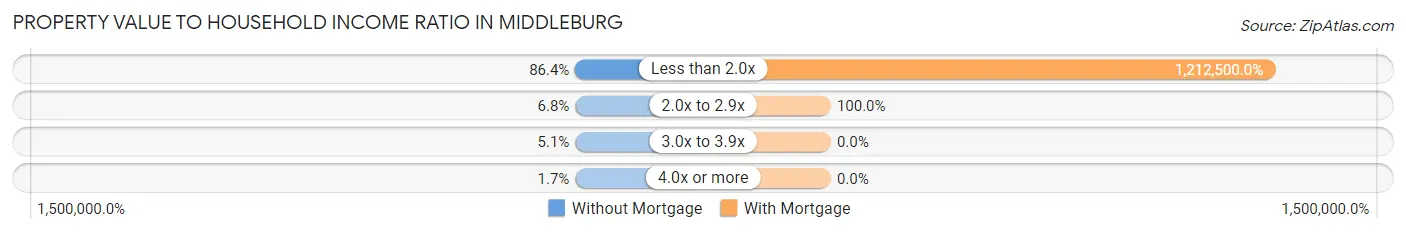
| Value-to-Income Ratio | Without Mortgage | With Mortgage |
| Less than 2.0x | 51 (86.4%) | 121,250 (1,212,500.0%) |
| 2.0x to 2.9x | 4 (6.8%) | 10 (100.0%) |
| 3.0x to 3.9x | 3 (5.1%) | 0 (0.0%) |
| 4.0x or more | 1 (1.7%) | 0 (0.0%) |
| Total | 59 (100.0%) | 10 (100.0%) |
Real Estate Taxes by Mortgage Status in Middleburg
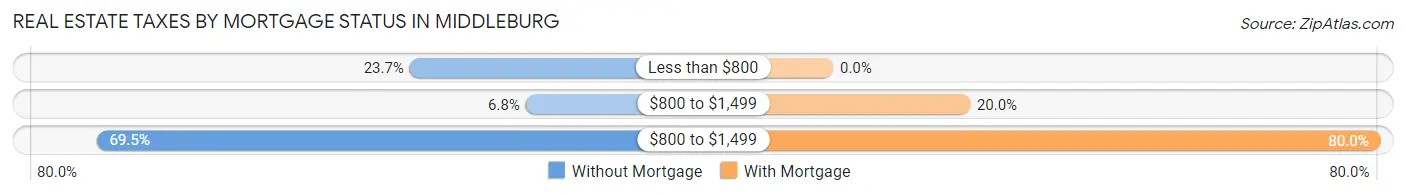
| Property Taxes | Without Mortgage | With Mortgage |
| Less than $800 | 14 (23.7%) | 0 (0.0%) |
| $800 to $1,499 | 4 (6.8%) | 2 (20.0%) |
| $800 to $1,499 | 41 (69.5%) | 8 (80.0%) |
| Total | 59 (100.0%) | 10 (100.0%) |
Health & Disability in Middleburg
Health Insurance Coverage by Age in Middleburg
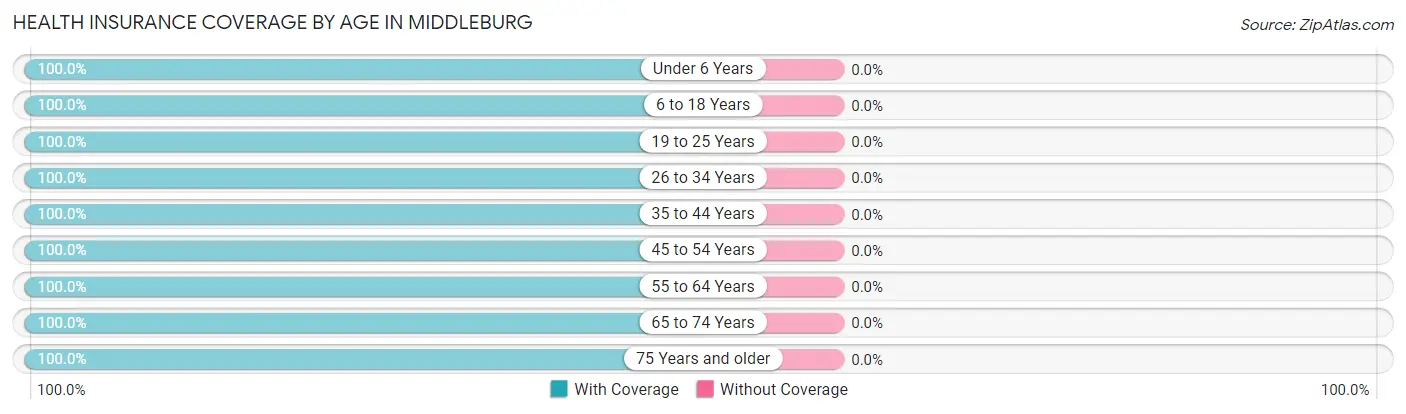
| Age Bracket | With Coverage | Without Coverage |
| Under 6 Years | 46 (100.0%) | 0 (0.0%) |
| 6 to 18 Years | 27 (100.0%) | 0 (0.0%) |
| 19 to 25 Years | 7 (100.0%) | 0 (0.0%) |
| 26 to 34 Years | 36 (100.0%) | 0 (0.0%) |
| 35 to 44 Years | 20 (100.0%) | 0 (0.0%) |
| 45 to 54 Years | 10 (100.0%) | 0 (0.0%) |
| 55 to 64 Years | 12 (100.0%) | 0 (0.0%) |
| 65 to 74 Years | 19 (100.0%) | 0 (0.0%) |
| 75 Years and older | 46 (100.0%) | 0 (0.0%) |
| Total | 223 (100.0%) | 0 (0.0%) |
Health Insurance Coverage by Citizenship Status in Middleburg
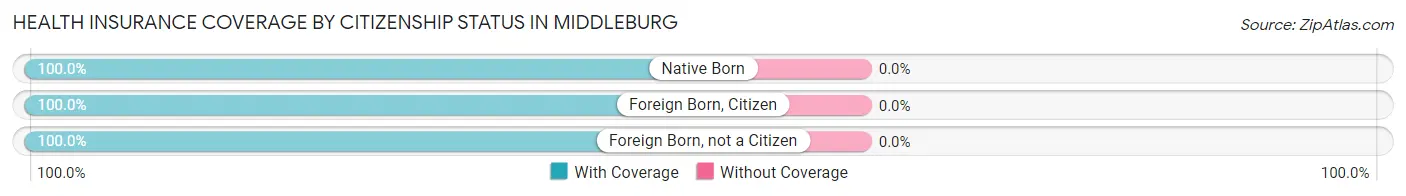
| Citizenship Status | With Coverage | Without Coverage |
| Native Born | 46 (100.0%) | 0 (0.0%) |
| Foreign Born, Citizen | 27 (100.0%) | 0 (0.0%) |
| Foreign Born, not a Citizen | 7 (100.0%) | 0 (0.0%) |
Health Insurance Coverage by Household Income in Middleburg
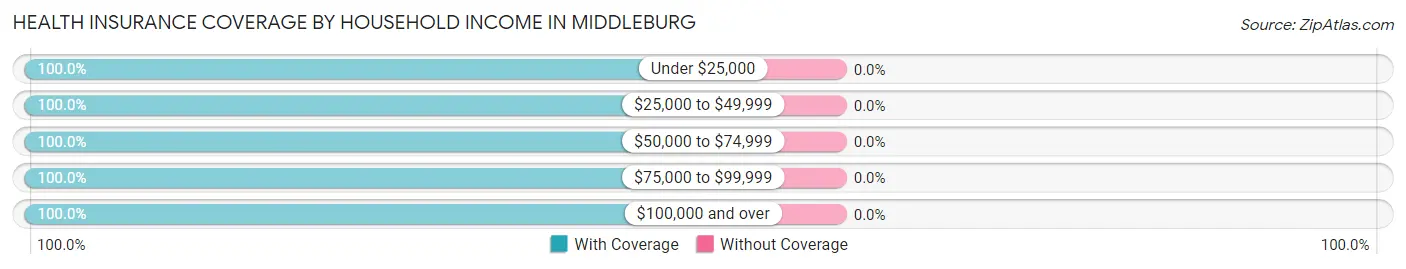
| Household Income | With Coverage | Without Coverage |
| Under $25,000 | 83 (100.0%) | 0 (0.0%) |
| $25,000 to $49,999 | 6 (100.0%) | 0 (0.0%) |
| $50,000 to $74,999 | 42 (100.0%) | 0 (0.0%) |
| $75,000 to $99,999 | 4 (100.0%) | 0 (0.0%) |
| $100,000 and over | 88 (100.0%) | 0 (0.0%) |
Public vs Private Health Insurance Coverage by Age in Middleburg
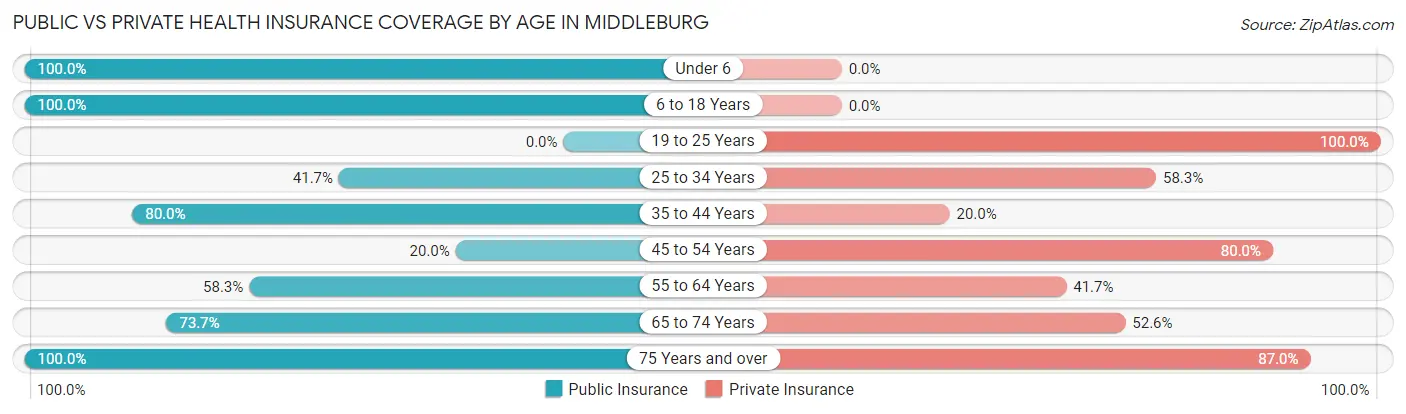
| Age Bracket | Public Insurance | Private Insurance |
| Under 6 | 46 (100.0%) | 0 (0.0%) |
| 6 to 18 Years | 27 (100.0%) | 0 (0.0%) |
| 19 to 25 Years | 0 (0.0%) | 7 (100.0%) |
| 25 to 34 Years | 15 (41.7%) | 21 (58.3%) |
| 35 to 44 Years | 16 (80.0%) | 4 (20.0%) |
| 45 to 54 Years | 2 (20.0%) | 8 (80.0%) |
| 55 to 64 Years | 7 (58.3%) | 5 (41.7%) |
| 65 to 74 Years | 14 (73.7%) | 10 (52.6%) |
| 75 Years and over | 46 (100.0%) | 40 (87.0%) |
| Total | 173 (77.6%) | 95 (42.6%) |
Disability Status by Sex by Age in Middleburg
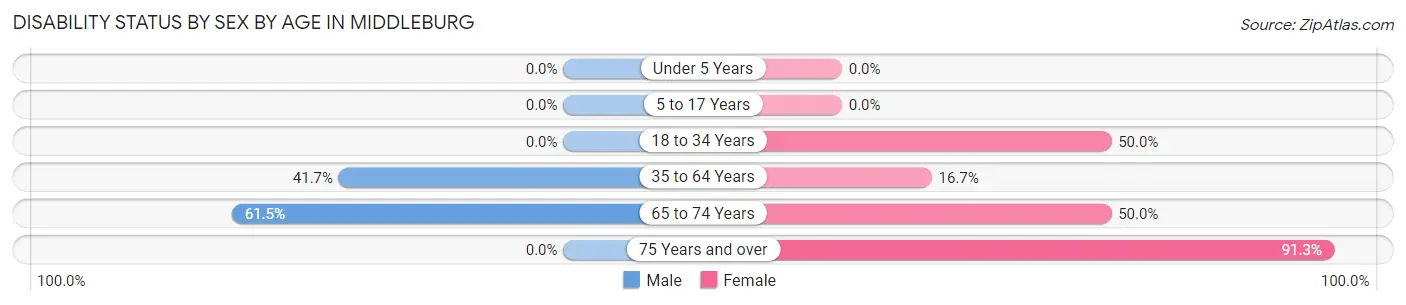
| Age Bracket | Male | Female |
| Under 5 Years | 0 (0.0%) | 0 (0.0%) |
| 5 to 17 Years | 0 (0.0%) | 0 (0.0%) |
| 18 to 34 Years | 0 (0.0%) | 15 (50.0%) |
| 35 to 64 Years | 5 (41.7%) | 5 (16.7%) |
| 65 to 74 Years | 8 (61.5%) | 3 (50.0%) |
| 75 Years and over | 0 (0.0%) | 42 (91.3%) |
Disability Class by Sex by Age in Middleburg
Disability Class: Hearing Difficulty
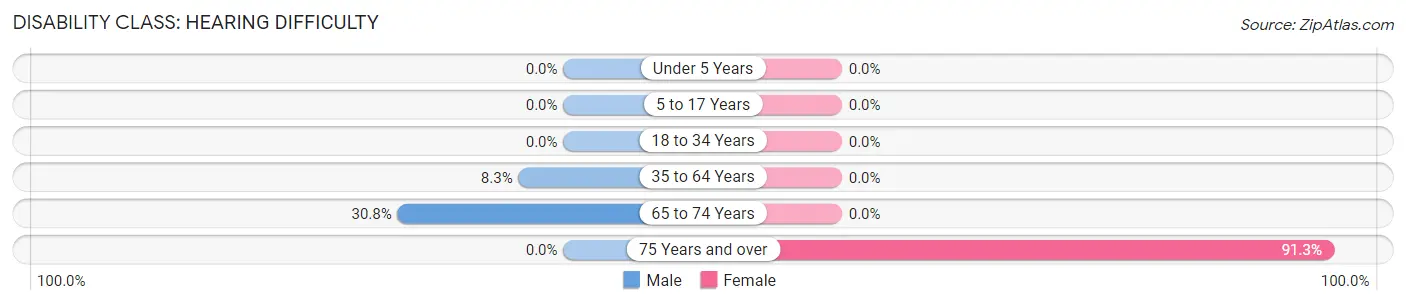
| Age Bracket | Male | Female |
| Under 5 Years | 0 (0.0%) | 0 (0.0%) |
| 5 to 17 Years | 0 (0.0%) | 0 (0.0%) |
| 18 to 34 Years | 0 (0.0%) | 0 (0.0%) |
| 35 to 64 Years | 1 (8.3%) | 0 (0.0%) |
| 65 to 74 Years | 4 (30.8%) | 0 (0.0%) |
| 75 Years and over | 0 (0.0%) | 42 (91.3%) |
Disability Class: Vision Difficulty
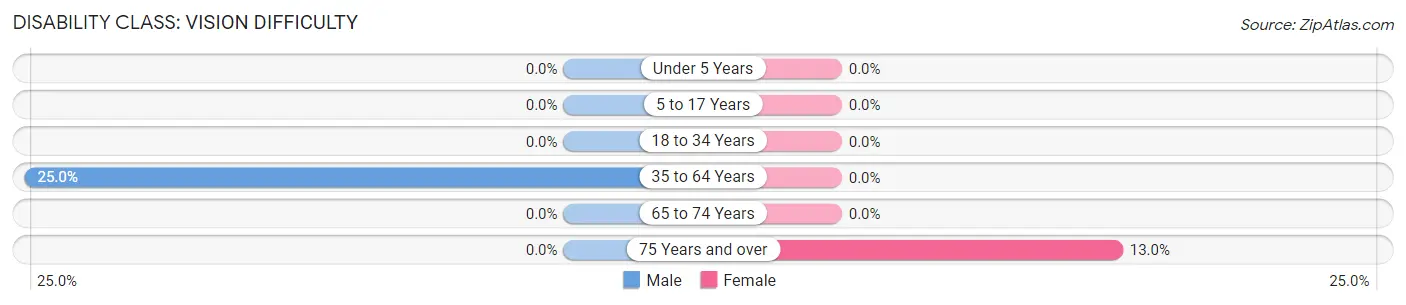
| Age Bracket | Male | Female |
| Under 5 Years | 0 (0.0%) | 0 (0.0%) |
| 5 to 17 Years | 0 (0.0%) | 0 (0.0%) |
| 18 to 34 Years | 0 (0.0%) | 0 (0.0%) |
| 35 to 64 Years | 3 (25.0%) | 0 (0.0%) |
| 65 to 74 Years | 0 (0.0%) | 0 (0.0%) |
| 75 Years and over | 0 (0.0%) | 6 (13.0%) |
Disability Class: Cognitive Difficulty
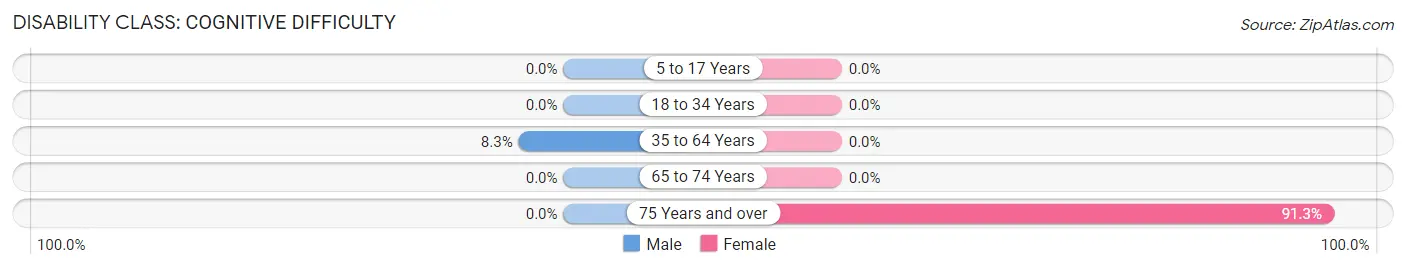
| Age Bracket | Male | Female |
| 5 to 17 Years | 0 (0.0%) | 0 (0.0%) |
| 18 to 34 Years | 0 (0.0%) | 0 (0.0%) |
| 35 to 64 Years | 1 (8.3%) | 0 (0.0%) |
| 65 to 74 Years | 0 (0.0%) | 0 (0.0%) |
| 75 Years and over | 0 (0.0%) | 42 (91.3%) |
Disability Class: Ambulatory Difficulty
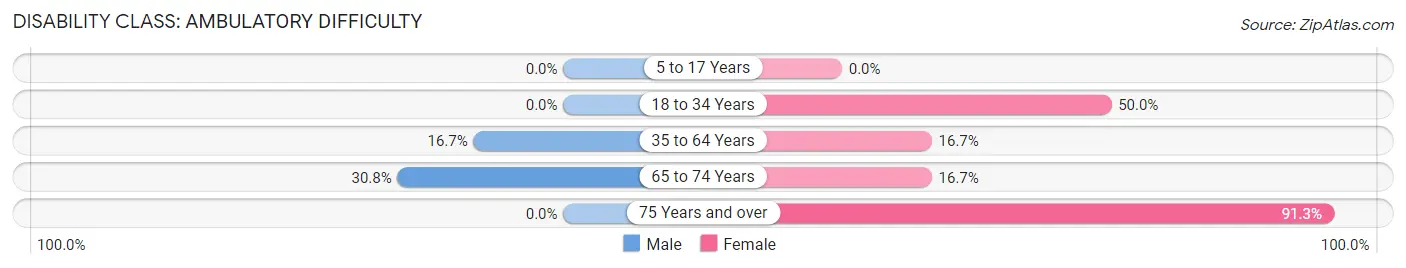
| Age Bracket | Male | Female |
| 5 to 17 Years | 0 (0.0%) | 0 (0.0%) |
| 18 to 34 Years | 0 (0.0%) | 15 (50.0%) |
| 35 to 64 Years | 2 (16.7%) | 5 (16.7%) |
| 65 to 74 Years | 4 (30.8%) | 1 (16.7%) |
| 75 Years and over | 0 (0.0%) | 42 (91.3%) |
Disability Class: Self-Care Difficulty
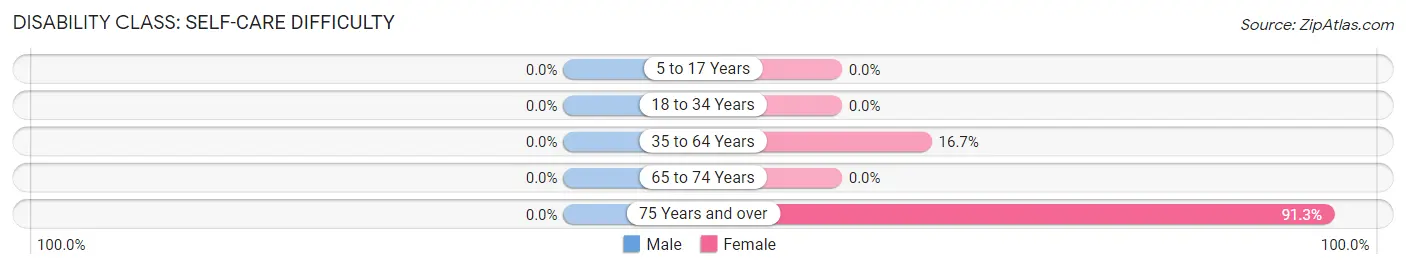
| Age Bracket | Male | Female |
| 5 to 17 Years | 0 (0.0%) | 0 (0.0%) |
| 18 to 34 Years | 0 (0.0%) | 0 (0.0%) |
| 35 to 64 Years | 0 (0.0%) | 5 (16.7%) |
| 65 to 74 Years | 0 (0.0%) | 0 (0.0%) |
| 75 Years and over | 0 (0.0%) | 42 (91.3%) |
Technology Access in Middleburg
Computing Device Access in Middleburg
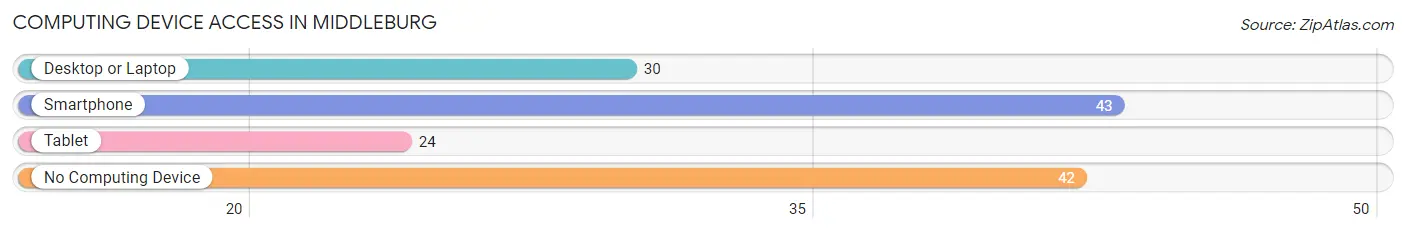
| Device Type | # Households | % Households |
| Desktop or Laptop | 30 | 35.3% |
| Smartphone | 43 | 50.6% |
| Tablet | 24 | 28.2% |
| No Computing Device | 42 | 49.4% |
| Total | 85 | 100.0% |
Internet Access in Middleburg
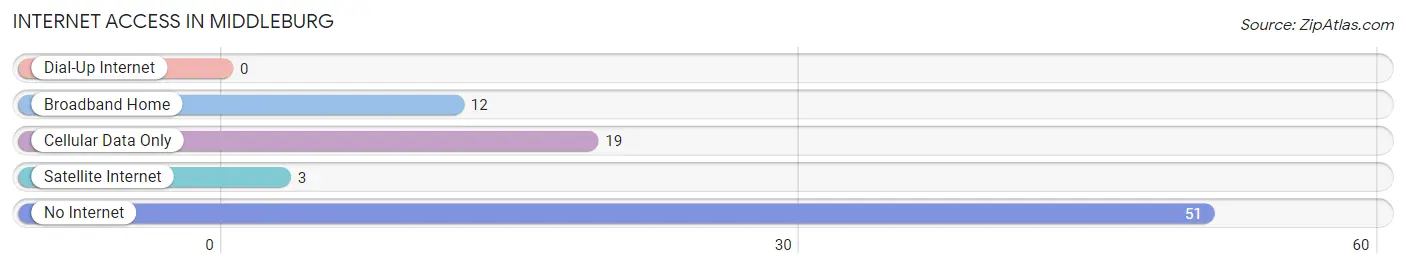
| Internet Type | # Households | % Households |
| Dial-Up Internet | 0 | 0.0% |
| Broadband Home | 12 | 14.1% |
| Cellular Data Only | 19 | 22.4% |
| Satellite Internet | 3 | 3.5% |
| No Internet | 51 | 60.0% |
| Total | 85 | 100.0% |
Middleburg Summary
Middleburg is a small town located in the foothills of the Blue Ridge Mountains in North Carolina. It is situated in the southwestern corner of the state, about 25 miles from Asheville. The town has a population of just over 1,000 people and is part of the larger Rutherford County.
History
Middleburg was first settled in the late 1700s by a group of settlers from Pennsylvania. The town was originally known as “Middleburgh” and was named after the nearby Middle Fork of the Broad River. The town was officially incorporated in 1887 and was the first town in Rutherford County to be incorporated.
The town was a major center of commerce in the late 19th and early 20th centuries. It was home to several mills, a tannery, and a number of other businesses. The town also had a railroad station, which connected it to other towns in the area.
In the late 20th century, the town began to decline as many of its businesses closed. However, in recent years, the town has seen a resurgence in popularity as a tourist destination.
Geography
Middleburg is located in the foothills of the Blue Ridge Mountains in western North Carolina. The town is situated in the southwestern corner of the state, about 25 miles from Asheville. The town is located in the Piedmont region of the state, which is characterized by rolling hills and valleys.
The town is situated at an elevation of 1,400 feet above sea level. The town is surrounded by the Nantahala National Forest, which provides a beautiful backdrop for the town.
Economy
The economy of Middleburg is largely based on tourism. The town is home to several bed and breakfasts, as well as a number of restaurants and shops. The town is also home to a number of outdoor recreation activities, such as hiking, fishing, and camping.
The town is also home to a number of small businesses, such as a local grocery store, a hardware store, and a few other small businesses.
Demographics
As of the 2010 census, the population of Middleburg was 1,072. The town is predominantly white, with 92.3% of the population being white. The town also has a small African American population, with 4.2% of the population being African American. The town also has a small Hispanic population, with 1.7% of the population being Hispanic.
The median household income in Middleburg is $37,500, which is slightly lower than the national median of $50,000. The median age in Middleburg is 44.7, which is slightly higher than the national median of 37.5.
Conclusion
Middleburg is a small town located in the foothills of the Blue Ridge Mountains in western North Carolina. The town has a population of just over 1,000 people and is part of the larger Rutherford County. The town has a long history and was once a major center of commerce in the late 19th and early 20th centuries. Today, the town is largely based on tourism, with a number of bed and breakfasts, restaurants, and shops. The town also has a small population of African Americans, Hispanics, and other minorities. The median household income in Middleburg is slightly lower than the national median, and the median age is slightly higher than the national median.
Common Questions
What is the Total Population of Middleburg?
Total Population of Middleburg is 223.
What is the Total Male Population of Middleburg?
Total Male Population of Middleburg is 87.
What is the Total Female Population of Middleburg?
Total Female Population of Middleburg is 136.
What is the Ratio of Males per 100 Females in Middleburg?
There are 63.97 Males per 100 Females in Middleburg.
What is the Ratio of Females per 100 Males in Middleburg?
There are 156.32 Females per 100 Males in Middleburg.
What is the Median Population Age in Middleburg?
Median Population Age in Middleburg is 33.7 Years.
What is the Average Family Size in Middleburg
Average Family Size in Middleburg is 4.3 People.
What is the Average Household Size in Middleburg
Average Household Size in Middleburg is 2.6 People.
What is Per Capita Income in Middleburg?
Per Capita income in Middleburg is $46,078.
What is Inequality or Gini Index in Middleburg?
Inequality or Gini Index in Middleburg is 0.36.
How Large is the Labor Force in Middleburg?
There are 83 People in the Labor Forcein in Middleburg.
What is the Percentage of People in the Labor Force in Middleburg?
54.6% of People are in the Labor Force in Middleburg.
What is the Unemployment Rate in Middleburg?
Unemployment Rate in Middleburg is 12.0%.