Jackson Heights, NC
Jackson Heights Map
Jackson Heights Overview
889
TOTAL POPULATION
485
MALE POPULATION
404
FEMALE POPULATION
120.05
MALES / 100 FEMALES
83.30
FEMALES / 100 MALES
59.1
MEDIAN AGE
2.7
AVG FAMILY SIZE
2.4
AVG HOUSEHOLD SIZE
$22,326
PER CAPITA INCOME
$36,927
AVG HOUSEHOLD INCOME
9.2%
WAGE / INCOME GAP [ % ]
90.8¢/ $1
WAGE / INCOME GAP [ $ ]
0.33
INEQUALITY / GINI INDEX
433
LABOR FORCE [ PEOPLE ]
55.9%
PERCENT IN LABOR FORCE
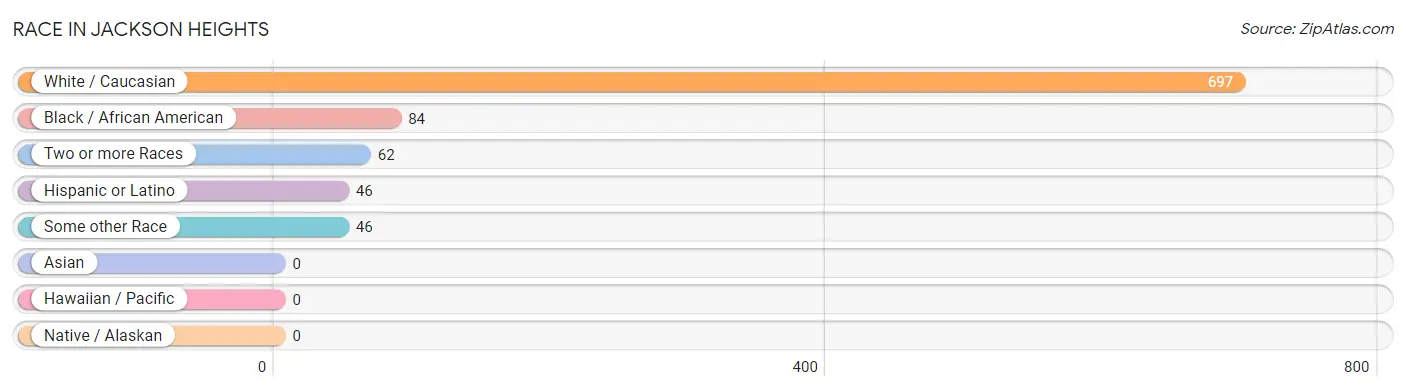
Race in Jackson Heights
The most populous races in Jackson Heights are White / Caucasian (697 | 78.4%), Black / African American (84 | 9.5%), and Two or more Races (62 | 7.0%).
| Race | # Population | % Population |
| Asian | 0 | 0.0% |
| Black / African American | 84 | 9.5% |
| Hawaiian / Pacific | 0 | 0.0% |
| Hispanic or Latino | 46 | 5.2% |
| Native / Alaskan | 0 | 0.0% |
| White / Caucasian | 697 | 78.4% |
| Two or more Races | 62 | 7.0% |
| Some other Race | 46 | 5.2% |
| Total | 889 | 100.0% |
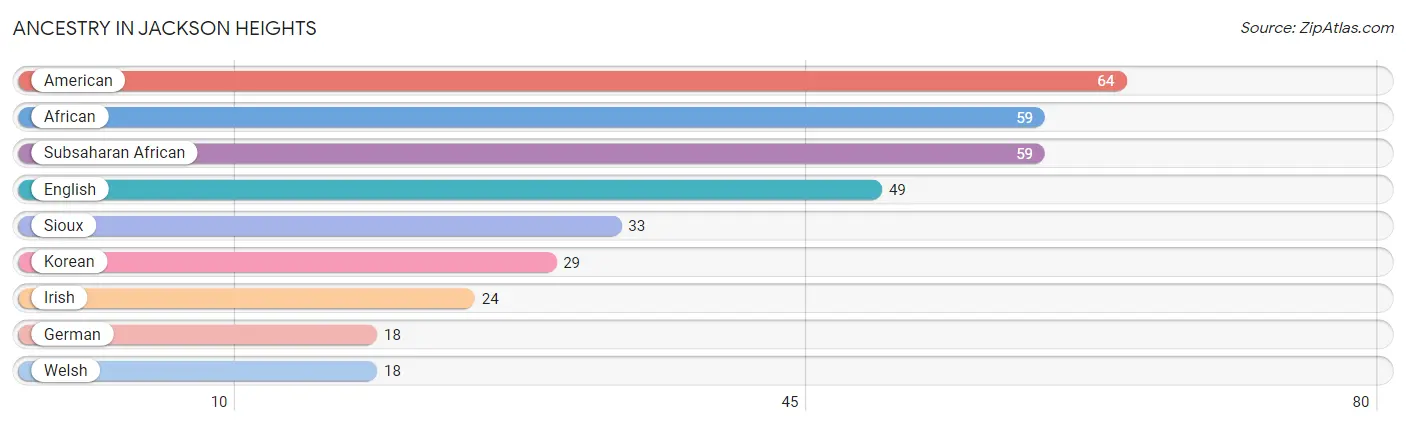
Ancestry in Jackson Heights
The most populous ancestries reported in Jackson Heights are American (64 | 7.2%), African (59 | 6.6%), Subsaharan African (59 | 6.6%), English (49 | 5.5%), and Sioux (33 | 3.7%), together accounting for 29.7% of all Jackson Heights residents.
| Ancestry | # Population | % Population |
| African | 59 | 6.6% |
| American | 64 | 7.2% |
| English | 49 | 5.5% |
| German | 18 | 2.0% |
| Irish | 24 | 2.7% |
| Korean | 29 | 3.3% |
| Sioux | 33 | 3.7% |
| Subsaharan African | 59 | 6.6% |
| Welsh | 18 | 2.0% | View All 9 Rows |
Immigrants in Jackson Heights

| Immigration Origin | # Population | % Population | View All 0 Rows |
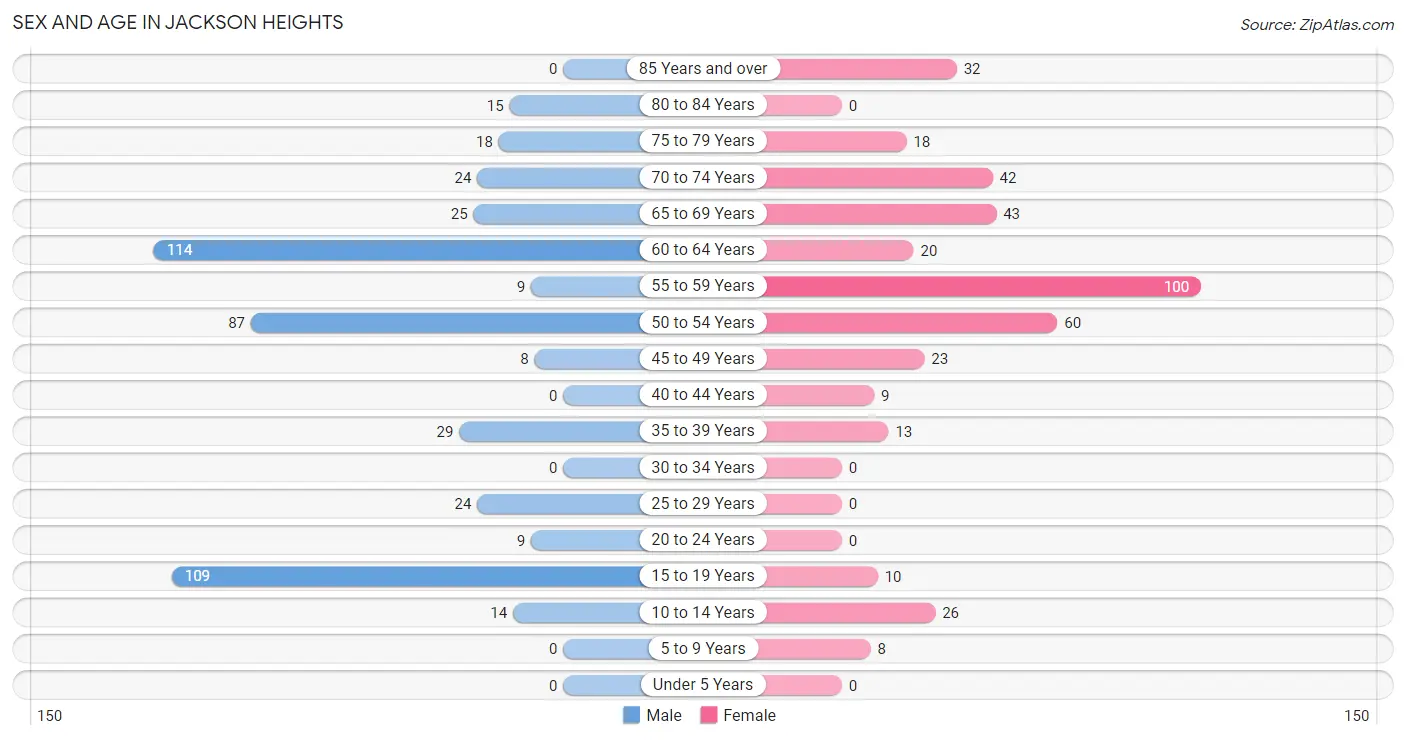
Sex and Age in Jackson Heights
Sex and Age in Jackson Heights
The most populous age groups in Jackson Heights are 60 to 64 Years (114 | 23.5%) for men and 55 to 59 Years (100 | 24.7%) for women.
| Age Bracket | Male | Female |
| Under 5 Years | 0 (0.0%) | 0 (0.0%) |
| 5 to 9 Years | 0 (0.0%) | 8 (2.0%) |
| 10 to 14 Years | 14 (2.9%) | 26 (6.4%) |
| 15 to 19 Years | 109 (22.5%) | 10 (2.5%) |
| 20 to 24 Years | 9 (1.9%) | 0 (0.0%) |
| 25 to 29 Years | 24 (5.0%) | 0 (0.0%) |
| 30 to 34 Years | 0 (0.0%) | 0 (0.0%) |
| 35 to 39 Years | 29 (6.0%) | 13 (3.2%) |
| 40 to 44 Years | 0 (0.0%) | 9 (2.2%) |
| 45 to 49 Years | 8 (1.7%) | 23 (5.7%) |
| 50 to 54 Years | 87 (17.9%) | 60 (14.8%) |
| 55 to 59 Years | 9 (1.9%) | 100 (24.7%) |
| 60 to 64 Years | 114 (23.5%) | 20 (5.0%) |
| 65 to 69 Years | 25 (5.1%) | 43 (10.6%) |
| 70 to 74 Years | 24 (5.0%) | 42 (10.4%) |
| 75 to 79 Years | 18 (3.7%) | 18 (4.5%) |
| 80 to 84 Years | 15 (3.1%) | 0 (0.0%) |
| 85 Years and over | 0 (0.0%) | 32 (7.9%) |
| Total | 485 (100.0%) | 404 (100.0%) |
Families and Households in Jackson Heights
Median Family Size in Jackson Heights
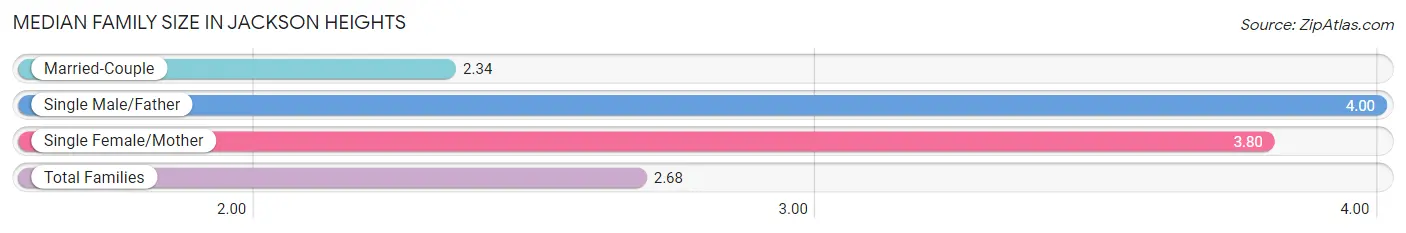
The median family size in Jackson Heights is 2.68 persons per family, with single male/father families (14 | 5.0%) accounting for the largest median family size of 4 persons per family. On the other hand, married-couple families (219 | 77.4%) represent the smallest median family size with 2.34 persons per family.
| Family Type | # Families | Family Size |
| Married-Couple | 219 (77.4%) | 2.34 |
| Single Male/Father | 14 (5.0%) | 4.00 |
| Single Female/Mother | 50 (17.7%) | 3.80 |
| Total Families | 283 (100.0%) | 2.68 |
Median Household Size in Jackson Heights
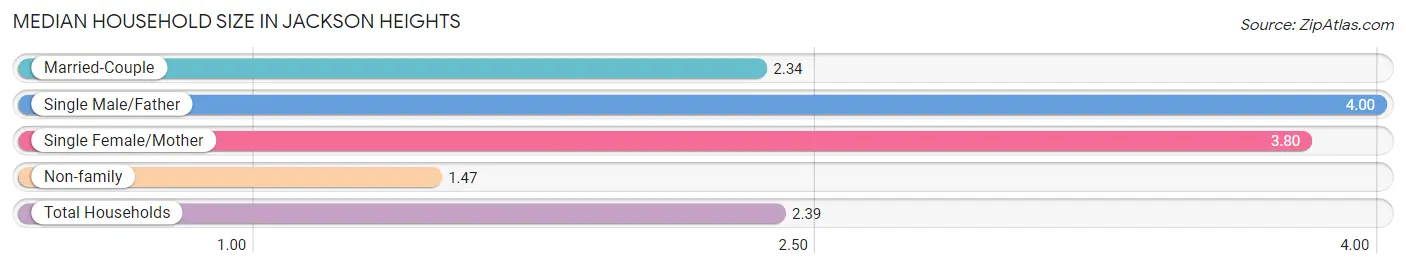
The median household size in Jackson Heights is 2.39 persons per household, with single male/father households (14 | 3.8%) accounting for the largest median household size of 4 persons per household. non-family households (89 | 23.9%) represent the smallest median household size with 1.47 persons per household.
| Household Type | # Households | Household Size |
| Married-Couple | 219 (58.9%) | 2.34 |
| Single Male/Father | 14 (3.8%) | 4.00 |
| Single Female/Mother | 50 (13.4%) | 3.80 |
| Non-family | 89 (23.9%) | 1.47 |
| Total Households | 372 (100.0%) | 2.39 |
Household Size by Marriage Status in Jackson Heights
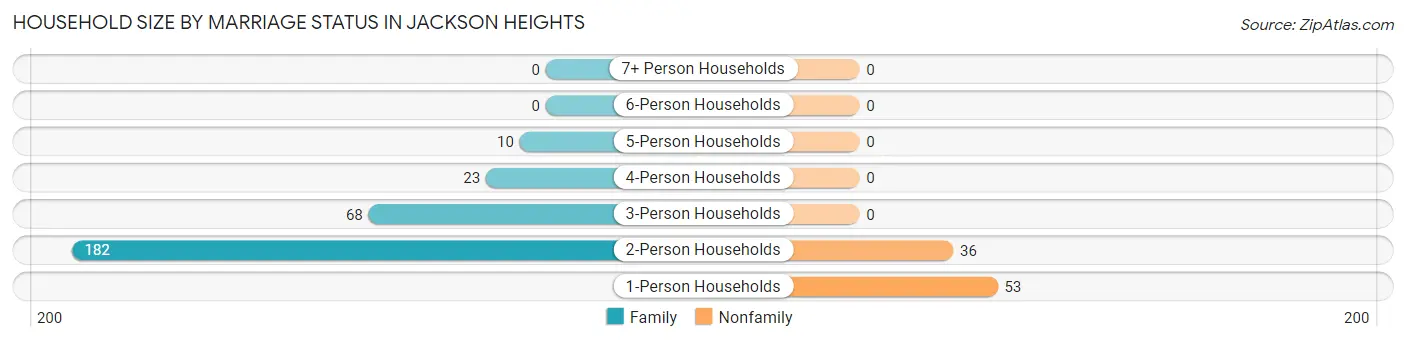
Out of a total of 372 households in Jackson Heights, 283 (76.1%) are family households, while 89 (23.9%) are nonfamily households. The most numerous type of family households are 2-person households, comprising 182, and the most common type of nonfamily households are 1-person households, comprising 53.
| Household Size | Family Households | Nonfamily Households |
| 1-Person Households | - | 53 (14.2%) |
| 2-Person Households | 182 (48.9%) | 36 (9.7%) |
| 3-Person Households | 68 (18.3%) | 0 (0.0%) |
| 4-Person Households | 23 (6.2%) | 0 (0.0%) |
| 5-Person Households | 10 (2.7%) | 0 (0.0%) |
| 6-Person Households | 0 (0.0%) | 0 (0.0%) |
| 7+ Person Households | 0 (0.0%) | 0 (0.0%) |
| Total | 283 (76.1%) | 89 (23.9%) |
Female Fertility in Jackson Heights
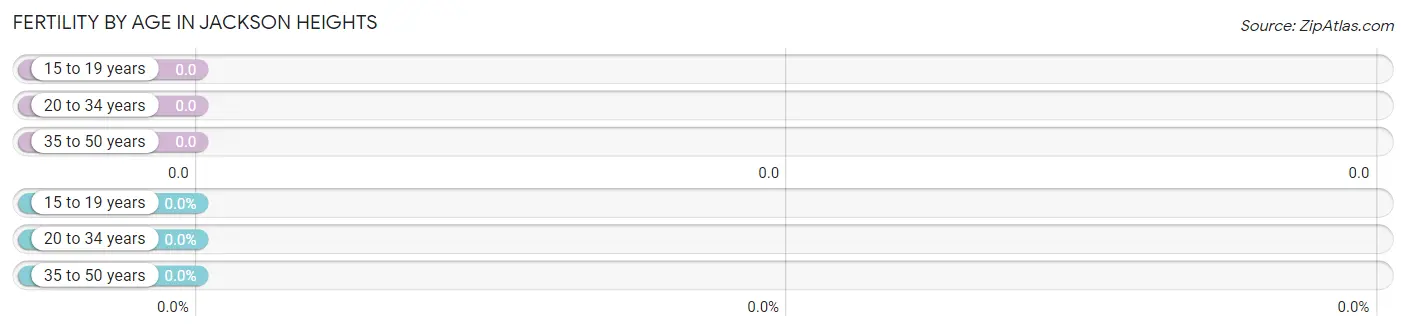
Fertility by Age in Jackson Heights
| Age Bracket | Women with Births | Births / 1,000 Women |
| 15 to 19 years | 0 (0.0%) | 0.0 |
| 20 to 34 years | 0 (0.0%) | 0.0 |
| 35 to 50 years | 0 (0.0%) | 0.0 |
| Total | 0 (0.0%) | 0.0 |
Fertility by Age by Marriage Status in Jackson Heights
| Age Bracket | Married | Unmarried |
| 15 to 19 years | 0 (0.0%) | 0 (0.0%) |
| 20 to 34 years | 0 (0.0%) | 0 (0.0%) |
| 35 to 50 years | 0 (0.0%) | 0 (0.0%) |
| Total | 0 (0.0%) | 0 (0.0%) |
Fertility by Education in Jackson Heights
| Educational Attainment | Women with Births | Births / 1,000 Women |
| Less than High School | 0 (0.0%) | 0.0 |
| High School Diploma | 0 (0.0%) | 0.0 |
| College or Associate's Degree | 0 (0.0%) | 0.0 |
| Bachelor's Degree | 0 (0.0%) | 0.0 |
| Graduate Degree | 0 (0.0%) | 0.0 |
| Total | 0 (0.0%) | 0.0 |
Fertility by Education by Marriage Status in Jackson Heights
| Educational Attainment | Married | Unmarried |
| Less than High School | 0 (0.0%) | 0 (0.0%) |
| High School Diploma | 0 (0.0%) | 0 (0.0%) |
| College or Associate's Degree | 0 (0.0%) | 0 (0.0%) |
| Bachelor's Degree | 0 (0.0%) | 0 (0.0%) |
| Graduate Degree | 0 (0.0%) | 0 (0.0%) |
| Total | 0 (0.0%) | 0 (0.0%) |
Income in Jackson Heights
Income Overview in Jackson Heights
| Characteristic | Number | Measure |
| Per Capita Income | 889 | $22,326 |
| Median Family Income | 283 | $0 |
| Mean Family Income | 283 | $58,051 |
| Median Household Income | 372 | $36,927 |
| Mean Household Income | 372 | $51,491 |
| Income Deficit | 283 | $0 |
| Wage / Income Gap (%) | 889 | 9.19% |
| Wage / Income Gap ($) | 889 | 90.81¢ per $1 |
| Gini / Inequality Index | 889 | 0.33 |
Earnings by Sex in Jackson Heights
Average Earnings in Jackson Heights are $34,258, $34,576 for men and $31,397 for women, a difference of 9.2%.
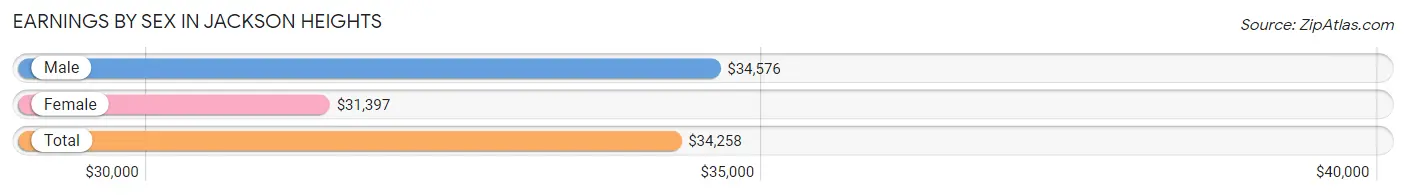
| Sex | Number | Average Earnings |
| Male | 292 (67.4%) | $34,576 |
| Female | 141 (32.6%) | $31,397 |
| Total | 433 (100.0%) | $34,258 |
Earnings by Sex by Income Bracket in Jackson Heights
The most common earnings brackets in Jackson Heights are $35,000 to $39,999 for men (114 | 39.0%) and $45,000 to $49,999 for women (47 | 33.3%).
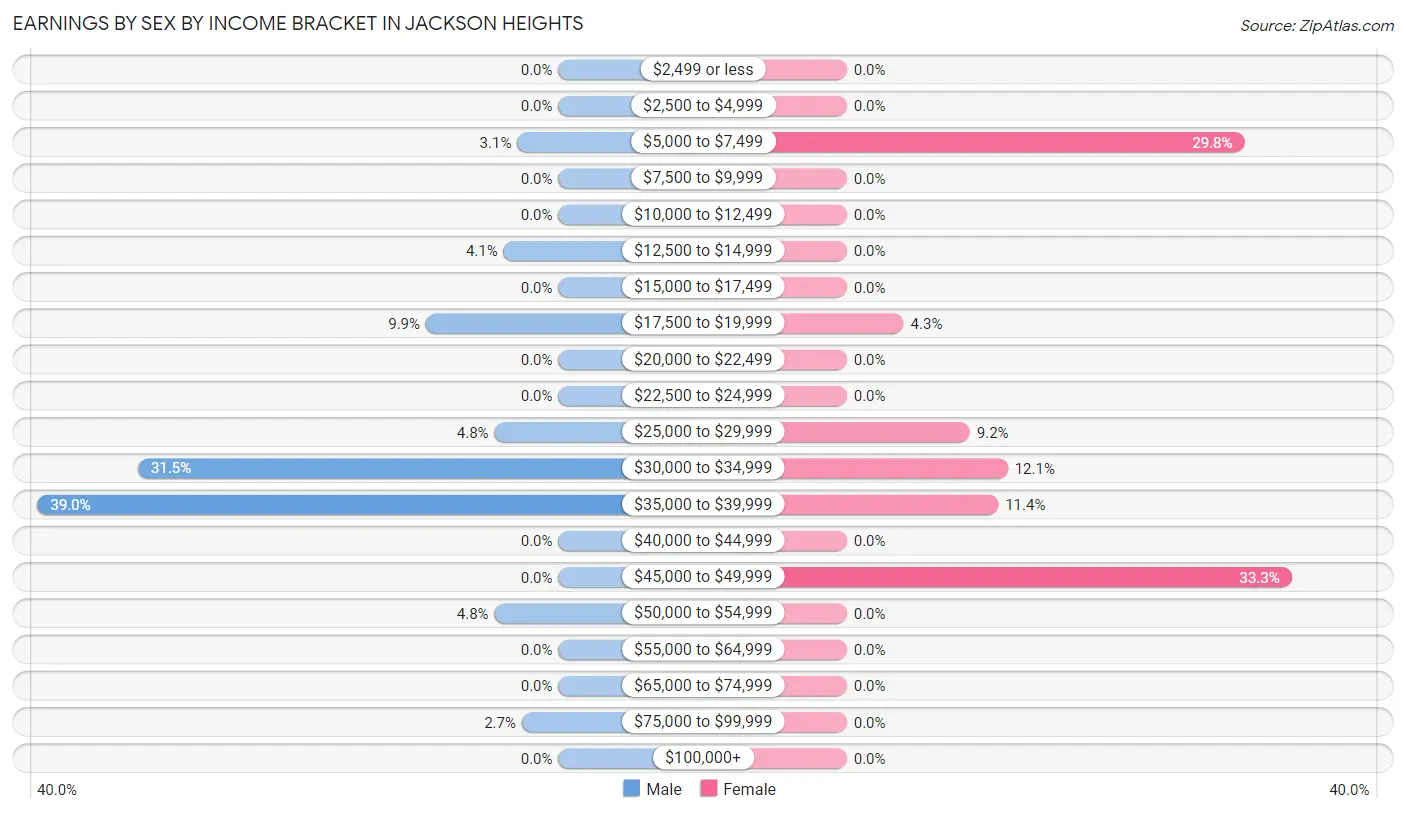
| Income | Male | Female |
| $2,499 or less | 0 (0.0%) | 0 (0.0%) |
| $2,500 to $4,999 | 0 (0.0%) | 0 (0.0%) |
| $5,000 to $7,499 | 9 (3.1%) | 42 (29.8%) |
| $7,500 to $9,999 | 0 (0.0%) | 0 (0.0%) |
| $10,000 to $12,499 | 0 (0.0%) | 0 (0.0%) |
| $12,500 to $14,999 | 12 (4.1%) | 0 (0.0%) |
| $15,000 to $17,499 | 0 (0.0%) | 0 (0.0%) |
| $17,500 to $19,999 | 29 (9.9%) | 6 (4.3%) |
| $20,000 to $22,499 | 0 (0.0%) | 0 (0.0%) |
| $22,500 to $24,999 | 0 (0.0%) | 0 (0.0%) |
| $25,000 to $29,999 | 14 (4.8%) | 13 (9.2%) |
| $30,000 to $34,999 | 92 (31.5%) | 17 (12.1%) |
| $35,000 to $39,999 | 114 (39.0%) | 16 (11.4%) |
| $40,000 to $44,999 | 0 (0.0%) | 0 (0.0%) |
| $45,000 to $49,999 | 0 (0.0%) | 47 (33.3%) |
| $50,000 to $54,999 | 14 (4.8%) | 0 (0.0%) |
| $55,000 to $64,999 | 0 (0.0%) | 0 (0.0%) |
| $65,000 to $74,999 | 0 (0.0%) | 0 (0.0%) |
| $75,000 to $99,999 | 8 (2.7%) | 0 (0.0%) |
| $100,000+ | 0 (0.0%) | 0 (0.0%) |
| Total | 292 (100.0%) | 141 (100.0%) |
Earnings by Sex by Educational Attainment in Jackson Heights
Average earnings in Jackson Heights are $34,767 for men and $31,397 for women, a difference of 9.7%. Men with an educational attainment of college or associate's degree enjoy the highest average annual earnings of $35,538, while those with high school diploma education earn the least with $33,856. Women with an educational attainment of college or associate's degree earn the most with the average annual earnings of $25,385, while those with college or associate's degree education have the smallest earnings of $25,385.
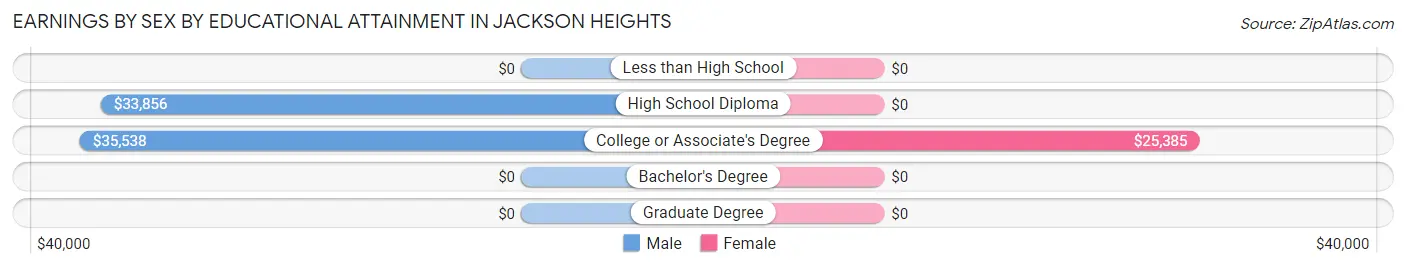
| Educational Attainment | Male Income | Female Income |
| Less than High School | - | - |
| High School Diploma | $33,856 | $0 |
| College or Associate's Degree | $35,538 | $25,385 |
| Bachelor's Degree | - | - |
| Graduate Degree | - | - |
| Total | $34,767 | $31,397 |
Family Income in Jackson Heights
Family Income Brackets in Jackson Heights
According to the Jackson Heights family income data, there are 91 families falling into the $35,000 to $49,999 income range, which is the most common income bracket and makes up 32.2% of all families.
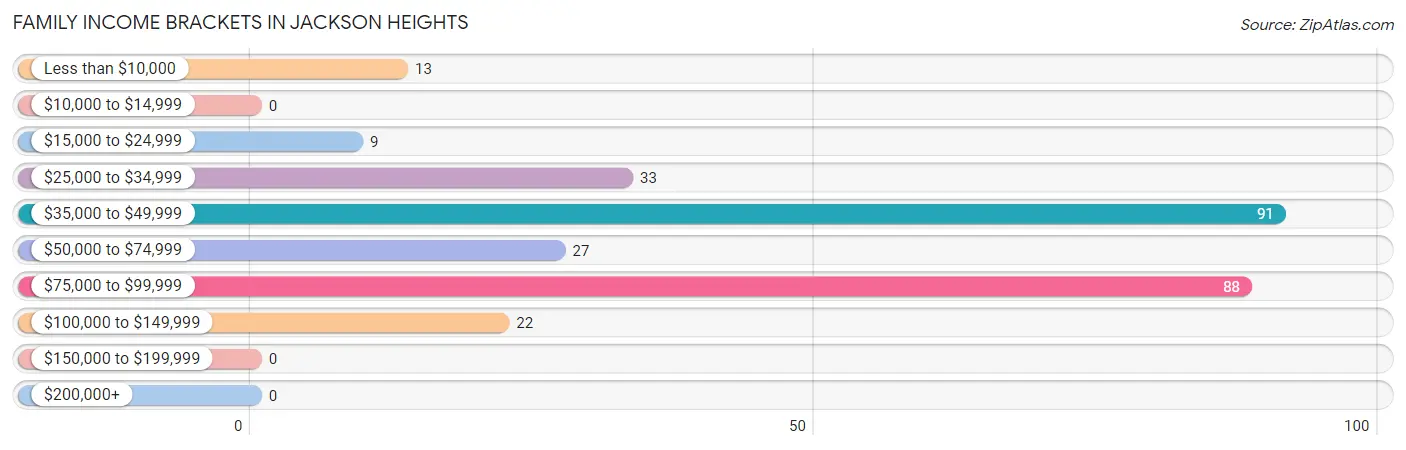
| Income Bracket | # Families | % Families |
| Less than $10,000 | 13 | 4.6% |
| $10,000 to $14,999 | 0 | 0.0% |
| $15,000 to $24,999 | 9 | 3.2% |
| $25,000 to $34,999 | 33 | 11.7% |
| $35,000 to $49,999 | 91 | 32.2% |
| $50,000 to $74,999 | 27 | 9.5% |
| $75,000 to $99,999 | 88 | 31.1% |
| $100,000 to $149,999 | 22 | 7.8% |
| $150,000 to $199,999 | 0 | 0.0% |
| $200,000+ | 0 | 0.0% |
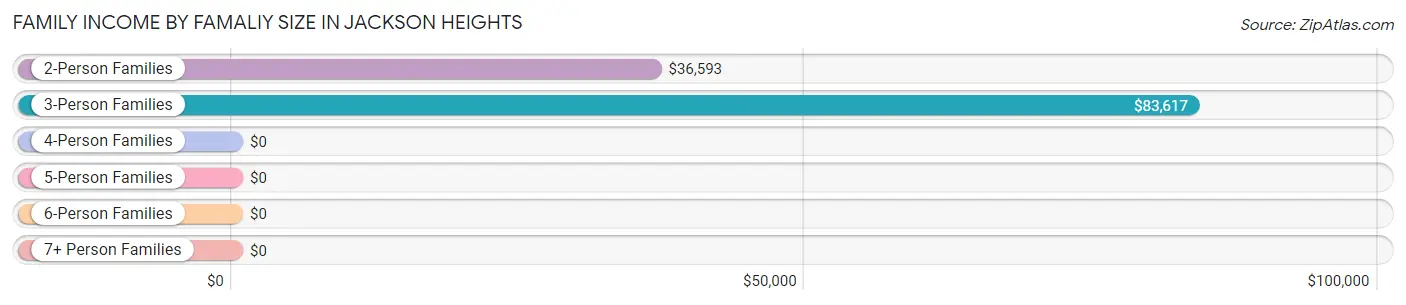
Family Income by Famaliy Size in Jackson Heights
3-person families (68 | 24.0%) account for the highest median family income in Jackson Heights with $83,617 per family, while 3-person families (68 | 24.0%) have the highest median income of $27,872 per family member.
| Income Bracket | # Families | Median Income |
| 2-Person Families | 182 (64.3%) | $36,593 |
| 3-Person Families | 68 (24.0%) | $83,617 |
| 4-Person Families | 23 (8.1%) | $0 |
| 5-Person Families | 10 (3.5%) | $0 |
| 6-Person Families | 0 (0.0%) | $0 |
| 7+ Person Families | 0 (0.0%) | $0 |
| Total | 283 (100.0%) | $0 |
Family Income by Number of Earners in Jackson Heights
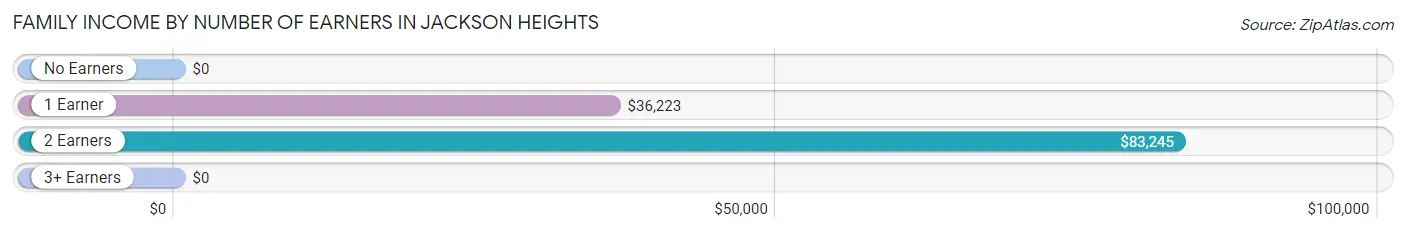
| Number of Earners | # Families | Median Income |
| No Earners | 40 (14.1%) | $0 |
| 1 Earner | 155 (54.8%) | $36,223 |
| 2 Earners | 66 (23.3%) | $83,245 |
| 3+ Earners | 22 (7.8%) | $0 |
| Total | 283 (100.0%) | $0 |
Household Income in Jackson Heights
Household Income Brackets in Jackson Heights
With 133 households falling in the category, the $35,000 to $49,999 income range is the most frequent in Jackson Heights, accounting for 35.7% of all households.
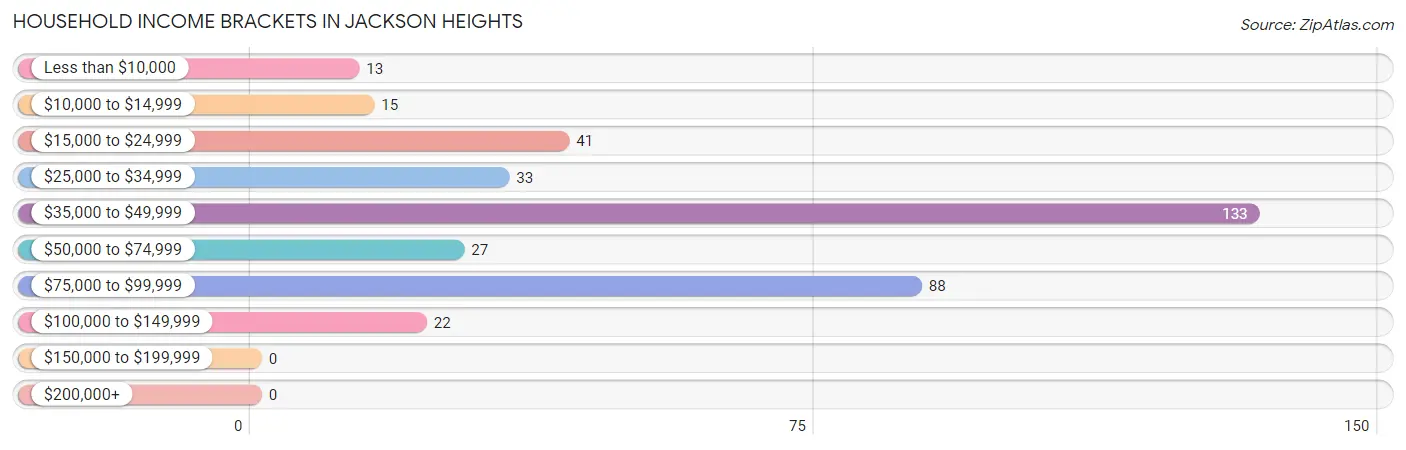
| Income Bracket | # Households | % Households |
| Less than $10,000 | 13 | 3.5% |
| $10,000 to $14,999 | 15 | 4.0% |
| $15,000 to $24,999 | 41 | 11.0% |
| $25,000 to $34,999 | 33 | 8.9% |
| $35,000 to $49,999 | 133 | 35.8% |
| $50,000 to $74,999 | 27 | 7.3% |
| $75,000 to $99,999 | 88 | 23.7% |
| $100,000 to $149,999 | 22 | 5.9% |
| $150,000 to $199,999 | 0 | 0.0% |
| $200,000+ | 0 | 0.0% |
Household Income by Householder Age in Jackson Heights
| Income Bracket | # Households | Median Income |
| 15 to 24 Years | 0 (0.0%) | $0 |
| 25 to 44 Years | 33 (8.9%) | $0 |
| 45 to 64 Years | 188 (50.5%) | $0 |
| 65+ Years | 151 (40.6%) | $0 |
| Total | 372 (100.0%) | $36,927 |
Poverty in Jackson Heights
Income Below Poverty by Sex and Age in Jackson Heights
With 13.0% poverty level for males and 15.1% for females among the residents of Jackson Heights, 6 to 11 year old males and 12 to 14 year old females are the most vulnerable to poverty, with 14 males (100.0%) and 10 females (100.0%) in their respective age groups living below the poverty level.
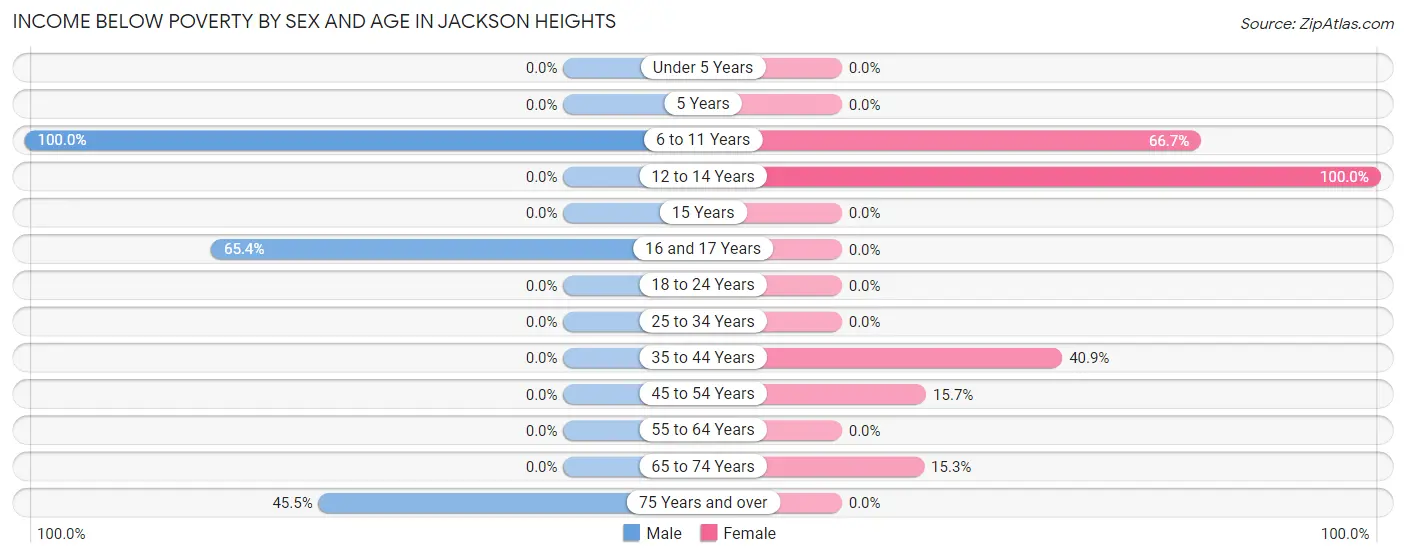
| Age Bracket | Male | Female |
| Under 5 Years | 0 (0.0%) | 0 (0.0%) |
| 5 Years | 0 (0.0%) | 0 (0.0%) |
| 6 to 11 Years | 14 (100.0%) | 16 (66.7%) |
| 12 to 14 Years | 0 (0.0%) | 10 (100.0%) |
| 15 Years | 0 (0.0%) | 0 (0.0%) |
| 16 and 17 Years | 34 (65.4%) | 0 (0.0%) |
| 18 to 24 Years | 0 (0.0%) | 0 (0.0%) |
| 25 to 34 Years | 0 (0.0%) | 0 (0.0%) |
| 35 to 44 Years | 0 (0.0%) | 9 (40.9%) |
| 45 to 54 Years | 0 (0.0%) | 13 (15.7%) |
| 55 to 64 Years | 0 (0.0%) | 0 (0.0%) |
| 65 to 74 Years | 0 (0.0%) | 13 (15.3%) |
| 75 Years and over | 15 (45.5%) | 0 (0.0%) |
| Total | 63 (13.0%) | 61 (15.1%) |
Income Above Poverty by Sex and Age in Jackson Heights
According to the poverty statistics in Jackson Heights, males aged 15 years and females aged 15 years are the age groups that are most secure financially, with 100.0% of males and 100.0% of females in these age groups living above the poverty line.
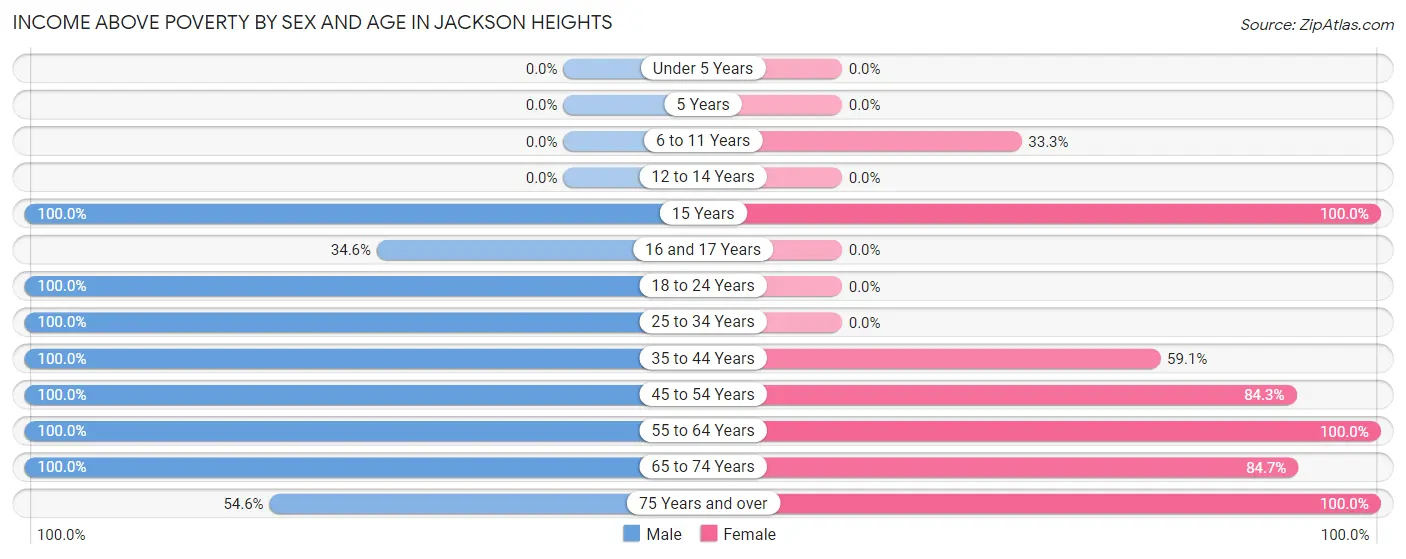
| Age Bracket | Male | Female |
| Under 5 Years | 0 (0.0%) | 0 (0.0%) |
| 5 Years | 0 (0.0%) | 0 (0.0%) |
| 6 to 11 Years | 0 (0.0%) | 8 (33.3%) |
| 12 to 14 Years | 0 (0.0%) | 0 (0.0%) |
| 15 Years | 57 (100.0%) | 10 (100.0%) |
| 16 and 17 Years | 18 (34.6%) | 0 (0.0%) |
| 18 to 24 Years | 9 (100.0%) | 0 (0.0%) |
| 25 to 34 Years | 24 (100.0%) | 0 (0.0%) |
| 35 to 44 Years | 29 (100.0%) | 13 (59.1%) |
| 45 to 54 Years | 95 (100.0%) | 70 (84.3%) |
| 55 to 64 Years | 123 (100.0%) | 120 (100.0%) |
| 65 to 74 Years | 49 (100.0%) | 72 (84.7%) |
| 75 Years and over | 18 (54.5%) | 50 (100.0%) |
| Total | 422 (87.0%) | 343 (84.9%) |
Income Below Poverty Among Married-Couple Families in Jackson Heights
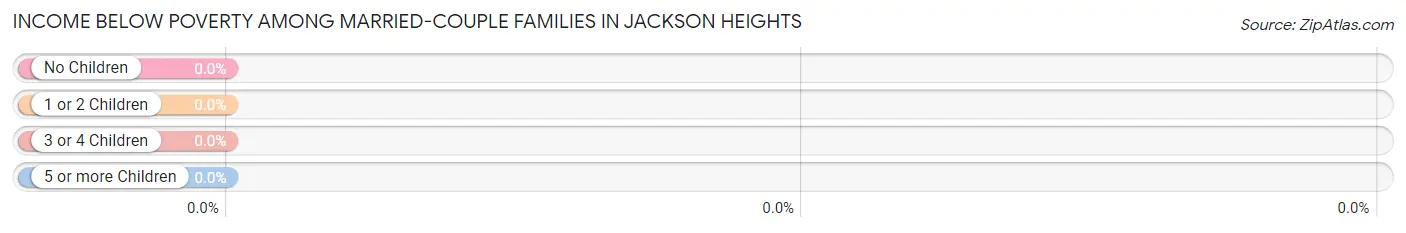
| Children | Above Poverty | Below Poverty |
| No Children | 172 (100.0%) | 0 (0.0%) |
| 1 or 2 Children | 47 (100.0%) | 0 (0.0%) |
| 3 or 4 Children | 0 (0.0%) | 0 (0.0%) |
| 5 or more Children | 0 (0.0%) | 0 (0.0%) |
| Total | 219 (100.0%) | 0 (0.0%) |
Income Below Poverty Among Single-Parent Households in Jackson Heights
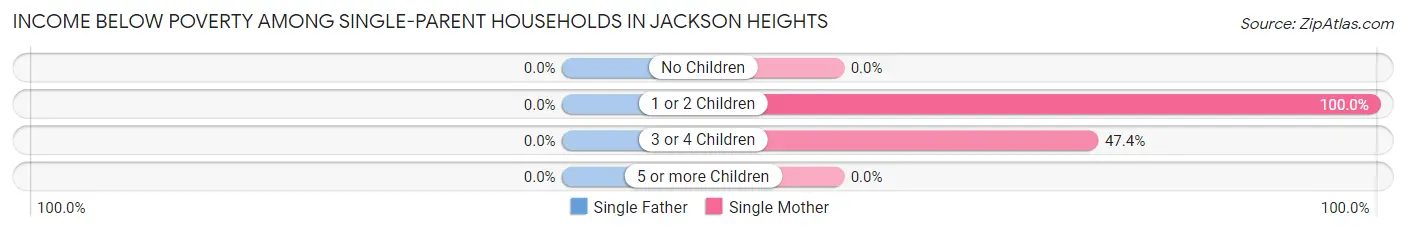
| Children | Single Father | Single Mother |
| No Children | 0 (0.0%) | 0 (0.0%) |
| 1 or 2 Children | 0 (0.0%) | 13 (100.0%) |
| 3 or 4 Children | 0 (0.0%) | 9 (47.4%) |
| 5 or more Children | 0 (0.0%) | 0 (0.0%) |
| Total | 0 (0.0%) | 22 (44.0%) |
Income Below Poverty Among Married-Couple vs Single-Parent Households in Jackson Heights
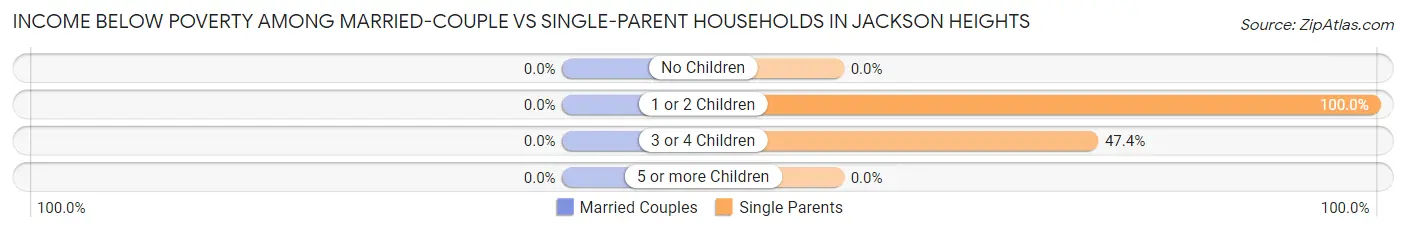
| Children | Married-Couple Families | Single-Parent Households |
| No Children | 0 (0.0%) | 0 (0.0%) |
| 1 or 2 Children | 0 (0.0%) | 13 (100.0%) |
| 3 or 4 Children | 0 (0.0%) | 9 (47.4%) |
| 5 or more Children | 0 (0.0%) | 0 (0.0%) |
| Total | 0 (0.0%) | 22 (34.4%) |
Employment Characteristics in Jackson Heights
Employment by Class of Employer in Jackson Heights
Among the 433 employed individuals in Jackson Heights, private company employees (348 | 80.4%), state government employees (70 | 16.2%), and self-employed (not incorporated) (9 | 2.1%) make up the most common classes of employment.
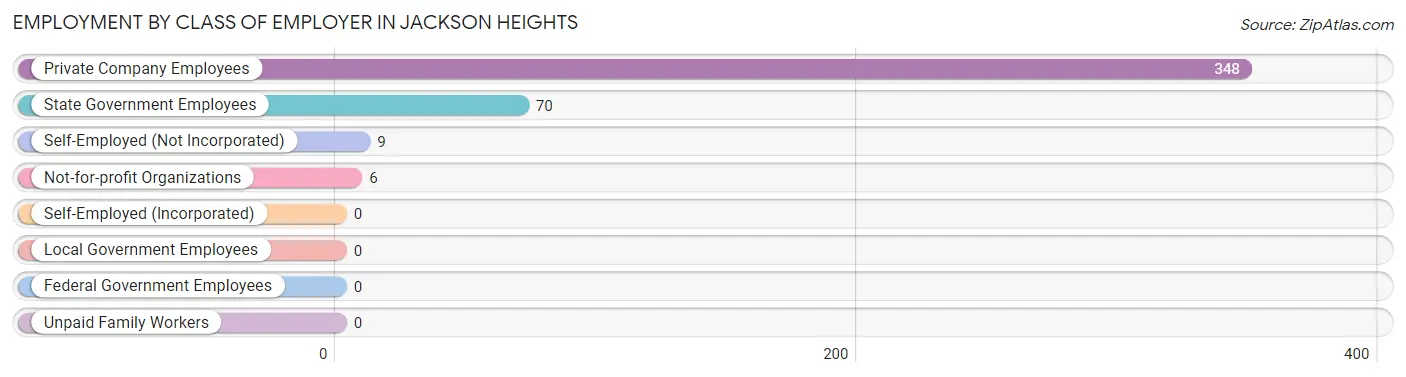
| Employer Class | # Employees | % Employees |
| Private Company Employees | 348 | 80.4% |
| Self-Employed (Incorporated) | 0 | 0.0% |
| Self-Employed (Not Incorporated) | 9 | 2.1% |
| Not-for-profit Organizations | 6 | 1.4% |
| Local Government Employees | 0 | 0.0% |
| State Government Employees | 70 | 16.2% |
| Federal Government Employees | 0 | 0.0% |
| Unpaid Family Workers | 0 | 0.0% |
| Total | 433 | 100.0% |
Employment Status by Age in Jackson Heights
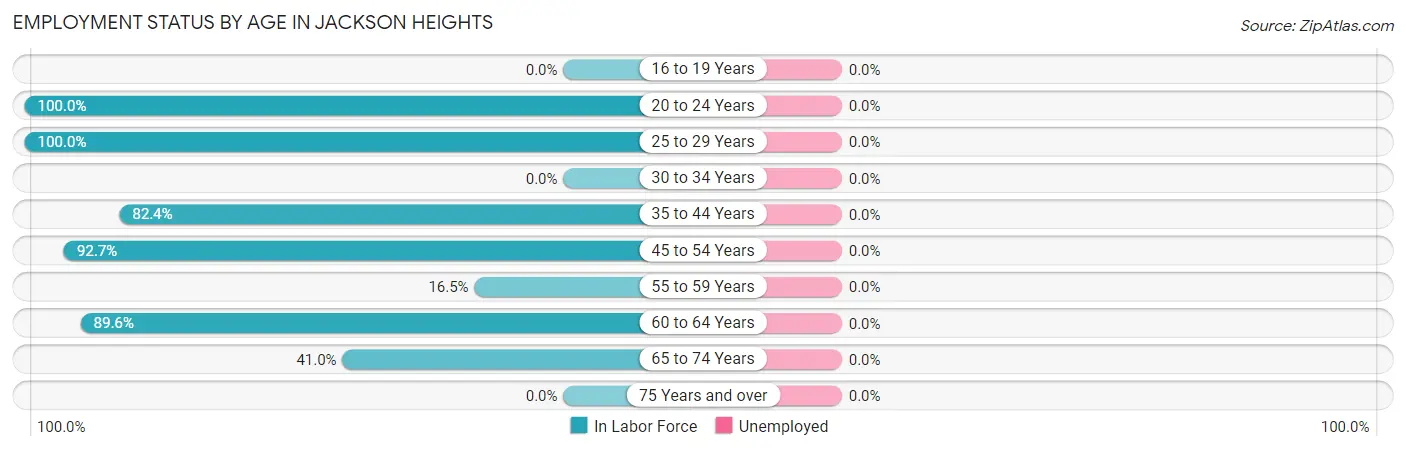
| Age Bracket | In Labor Force | Unemployed |
| 16 to 19 Years | 0 (0.0%) | 0 (0.0%) |
| 20 to 24 Years | 9 (100.0%) | 0 (0.0%) |
| 25 to 29 Years | 24 (100.0%) | 0 (0.0%) |
| 30 to 34 Years | 0 (0.0%) | 0 (0.0%) |
| 35 to 44 Years | 42 (82.4%) | 0 (0.0%) |
| 45 to 54 Years | 165 (92.7%) | 0 (0.0%) |
| 55 to 59 Years | 18 (16.5%) | 0 (0.0%) |
| 60 to 64 Years | 120 (89.6%) | 0 (0.0%) |
| 65 to 74 Years | 55 (41.0%) | 0 (0.0%) |
| 75 Years and over | 0 (0.0%) | 0 (0.0%) |
| Total | 433 (55.9%) | 0 (0.0%) |
Employment Status by Educational Attainment in Jackson Heights
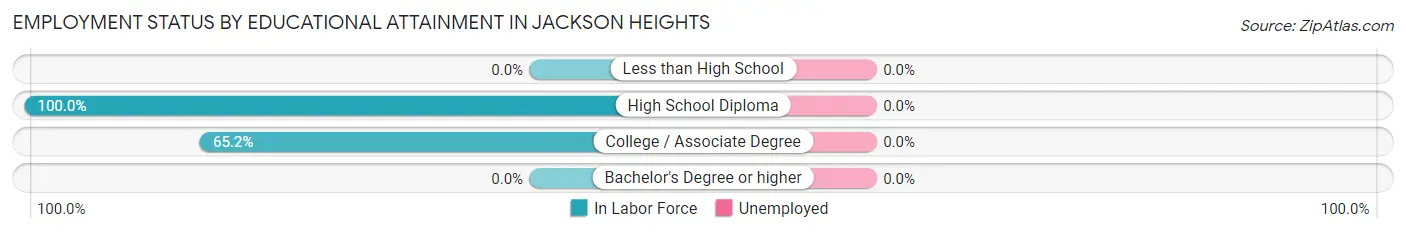
| Educational Attainment | In Labor Force | Unemployed |
| Less than High School | 0 (0.0%) | 0 (0.0%) |
| High School Diploma | 174 (100.0%) | 0 (0.0%) |
| College / Associate Degree | 195 (65.2%) | 0 (0.0%) |
| Bachelor's Degree or higher | 0 (0.0%) | 0 (0.0%) |
| Total | 369 (74.4%) | 0 (0.0%) |
Employment Occupations by Sex in Jackson Heights
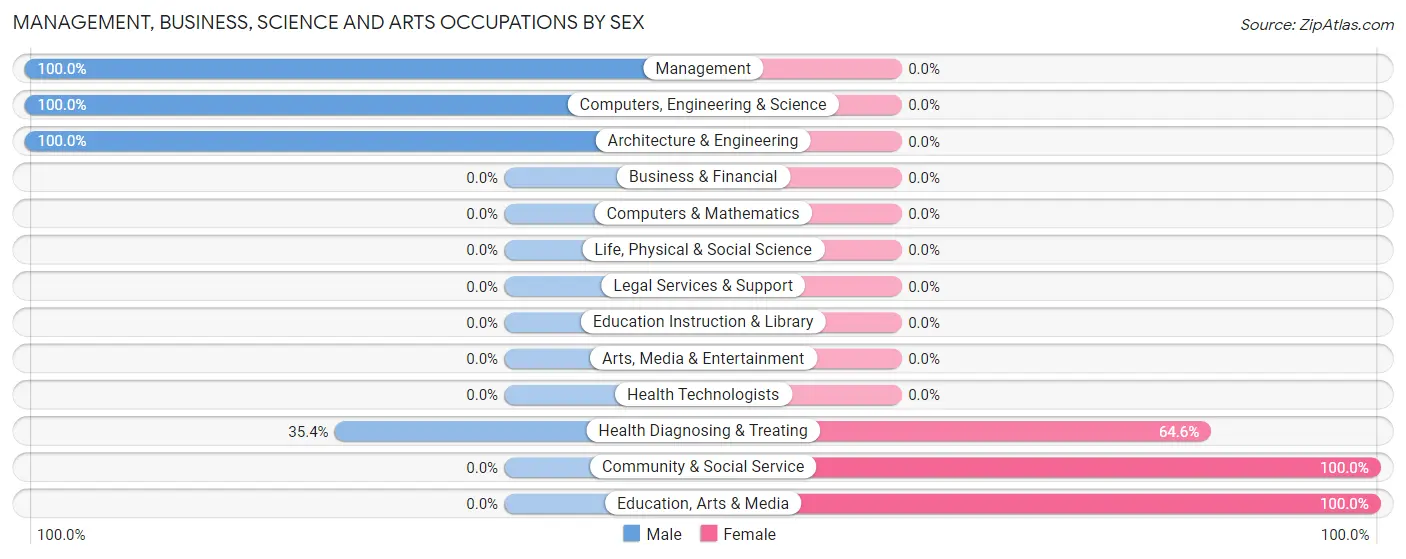
Management, Business, Science and Arts Occupations
The most common Management, Business, Science and Arts occupations in Jackson Heights are Health Diagnosing & Treating (82 | 18.9%), Community & Social Service (23 | 5.3%), Education, Arts & Media (23 | 5.3%), Computers, Engineering & Science (14 | 3.2%), and Architecture & Engineering (14 | 3.2%).
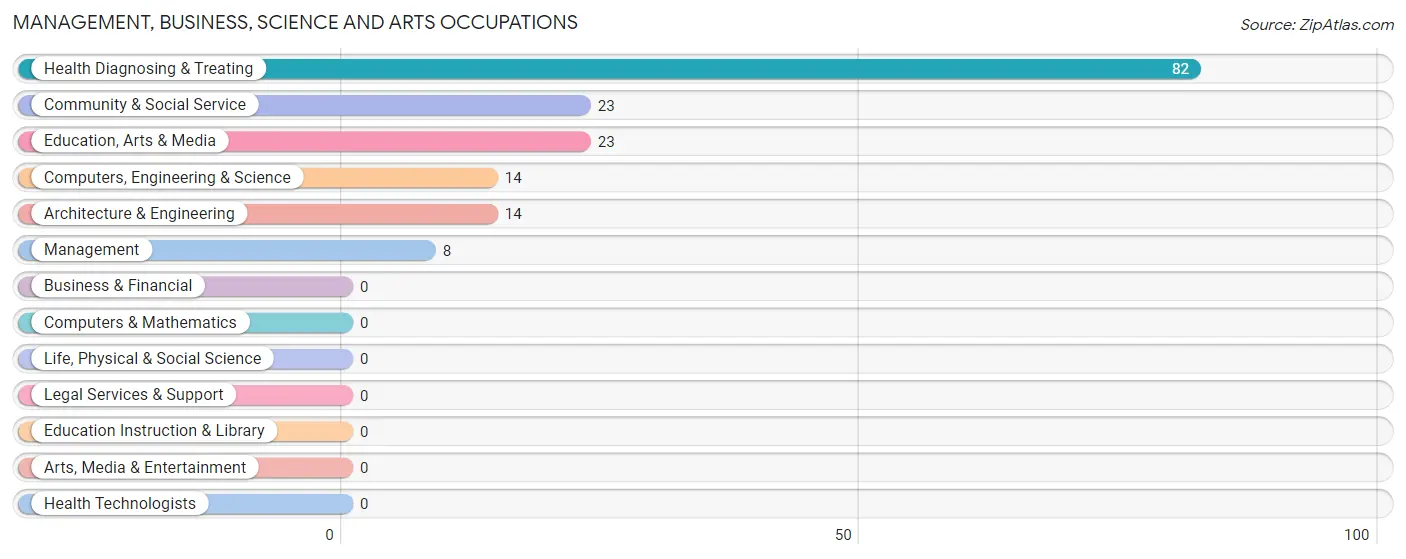
Management, Business, Science and Arts Occupations by Sex
Within the Management, Business, Science and Arts occupations in Jackson Heights, the most male-oriented occupations are Management (100.0%), Computers, Engineering & Science (100.0%), and Architecture & Engineering (100.0%), while the most female-oriented occupations are Community & Social Service (100.0%), Education, Arts & Media (100.0%), and Health Diagnosing & Treating (64.6%).
| Occupation | Male | Female |
| Management | 8 (100.0%) | 0 (0.0%) |
| Business & Financial | 0 (0.0%) | 0 (0.0%) |
| Computers, Engineering & Science | 14 (100.0%) | 0 (0.0%) |
| Computers & Mathematics | 0 (0.0%) | 0 (0.0%) |
| Architecture & Engineering | 14 (100.0%) | 0 (0.0%) |
| Life, Physical & Social Science | 0 (0.0%) | 0 (0.0%) |
| Community & Social Service | 0 (0.0%) | 23 (100.0%) |
| Education, Arts & Media | 0 (0.0%) | 23 (100.0%) |
| Legal Services & Support | 0 (0.0%) | 0 (0.0%) |
| Education Instruction & Library | 0 (0.0%) | 0 (0.0%) |
| Arts, Media & Entertainment | 0 (0.0%) | 0 (0.0%) |
| Health Diagnosing & Treating | 29 (35.4%) | 53 (64.6%) |
| Health Technologists | 0 (0.0%) | 0 (0.0%) |
| Total (Category) | 51 (40.2%) | 76 (59.8%) |
| Total (Overall) | 292 (67.4%) | 141 (32.6%) |
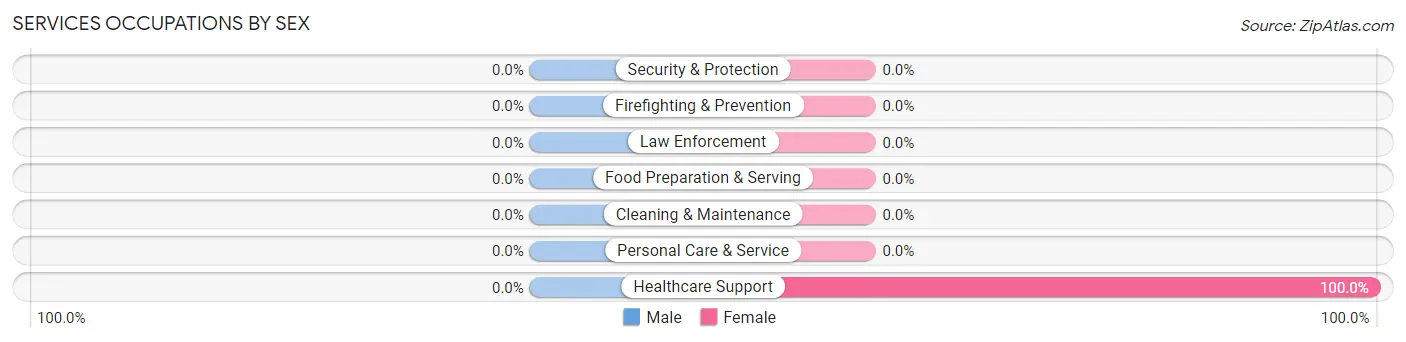
Services Occupations
The most common Services occupations in Jackson Heights are , and Healthcare Support (17 | 3.9%).
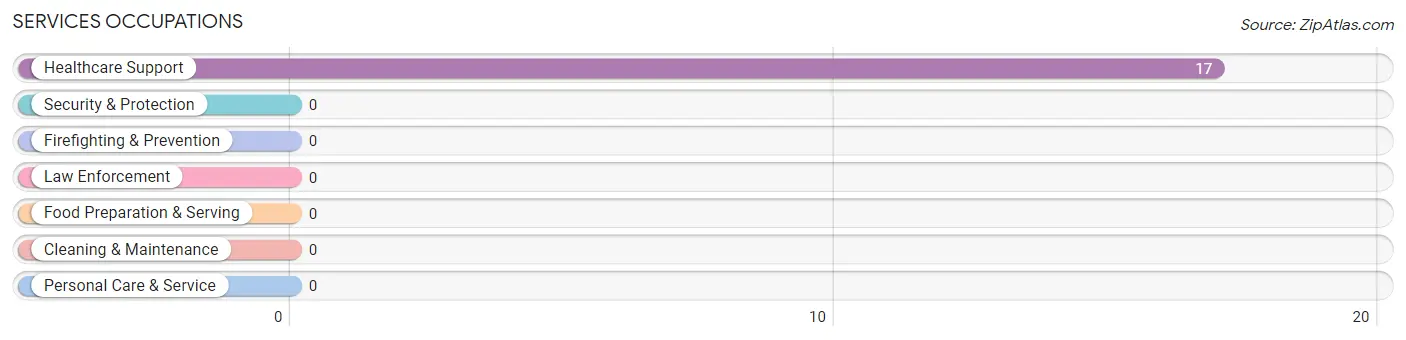
Services Occupations by Sex
| Occupation | Male | Female |
| Healthcare Support | 0 (0.0%) | 17 (100.0%) |
| Security & Protection | 0 (0.0%) | 0 (0.0%) |
| Firefighting & Prevention | 0 (0.0%) | 0 (0.0%) |
| Law Enforcement | 0 (0.0%) | 0 (0.0%) |
| Food Preparation & Serving | 0 (0.0%) | 0 (0.0%) |
| Cleaning & Maintenance | 0 (0.0%) | 0 (0.0%) |
| Personal Care & Service | 0 (0.0%) | 0 (0.0%) |
| Total (Category) | 0 (0.0%) | 17 (100.0%) |
| Total (Overall) | 292 (67.4%) | 141 (32.6%) |
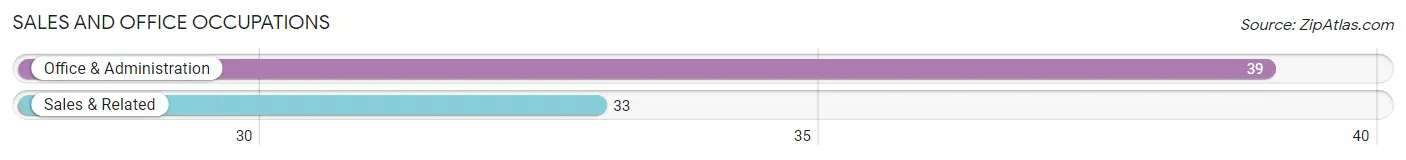
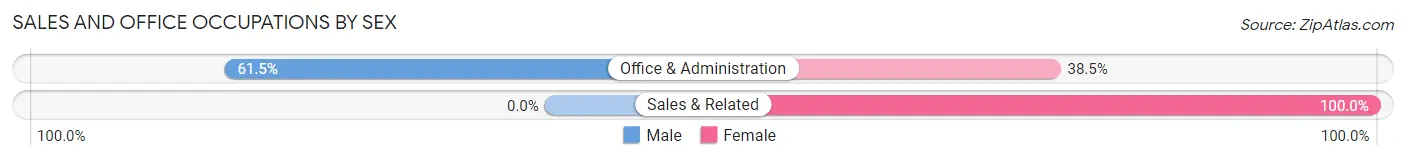
Sales and Office Occupations
The most common Sales and Office occupations in Jackson Heights are Office & Administration (39 | 9.0%), and Sales & Related (33 | 7.6%).
Sales and Office Occupations by Sex
| Occupation | Male | Female |
| Sales & Related | 0 (0.0%) | 33 (100.0%) |
| Office & Administration | 24 (61.5%) | 15 (38.5%) |
| Total (Category) | 24 (33.3%) | 48 (66.7%) |
| Total (Overall) | 292 (67.4%) | 141 (32.6%) |
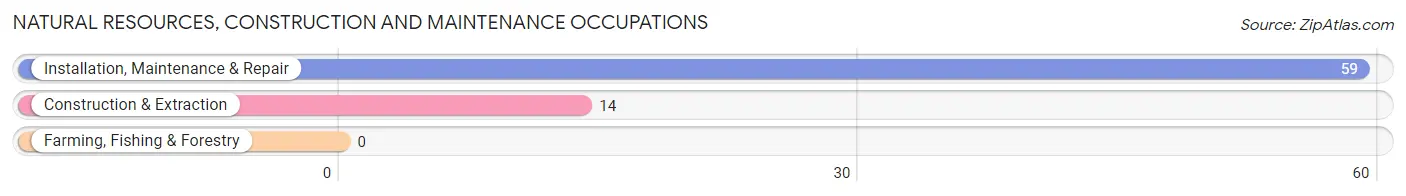
Natural Resources, Construction and Maintenance Occupations
The most common Natural Resources, Construction and Maintenance occupations in Jackson Heights are Installation, Maintenance & Repair (59 | 13.6%), and Construction & Extraction (14 | 3.2%).
Natural Resources, Construction and Maintenance Occupations by Sex
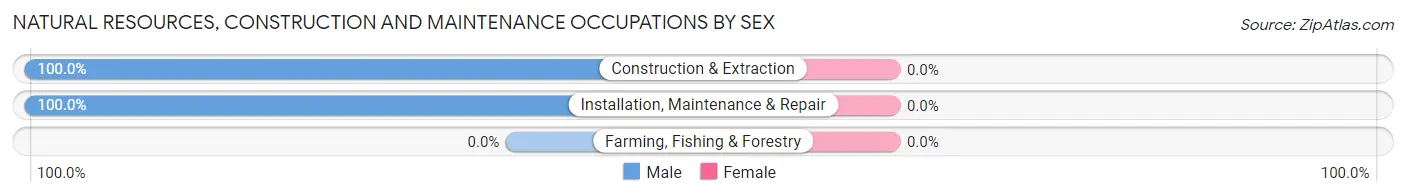
| Occupation | Male | Female |
| Farming, Fishing & Forestry | 0 (0.0%) | 0 (0.0%) |
| Construction & Extraction | 14 (100.0%) | 0 (0.0%) |
| Installation, Maintenance & Repair | 59 (100.0%) | 0 (0.0%) |
| Total (Category) | 73 (100.0%) | 0 (0.0%) |
| Total (Overall) | 292 (67.4%) | 141 (32.6%) |
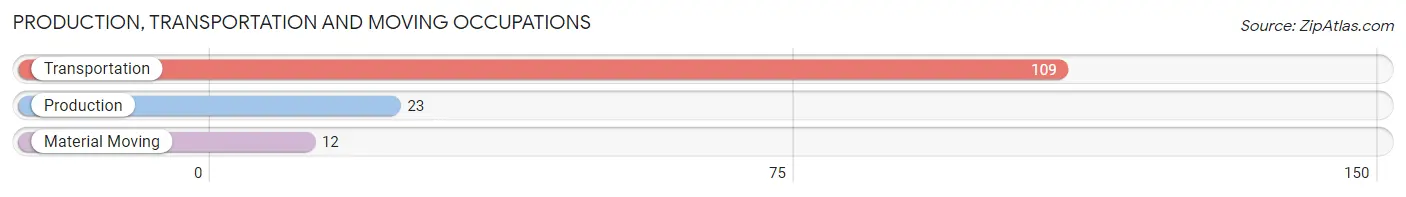
Production, Transportation and Moving Occupations
The most common Production, Transportation and Moving occupations in Jackson Heights are Transportation (109 | 25.2%), Production (23 | 5.3%), and Material Moving (12 | 2.8%).
Production, Transportation and Moving Occupations by Sex
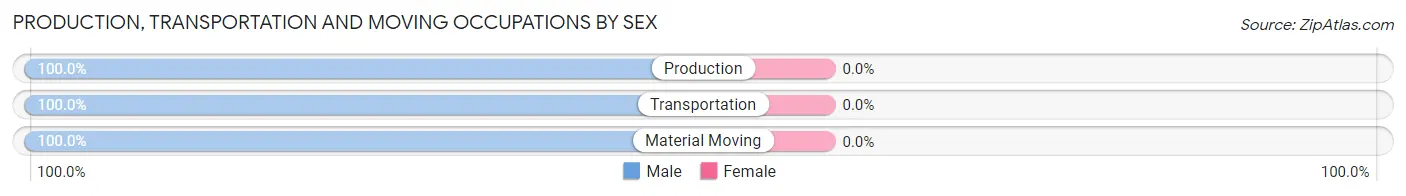
| Occupation | Male | Female |
| Production | 23 (100.0%) | 0 (0.0%) |
| Transportation | 109 (100.0%) | 0 (0.0%) |
| Material Moving | 12 (100.0%) | 0 (0.0%) |
| Total (Category) | 144 (100.0%) | 0 (0.0%) |
| Total (Overall) | 292 (67.4%) | 141 (32.6%) |
Employment Industries by Sex in Jackson Heights
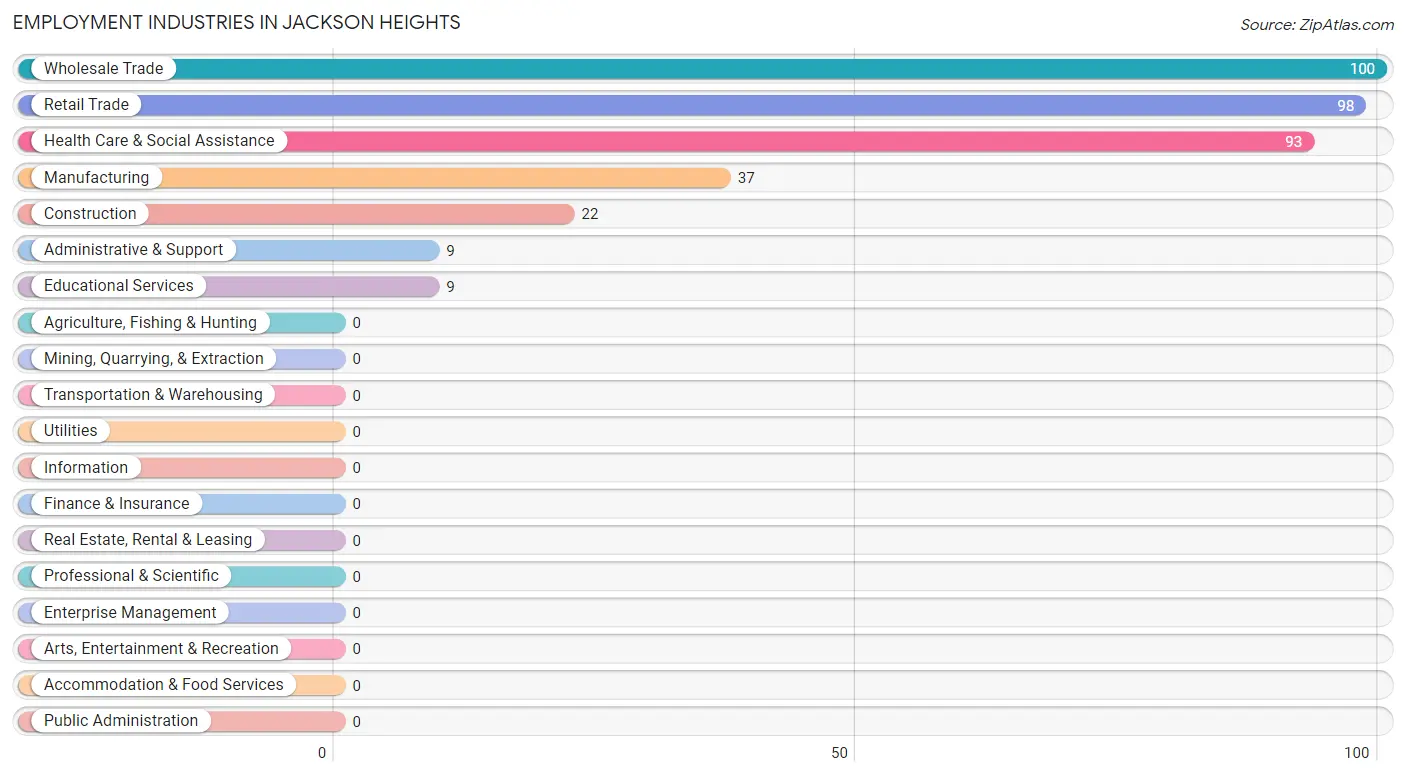
Employment Industries in Jackson Heights
The major employment industries in Jackson Heights include Wholesale Trade (100 | 23.1%), Retail Trade (98 | 22.6%), Health Care & Social Assistance (93 | 21.5%), Manufacturing (37 | 8.6%), and Construction (22 | 5.1%).
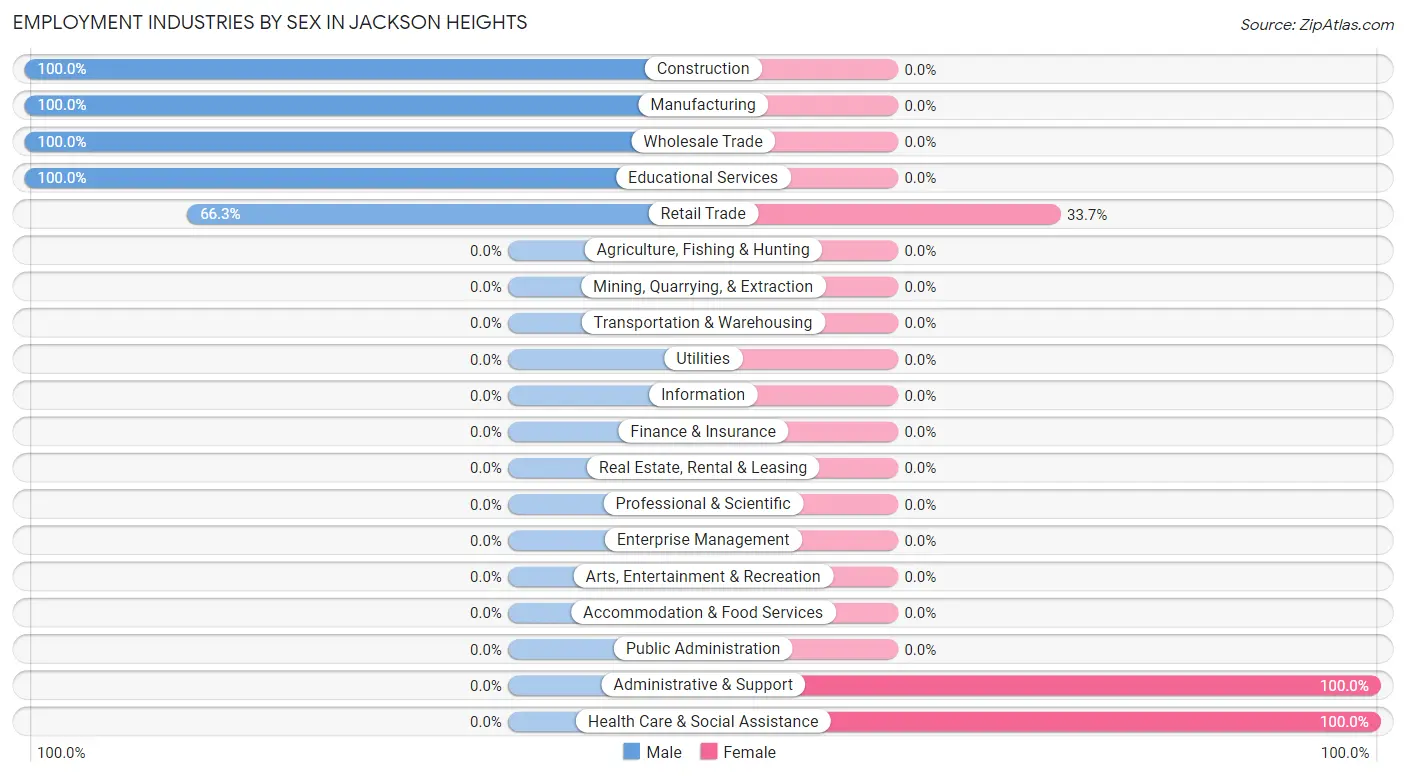
Employment Industries by Sex in Jackson Heights
The Jackson Heights industries that see more men than women are Construction (100.0%), Manufacturing (100.0%), and Wholesale Trade (100.0%), whereas the industries that tend to have a higher number of women are Administrative & Support (100.0%), Health Care & Social Assistance (100.0%), and Retail Trade (33.7%).
| Industry | Male | Female |
| Agriculture, Fishing & Hunting | 0 (0.0%) | 0 (0.0%) |
| Mining, Quarrying, & Extraction | 0 (0.0%) | 0 (0.0%) |
| Construction | 22 (100.0%) | 0 (0.0%) |
| Manufacturing | 37 (100.0%) | 0 (0.0%) |
| Wholesale Trade | 100 (100.0%) | 0 (0.0%) |
| Retail Trade | 65 (66.3%) | 33 (33.7%) |
| Transportation & Warehousing | 0 (0.0%) | 0 (0.0%) |
| Utilities | 0 (0.0%) | 0 (0.0%) |
| Information | 0 (0.0%) | 0 (0.0%) |
| Finance & Insurance | 0 (0.0%) | 0 (0.0%) |
| Real Estate, Rental & Leasing | 0 (0.0%) | 0 (0.0%) |
| Professional & Scientific | 0 (0.0%) | 0 (0.0%) |
| Enterprise Management | 0 (0.0%) | 0 (0.0%) |
| Administrative & Support | 0 (0.0%) | 9 (100.0%) |
| Educational Services | 9 (100.0%) | 0 (0.0%) |
| Health Care & Social Assistance | 0 (0.0%) | 93 (100.0%) |
| Arts, Entertainment & Recreation | 0 (0.0%) | 0 (0.0%) |
| Accommodation & Food Services | 0 (0.0%) | 0 (0.0%) |
| Public Administration | 0 (0.0%) | 0 (0.0%) |
| Total | 292 (67.4%) | 141 (32.6%) |
Education in Jackson Heights
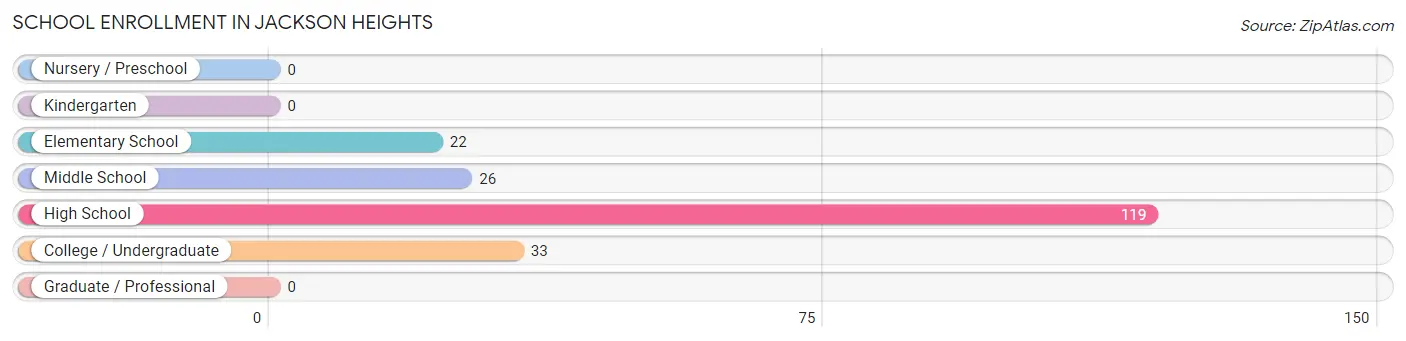
School Enrollment in Jackson Heights
The most common levels of schooling among the 200 students in Jackson Heights are high school (119 | 59.5%), college / undergraduate (33 | 16.5%), and middle school (26 | 13.0%).
| School Level | # Students | % Students |
| Nursery / Preschool | 0 | 0.0% |
| Kindergarten | 0 | 0.0% |
| Elementary School | 22 | 11.0% |
| Middle School | 26 | 13.0% |
| High School | 119 | 59.5% |
| College / Undergraduate | 33 | 16.5% |
| Graduate / Professional | 0 | 0.0% |
| Total | 200 | 100.0% |
School Enrollment by Age by Funding Source in Jackson Heights
Out of a total of 200 students who are enrolled in schools in Jackson Heights, 42 (21.0%) attend a private institution, while the remaining 158 (79.0%) are enrolled in public schools. The age group of 10 to 14 year olds has the highest likelihood of being enrolled in private schools, with 24 (60.0% in the age bracket) enrolled. Conversely, the age group of 5 to 9 year old has the lowest likelihood of being enrolled in a private school, with 8 (100.0% in the age bracket) attending a public institution.
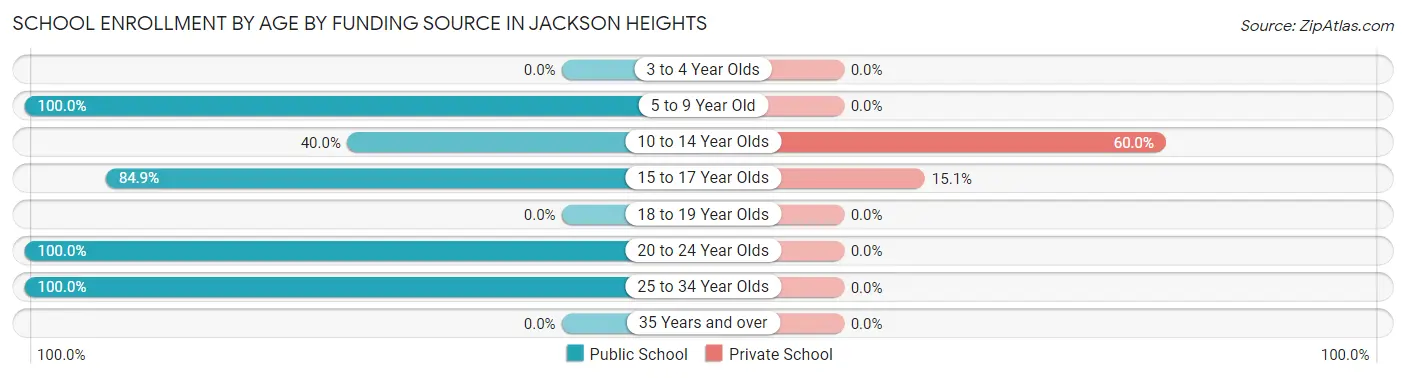
| Age Bracket | Public School | Private School |
| 3 to 4 Year Olds | 0 (0.0%) | 0 (0.0%) |
| 5 to 9 Year Old | 8 (100.0%) | 0 (0.0%) |
| 10 to 14 Year Olds | 16 (40.0%) | 24 (60.0%) |
| 15 to 17 Year Olds | 101 (84.9%) | 18 (15.1%) |
| 18 to 19 Year Olds | 0 (0.0%) | 0 (0.0%) |
| 20 to 24 Year Olds | 9 (100.0%) | 0 (0.0%) |
| 25 to 34 Year Olds | 24 (100.0%) | 0 (0.0%) |
| 35 Years and over | 0 (0.0%) | 0 (0.0%) |
| Total | 158 (79.0%) | 42 (21.0%) |
Educational Attainment by Field of Study in Jackson Heights
| Field of Study | # Graduates | % Graduates |
| Computers & Mathematics | 0 | 0.0% |
| Bio, Nature & Agricultural | 0 | 0.0% |
| Physical & Health Sciences | 0 | 0.0% |
| Psychology | 0 | 0.0% |
| Social Sciences | 0 | 0.0% |
| Engineering | 0 | 0.0% |
| Multidisciplinary Studies | 0 | 0.0% |
| Science & Technology | 0 | 0.0% |
| Business | 0 | 0.0% |
| Education | 0 | 0.0% |
| Literature & Languages | 0 | 0.0% |
| Liberal Arts & History | 0 | 0.0% |
| Visual & Performing Arts | 0 | 0.0% |
| Communications | 0 | 0.0% |
| Arts & Humanities | 0 | 0.0% |
| Total | 0 | 0.0% |
Transportation & Commute in Jackson Heights
Vehicle Availability by Sex in Jackson Heights
The most prevalent vehicle ownership categories in Jackson Heights are males with 2 vehicles (221, accounting for 75.7%) and females with 2 vehicles (96, making up 156.7%).
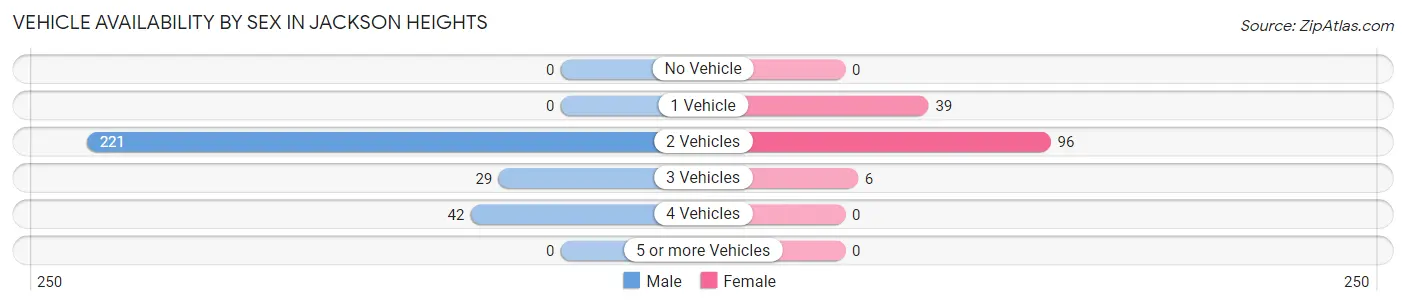
| Vehicles Available | Male | Female |
| No Vehicle | 0 (0.0%) | 0 (0.0%) |
| 1 Vehicle | 0 (0.0%) | 39 (27.7%) |
| 2 Vehicles | 221 (75.7%) | 96 (68.1%) |
| 3 Vehicles | 29 (9.9%) | 6 (4.3%) |
| 4 Vehicles | 42 (14.4%) | 0 (0.0%) |
| 5 or more Vehicles | 0 (0.0%) | 0 (0.0%) |
| Total | 292 (100.0%) | 141 (100.0%) |
Commute Time in Jackson Heights
The most frequently occuring commute durations in Jackson Heights are 25 to 29 minutes (124 commuters, 29.2%), 15 to 19 minutes (119 commuters, 28.1%), and 10 to 14 minutes (79 commuters, 18.6%).
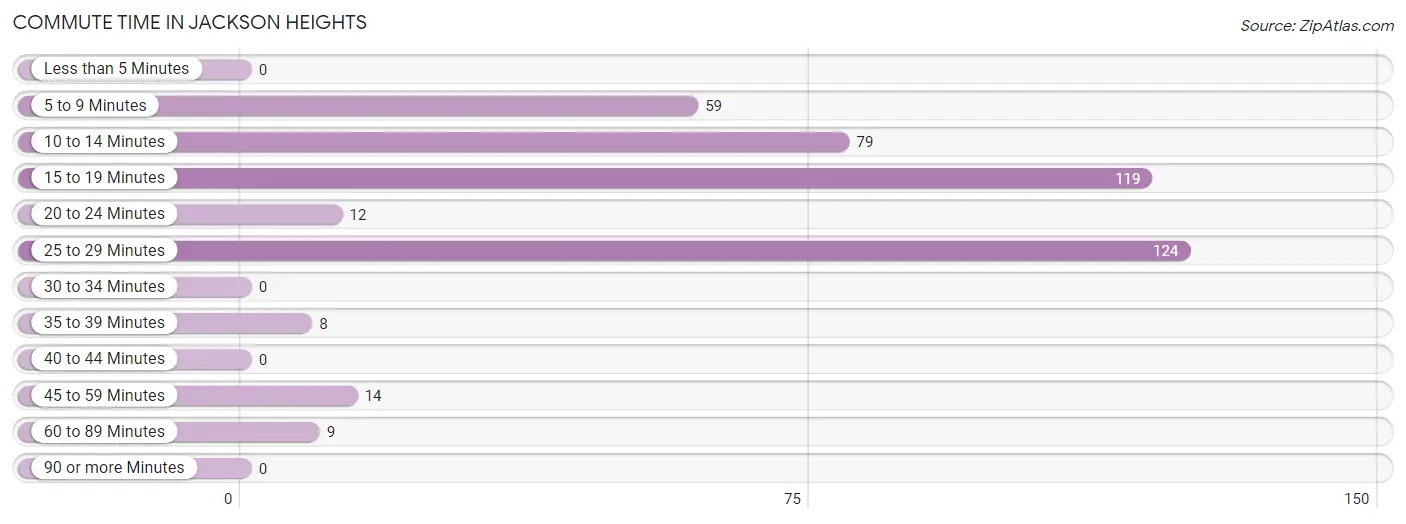
| Commute Time | # Commuters | % Commuters |
| Less than 5 Minutes | 0 | 0.0% |
| 5 to 9 Minutes | 59 | 13.9% |
| 10 to 14 Minutes | 79 | 18.6% |
| 15 to 19 Minutes | 119 | 28.1% |
| 20 to 24 Minutes | 12 | 2.8% |
| 25 to 29 Minutes | 124 | 29.2% |
| 30 to 34 Minutes | 0 | 0.0% |
| 35 to 39 Minutes | 8 | 1.9% |
| 40 to 44 Minutes | 0 | 0.0% |
| 45 to 59 Minutes | 14 | 3.3% |
| 60 to 89 Minutes | 9 | 2.1% |
| 90 or more Minutes | 0 | 0.0% |
Commute Time by Sex in Jackson Heights
The most common commute times in Jackson Heights are 25 to 29 minutes (124 commuters, 42.5%) for males and 10 to 14 minutes (70 commuters, 53.0%) for females.
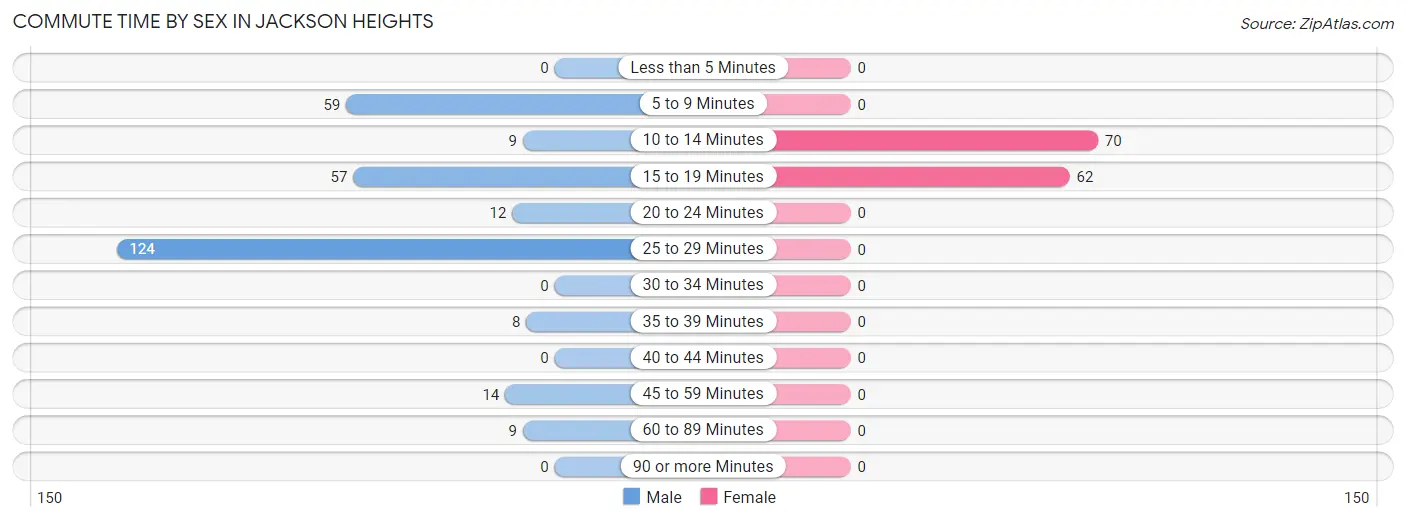
| Commute Time | Male | Female |
| Less than 5 Minutes | 0 (0.0%) | 0 (0.0%) |
| 5 to 9 Minutes | 59 (20.2%) | 0 (0.0%) |
| 10 to 14 Minutes | 9 (3.1%) | 70 (53.0%) |
| 15 to 19 Minutes | 57 (19.5%) | 62 (47.0%) |
| 20 to 24 Minutes | 12 (4.1%) | 0 (0.0%) |
| 25 to 29 Minutes | 124 (42.5%) | 0 (0.0%) |
| 30 to 34 Minutes | 0 (0.0%) | 0 (0.0%) |
| 35 to 39 Minutes | 8 (2.7%) | 0 (0.0%) |
| 40 to 44 Minutes | 0 (0.0%) | 0 (0.0%) |
| 45 to 59 Minutes | 14 (4.8%) | 0 (0.0%) |
| 60 to 89 Minutes | 9 (3.1%) | 0 (0.0%) |
| 90 or more Minutes | 0 (0.0%) | 0 (0.0%) |
Time of Departure to Work by Sex in Jackson Heights
The most frequent times of departure to work in Jackson Heights are 7:00 AM to 7:29 AM (171, 58.6%) for males and 5:00 AM to 5:29 AM (47, 35.6%) for females.
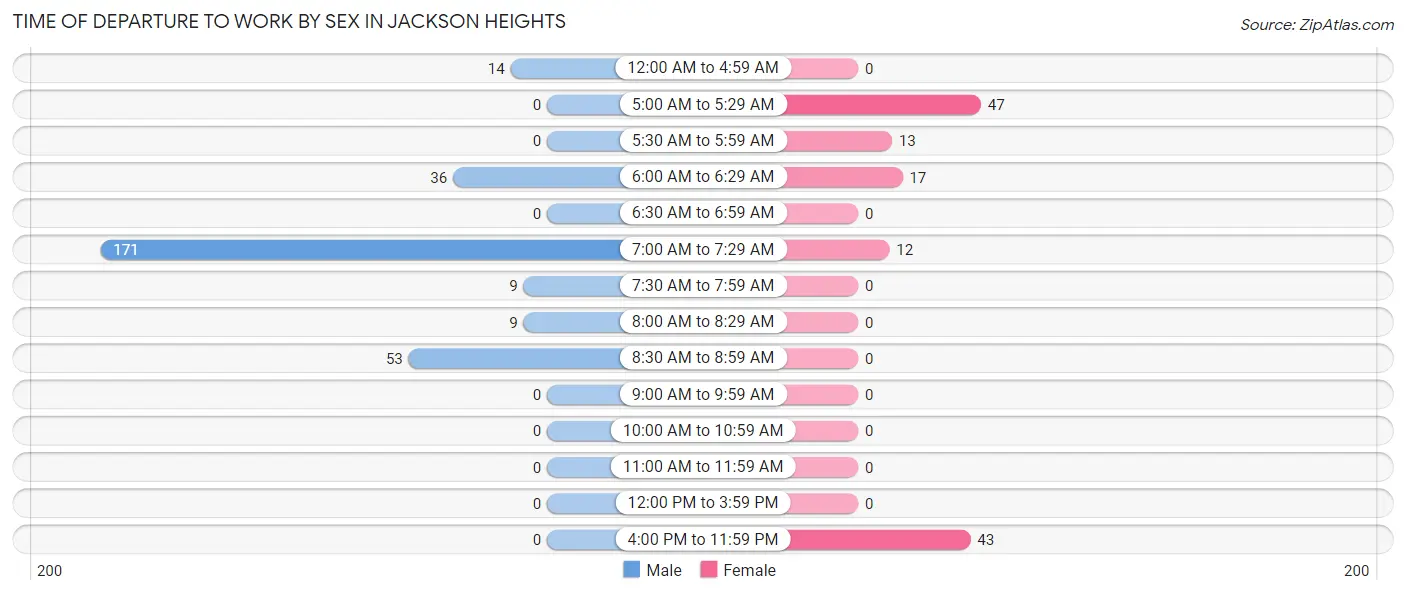
| Time of Departure | Male | Female |
| 12:00 AM to 4:59 AM | 14 (4.8%) | 0 (0.0%) |
| 5:00 AM to 5:29 AM | 0 (0.0%) | 47 (35.6%) |
| 5:30 AM to 5:59 AM | 0 (0.0%) | 13 (9.9%) |
| 6:00 AM to 6:29 AM | 36 (12.3%) | 17 (12.9%) |
| 6:30 AM to 6:59 AM | 0 (0.0%) | 0 (0.0%) |
| 7:00 AM to 7:29 AM | 171 (58.6%) | 12 (9.1%) |
| 7:30 AM to 7:59 AM | 9 (3.1%) | 0 (0.0%) |
| 8:00 AM to 8:29 AM | 9 (3.1%) | 0 (0.0%) |
| 8:30 AM to 8:59 AM | 53 (18.1%) | 0 (0.0%) |
| 9:00 AM to 9:59 AM | 0 (0.0%) | 0 (0.0%) |
| 10:00 AM to 10:59 AM | 0 (0.0%) | 0 (0.0%) |
| 11:00 AM to 11:59 AM | 0 (0.0%) | 0 (0.0%) |
| 12:00 PM to 3:59 PM | 0 (0.0%) | 0 (0.0%) |
| 4:00 PM to 11:59 PM | 0 (0.0%) | 43 (32.6%) |
| Total | 292 (100.0%) | 132 (100.0%) |
Housing Occupancy in Jackson Heights
Occupancy by Ownership in Jackson Heights
Of the total 372 dwellings in Jackson Heights, owner-occupied units account for 286 (76.9%), while renter-occupied units make up 86 (23.1%).
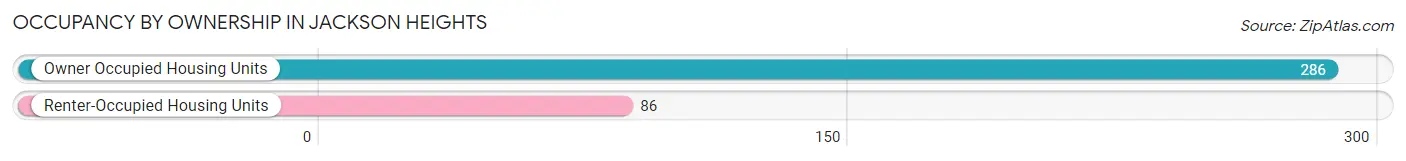
| Occupancy | # Housing Units | % Housing Units |
| Owner Occupied Housing Units | 286 | 76.9% |
| Renter-Occupied Housing Units | 86 | 23.1% |
| Total Occupied Housing Units | 372 | 100.0% |
Occupancy by Household Size in Jackson Heights
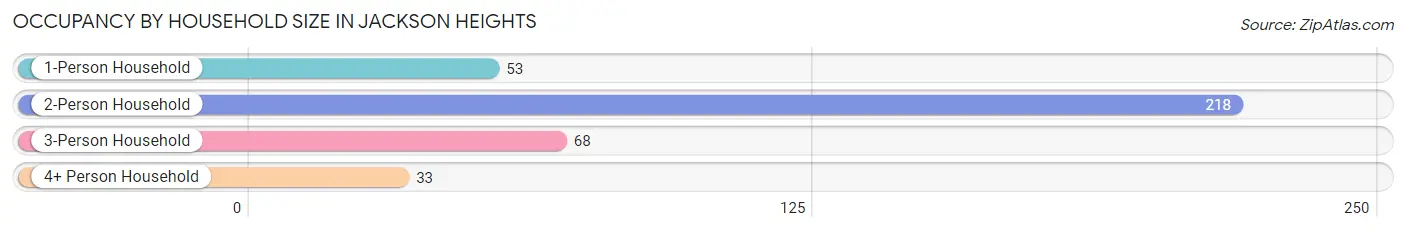
| Household Size | # Housing Units | % Housing Units |
| 1-Person Household | 53 | 14.2% |
| 2-Person Household | 218 | 58.6% |
| 3-Person Household | 68 | 18.3% |
| 4+ Person Household | 33 | 8.9% |
| Total Housing Units | 372 | 100.0% |
Occupancy by Ownership by Household Size in Jackson Heights
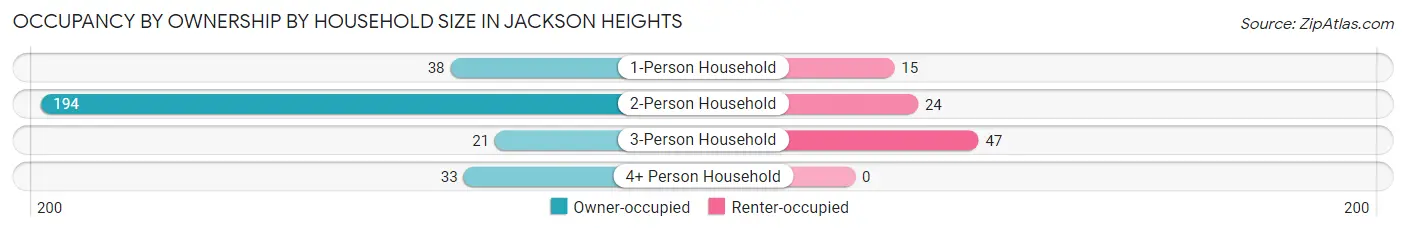
| Household Size | Owner-occupied | Renter-occupied |
| 1-Person Household | 38 (71.7%) | 15 (28.3%) |
| 2-Person Household | 194 (89.0%) | 24 (11.0%) |
| 3-Person Household | 21 (30.9%) | 47 (69.1%) |
| 4+ Person Household | 33 (100.0%) | 0 (0.0%) |
| Total Housing Units | 286 (76.9%) | 86 (23.1%) |
Occupancy by Educational Attainment in Jackson Heights
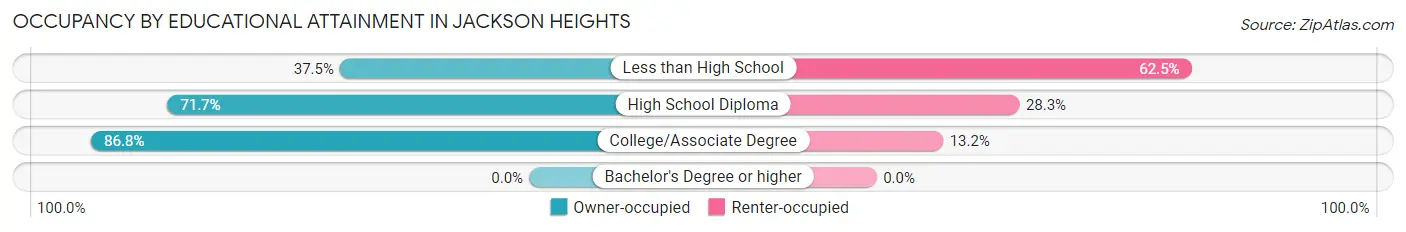
| Household Size | Owner-occupied | Renter-occupied |
| Less than High School | 9 (37.5%) | 15 (62.5%) |
| High School Diploma | 119 (71.7%) | 47 (28.3%) |
| College/Associate Degree | 158 (86.8%) | 24 (13.2%) |
| Bachelor's Degree or higher | 0 (0.0%) | 0 (0.0%) |
Occupancy by Age of Householder in Jackson Heights
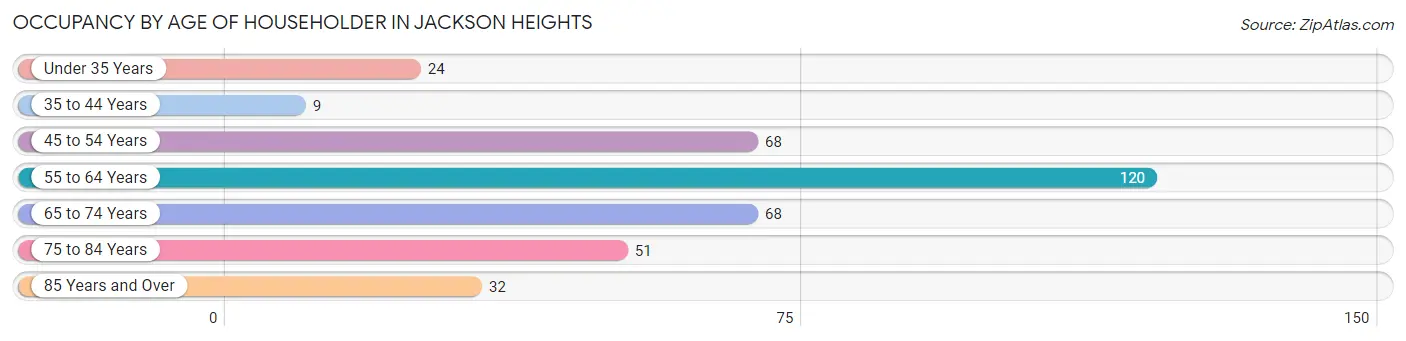
| Age Bracket | # Households | % Households |
| Under 35 Years | 24 | 6.5% |
| 35 to 44 Years | 9 | 2.4% |
| 45 to 54 Years | 68 | 18.3% |
| 55 to 64 Years | 120 | 32.3% |
| 65 to 74 Years | 68 | 18.3% |
| 75 to 84 Years | 51 | 13.7% |
| 85 Years and Over | 32 | 8.6% |
| Total | 372 | 100.0% |
Housing Finances in Jackson Heights
Median Income by Occupancy in Jackson Heights
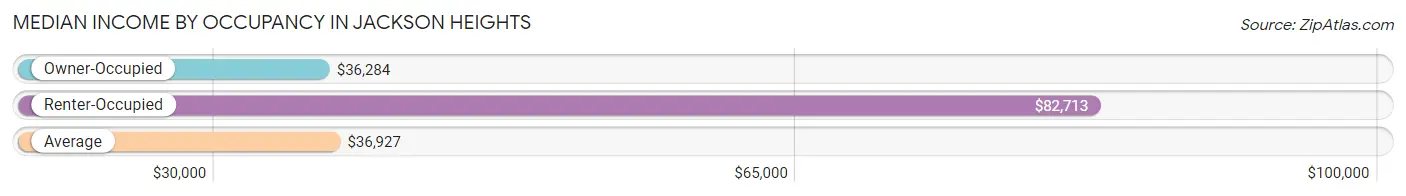
| Occupancy Type | # Households | Median Income |
| Owner-Occupied | 286 (76.9%) | $36,284 |
| Renter-Occupied | 86 (23.1%) | $82,713 |
| Average | 372 (100.0%) | $36,927 |
Occupancy by Householder Income Bracket in Jackson Heights
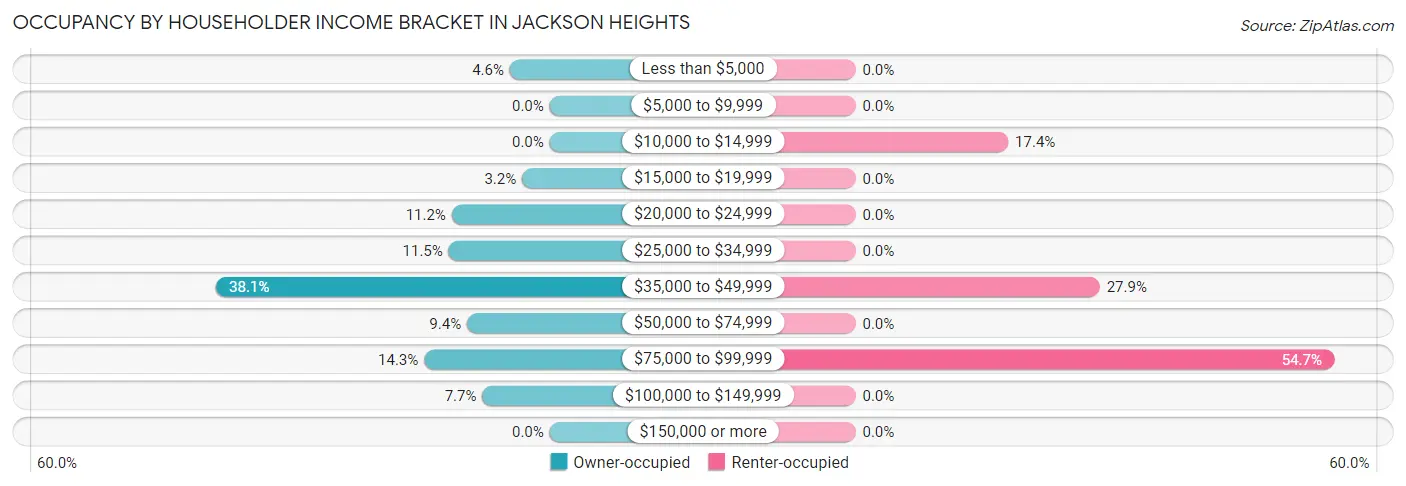
| Income Bracket | Owner-occupied | Renter-occupied |
| Less than $5,000 | 13 (4.5%) | 0 (0.0%) |
| $5,000 to $9,999 | 0 (0.0%) | 0 (0.0%) |
| $10,000 to $14,999 | 0 (0.0%) | 15 (17.4%) |
| $15,000 to $19,999 | 9 (3.2%) | 0 (0.0%) |
| $20,000 to $24,999 | 32 (11.2%) | 0 (0.0%) |
| $25,000 to $34,999 | 33 (11.5%) | 0 (0.0%) |
| $35,000 to $49,999 | 109 (38.1%) | 24 (27.9%) |
| $50,000 to $74,999 | 27 (9.4%) | 0 (0.0%) |
| $75,000 to $99,999 | 41 (14.3%) | 47 (54.6%) |
| $100,000 to $149,999 | 22 (7.7%) | 0 (0.0%) |
| $150,000 or more | 0 (0.0%) | 0 (0.0%) |
| Total | 286 (100.0%) | 86 (100.0%) |
Monthly Housing Cost Tiers in Jackson Heights
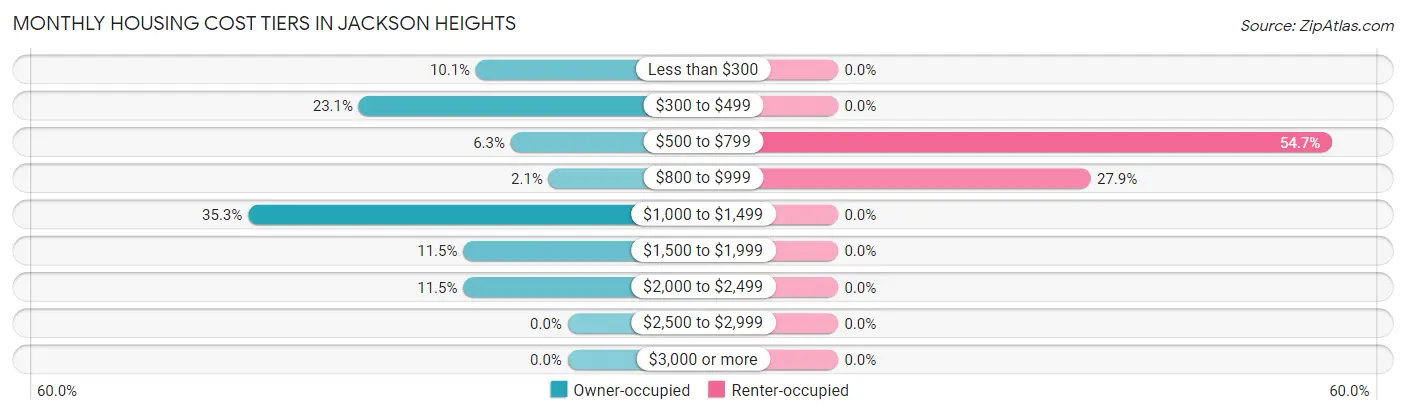
| Monthly Cost | Owner-occupied | Renter-occupied |
| Less than $300 | 29 (10.1%) | 0 (0.0%) |
| $300 to $499 | 66 (23.1%) | 0 (0.0%) |
| $500 to $799 | 18 (6.3%) | 47 (54.6%) |
| $800 to $999 | 6 (2.1%) | 24 (27.9%) |
| $1,000 to $1,499 | 101 (35.3%) | 0 (0.0%) |
| $1,500 to $1,999 | 33 (11.5%) | 0 (0.0%) |
| $2,000 to $2,499 | 33 (11.5%) | 0 (0.0%) |
| $2,500 to $2,999 | 0 (0.0%) | 0 (0.0%) |
| $3,000 or more | 0 (0.0%) | 0 (0.0%) |
| Total | 286 (100.0%) | 86 (100.0%) |
Physical Housing Characteristics in Jackson Heights
Housing Structures in Jackson Heights
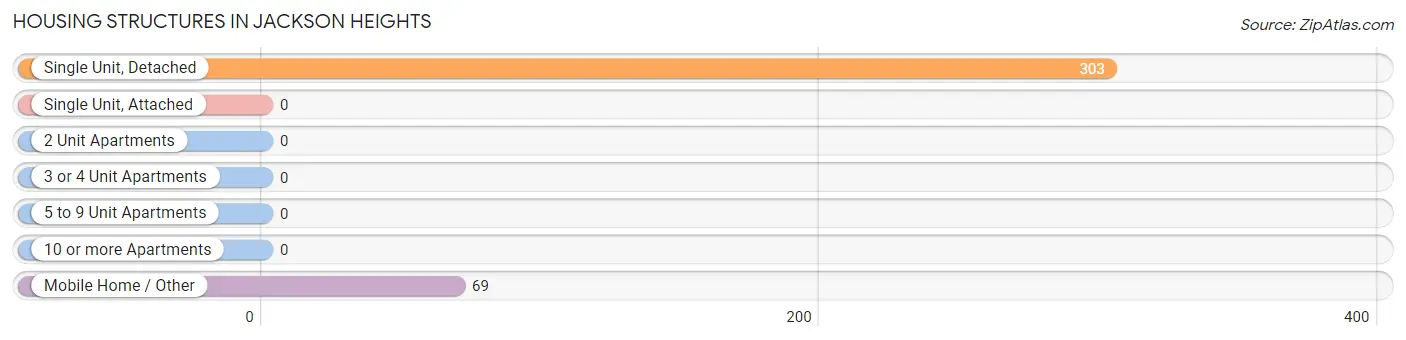
| Structure Type | # Housing Units | % Housing Units |
| Single Unit, Detached | 303 | 81.5% |
| Single Unit, Attached | 0 | 0.0% |
| 2 Unit Apartments | 0 | 0.0% |
| 3 or 4 Unit Apartments | 0 | 0.0% |
| 5 to 9 Unit Apartments | 0 | 0.0% |
| 10 or more Apartments | 0 | 0.0% |
| Mobile Home / Other | 69 | 18.5% |
| Total | 372 | 100.0% |
Housing Structures by Occupancy in Jackson Heights
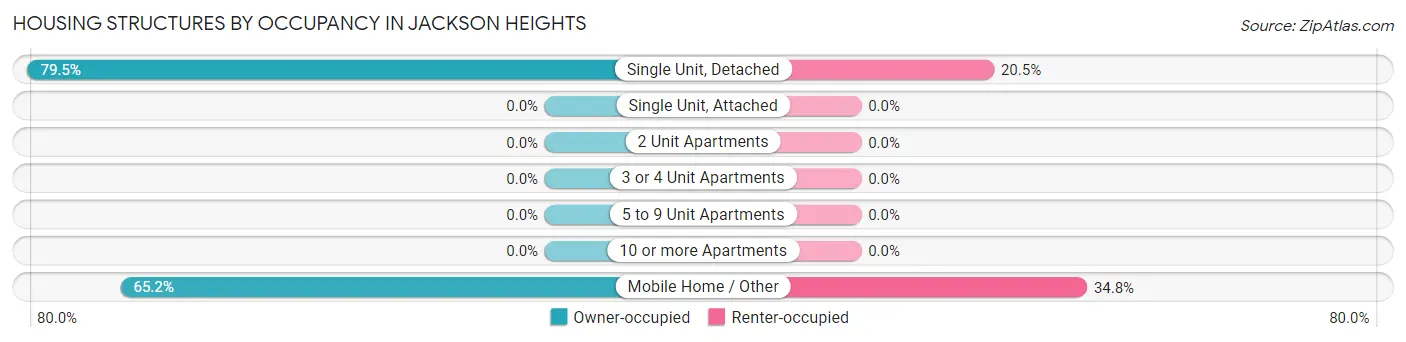
| Structure Type | Owner-occupied | Renter-occupied |
| Single Unit, Detached | 241 (79.5%) | 62 (20.5%) |
| Single Unit, Attached | 0 (0.0%) | 0 (0.0%) |
| 2 Unit Apartments | 0 (0.0%) | 0 (0.0%) |
| 3 or 4 Unit Apartments | 0 (0.0%) | 0 (0.0%) |
| 5 to 9 Unit Apartments | 0 (0.0%) | 0 (0.0%) |
| 10 or more Apartments | 0 (0.0%) | 0 (0.0%) |
| Mobile Home / Other | 45 (65.2%) | 24 (34.8%) |
| Total | 286 (76.9%) | 86 (23.1%) |
Housing Structures by Number of Rooms in Jackson Heights
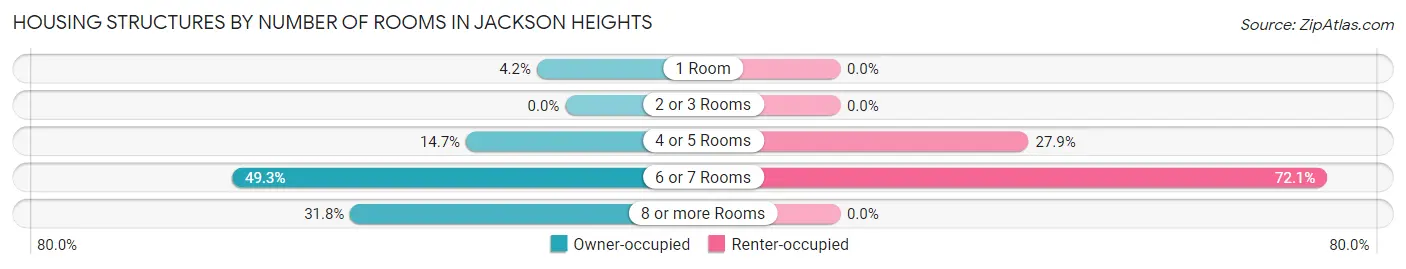
| Number of Rooms | Owner-occupied | Renter-occupied |
| 1 Room | 12 (4.2%) | 0 (0.0%) |
| 2 or 3 Rooms | 0 (0.0%) | 0 (0.0%) |
| 4 or 5 Rooms | 42 (14.7%) | 24 (27.9%) |
| 6 or 7 Rooms | 141 (49.3%) | 62 (72.1%) |
| 8 or more Rooms | 91 (31.8%) | 0 (0.0%) |
| Total | 286 (100.0%) | 86 (100.0%) |
Housing Structure by Heating Type in Jackson Heights
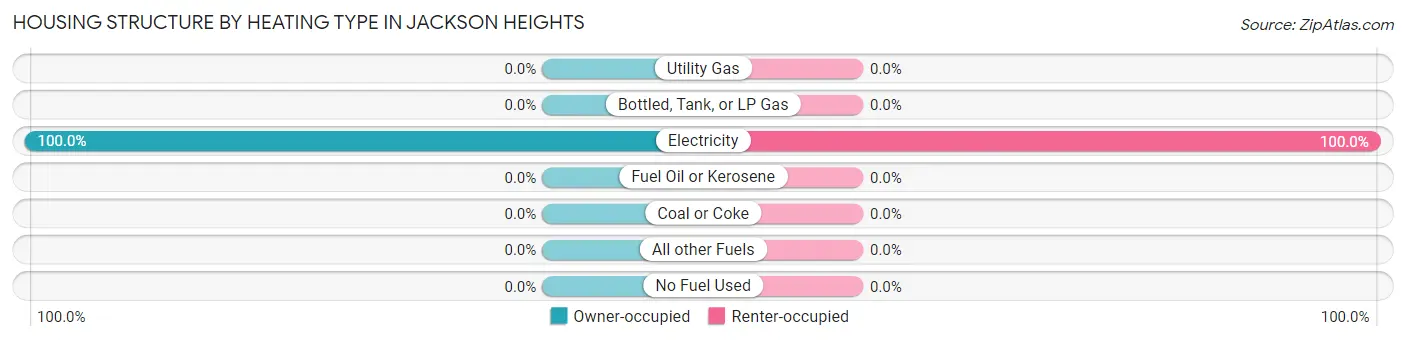
| Heating Type | Owner-occupied | Renter-occupied |
| Utility Gas | 0 (0.0%) | 0 (0.0%) |
| Bottled, Tank, or LP Gas | 0 (0.0%) | 0 (0.0%) |
| Electricity | 286 (100.0%) | 86 (100.0%) |
| Fuel Oil or Kerosene | 0 (0.0%) | 0 (0.0%) |
| Coal or Coke | 0 (0.0%) | 0 (0.0%) |
| All other Fuels | 0 (0.0%) | 0 (0.0%) |
| No Fuel Used | 0 (0.0%) | 0 (0.0%) |
| Total | 286 (100.0%) | 86 (100.0%) |
Household Vehicle Usage in Jackson Heights
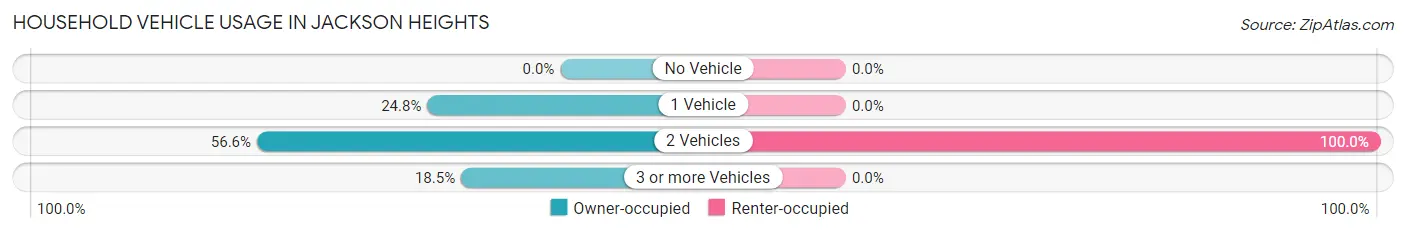
| Vehicles per Household | Owner-occupied | Renter-occupied |
| No Vehicle | 0 (0.0%) | 0 (0.0%) |
| 1 Vehicle | 71 (24.8%) | 0 (0.0%) |
| 2 Vehicles | 162 (56.6%) | 86 (100.0%) |
| 3 or more Vehicles | 53 (18.5%) | 0 (0.0%) |
| Total | 286 (100.0%) | 86 (100.0%) |
Real Estate & Mortgages in Jackson Heights
Real Estate and Mortgage Overview in Jackson Heights
| Characteristic | Without Mortgage | With Mortgage |
| Housing Units | 113 | 173 |
| Median Property Value | $80,600 | $140,400 |
| Median Household Income | - | - |
| Monthly Housing Costs | $367 | $0 |
| Real Estate Taxes | - | - |
Property Value by Mortgage Status in Jackson Heights
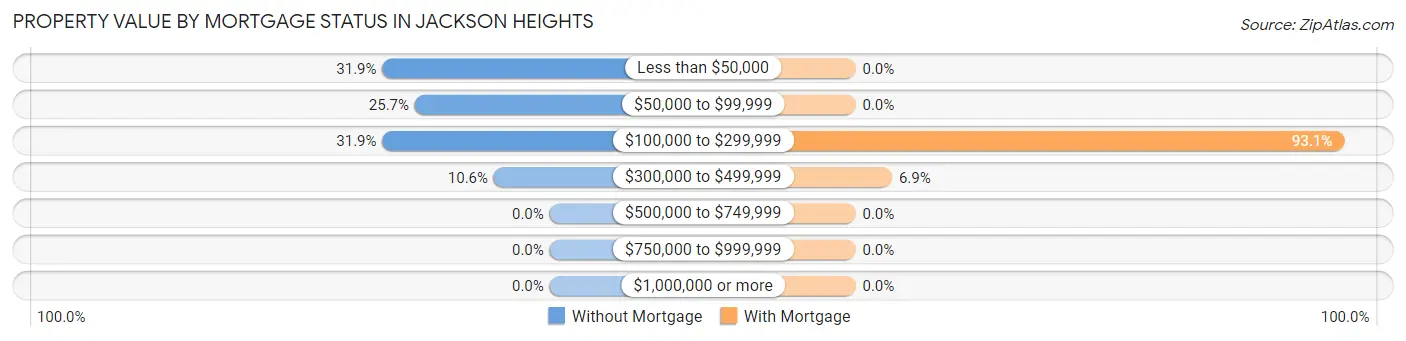
| Property Value | Without Mortgage | With Mortgage |
| Less than $50,000 | 36 (31.9%) | 0 (0.0%) |
| $50,000 to $99,999 | 29 (25.7%) | 0 (0.0%) |
| $100,000 to $299,999 | 36 (31.9%) | 161 (93.1%) |
| $300,000 to $499,999 | 12 (10.6%) | 12 (6.9%) |
| $500,000 to $749,999 | 0 (0.0%) | 0 (0.0%) |
| $750,000 to $999,999 | 0 (0.0%) | 0 (0.0%) |
| $1,000,000 or more | 0 (0.0%) | 0 (0.0%) |
| Total | 113 (100.0%) | 173 (100.0%) |
Household Income by Mortgage Status in Jackson Heights
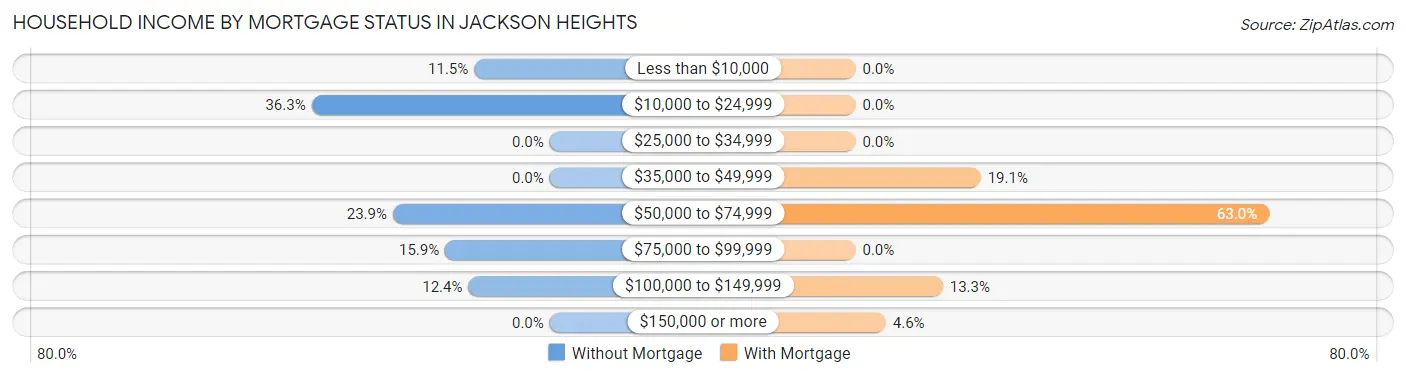
| Household Income | Without Mortgage | With Mortgage |
| Less than $10,000 | 13 (11.5%) | 0 (0.0%) |
| $10,000 to $24,999 | 41 (36.3%) | 0 (0.0%) |
| $25,000 to $34,999 | 0 (0.0%) | 0 (0.0%) |
| $35,000 to $49,999 | 0 (0.0%) | 33 (19.1%) |
| $50,000 to $74,999 | 27 (23.9%) | 109 (63.0%) |
| $75,000 to $99,999 | 18 (15.9%) | 0 (0.0%) |
| $100,000 to $149,999 | 14 (12.4%) | 23 (13.3%) |
| $150,000 or more | 0 (0.0%) | 8 (4.6%) |
| Total | 113 (100.0%) | 173 (100.0%) |
Property Value to Household Income Ratio in Jackson Heights
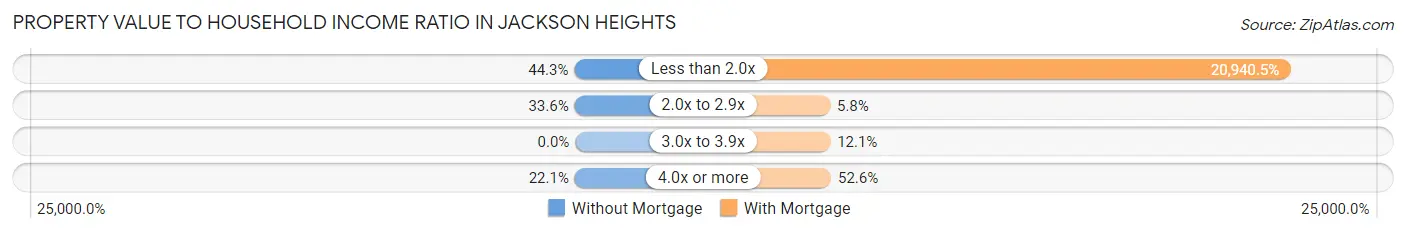
| Value-to-Income Ratio | Without Mortgage | With Mortgage |
| Less than 2.0x | 50 (44.3%) | 36,227 (20,940.5%) |
| 2.0x to 2.9x | 38 (33.6%) | 10 (5.8%) |
| 3.0x to 3.9x | 0 (0.0%) | 21 (12.1%) |
| 4.0x or more | 25 (22.1%) | 91 (52.6%) |
| Total | 113 (100.0%) | 173 (100.0%) |
Real Estate Taxes by Mortgage Status in Jackson Heights
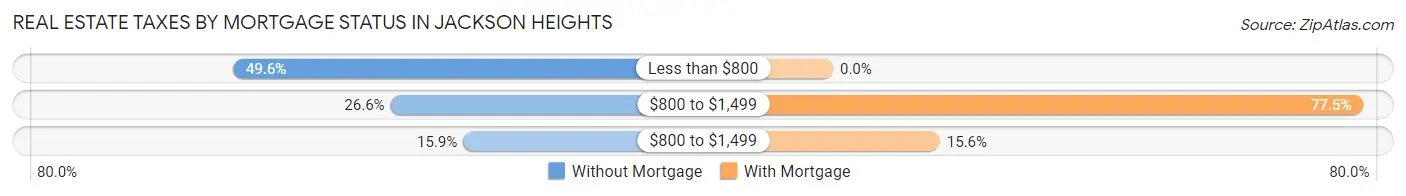
| Property Taxes | Without Mortgage | With Mortgage |
| Less than $800 | 56 (49.6%) | 0 (0.0%) |
| $800 to $1,499 | 30 (26.6%) | 134 (77.5%) |
| $800 to $1,499 | 18 (15.9%) | 27 (15.6%) |
| Total | 113 (100.0%) | 173 (100.0%) |
Health & Disability in Jackson Heights
Health Insurance Coverage by Age in Jackson Heights
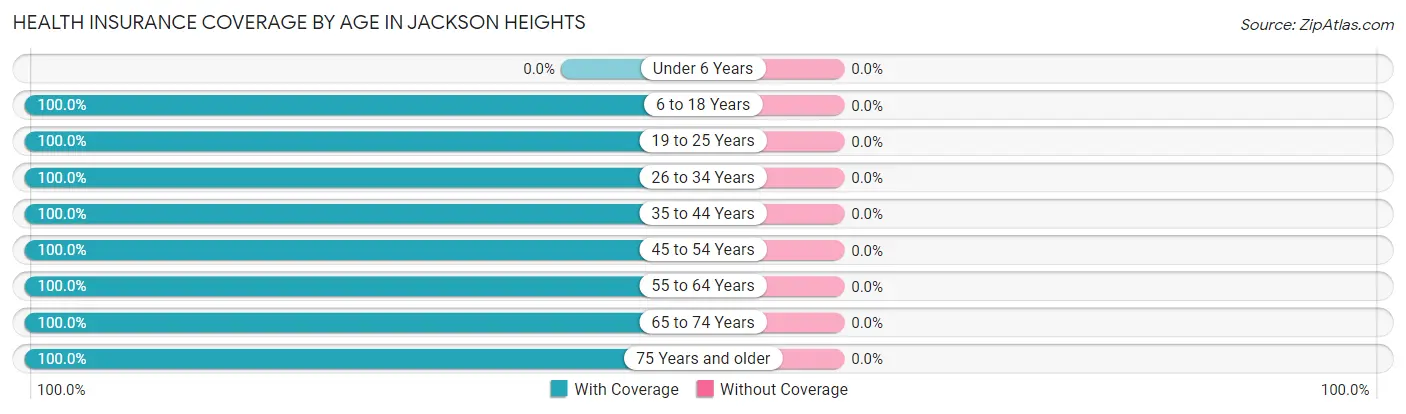
| Age Bracket | With Coverage | Without Coverage |
| Under 6 Years | 0 (0.0%) | 0 (0.0%) |
| 6 to 18 Years | 167 (100.0%) | 0 (0.0%) |
| 19 to 25 Years | 9 (100.0%) | 0 (0.0%) |
| 26 to 34 Years | 24 (100.0%) | 0 (0.0%) |
| 35 to 44 Years | 51 (100.0%) | 0 (0.0%) |
| 45 to 54 Years | 178 (100.0%) | 0 (0.0%) |
| 55 to 64 Years | 243 (100.0%) | 0 (0.0%) |
| 65 to 74 Years | 134 (100.0%) | 0 (0.0%) |
| 75 Years and older | 83 (100.0%) | 0 (0.0%) |
| Total | 889 (100.0%) | 0 (0.0%) |
Health Insurance Coverage by Citizenship Status in Jackson Heights
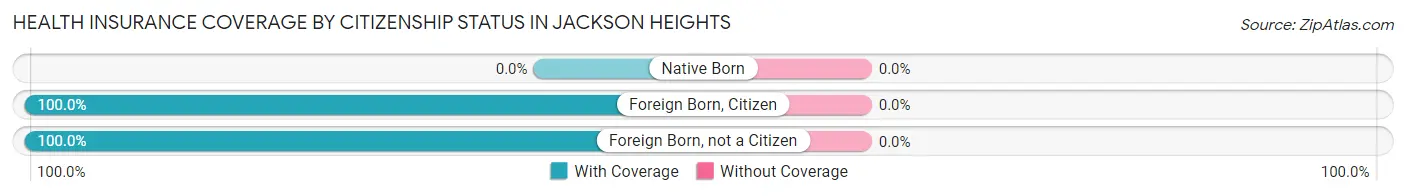
| Citizenship Status | With Coverage | Without Coverage |
| Native Born | 0 (0.0%) | 0 (0.0%) |
| Foreign Born, Citizen | 167 (100.0%) | 0 (0.0%) |
| Foreign Born, not a Citizen | 9 (100.0%) | 0 (0.0%) |
Health Insurance Coverage by Household Income in Jackson Heights
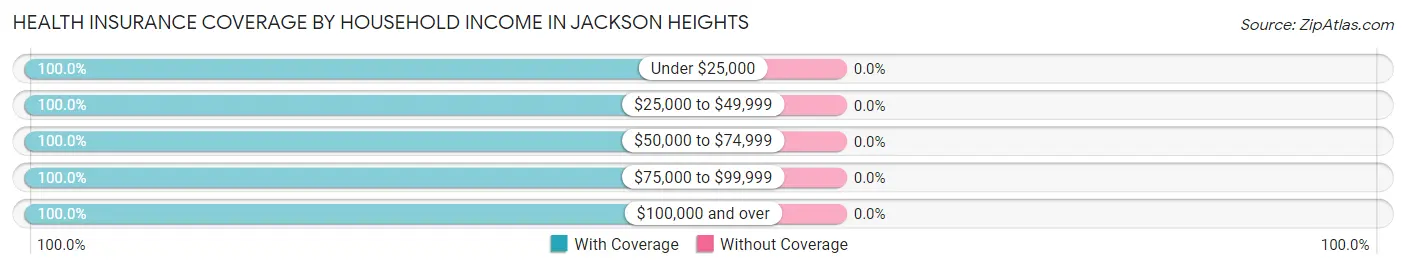
| Household Income | With Coverage | Without Coverage |
| Under $25,000 | 143 (100.0%) | 0 (0.0%) |
| $25,000 to $49,999 | 333 (100.0%) | 0 (0.0%) |
| $50,000 to $74,999 | 53 (100.0%) | 0 (0.0%) |
| $75,000 to $99,999 | 281 (100.0%) | 0 (0.0%) |
| $100,000 and over | 79 (100.0%) | 0 (0.0%) |
Public vs Private Health Insurance Coverage by Age in Jackson Heights
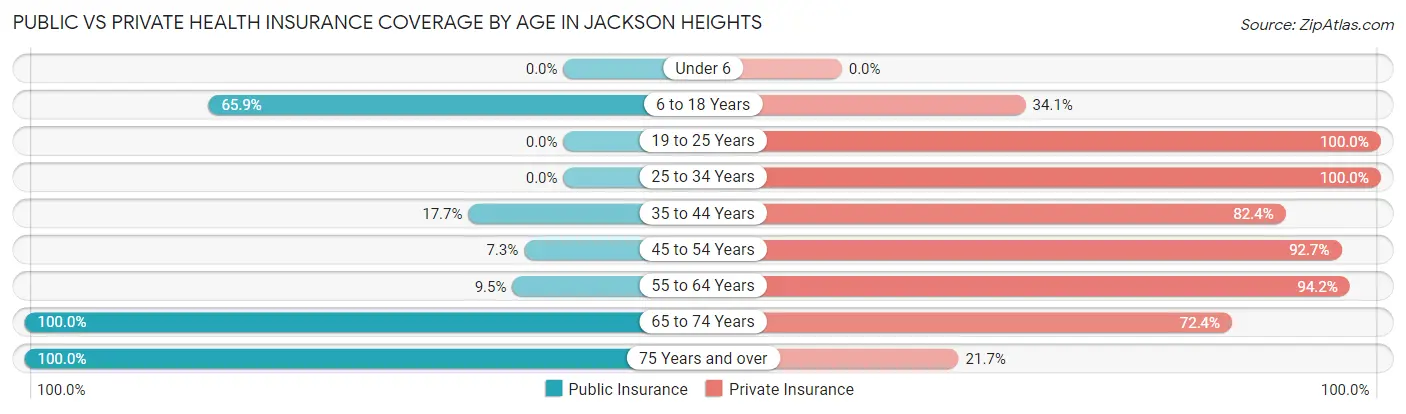
| Age Bracket | Public Insurance | Private Insurance |
| Under 6 | 0 (0.0%) | 0 (0.0%) |
| 6 to 18 Years | 110 (65.9%) | 57 (34.1%) |
| 19 to 25 Years | 0 (0.0%) | 9 (100.0%) |
| 25 to 34 Years | 0 (0.0%) | 24 (100.0%) |
| 35 to 44 Years | 9 (17.6%) | 42 (82.4%) |
| 45 to 54 Years | 13 (7.3%) | 165 (92.7%) |
| 55 to 64 Years | 23 (9.5%) | 229 (94.2%) |
| 65 to 74 Years | 134 (100.0%) | 97 (72.4%) |
| 75 Years and over | 83 (100.0%) | 18 (21.7%) |
| Total | 372 (41.8%) | 641 (72.1%) |
Disability Status by Sex by Age in Jackson Heights
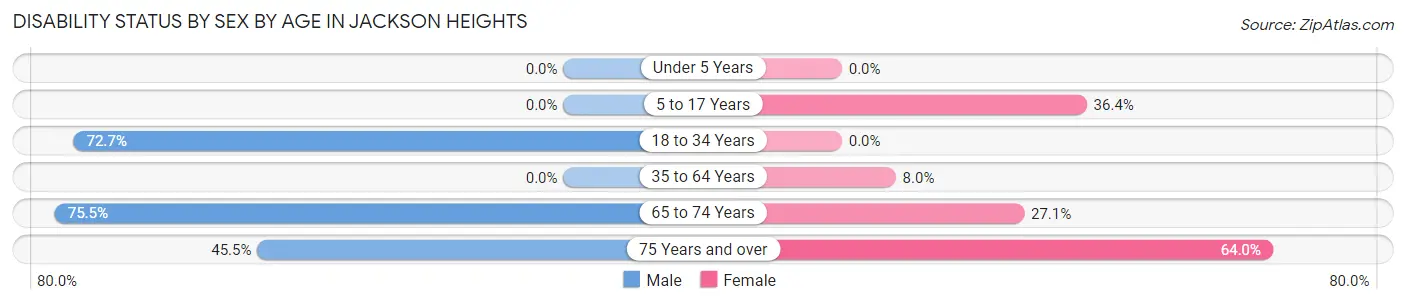
| Age Bracket | Male | Female |
| Under 5 Years | 0 (0.0%) | 0 (0.0%) |
| 5 to 17 Years | 0 (0.0%) | 16 (36.4%) |
| 18 to 34 Years | 24 (72.7%) | 0 (0.0%) |
| 35 to 64 Years | 0 (0.0%) | 18 (8.0%) |
| 65 to 74 Years | 37 (75.5%) | 23 (27.1%) |
| 75 Years and over | 15 (45.5%) | 32 (64.0%) |
Disability Class by Sex by Age in Jackson Heights
Disability Class: Hearing Difficulty
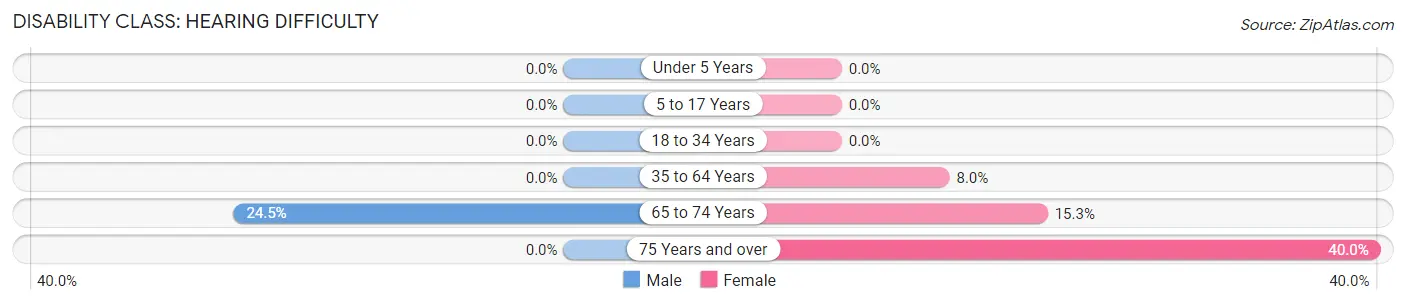
| Age Bracket | Male | Female |
| Under 5 Years | 0 (0.0%) | 0 (0.0%) |
| 5 to 17 Years | 0 (0.0%) | 0 (0.0%) |
| 18 to 34 Years | 0 (0.0%) | 0 (0.0%) |
| 35 to 64 Years | 0 (0.0%) | 18 (8.0%) |
| 65 to 74 Years | 12 (24.5%) | 13 (15.3%) |
| 75 Years and over | 0 (0.0%) | 20 (40.0%) |
Disability Class: Vision Difficulty
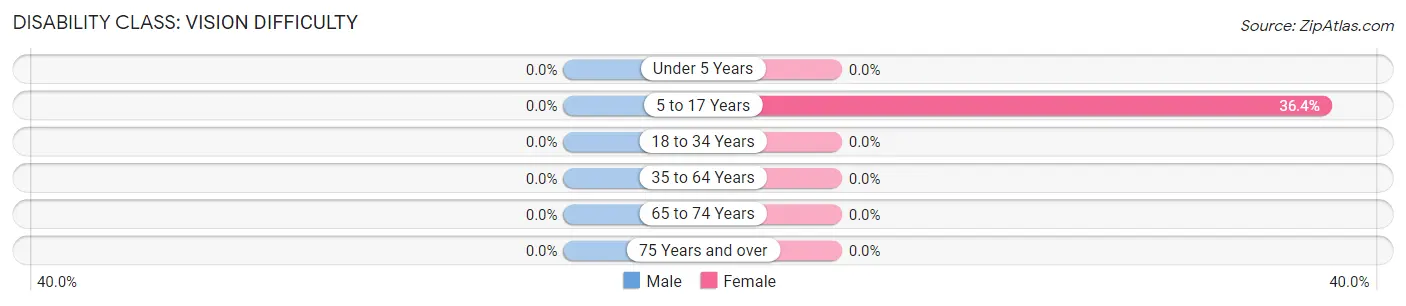
| Age Bracket | Male | Female |
| Under 5 Years | 0 (0.0%) | 0 (0.0%) |
| 5 to 17 Years | 0 (0.0%) | 16 (36.4%) |
| 18 to 34 Years | 0 (0.0%) | 0 (0.0%) |
| 35 to 64 Years | 0 (0.0%) | 0 (0.0%) |
| 65 to 74 Years | 0 (0.0%) | 0 (0.0%) |
| 75 Years and over | 0 (0.0%) | 0 (0.0%) |
Disability Class: Cognitive Difficulty
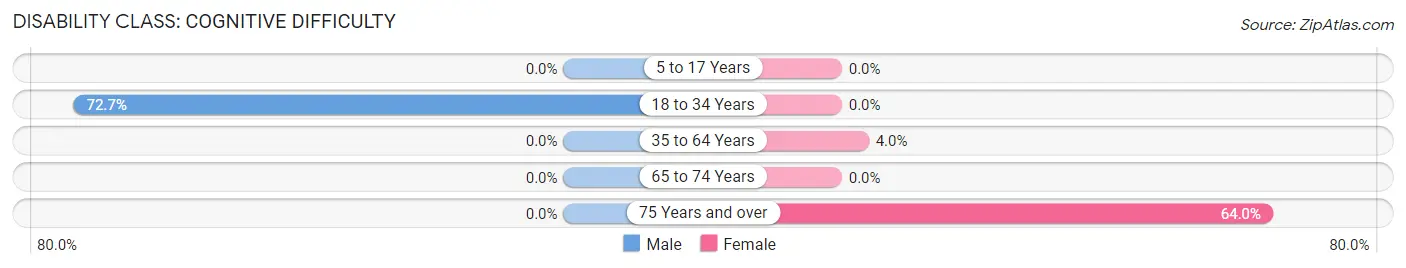
| Age Bracket | Male | Female |
| 5 to 17 Years | 0 (0.0%) | 0 (0.0%) |
| 18 to 34 Years | 24 (72.7%) | 0 (0.0%) |
| 35 to 64 Years | 0 (0.0%) | 9 (4.0%) |
| 65 to 74 Years | 0 (0.0%) | 0 (0.0%) |
| 75 Years and over | 0 (0.0%) | 32 (64.0%) |
Disability Class: Ambulatory Difficulty
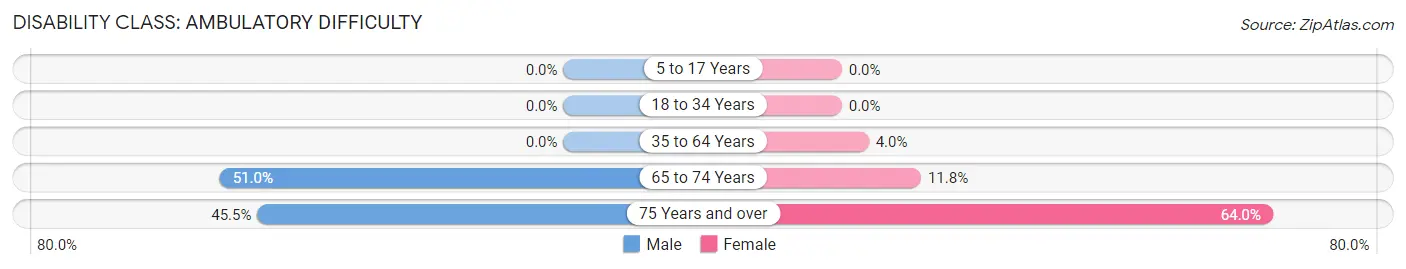
| Age Bracket | Male | Female |
| 5 to 17 Years | 0 (0.0%) | 0 (0.0%) |
| 18 to 34 Years | 0 (0.0%) | 0 (0.0%) |
| 35 to 64 Years | 0 (0.0%) | 9 (4.0%) |
| 65 to 74 Years | 25 (51.0%) | 10 (11.8%) |
| 75 Years and over | 15 (45.5%) | 32 (64.0%) |
Disability Class: Self-Care Difficulty
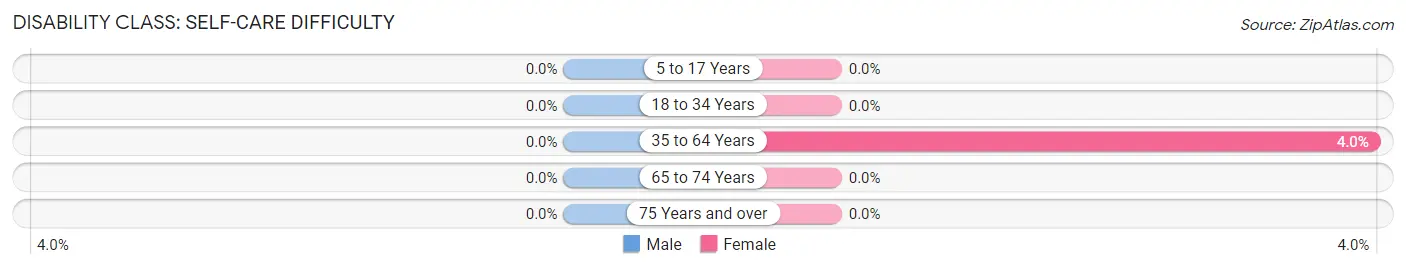
| Age Bracket | Male | Female |
| 5 to 17 Years | 0 (0.0%) | 0 (0.0%) |
| 18 to 34 Years | 0 (0.0%) | 0 (0.0%) |
| 35 to 64 Years | 0 (0.0%) | 9 (4.0%) |
| 65 to 74 Years | 0 (0.0%) | 0 (0.0%) |
| 75 Years and over | 0 (0.0%) | 0 (0.0%) |
Technology Access in Jackson Heights
Computing Device Access in Jackson Heights
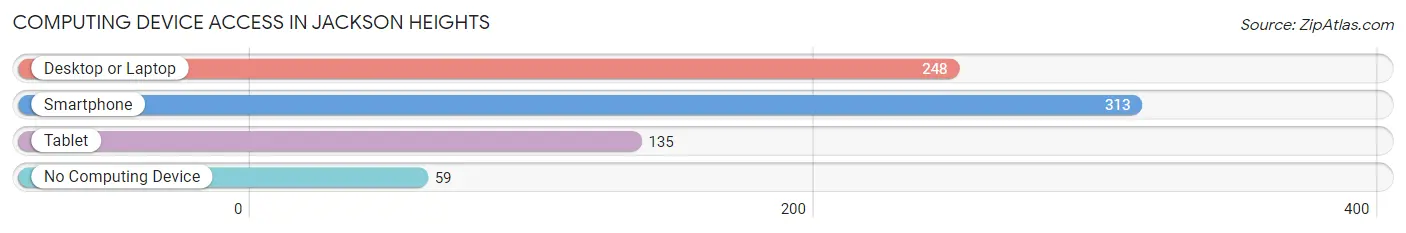
| Device Type | # Households | % Households |
| Desktop or Laptop | 248 | 66.7% |
| Smartphone | 313 | 84.1% |
| Tablet | 135 | 36.3% |
| No Computing Device | 59 | 15.9% |
| Total | 372 | 100.0% |
Internet Access in Jackson Heights
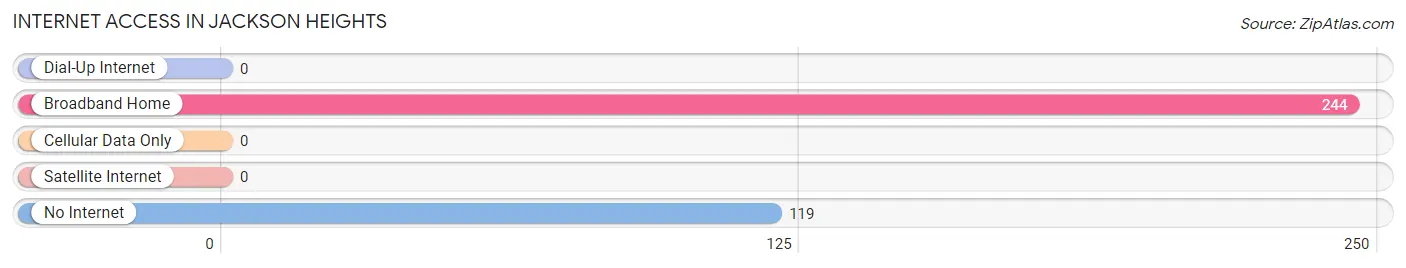
| Internet Type | # Households | % Households |
| Dial-Up Internet | 0 | 0.0% |
| Broadband Home | 244 | 65.6% |
| Cellular Data Only | 0 | 0.0% |
| Satellite Internet | 0 | 0.0% |
| No Internet | 119 | 32.0% |
| Total | 372 | 100.0% |
Jackson Heights Summary
Jackson Heights is a small town located in the state of North Carolina. It is situated in the foothills of the Blue Ridge Mountains, about 25 miles east of Asheville. The town has a population of just over 1,000 people and is part of the larger Buncombe County.
History
Jackson Heights was founded in the late 1800s by a group of settlers from the nearby town of Asheville. The town was named after the Jackson family, who were among the first settlers. The town was originally a farming community, with the main crops being corn, wheat, and tobacco. In the early 1900s, the town began to grow and develop, with the construction of a railroad line and the opening of a post office.
In the 1920s, the town began to experience a period of growth and prosperity. The town was home to several businesses, including a general store, a blacksmith shop, and a sawmill. The town also had a school, a church, and a movie theater.
In the 1950s, the town began to decline as the railroad line was abandoned and the businesses began to close. The town was also affected by the Great Depression, which caused many of the town’s residents to leave in search of work.
Geography
Jackson Heights is located in the foothills of the Blue Ridge Mountains, about 25 miles east of Asheville. The town is situated at an elevation of 1,400 feet and is surrounded by rolling hills and forests. The town is located in a valley, with the French Broad River running through it.
The town is located in a temperate climate, with mild winters and warm summers. The average annual temperature is around 60 degrees Fahrenheit. The town receives an average of 45 inches of rain per year.
Economy
The economy of Jackson Heights is largely based on tourism. The town is home to several tourist attractions, including the Jackson Heights Historic District, which is listed on the National Register of Historic Places. The town is also home to several wineries, breweries, and distilleries.
The town is also home to several small businesses, including restaurants, shops, and galleries. The town is also home to a number of farms, which produce a variety of crops, including corn, wheat, and tobacco.
Demographics
As of the 2010 census, the population of Jackson Heights was 1,072. The town is predominantly white, with a population that is 97.2% white and 2.8% African American. The median household income is $37,500, and the median age is 44.
Conclusion
Jackson Heights is a small town located in the foothills of the Blue Ridge Mountains in North Carolina. The town has a population of just over 1,000 people and is part of the larger Buncombe County. The town was founded in the late 1800s and was originally a farming community. In the early 1900s, the town began to grow and develop, with the construction of a railroad line and the opening of a post office. The town is now largely based on tourism, with several tourist attractions, wineries, breweries, and distilleries. The population of Jackson Heights is predominantly white, with a median household income of $37,500 and a median age of 44.
Common Questions
What is the Total Population of Jackson Heights?
Total Population of Jackson Heights is 889.
What is the Total Male Population of Jackson Heights?
Total Male Population of Jackson Heights is 485.
What is the Total Female Population of Jackson Heights?
Total Female Population of Jackson Heights is 404.
What is the Ratio of Males per 100 Females in Jackson Heights?
There are 120.05 Males per 100 Females in Jackson Heights.
What is the Ratio of Females per 100 Males in Jackson Heights?
There are 83.30 Females per 100 Males in Jackson Heights.
What is the Median Population Age in Jackson Heights?
Median Population Age in Jackson Heights is 59.1 Years.
What is the Average Family Size in Jackson Heights
Average Family Size in Jackson Heights is 2.7 People.
What is the Average Household Size in Jackson Heights
Average Household Size in Jackson Heights is 2.4 People.
What is Per Capita Income in Jackson Heights?
Per Capita income in Jackson Heights is $22,326.
What is the Median Household income in Jackson Heights?
Median Household Income in Jackson Heights is $36,927.
What is Income or Wage Gap in Jackson Heights?
Income or Wage Gap in Jackson Heights is 9.2%.
Women in Jackson Heights earn 90.8 cents for every dollar earned by a man.
What is Inequality or Gini Index in Jackson Heights?
Inequality or Gini Index in Jackson Heights is 0.33.
How Large is the Labor Force in Jackson Heights?
There are 433 People in the Labor Forcein in Jackson Heights.
What is the Percentage of People in the Labor Force in Jackson Heights?
55.9% of People are in the Labor Force in Jackson Heights.