Centerville, NC
Centerville Map
Centerville Overview
261
TOTAL POPULATION
103
MALE POPULATION
158
FEMALE POPULATION
65.19
MALES / 100 FEMALES
153.40
FEMALES / 100 MALES
35.6
MEDIAN AGE
2.5
AVG FAMILY SIZE
2.4
AVG HOUSEHOLD SIZE
$44,676
PER CAPITA INCOME
$99,972
AVG FAMILY INCOME
$99,773
AVG HOUSEHOLD INCOME
0.12
INEQUALITY / GINI INDEX
110
LABOR FORCE [ PEOPLE ]
51.6%
PERCENT IN LABOR FORCE
Centerville Area Codes
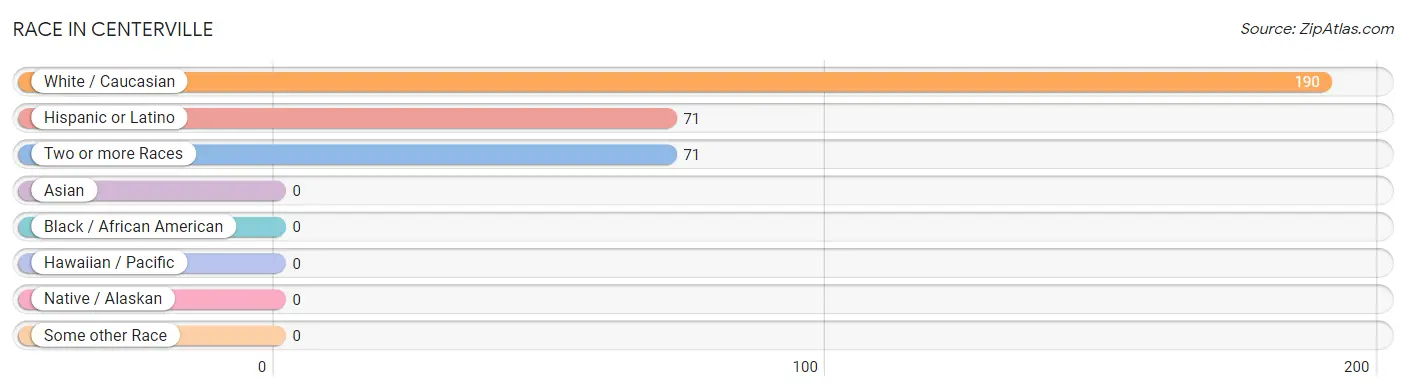
Race in Centerville
The most populous races in Centerville are White / Caucasian (190 | 72.8%), Hispanic or Latino (71 | 27.2%), and Two or more Races (71 | 27.2%).
| Race | # Population | % Population |
| Asian | 0 | 0.0% |
| Black / African American | 0 | 0.0% |
| Hawaiian / Pacific | 0 | 0.0% |
| Hispanic or Latino | 71 | 27.2% |
| Native / Alaskan | 0 | 0.0% |
| White / Caucasian | 190 | 72.8% |
| Two or more Races | 71 | 27.2% |
| Some other Race | 0 | 0.0% |
| Total | 261 | 100.0% |
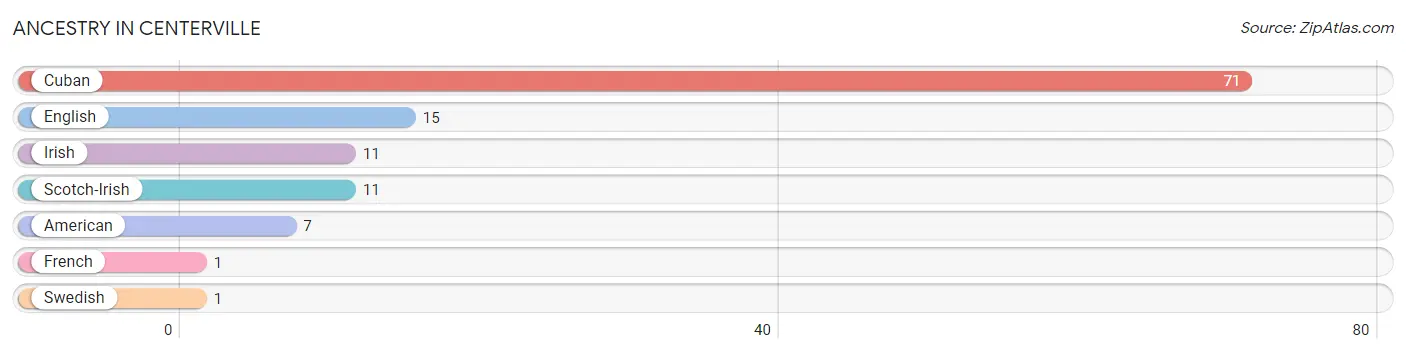
Ancestry in Centerville
The most populous ancestries reported in Centerville are Cuban (71 | 27.2%), English (15 | 5.8%), Irish (11 | 4.2%), Scotch-Irish (11 | 4.2%), and American (7 | 2.7%), together accounting for 44.1% of all Centerville residents.
| Ancestry | # Population | % Population |
| American | 7 | 2.7% |
| Cuban | 71 | 27.2% |
| English | 15 | 5.8% |
| French | 1 | 0.4% |
| Irish | 11 | 4.2% |
| Scotch-Irish | 11 | 4.2% |
| Swedish | 1 | 0.4% | View All 7 Rows |
Immigrants in Centerville

| Immigration Origin | # Population | % Population | View All 0 Rows |
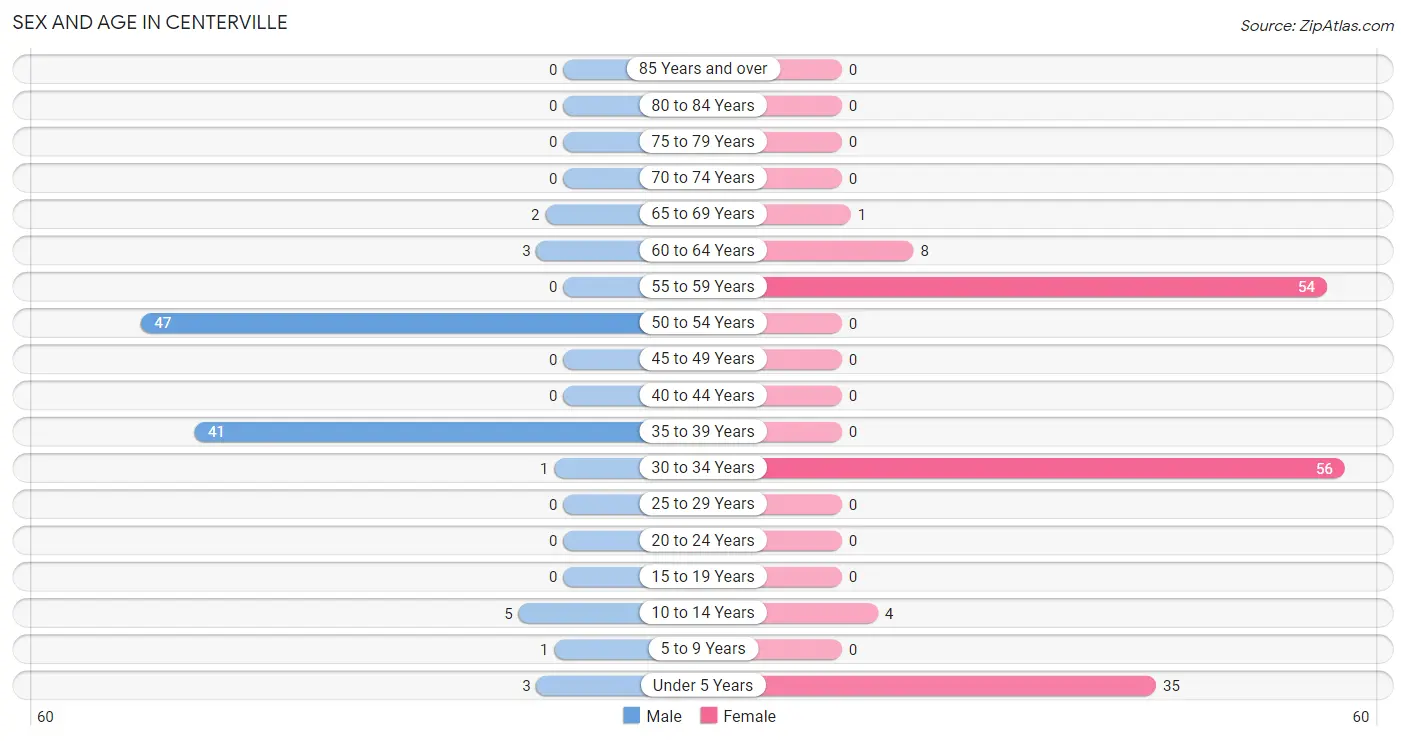
Sex and Age in Centerville
Sex and Age in Centerville
The most populous age groups in Centerville are 50 to 54 Years (47 | 45.6%) for men and 30 to 34 Years (56 | 35.4%) for women.
| Age Bracket | Male | Female |
| Under 5 Years | 3 (2.9%) | 35 (22.2%) |
| 5 to 9 Years | 1 (1.0%) | 0 (0.0%) |
| 10 to 14 Years | 5 (4.9%) | 4 (2.5%) |
| 15 to 19 Years | 0 (0.0%) | 0 (0.0%) |
| 20 to 24 Years | 0 (0.0%) | 0 (0.0%) |
| 25 to 29 Years | 0 (0.0%) | 0 (0.0%) |
| 30 to 34 Years | 1 (1.0%) | 56 (35.4%) |
| 35 to 39 Years | 41 (39.8%) | 0 (0.0%) |
| 40 to 44 Years | 0 (0.0%) | 0 (0.0%) |
| 45 to 49 Years | 0 (0.0%) | 0 (0.0%) |
| 50 to 54 Years | 47 (45.6%) | 0 (0.0%) |
| 55 to 59 Years | 0 (0.0%) | 54 (34.2%) |
| 60 to 64 Years | 3 (2.9%) | 8 (5.1%) |
| 65 to 69 Years | 2 (1.9%) | 1 (0.6%) |
| 70 to 74 Years | 0 (0.0%) | 0 (0.0%) |
| 75 to 79 Years | 0 (0.0%) | 0 (0.0%) |
| 80 to 84 Years | 0 (0.0%) | 0 (0.0%) |
| 85 Years and over | 0 (0.0%) | 0 (0.0%) |
| Total | 103 (100.0%) | 158 (100.0%) |
Families and Households in Centerville
Median Family Size in Centerville
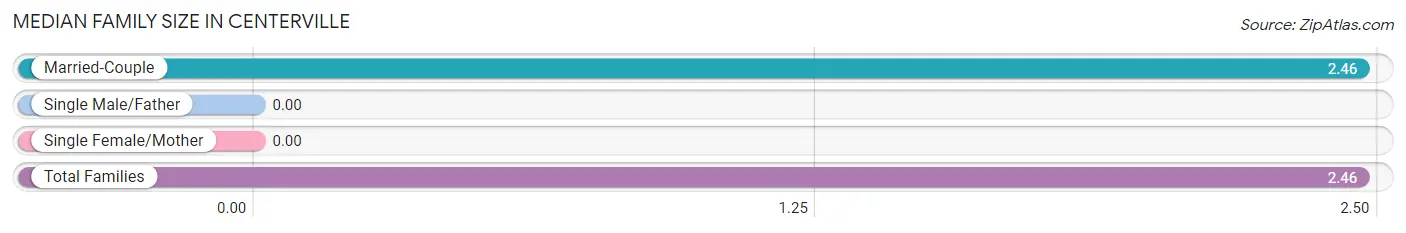
| Family Type | # Families | Family Size |
| Married-Couple | 103 (100.0%) | 2.46 |
| Single Male/Father | 0 (0.0%) | - |
| Single Female/Mother | 0 (0.0%) | - |
| Total Families | 103 (100.0%) | 2.46 |
Median Household Size in Centerville
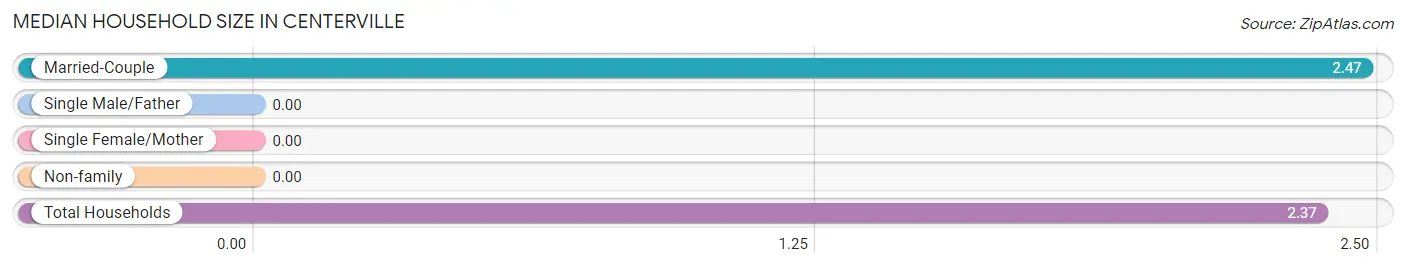
| Household Type | # Households | Household Size |
| Married-Couple | 103 (93.6%) | 2.47 |
| Single Male/Father | 0 (0.0%) | - |
| Single Female/Mother | 0 (0.0%) | - |
| Non-family | 7 (6.4%) | - |
| Total Households | 110 (100.0%) | 2.37 |
Household Size by Marriage Status in Centerville
Out of a total of 110 households in Centerville, 103 (93.6%) are family households, while 7 (6.4%) are nonfamily households. The most numerous type of family households are 2-person households, comprising 48, and the most common type of nonfamily households are 1-person households, comprising 7.
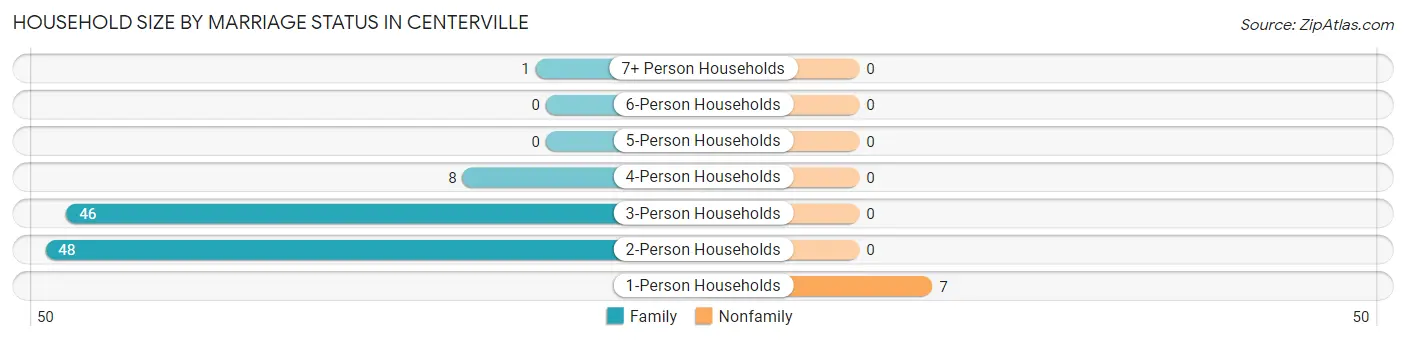
| Household Size | Family Households | Nonfamily Households |
| 1-Person Households | - | 7 (6.4%) |
| 2-Person Households | 48 (43.6%) | 0 (0.0%) |
| 3-Person Households | 46 (41.8%) | 0 (0.0%) |
| 4-Person Households | 8 (7.3%) | 0 (0.0%) |
| 5-Person Households | 0 (0.0%) | 0 (0.0%) |
| 6-Person Households | 0 (0.0%) | 0 (0.0%) |
| 7+ Person Households | 1 (0.9%) | 0 (0.0%) |
| Total | 103 (93.6%) | 7 (6.4%) |
Female Fertility in Centerville
Fertility by Age in Centerville
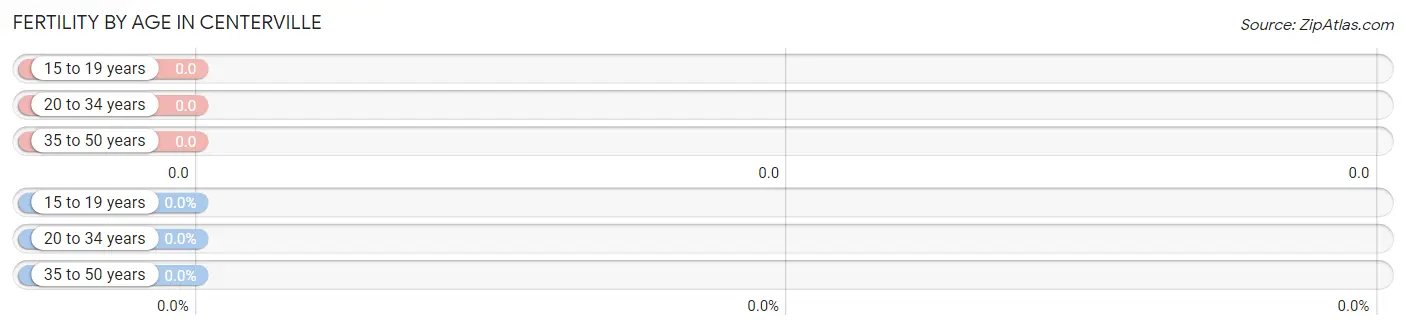
| Age Bracket | Women with Births | Births / 1,000 Women |
| 15 to 19 years | 0 (0.0%) | 0.0 |
| 20 to 34 years | 0 (0.0%) | 0.0 |
| 35 to 50 years | 0 (0.0%) | 0.0 |
| Total | 0 (0.0%) | 0.0 |
Fertility by Age by Marriage Status in Centerville
| Age Bracket | Married | Unmarried |
| 15 to 19 years | 0 (0.0%) | 0 (0.0%) |
| 20 to 34 years | 0 (0.0%) | 0 (0.0%) |
| 35 to 50 years | 0 (0.0%) | 0 (0.0%) |
| Total | 0 (0.0%) | 0 (0.0%) |
Fertility by Education in Centerville
| Educational Attainment | Women with Births | Births / 1,000 Women |
| Less than High School | 0 (0.0%) | 0.0 |
| High School Diploma | 0 (0.0%) | 0.0 |
| College or Associate's Degree | 0 (0.0%) | 0.0 |
| Bachelor's Degree | 0 (0.0%) | 0.0 |
| Graduate Degree | 0 (0.0%) | 0.0 |
| Total | 0 (0.0%) | 0.0 |
Fertility by Education by Marriage Status in Centerville
| Educational Attainment | Married | Unmarried |
| Less than High School | 0 (0.0%) | 0 (0.0%) |
| High School Diploma | 0 (0.0%) | 0 (0.0%) |
| College or Associate's Degree | 0 (0.0%) | 0 (0.0%) |
| Bachelor's Degree | 0 (0.0%) | 0 (0.0%) |
| Graduate Degree | 0 (0.0%) | 0 (0.0%) |
| Total | 0 (0.0%) | 0 (0.0%) |
Income in Centerville
Income Overview in Centerville
Per Capita Income in Centerville is $44,676, while median incomes of families and households are $99,972 and $99,773 respectively.
| Characteristic | Number | Measure |
| Per Capita Income | 261 | $44,676 |
| Median Family Income | 103 | $99,972 |
| Mean Family Income | 103 | $113,215 |
| Median Household Income | 110 | $99,773 |
| Mean Household Income | 110 | $109,977 |
| Income Deficit | 103 | $0 |
| Wage / Income Gap (%) | 261 | 0.00% |
| Wage / Income Gap ($) | 261 | 100.00¢ per $1 |
| Gini / Inequality Index | 261 | 0.12 |
Earnings by Sex in Centerville
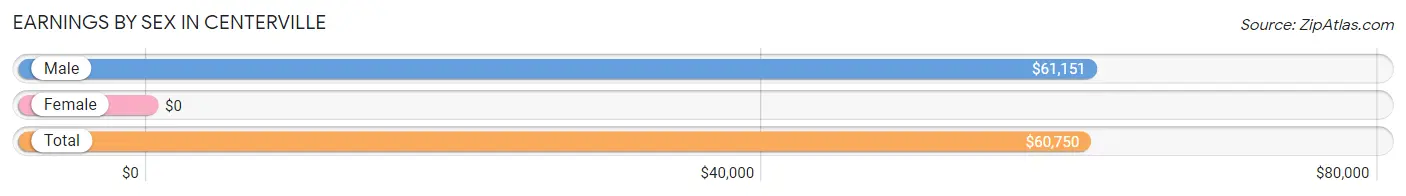
| Sex | Number | Average Earnings |
| Male | 49 (30.1%) | $61,151 |
| Female | 114 (69.9%) | $0 |
| Total | 163 (100.0%) | $60,750 |
Earnings by Sex by Income Bracket in Centerville
The most common earnings brackets in Centerville are $55,000 to $64,999 for men (38 | 77.5%) and $20,000 to $22,499 for women (48 | 42.1%).
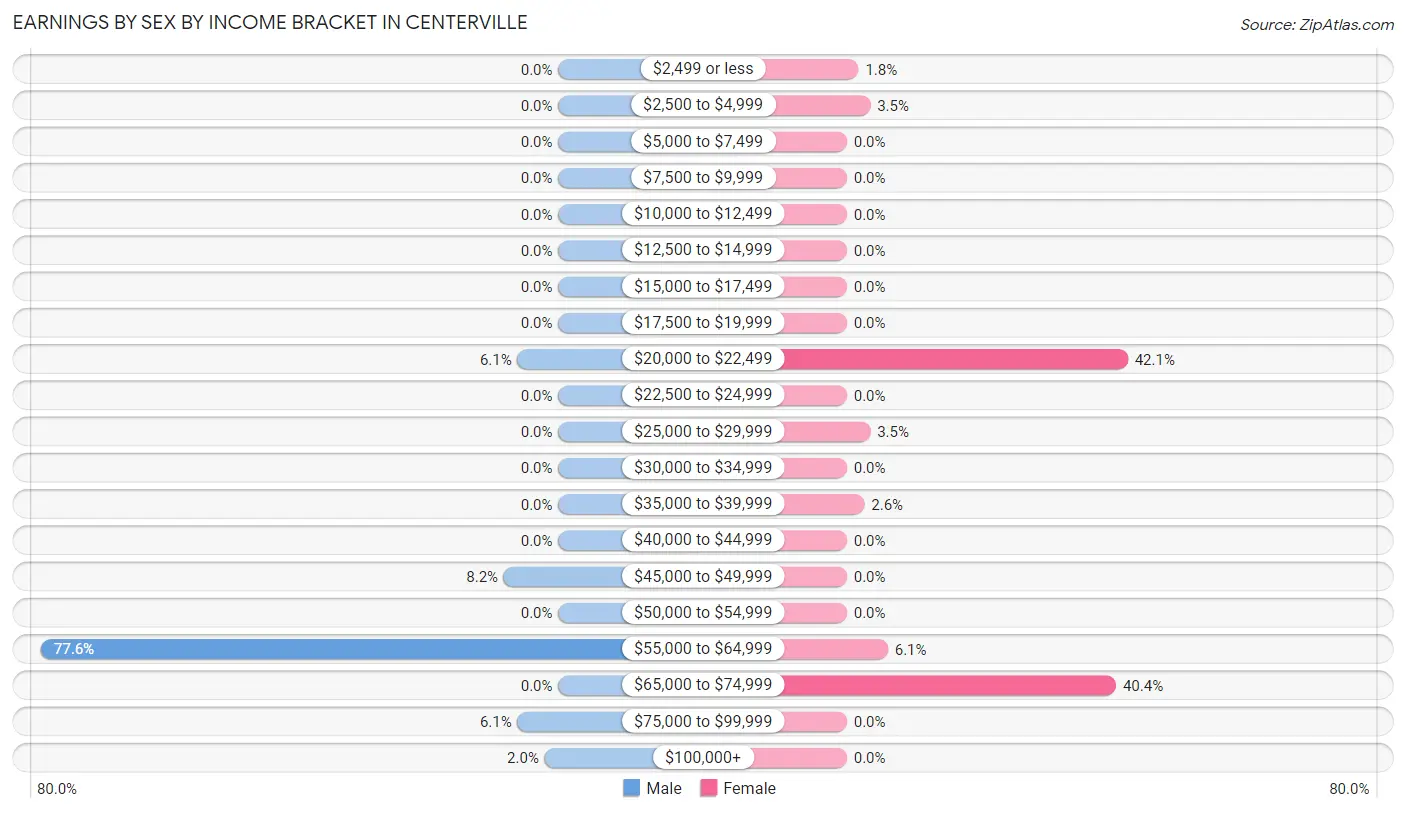
| Income | Male | Female |
| $2,499 or less | 0 (0.0%) | 2 (1.8%) |
| $2,500 to $4,999 | 0 (0.0%) | 4 (3.5%) |
| $5,000 to $7,499 | 0 (0.0%) | 0 (0.0%) |
| $7,500 to $9,999 | 0 (0.0%) | 0 (0.0%) |
| $10,000 to $12,499 | 0 (0.0%) | 0 (0.0%) |
| $12,500 to $14,999 | 0 (0.0%) | 0 (0.0%) |
| $15,000 to $17,499 | 0 (0.0%) | 0 (0.0%) |
| $17,500 to $19,999 | 0 (0.0%) | 0 (0.0%) |
| $20,000 to $22,499 | 3 (6.1%) | 48 (42.1%) |
| $22,500 to $24,999 | 0 (0.0%) | 0 (0.0%) |
| $25,000 to $29,999 | 0 (0.0%) | 4 (3.5%) |
| $30,000 to $34,999 | 0 (0.0%) | 0 (0.0%) |
| $35,000 to $39,999 | 0 (0.0%) | 3 (2.6%) |
| $40,000 to $44,999 | 0 (0.0%) | 0 (0.0%) |
| $45,000 to $49,999 | 4 (8.2%) | 0 (0.0%) |
| $50,000 to $54,999 | 0 (0.0%) | 0 (0.0%) |
| $55,000 to $64,999 | 38 (77.5%) | 7 (6.1%) |
| $65,000 to $74,999 | 0 (0.0%) | 46 (40.4%) |
| $75,000 to $99,999 | 3 (6.1%) | 0 (0.0%) |
| $100,000+ | 1 (2.0%) | 0 (0.0%) |
| Total | 49 (100.0%) | 114 (100.0%) |
Earnings by Sex by Educational Attainment in Centerville
| Educational Attainment | Male Income | Female Income |
| Less than High School | - | - |
| High School Diploma | - | - |
| College or Associate's Degree | - | - |
| Bachelor's Degree | - | - |
| Graduate Degree | - | - |
| Total | $61,151 | $0 |
Family Income in Centerville
Family Income Brackets in Centerville
According to the Centerville family income data, there are 50 families falling into the $100,000 to $149,999 income range, which is the most common income bracket and makes up 48.5% of all families.
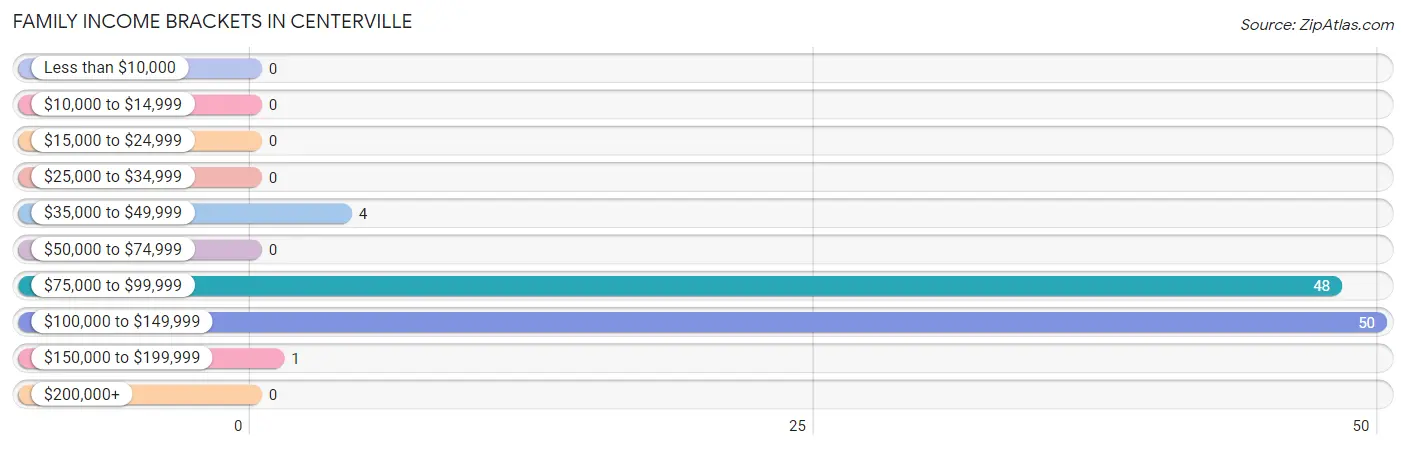
| Income Bracket | # Families | % Families |
| Less than $10,000 | 0 | 0.0% |
| $10,000 to $14,999 | 0 | 0.0% |
| $15,000 to $24,999 | 0 | 0.0% |
| $25,000 to $34,999 | 0 | 0.0% |
| $35,000 to $49,999 | 4 | 3.9% |
| $50,000 to $74,999 | 0 | 0.0% |
| $75,000 to $99,999 | 48 | 46.6% |
| $100,000 to $149,999 | 50 | 48.5% |
| $150,000 to $199,999 | 1 | 1.0% |
| $200,000+ | 0 | 0.0% |
Family Income by Famaliy Size in Centerville
2-person families (48 | 46.6%) account for the highest median family income in Centerville with $98,636 per family, while 2-person families (48 | 46.6%) have the highest median income of $49,318 per family member.
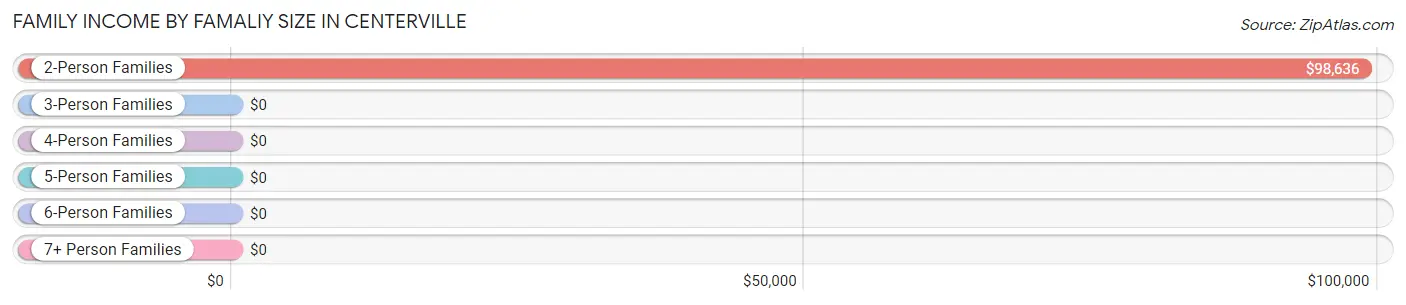
| Income Bracket | # Families | Median Income |
| 2-Person Families | 48 (46.6%) | $98,636 |
| 3-Person Families | 46 (44.7%) | $0 |
| 4-Person Families | 8 (7.8%) | $0 |
| 5-Person Families | 0 (0.0%) | $0 |
| 6-Person Families | 0 (0.0%) | $0 |
| 7+ Person Families | 1 (1.0%) | $0 |
| Total | 103 (100.0%) | $99,972 |
Family Income by Number of Earners in Centerville
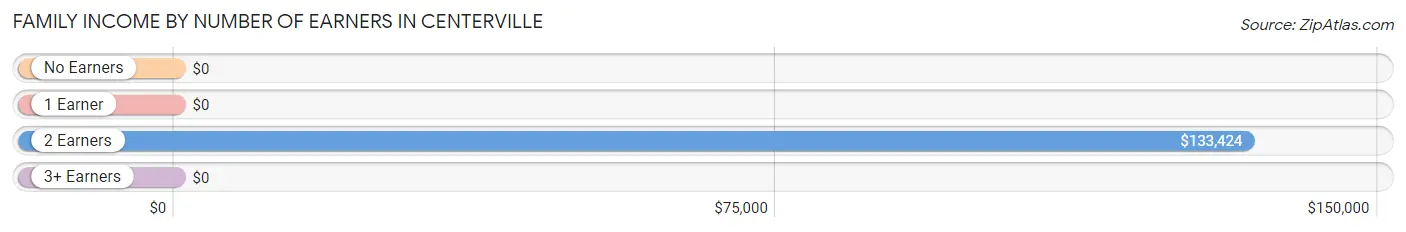
| Number of Earners | # Families | Median Income |
| No Earners | 0 (0.0%) | $0 |
| 1 Earner | 44 (42.7%) | $0 |
| 2 Earners | 58 (56.3%) | $133,424 |
| 3+ Earners | 1 (1.0%) | $0 |
| Total | 103 (100.0%) | $99,972 |
Household Income in Centerville
Household Income Brackets in Centerville
With 50 households falling in the category, the $100,000 to $149,999 income range is the most frequent in Centerville, accounting for 45.5% of all households.
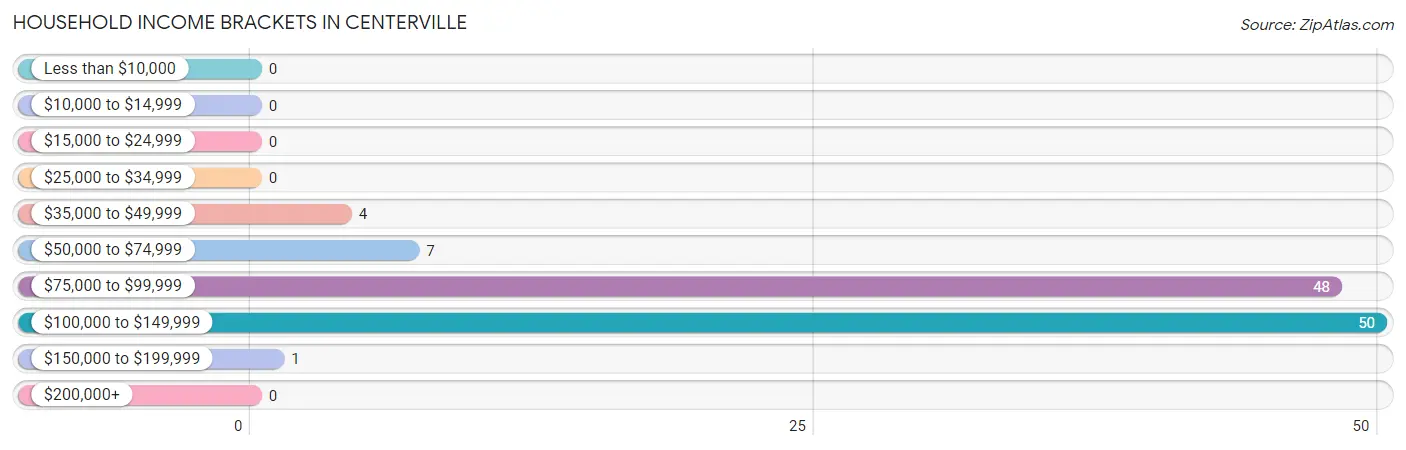
| Income Bracket | # Households | % Households |
| Less than $10,000 | 0 | 0.0% |
| $10,000 to $14,999 | 0 | 0.0% |
| $15,000 to $24,999 | 0 | 0.0% |
| $25,000 to $34,999 | 0 | 0.0% |
| $35,000 to $49,999 | 4 | 3.6% |
| $50,000 to $74,999 | 7 | 6.4% |
| $75,000 to $99,999 | 48 | 43.6% |
| $100,000 to $149,999 | 50 | 45.5% |
| $150,000 to $199,999 | 1 | 0.9% |
| $200,000+ | 0 | 0.0% |
Household Income by Householder Age in Centerville
The median household income in Centerville is $99,773, with the highest median household income of $133,668 found in the 25 to 44 years age bracket for the primary householder. A total of 51 households (46.4%) fall into this category.
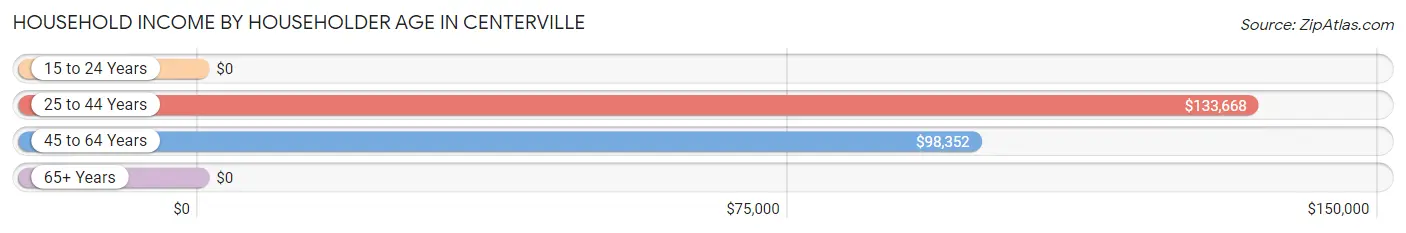
| Income Bracket | # Households | Median Income |
| 15 to 24 Years | 0 (0.0%) | $0 |
| 25 to 44 Years | 51 (46.4%) | $133,668 |
| 45 to 64 Years | 58 (52.7%) | $98,352 |
| 65+ Years | 1 (0.9%) | $0 |
| Total | 110 (100.0%) | $99,773 |
Poverty in Centerville
Income Below Poverty by Sex and Age in Centerville
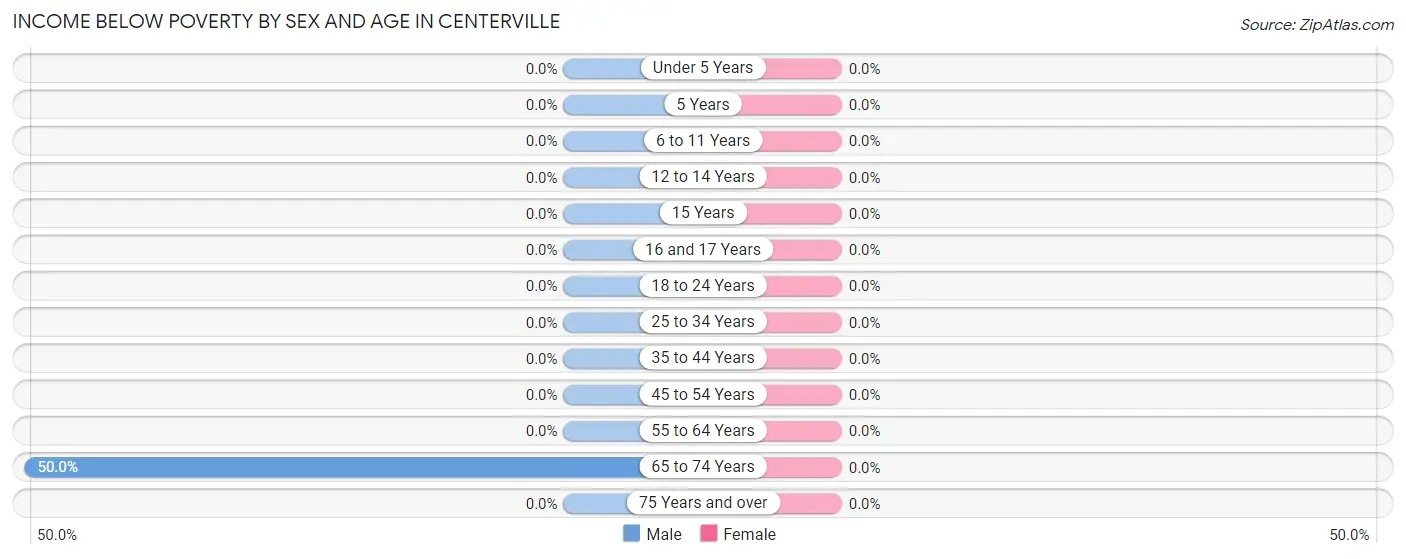
| Age Bracket | Male | Female |
| Under 5 Years | 0 (0.0%) | 0 (0.0%) |
| 5 Years | 0 (0.0%) | 0 (0.0%) |
| 6 to 11 Years | 0 (0.0%) | 0 (0.0%) |
| 12 to 14 Years | 0 (0.0%) | 0 (0.0%) |
| 15 Years | 0 (0.0%) | 0 (0.0%) |
| 16 and 17 Years | 0 (0.0%) | 0 (0.0%) |
| 18 to 24 Years | 0 (0.0%) | 0 (0.0%) |
| 25 to 34 Years | 0 (0.0%) | 0 (0.0%) |
| 35 to 44 Years | 0 (0.0%) | 0 (0.0%) |
| 45 to 54 Years | 0 (0.0%) | 0 (0.0%) |
| 55 to 64 Years | 0 (0.0%) | 0 (0.0%) |
| 65 to 74 Years | 1 (50.0%) | 0 (0.0%) |
| 75 Years and over | 0 (0.0%) | 0 (0.0%) |
| Total | 1 (1.0%) | 0 (0.0%) |
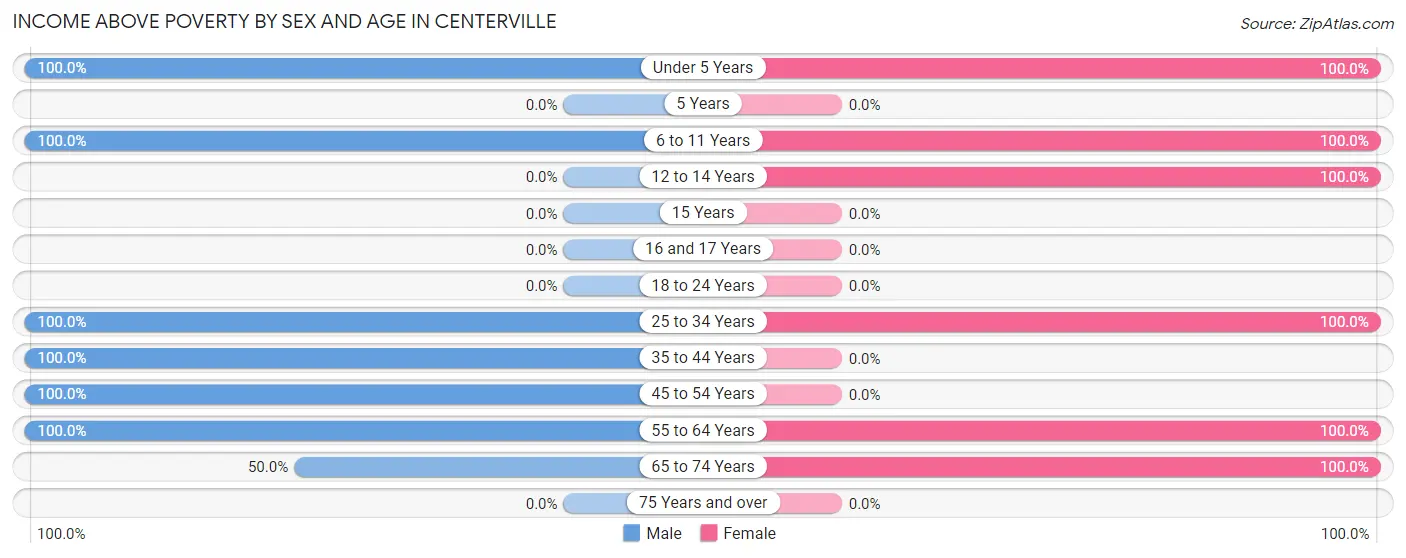
Income Above Poverty by Sex and Age in Centerville
According to the poverty statistics in Centerville, males aged under 5 years and females aged under 5 years are the age groups that are most secure financially, with 100.0% of males and 100.0% of females in these age groups living above the poverty line.
| Age Bracket | Male | Female |
| Under 5 Years | 3 (100.0%) | 35 (100.0%) |
| 5 Years | 0 (0.0%) | 0 (0.0%) |
| 6 to 11 Years | 6 (100.0%) | 1 (100.0%) |
| 12 to 14 Years | 0 (0.0%) | 3 (100.0%) |
| 15 Years | 0 (0.0%) | 0 (0.0%) |
| 16 and 17 Years | 0 (0.0%) | 0 (0.0%) |
| 18 to 24 Years | 0 (0.0%) | 0 (0.0%) |
| 25 to 34 Years | 1 (100.0%) | 56 (100.0%) |
| 35 to 44 Years | 41 (100.0%) | 0 (0.0%) |
| 45 to 54 Years | 47 (100.0%) | 0 (0.0%) |
| 55 to 64 Years | 3 (100.0%) | 62 (100.0%) |
| 65 to 74 Years | 1 (50.0%) | 1 (100.0%) |
| 75 Years and over | 0 (0.0%) | 0 (0.0%) |
| Total | 102 (99.0%) | 158 (100.0%) |
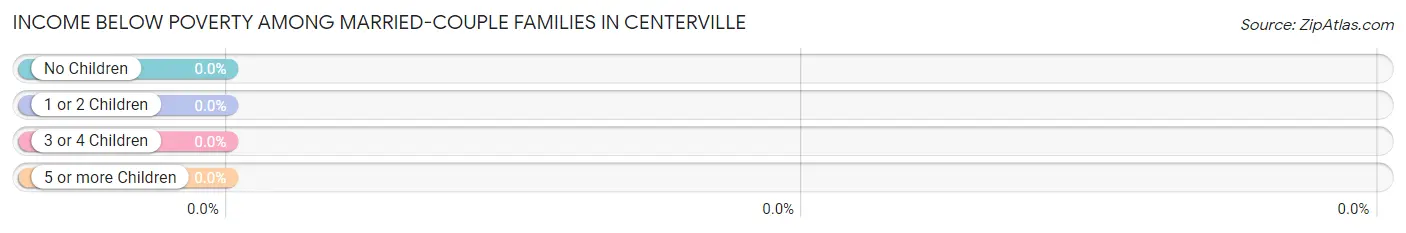
Income Below Poverty Among Married-Couple Families in Centerville
| Children | Above Poverty | Below Poverty |
| No Children | 48 (100.0%) | 0 (0.0%) |
| 1 or 2 Children | 54 (100.0%) | 0 (0.0%) |
| 3 or 4 Children | 1 (100.0%) | 0 (0.0%) |
| 5 or more Children | 0 (0.0%) | 0 (0.0%) |
| Total | 103 (100.0%) | 0 (0.0%) |
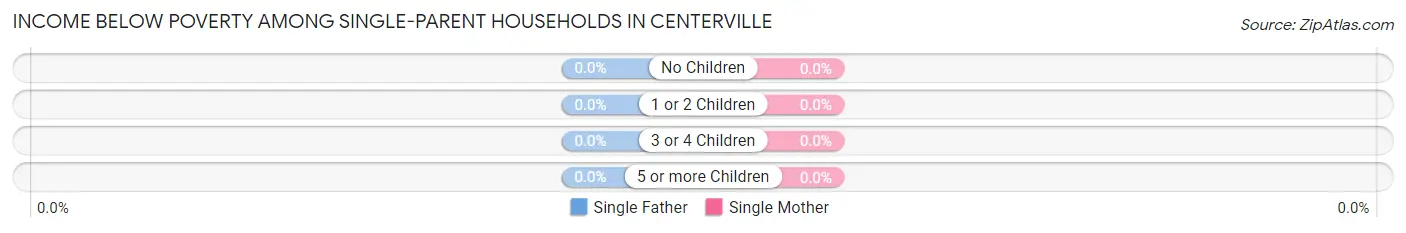
Income Below Poverty Among Single-Parent Households in Centerville
| Children | Single Father | Single Mother |
| No Children | 0 (0.0%) | 0 (0.0%) |
| 1 or 2 Children | 0 (0.0%) | 0 (0.0%) |
| 3 or 4 Children | 0 (0.0%) | 0 (0.0%) |
| 5 or more Children | 0 (0.0%) | 0 (0.0%) |
| Total | 0 (0.0%) | 0 (0.0%) |
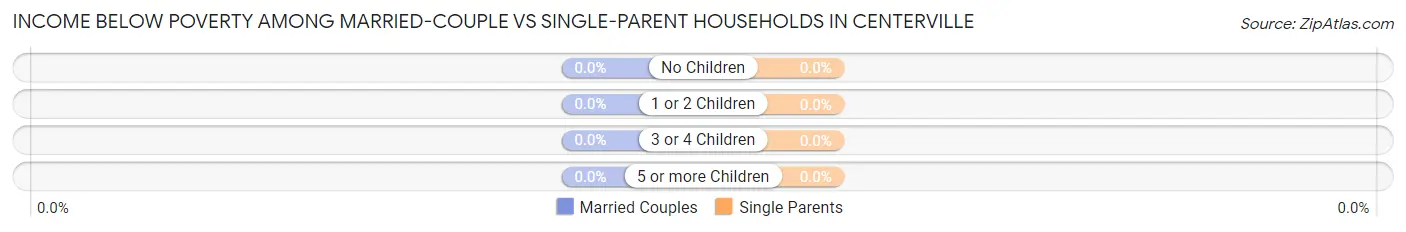
Income Below Poverty Among Married-Couple vs Single-Parent Households in Centerville
| Children | Married-Couple Families | Single-Parent Households |
| No Children | 0 (0.0%) | 0 (0.0%) |
| 1 or 2 Children | 0 (0.0%) | 0 (0.0%) |
| 3 or 4 Children | 0 (0.0%) | 0 (0.0%) |
| 5 or more Children | 0 (0.0%) | 0 (0.0%) |
| Total | 0 (0.0%) | 0 (0.0%) |
Employment Characteristics in Centerville
Employment by Class of Employer in Centerville
Among the 110 employed individuals in Centerville, private company employees (93 | 84.6%), state government employees (14 | 12.7%), and self-employed (not incorporated) (3 | 2.7%) make up the most common classes of employment.
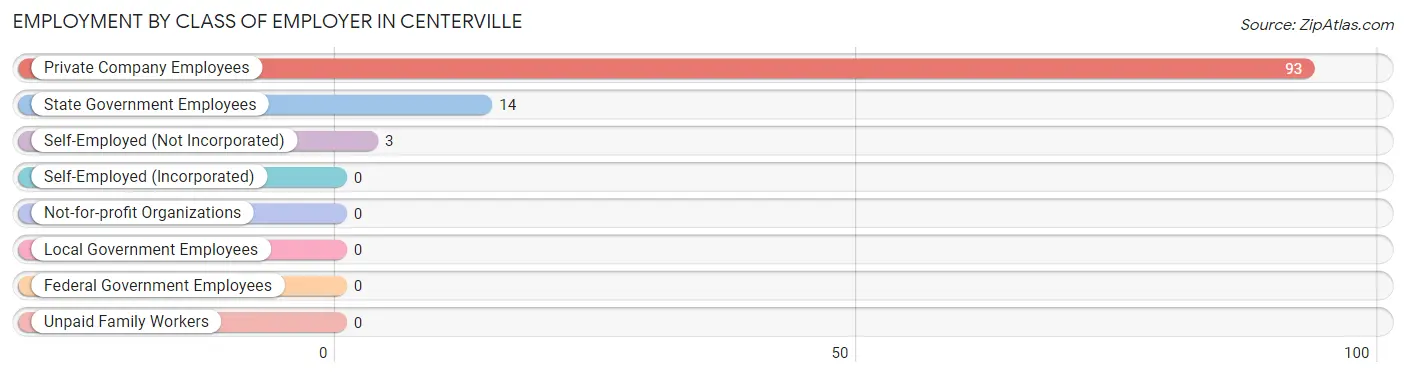
| Employer Class | # Employees | % Employees |
| Private Company Employees | 93 | 84.6% |
| Self-Employed (Incorporated) | 0 | 0.0% |
| Self-Employed (Not Incorporated) | 3 | 2.7% |
| Not-for-profit Organizations | 0 | 0.0% |
| Local Government Employees | 0 | 0.0% |
| State Government Employees | 14 | 12.7% |
| Federal Government Employees | 0 | 0.0% |
| Unpaid Family Workers | 0 | 0.0% |
| Total | 110 | 100.0% |
Employment Status by Age in Centerville
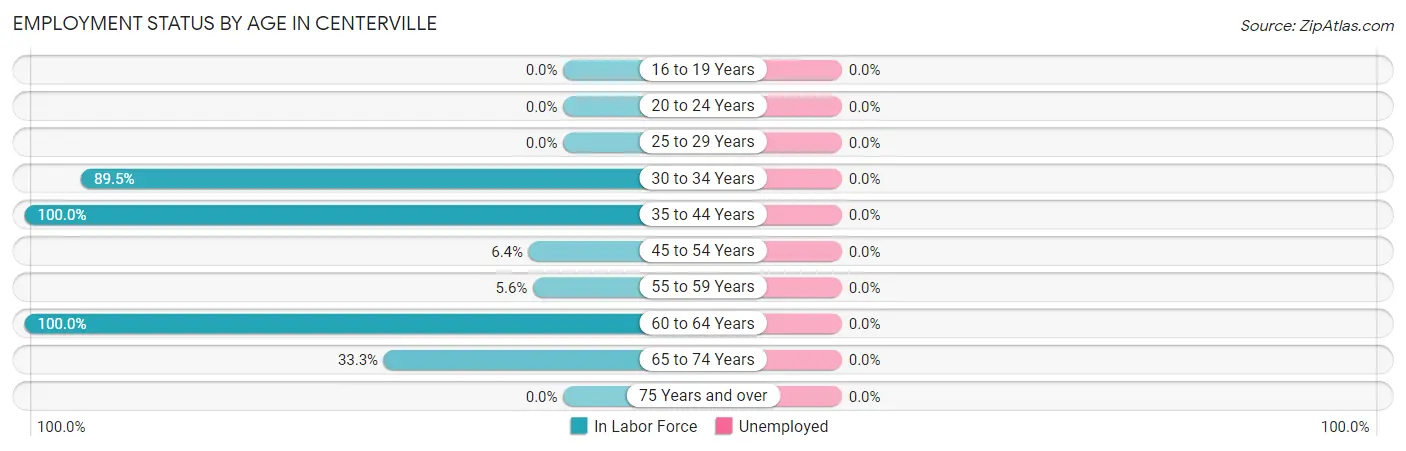
| Age Bracket | In Labor Force | Unemployed |
| 16 to 19 Years | 0 (0.0%) | 0 (0.0%) |
| 20 to 24 Years | 0 (0.0%) | 0 (0.0%) |
| 25 to 29 Years | 0 (0.0%) | 0 (0.0%) |
| 30 to 34 Years | 51 (89.5%) | 0 (0.0%) |
| 35 to 44 Years | 41 (100.0%) | 0 (0.0%) |
| 45 to 54 Years | 3 (6.4%) | 0 (0.0%) |
| 55 to 59 Years | 3 (5.6%) | 0 (0.0%) |
| 60 to 64 Years | 11 (100.0%) | 0 (0.0%) |
| 65 to 74 Years | 1 (33.3%) | 0 (0.0%) |
| 75 Years and over | 0 (0.0%) | 0 (0.0%) |
| Total | 110 (51.6%) | 0 (0.0%) |
Employment Status by Educational Attainment in Centerville
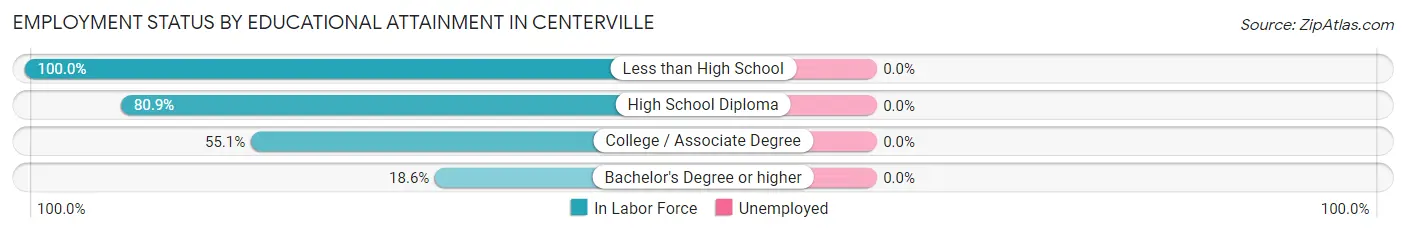
| Educational Attainment | In Labor Force | Unemployed |
| Less than High School | 6 (100.0%) | 0 (0.0%) |
| High School Diploma | 38 (80.9%) | 0 (0.0%) |
| College / Associate Degree | 54 (55.1%) | 0 (0.0%) |
| Bachelor's Degree or higher | 11 (18.6%) | 0 (0.0%) |
| Total | 109 (51.9%) | 0 (0.0%) |
Employment Occupations by Sex in Centerville
Management, Business, Science and Arts Occupations
The most common Management, Business, Science and Arts occupations in Centerville are Health Diagnosing & Treating (47 | 42.7%), Health Technologists (46 | 41.8%), Computers, Engineering & Science (38 | 34.5%), Life, Physical & Social Science (38 | 34.5%), and Community & Social Service (4 | 3.6%).
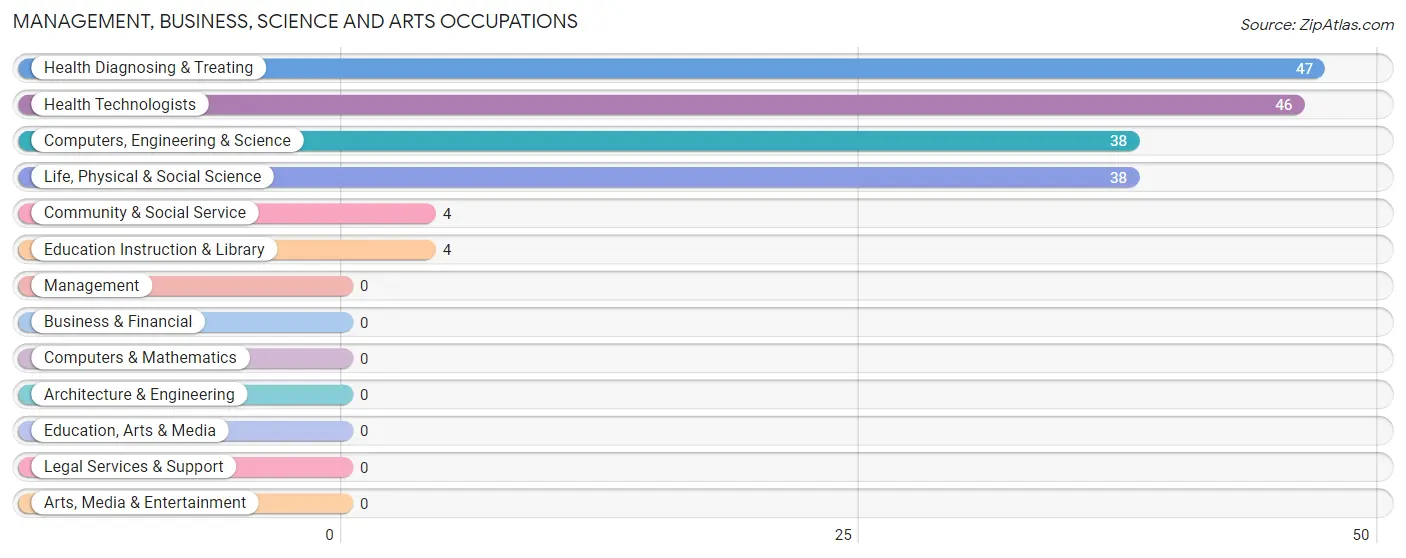
Management, Business, Science and Arts Occupations by Sex
Within the Management, Business, Science and Arts occupations in Centerville, the most male-oriented occupations are Computers, Engineering & Science (100.0%), and Life, Physical & Social Science (100.0%), while the most female-oriented occupations are Community & Social Service (100.0%), Education Instruction & Library (100.0%), and Health Diagnosing & Treating (100.0%).
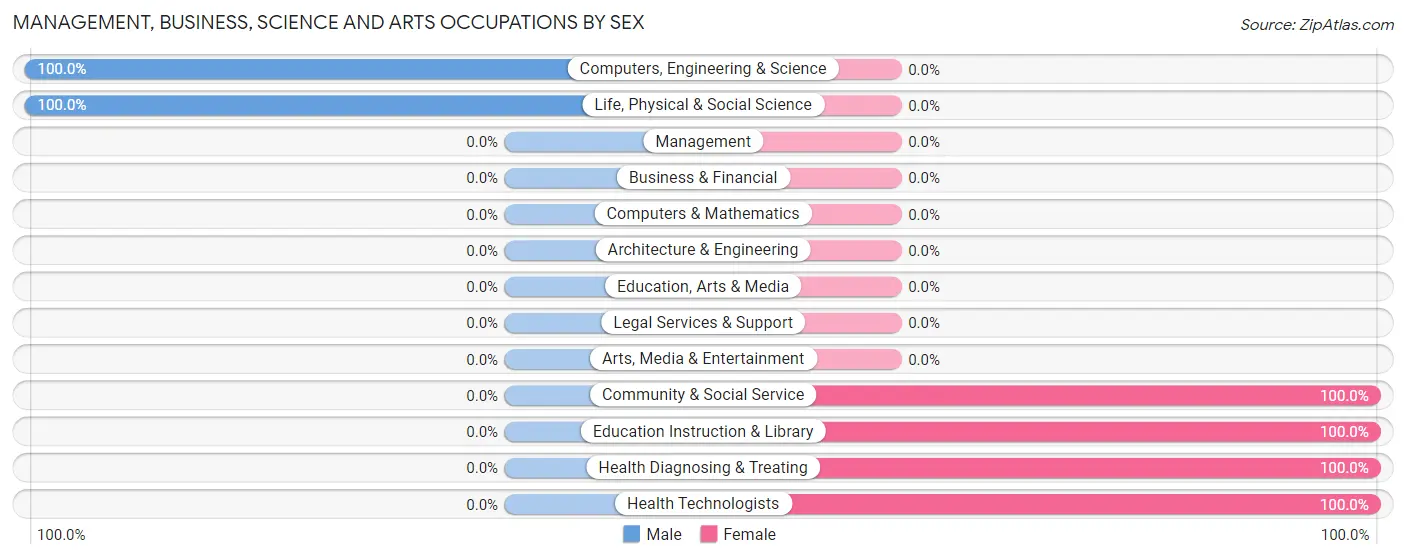
| Occupation | Male | Female |
| Management | 0 (0.0%) | 0 (0.0%) |
| Business & Financial | 0 (0.0%) | 0 (0.0%) |
| Computers, Engineering & Science | 38 (100.0%) | 0 (0.0%) |
| Computers & Mathematics | 0 (0.0%) | 0 (0.0%) |
| Architecture & Engineering | 0 (0.0%) | 0 (0.0%) |
| Life, Physical & Social Science | 38 (100.0%) | 0 (0.0%) |
| Community & Social Service | 0 (0.0%) | 4 (100.0%) |
| Education, Arts & Media | 0 (0.0%) | 0 (0.0%) |
| Legal Services & Support | 0 (0.0%) | 0 (0.0%) |
| Education Instruction & Library | 0 (0.0%) | 4 (100.0%) |
| Arts, Media & Entertainment | 0 (0.0%) | 0 (0.0%) |
| Health Diagnosing & Treating | 0 (0.0%) | 47 (100.0%) |
| Health Technologists | 0 (0.0%) | 46 (100.0%) |
| Total (Category) | 38 (42.7%) | 51 (57.3%) |
| Total (Overall) | 49 (44.6%) | 61 (55.4%) |
Services Occupations
The most common Services occupations in Centerville are Security & Protection (7 | 6.4%), and Law Enforcement (7 | 6.4%).
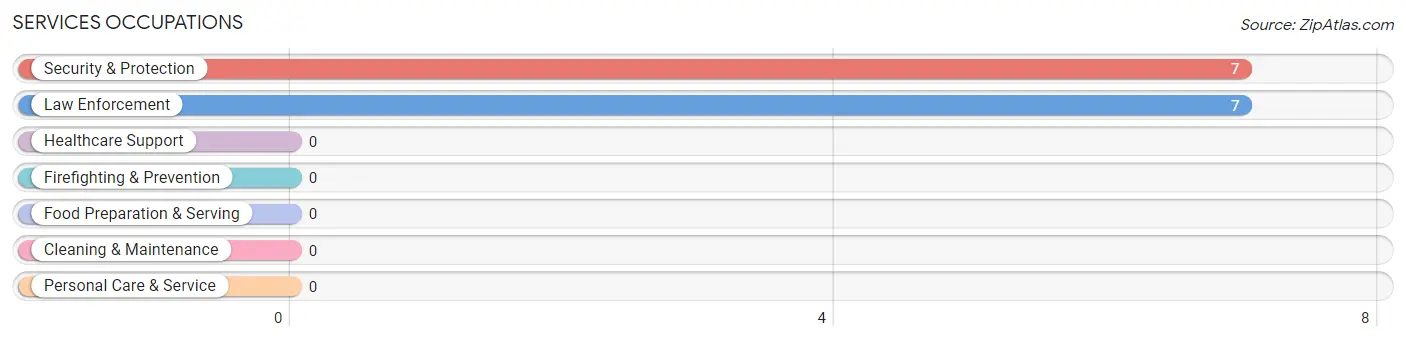
Services Occupations by Sex
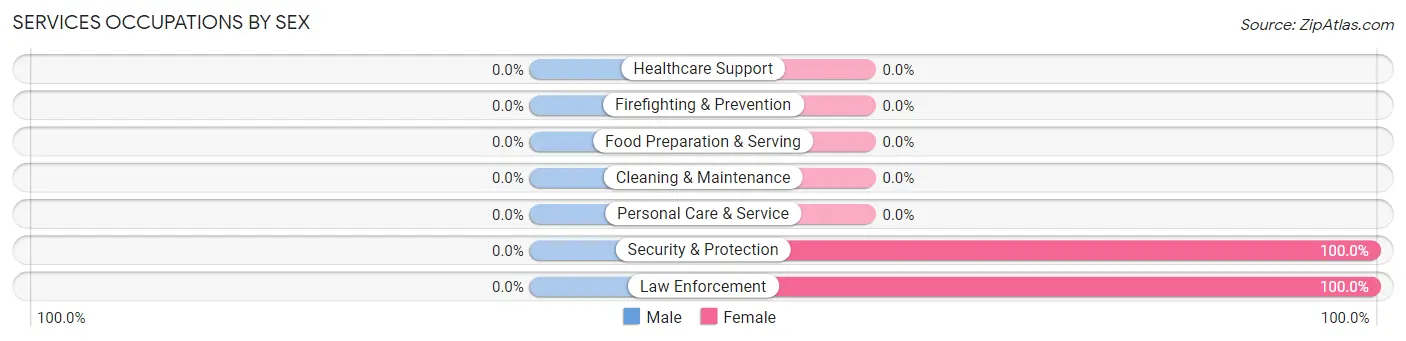
| Occupation | Male | Female |
| Healthcare Support | 0 (0.0%) | 0 (0.0%) |
| Security & Protection | 0 (0.0%) | 7 (100.0%) |
| Firefighting & Prevention | 0 (0.0%) | 0 (0.0%) |
| Law Enforcement | 0 (0.0%) | 7 (100.0%) |
| Food Preparation & Serving | 0 (0.0%) | 0 (0.0%) |
| Cleaning & Maintenance | 0 (0.0%) | 0 (0.0%) |
| Personal Care & Service | 0 (0.0%) | 0 (0.0%) |
| Total (Category) | 0 (0.0%) | 7 (100.0%) |
| Total (Overall) | 49 (44.6%) | 61 (55.4%) |
Sales and Office Occupations
The most common Sales and Office occupations in Centerville are Office & Administration (3 | 2.7%), and Sales & Related (1 | 0.9%).

Sales and Office Occupations by Sex

| Occupation | Male | Female |
| Sales & Related | 1 (100.0%) | 0 (0.0%) |
| Office & Administration | 0 (0.0%) | 3 (100.0%) |
| Total (Category) | 1 (25.0%) | 3 (75.0%) |
| Total (Overall) | 49 (44.6%) | 61 (55.4%) |
Natural Resources, Construction and Maintenance Occupations
The most common Natural Resources, Construction and Maintenance occupations in Centerville are Installation, Maintenance & Repair (4 | 3.6%), and Construction & Extraction (3 | 2.7%).

Natural Resources, Construction and Maintenance Occupations by Sex

| Occupation | Male | Female |
| Farming, Fishing & Forestry | 0 (0.0%) | 0 (0.0%) |
| Construction & Extraction | 3 (100.0%) | 0 (0.0%) |
| Installation, Maintenance & Repair | 4 (100.0%) | 0 (0.0%) |
| Total (Category) | 7 (100.0%) | 0 (0.0%) |
| Total (Overall) | 49 (44.6%) | 61 (55.4%) |
Production, Transportation and Moving Occupations
The most common Production, Transportation and Moving occupations in Centerville are , and Transportation (3 | 2.7%).
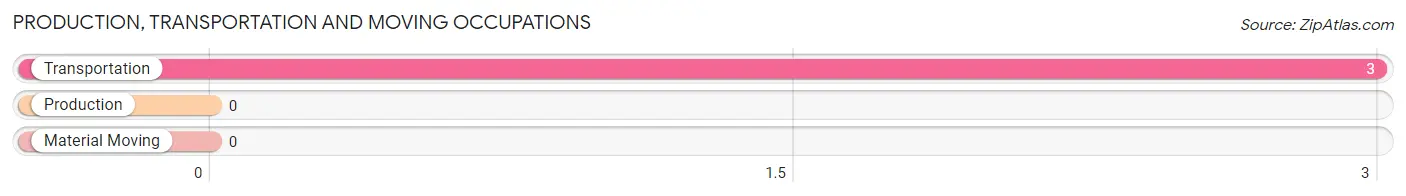
Production, Transportation and Moving Occupations by Sex
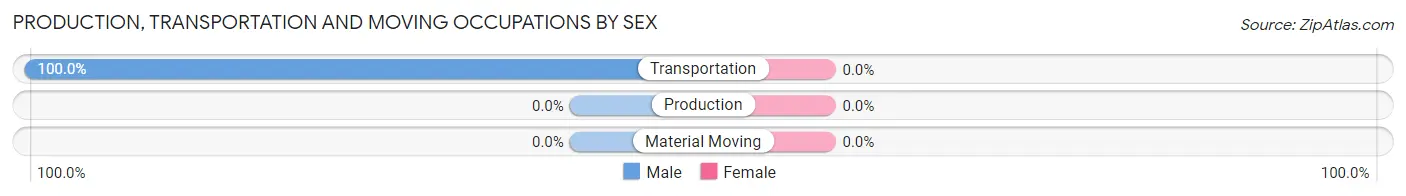
| Occupation | Male | Female |
| Production | 0 (0.0%) | 0 (0.0%) |
| Transportation | 3 (100.0%) | 0 (0.0%) |
| Material Moving | 0 (0.0%) | 0 (0.0%) |
| Total (Category) | 3 (100.0%) | 0 (0.0%) |
| Total (Overall) | 49 (44.6%) | 61 (55.4%) |
Employment Industries by Sex in Centerville
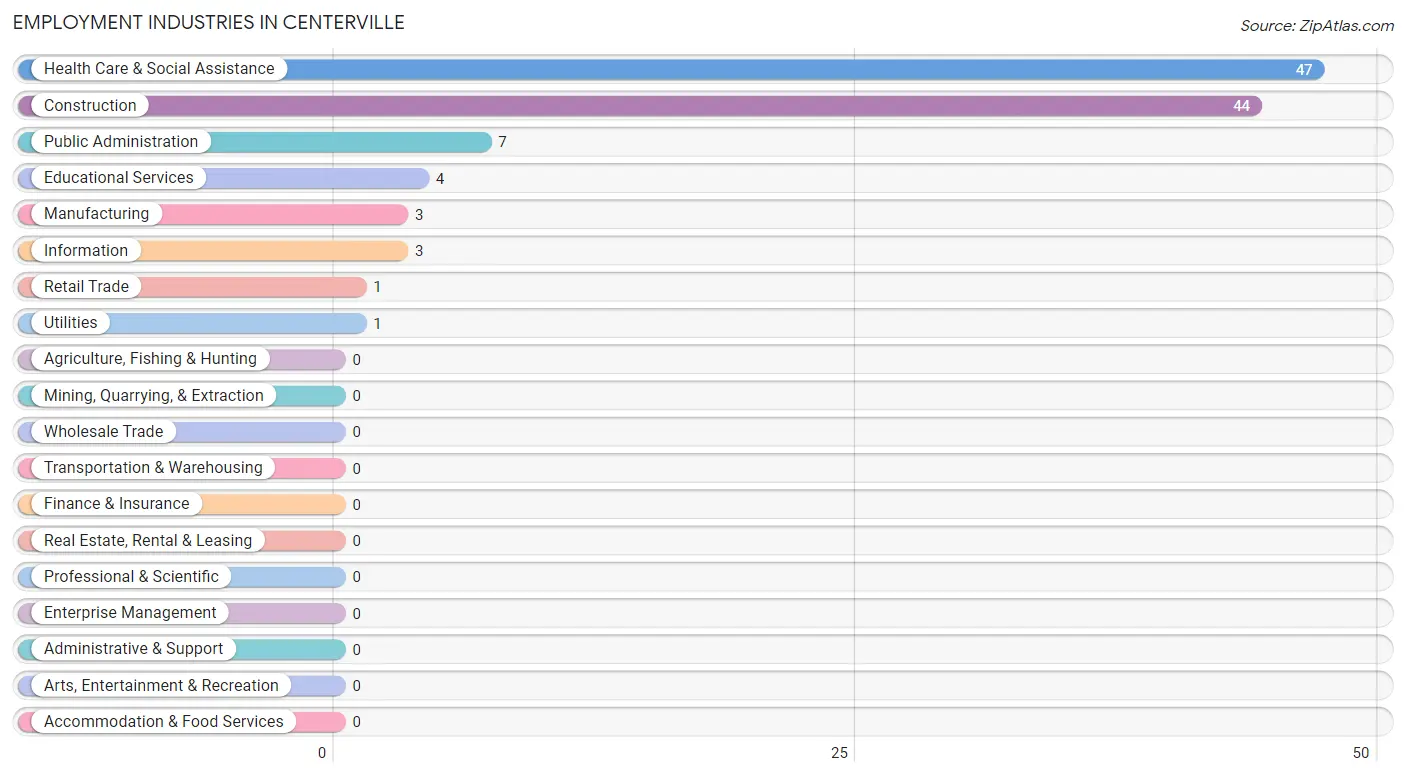
Employment Industries in Centerville
The major employment industries in Centerville include Health Care & Social Assistance (47 | 42.7%), Construction (44 | 40.0%), Public Administration (7 | 6.4%), Educational Services (4 | 3.6%), and Manufacturing (3 | 2.7%).
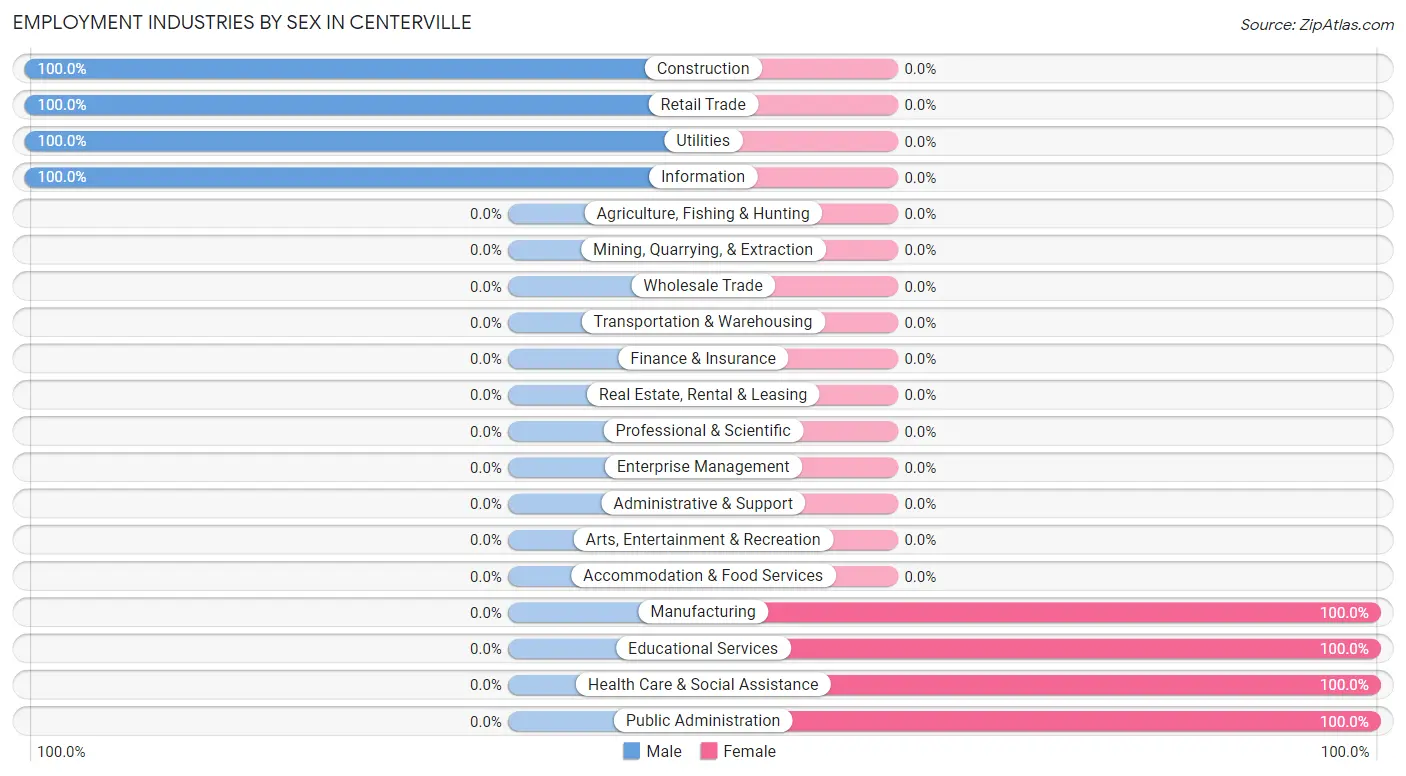
Employment Industries by Sex in Centerville
The Centerville industries that see more men than women are Construction (100.0%), Retail Trade (100.0%), and Utilities (100.0%), whereas the industries that tend to have a higher number of women are Manufacturing (100.0%), Educational Services (100.0%), and Health Care & Social Assistance (100.0%).
| Industry | Male | Female |
| Agriculture, Fishing & Hunting | 0 (0.0%) | 0 (0.0%) |
| Mining, Quarrying, & Extraction | 0 (0.0%) | 0 (0.0%) |
| Construction | 44 (100.0%) | 0 (0.0%) |
| Manufacturing | 0 (0.0%) | 3 (100.0%) |
| Wholesale Trade | 0 (0.0%) | 0 (0.0%) |
| Retail Trade | 1 (100.0%) | 0 (0.0%) |
| Transportation & Warehousing | 0 (0.0%) | 0 (0.0%) |
| Utilities | 1 (100.0%) | 0 (0.0%) |
| Information | 3 (100.0%) | 0 (0.0%) |
| Finance & Insurance | 0 (0.0%) | 0 (0.0%) |
| Real Estate, Rental & Leasing | 0 (0.0%) | 0 (0.0%) |
| Professional & Scientific | 0 (0.0%) | 0 (0.0%) |
| Enterprise Management | 0 (0.0%) | 0 (0.0%) |
| Administrative & Support | 0 (0.0%) | 0 (0.0%) |
| Educational Services | 0 (0.0%) | 4 (100.0%) |
| Health Care & Social Assistance | 0 (0.0%) | 47 (100.0%) |
| Arts, Entertainment & Recreation | 0 (0.0%) | 0 (0.0%) |
| Accommodation & Food Services | 0 (0.0%) | 0 (0.0%) |
| Public Administration | 0 (0.0%) | 7 (100.0%) |
| Total | 49 (44.6%) | 61 (55.4%) |
Education in Centerville
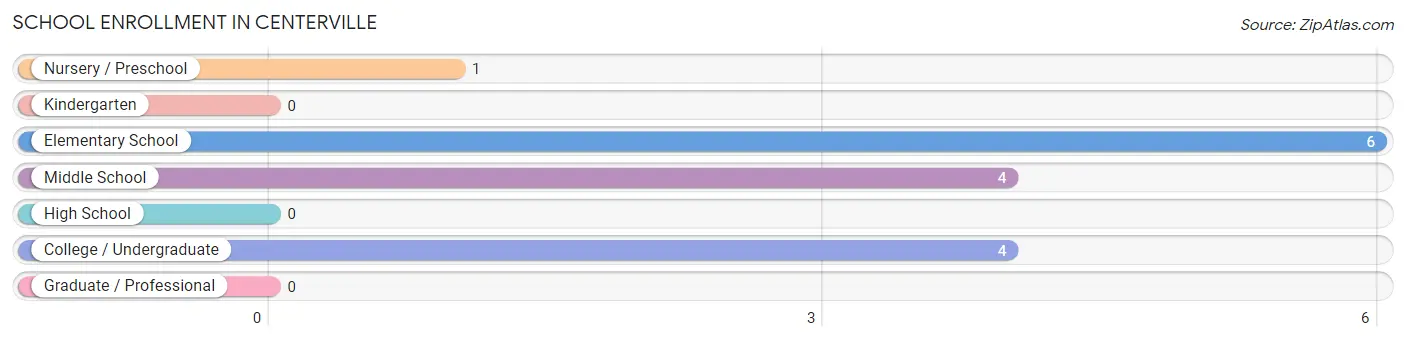
School Enrollment in Centerville
The most common levels of schooling among the 15 students in Centerville are elementary school (6 | 40.0%), middle school (4 | 26.7%), and college / undergraduate (4 | 26.7%).
| School Level | # Students | % Students |
| Nursery / Preschool | 1 | 6.7% |
| Kindergarten | 0 | 0.0% |
| Elementary School | 6 | 40.0% |
| Middle School | 4 | 26.7% |
| High School | 0 | 0.0% |
| College / Undergraduate | 4 | 26.7% |
| Graduate / Professional | 0 | 0.0% |
| Total | 15 | 100.0% |
School Enrollment by Age by Funding Source in Centerville
Out of a total of 15 students who are enrolled in schools in Centerville, 5 (33.3%) attend a private institution, while the remaining 10 (66.7%) are enrolled in public schools. The age group of 3 to 4 year olds has the highest likelihood of being enrolled in private schools, with 1 (100.0% in the age bracket) enrolled. Conversely, the age group of 5 to 9 year old has the lowest likelihood of being enrolled in a private school, with 1 (100.0% in the age bracket) attending a public institution.
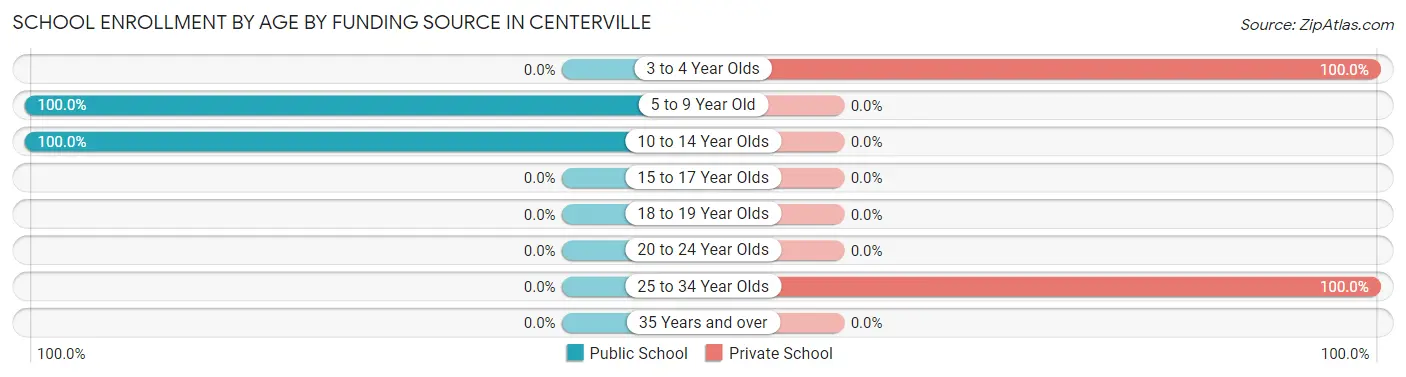
| Age Bracket | Public School | Private School |
| 3 to 4 Year Olds | 0 (0.0%) | 1 (100.0%) |
| 5 to 9 Year Old | 1 (100.0%) | 0 (0.0%) |
| 10 to 14 Year Olds | 9 (100.0%) | 0 (0.0%) |
| 15 to 17 Year Olds | 0 (0.0%) | 0 (0.0%) |
| 18 to 19 Year Olds | 0 (0.0%) | 0 (0.0%) |
| 20 to 24 Year Olds | 0 (0.0%) | 0 (0.0%) |
| 25 to 34 Year Olds | 0 (0.0%) | 4 (100.0%) |
| 35 Years and over | 0 (0.0%) | 0 (0.0%) |
| Total | 10 (66.7%) | 5 (33.3%) |
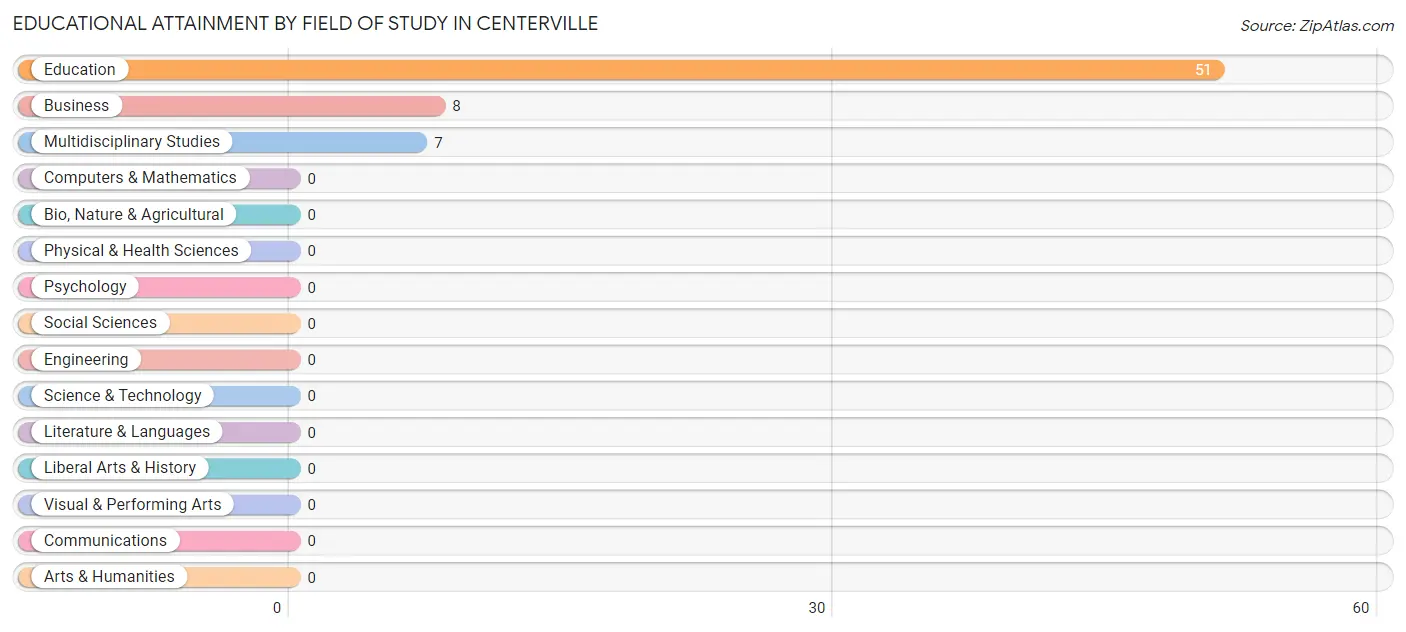
Educational Attainment by Field of Study in Centerville
Education (51 | 77.3%), business (8 | 12.1%), and multidisciplinary studies (7 | 10.6%) are the most common fields of study among 66 individuals in Centerville who have obtained a bachelor's degree or higher.
| Field of Study | # Graduates | % Graduates |
| Computers & Mathematics | 0 | 0.0% |
| Bio, Nature & Agricultural | 0 | 0.0% |
| Physical & Health Sciences | 0 | 0.0% |
| Psychology | 0 | 0.0% |
| Social Sciences | 0 | 0.0% |
| Engineering | 0 | 0.0% |
| Multidisciplinary Studies | 7 | 10.6% |
| Science & Technology | 0 | 0.0% |
| Business | 8 | 12.1% |
| Education | 51 | 77.3% |
| Literature & Languages | 0 | 0.0% |
| Liberal Arts & History | 0 | 0.0% |
| Visual & Performing Arts | 0 | 0.0% |
| Communications | 0 | 0.0% |
| Arts & Humanities | 0 | 0.0% |
| Total | 66 | 100.0% |
Transportation & Commute in Centerville
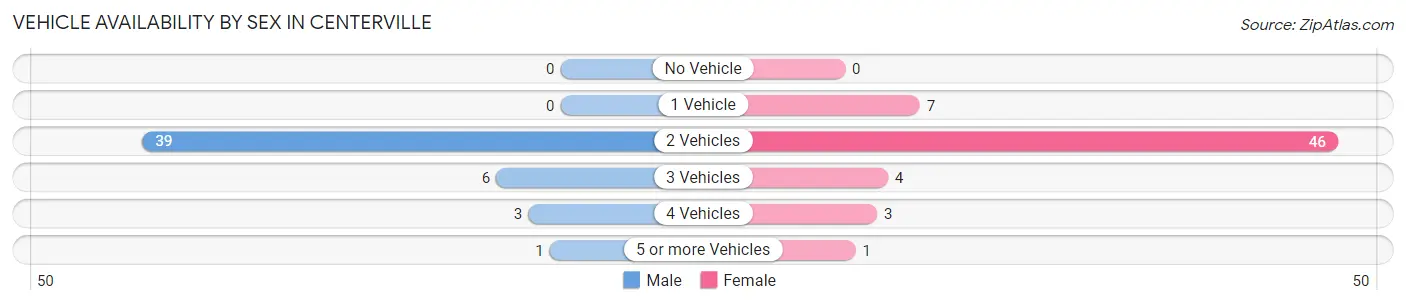
Vehicle Availability by Sex in Centerville
The most prevalent vehicle ownership categories in Centerville are males with 2 vehicles (39, accounting for 79.6%) and females with 2 vehicles (46, making up 63.9%).
| Vehicles Available | Male | Female |
| No Vehicle | 0 (0.0%) | 0 (0.0%) |
| 1 Vehicle | 0 (0.0%) | 7 (11.5%) |
| 2 Vehicles | 39 (79.6%) | 46 (75.4%) |
| 3 Vehicles | 6 (12.2%) | 4 (6.6%) |
| 4 Vehicles | 3 (6.1%) | 3 (4.9%) |
| 5 or more Vehicles | 1 (2.0%) | 1 (1.6%) |
| Total | 49 (100.0%) | 61 (100.0%) |
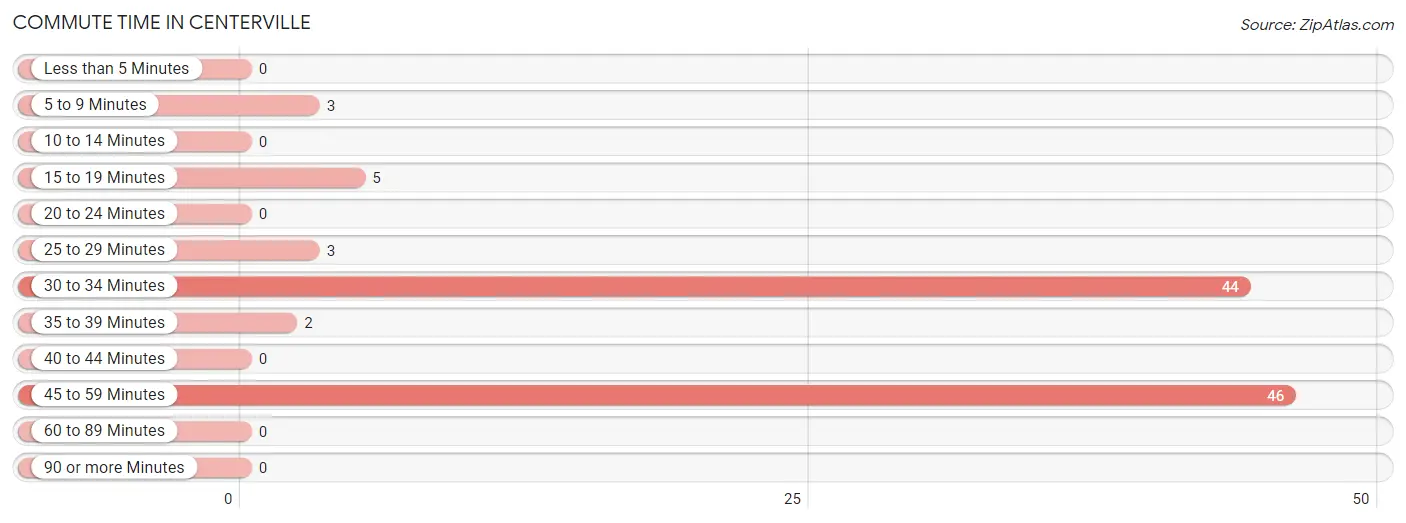
Commute Time in Centerville
The most frequently occuring commute durations in Centerville are 45 to 59 minutes (46 commuters, 44.7%), 30 to 34 minutes (44 commuters, 42.7%), and 15 to 19 minutes (5 commuters, 4.9%).
| Commute Time | # Commuters | % Commuters |
| Less than 5 Minutes | 0 | 0.0% |
| 5 to 9 Minutes | 3 | 2.9% |
| 10 to 14 Minutes | 0 | 0.0% |
| 15 to 19 Minutes | 5 | 4.9% |
| 20 to 24 Minutes | 0 | 0.0% |
| 25 to 29 Minutes | 3 | 2.9% |
| 30 to 34 Minutes | 44 | 42.7% |
| 35 to 39 Minutes | 2 | 1.9% |
| 40 to 44 Minutes | 0 | 0.0% |
| 45 to 59 Minutes | 46 | 44.7% |
| 60 to 89 Minutes | 0 | 0.0% |
| 90 or more Minutes | 0 | 0.0% |
Commute Time by Sex in Centerville
The most common commute times in Centerville are 30 to 34 minutes (44 commuters, 89.8%) for males and 45 to 59 minutes (46 commuters, 85.2%) for females.
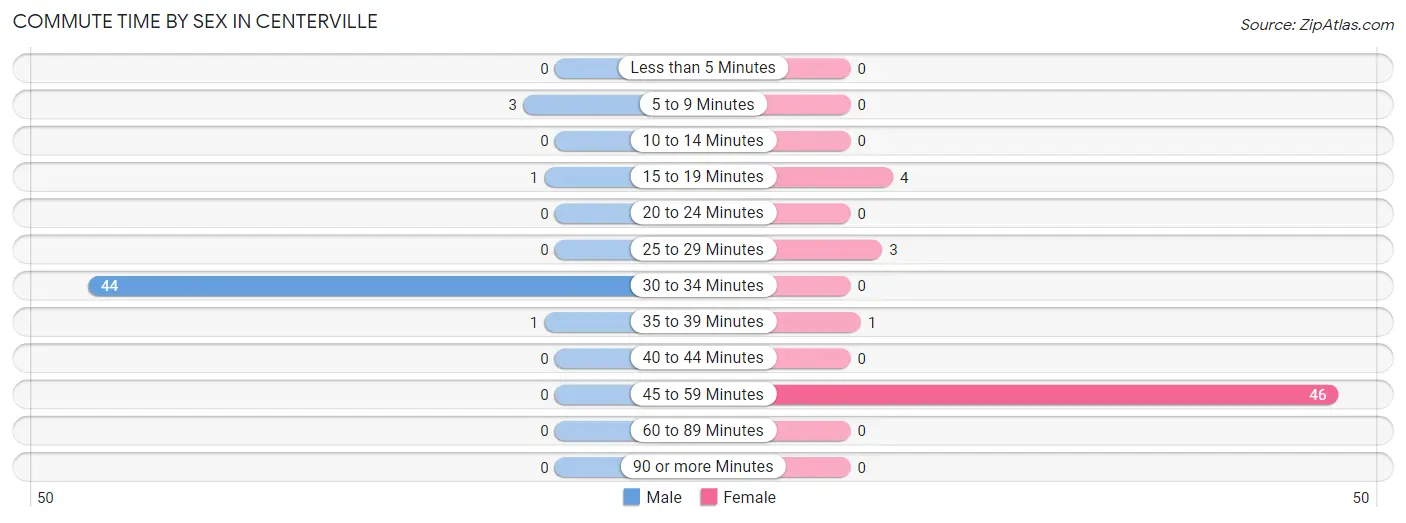
| Commute Time | Male | Female |
| Less than 5 Minutes | 0 (0.0%) | 0 (0.0%) |
| 5 to 9 Minutes | 3 (6.1%) | 0 (0.0%) |
| 10 to 14 Minutes | 0 (0.0%) | 0 (0.0%) |
| 15 to 19 Minutes | 1 (2.0%) | 4 (7.4%) |
| 20 to 24 Minutes | 0 (0.0%) | 0 (0.0%) |
| 25 to 29 Minutes | 0 (0.0%) | 3 (5.6%) |
| 30 to 34 Minutes | 44 (89.8%) | 0 (0.0%) |
| 35 to 39 Minutes | 1 (2.0%) | 1 (1.8%) |
| 40 to 44 Minutes | 0 (0.0%) | 0 (0.0%) |
| 45 to 59 Minutes | 0 (0.0%) | 46 (85.2%) |
| 60 to 89 Minutes | 0 (0.0%) | 0 (0.0%) |
| 90 or more Minutes | 0 (0.0%) | 0 (0.0%) |
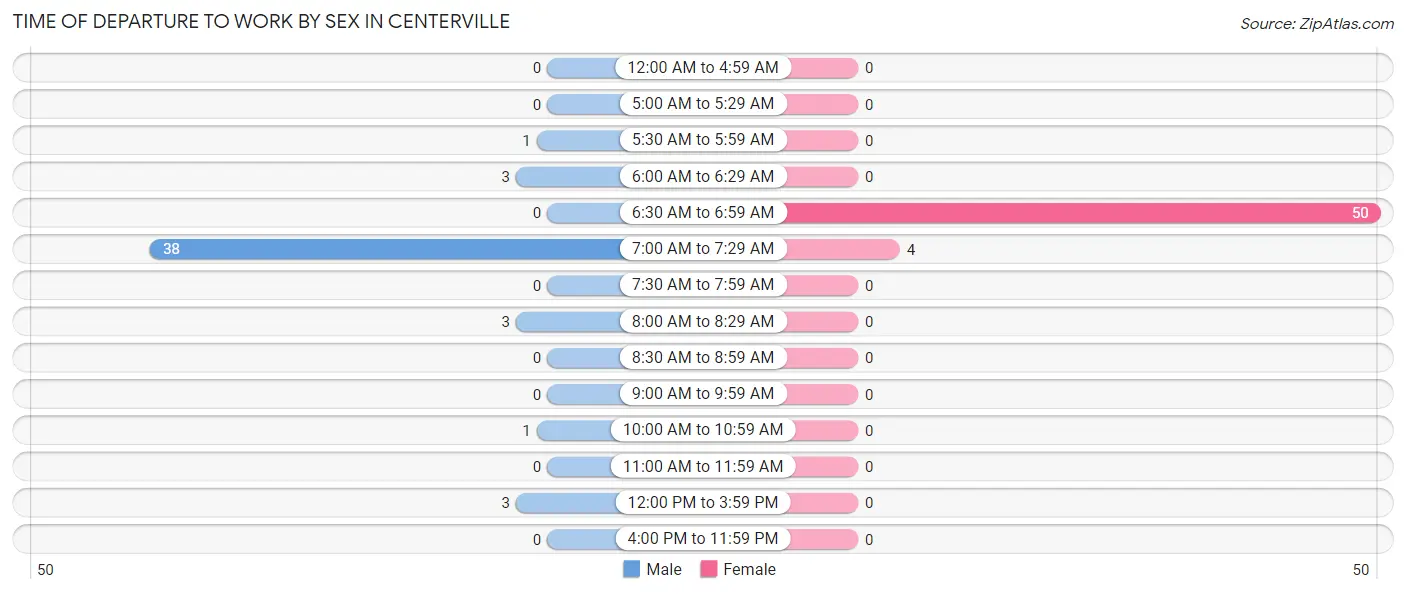
Time of Departure to Work by Sex in Centerville
The most frequent times of departure to work in Centerville are 7:00 AM to 7:29 AM (38, 77.5%) for males and 6:30 AM to 6:59 AM (50, 92.6%) for females.
| Time of Departure | Male | Female |
| 12:00 AM to 4:59 AM | 0 (0.0%) | 0 (0.0%) |
| 5:00 AM to 5:29 AM | 0 (0.0%) | 0 (0.0%) |
| 5:30 AM to 5:59 AM | 1 (2.0%) | 0 (0.0%) |
| 6:00 AM to 6:29 AM | 3 (6.1%) | 0 (0.0%) |
| 6:30 AM to 6:59 AM | 0 (0.0%) | 50 (92.6%) |
| 7:00 AM to 7:29 AM | 38 (77.5%) | 4 (7.4%) |
| 7:30 AM to 7:59 AM | 0 (0.0%) | 0 (0.0%) |
| 8:00 AM to 8:29 AM | 3 (6.1%) | 0 (0.0%) |
| 8:30 AM to 8:59 AM | 0 (0.0%) | 0 (0.0%) |
| 9:00 AM to 9:59 AM | 0 (0.0%) | 0 (0.0%) |
| 10:00 AM to 10:59 AM | 1 (2.0%) | 0 (0.0%) |
| 11:00 AM to 11:59 AM | 0 (0.0%) | 0 (0.0%) |
| 12:00 PM to 3:59 PM | 3 (6.1%) | 0 (0.0%) |
| 4:00 PM to 11:59 PM | 0 (0.0%) | 0 (0.0%) |
| Total | 49 (100.0%) | 54 (100.0%) |
Housing Occupancy in Centerville
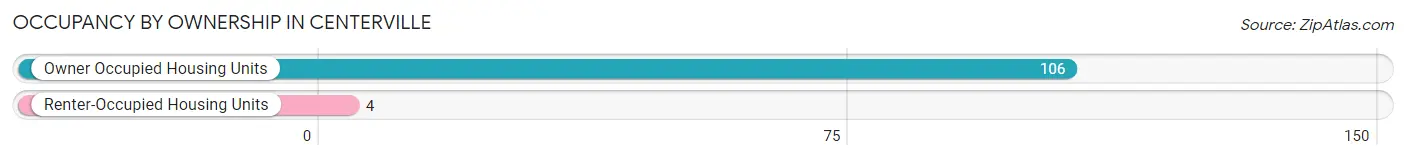
Occupancy by Ownership in Centerville
Of the total 110 dwellings in Centerville, owner-occupied units account for 106 (96.4%), while renter-occupied units make up 4 (3.6%).
| Occupancy | # Housing Units | % Housing Units |
| Owner Occupied Housing Units | 106 | 96.4% |
| Renter-Occupied Housing Units | 4 | 3.6% |
| Total Occupied Housing Units | 110 | 100.0% |
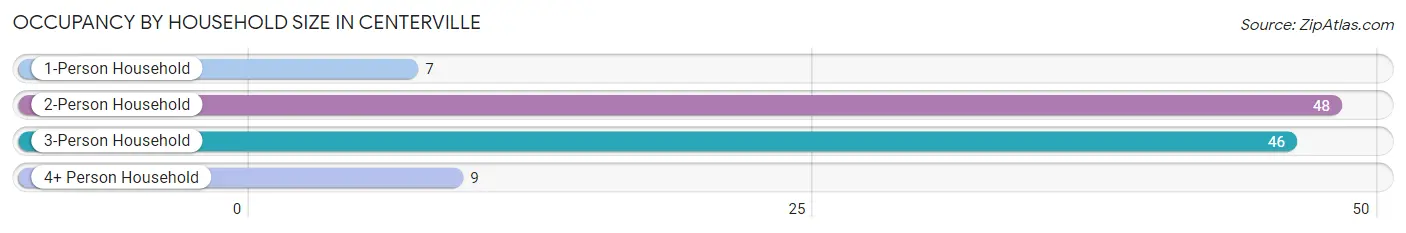
Occupancy by Household Size in Centerville
| Household Size | # Housing Units | % Housing Units |
| 1-Person Household | 7 | 6.4% |
| 2-Person Household | 48 | 43.6% |
| 3-Person Household | 46 | 41.8% |
| 4+ Person Household | 9 | 8.2% |
| Total Housing Units | 110 | 100.0% |
Occupancy by Ownership by Household Size in Centerville
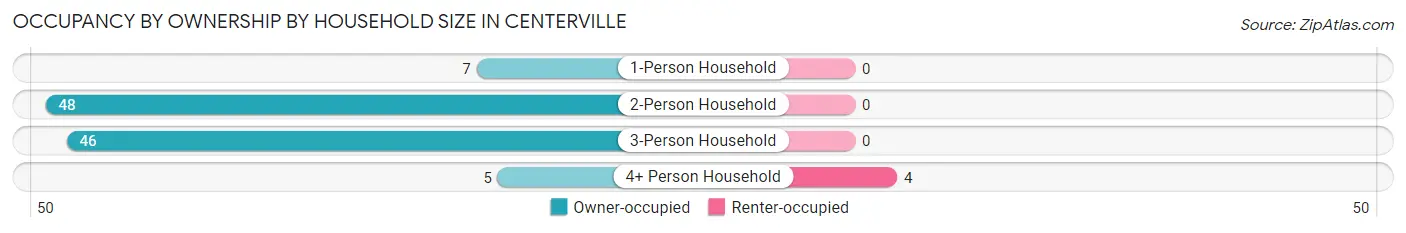
| Household Size | Owner-occupied | Renter-occupied |
| 1-Person Household | 7 (100.0%) | 0 (0.0%) |
| 2-Person Household | 48 (100.0%) | 0 (0.0%) |
| 3-Person Household | 46 (100.0%) | 0 (0.0%) |
| 4+ Person Household | 5 (55.6%) | 4 (44.4%) |
| Total Housing Units | 106 (96.4%) | 4 (3.6%) |
Occupancy by Educational Attainment in Centerville
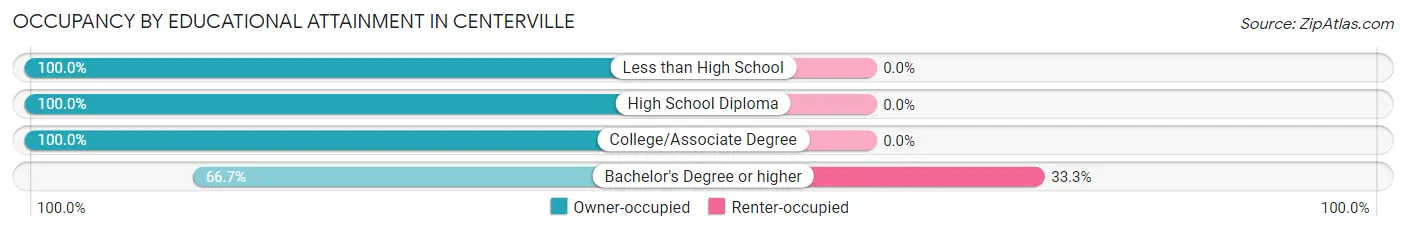
| Household Size | Owner-occupied | Renter-occupied |
| Less than High School | 4 (100.0%) | 0 (0.0%) |
| High School Diploma | 4 (100.0%) | 0 (0.0%) |
| College/Associate Degree | 90 (100.0%) | 0 (0.0%) |
| Bachelor's Degree or higher | 8 (66.7%) | 4 (33.3%) |
Occupancy by Age of Householder in Centerville
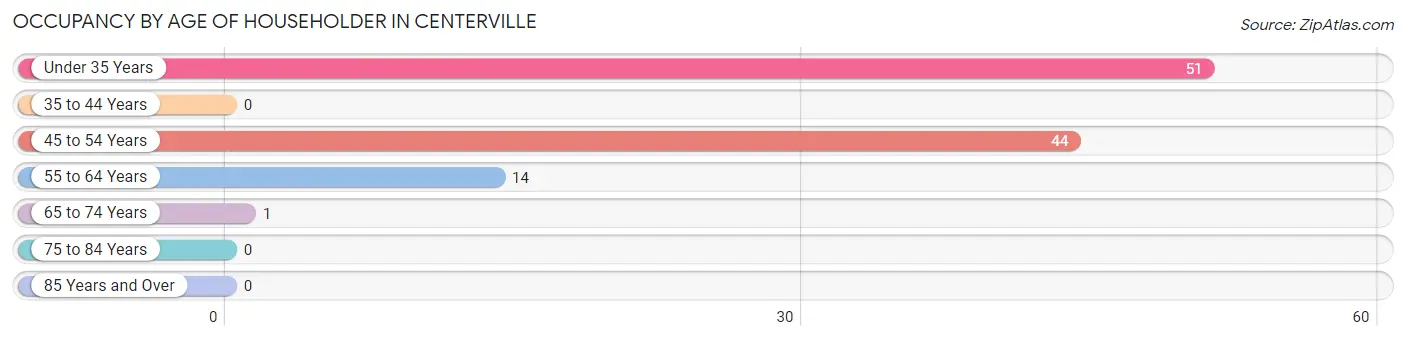
| Age Bracket | # Households | % Households |
| Under 35 Years | 51 | 46.4% |
| 35 to 44 Years | 0 | 0.0% |
| 45 to 54 Years | 44 | 40.0% |
| 55 to 64 Years | 14 | 12.7% |
| 65 to 74 Years | 1 | 0.9% |
| 75 to 84 Years | 0 | 0.0% |
| 85 Years and Over | 0 | 0.0% |
| Total | 110 | 100.0% |
Housing Finances in Centerville
Median Income by Occupancy in Centerville
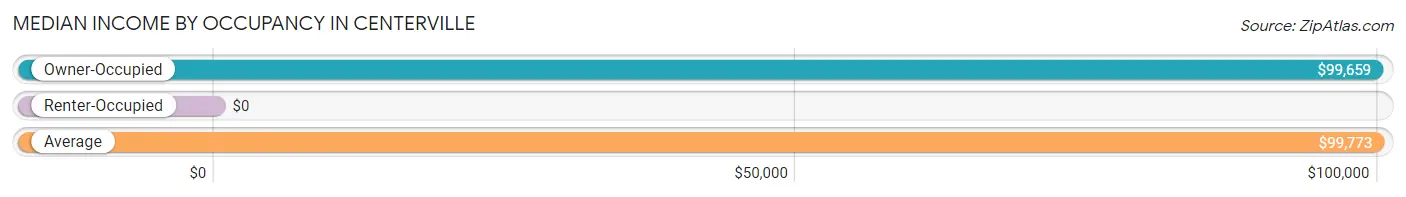
| Occupancy Type | # Households | Median Income |
| Owner-Occupied | 106 (96.4%) | $99,659 |
| Renter-Occupied | 4 (3.6%) | $0 |
| Average | 110 (100.0%) | $99,773 |
Occupancy by Householder Income Bracket in Centerville
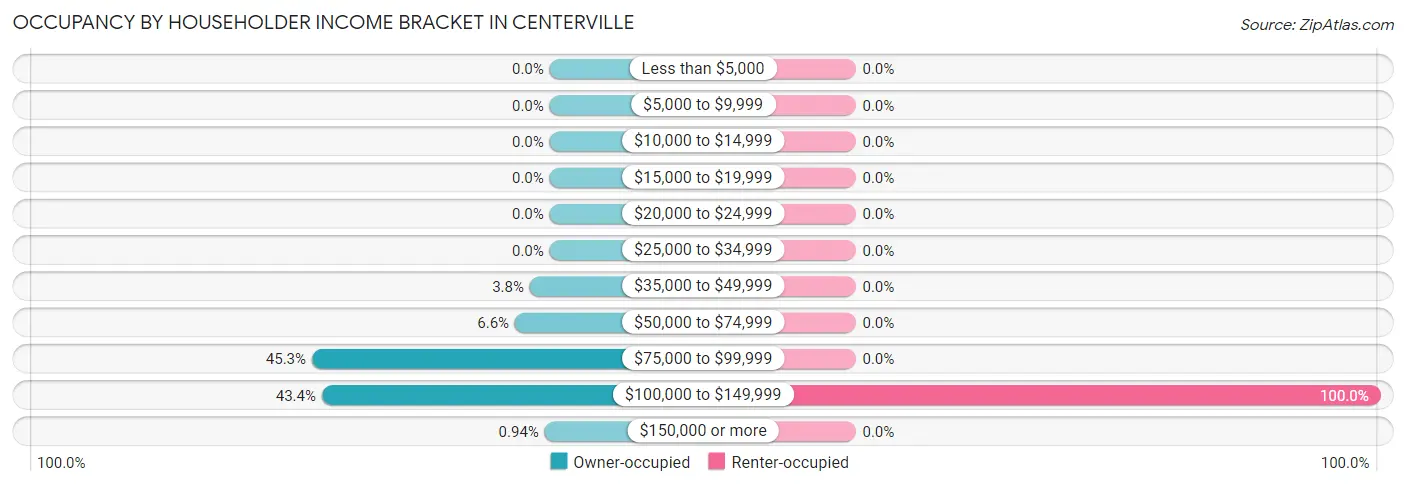
| Income Bracket | Owner-occupied | Renter-occupied |
| Less than $5,000 | 0 (0.0%) | 0 (0.0%) |
| $5,000 to $9,999 | 0 (0.0%) | 0 (0.0%) |
| $10,000 to $14,999 | 0 (0.0%) | 0 (0.0%) |
| $15,000 to $19,999 | 0 (0.0%) | 0 (0.0%) |
| $20,000 to $24,999 | 0 (0.0%) | 0 (0.0%) |
| $25,000 to $34,999 | 0 (0.0%) | 0 (0.0%) |
| $35,000 to $49,999 | 4 (3.8%) | 0 (0.0%) |
| $50,000 to $74,999 | 7 (6.6%) | 0 (0.0%) |
| $75,000 to $99,999 | 48 (45.3%) | 0 (0.0%) |
| $100,000 to $149,999 | 46 (43.4%) | 4 (100.0%) |
| $150,000 or more | 1 (0.9%) | 0 (0.0%) |
| Total | 106 (100.0%) | 4 (100.0%) |
Monthly Housing Cost Tiers in Centerville
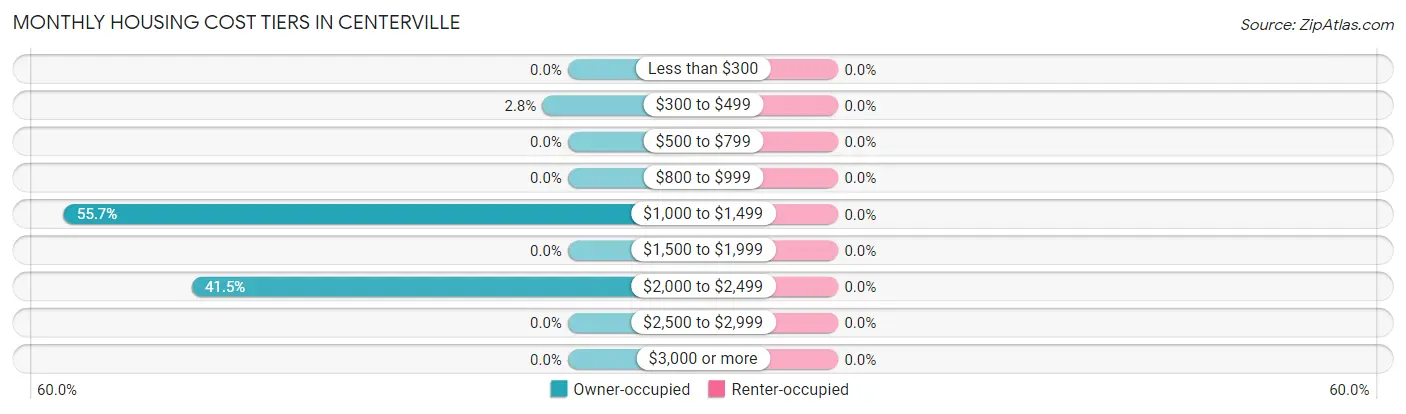
| Monthly Cost | Owner-occupied | Renter-occupied |
| Less than $300 | 0 (0.0%) | 0 (0.0%) |
| $300 to $499 | 3 (2.8%) | 0 (0.0%) |
| $500 to $799 | 0 (0.0%) | 0 (0.0%) |
| $800 to $999 | 0 (0.0%) | 0 (0.0%) |
| $1,000 to $1,499 | 59 (55.7%) | 0 (0.0%) |
| $1,500 to $1,999 | 0 (0.0%) | 0 (0.0%) |
| $2,000 to $2,499 | 44 (41.5%) | 0 (0.0%) |
| $2,500 to $2,999 | 0 (0.0%) | 0 (0.0%) |
| $3,000 or more | 0 (0.0%) | 0 (0.0%) |
| Total | 106 (100.0%) | 4 (100.0%) |
Physical Housing Characteristics in Centerville
Housing Structures in Centerville
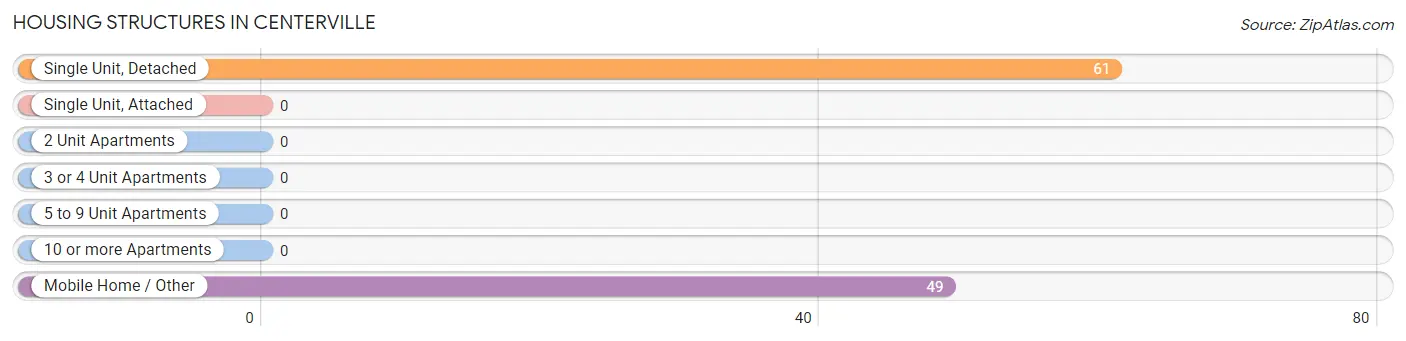
| Structure Type | # Housing Units | % Housing Units |
| Single Unit, Detached | 61 | 55.4% |
| Single Unit, Attached | 0 | 0.0% |
| 2 Unit Apartments | 0 | 0.0% |
| 3 or 4 Unit Apartments | 0 | 0.0% |
| 5 to 9 Unit Apartments | 0 | 0.0% |
| 10 or more Apartments | 0 | 0.0% |
| Mobile Home / Other | 49 | 44.6% |
| Total | 110 | 100.0% |
Housing Structures by Occupancy in Centerville
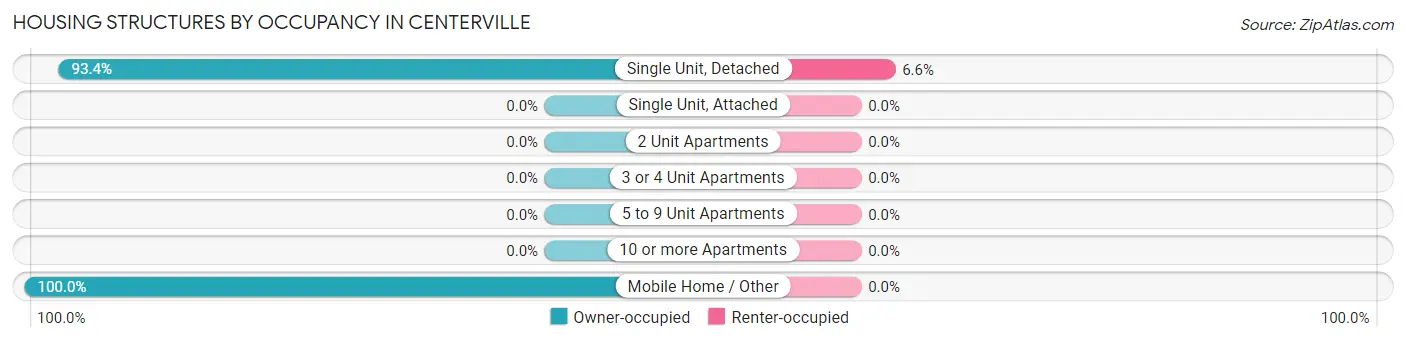
| Structure Type | Owner-occupied | Renter-occupied |
| Single Unit, Detached | 57 (93.4%) | 4 (6.6%) |
| Single Unit, Attached | 0 (0.0%) | 0 (0.0%) |
| 2 Unit Apartments | 0 (0.0%) | 0 (0.0%) |
| 3 or 4 Unit Apartments | 0 (0.0%) | 0 (0.0%) |
| 5 to 9 Unit Apartments | 0 (0.0%) | 0 (0.0%) |
| 10 or more Apartments | 0 (0.0%) | 0 (0.0%) |
| Mobile Home / Other | 49 (100.0%) | 0 (0.0%) |
| Total | 106 (96.4%) | 4 (3.6%) |
Housing Structures by Number of Rooms in Centerville
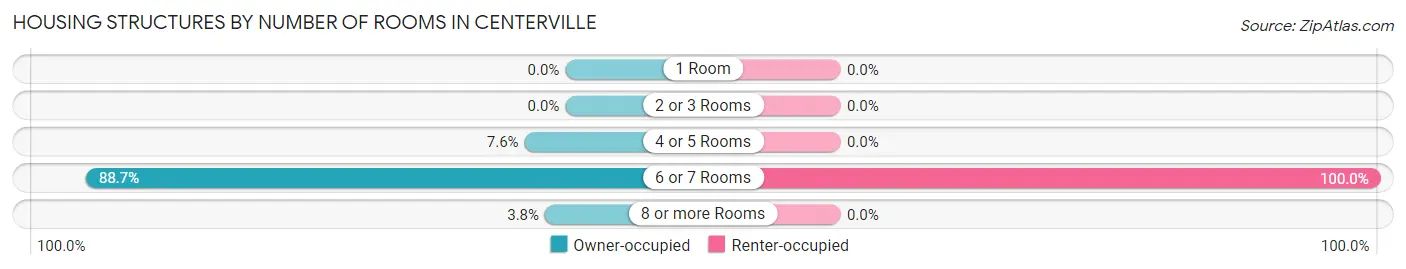
| Number of Rooms | Owner-occupied | Renter-occupied |
| 1 Room | 0 (0.0%) | 0 (0.0%) |
| 2 or 3 Rooms | 0 (0.0%) | 0 (0.0%) |
| 4 or 5 Rooms | 8 (7.5%) | 0 (0.0%) |
| 6 or 7 Rooms | 94 (88.7%) | 4 (100.0%) |
| 8 or more Rooms | 4 (3.8%) | 0 (0.0%) |
| Total | 106 (100.0%) | 4 (100.0%) |
Housing Structure by Heating Type in Centerville
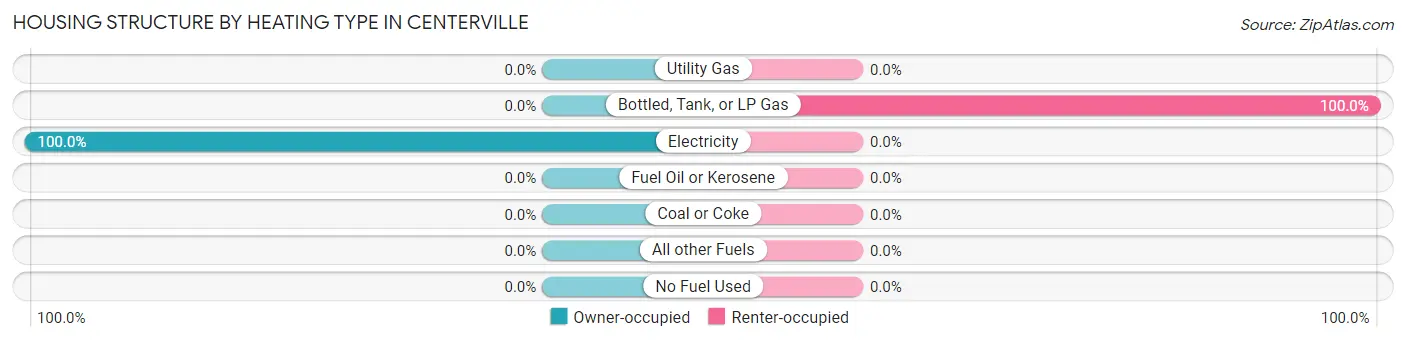
| Heating Type | Owner-occupied | Renter-occupied |
| Utility Gas | 0 (0.0%) | 0 (0.0%) |
| Bottled, Tank, or LP Gas | 0 (0.0%) | 4 (100.0%) |
| Electricity | 106 (100.0%) | 0 (0.0%) |
| Fuel Oil or Kerosene | 0 (0.0%) | 0 (0.0%) |
| Coal or Coke | 0 (0.0%) | 0 (0.0%) |
| All other Fuels | 0 (0.0%) | 0 (0.0%) |
| No Fuel Used | 0 (0.0%) | 0 (0.0%) |
| Total | 106 (100.0%) | 4 (100.0%) |
Household Vehicle Usage in Centerville
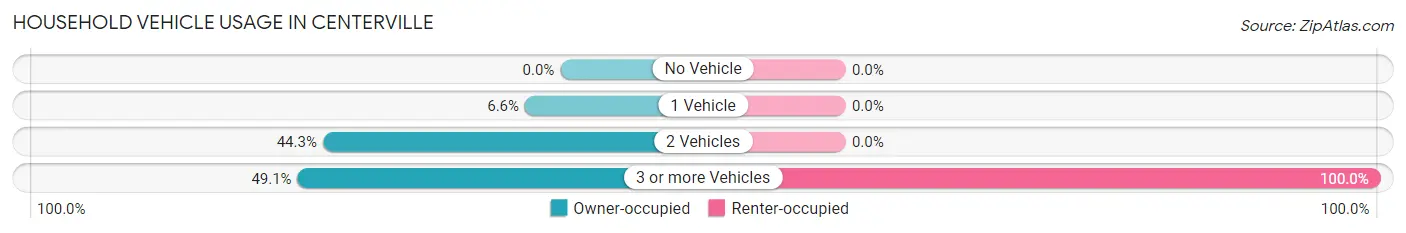
| Vehicles per Household | Owner-occupied | Renter-occupied |
| No Vehicle | 0 (0.0%) | 0 (0.0%) |
| 1 Vehicle | 7 (6.6%) | 0 (0.0%) |
| 2 Vehicles | 47 (44.3%) | 0 (0.0%) |
| 3 or more Vehicles | 52 (49.1%) | 4 (100.0%) |
| Total | 106 (100.0%) | 4 (100.0%) |
Real Estate & Mortgages in Centerville
Real Estate and Mortgage Overview in Centerville
| Characteristic | Without Mortgage | With Mortgage |
| Housing Units | 3 | 103 |
| Median Property Value | - | - |
| Median Household Income | - | - |
| Monthly Housing Costs | - | - |
| Real Estate Taxes | - | - |
Property Value by Mortgage Status in Centerville
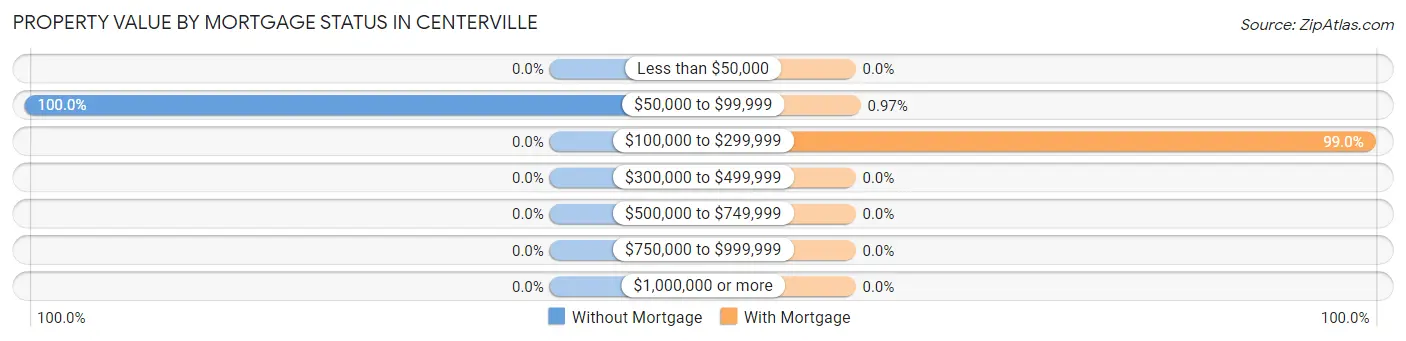
| Property Value | Without Mortgage | With Mortgage |
| Less than $50,000 | 0 (0.0%) | 0 (0.0%) |
| $50,000 to $99,999 | 3 (100.0%) | 1 (1.0%) |
| $100,000 to $299,999 | 0 (0.0%) | 102 (99.0%) |
| $300,000 to $499,999 | 0 (0.0%) | 0 (0.0%) |
| $500,000 to $749,999 | 0 (0.0%) | 0 (0.0%) |
| $750,000 to $999,999 | 0 (0.0%) | 0 (0.0%) |
| $1,000,000 or more | 0 (0.0%) | 0 (0.0%) |
| Total | 3 (100.0%) | 103 (100.0%) |
Household Income by Mortgage Status in Centerville
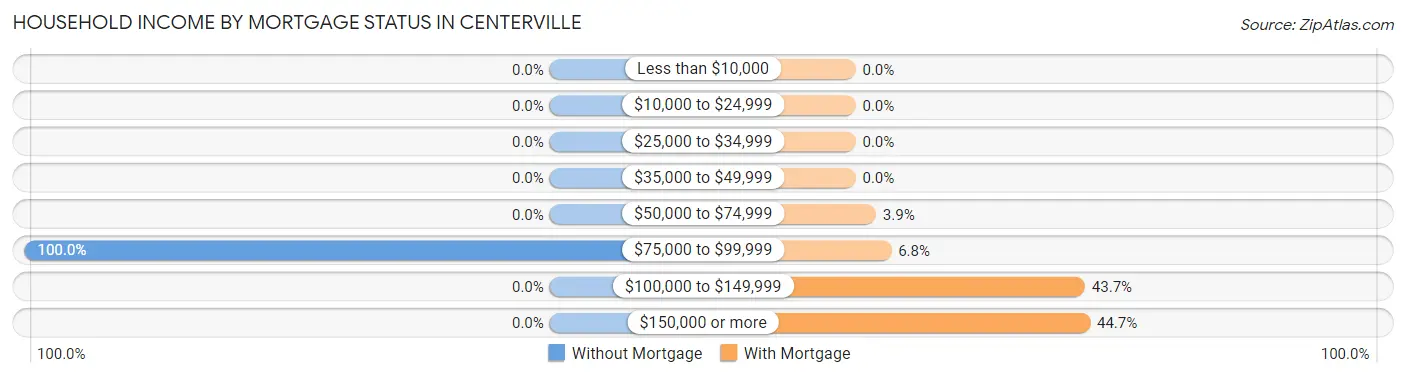
| Household Income | Without Mortgage | With Mortgage |
| Less than $10,000 | 0 (0.0%) | 0 (0.0%) |
| $10,000 to $24,999 | 0 (0.0%) | 0 (0.0%) |
| $25,000 to $34,999 | 0 (0.0%) | 0 (0.0%) |
| $35,000 to $49,999 | 0 (0.0%) | 0 (0.0%) |
| $50,000 to $74,999 | 0 (0.0%) | 4 (3.9%) |
| $75,000 to $99,999 | 3 (100.0%) | 7 (6.8%) |
| $100,000 to $149,999 | 0 (0.0%) | 45 (43.7%) |
| $150,000 or more | 0 (0.0%) | 46 (44.7%) |
| Total | 3 (100.0%) | 103 (100.0%) |
Property Value to Household Income Ratio in Centerville
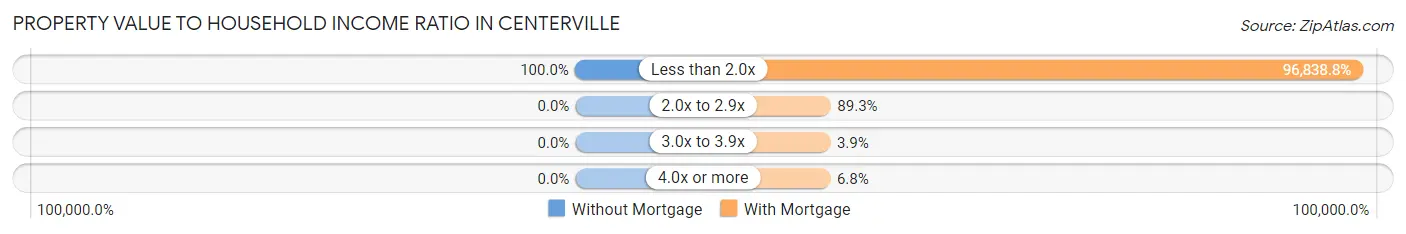
| Value-to-Income Ratio | Without Mortgage | With Mortgage |
| Less than 2.0x | 3 (100.0%) | 99,744 (96,838.8%) |
| 2.0x to 2.9x | 0 (0.0%) | 92 (89.3%) |
| 3.0x to 3.9x | 0 (0.0%) | 4 (3.9%) |
| 4.0x or more | 0 (0.0%) | 7 (6.8%) |
| Total | 3 (100.0%) | 103 (100.0%) |
Real Estate Taxes by Mortgage Status in Centerville
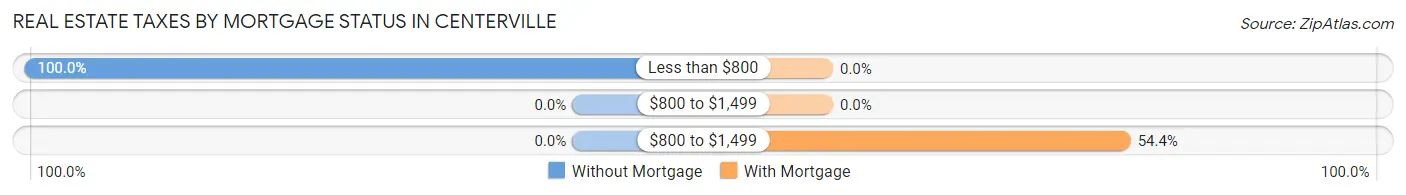
| Property Taxes | Without Mortgage | With Mortgage |
| Less than $800 | 3 (100.0%) | 0 (0.0%) |
| $800 to $1,499 | 0 (0.0%) | 0 (0.0%) |
| $800 to $1,499 | 0 (0.0%) | 56 (54.4%) |
| Total | 3 (100.0%) | 103 (100.0%) |
Health & Disability in Centerville
Health Insurance Coverage by Age in Centerville
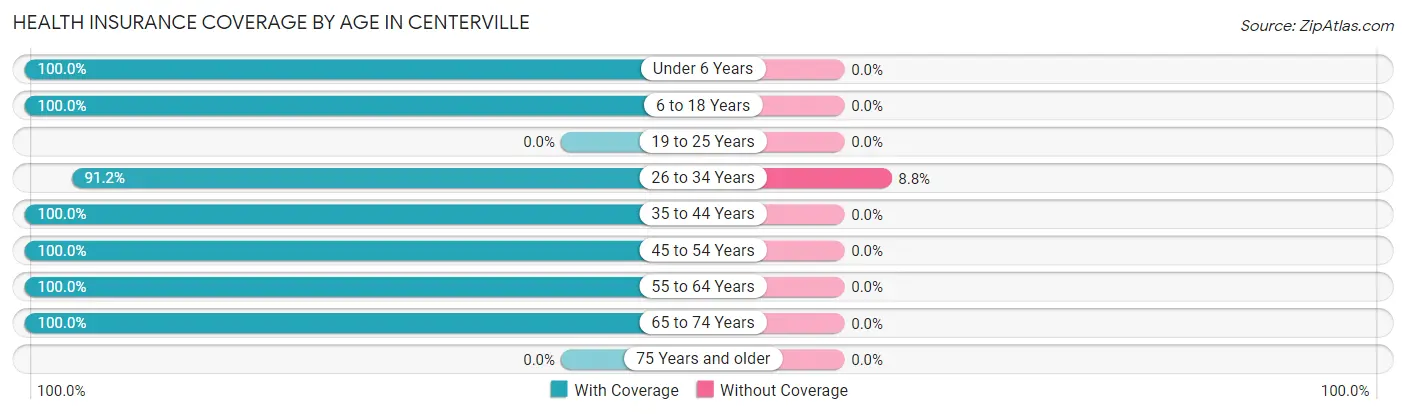
| Age Bracket | With Coverage | Without Coverage |
| Under 6 Years | 38 (100.0%) | 0 (0.0%) |
| 6 to 18 Years | 10 (100.0%) | 0 (0.0%) |
| 19 to 25 Years | 0 (0.0%) | 0 (0.0%) |
| 26 to 34 Years | 52 (91.2%) | 5 (8.8%) |
| 35 to 44 Years | 41 (100.0%) | 0 (0.0%) |
| 45 to 54 Years | 47 (100.0%) | 0 (0.0%) |
| 55 to 64 Years | 65 (100.0%) | 0 (0.0%) |
| 65 to 74 Years | 3 (100.0%) | 0 (0.0%) |
| 75 Years and older | 0 (0.0%) | 0 (0.0%) |
| Total | 256 (98.1%) | 5 (1.9%) |
Health Insurance Coverage by Citizenship Status in Centerville

| Citizenship Status | With Coverage | Without Coverage |
| Native Born | 38 (100.0%) | 0 (0.0%) |
| Foreign Born, Citizen | 10 (100.0%) | 0 (0.0%) |
| Foreign Born, not a Citizen | 0 (0.0%) | 0 (0.0%) |
Health Insurance Coverage by Household Income in Centerville
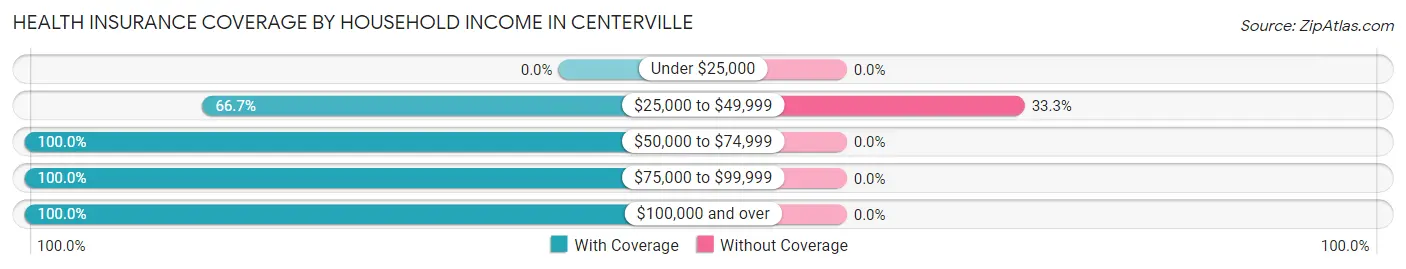
| Household Income | With Coverage | Without Coverage |
| Under $25,000 | 0 (0.0%) | 0 (0.0%) |
| $25,000 to $49,999 | 10 (66.7%) | 5 (33.3%) |
| $50,000 to $74,999 | 7 (100.0%) | 0 (0.0%) |
| $75,000 to $99,999 | 99 (100.0%) | 0 (0.0%) |
| $100,000 and over | 140 (100.0%) | 0 (0.0%) |
Public vs Private Health Insurance Coverage by Age in Centerville
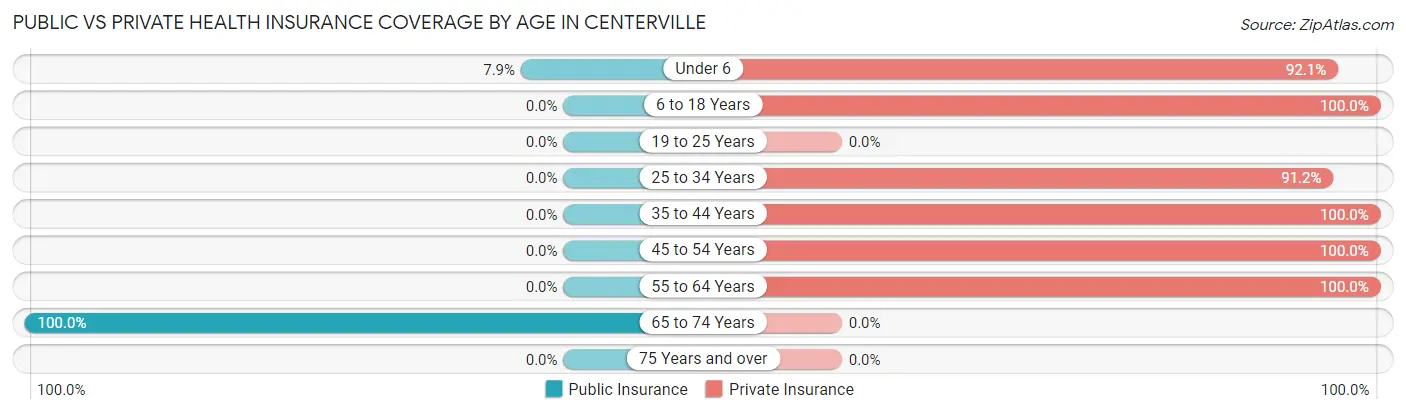
| Age Bracket | Public Insurance | Private Insurance |
| Under 6 | 3 (7.9%) | 35 (92.1%) |
| 6 to 18 Years | 0 (0.0%) | 10 (100.0%) |
| 19 to 25 Years | 0 (0.0%) | 0 (0.0%) |
| 25 to 34 Years | 0 (0.0%) | 52 (91.2%) |
| 35 to 44 Years | 0 (0.0%) | 41 (100.0%) |
| 45 to 54 Years | 0 (0.0%) | 47 (100.0%) |
| 55 to 64 Years | 0 (0.0%) | 65 (100.0%) |
| 65 to 74 Years | 3 (100.0%) | 0 (0.0%) |
| 75 Years and over | 0 (0.0%) | 0 (0.0%) |
| Total | 6 (2.3%) | 250 (95.8%) |
Disability Status by Sex by Age in Centerville
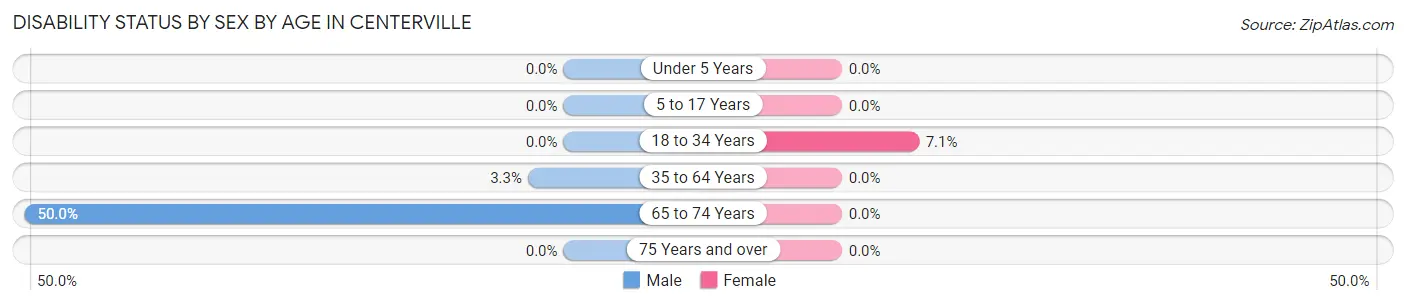
| Age Bracket | Male | Female |
| Under 5 Years | 0 (0.0%) | 0 (0.0%) |
| 5 to 17 Years | 0 (0.0%) | 0 (0.0%) |
| 18 to 34 Years | 0 (0.0%) | 4 (7.1%) |
| 35 to 64 Years | 3 (3.3%) | 0 (0.0%) |
| 65 to 74 Years | 1 (50.0%) | 0 (0.0%) |
| 75 Years and over | 0 (0.0%) | 0 (0.0%) |
Disability Class by Sex by Age in Centerville
Disability Class: Hearing Difficulty
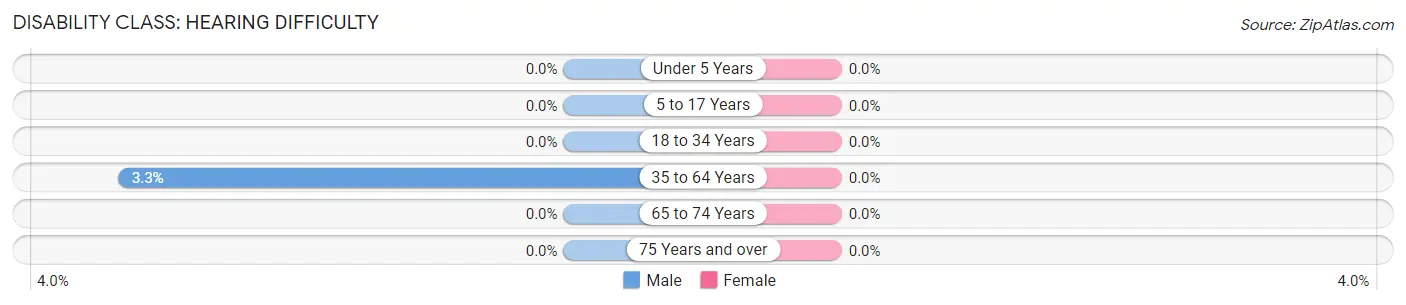
| Age Bracket | Male | Female |
| Under 5 Years | 0 (0.0%) | 0 (0.0%) |
| 5 to 17 Years | 0 (0.0%) | 0 (0.0%) |
| 18 to 34 Years | 0 (0.0%) | 0 (0.0%) |
| 35 to 64 Years | 3 (3.3%) | 0 (0.0%) |
| 65 to 74 Years | 0 (0.0%) | 0 (0.0%) |
| 75 Years and over | 0 (0.0%) | 0 (0.0%) |
Disability Class: Vision Difficulty
| Age Bracket | Male | Female |
| Under 5 Years | 0 (0.0%) | 0 (0.0%) |
| 5 to 17 Years | 0 (0.0%) | 0 (0.0%) |
| 18 to 34 Years | 0 (0.0%) | 0 (0.0%) |
| 35 to 64 Years | 0 (0.0%) | 0 (0.0%) |
| 65 to 74 Years | 0 (0.0%) | 0 (0.0%) |
| 75 Years and over | 0 (0.0%) | 0 (0.0%) |
Disability Class: Cognitive Difficulty
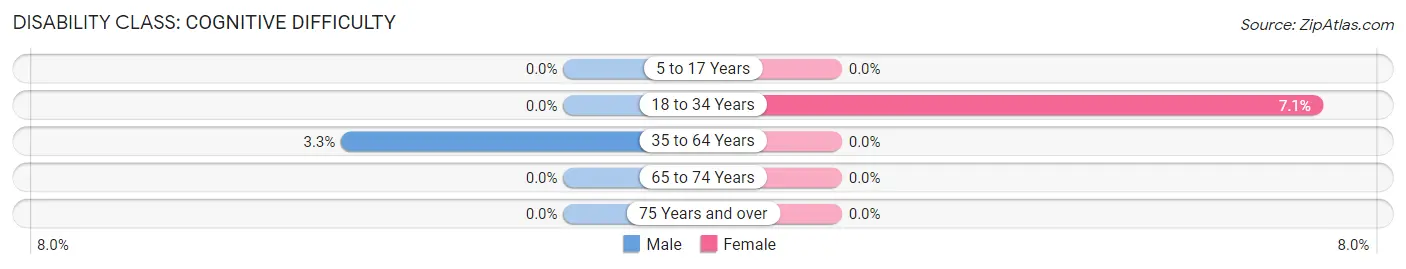
| Age Bracket | Male | Female |
| 5 to 17 Years | 0 (0.0%) | 0 (0.0%) |
| 18 to 34 Years | 0 (0.0%) | 4 (7.1%) |
| 35 to 64 Years | 3 (3.3%) | 0 (0.0%) |
| 65 to 74 Years | 0 (0.0%) | 0 (0.0%) |
| 75 Years and over | 0 (0.0%) | 0 (0.0%) |
Disability Class: Ambulatory Difficulty
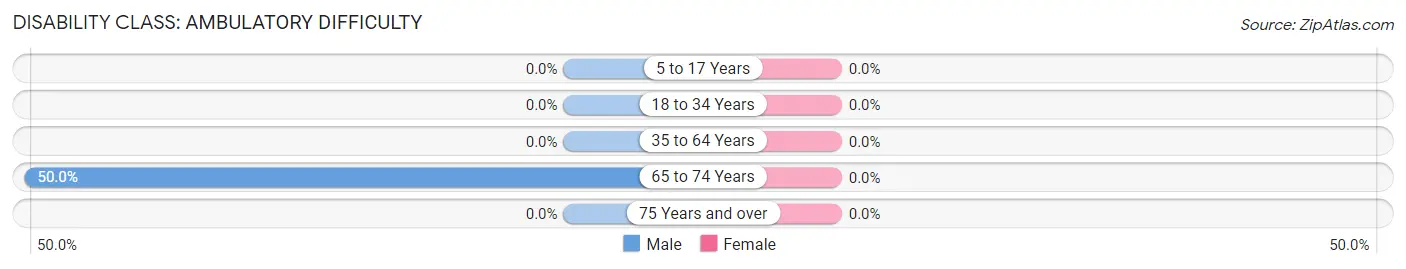
| Age Bracket | Male | Female |
| 5 to 17 Years | 0 (0.0%) | 0 (0.0%) |
| 18 to 34 Years | 0 (0.0%) | 0 (0.0%) |
| 35 to 64 Years | 0 (0.0%) | 0 (0.0%) |
| 65 to 74 Years | 1 (50.0%) | 0 (0.0%) |
| 75 Years and over | 0 (0.0%) | 0 (0.0%) |
Disability Class: Self-Care Difficulty
| Age Bracket | Male | Female |
| 5 to 17 Years | 0 (0.0%) | 0 (0.0%) |
| 18 to 34 Years | 0 (0.0%) | 0 (0.0%) |
| 35 to 64 Years | 0 (0.0%) | 0 (0.0%) |
| 65 to 74 Years | 0 (0.0%) | 0 (0.0%) |
| 75 Years and over | 0 (0.0%) | 0 (0.0%) |
Technology Access in Centerville
Computing Device Access in Centerville
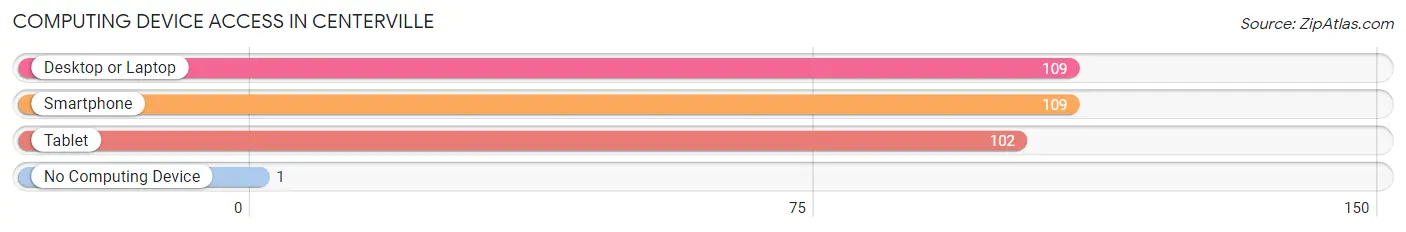
| Device Type | # Households | % Households |
| Desktop or Laptop | 109 | 99.1% |
| Smartphone | 109 | 99.1% |
| Tablet | 102 | 92.7% |
| No Computing Device | 1 | 0.9% |
| Total | 110 | 100.0% |
Internet Access in Centerville
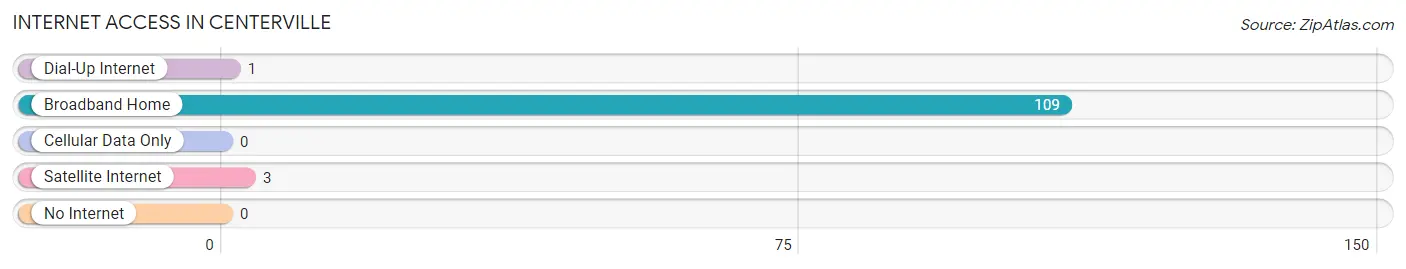
| Internet Type | # Households | % Households |
| Dial-Up Internet | 1 | 0.9% |
| Broadband Home | 109 | 99.1% |
| Cellular Data Only | 0 | 0.0% |
| Satellite Internet | 3 | 2.7% |
| No Internet | 0 | 0.0% |
| Total | 110 | 100.0% |
Centerville Summary
Centerville is a small town located in Vance County, North Carolina. It is situated in the northeastern part of the state, about 25 miles northeast of Raleigh. The town has a population of approximately 1,500 people and is part of the Henderson-Vance County metropolitan statistical area.
Geography
Centerville is located in the northeastern part of Vance County, North Carolina. It is situated in the Piedmont region of the state, which is characterized by rolling hills and flat plains. The town is located on the banks of the Tar River, which flows through the area. The town is surrounded by the towns of Henderson, Kittrell, and Townsville. The nearest major city is Raleigh, which is located about 25 miles to the southwest.
Climate
Centerville has a humid subtropical climate, with hot, humid summers and mild winters. The average annual temperature is around 68°F, with an average high of around 86°F in the summer and an average low of around 50°F in the winter. The town receives an average of 48 inches of precipitation per year, with most of it falling in the summer months.
Demographics
As of the 2010 census, Centerville had a population of 1,500 people. The racial makeup of the town was 79.3% White, 17.3% African American, 0.7% Native American, 0.7% Asian, 0.3% from other races, and 1.7% from two or more races. Hispanic or Latino of any race were 1.3% of the population.
Economy
Centerville’s economy is largely based on agriculture and manufacturing. The town is home to several small businesses, including a feed mill, a lumber mill, and a furniture factory. The town also has a few retail stores, including a grocery store, a hardware store, and a few restaurants.
Education
Centerville is served by the Vance County School District. The town has one elementary school, one middle school, and one high school. The town also has a few private schools, including a Christian school and a Montessori school.
Conclusion
Centerville is a small town located in Vance County, North Carolina. It is situated in the northeastern part of the state, about 25 miles northeast of Raleigh. The town has a population of approximately 1,500 people and is part of the Henderson-Vance County metropolitan statistical area. Centerville has a humid subtropical climate, with hot, humid summers and mild winters. The town’s economy is largely based on agriculture and manufacturing. The town is served by the Vance County School District and has a few private schools.
Common Questions
What is the Total Population of Centerville?
Total Population of Centerville is 261.
What is the Total Male Population of Centerville?
Total Male Population of Centerville is 103.
What is the Total Female Population of Centerville?
Total Female Population of Centerville is 158.
What is the Ratio of Males per 100 Females in Centerville?
There are 65.19 Males per 100 Females in Centerville.
What is the Ratio of Females per 100 Males in Centerville?
There are 153.40 Females per 100 Males in Centerville.
What is the Median Population Age in Centerville?
Median Population Age in Centerville is 35.6 Years.
What is the Average Family Size in Centerville
Average Family Size in Centerville is 2.5 People.
What is the Average Household Size in Centerville
Average Household Size in Centerville is 2.4 People.
What is Per Capita Income in Centerville?
Per Capita income in Centerville is $44,676.
What is the Median Family Income in Centerville?
Median Family Income in Centerville is $99,972.
What is the Median Household income in Centerville?
Median Household Income in Centerville is $99,773.
What is Inequality or Gini Index in Centerville?
Inequality or Gini Index in Centerville is 0.12.
How Large is the Labor Force in Centerville?
There are 110 People in the Labor Forcein in Centerville.
What is the Percentage of People in the Labor Force in Centerville?
51.6% of People are in the Labor Force in Centerville.