Yancey County, NC
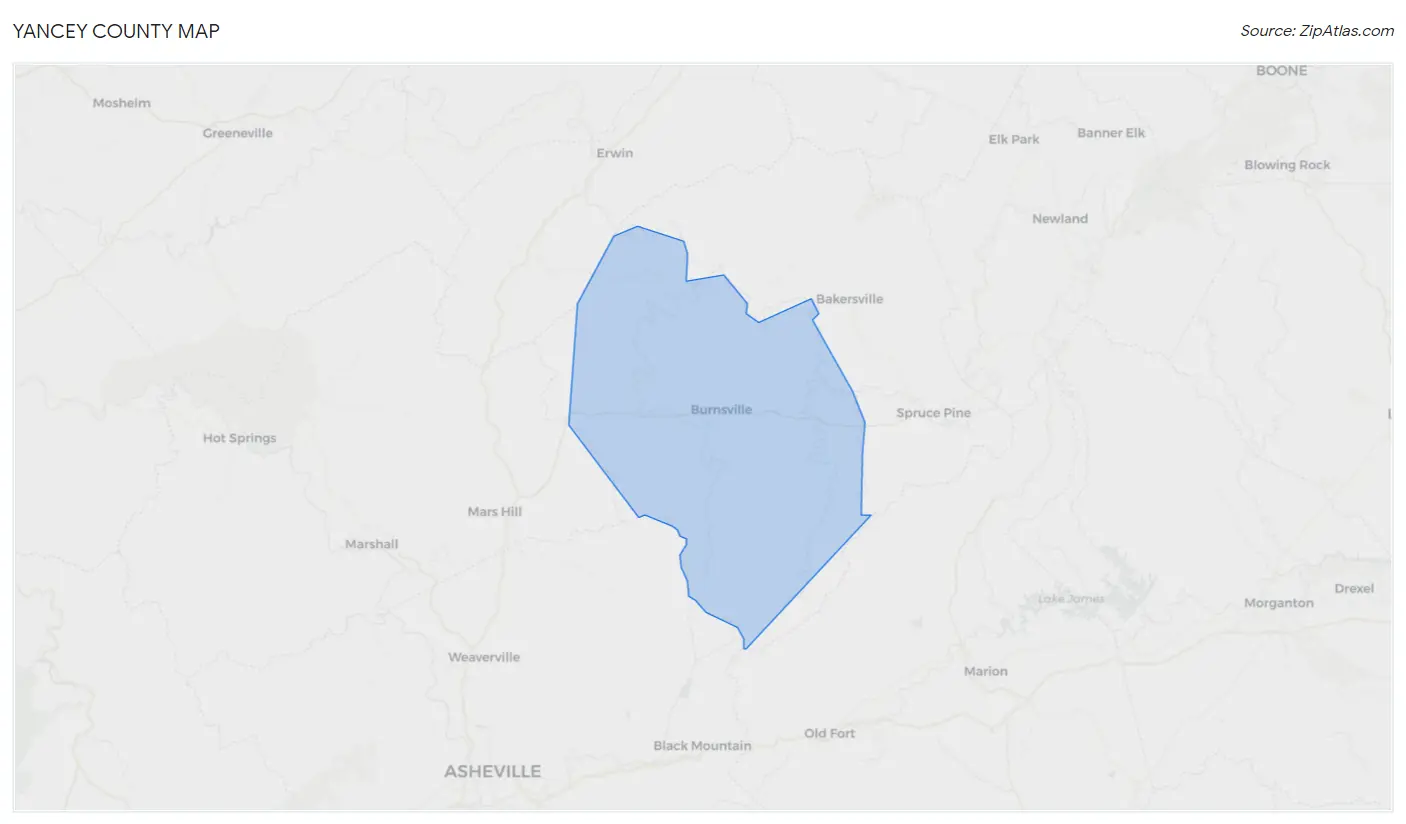
Yancey County Map
Yancey County Overview
18,538
TOTAL POPULATION
9,203
MALE POPULATION
9,335
FEMALE POPULATION
98.59
MALES / 100 FEMALES
101.43
FEMALES / 100 MALES
48.0
MEDIAN AGE
2.9
AVG FAMILY SIZE
2.3
AVG HOUSEHOLD SIZE
$31,037
PER CAPITA INCOME
$71,351
AVG FAMILY INCOME
$53,103
AVG HOUSEHOLD INCOME
25.7%
WAGE / INCOME GAP [ % ]
74.3¢/ $1
WAGE / INCOME GAP [ $ ]
0.47
INEQUALITY / GINI INDEX
8,346
LABOR FORCE [ PEOPLE ]
53.8%
PERCENT IN LABOR FORCE
7.6%
UNEMPLOYMENT RATE
Yancey County Area Codes
Race in Yancey County
The most populous races in Yancey County are White / Caucasian (17,253 | 93.1%), Hispanic or Latino (1,001 | 5.4%), and Two or more Races (673 | 3.6%).

| Race | # Population | % Population |
| Asian | 67 | 0.4% |
| Black / African American | 82 | 0.4% |
| Hawaiian / Pacific | 8 | 0.0% |
| Hispanic or Latino | 1,001 | 5.4% |
| Native / Alaskan | 19 | 0.1% |
| White / Caucasian | 17,253 | 93.1% |
| Two or more Races | 673 | 3.6% |
| Some other Race | 436 | 2.4% |
| Total | 18,538 | 100.0% |
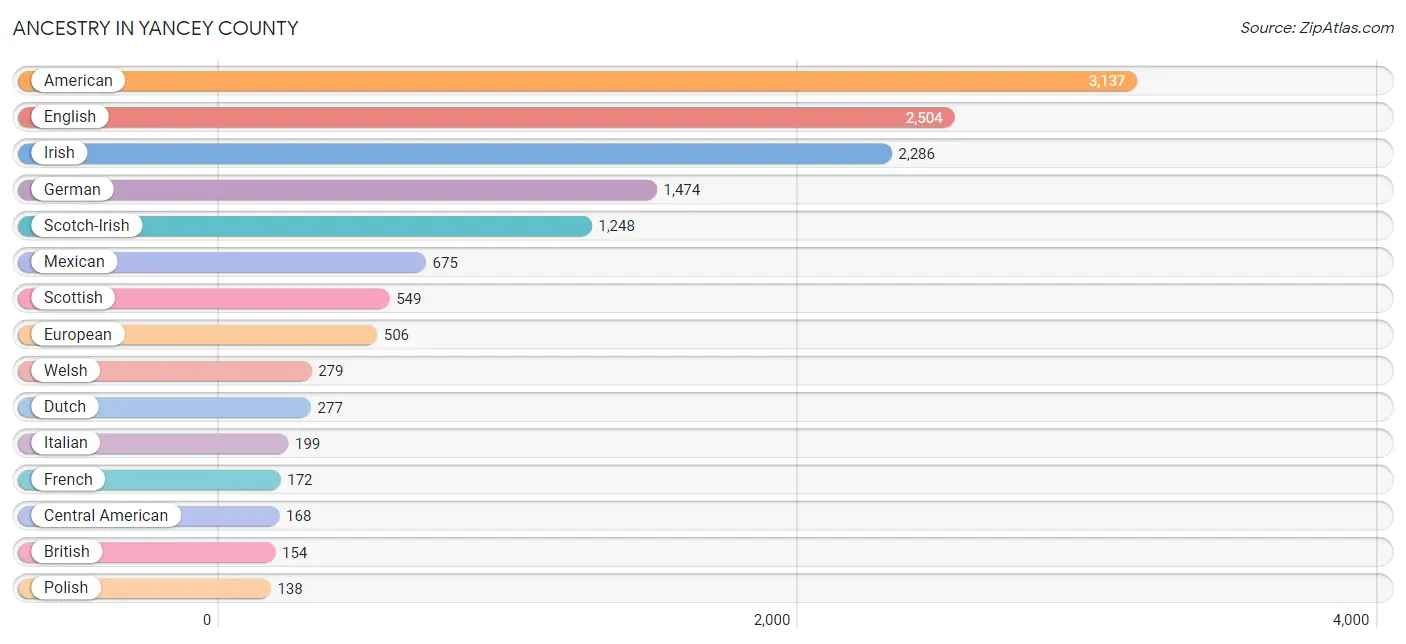
Ancestry in Yancey County
The most populous ancestries reported in Yancey County are American (3,137 | 16.9%), English (2,504 | 13.5%), Irish (2,286 | 12.3%), German (1,474 | 8.0%), and Scotch-Irish (1,248 | 6.7%), together accounting for 57.4% of all Yancey County residents.
| Ancestry | # Population | % Population |
| African | 19 | 0.1% |
| Alaskan Athabascan | 2 | 0.0% |
| American | 3,137 | 16.9% |
| Argentinean | 15 | 0.1% |
| Austrian | 6 | 0.0% |
| Bhutanese | 7 | 0.0% |
| Blackfeet | 2 | 0.0% |
| British | 154 | 0.8% |
| Bulgarian | 4 | 0.0% |
| Burmese | 13 | 0.1% |
| Celtic | 8 | 0.0% |
| Central American | 168 | 0.9% |
| Cherokee | 79 | 0.4% |
| Choctaw | 2 | 0.0% |
| Colombian | 17 | 0.1% |
| Creek | 2 | 0.0% |
| Cuban | 50 | 0.3% |
| Czech | 91 | 0.5% |
| Danish | 4 | 0.0% |
| Dutch | 277 | 1.5% |
| Eastern European | 15 | 0.1% |
| English | 2,504 | 13.5% |
| European | 506 | 2.7% |
| French | 172 | 0.9% |
| French American Indian | 1 | 0.0% |
| French Canadian | 96 | 0.5% |
| German | 1,474 | 8.0% |
| Greek | 29 | 0.2% |
| Guatemalan | 133 | 0.7% |
| Hungarian | 49 | 0.3% |
| Indian (Asian) | 2 | 0.0% |
| Iranian | 64 | 0.4% |
| Irish | 2,286 | 12.3% |
| Italian | 199 | 1.1% |
| Korean | 1 | 0.0% |
| Laotian | 2 | 0.0% |
| Lithuanian | 16 | 0.1% |
| Lumbee | 1 | 0.0% |
| Mexican | 675 | 3.6% |
| Native Hawaiian | 8 | 0.0% |
| Navajo | 1 | 0.0% |
| New Zealander | 2 | 0.0% |
| Nicaraguan | 17 | 0.1% |
| Northern European | 10 | 0.1% |
| Norwegian | 40 | 0.2% |
| Polish | 138 | 0.7% |
| Puerto Rican | 10 | 0.1% |
| Romanian | 12 | 0.1% |
| Russian | 87 | 0.5% |
| Salvadoran | 18 | 0.1% |
| Scandinavian | 60 | 0.3% |
| Scotch-Irish | 1,248 | 6.7% |
| Scottish | 549 | 3.0% |
| Slovak | 14 | 0.1% |
| South African | 5 | 0.0% |
| South American | 35 | 0.2% |
| Spaniard | 4 | 0.0% |
| Subsaharan African | 24 | 0.1% |
| Swedish | 97 | 0.5% |
| Swiss | 39 | 0.2% |
| Thai | 41 | 0.2% |
| Turkish | 12 | 0.1% |
| Ukrainian | 64 | 0.4% |
| Welsh | 279 | 1.5% |
| Yugoslavian | 3 | 0.0% | View All 65 Rows |
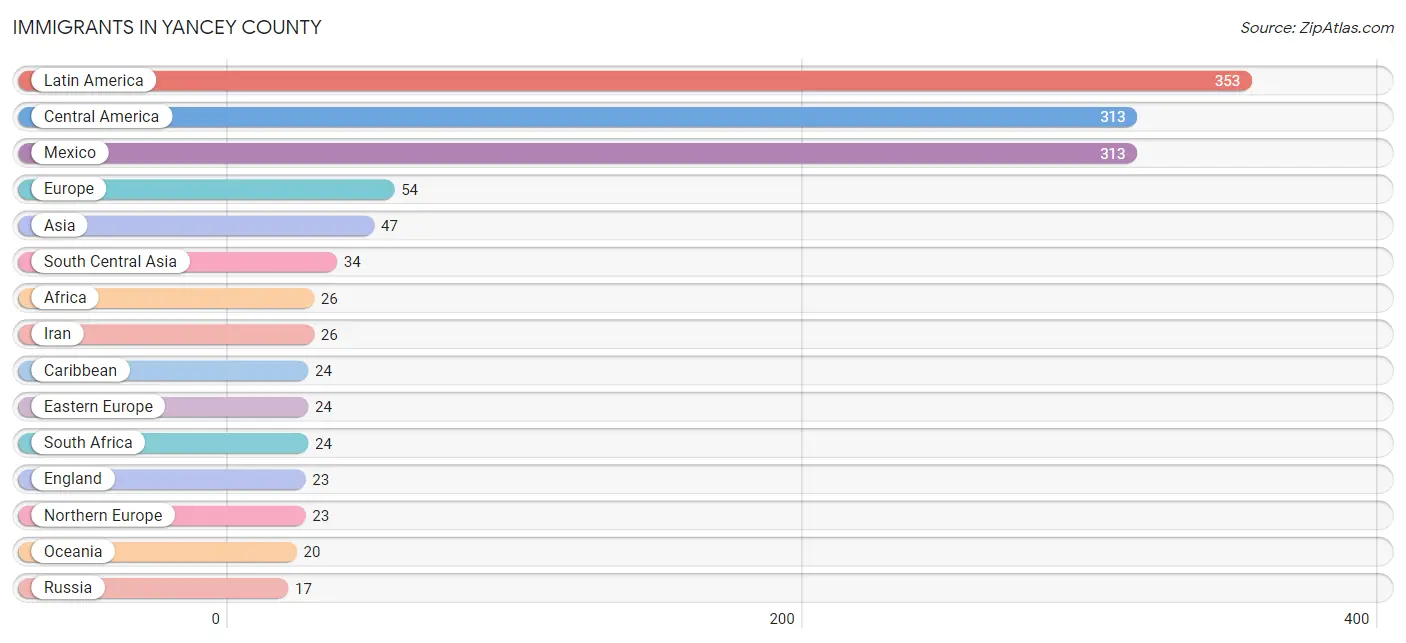
Immigrants in Yancey County
The most numerous immigrant groups reported in Yancey County came from Latin America (353 | 1.9%), Central America (313 | 1.7%), Mexico (313 | 1.7%), Europe (54 | 0.3%), and Asia (47 | 0.3%), together accounting for 5.8% of all Yancey County residents.
| Immigration Origin | # Population | % Population |
| Africa | 26 | 0.1% |
| Argentina | 15 | 0.1% |
| Asia | 47 | 0.3% |
| Bulgaria | 4 | 0.0% |
| Caribbean | 24 | 0.1% |
| Central America | 313 | 1.7% |
| China | 1 | 0.0% |
| Colombia | 1 | 0.0% |
| Cuba | 8 | 0.0% |
| Czechoslovakia | 3 | 0.0% |
| Eastern Africa | 2 | 0.0% |
| Eastern Asia | 10 | 0.1% |
| Eastern Europe | 24 | 0.1% |
| England | 23 | 0.1% |
| Europe | 54 | 0.3% |
| India | 8 | 0.0% |
| Indonesia | 2 | 0.0% |
| Iran | 26 | 0.1% |
| Italy | 7 | 0.0% |
| Japan | 5 | 0.0% |
| Korea | 4 | 0.0% |
| Latin America | 353 | 1.9% |
| Mexico | 313 | 1.7% |
| Northern Europe | 23 | 0.1% |
| Oceania | 20 | 0.1% |
| Philippines | 1 | 0.0% |
| Russia | 17 | 0.1% |
| South Africa | 24 | 0.1% |
| South America | 16 | 0.1% |
| South Central Asia | 34 | 0.2% |
| South Eastern Asia | 3 | 0.0% |
| Southern Europe | 7 | 0.0% |
| Trinidad and Tobago | 16 | 0.1% | View All 33 Rows |
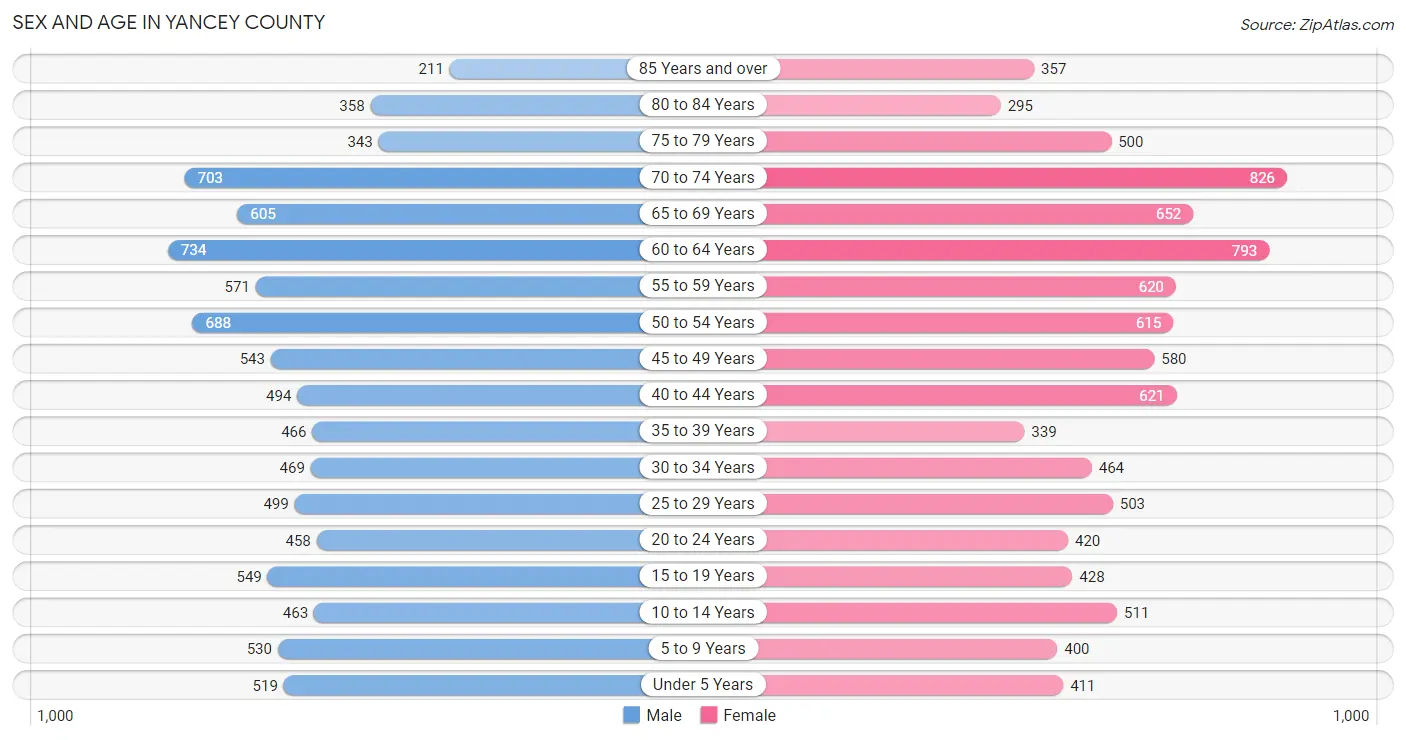
Sex and Age in Yancey County
Sex and Age in Yancey County
The most populous age groups in Yancey County are 60 to 64 Years (734 | 8.0%) for men and 70 to 74 Years (826 | 8.8%) for women.
| Age Bracket | Male | Female |
| Under 5 Years | 519 (5.6%) | 411 (4.4%) |
| 5 to 9 Years | 530 (5.8%) | 400 (4.3%) |
| 10 to 14 Years | 463 (5.0%) | 511 (5.5%) |
| 15 to 19 Years | 549 (6.0%) | 428 (4.6%) |
| 20 to 24 Years | 458 (5.0%) | 420 (4.5%) |
| 25 to 29 Years | 499 (5.4%) | 503 (5.4%) |
| 30 to 34 Years | 469 (5.1%) | 464 (5.0%) |
| 35 to 39 Years | 466 (5.1%) | 339 (3.6%) |
| 40 to 44 Years | 494 (5.4%) | 621 (6.7%) |
| 45 to 49 Years | 543 (5.9%) | 580 (6.2%) |
| 50 to 54 Years | 688 (7.5%) | 615 (6.6%) |
| 55 to 59 Years | 571 (6.2%) | 620 (6.6%) |
| 60 to 64 Years | 734 (8.0%) | 793 (8.5%) |
| 65 to 69 Years | 605 (6.6%) | 652 (7.0%) |
| 70 to 74 Years | 703 (7.6%) | 826 (8.8%) |
| 75 to 79 Years | 343 (3.7%) | 500 (5.4%) |
| 80 to 84 Years | 358 (3.9%) | 295 (3.2%) |
| 85 Years and over | 211 (2.3%) | 357 (3.8%) |
| Total | 9,203 (100.0%) | 9,335 (100.0%) |
Families and Households in Yancey County
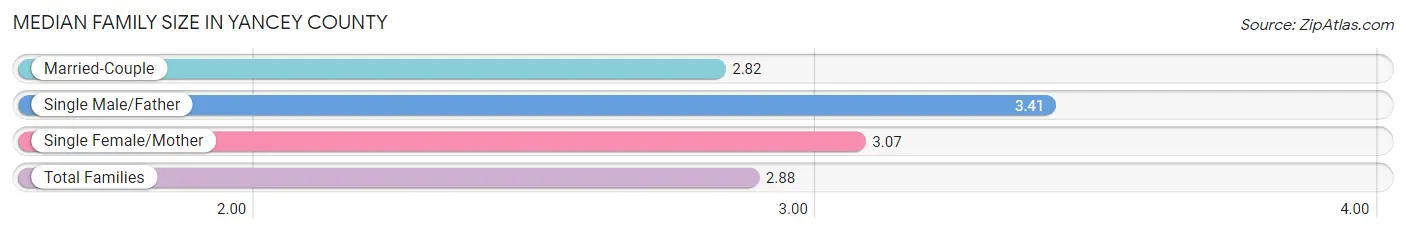
Median Family Size in Yancey County
The median family size in Yancey County is 2.88 persons per family, with single male/father families (245 | 4.6%) accounting for the largest median family size of 3.41 persons per family. On the other hand, married-couple families (4,362 | 82.6%) represent the smallest median family size with 2.82 persons per family.
| Family Type | # Families | Family Size |
| Married-Couple | 4,362 (82.6%) | 2.82 |
| Single Male/Father | 245 (4.6%) | 3.41 |
| Single Female/Mother | 674 (12.8%) | 3.07 |
| Total Families | 5,281 (100.0%) | 2.88 |
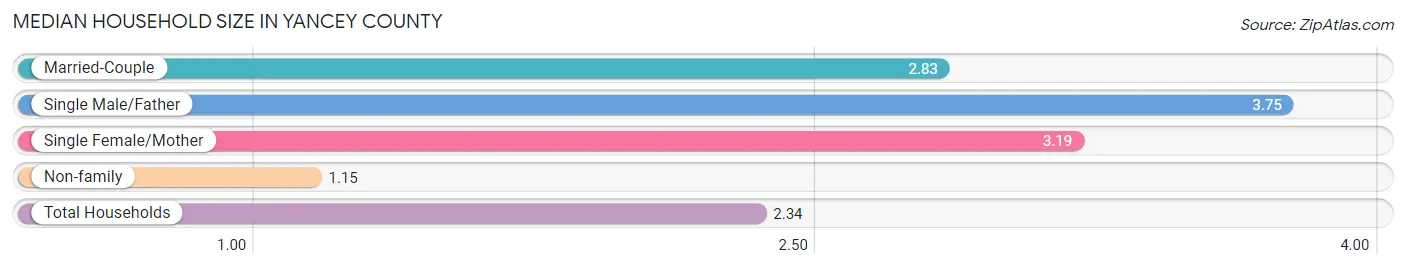
Median Household Size in Yancey County
The median household size in Yancey County is 2.34 persons per household, with single male/father households (245 | 3.1%) accounting for the largest median household size of 3.75 persons per household. non-family households (2,578 | 32.8%) represent the smallest median household size with 1.15 persons per household.
| Household Type | # Households | Household Size |
| Married-Couple | 4,362 (55.5%) | 2.83 |
| Single Male/Father | 245 (3.1%) | 3.75 |
| Single Female/Mother | 674 (8.6%) | 3.19 |
| Non-family | 2,578 (32.8%) | 1.15 |
| Total Households | 7,859 (100.0%) | 2.34 |
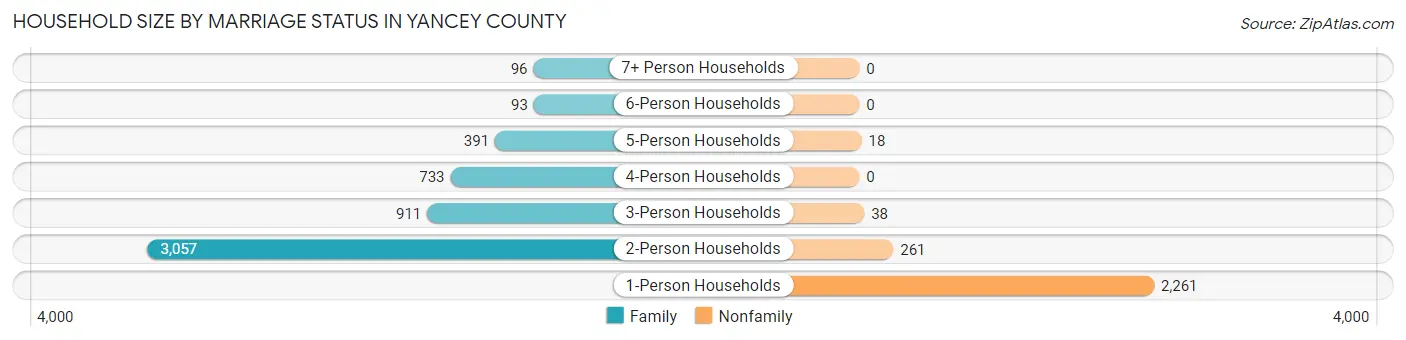
Household Size by Marriage Status in Yancey County
Out of a total of 7,859 households in Yancey County, 5,281 (67.2%) are family households, while 2,578 (32.8%) are nonfamily households. The most numerous type of family households are 2-person households, comprising 3,057, and the most common type of nonfamily households are 1-person households, comprising 2,261.
| Household Size | Family Households | Nonfamily Households |
| 1-Person Households | - | 2,261 (28.8%) |
| 2-Person Households | 3,057 (38.9%) | 261 (3.3%) |
| 3-Person Households | 911 (11.6%) | 38 (0.5%) |
| 4-Person Households | 733 (9.3%) | 0 (0.0%) |
| 5-Person Households | 391 (5.0%) | 18 (0.2%) |
| 6-Person Households | 93 (1.2%) | 0 (0.0%) |
| 7+ Person Households | 96 (1.2%) | 0 (0.0%) |
| Total | 5,281 (67.2%) | 2,578 (32.8%) |
Female Fertility in Yancey County
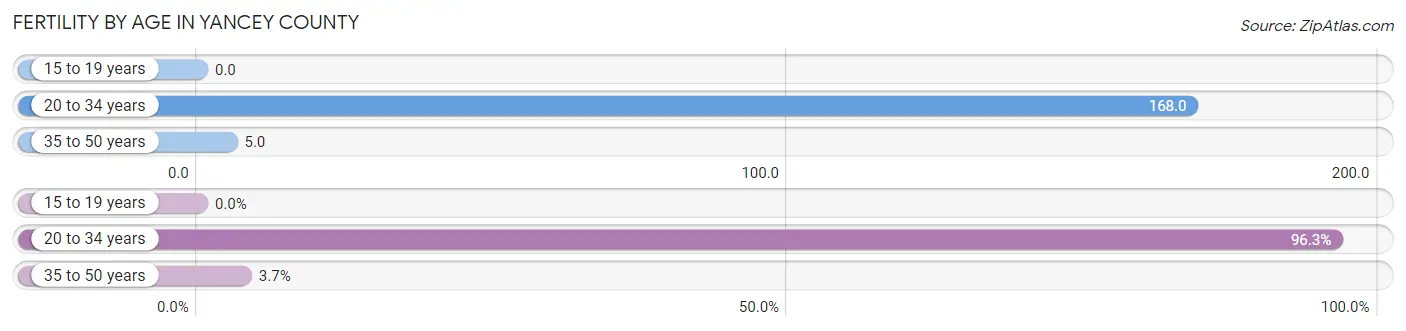
Fertility by Age in Yancey County
Average fertility rate in Yancey County is 68.0 births per 1,000 women. Women in the age bracket of 20 to 34 years have the highest fertility rate with 168.0 births per 1,000 women. Women in the age bracket of 20 to 34 years acount for 96.3% of all women with births.
| Age Bracket | Women with Births | Births / 1,000 Women |
| 15 to 19 years | 0 (0.0%) | 0.0 |
| 20 to 34 years | 233 (96.3%) | 168.0 |
| 35 to 50 years | 9 (3.7%) | 5.0 |
| Total | 242 (100.0%) | 68.0 |
Fertility by Age by Marriage Status in Yancey County
70.7% of women with births (242) in Yancey County are married. The highest percentage of unmarried women with births falls into 20 to 34 years age bracket with 30.5% of them unmarried at the time of birth, while the lowest percentage of unmarried women with births belong to 35 to 50 years age bracket with 0.0% of them unmarried.
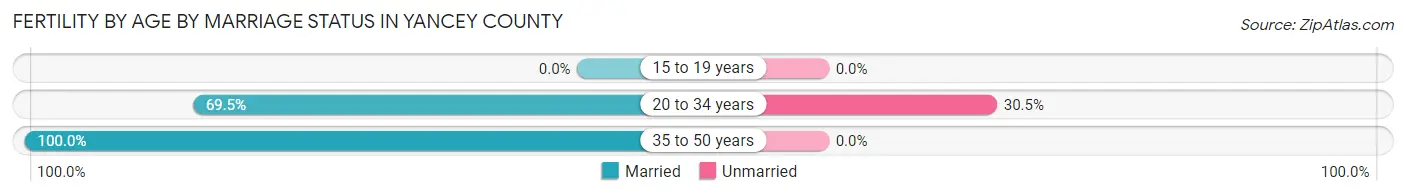
| Age Bracket | Married | Unmarried |
| 15 to 19 years | 0 (0.0%) | 0 (0.0%) |
| 20 to 34 years | 162 (69.5%) | 71 (30.5%) |
| 35 to 50 years | 9 (100.0%) | 0 (0.0%) |
| Total | 171 (70.7%) | 71 (29.3%) |
Fertility by Education in Yancey County
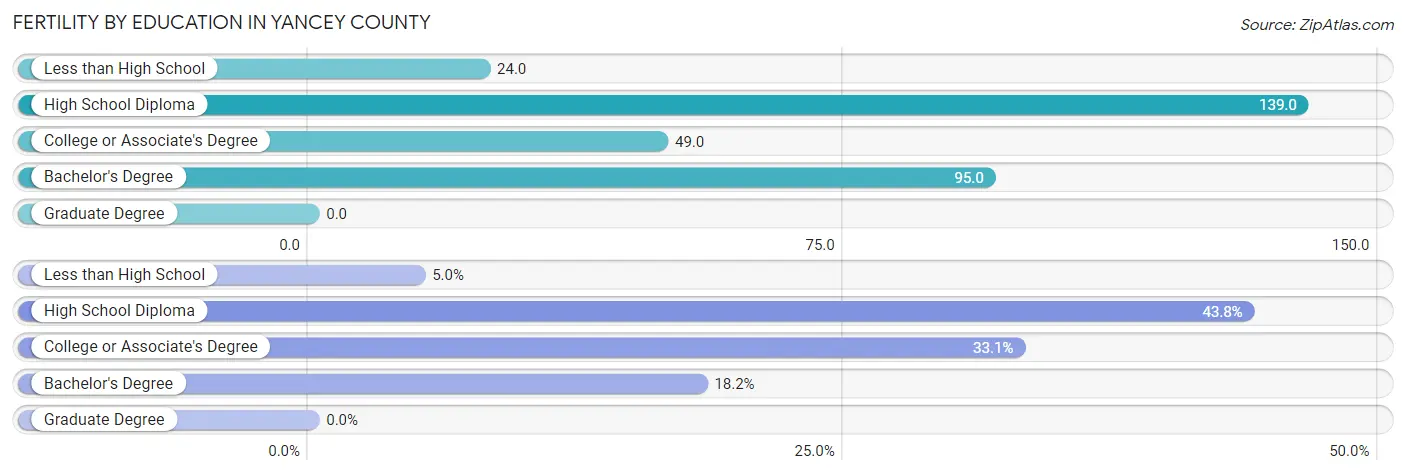
| Educational Attainment | Women with Births | Births / 1,000 Women |
| Less than High School | 12 (5.0%) | 24.0 |
| High School Diploma | 106 (43.8%) | 139.0 |
| College or Associate's Degree | 80 (33.1%) | 49.0 |
| Bachelor's Degree | 44 (18.2%) | 95.0 |
| Graduate Degree | 0 (0.0%) | 0.0 |
| Total | 242 (100.0%) | 68.0 |
Fertility by Education by Marriage Status in Yancey County
29.3% of women with births in Yancey County are unmarried. Women with the educational attainment of less than high school are most likely to be married with 100.0% of them married at childbirth, while women with the educational attainment of college or associate's degree are least likely to be married with 66.2% of them unmarried at childbirth.
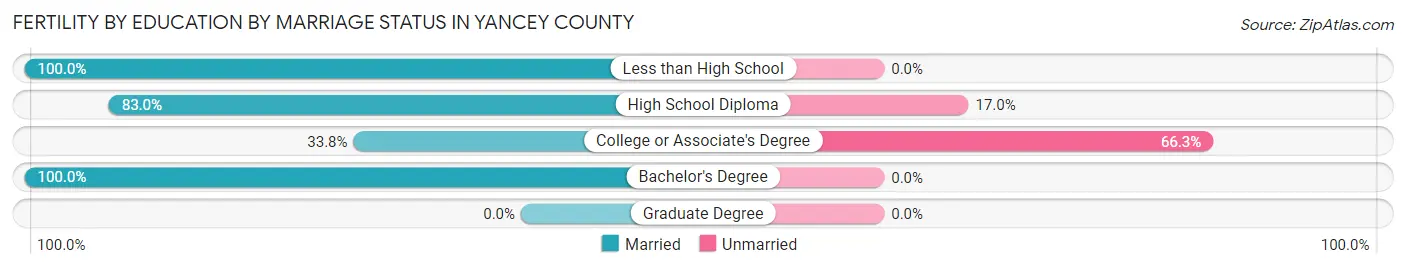
| Educational Attainment | Married | Unmarried |
| Less than High School | 12 (100.0%) | 0 (0.0%) |
| High School Diploma | 88 (83.0%) | 18 (17.0%) |
| College or Associate's Degree | 27 (33.8%) | 53 (66.2%) |
| Bachelor's Degree | 44 (100.0%) | 0 (0.0%) |
| Graduate Degree | 0 (0.0%) | 0 (0.0%) |
| Total | 171 (70.7%) | 71 (29.3%) |
Income in Yancey County
Income Overview in Yancey County
Per Capita Income in Yancey County is $31,037, while median incomes of families and households are $71,351 and $53,103 respectively.
| Characteristic | Number | Measure |
| Per Capita Income | 18,538 | $31,037 |
| Median Family Income | 5,281 | $71,351 |
| Mean Family Income | 5,281 | $90,166 |
| Median Household Income | 7,859 | $53,103 |
| Mean Household Income | 7,859 | $72,533 |
| Income Deficit | 5,281 | $0 |
| Wage / Income Gap (%) | 18,538 | 25.71% |
| Wage / Income Gap ($) | 18,538 | 74.29¢ per $1 |
| Gini / Inequality Index | 18,538 | 0.47 |
Earnings by Sex in Yancey County
Average Earnings in Yancey County are $34,491, $39,300 for men and $29,196 for women, a difference of 25.7%.
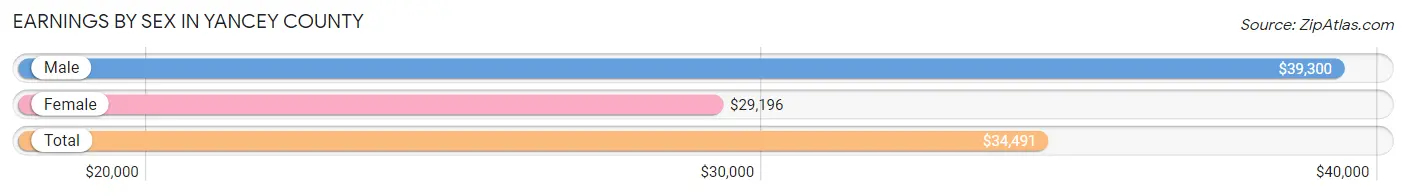
| Sex | Number | Average Earnings |
| Male | 4,459 (50.4%) | $39,300 |
| Female | 4,386 (49.6%) | $29,196 |
| Total | 8,845 (100.0%) | $34,491 |
Earnings by Sex by Income Bracket in Yancey County
The most common earnings brackets in Yancey County are $55,000 to $64,999 for men (466 | 10.4%) and $25,000 to $29,999 for women (434 | 9.9%).
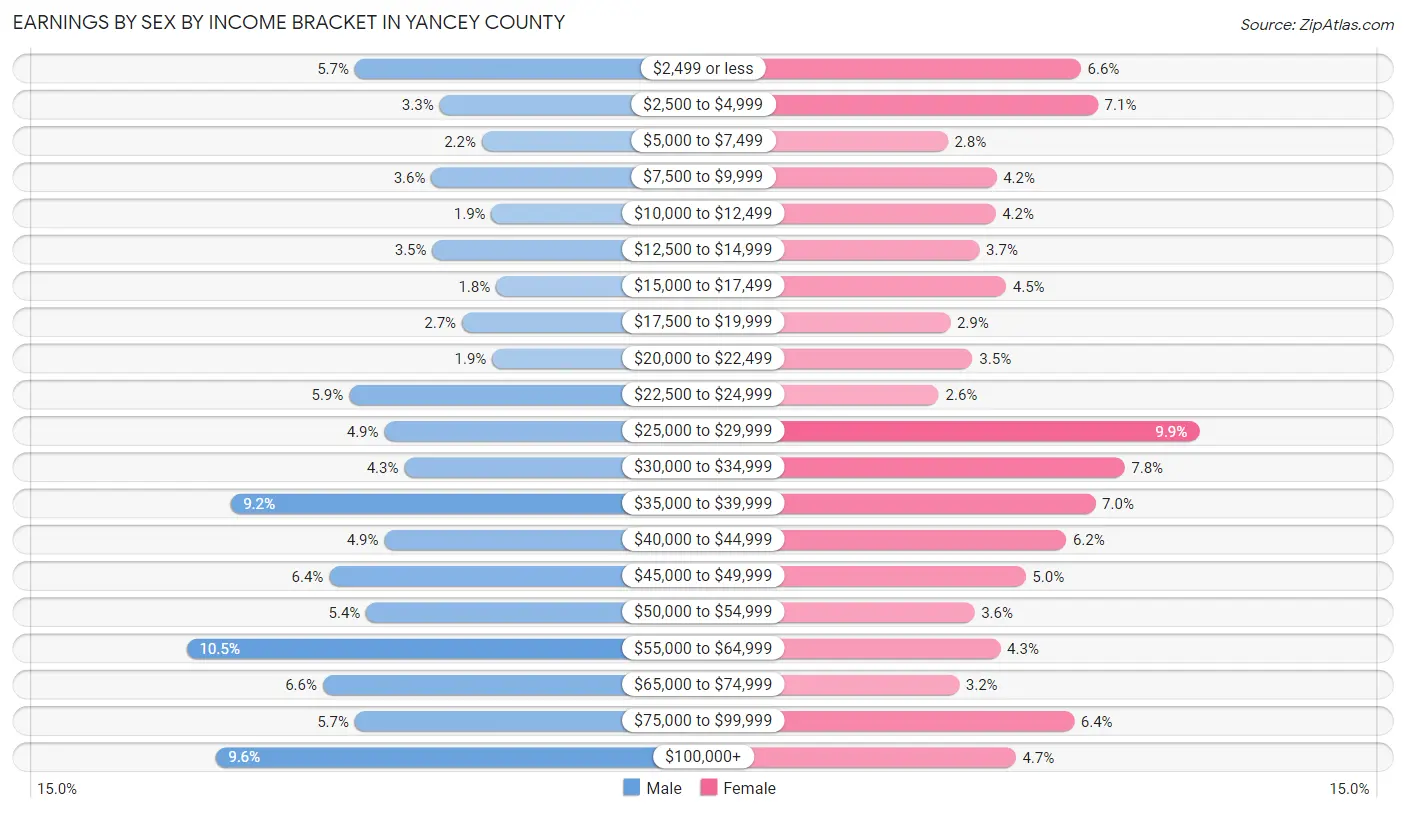
| Income | Male | Female |
| $2,499 or less | 255 (5.7%) | 288 (6.6%) |
| $2,500 to $4,999 | 149 (3.3%) | 309 (7.0%) |
| $5,000 to $7,499 | 96 (2.1%) | 124 (2.8%) |
| $7,500 to $9,999 | 159 (3.6%) | 184 (4.2%) |
| $10,000 to $12,499 | 84 (1.9%) | 183 (4.2%) |
| $12,500 to $14,999 | 158 (3.5%) | 163 (3.7%) |
| $15,000 to $17,499 | 78 (1.8%) | 196 (4.5%) |
| $17,500 to $19,999 | 121 (2.7%) | 127 (2.9%) |
| $20,000 to $22,499 | 83 (1.9%) | 155 (3.5%) |
| $22,500 to $24,999 | 262 (5.9%) | 113 (2.6%) |
| $25,000 to $29,999 | 218 (4.9%) | 434 (9.9%) |
| $30,000 to $34,999 | 193 (4.3%) | 342 (7.8%) |
| $35,000 to $39,999 | 411 (9.2%) | 306 (7.0%) |
| $40,000 to $44,999 | 218 (4.9%) | 270 (6.2%) |
| $45,000 to $49,999 | 287 (6.4%) | 220 (5.0%) |
| $50,000 to $54,999 | 241 (5.4%) | 157 (3.6%) |
| $55,000 to $64,999 | 466 (10.4%) | 189 (4.3%) |
| $65,000 to $74,999 | 295 (6.6%) | 138 (3.2%) |
| $75,000 to $99,999 | 255 (5.7%) | 280 (6.4%) |
| $100,000+ | 430 (9.6%) | 208 (4.7%) |
| Total | 4,459 (100.0%) | 4,386 (100.0%) |
Earnings by Sex by Educational Attainment in Yancey County
Average earnings in Yancey County are $42,460 for men and $30,707 for women, a difference of 27.7%. Men with an educational attainment of graduate degree enjoy the highest average annual earnings of $75,167, while those with less than high school education earn the least with $18,750. Women with an educational attainment of graduate degree earn the most with the average annual earnings of $65,750, while those with less than high school education have the smallest earnings of $21,161.
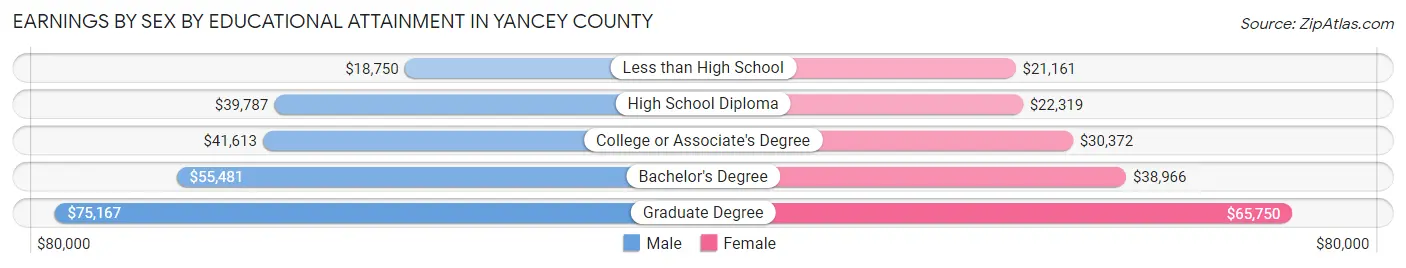
| Educational Attainment | Male Income | Female Income |
| Less than High School | $18,750 | $21,161 |
| High School Diploma | $39,787 | $22,319 |
| College or Associate's Degree | $41,613 | $30,372 |
| Bachelor's Degree | $55,481 | $38,966 |
| Graduate Degree | $75,167 | $65,750 |
| Total | $42,460 | $30,707 |
Family Income in Yancey County
Family Income Brackets in Yancey County
According to the Yancey County family income data, there are 1,030 families falling into the $50,000 to $74,999 income range, which is the most common income bracket and makes up 19.5% of all families. Conversely, the $10,000 to $14,999 income bracket is the least frequent group with only 58 families (1.1%) belonging to this category.
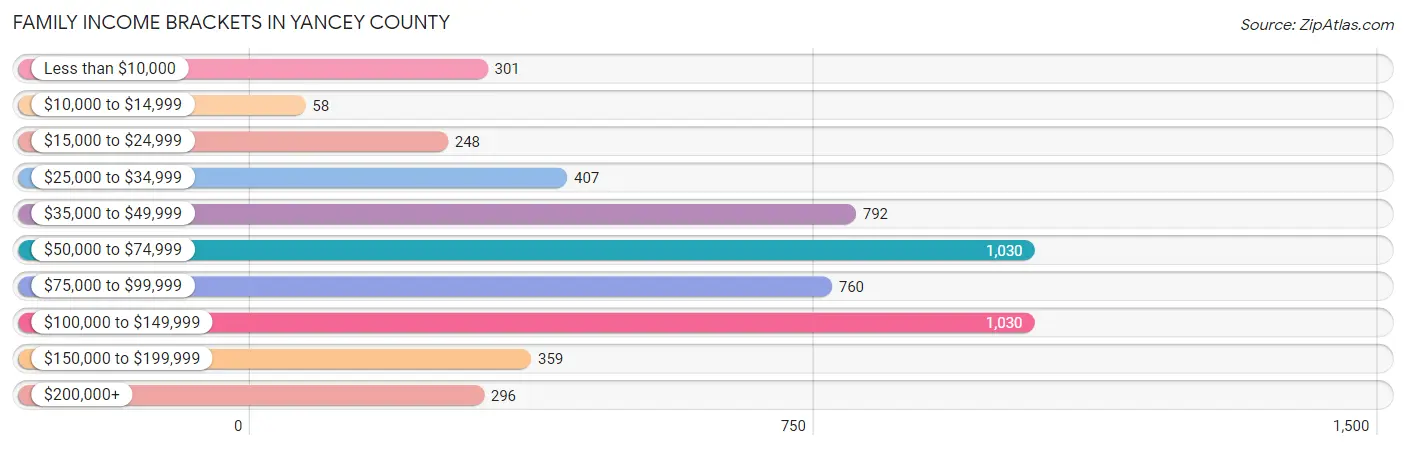
| Income Bracket | # Families | % Families |
| Less than $10,000 | 301 | 5.7% |
| $10,000 to $14,999 | 58 | 1.1% |
| $15,000 to $24,999 | 248 | 4.7% |
| $25,000 to $34,999 | 407 | 7.7% |
| $35,000 to $49,999 | 792 | 15.0% |
| $50,000 to $74,999 | 1,030 | 19.5% |
| $75,000 to $99,999 | 760 | 14.4% |
| $100,000 to $149,999 | 1,030 | 19.5% |
| $150,000 to $199,999 | 359 | 6.8% |
| $200,000+ | 296 | 5.6% |
Family Income by Famaliy Size in Yancey County
6-person families (70 | 1.3%) account for the highest median family income in Yancey County with $101,786 per family, while 2-person families (3,118 | 59.0%) have the highest median income of $35,114 per family member.
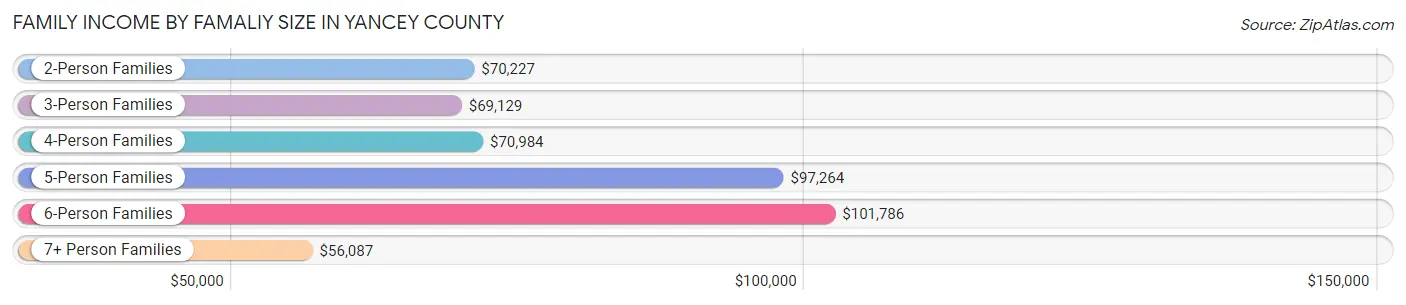
| Income Bracket | # Families | Median Income |
| 2-Person Families | 3,118 (59.0%) | $70,227 |
| 3-Person Families | 912 (17.3%) | $69,129 |
| 4-Person Families | 726 (13.8%) | $70,984 |
| 5-Person Families | 369 (7.0%) | $97,264 |
| 6-Person Families | 70 (1.3%) | $101,786 |
| 7+ Person Families | 86 (1.6%) | $56,087 |
| Total | 5,281 (100.0%) | $71,351 |
Family Income by Number of Earners in Yancey County
The median family income in Yancey County is $71,351, with families comprising 3+ earners (423) having the highest median family income of $114,375, while families with no earners (1,267) have the lowest median family income of $37,192, accounting for 8.0% and 24.0% of families, respectively.

| Number of Earners | # Families | Median Income |
| No Earners | 1,267 (24.0%) | $37,192 |
| 1 Earner | 1,480 (28.0%) | $58,511 |
| 2 Earners | 2,111 (40.0%) | $94,835 |
| 3+ Earners | 423 (8.0%) | $114,375 |
| Total | 5,281 (100.0%) | $71,351 |
Household Income in Yancey County
Household Income Brackets in Yancey County
With 1,430 households falling in the category, the $50,000 to $74,999 income range is the most frequent in Yancey County, accounting for 18.2% of all households. In contrast, only 307 households (3.9%) fall into the $200,000+ income bracket, making it the least populous group.
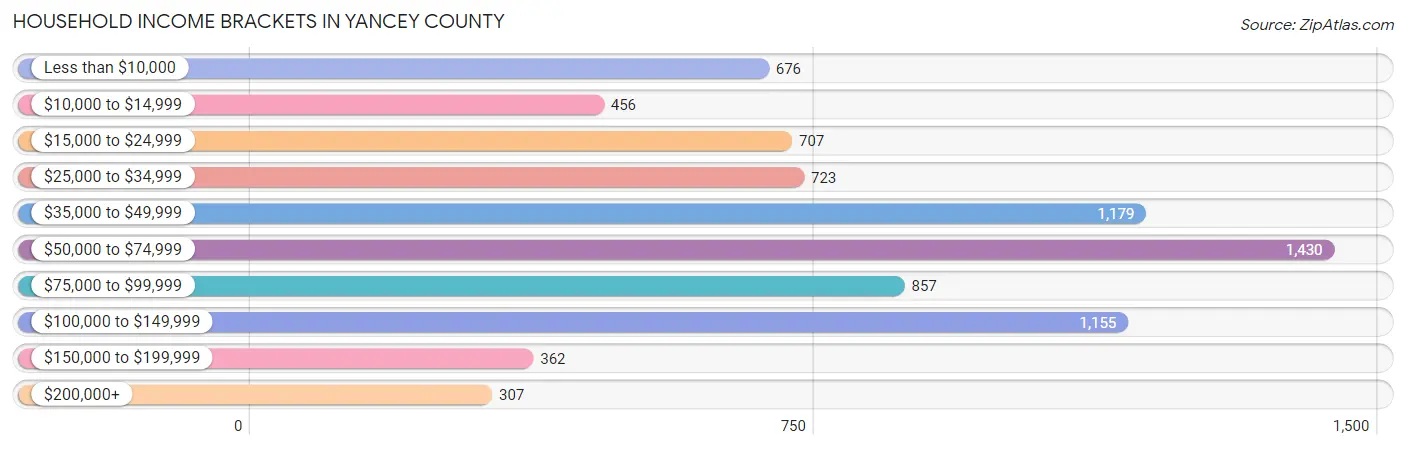
| Income Bracket | # Households | % Households |
| Less than $10,000 | 676 | 8.6% |
| $10,000 to $14,999 | 456 | 5.8% |
| $15,000 to $24,999 | 707 | 9.0% |
| $25,000 to $34,999 | 723 | 9.2% |
| $35,000 to $49,999 | 1,179 | 15.0% |
| $50,000 to $74,999 | 1,430 | 18.2% |
| $75,000 to $99,999 | 857 | 10.9% |
| $100,000 to $149,999 | 1,155 | 14.7% |
| $150,000 to $199,999 | 362 | 4.6% |
| $200,000+ | 307 | 3.9% |
Household Income by Householder Age in Yancey County
The median household income in Yancey County is $53,103, with the highest median household income of $69,630 found in the 45 to 64 years age bracket for the primary householder. A total of 2,861 households (36.4%) fall into this category. Meanwhile, the 65+ years age bracket for the primary householder has the lowest median household income of $41,386, with 2,985 households (38.0%) in this group.
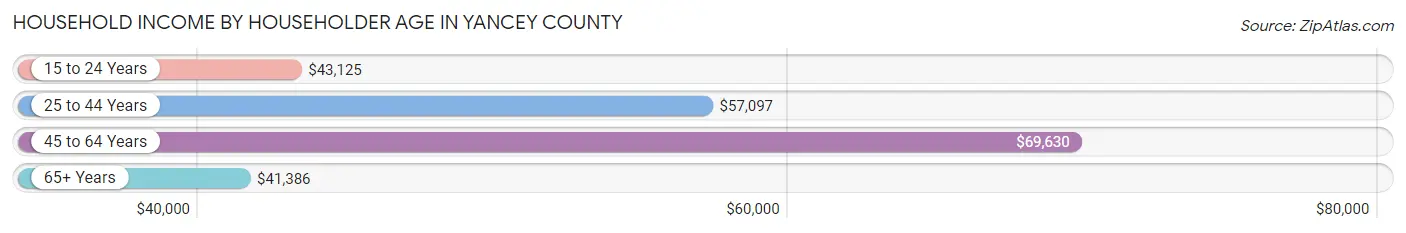
| Income Bracket | # Households | Median Income |
| 15 to 24 Years | 199 (2.5%) | $43,125 |
| 25 to 44 Years | 1,814 (23.1%) | $57,097 |
| 45 to 64 Years | 2,861 (36.4%) | $69,630 |
| 65+ Years | 2,985 (38.0%) | $41,386 |
| Total | 7,859 (100.0%) | $53,103 |
Poverty in Yancey County
Income Below Poverty by Sex and Age in Yancey County
With 16.1% poverty level for males and 14.4% for females among the residents of Yancey County, under 5 year old males and 16 and 17 year old females are the most vulnerable to poverty, with 259 males (50.0%) and 87 females (60.4%) in their respective age groups living below the poverty level.
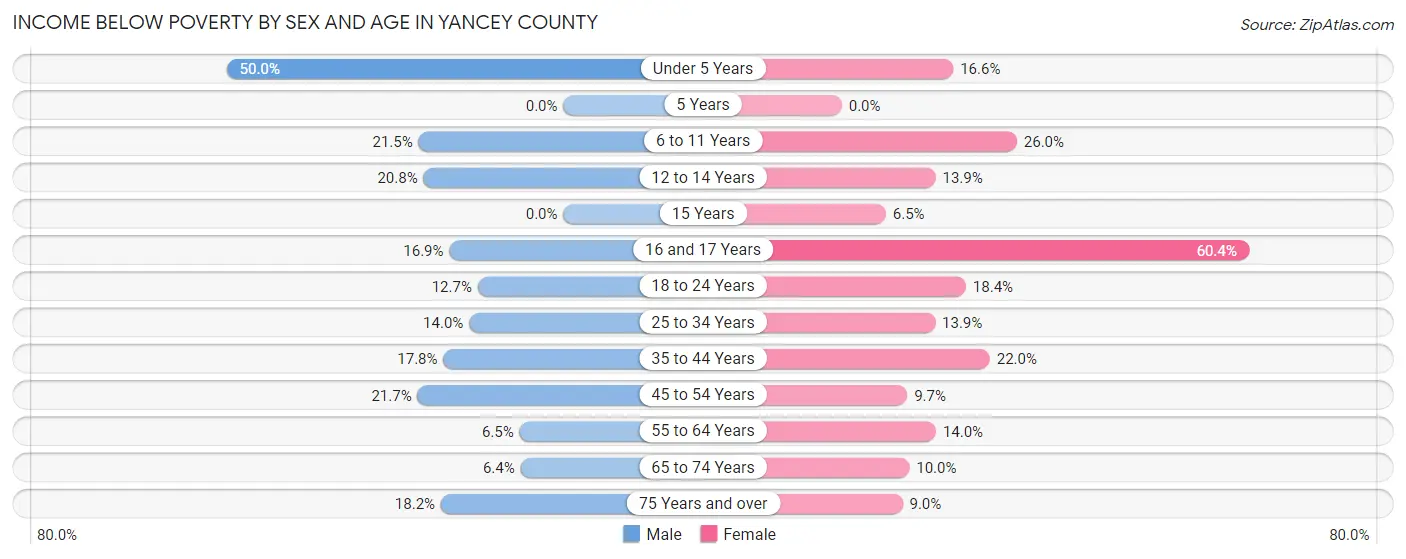
| Age Bracket | Male | Female |
| Under 5 Years | 259 (50.0%) | 68 (16.6%) |
| 5 Years | 0 (0.0%) | 0 (0.0%) |
| 6 to 11 Years | 123 (21.5%) | 111 (26.0%) |
| 12 to 14 Years | 65 (20.8%) | 54 (13.9%) |
| 15 Years | 0 (0.0%) | 7 (6.5%) |
| 16 and 17 Years | 43 (16.9%) | 87 (60.4%) |
| 18 to 24 Years | 85 (12.7%) | 110 (18.4%) |
| 25 to 34 Years | 133 (14.0%) | 134 (13.9%) |
| 35 to 44 Years | 170 (17.8%) | 211 (22.0%) |
| 45 to 54 Years | 263 (21.7%) | 116 (9.7%) |
| 55 to 64 Years | 84 (6.5%) | 196 (14.0%) |
| 65 to 74 Years | 83 (6.4%) | 147 (10.0%) |
| 75 Years and over | 160 (18.2%) | 102 (9.0%) |
| Total | 1,468 (16.1%) | 1,343 (14.4%) |
Income Above Poverty by Sex and Age in Yancey County
According to the poverty statistics in Yancey County, males aged 5 years and females aged 5 years are the age groups that are most secure financially, with 100.0% of males and 100.0% of females in these age groups living above the poverty line.
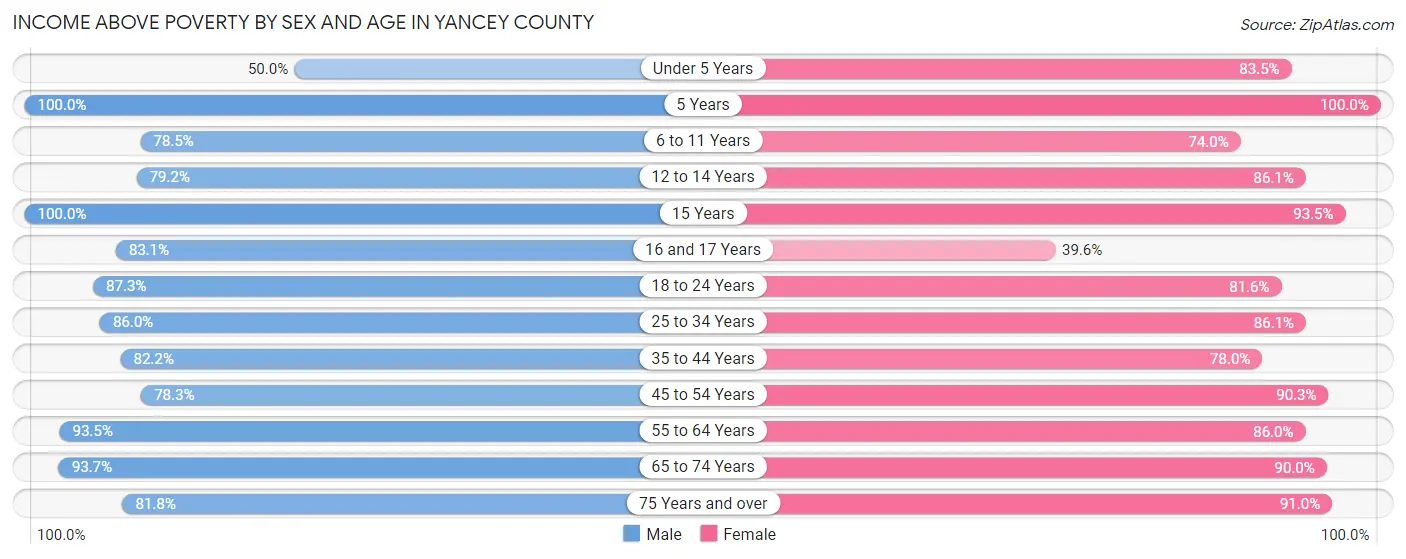
| Age Bracket | Male | Female |
| Under 5 Years | 259 (50.0%) | 343 (83.5%) |
| 5 Years | 94 (100.0%) | 96 (100.0%) |
| 6 to 11 Years | 449 (78.5%) | 316 (74.0%) |
| 12 to 14 Years | 248 (79.2%) | 334 (86.1%) |
| 15 Years | 84 (100.0%) | 100 (93.5%) |
| 16 and 17 Years | 211 (83.1%) | 57 (39.6%) |
| 18 to 24 Years | 584 (87.3%) | 487 (81.6%) |
| 25 to 34 Years | 818 (86.0%) | 833 (86.1%) |
| 35 to 44 Years | 784 (82.2%) | 749 (78.0%) |
| 45 to 54 Years | 951 (78.3%) | 1,079 (90.3%) |
| 55 to 64 Years | 1,208 (93.5%) | 1,206 (86.0%) |
| 65 to 74 Years | 1,225 (93.6%) | 1,320 (90.0%) |
| 75 Years and over | 720 (81.8%) | 1,029 (91.0%) |
| Total | 7,635 (83.9%) | 7,949 (85.6%) |
Income Below Poverty Among Married-Couple Families in Yancey County
The poverty statistics for married-couple families in Yancey County show that 5.3% or 232 of the total 4,362 families live below the poverty line. Families with 5 or more children have the highest poverty rate of 24.0%, comprising of 6 families. On the other hand, families with no children have the lowest poverty rate of 4.2%, which includes 132 families.
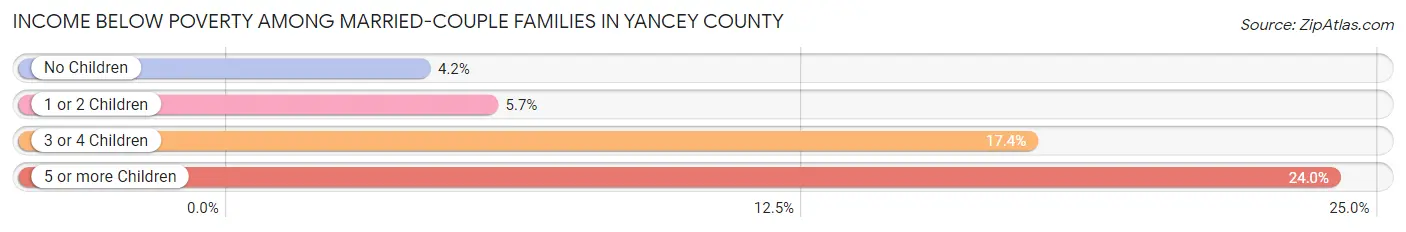
| Children | Above Poverty | Below Poverty |
| No Children | 3,011 (95.8%) | 132 (4.2%) |
| 1 or 2 Children | 915 (94.3%) | 55 (5.7%) |
| 3 or 4 Children | 185 (82.6%) | 39 (17.4%) |
| 5 or more Children | 19 (76.0%) | 6 (24.0%) |
| Total | 4,130 (94.7%) | 232 (5.3%) |
Income Below Poverty Among Single-Parent Households in Yancey County
According to the poverty data in Yancey County, 7.3% or 18 single-father households and 33.5% or 226 single-mother households are living below the poverty line. Among single-father households, those with 1 or 2 children have the highest poverty rate, with 18 households (15.5%) experiencing poverty. Likewise, among single-mother households, those with 3 or 4 children have the highest poverty rate, with 69 households (77.5%) falling below the poverty line.
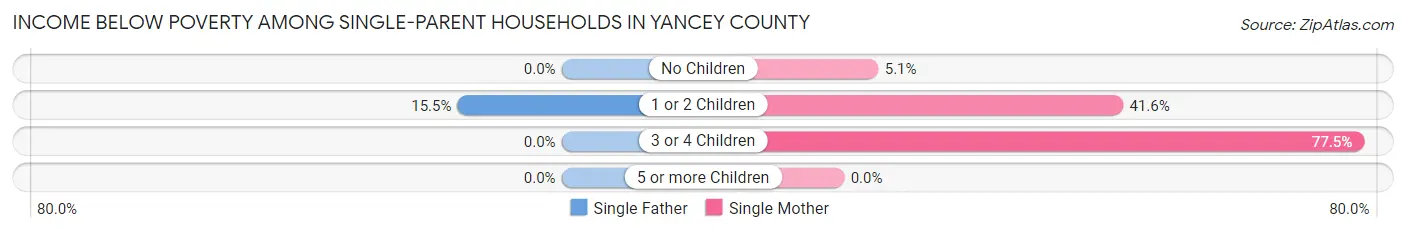
| Children | Single Father | Single Mother |
| No Children | 0 (0.0%) | 12 (5.1%) |
| 1 or 2 Children | 18 (15.5%) | 145 (41.5%) |
| 3 or 4 Children | 0 (0.0%) | 69 (77.5%) |
| 5 or more Children | 0 (0.0%) | 0 (0.0%) |
| Total | 18 (7.3%) | 226 (33.5%) |
Income Below Poverty Among Married-Couple vs Single-Parent Households in Yancey County
The poverty data for Yancey County shows that 232 of the married-couple family households (5.3%) and 244 of the single-parent households (26.6%) are living below the poverty level. Within the married-couple family households, those with 5 or more children have the highest poverty rate, with 6 households (24.0%) falling below the poverty line. Among the single-parent households, those with 3 or 4 children have the highest poverty rate, with 69 household (69.0%) living below poverty.
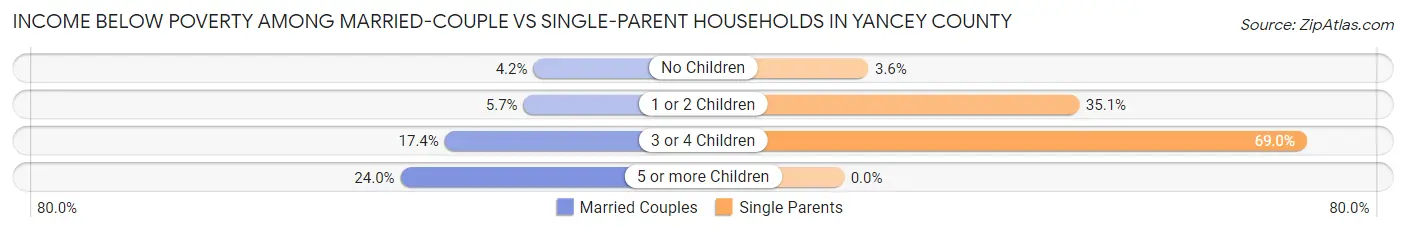
| Children | Married-Couple Families | Single-Parent Households |
| No Children | 132 (4.2%) | 12 (3.6%) |
| 1 or 2 Children | 55 (5.7%) | 163 (35.0%) |
| 3 or 4 Children | 39 (17.4%) | 69 (69.0%) |
| 5 or more Children | 6 (24.0%) | 0 (0.0%) |
| Total | 232 (5.3%) | 244 (26.6%) |
Employment Characteristics in Yancey County
Employment by Class of Employer in Yancey County
Among the 7,632 employed individuals in Yancey County, private company employees (4,676 | 61.3%), self-employed (not incorporated) (820 | 10.7%), and state government employees (714 | 9.4%) make up the most common classes of employment.
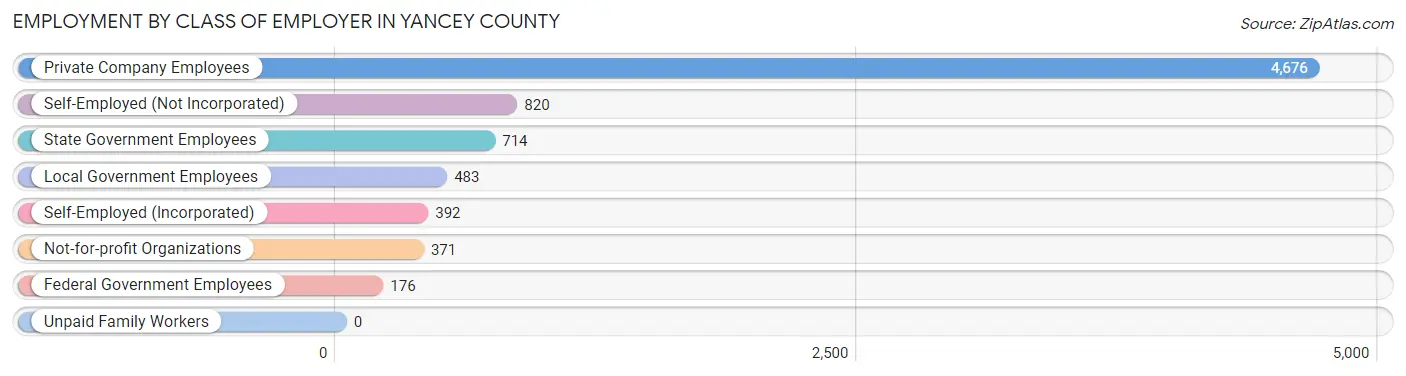
| Employer Class | # Employees | % Employees |
| Private Company Employees | 4,676 | 61.3% |
| Self-Employed (Incorporated) | 392 | 5.1% |
| Self-Employed (Not Incorporated) | 820 | 10.7% |
| Not-for-profit Organizations | 371 | 4.9% |
| Local Government Employees | 483 | 6.3% |
| State Government Employees | 714 | 9.4% |
| Federal Government Employees | 176 | 2.3% |
| Unpaid Family Workers | 0 | 0.0% |
| Total | 7,632 | 100.0% |
Employment Status by Age in Yancey County
According to the labor force statistics for Yancey County, out of the total population over 16 years of age (15,513), 53.8% or 8,346 individuals are in the labor force, with 7.6% or 634 of them unemployed. The age group with the highest labor force participation rate is 30 to 34 years, with 84.8% or 791 individuals in the labor force. Within the labor force, the 16 to 19 years age range has the highest percentage of unemployed individuals, with 18.8% or 62 of them being unemployed.
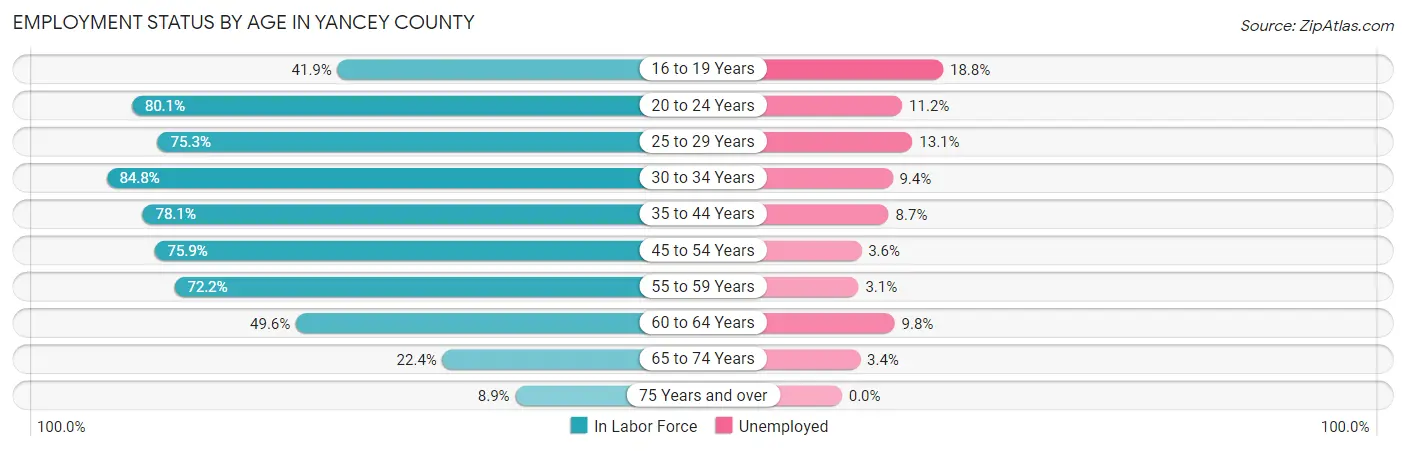
| Age Bracket | In Labor Force | Unemployed |
| 16 to 19 Years | 329 (41.9%) | 62 (18.8%) |
| 20 to 24 Years | 703 (80.1%) | 79 (11.2%) |
| 25 to 29 Years | 755 (75.3%) | 99 (13.1%) |
| 30 to 34 Years | 791 (84.8%) | 74 (9.4%) |
| 35 to 44 Years | 1,500 (78.1%) | 130 (8.7%) |
| 45 to 54 Years | 1,841 (75.9%) | 66 (3.6%) |
| 55 to 59 Years | 860 (72.2%) | 27 (3.1%) |
| 60 to 64 Years | 757 (49.6%) | 74 (9.8%) |
| 65 to 74 Years | 624 (22.4%) | 21 (3.4%) |
| 75 Years and over | 184 (8.9%) | 0 (0.0%) |
| Total | 8,346 (53.8%) | 634 (7.6%) |
Employment Status by Educational Attainment in Yancey County
According to labor force statistics for Yancey County, 72.3% of individuals (6,506) out of the total population between 25 and 64 years of age (8,999) are in the labor force, with 7.2% or 468 of them being unemployed. The group with the highest labor force participation rate are those with the educational attainment of bachelor's degree or higher, with 82.2% or 1,628 individuals in the labor force. Within the labor force, individuals with less than high school education have the highest percentage of unemployment, with 15.1% or 45 of them being unemployed.
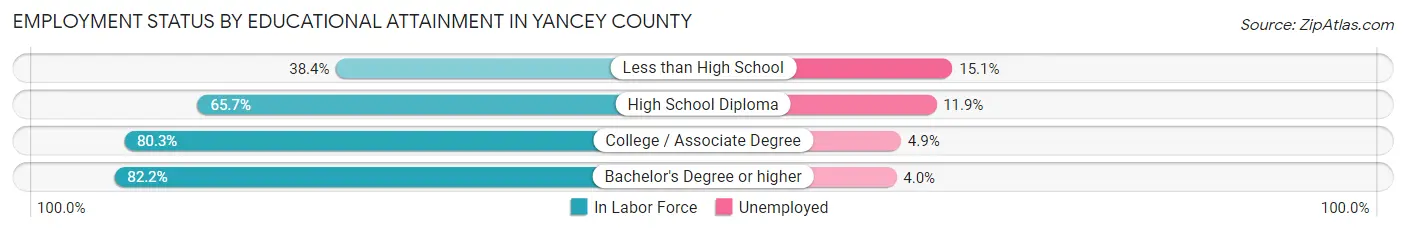
| Educational Attainment | In Labor Force | Unemployed |
| Less than High School | 298 (38.4%) | 117 (15.1%) |
| High School Diploma | 1,943 (65.7%) | 352 (11.9%) |
| College / Associate Degree | 2,637 (80.3%) | 161 (4.9%) |
| Bachelor's Degree or higher | 1,628 (82.2%) | 79 (4.0%) |
| Total | 6,506 (72.3%) | 648 (7.2%) |
Employment Occupations by Sex in Yancey County
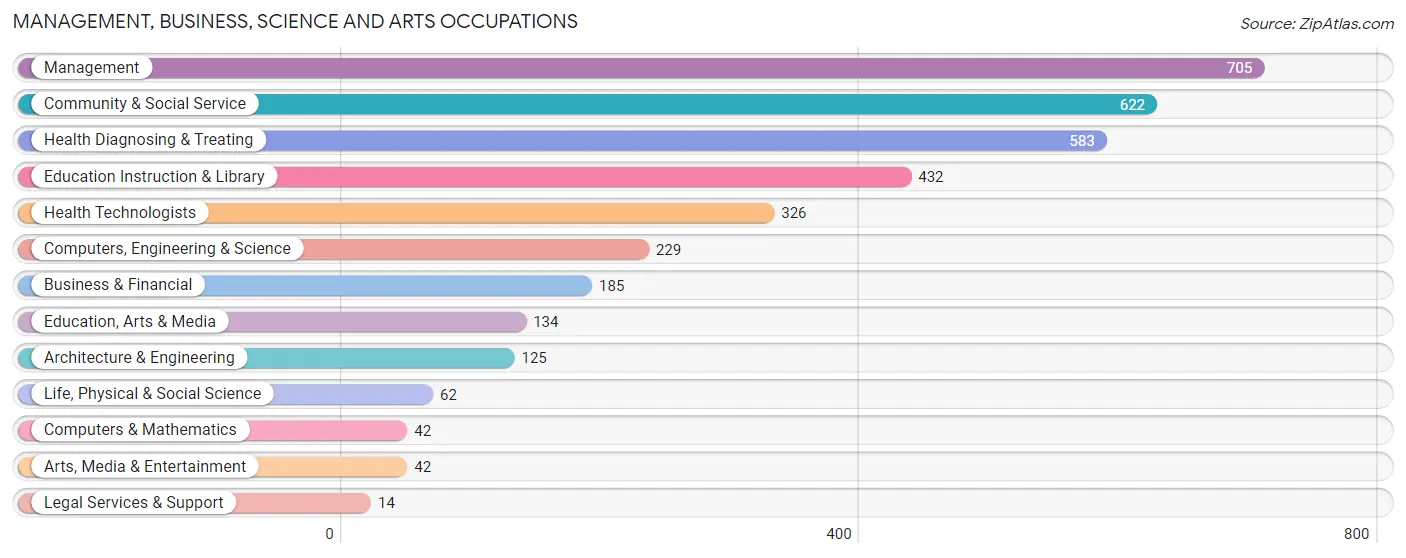
Management, Business, Science and Arts Occupations
The most common Management, Business, Science and Arts occupations in Yancey County are Management (705 | 9.2%), Community & Social Service (622 | 8.1%), Health Diagnosing & Treating (583 | 7.6%), Education Instruction & Library (432 | 5.6%), and Health Technologists (326 | 4.2%).
Management, Business, Science and Arts Occupations by Sex
Within the Management, Business, Science and Arts occupations in Yancey County, the most male-oriented occupations are Life, Physical & Social Science (100.0%), Computers, Engineering & Science (81.2%), and Architecture & Engineering (79.2%), while the most female-oriented occupations are Health Diagnosing & Treating (85.8%), Legal Services & Support (78.6%), and Business & Financial (77.3%).
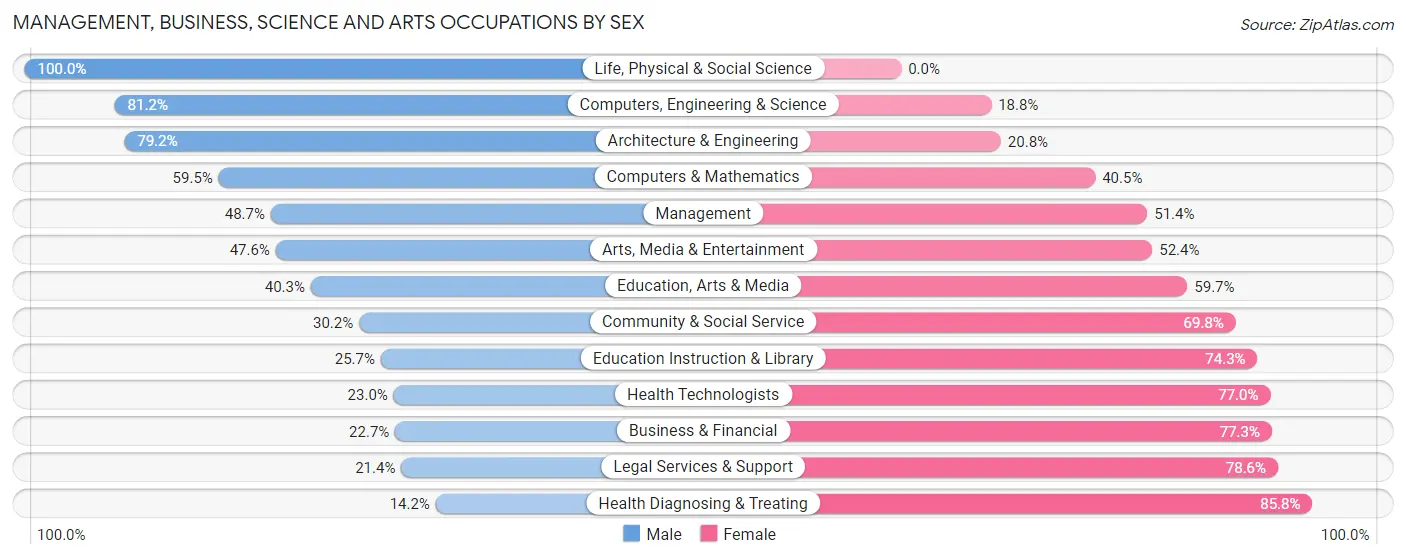
| Occupation | Male | Female |
| Management | 343 (48.6%) | 362 (51.3%) |
| Business & Financial | 42 (22.7%) | 143 (77.3%) |
| Computers, Engineering & Science | 186 (81.2%) | 43 (18.8%) |
| Computers & Mathematics | 25 (59.5%) | 17 (40.5%) |
| Architecture & Engineering | 99 (79.2%) | 26 (20.8%) |
| Life, Physical & Social Science | 62 (100.0%) | 0 (0.0%) |
| Community & Social Service | 188 (30.2%) | 434 (69.8%) |
| Education, Arts & Media | 54 (40.3%) | 80 (59.7%) |
| Legal Services & Support | 3 (21.4%) | 11 (78.6%) |
| Education Instruction & Library | 111 (25.7%) | 321 (74.3%) |
| Arts, Media & Entertainment | 20 (47.6%) | 22 (52.4%) |
| Health Diagnosing & Treating | 83 (14.2%) | 500 (85.8%) |
| Health Technologists | 75 (23.0%) | 251 (77.0%) |
| Total (Category) | 842 (36.2%) | 1,482 (63.8%) |
| Total (Overall) | 3,814 (49.6%) | 3,882 (50.4%) |
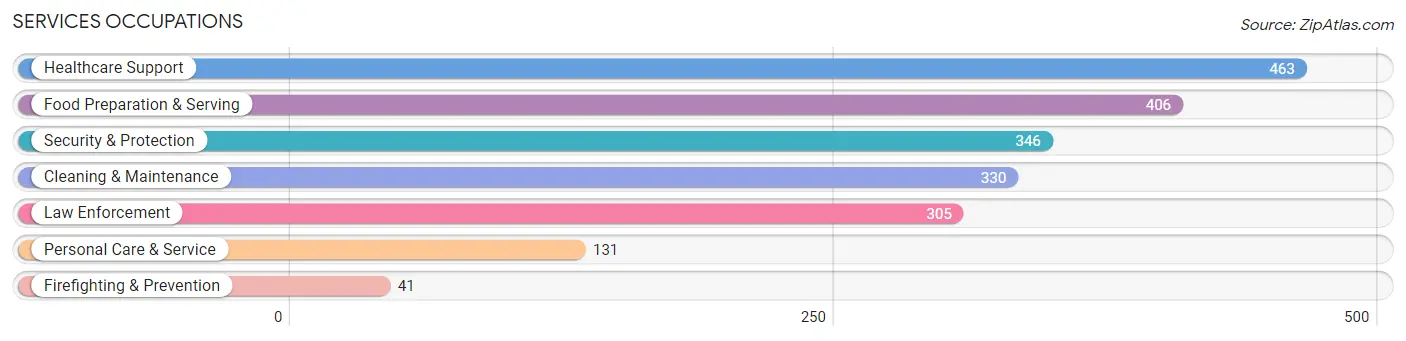
Services Occupations
The most common Services occupations in Yancey County are Healthcare Support (463 | 6.0%), Food Preparation & Serving (406 | 5.3%), Security & Protection (346 | 4.5%), Cleaning & Maintenance (330 | 4.3%), and Law Enforcement (305 | 4.0%).
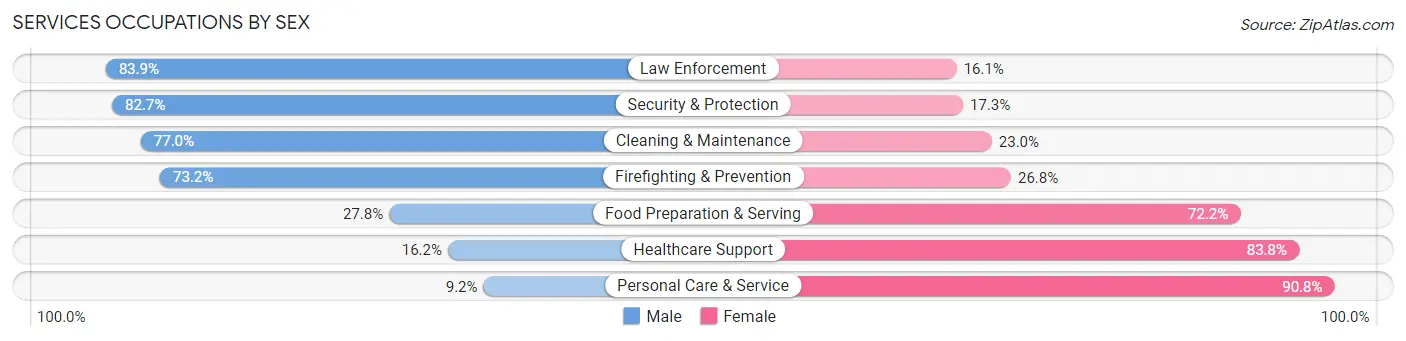
Services Occupations by Sex
Within the Services occupations in Yancey County, the most male-oriented occupations are Law Enforcement (83.9%), Security & Protection (82.7%), and Cleaning & Maintenance (77.0%), while the most female-oriented occupations are Personal Care & Service (90.8%), Healthcare Support (83.8%), and Food Preparation & Serving (72.2%).
| Occupation | Male | Female |
| Healthcare Support | 75 (16.2%) | 388 (83.8%) |
| Security & Protection | 286 (82.7%) | 60 (17.3%) |
| Firefighting & Prevention | 30 (73.2%) | 11 (26.8%) |
| Law Enforcement | 256 (83.9%) | 49 (16.1%) |
| Food Preparation & Serving | 113 (27.8%) | 293 (72.2%) |
| Cleaning & Maintenance | 254 (77.0%) | 76 (23.0%) |
| Personal Care & Service | 12 (9.2%) | 119 (90.8%) |
| Total (Category) | 740 (44.2%) | 936 (55.8%) |
| Total (Overall) | 3,814 (49.6%) | 3,882 (50.4%) |
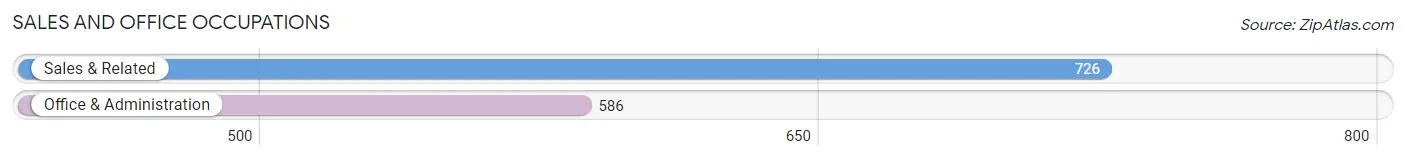
Sales and Office Occupations
The most common Sales and Office occupations in Yancey County are Sales & Related (726 | 9.4%), and Office & Administration (586 | 7.6%).
Sales and Office Occupations by Sex
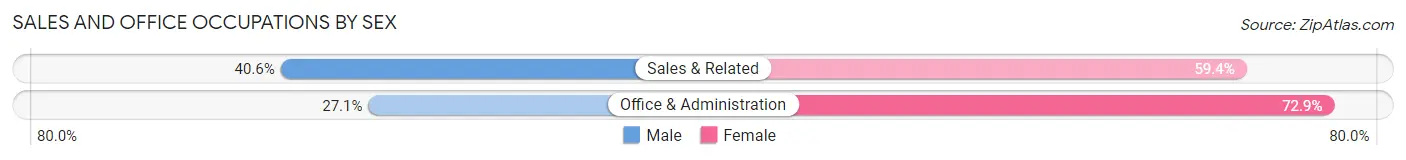
| Occupation | Male | Female |
| Sales & Related | 295 (40.6%) | 431 (59.4%) |
| Office & Administration | 159 (27.1%) | 427 (72.9%) |
| Total (Category) | 454 (34.6%) | 858 (65.4%) |
| Total (Overall) | 3,814 (49.6%) | 3,882 (50.4%) |
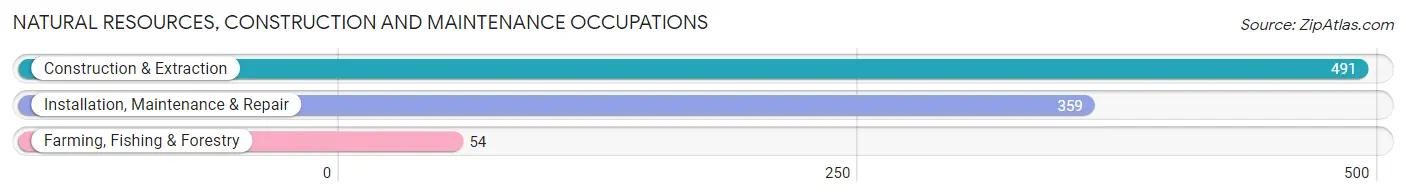
Natural Resources, Construction and Maintenance Occupations
The most common Natural Resources, Construction and Maintenance occupations in Yancey County are Construction & Extraction (491 | 6.4%), Installation, Maintenance & Repair (359 | 4.7%), and Farming, Fishing & Forestry (54 | 0.7%).
Natural Resources, Construction and Maintenance Occupations by Sex
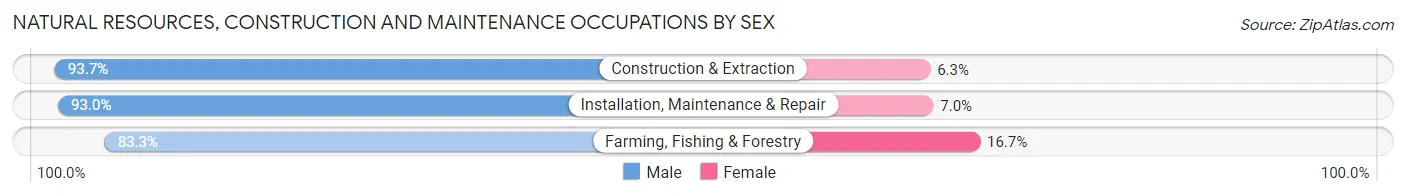
| Occupation | Male | Female |
| Farming, Fishing & Forestry | 45 (83.3%) | 9 (16.7%) |
| Construction & Extraction | 460 (93.7%) | 31 (6.3%) |
| Installation, Maintenance & Repair | 334 (93.0%) | 25 (7.0%) |
| Total (Category) | 839 (92.8%) | 65 (7.2%) |
| Total (Overall) | 3,814 (49.6%) | 3,882 (50.4%) |
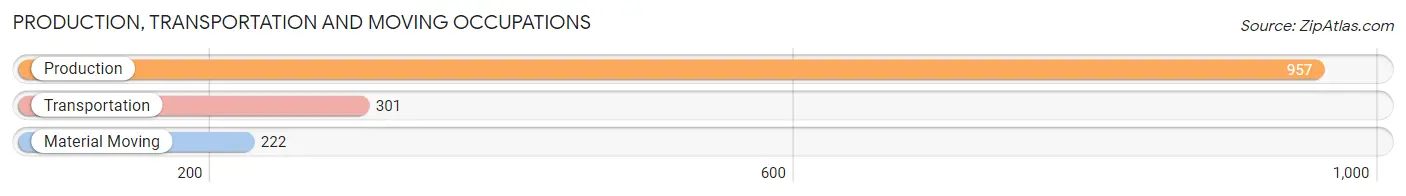
Production, Transportation and Moving Occupations
The most common Production, Transportation and Moving occupations in Yancey County are Production (957 | 12.4%), Transportation (301 | 3.9%), and Material Moving (222 | 2.9%).
Production, Transportation and Moving Occupations by Sex
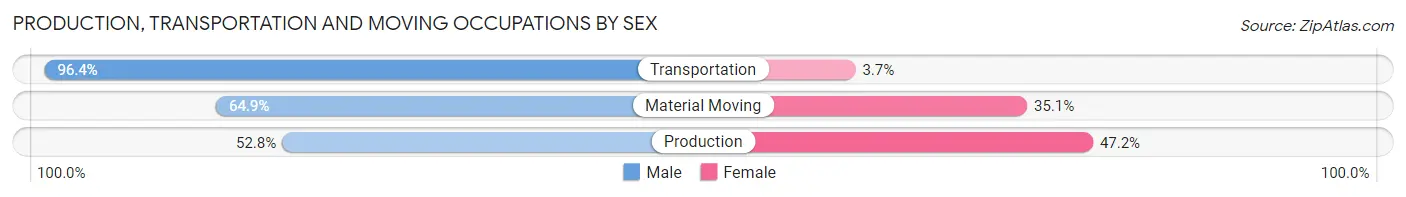
| Occupation | Male | Female |
| Production | 505 (52.8%) | 452 (47.2%) |
| Transportation | 290 (96.4%) | 11 (3.6%) |
| Material Moving | 144 (64.9%) | 78 (35.1%) |
| Total (Category) | 939 (63.4%) | 541 (36.5%) |
| Total (Overall) | 3,814 (49.6%) | 3,882 (50.4%) |
Employment Industries by Sex in Yancey County
Employment Industries in Yancey County
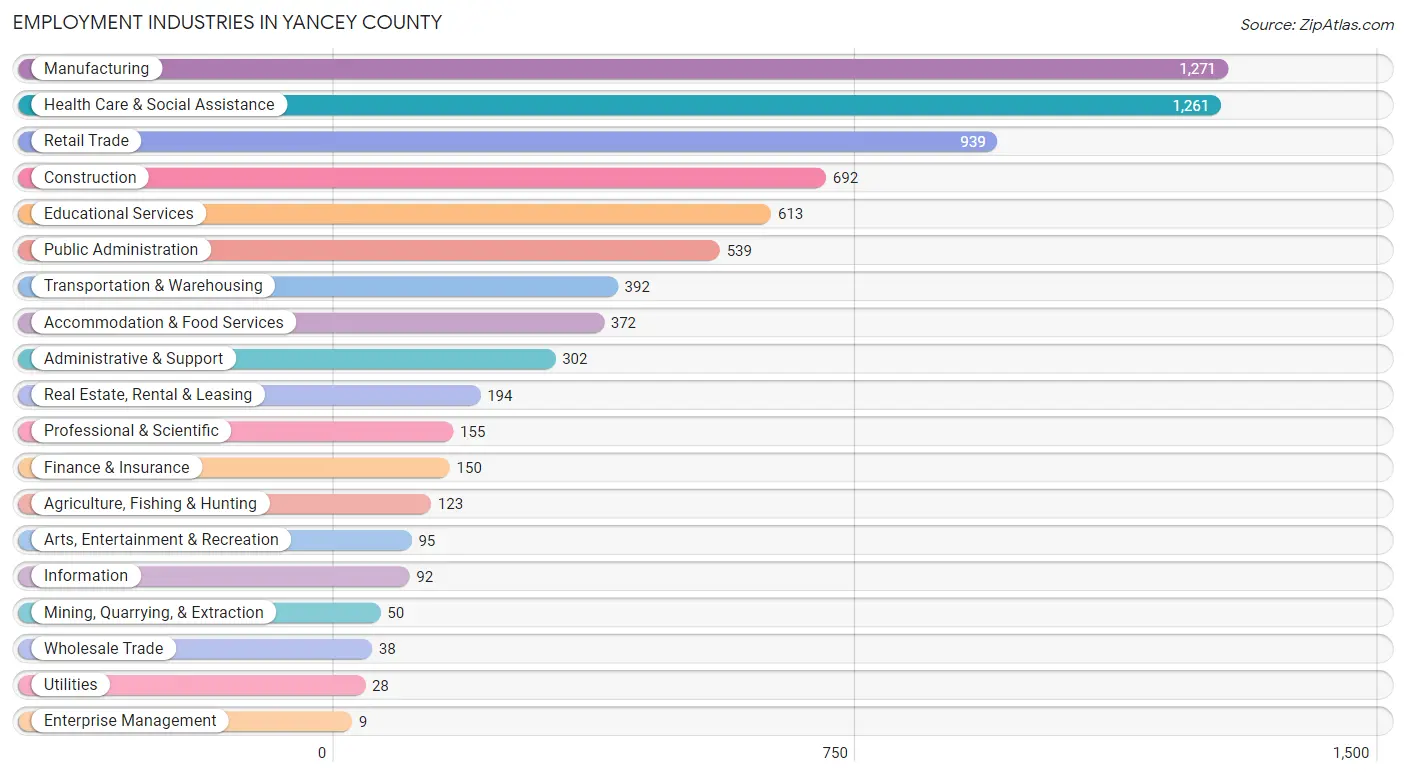
The major employment industries in Yancey County include Manufacturing (1,271 | 16.5%), Health Care & Social Assistance (1,261 | 16.4%), Retail Trade (939 | 12.2%), Construction (692 | 9.0%), and Educational Services (613 | 8.0%).
Employment Industries by Sex in Yancey County
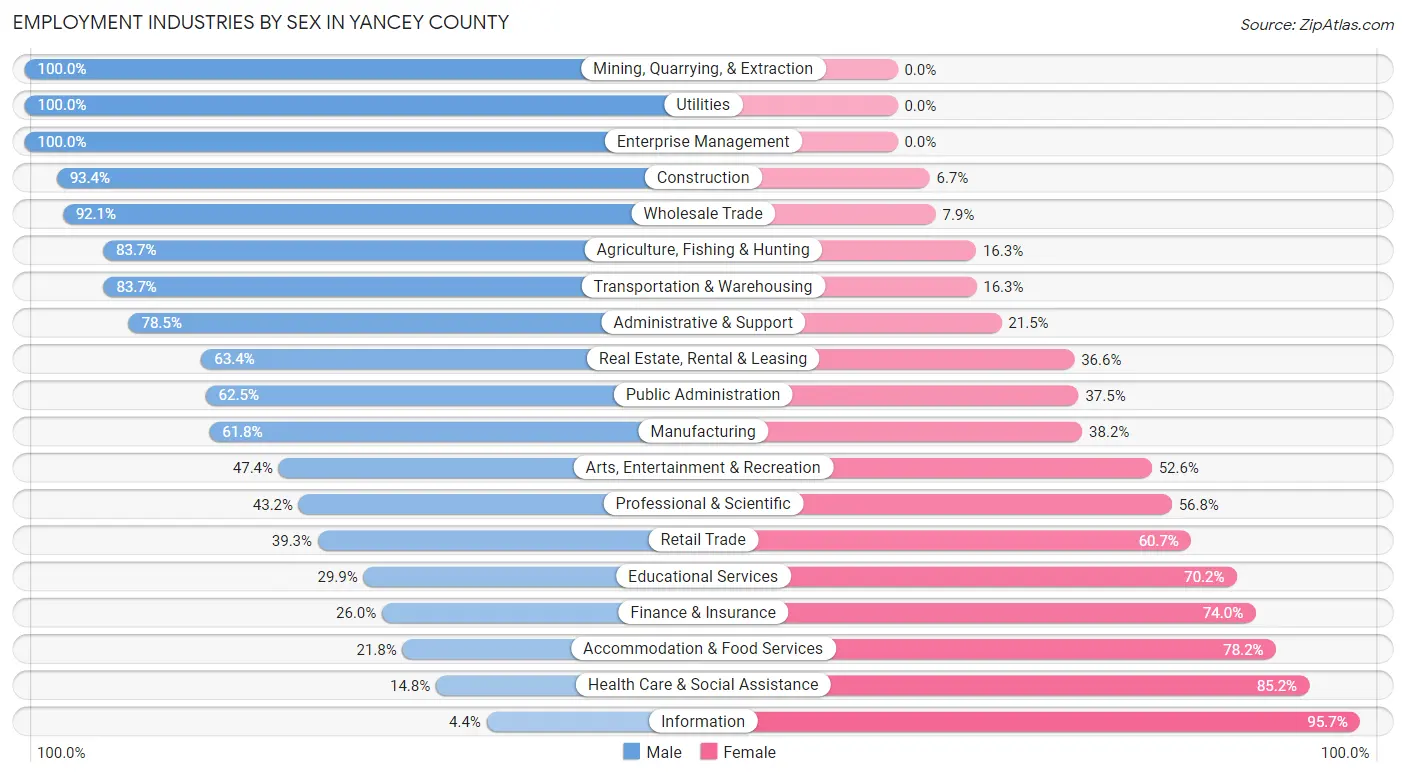
The Yancey County industries that see more men than women are Mining, Quarrying, & Extraction (100.0%), Utilities (100.0%), and Enterprise Management (100.0%), whereas the industries that tend to have a higher number of women are Information (95.7%), Health Care & Social Assistance (85.2%), and Accommodation & Food Services (78.2%).
| Industry | Male | Female |
| Agriculture, Fishing & Hunting | 103 (83.7%) | 20 (16.3%) |
| Mining, Quarrying, & Extraction | 50 (100.0%) | 0 (0.0%) |
| Construction | 646 (93.3%) | 46 (6.7%) |
| Manufacturing | 785 (61.8%) | 486 (38.2%) |
| Wholesale Trade | 35 (92.1%) | 3 (7.9%) |
| Retail Trade | 369 (39.3%) | 570 (60.7%) |
| Transportation & Warehousing | 328 (83.7%) | 64 (16.3%) |
| Utilities | 28 (100.0%) | 0 (0.0%) |
| Information | 4 (4.3%) | 88 (95.7%) |
| Finance & Insurance | 39 (26.0%) | 111 (74.0%) |
| Real Estate, Rental & Leasing | 123 (63.4%) | 71 (36.6%) |
| Professional & Scientific | 67 (43.2%) | 88 (56.8%) |
| Enterprise Management | 9 (100.0%) | 0 (0.0%) |
| Administrative & Support | 237 (78.5%) | 65 (21.5%) |
| Educational Services | 183 (29.8%) | 430 (70.2%) |
| Health Care & Social Assistance | 187 (14.8%) | 1,074 (85.2%) |
| Arts, Entertainment & Recreation | 45 (47.4%) | 50 (52.6%) |
| Accommodation & Food Services | 81 (21.8%) | 291 (78.2%) |
| Public Administration | 337 (62.5%) | 202 (37.5%) |
| Total | 3,814 (49.6%) | 3,882 (50.4%) |
Education in Yancey County
School Enrollment in Yancey County
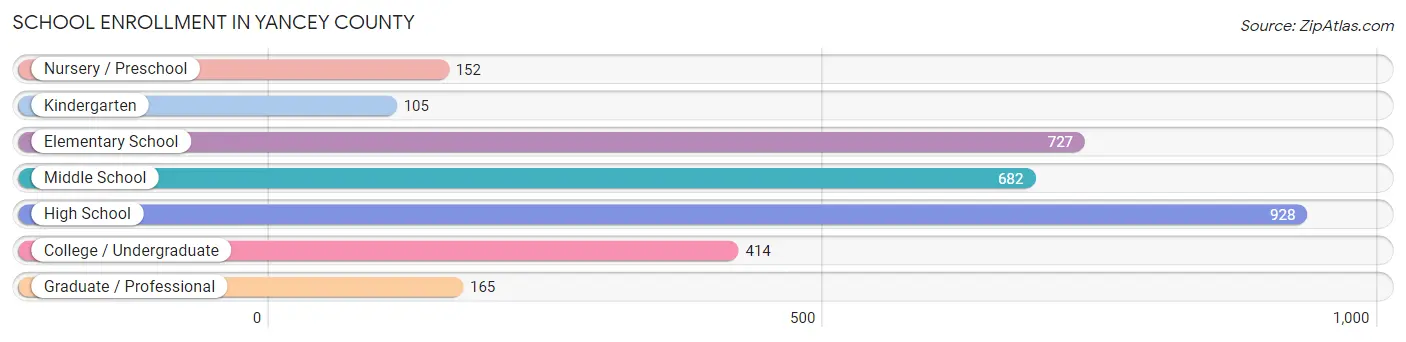
The most common levels of schooling among the 3,173 students in Yancey County are high school (928 | 29.2%), elementary school (727 | 22.9%), and middle school (682 | 21.5%).
| School Level | # Students | % Students |
| Nursery / Preschool | 152 | 4.8% |
| Kindergarten | 105 | 3.3% |
| Elementary School | 727 | 22.9% |
| Middle School | 682 | 21.5% |
| High School | 928 | 29.2% |
| College / Undergraduate | 414 | 13.1% |
| Graduate / Professional | 165 | 5.2% |
| Total | 3,173 | 100.0% |
School Enrollment by Age by Funding Source in Yancey County
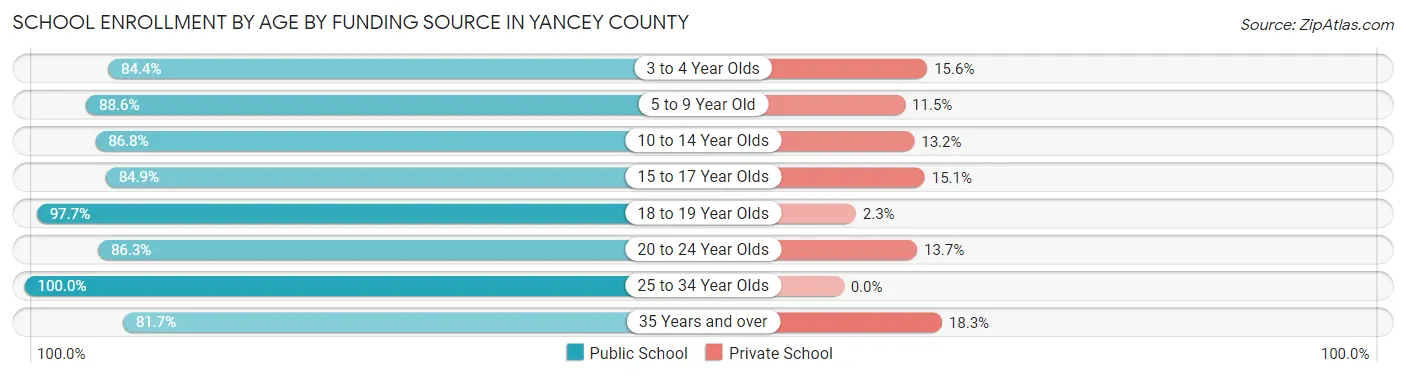
Out of a total of 3,173 students who are enrolled in schools in Yancey County, 384 (12.1%) attend a private institution, while the remaining 2,789 (87.9%) are enrolled in public schools. The age group of 35 years and over has the highest likelihood of being enrolled in private schools, with 43 (18.3% in the age bracket) enrolled. Conversely, the age group of 25 to 34 year olds has the lowest likelihood of being enrolled in a private school, with 123 (100.0% in the age bracket) attending a public institution.
| Age Bracket | Public School | Private School |
| 3 to 4 Year Olds | 76 (84.4%) | 14 (15.6%) |
| 5 to 9 Year Old | 727 (88.5%) | 94 (11.5%) |
| 10 to 14 Year Olds | 838 (86.8%) | 127 (13.2%) |
| 15 to 17 Year Olds | 455 (84.9%) | 81 (15.1%) |
| 18 to 19 Year Olds | 258 (97.7%) | 6 (2.3%) |
| 20 to 24 Year Olds | 120 (86.3%) | 19 (13.7%) |
| 25 to 34 Year Olds | 123 (100.0%) | 0 (0.0%) |
| 35 Years and over | 192 (81.7%) | 43 (18.3%) |
| Total | 2,789 (87.9%) | 384 (12.1%) |
Educational Attainment by Field of Study in Yancey County
Education (597 | 17.3%), business (525 | 15.2%), science & technology (394 | 11.4%), visual & performing arts (322 | 9.3%), and liberal arts & history (255 | 7.4%) are the most common fields of study among 3,451 individuals in Yancey County who have obtained a bachelor's degree or higher.
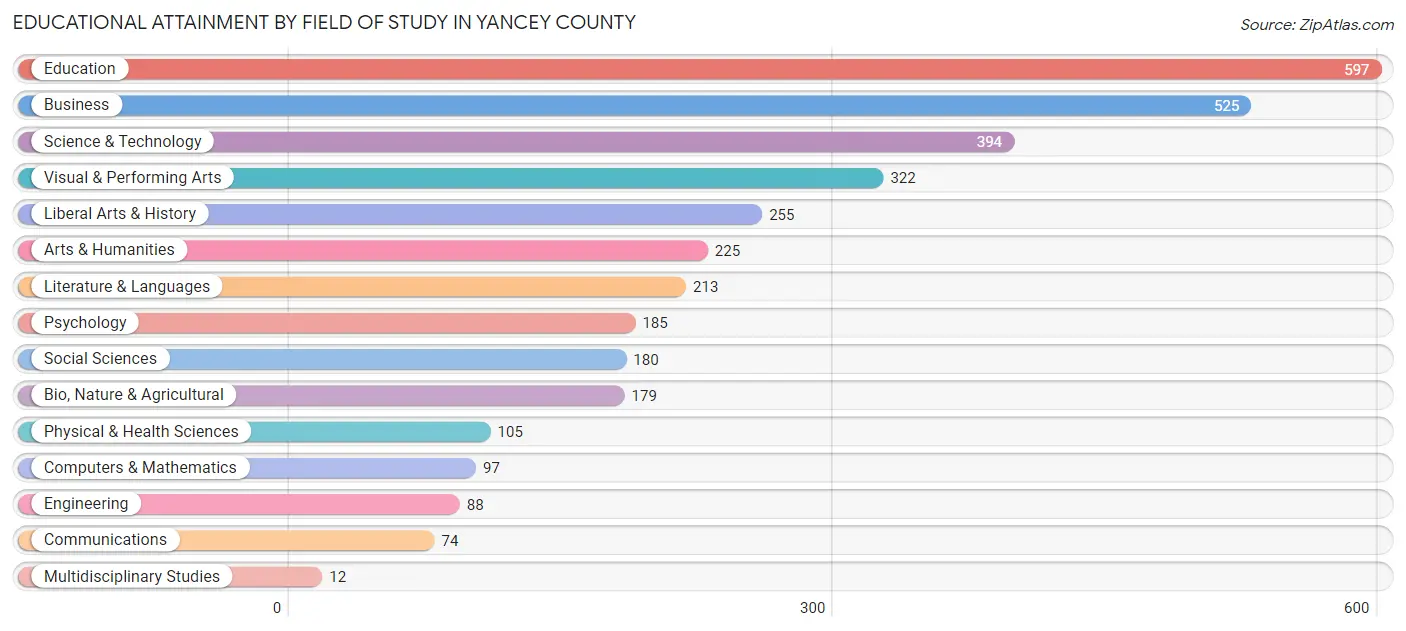
| Field of Study | # Graduates | % Graduates |
| Computers & Mathematics | 97 | 2.8% |
| Bio, Nature & Agricultural | 179 | 5.2% |
| Physical & Health Sciences | 105 | 3.0% |
| Psychology | 185 | 5.4% |
| Social Sciences | 180 | 5.2% |
| Engineering | 88 | 2.5% |
| Multidisciplinary Studies | 12 | 0.4% |
| Science & Technology | 394 | 11.4% |
| Business | 525 | 15.2% |
| Education | 597 | 17.3% |
| Literature & Languages | 213 | 6.2% |
| Liberal Arts & History | 255 | 7.4% |
| Visual & Performing Arts | 322 | 9.3% |
| Communications | 74 | 2.1% |
| Arts & Humanities | 225 | 6.5% |
| Total | 3,451 | 100.0% |
Transportation & Commute in Yancey County
Vehicle Availability by Sex in Yancey County
The most prevalent vehicle ownership categories in Yancey County are males with 2 vehicles (1,373, accounting for 36.2%) and females with 2 vehicles (1,359, making up 35.8%).
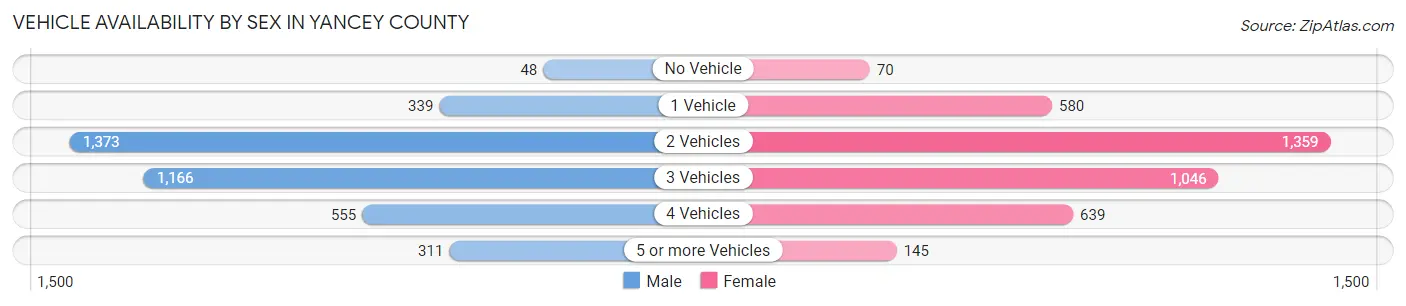
| Vehicles Available | Male | Female |
| No Vehicle | 48 (1.3%) | 70 (1.8%) |
| 1 Vehicle | 339 (8.9%) | 580 (15.1%) |
| 2 Vehicles | 1,373 (36.2%) | 1,359 (35.4%) |
| 3 Vehicles | 1,166 (30.7%) | 1,046 (27.3%) |
| 4 Vehicles | 555 (14.6%) | 639 (16.6%) |
| 5 or more Vehicles | 311 (8.2%) | 145 (3.8%) |
| Total | 3,792 (100.0%) | 3,839 (100.0%) |
Commute Time in Yancey County
The most frequently occuring commute durations in Yancey County are 10 to 14 minutes (1,168 commuters, 16.5%), 15 to 19 minutes (1,135 commuters, 16.0%), and 5 to 9 minutes (783 commuters, 11.1%).
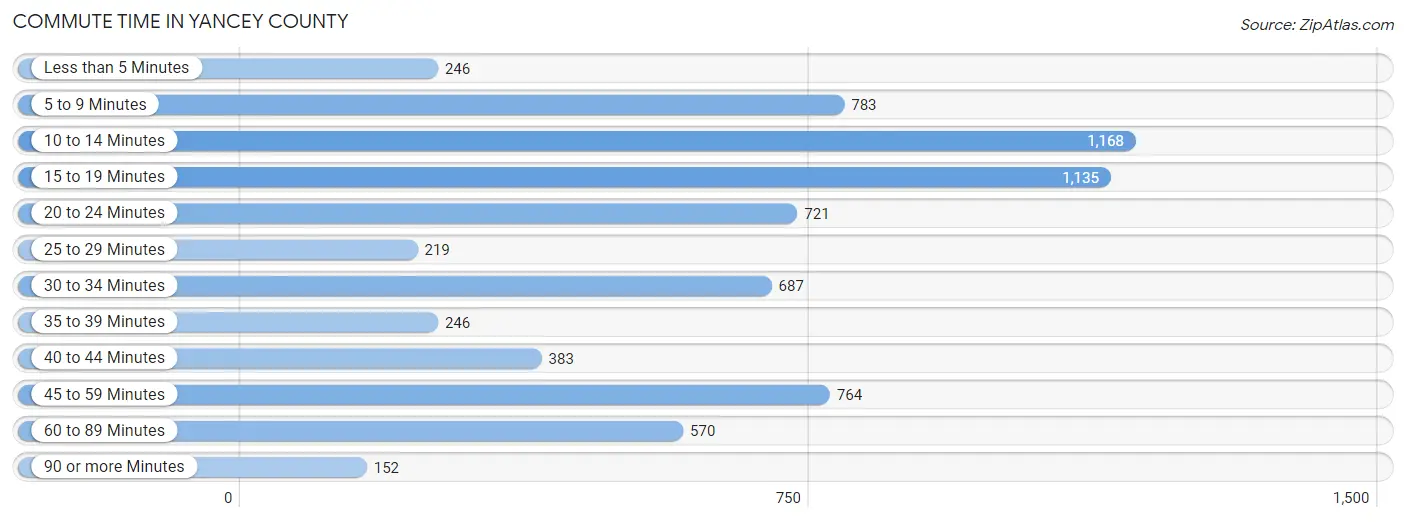
| Commute Time | # Commuters | % Commuters |
| Less than 5 Minutes | 246 | 3.5% |
| 5 to 9 Minutes | 783 | 11.1% |
| 10 to 14 Minutes | 1,168 | 16.5% |
| 15 to 19 Minutes | 1,135 | 16.0% |
| 20 to 24 Minutes | 721 | 10.2% |
| 25 to 29 Minutes | 219 | 3.1% |
| 30 to 34 Minutes | 687 | 9.7% |
| 35 to 39 Minutes | 246 | 3.5% |
| 40 to 44 Minutes | 383 | 5.4% |
| 45 to 59 Minutes | 764 | 10.8% |
| 60 to 89 Minutes | 570 | 8.1% |
| 90 or more Minutes | 152 | 2.1% |
Commute Time by Sex in Yancey County
The most common commute times in Yancey County are 10 to 14 minutes (575 commuters, 16.0%) for males and 15 to 19 minutes (684 commuters, 19.7%) for females.
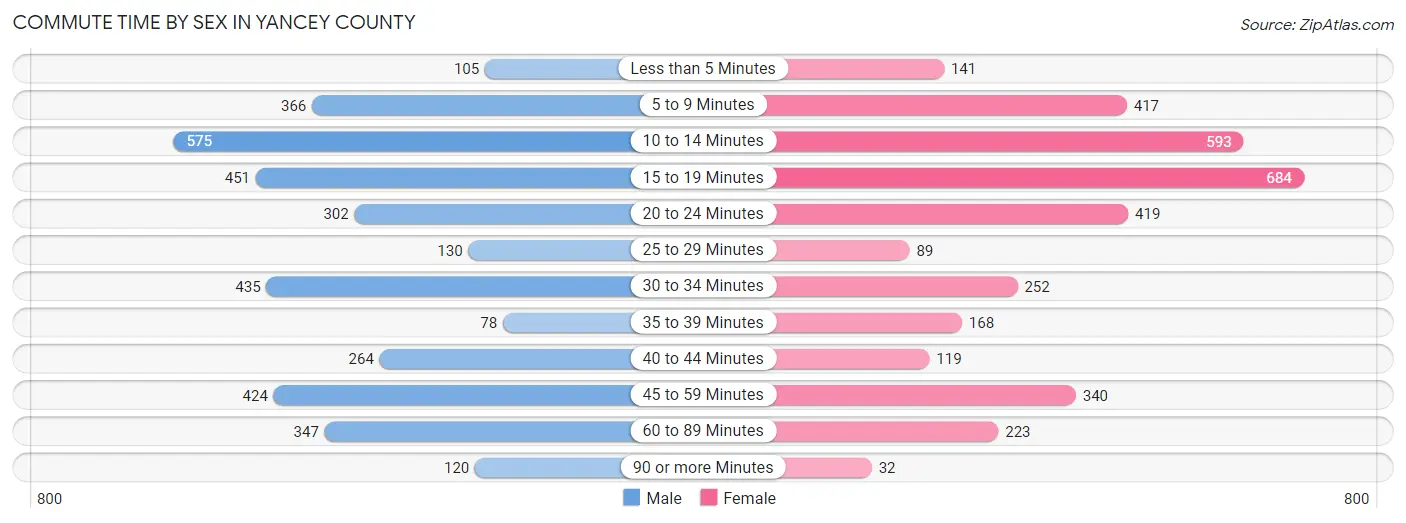
| Commute Time | Male | Female |
| Less than 5 Minutes | 105 (2.9%) | 141 (4.1%) |
| 5 to 9 Minutes | 366 (10.2%) | 417 (12.0%) |
| 10 to 14 Minutes | 575 (16.0%) | 593 (17.1%) |
| 15 to 19 Minutes | 451 (12.5%) | 684 (19.7%) |
| 20 to 24 Minutes | 302 (8.4%) | 419 (12.0%) |
| 25 to 29 Minutes | 130 (3.6%) | 89 (2.6%) |
| 30 to 34 Minutes | 435 (12.1%) | 252 (7.2%) |
| 35 to 39 Minutes | 78 (2.2%) | 168 (4.8%) |
| 40 to 44 Minutes | 264 (7.3%) | 119 (3.4%) |
| 45 to 59 Minutes | 424 (11.8%) | 340 (9.8%) |
| 60 to 89 Minutes | 347 (9.7%) | 223 (6.4%) |
| 90 or more Minutes | 120 (3.3%) | 32 (0.9%) |
Time of Departure to Work by Sex in Yancey County
The most frequent times of departure to work in Yancey County are 7:00 AM to 7:29 AM (519, 14.4%) for males and 7:30 AM to 7:59 AM (622, 17.9%) for females.
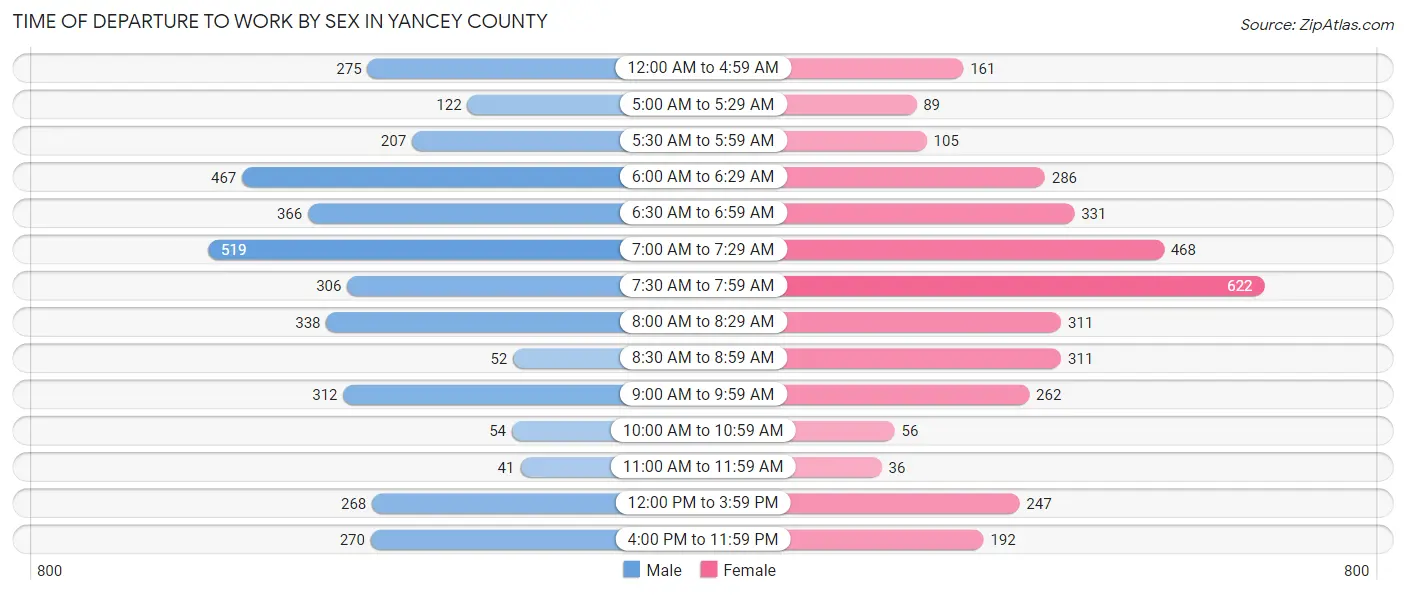
| Time of Departure | Male | Female |
| 12:00 AM to 4:59 AM | 275 (7.6%) | 161 (4.6%) |
| 5:00 AM to 5:29 AM | 122 (3.4%) | 89 (2.6%) |
| 5:30 AM to 5:59 AM | 207 (5.8%) | 105 (3.0%) |
| 6:00 AM to 6:29 AM | 467 (13.0%) | 286 (8.2%) |
| 6:30 AM to 6:59 AM | 366 (10.2%) | 331 (9.5%) |
| 7:00 AM to 7:29 AM | 519 (14.4%) | 468 (13.5%) |
| 7:30 AM to 7:59 AM | 306 (8.5%) | 622 (17.9%) |
| 8:00 AM to 8:29 AM | 338 (9.4%) | 311 (8.9%) |
| 8:30 AM to 8:59 AM | 52 (1.5%) | 311 (8.9%) |
| 9:00 AM to 9:59 AM | 312 (8.7%) | 262 (7.5%) |
| 10:00 AM to 10:59 AM | 54 (1.5%) | 56 (1.6%) |
| 11:00 AM to 11:59 AM | 41 (1.1%) | 36 (1.0%) |
| 12:00 PM to 3:59 PM | 268 (7.4%) | 247 (7.1%) |
| 4:00 PM to 11:59 PM | 270 (7.5%) | 192 (5.5%) |
| Total | 3,597 (100.0%) | 3,477 (100.0%) |
Housing Occupancy in Yancey County
Occupancy by Ownership in Yancey County
Of the total 7,859 dwellings in Yancey County, owner-occupied units account for 6,162 (78.4%), while renter-occupied units make up 1,697 (21.6%).

| Occupancy | # Housing Units | % Housing Units |
| Owner Occupied Housing Units | 6,162 | 78.4% |
| Renter-Occupied Housing Units | 1,697 | 21.6% |
| Total Occupied Housing Units | 7,859 | 100.0% |
Occupancy by Household Size in Yancey County
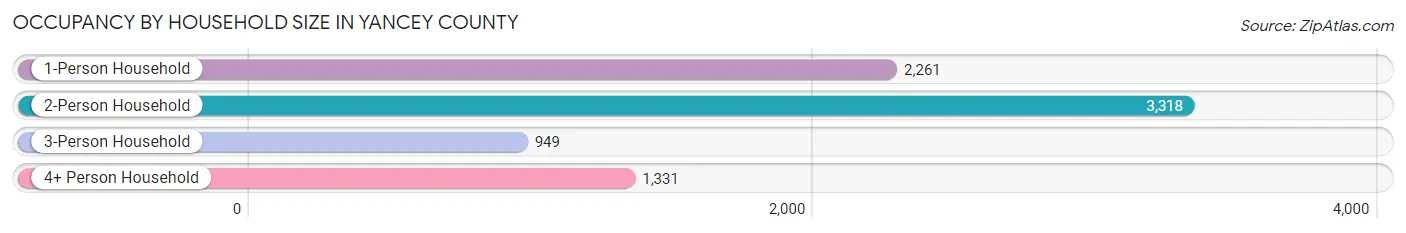
| Household Size | # Housing Units | % Housing Units |
| 1-Person Household | 2,261 | 28.8% |
| 2-Person Household | 3,318 | 42.2% |
| 3-Person Household | 949 | 12.1% |
| 4+ Person Household | 1,331 | 16.9% |
| Total Housing Units | 7,859 | 100.0% |
Occupancy by Ownership by Household Size in Yancey County
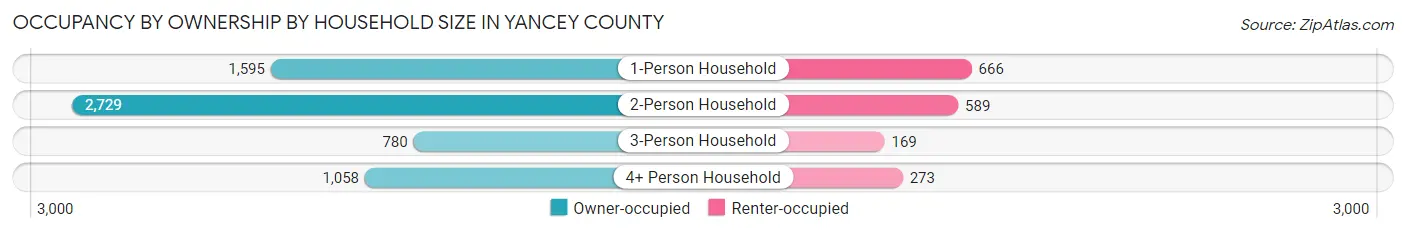
| Household Size | Owner-occupied | Renter-occupied |
| 1-Person Household | 1,595 (70.5%) | 666 (29.5%) |
| 2-Person Household | 2,729 (82.3%) | 589 (17.7%) |
| 3-Person Household | 780 (82.2%) | 169 (17.8%) |
| 4+ Person Household | 1,058 (79.5%) | 273 (20.5%) |
| Total Housing Units | 6,162 (78.4%) | 1,697 (21.6%) |
Occupancy by Educational Attainment in Yancey County
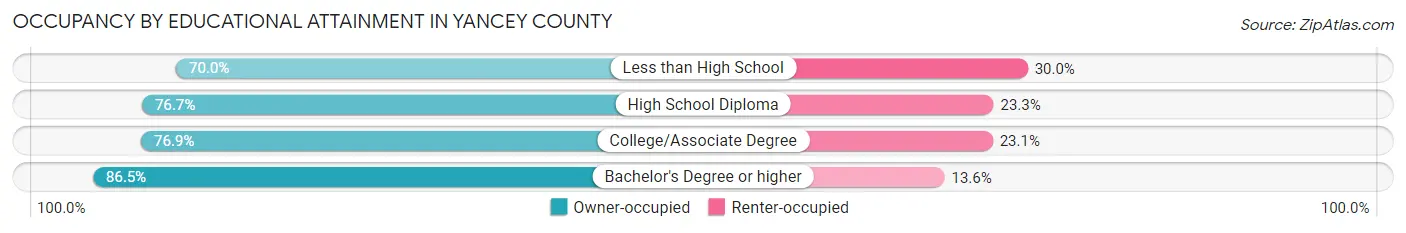
| Household Size | Owner-occupied | Renter-occupied |
| Less than High School | 545 (70.0%) | 234 (30.0%) |
| High School Diploma | 1,892 (76.7%) | 574 (23.3%) |
| College/Associate Degree | 2,123 (76.9%) | 638 (23.1%) |
| Bachelor's Degree or higher | 1,602 (86.5%) | 251 (13.6%) |
Occupancy by Age of Householder in Yancey County
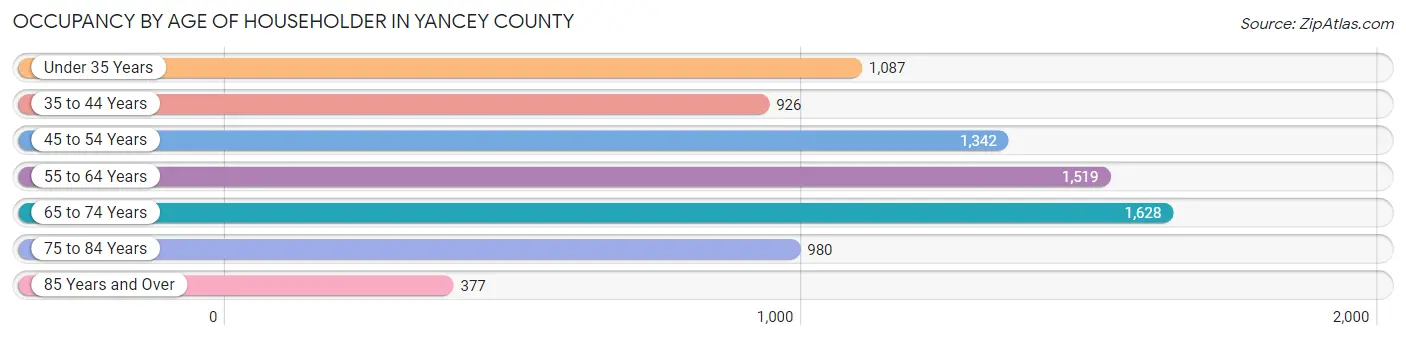
| Age Bracket | # Households | % Households |
| Under 35 Years | 1,087 | 13.8% |
| 35 to 44 Years | 926 | 11.8% |
| 45 to 54 Years | 1,342 | 17.1% |
| 55 to 64 Years | 1,519 | 19.3% |
| 65 to 74 Years | 1,628 | 20.7% |
| 75 to 84 Years | 980 | 12.5% |
| 85 Years and Over | 377 | 4.8% |
| Total | 7,859 | 100.0% |
Housing Finances in Yancey County
Median Income by Occupancy in Yancey County
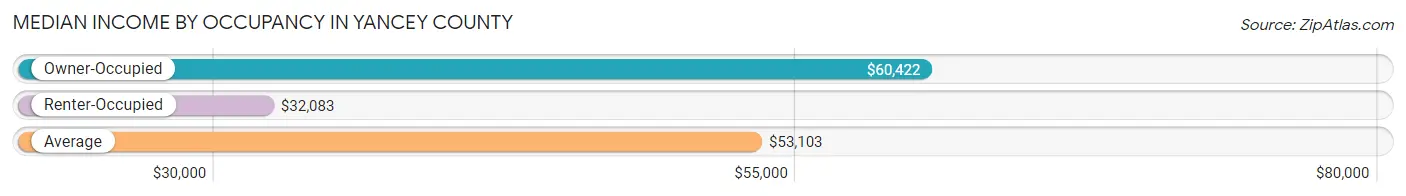
| Occupancy Type | # Households | Median Income |
| Owner-Occupied | 6,162 (78.4%) | $60,422 |
| Renter-Occupied | 1,697 (21.6%) | $32,083 |
| Average | 7,859 (100.0%) | $53,103 |
Occupancy by Householder Income Bracket in Yancey County
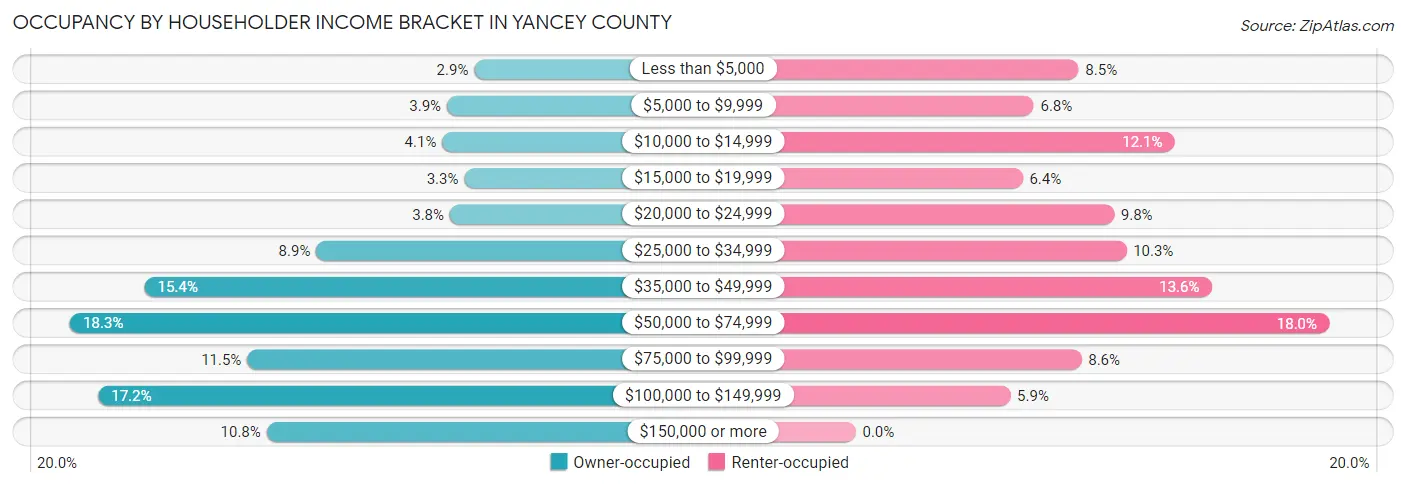
| Income Bracket | Owner-occupied | Renter-occupied |
| Less than $5,000 | 177 (2.9%) | 144 (8.5%) |
| $5,000 to $9,999 | 241 (3.9%) | 115 (6.8%) |
| $10,000 to $14,999 | 252 (4.1%) | 206 (12.1%) |
| $15,000 to $19,999 | 200 (3.3%) | 108 (6.4%) |
| $20,000 to $24,999 | 234 (3.8%) | 167 (9.8%) |
| $25,000 to $34,999 | 548 (8.9%) | 175 (10.3%) |
| $35,000 to $49,999 | 951 (15.4%) | 230 (13.6%) |
| $50,000 to $74,999 | 1,126 (18.3%) | 306 (18.0%) |
| $75,000 to $99,999 | 710 (11.5%) | 146 (8.6%) |
| $100,000 to $149,999 | 1,059 (17.2%) | 100 (5.9%) |
| $150,000 or more | 664 (10.8%) | 0 (0.0%) |
| Total | 6,162 (100.0%) | 1,697 (100.0%) |
Monthly Housing Cost Tiers in Yancey County
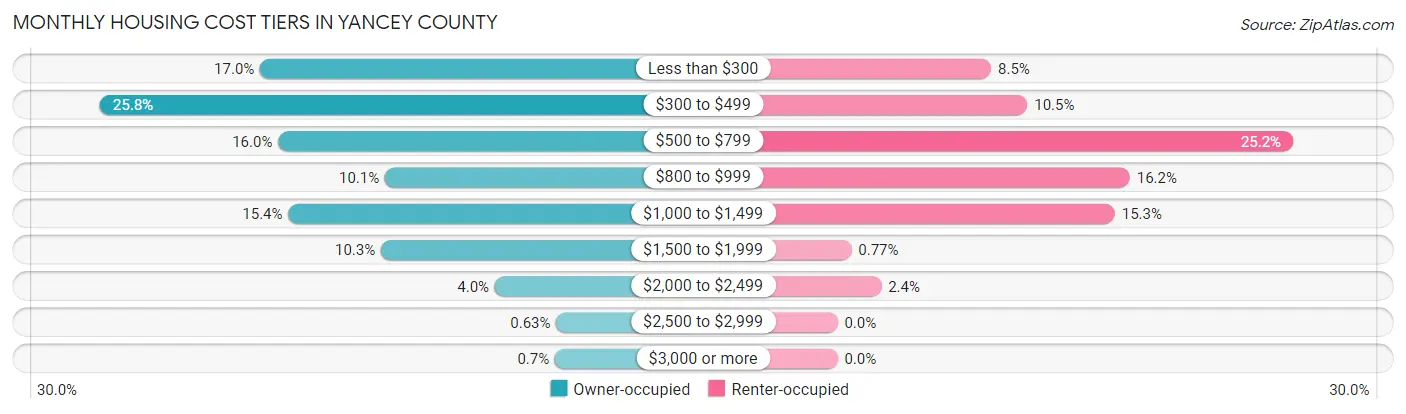
| Monthly Cost | Owner-occupied | Renter-occupied |
| Less than $300 | 1,047 (17.0%) | 144 (8.5%) |
| $300 to $499 | 1,592 (25.8%) | 178 (10.5%) |
| $500 to $799 | 985 (16.0%) | 427 (25.2%) |
| $800 to $999 | 622 (10.1%) | 274 (16.2%) |
| $1,000 to $1,499 | 951 (15.4%) | 260 (15.3%) |
| $1,500 to $1,999 | 635 (10.3%) | 13 (0.8%) |
| $2,000 to $2,499 | 248 (4.0%) | 41 (2.4%) |
| $2,500 to $2,999 | 39 (0.6%) | 0 (0.0%) |
| $3,000 or more | 43 (0.7%) | 0 (0.0%) |
| Total | 6,162 (100.0%) | 1,697 (100.0%) |
Physical Housing Characteristics in Yancey County
Housing Structures in Yancey County

| Structure Type | # Housing Units | % Housing Units |
| Single Unit, Detached | 5,735 | 73.0% |
| Single Unit, Attached | 84 | 1.1% |
| 2 Unit Apartments | 72 | 0.9% |
| 3 or 4 Unit Apartments | 178 | 2.3% |
| 5 to 9 Unit Apartments | 63 | 0.8% |
| 10 or more Apartments | 156 | 2.0% |
| Mobile Home / Other | 1,571 | 20.0% |
| Total | 7,859 | 100.0% |
Housing Structures by Occupancy in Yancey County
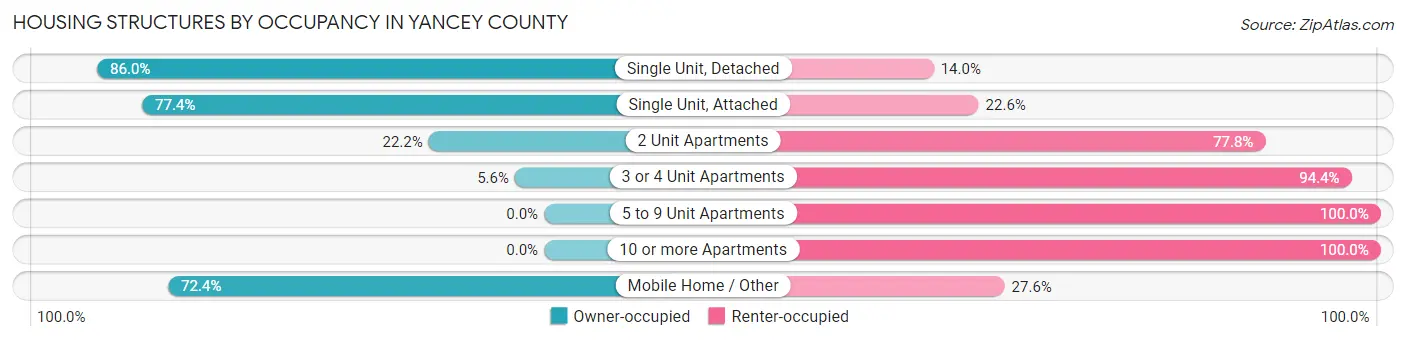
| Structure Type | Owner-occupied | Renter-occupied |
| Single Unit, Detached | 4,934 (86.0%) | 801 (14.0%) |
| Single Unit, Attached | 65 (77.4%) | 19 (22.6%) |
| 2 Unit Apartments | 16 (22.2%) | 56 (77.8%) |
| 3 or 4 Unit Apartments | 10 (5.6%) | 168 (94.4%) |
| 5 to 9 Unit Apartments | 0 (0.0%) | 63 (100.0%) |
| 10 or more Apartments | 0 (0.0%) | 156 (100.0%) |
| Mobile Home / Other | 1,137 (72.4%) | 434 (27.6%) |
| Total | 6,162 (78.4%) | 1,697 (21.6%) |
Housing Structures by Number of Rooms in Yancey County
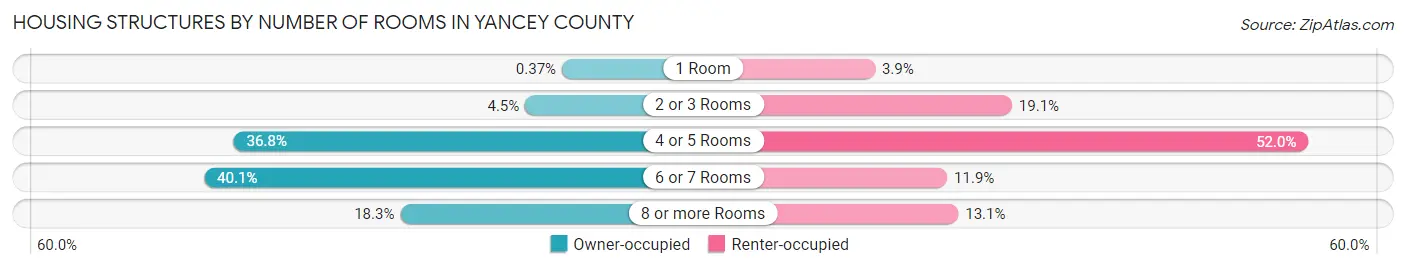
| Number of Rooms | Owner-occupied | Renter-occupied |
| 1 Room | 23 (0.4%) | 66 (3.9%) |
| 2 or 3 Rooms | 274 (4.4%) | 324 (19.1%) |
| 4 or 5 Rooms | 2,268 (36.8%) | 882 (52.0%) |
| 6 or 7 Rooms | 2,469 (40.1%) | 202 (11.9%) |
| 8 or more Rooms | 1,128 (18.3%) | 223 (13.1%) |
| Total | 6,162 (100.0%) | 1,697 (100.0%) |
Housing Structure by Heating Type in Yancey County
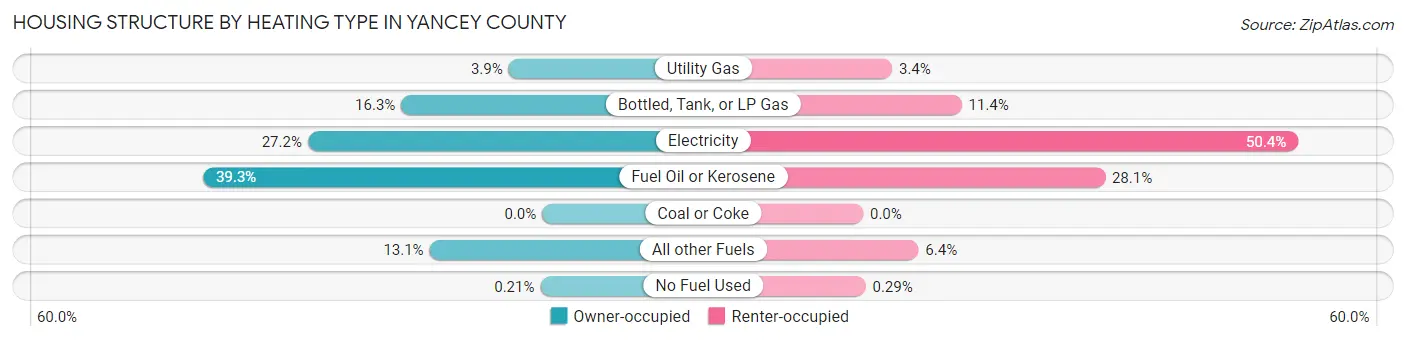
| Heating Type | Owner-occupied | Renter-occupied |
| Utility Gas | 240 (3.9%) | 57 (3.4%) |
| Bottled, Tank, or LP Gas | 1,007 (16.3%) | 194 (11.4%) |
| Electricity | 1,674 (27.2%) | 856 (50.4%) |
| Fuel Oil or Kerosene | 2,423 (39.3%) | 476 (28.1%) |
| Coal or Coke | 0 (0.0%) | 0 (0.0%) |
| All other Fuels | 805 (13.1%) | 109 (6.4%) |
| No Fuel Used | 13 (0.2%) | 5 (0.3%) |
| Total | 6,162 (100.0%) | 1,697 (100.0%) |
Household Vehicle Usage in Yancey County
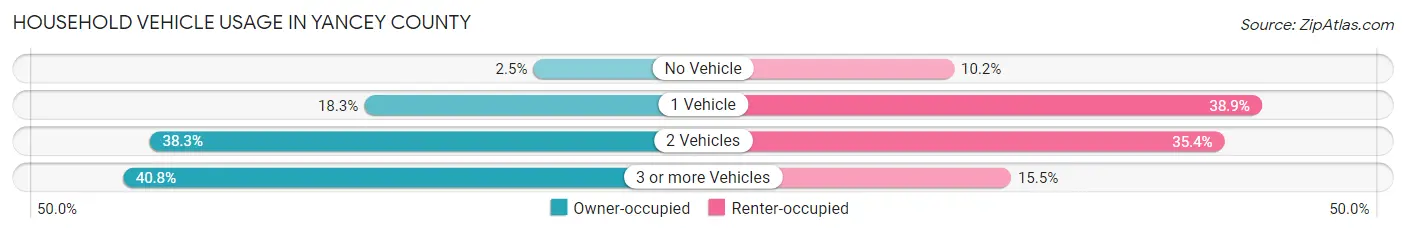
| Vehicles per Household | Owner-occupied | Renter-occupied |
| No Vehicle | 155 (2.5%) | 173 (10.2%) |
| 1 Vehicle | 1,129 (18.3%) | 660 (38.9%) |
| 2 Vehicles | 2,362 (38.3%) | 601 (35.4%) |
| 3 or more Vehicles | 2,516 (40.8%) | 263 (15.5%) |
| Total | 6,162 (100.0%) | 1,697 (100.0%) |
Real Estate & Mortgages in Yancey County
Real Estate and Mortgage Overview in Yancey County
| Characteristic | Without Mortgage | With Mortgage |
| Housing Units | 3,267 | 2,895 |
| Median Property Value | $173,400 | $238,000 |
| Median Household Income | $46,559 | $379 |
| Monthly Housing Costs | $365 | $43 |
| Real Estate Taxes | $1,002 | $158 |
Property Value by Mortgage Status in Yancey County
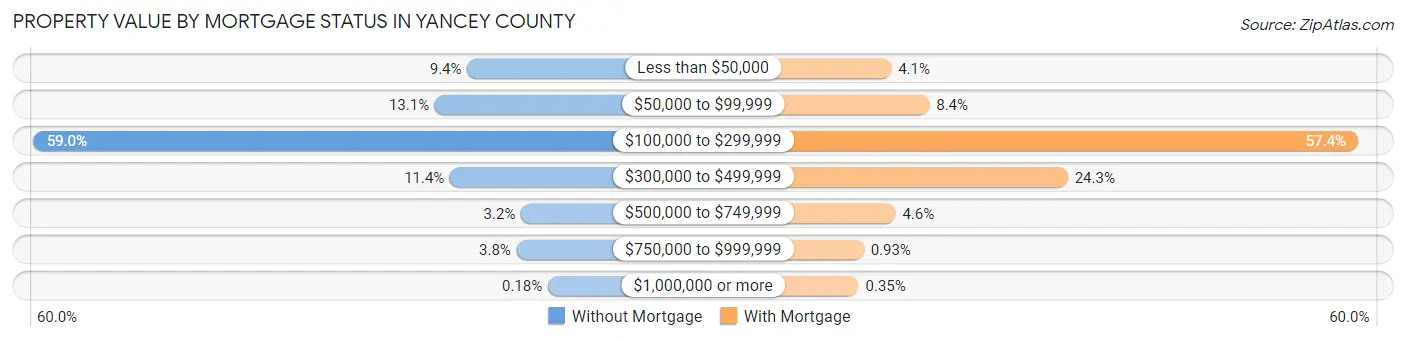
| Property Value | Without Mortgage | With Mortgage |
| Less than $50,000 | 307 (9.4%) | 118 (4.1%) |
| $50,000 to $99,999 | 428 (13.1%) | 244 (8.4%) |
| $100,000 to $299,999 | 1,926 (59.0%) | 1,662 (57.4%) |
| $300,000 to $499,999 | 371 (11.4%) | 702 (24.2%) |
| $500,000 to $749,999 | 106 (3.2%) | 132 (4.6%) |
| $750,000 to $999,999 | 123 (3.8%) | 27 (0.9%) |
| $1,000,000 or more | 6 (0.2%) | 10 (0.4%) |
| Total | 3,267 (100.0%) | 2,895 (100.0%) |
Household Income by Mortgage Status in Yancey County
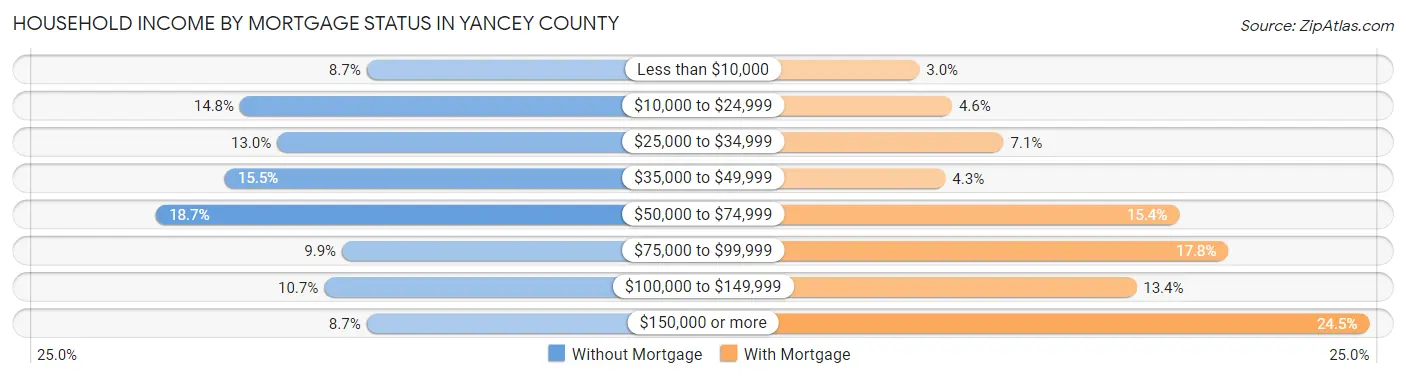
| Household Income | Without Mortgage | With Mortgage |
| Less than $10,000 | 285 (8.7%) | 88 (3.0%) |
| $10,000 to $24,999 | 482 (14.7%) | 133 (4.6%) |
| $25,000 to $34,999 | 424 (13.0%) | 204 (7.0%) |
| $35,000 to $49,999 | 505 (15.5%) | 124 (4.3%) |
| $50,000 to $74,999 | 612 (18.7%) | 446 (15.4%) |
| $75,000 to $99,999 | 323 (9.9%) | 514 (17.7%) |
| $100,000 to $149,999 | 351 (10.7%) | 387 (13.4%) |
| $150,000 or more | 285 (8.7%) | 708 (24.5%) |
| Total | 3,267 (100.0%) | 2,895 (100.0%) |
Property Value to Household Income Ratio in Yancey County
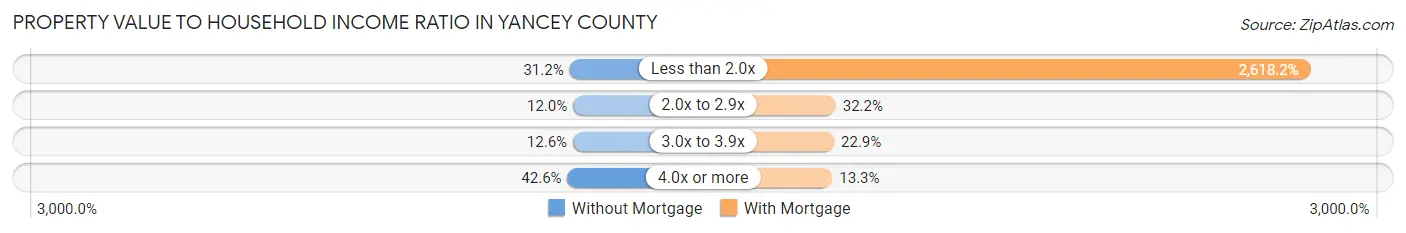
| Value-to-Income Ratio | Without Mortgage | With Mortgage |
| Less than 2.0x | 1,020 (31.2%) | 75,798 (2,618.2%) |
| 2.0x to 2.9x | 391 (12.0%) | 933 (32.2%) |
| 3.0x to 3.9x | 413 (12.6%) | 662 (22.9%) |
| 4.0x or more | 1,391 (42.6%) | 386 (13.3%) |
| Total | 3,267 (100.0%) | 2,895 (100.0%) |
Real Estate Taxes by Mortgage Status in Yancey County
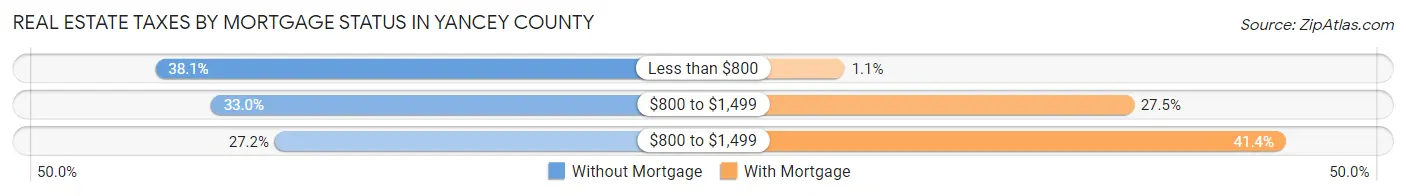
| Property Taxes | Without Mortgage | With Mortgage |
| Less than $800 | 1,243 (38.1%) | 31 (1.1%) |
| $800 to $1,499 | 1,078 (33.0%) | 795 (27.5%) |
| $800 to $1,499 | 887 (27.2%) | 1,197 (41.3%) |
| Total | 3,267 (100.0%) | 2,895 (100.0%) |
Health & Disability in Yancey County
Health Insurance Coverage by Age in Yancey County
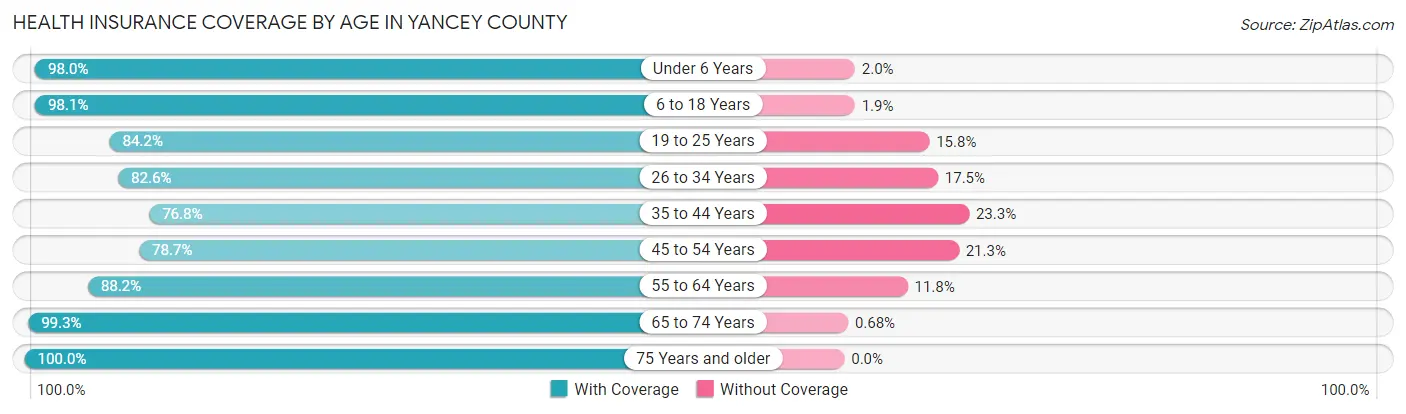
| Age Bracket | With Coverage | Without Coverage |
| Under 6 Years | 1,098 (98.0%) | 22 (2.0%) |
| 6 to 18 Years | 2,529 (98.1%) | 50 (1.9%) |
| 19 to 25 Years | 962 (84.2%) | 181 (15.8%) |
| 26 to 34 Years | 1,443 (82.6%) | 305 (17.4%) |
| 35 to 44 Years | 1,469 (76.7%) | 445 (23.3%) |
| 45 to 54 Years | 1,895 (78.7%) | 514 (21.3%) |
| 55 to 64 Years | 2,376 (88.2%) | 318 (11.8%) |
| 65 to 74 Years | 2,756 (99.3%) | 19 (0.7%) |
| 75 Years and older | 2,011 (100.0%) | 0 (0.0%) |
| Total | 16,539 (89.9%) | 1,854 (10.1%) |
Health Insurance Coverage by Citizenship Status in Yancey County
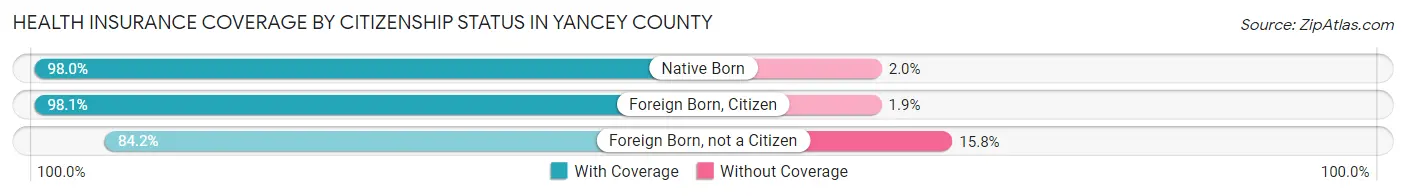
| Citizenship Status | With Coverage | Without Coverage |
| Native Born | 1,098 (98.0%) | 22 (2.0%) |
| Foreign Born, Citizen | 2,529 (98.1%) | 50 (1.9%) |
| Foreign Born, not a Citizen | 962 (84.2%) | 181 (15.8%) |
Health Insurance Coverage by Household Income in Yancey County
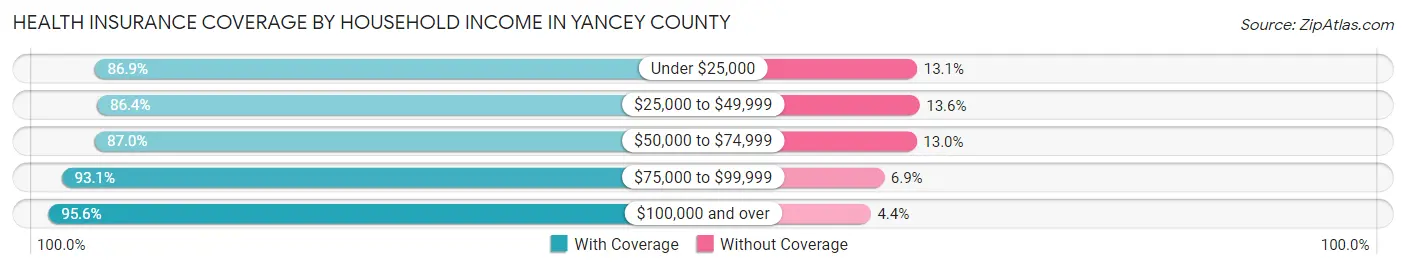
| Household Income | With Coverage | Without Coverage |
| Under $25,000 | 2,616 (86.9%) | 395 (13.1%) |
| $25,000 to $49,999 | 3,699 (86.4%) | 582 (13.6%) |
| $50,000 to $74,999 | 3,098 (87.0%) | 464 (13.0%) |
| $75,000 to $99,999 | 2,254 (93.1%) | 168 (6.9%) |
| $100,000 and over | 4,861 (95.6%) | 226 (4.4%) |
Public vs Private Health Insurance Coverage by Age in Yancey County
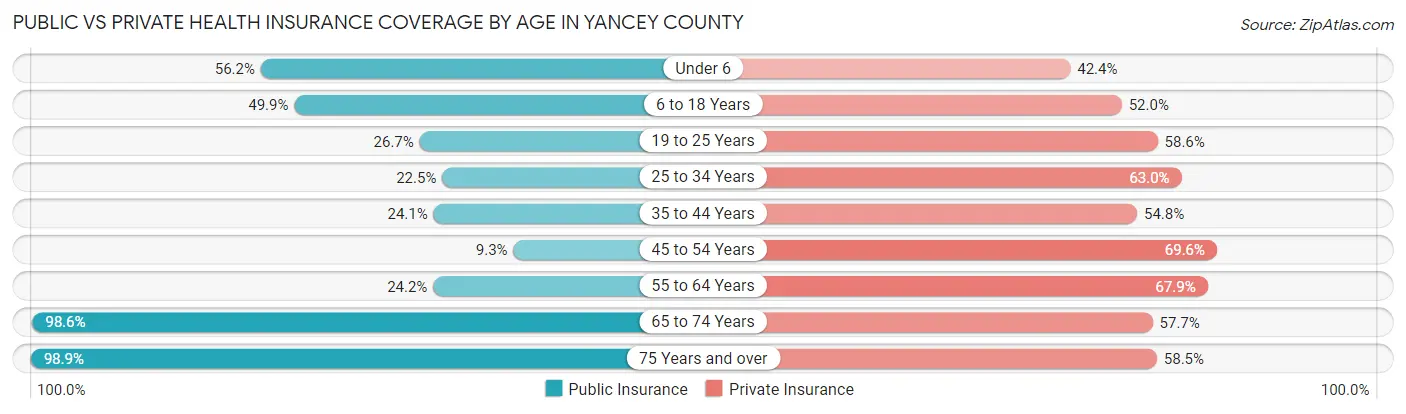
| Age Bracket | Public Insurance | Private Insurance |
| Under 6 | 629 (56.2%) | 475 (42.4%) |
| 6 to 18 Years | 1,288 (49.9%) | 1,340 (52.0%) |
| 19 to 25 Years | 305 (26.7%) | 670 (58.6%) |
| 25 to 34 Years | 393 (22.5%) | 1,102 (63.0%) |
| 35 to 44 Years | 461 (24.1%) | 1,049 (54.8%) |
| 45 to 54 Years | 223 (9.3%) | 1,677 (69.6%) |
| 55 to 64 Years | 651 (24.2%) | 1,829 (67.9%) |
| 65 to 74 Years | 2,735 (98.6%) | 1,601 (57.7%) |
| 75 Years and over | 1,988 (98.9%) | 1,176 (58.5%) |
| Total | 8,673 (47.1%) | 10,919 (59.4%) |
Disability Status by Sex by Age in Yancey County
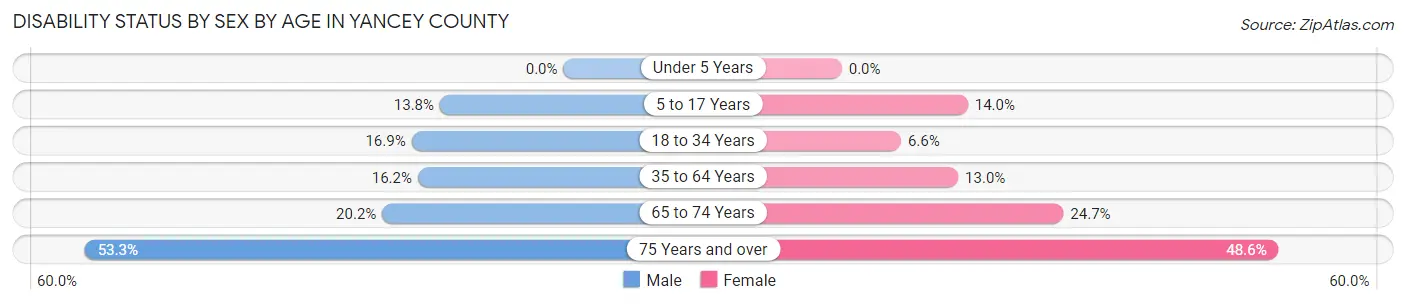
| Age Bracket | Male | Female |
| Under 5 Years | 0 (0.0%) | 0 (0.0%) |
| 5 to 17 Years | 183 (13.8%) | 163 (14.0%) |
| 18 to 34 Years | 271 (16.9%) | 103 (6.6%) |
| 35 to 64 Years | 561 (16.2%) | 461 (13.0%) |
| 65 to 74 Years | 264 (20.2%) | 362 (24.7%) |
| 75 Years and over | 469 (53.3%) | 550 (48.6%) |
Disability Class by Sex by Age in Yancey County
Disability Class: Hearing Difficulty
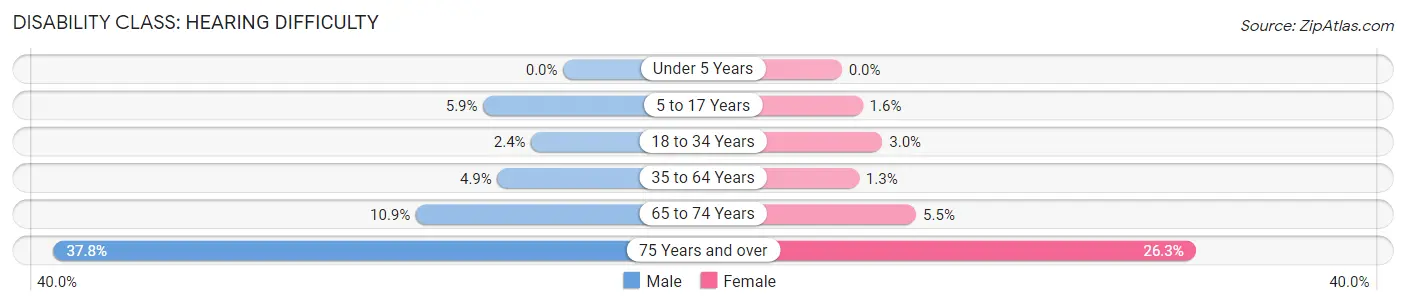
| Age Bracket | Male | Female |
| Under 5 Years | 0 (0.0%) | 0 (0.0%) |
| 5 to 17 Years | 79 (5.9%) | 18 (1.5%) |
| 18 to 34 Years | 38 (2.4%) | 47 (3.0%) |
| 35 to 64 Years | 169 (4.9%) | 45 (1.3%) |
| 65 to 74 Years | 143 (10.9%) | 81 (5.5%) |
| 75 Years and over | 333 (37.8%) | 297 (26.3%) |
Disability Class: Vision Difficulty
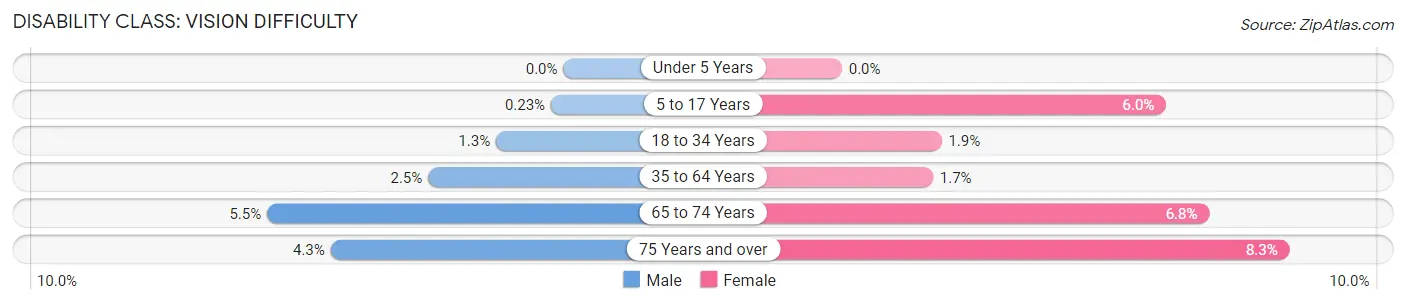
| Age Bracket | Male | Female |
| Under 5 Years | 0 (0.0%) | 0 (0.0%) |
| 5 to 17 Years | 3 (0.2%) | 70 (6.0%) |
| 18 to 34 Years | 20 (1.3%) | 29 (1.8%) |
| 35 to 64 Years | 87 (2.5%) | 60 (1.7%) |
| 65 to 74 Years | 72 (5.5%) | 100 (6.8%) |
| 75 Years and over | 38 (4.3%) | 94 (8.3%) |
Disability Class: Cognitive Difficulty
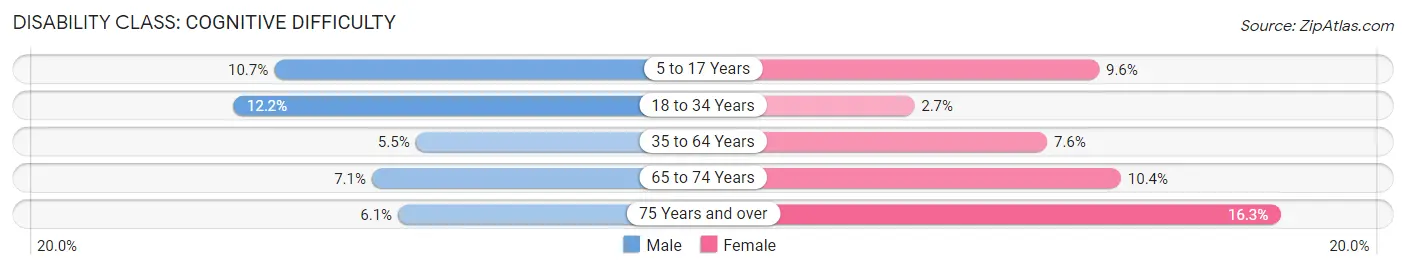
| Age Bracket | Male | Female |
| 5 to 17 Years | 143 (10.7%) | 111 (9.6%) |
| 18 to 34 Years | 196 (12.2%) | 42 (2.7%) |
| 35 to 64 Years | 190 (5.5%) | 271 (7.6%) |
| 65 to 74 Years | 93 (7.1%) | 152 (10.4%) |
| 75 Years and over | 54 (6.1%) | 184 (16.3%) |
Disability Class: Ambulatory Difficulty
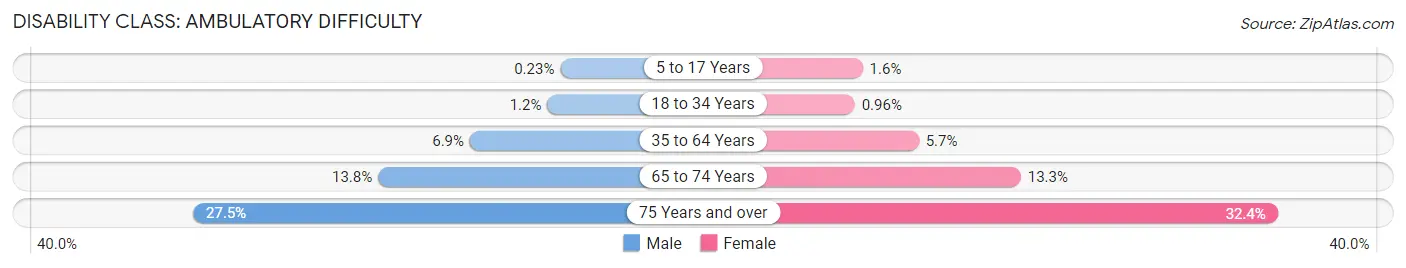
| Age Bracket | Male | Female |
| 5 to 17 Years | 3 (0.2%) | 18 (1.5%) |
| 18 to 34 Years | 19 (1.2%) | 15 (1.0%) |
| 35 to 64 Years | 240 (6.9%) | 203 (5.7%) |
| 65 to 74 Years | 180 (13.8%) | 195 (13.3%) |
| 75 Years and over | 242 (27.5%) | 366 (32.4%) |
Disability Class: Self-Care Difficulty
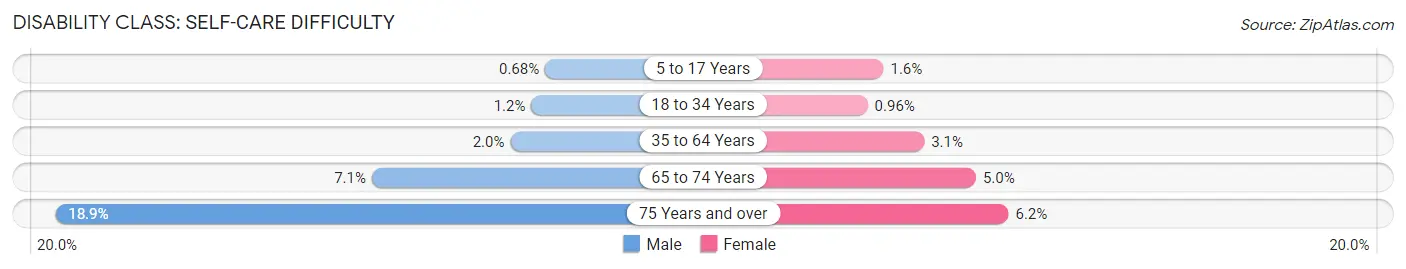
| Age Bracket | Male | Female |
| 5 to 17 Years | 9 (0.7%) | 18 (1.5%) |
| 18 to 34 Years | 19 (1.2%) | 15 (1.0%) |
| 35 to 64 Years | 68 (2.0%) | 109 (3.1%) |
| 65 to 74 Years | 93 (7.1%) | 73 (5.0%) |
| 75 Years and over | 166 (18.9%) | 70 (6.2%) |
Technology Access in Yancey County
Computing Device Access in Yancey County
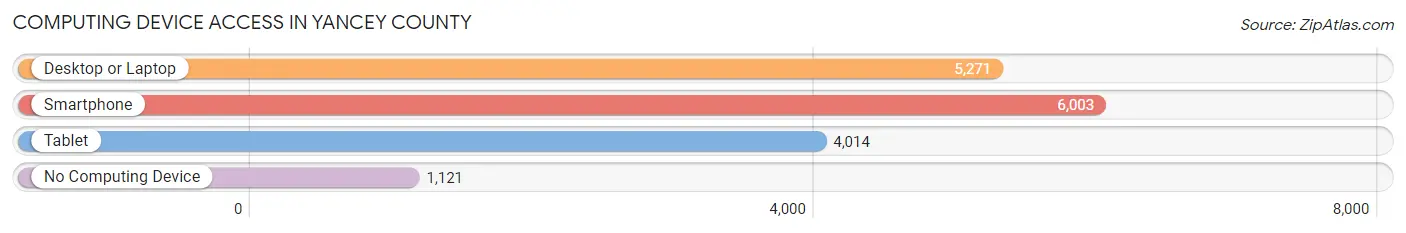
| Device Type | # Households | % Households |
| Desktop or Laptop | 5,271 | 67.1% |
| Smartphone | 6,003 | 76.4% |
| Tablet | 4,014 | 51.1% |
| No Computing Device | 1,121 | 14.3% |
| Total | 7,859 | 100.0% |
Internet Access in Yancey County
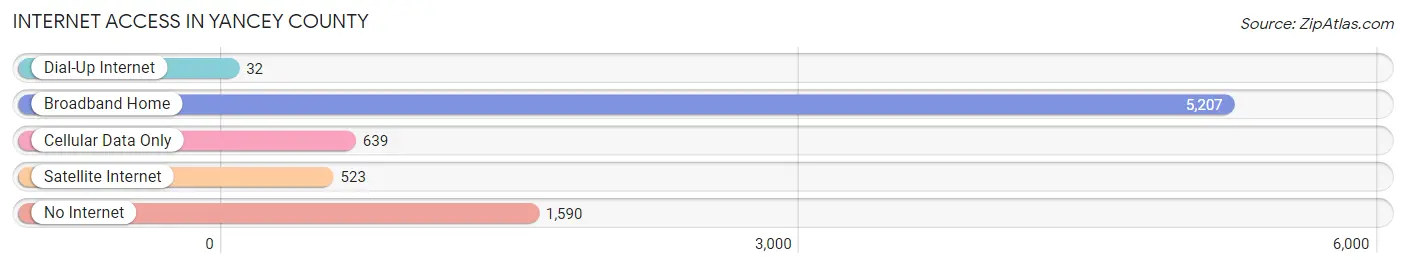
| Internet Type | # Households | % Households |
| Dial-Up Internet | 32 | 0.4% |
| Broadband Home | 5,207 | 66.3% |
| Cellular Data Only | 639 | 8.1% |
| Satellite Internet | 523 | 6.7% |
| No Internet | 1,590 | 20.2% |
| Total | 7,859 | 100.0% |
Yancey County Summary
Yancey County is located in the western part of North Carolina, in the Appalachian Mountains. It is bordered by Mitchell County to the north, Madison County to the east, Buncombe County to the south, and Haywood County to the west. The county seat is Burnsville, and the county is named after Bartlett Yancey, a North Carolina congressman.
Geography
Yancey County covers an area of 437 square miles, with elevations ranging from 1,400 to 6,000 feet. The terrain is mostly mountainous, with the highest point being Mount Mitchell, at 6,684 feet. The county is home to the Blue Ridge Parkway, which runs through the county from east to west. The county is also home to the Pisgah National Forest, which covers much of the county. The county is home to numerous rivers and streams, including the Toe River, the Cane River, and the North Toe River.
Climate
Yancey County has a humid subtropical climate, with hot summers and cold winters. The average annual temperature is 57°F, with an average high of 73°F in July and an average low of 41°F in January. The average annual precipitation is 48 inches, with the wettest month being July, with an average of 6.5 inches of rain.
Demographics
As of the 2010 census, Yancey County had a population of 17,818. The population was 97.2% white, 0.7% black or African American, 0.3% Native American, 0.3% Asian, 0.1% Pacific Islander, 0.7% from other races, and 1.1% from two or more races. Hispanic or Latino of any race were 1.9% of the population.
The median household income was $33,945, and the median family income was $41,945. The per capita income was $17,818. About 17.2% of the population was below the poverty line.
Economy
Yancey County's economy is largely based on agriculture and tourism. The county is home to numerous farms, which produce a variety of crops, including corn, soybeans, hay, and tobacco. The county is also home to several wineries, which produce a variety of wines.
Tourism is a major part of the county's economy, with the Blue Ridge Parkway and the Pisgah National Forest drawing visitors from all over the country. The county is also home to numerous outdoor recreation opportunities, including hiking, camping, fishing, and hunting.
Conclusion
Yancey County is a rural county located in the western part of North Carolina. It is home to the Blue Ridge Parkway and the Pisgah National Forest, and is a popular destination for outdoor recreation. The county's economy is largely based on agriculture and tourism, and the population is mostly white. The median household income is $33,945, and the per capita income is $17,818.
Common Questions
What is the Total Population of Yancey County?
Total Population of Yancey County is 18,538.
What is the Total Male Population of Yancey County?
Total Male Population of Yancey County is 9,203.
What is the Total Female Population of Yancey County?
Total Female Population of Yancey County is 9,335.
What is the Ratio of Males per 100 Females in Yancey County?
There are 98.59 Males per 100 Females in Yancey County.
What is the Ratio of Females per 100 Males in Yancey County?
There are 101.43 Females per 100 Males in Yancey County.
What is the Median Population Age in Yancey County?
Median Population Age in Yancey County is 48.0 Years.
What is the Average Family Size in Yancey County
Average Family Size in Yancey County is 2.9 People.
What is the Average Household Size in Yancey County
Average Household Size in Yancey County is 2.3 People.
What is Per Capita Income in Yancey County?
Per Capita income in Yancey County is $31,037.
What is the Median Family Income in Yancey County?
Median Family Income in Yancey County is $71,351.
What is the Median Household income in Yancey County?
Median Household Income in Yancey County is $53,103.
What is Income or Wage Gap in Yancey County?
Income or Wage Gap in Yancey County is 25.7%.
Women in Yancey County earn 74.3 cents for every dollar earned by a man.
What is Inequality or Gini Index in Yancey County?
Inequality or Gini Index in Yancey County is 0.47.
How Large is the Labor Force in Yancey County?
There are 8,346 People in the Labor Forcein in Yancey County.
What is the Percentage of People in the Labor Force in Yancey County?
53.8% of People are in the Labor Force in Yancey County.
What is the Unemployment Rate in Yancey County?
Unemployment Rate in Yancey County is 7.6%.