Wilkes County, NC
Wilkes County Map
Wilkes County Overview
66,125
TOTAL POPULATION
32,914
MALE POPULATION
33,211
FEMALE POPULATION
99.11
MALES / 100 FEMALES
100.90
FEMALES / 100 MALES
45.3
MEDIAN AGE
2.9
AVG FAMILY SIZE
2.4
AVG HOUSEHOLD SIZE
$27,592
PER CAPITA INCOME
$60,492
AVG FAMILY INCOME
$49,119
AVG HOUSEHOLD INCOME
21.5%
WAGE / INCOME GAP [ % ]
78.5¢/ $1
WAGE / INCOME GAP [ $ ]
$12,712
FAMILY INCOME DEFICIT
0.44
INEQUALITY / GINI INDEX
30,454
LABOR FORCE [ PEOPLE ]
56.0%
PERCENT IN LABOR FORCE
6.0%
UNEMPLOYMENT RATE
Wilkes County Area Codes
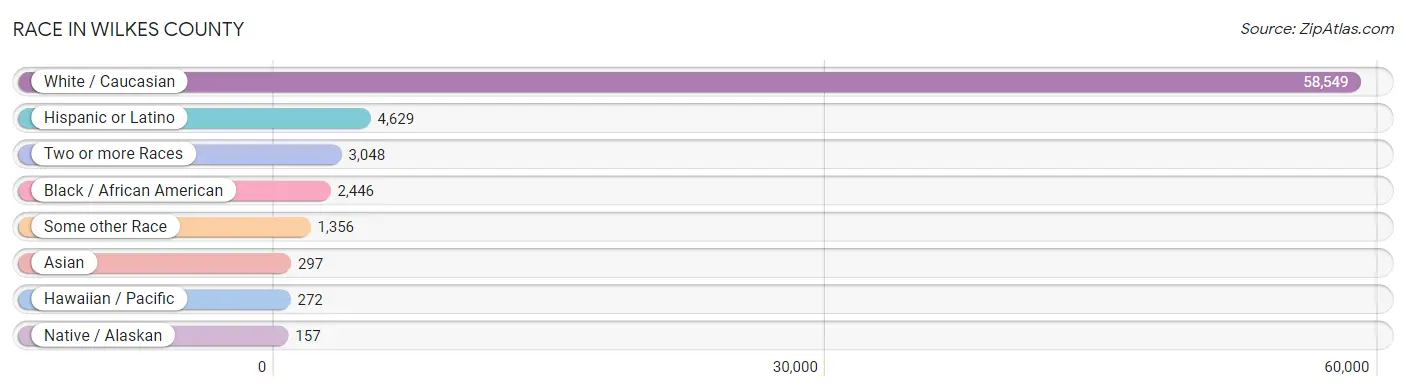
Race in Wilkes County
The most populous races in Wilkes County are White / Caucasian (58,549 | 88.5%), Hispanic or Latino (4,629 | 7.0%), and Two or more Races (3,048 | 4.6%).
| Race | # Population | % Population |
| Asian | 297 | 0.4% |
| Black / African American | 2,446 | 3.7% |
| Hawaiian / Pacific | 272 | 0.4% |
| Hispanic or Latino | 4,629 | 7.0% |
| Native / Alaskan | 157 | 0.2% |
| White / Caucasian | 58,549 | 88.5% |
| Two or more Races | 3,048 | 4.6% |
| Some other Race | 1,356 | 2.1% |
| Total | 66,125 | 100.0% |
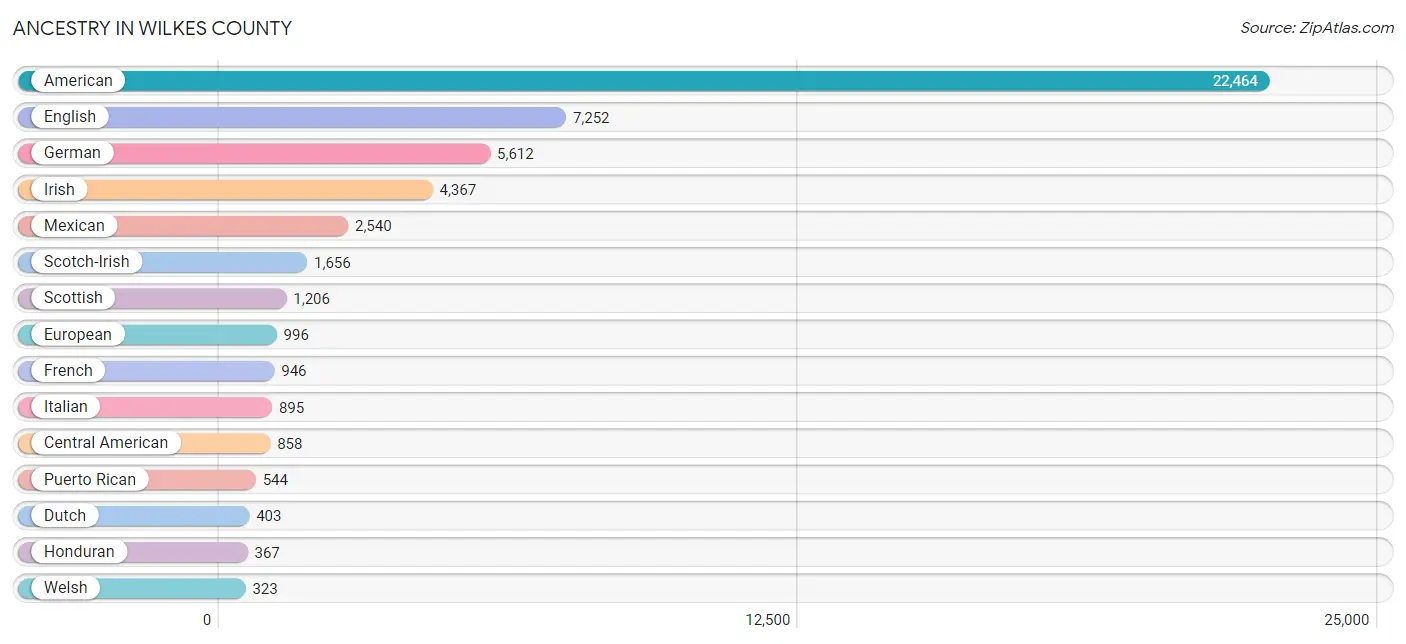
Ancestry in Wilkes County
The most populous ancestries reported in Wilkes County are American (22,464 | 34.0%), English (7,252 | 11.0%), German (5,612 | 8.5%), Irish (4,367 | 6.6%), and Mexican (2,540 | 3.8%), together accounting for 63.9% of all Wilkes County residents.
| Ancestry | # Population | % Population |
| African | 141 | 0.2% |
| American | 22,464 | 34.0% |
| Arab | 26 | 0.0% |
| Armenian | 22 | 0.0% |
| Australian | 22 | 0.0% |
| Austrian | 36 | 0.1% |
| Basque | 14 | 0.0% |
| Bhutanese | 70 | 0.1% |
| Blackfeet | 5 | 0.0% |
| Bolivian | 8 | 0.0% |
| British | 130 | 0.2% |
| Burmese | 180 | 0.3% |
| Cambodian | 10 | 0.0% |
| Canadian | 22 | 0.0% |
| Central American | 858 | 1.3% |
| Central American Indian | 36 | 0.1% |
| Cherokee | 168 | 0.3% |
| Chilean | 13 | 0.0% |
| Chippewa | 6 | 0.0% |
| Colombian | 11 | 0.0% |
| Costa Rican | 89 | 0.1% |
| Creek | 9 | 0.0% |
| Cuban | 72 | 0.1% |
| Czech | 18 | 0.0% |
| Danish | 48 | 0.1% |
| Dominican | 65 | 0.1% |
| Dutch | 403 | 0.6% |
| Eastern European | 82 | 0.1% |
| English | 7,252 | 11.0% |
| European | 996 | 1.5% |
| Finnish | 10 | 0.0% |
| French | 946 | 1.4% |
| French Canadian | 80 | 0.1% |
| German | 5,612 | 8.5% |
| Greek | 39 | 0.1% |
| Guamanian / Chamorro | 197 | 0.3% |
| Guatemalan | 103 | 0.2% |
| Haitian | 12 | 0.0% |
| Honduran | 367 | 0.6% |
| Hungarian | 57 | 0.1% |
| Indian (Asian) | 28 | 0.0% |
| Irish | 4,367 | 6.6% |
| Italian | 895 | 1.3% |
| Jamaican | 14 | 0.0% |
| Japanese | 5 | 0.0% |
| Korean | 29 | 0.0% |
| Lebanese | 26 | 0.0% |
| Lithuanian | 16 | 0.0% |
| Lumbee | 15 | 0.0% |
| Luxembourger | 10 | 0.0% |
| Mexican | 2,540 | 3.8% |
| Native Hawaiian | 49 | 0.1% |
| Nicaraguan | 36 | 0.1% |
| Northern European | 29 | 0.0% |
| Norwegian | 175 | 0.3% |
| Panamanian | 14 | 0.0% |
| Polish | 242 | 0.4% |
| Puerto Rican | 544 | 0.8% |
| Romanian | 18 | 0.0% |
| Russian | 24 | 0.0% |
| Salvadoran | 249 | 0.4% |
| Samoan | 33 | 0.1% |
| Scandinavian | 28 | 0.0% |
| Scotch-Irish | 1,656 | 2.5% |
| Scottish | 1,206 | 1.8% |
| Sioux | 14 | 0.0% |
| Slavic | 100 | 0.2% |
| South American | 32 | 0.1% |
| Spaniard | 126 | 0.2% |
| Spanish | 166 | 0.3% |
| Sri Lankan | 45 | 0.1% |
| Subsaharan African | 141 | 0.2% |
| Swedish | 197 | 0.3% |
| Swiss | 41 | 0.1% |
| Thai | 58 | 0.1% |
| Trinidadian and Tobagonian | 13 | 0.0% |
| Turkish | 11 | 0.0% |
| Welsh | 323 | 0.5% |
| Yugoslavian | 14 | 0.0% | View All 79 Rows |
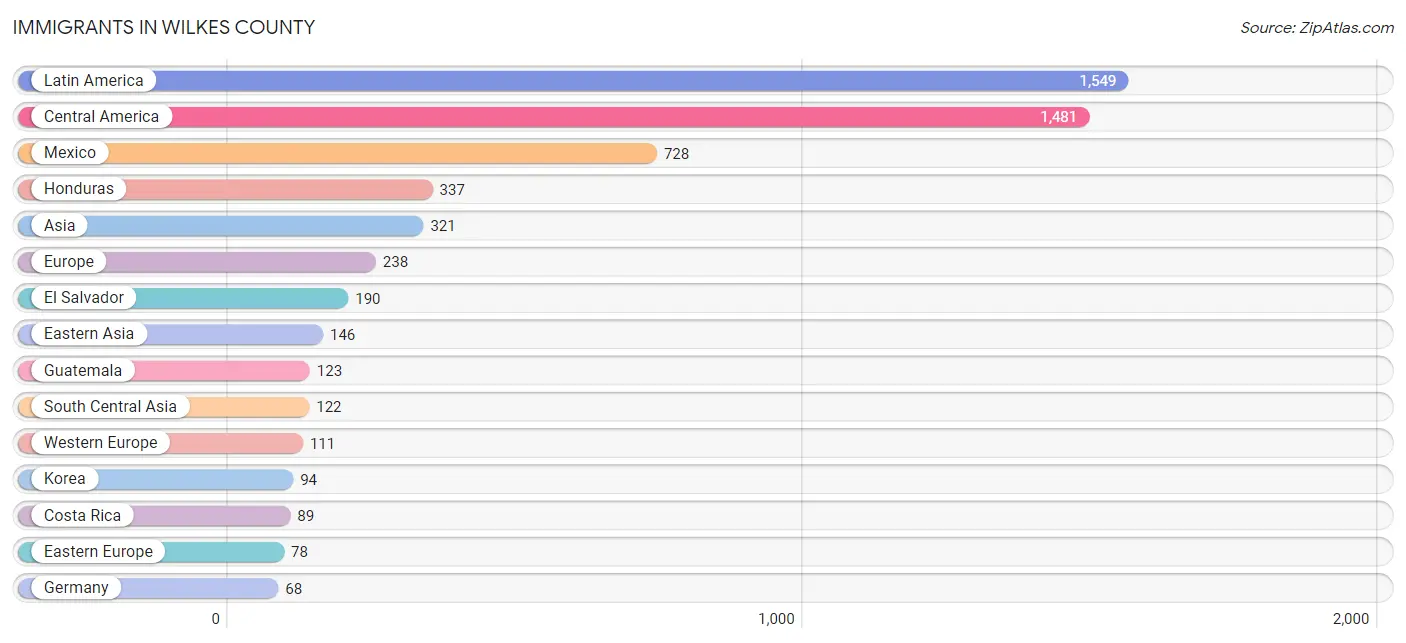
Immigrants in Wilkes County
The most numerous immigrant groups reported in Wilkes County came from Latin America (1,549 | 2.3%), Central America (1,481 | 2.2%), Mexico (728 | 1.1%), Honduras (337 | 0.5%), and Asia (321 | 0.5%), together accounting for 6.7% of all Wilkes County residents.
| Immigration Origin | # Population | % Population |
| Africa | 36 | 0.1% |
| Asia | 321 | 0.5% |
| Bolivia | 8 | 0.0% |
| Bosnia and Herzegovina | 14 | 0.0% |
| Canada | 7 | 0.0% |
| Caribbean | 19 | 0.0% |
| Central America | 1,481 | 2.2% |
| Chile | 13 | 0.0% |
| Colombia | 28 | 0.0% |
| Costa Rica | 89 | 0.1% |
| Denmark | 15 | 0.0% |
| Dominican Republic | 19 | 0.0% |
| Eastern Africa | 36 | 0.1% |
| Eastern Asia | 146 | 0.2% |
| Eastern Europe | 78 | 0.1% |
| El Salvador | 190 | 0.3% |
| Europe | 238 | 0.4% |
| France | 33 | 0.1% |
| Germany | 68 | 0.1% |
| Guatemala | 123 | 0.2% |
| Honduras | 337 | 0.5% |
| India | 22 | 0.0% |
| Japan | 52 | 0.1% |
| Korea | 94 | 0.1% |
| Latin America | 1,549 | 2.3% |
| Mexico | 728 | 1.1% |
| Nicaragua | 14 | 0.0% |
| Northern Europe | 49 | 0.1% |
| Philippines | 42 | 0.1% |
| Poland | 14 | 0.0% |
| Romania | 50 | 0.1% |
| Scotland | 18 | 0.0% |
| South America | 49 | 0.1% |
| South Central Asia | 122 | 0.2% |
| South Eastern Asia | 42 | 0.1% |
| Switzerland | 10 | 0.0% |
| Turkey | 11 | 0.0% |
| Uganda | 36 | 0.1% |
| Western Asia | 11 | 0.0% |
| Western Europe | 111 | 0.2% | View All 40 Rows |
Sex and Age in Wilkes County
Sex and Age in Wilkes County
The most populous age groups in Wilkes County are 55 to 59 Years (2,695 | 8.2%) for men and 55 to 59 Years (2,496 | 7.5%) for women.
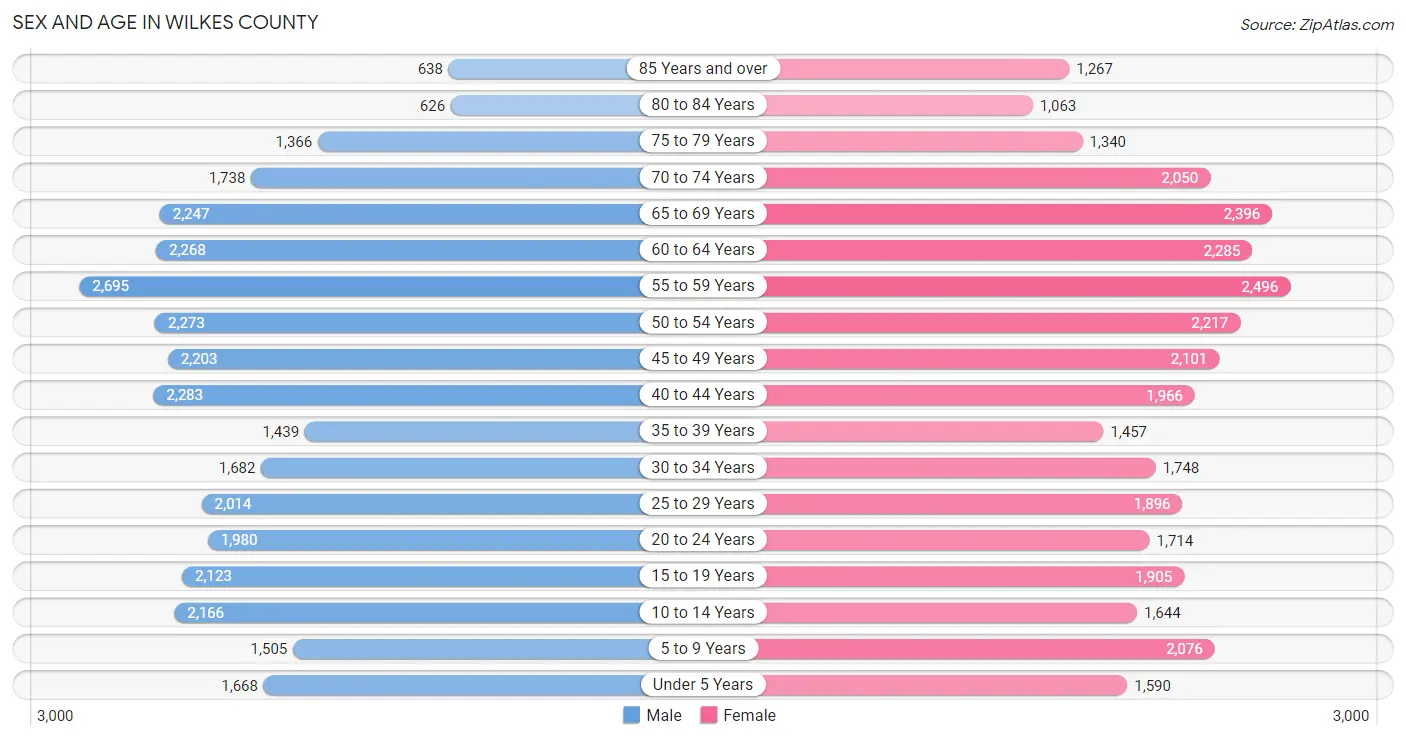
| Age Bracket | Male | Female |
| Under 5 Years | 1,668 (5.1%) | 1,590 (4.8%) |
| 5 to 9 Years | 1,505 (4.6%) | 2,076 (6.2%) |
| 10 to 14 Years | 2,166 (6.6%) | 1,644 (5.0%) |
| 15 to 19 Years | 2,123 (6.5%) | 1,905 (5.7%) |
| 20 to 24 Years | 1,980 (6.0%) | 1,714 (5.2%) |
| 25 to 29 Years | 2,014 (6.1%) | 1,896 (5.7%) |
| 30 to 34 Years | 1,682 (5.1%) | 1,748 (5.3%) |
| 35 to 39 Years | 1,439 (4.4%) | 1,457 (4.4%) |
| 40 to 44 Years | 2,283 (6.9%) | 1,966 (5.9%) |
| 45 to 49 Years | 2,203 (6.7%) | 2,101 (6.3%) |
| 50 to 54 Years | 2,273 (6.9%) | 2,217 (6.7%) |
| 55 to 59 Years | 2,695 (8.2%) | 2,496 (7.5%) |
| 60 to 64 Years | 2,268 (6.9%) | 2,285 (6.9%) |
| 65 to 69 Years | 2,247 (6.8%) | 2,396 (7.2%) |
| 70 to 74 Years | 1,738 (5.3%) | 2,050 (6.2%) |
| 75 to 79 Years | 1,366 (4.2%) | 1,340 (4.0%) |
| 80 to 84 Years | 626 (1.9%) | 1,063 (3.2%) |
| 85 Years and over | 638 (1.9%) | 1,267 (3.8%) |
| Total | 32,914 (100.0%) | 33,211 (100.0%) |
Families and Households in Wilkes County
Median Family Size in Wilkes County
The median family size in Wilkes County is 2.93 persons per family, with single female/mother families (3,111 | 17.3%) accounting for the largest median family size of 3.02 persons per family. On the other hand, single male/father families (1,235 | 6.9%) represent the smallest median family size with 2.67 persons per family.
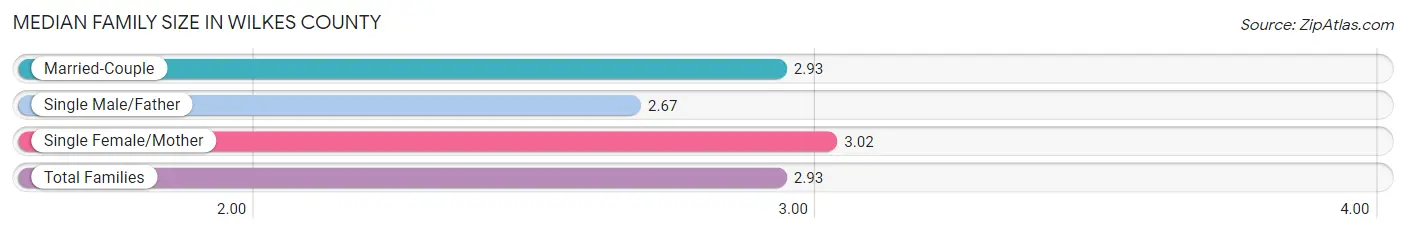
| Family Type | # Families | Family Size |
| Married-Couple | 13,680 (75.9%) | 2.93 |
| Single Male/Father | 1,235 (6.9%) | 2.67 |
| Single Female/Mother | 3,111 (17.3%) | 3.02 |
| Total Families | 18,026 (100.0%) | 2.93 |
Median Household Size in Wilkes County
The median household size in Wilkes County is 2.39 persons per household, with single female/mother households (3,111 | 11.4%) accounting for the largest median household size of 3.29 persons per household. non-family households (9,223 | 33.9%) represent the smallest median household size with 1.16 persons per household.
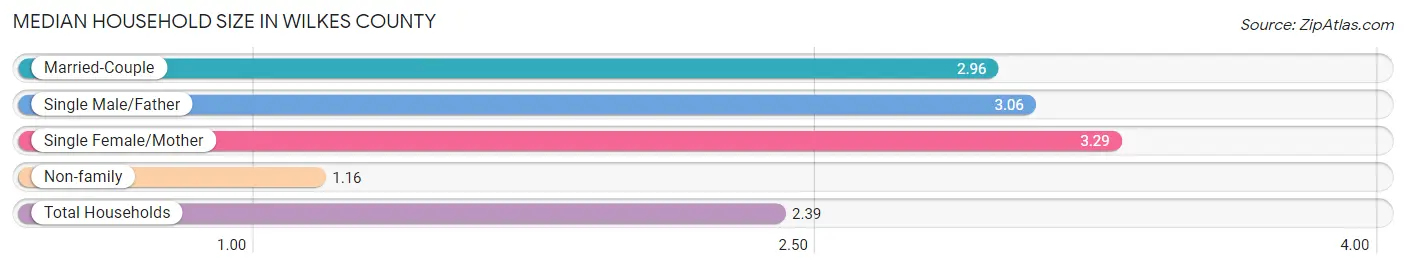
| Household Type | # Households | Household Size |
| Married-Couple | 13,680 (50.2%) | 2.96 |
| Single Male/Father | 1,235 (4.5%) | 3.06 |
| Single Female/Mother | 3,111 (11.4%) | 3.29 |
| Non-family | 9,223 (33.9%) | 1.16 |
| Total Households | 27,249 (100.0%) | 2.39 |
Household Size by Marriage Status in Wilkes County
Out of a total of 27,249 households in Wilkes County, 18,026 (66.1%) are family households, while 9,223 (33.9%) are nonfamily households. The most numerous type of family households are 2-person households, comprising 9,306, and the most common type of nonfamily households are 1-person households, comprising 7,860.
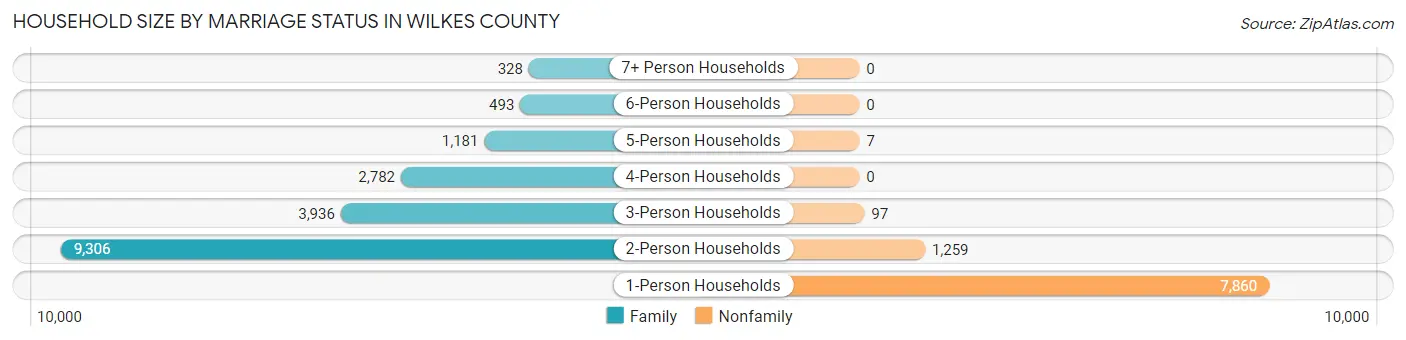
| Household Size | Family Households | Nonfamily Households |
| 1-Person Households | - | 7,860 (28.8%) |
| 2-Person Households | 9,306 (34.2%) | 1,259 (4.6%) |
| 3-Person Households | 3,936 (14.4%) | 97 (0.4%) |
| 4-Person Households | 2,782 (10.2%) | 0 (0.0%) |
| 5-Person Households | 1,181 (4.3%) | 7 (0.0%) |
| 6-Person Households | 493 (1.8%) | 0 (0.0%) |
| 7+ Person Households | 328 (1.2%) | 0 (0.0%) |
| Total | 18,026 (66.1%) | 9,223 (33.9%) |
Female Fertility in Wilkes County
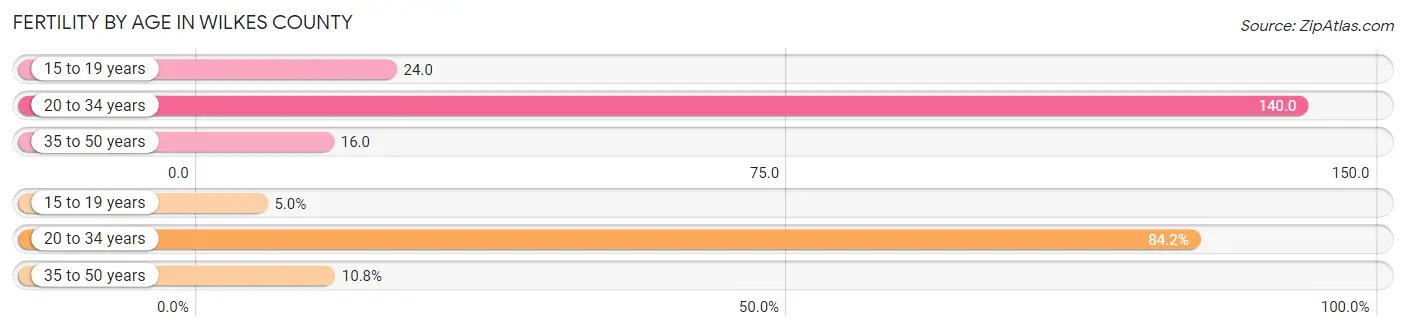
Fertility by Age in Wilkes County
Average fertility rate in Wilkes County is 67.0 births per 1,000 women. Women in the age bracket of 20 to 34 years have the highest fertility rate with 140.0 births per 1,000 women. Women in the age bracket of 20 to 34 years acount for 84.2% of all women with births.
| Age Bracket | Women with Births | Births / 1,000 Women |
| 15 to 19 years | 45 (5.0%) | 24.0 |
| 20 to 34 years | 751 (84.2%) | 140.0 |
| 35 to 50 years | 96 (10.8%) | 16.0 |
| Total | 892 (100.0%) | 67.0 |
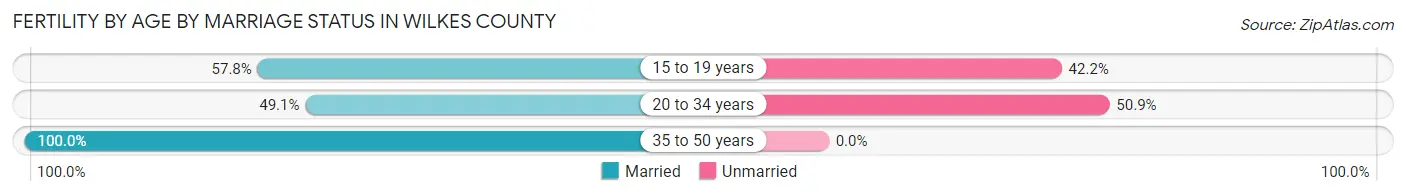
Fertility by Age by Marriage Status in Wilkes County
55.0% of women with births (892) in Wilkes County are married. The highest percentage of unmarried women with births falls into 20 to 34 years age bracket with 50.9% of them unmarried at the time of birth, while the lowest percentage of unmarried women with births belong to 35 to 50 years age bracket with 0.0% of them unmarried.
| Age Bracket | Married | Unmarried |
| 15 to 19 years | 26 (57.8%) | 19 (42.2%) |
| 20 to 34 years | 369 (49.1%) | 382 (50.9%) |
| 35 to 50 years | 96 (100.0%) | 0 (0.0%) |
| Total | 491 (55.0%) | 401 (45.0%) |
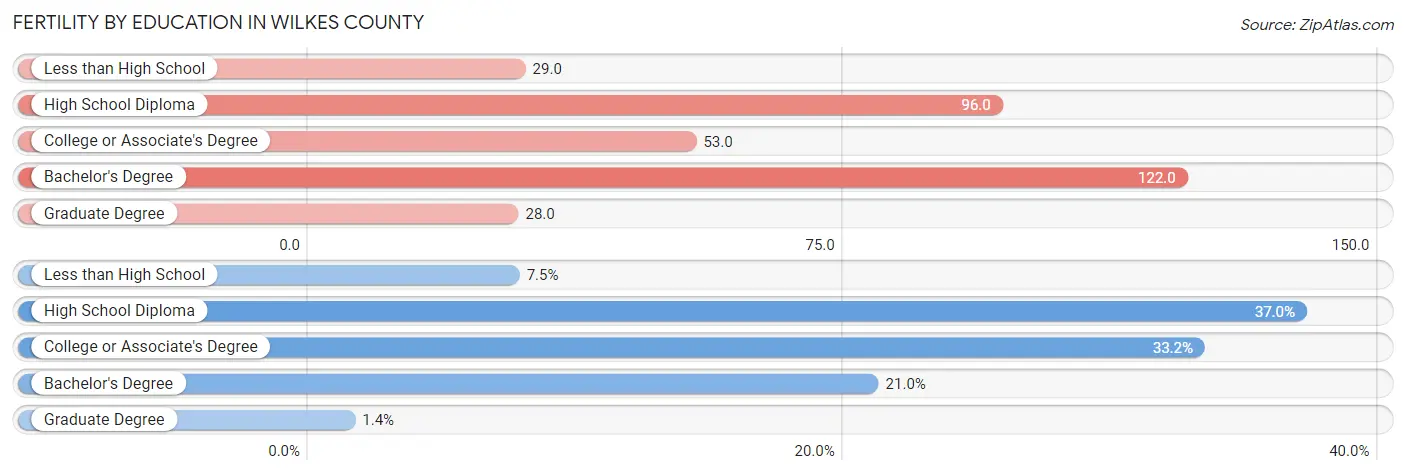
Fertility by Education in Wilkes County
Average fertility rate in Wilkes County is 67.0 births per 1,000 women. Women with the education attainment of bachelor's degree have the highest fertility rate of 122.0 births per 1,000 women, while women with the education attainment of graduate degree have the lowest fertility at 28.0 births per 1,000 women. Women with the education attainment of high school diploma represent 37.0% of all women with births.
| Educational Attainment | Women with Births | Births / 1,000 Women |
| Less than High School | 67 (7.5%) | 29.0 |
| High School Diploma | 330 (37.0%) | 96.0 |
| College or Associate's Degree | 296 (33.2%) | 53.0 |
| Bachelor's Degree | 187 (21.0%) | 122.0 |
| Graduate Degree | 12 (1.3%) | 28.0 |
| Total | 892 (100.0%) | 67.0 |
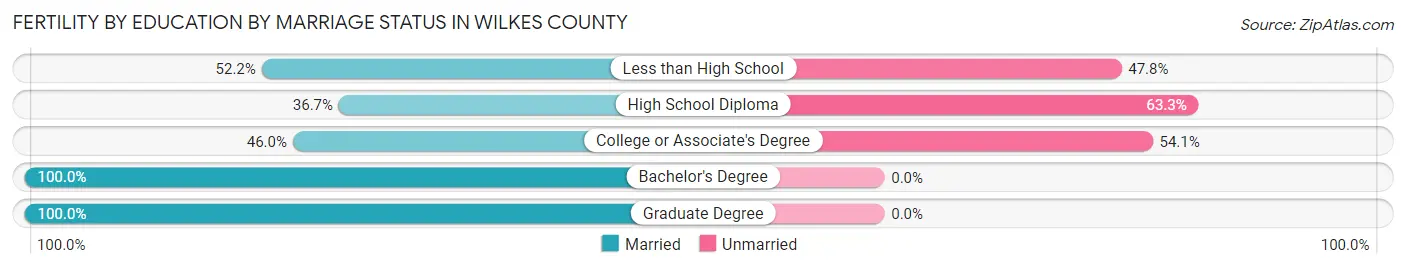
Fertility by Education by Marriage Status in Wilkes County
45.0% of women with births in Wilkes County are unmarried. Women with the educational attainment of bachelor's degree are most likely to be married with 100.0% of them married at childbirth, while women with the educational attainment of high school diploma are least likely to be married with 63.3% of them unmarried at childbirth.
| Educational Attainment | Married | Unmarried |
| Less than High School | 35 (52.2%) | 32 (47.8%) |
| High School Diploma | 121 (36.7%) | 209 (63.3%) |
| College or Associate's Degree | 136 (46.0%) | 160 (54.0%) |
| Bachelor's Degree | 187 (100.0%) | 0 (0.0%) |
| Graduate Degree | 12 (100.0%) | 0 (0.0%) |
| Total | 491 (55.0%) | 401 (45.0%) |
Income in Wilkes County
Income Overview in Wilkes County
Per Capita Income in Wilkes County is $27,592, while median incomes of families and households are $60,492 and $49,119 respectively.
| Characteristic | Number | Measure |
| Per Capita Income | 66,125 | $27,592 |
| Median Family Income | 18,026 | $60,492 |
| Mean Family Income | 18,026 | $75,076 |
| Median Household Income | 27,249 | $49,119 |
| Mean Household Income | 27,249 | $64,650 |
| Income Deficit | 18,026 | $12,712 |
| Wage / Income Gap (%) | 66,125 | 21.52% |
| Wage / Income Gap ($) | 66,125 | 78.48¢ per $1 |
| Gini / Inequality Index | 66,125 | 0.44 |
Earnings by Sex in Wilkes County
Average Earnings in Wilkes County are $31,917, $34,508 for men and $27,081 for women, a difference of 21.5%.
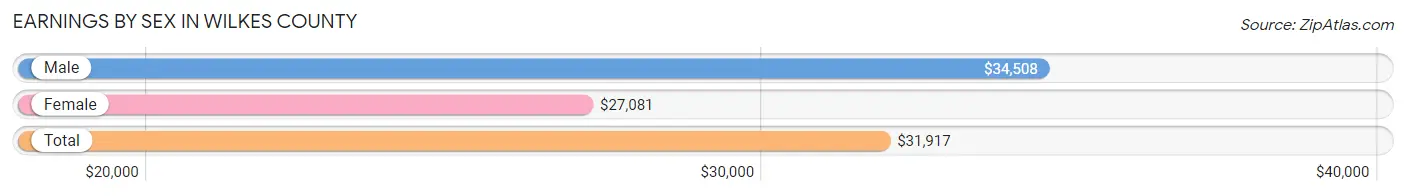
| Sex | Number | Average Earnings |
| Male | 17,295 (54.1%) | $34,508 |
| Female | 14,647 (45.9%) | $27,081 |
| Total | 31,942 (100.0%) | $31,917 |
Earnings by Sex by Income Bracket in Wilkes County
The most common earnings brackets in Wilkes County are $30,000 to $34,999 for men (1,670 | 9.7%) and $25,000 to $29,999 for women (1,460 | 10.0%).
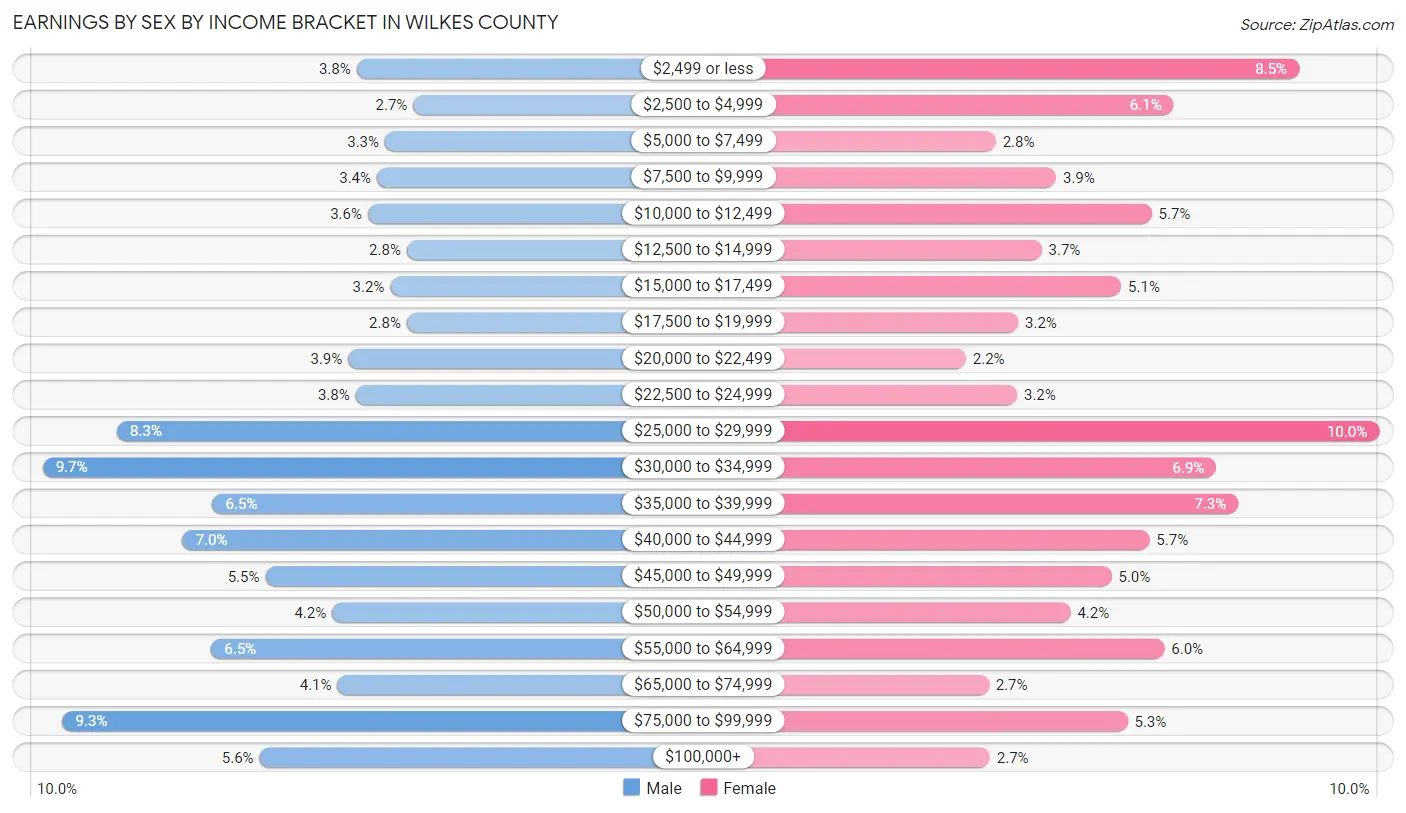
| Income | Male | Female |
| $2,499 or less | 653 (3.8%) | 1,240 (8.5%) |
| $2,500 to $4,999 | 471 (2.7%) | 897 (6.1%) |
| $5,000 to $7,499 | 562 (3.3%) | 408 (2.8%) |
| $7,500 to $9,999 | 588 (3.4%) | 574 (3.9%) |
| $10,000 to $12,499 | 617 (3.6%) | 837 (5.7%) |
| $12,500 to $14,999 | 492 (2.8%) | 534 (3.6%) |
| $15,000 to $17,499 | 545 (3.2%) | 753 (5.1%) |
| $17,500 to $19,999 | 492 (2.8%) | 470 (3.2%) |
| $20,000 to $22,499 | 682 (3.9%) | 326 (2.2%) |
| $22,500 to $24,999 | 657 (3.8%) | 467 (3.2%) |
| $25,000 to $29,999 | 1,431 (8.3%) | 1,460 (10.0%) |
| $30,000 to $34,999 | 1,670 (9.7%) | 1,014 (6.9%) |
| $35,000 to $39,999 | 1,120 (6.5%) | 1,073 (7.3%) |
| $40,000 to $44,999 | 1,217 (7.0%) | 831 (5.7%) |
| $45,000 to $49,999 | 950 (5.5%) | 726 (5.0%) |
| $50,000 to $54,999 | 733 (4.2%) | 613 (4.2%) |
| $55,000 to $64,999 | 1,124 (6.5%) | 872 (5.9%) |
| $65,000 to $74,999 | 716 (4.1%) | 389 (2.7%) |
| $75,000 to $99,999 | 1,606 (9.3%) | 771 (5.3%) |
| $100,000+ | 969 (5.6%) | 392 (2.7%) |
| Total | 17,295 (100.0%) | 14,647 (100.0%) |
Earnings by Sex by Educational Attainment in Wilkes County
Average earnings in Wilkes County are $37,603 for men and $30,938 for women, a difference of 17.7%. Men with an educational attainment of graduate degree enjoy the highest average annual earnings of $76,556, while those with less than high school education earn the least with $29,583. Women with an educational attainment of graduate degree earn the most with the average annual earnings of $61,220, while those with high school diploma education have the smallest earnings of $20,935.
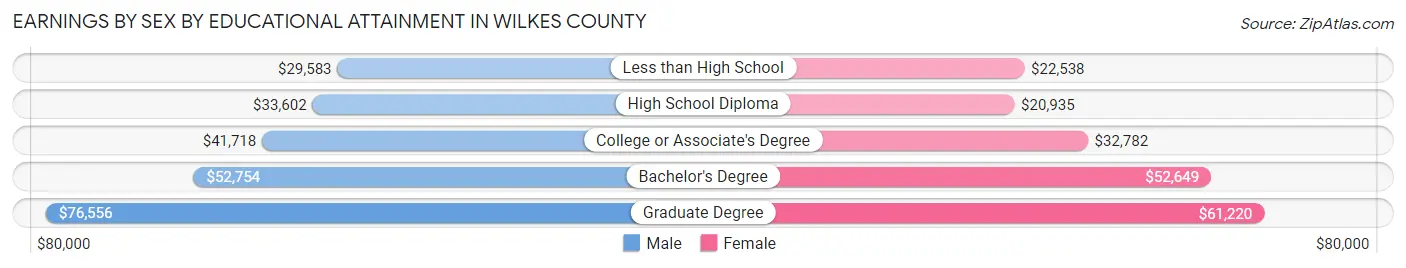
| Educational Attainment | Male Income | Female Income |
| Less than High School | $29,583 | $22,538 |
| High School Diploma | $33,602 | $20,935 |
| College or Associate's Degree | $41,718 | $32,782 |
| Bachelor's Degree | $52,754 | $52,649 |
| Graduate Degree | $76,556 | $61,220 |
| Total | $37,603 | $30,938 |
Family Income in Wilkes County
Family Income Brackets in Wilkes County
According to the Wilkes County family income data, there are 3,858 families falling into the $50,000 to $74,999 income range, which is the most common income bracket and makes up 21.4% of all families. Conversely, the $200,000+ income bracket is the least frequent group with only 523 families (2.9%) belonging to this category.
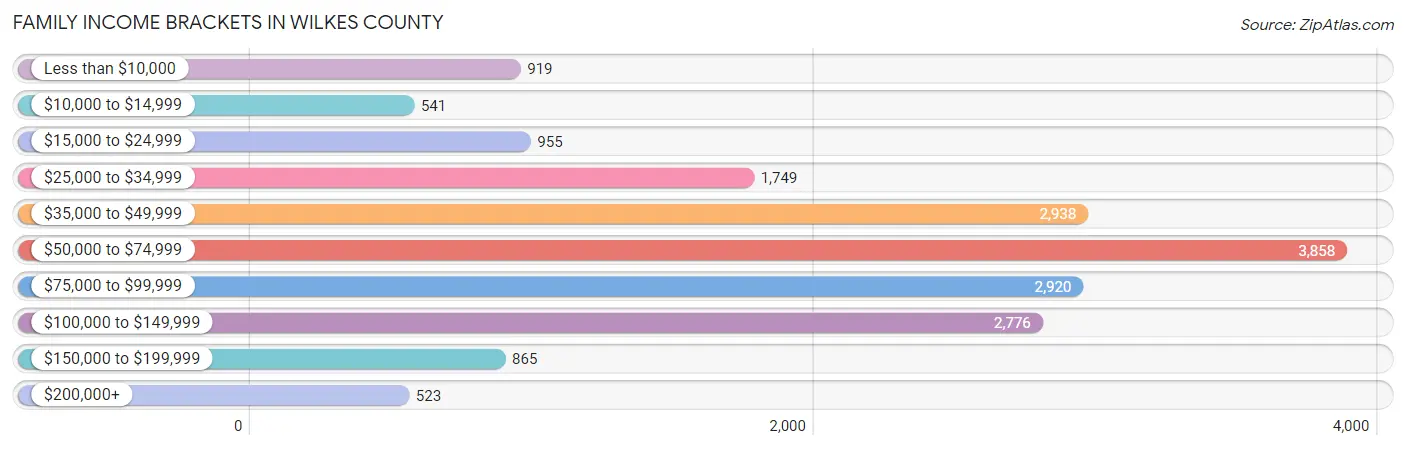
| Income Bracket | # Families | % Families |
| Less than $10,000 | 919 | 5.1% |
| $10,000 to $14,999 | 541 | 3.0% |
| $15,000 to $24,999 | 955 | 5.3% |
| $25,000 to $34,999 | 1,749 | 9.7% |
| $35,000 to $49,999 | 2,938 | 16.3% |
| $50,000 to $74,999 | 3,858 | 21.4% |
| $75,000 to $99,999 | 2,920 | 16.2% |
| $100,000 to $149,999 | 2,776 | 15.4% |
| $150,000 to $199,999 | 865 | 4.8% |
| $200,000+ | 523 | 2.9% |
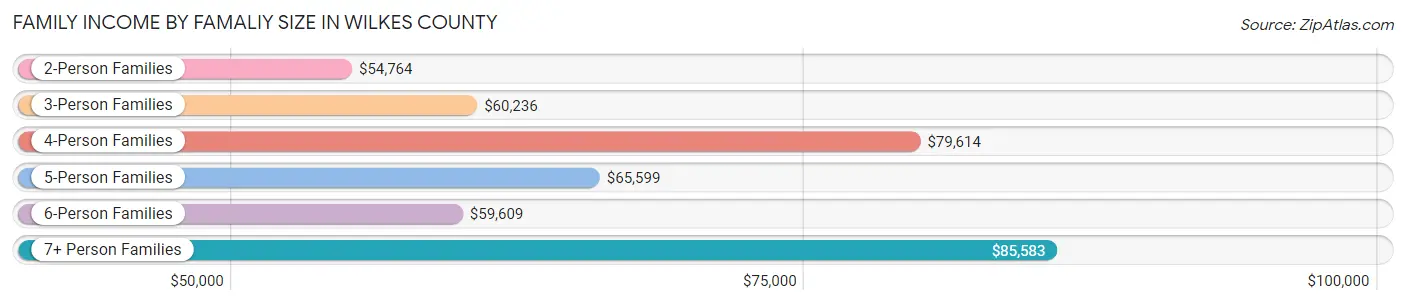
Family Income by Famaliy Size in Wilkes County
7+ person families (301 | 1.7%) account for the highest median family income in Wilkes County with $85,583 per family, while 2-person families (9,900 | 54.9%) have the highest median income of $27,382 per family member.
| Income Bracket | # Families | Median Income |
| 2-Person Families | 9,900 (54.9%) | $54,764 |
| 3-Person Families | 3,757 (20.8%) | $60,236 |
| 4-Person Families | 2,701 (15.0%) | $79,614 |
| 5-Person Families | 901 (5.0%) | $65,599 |
| 6-Person Families | 466 (2.6%) | $59,609 |
| 7+ Person Families | 301 (1.7%) | $85,583 |
| Total | 18,026 (100.0%) | $60,492 |
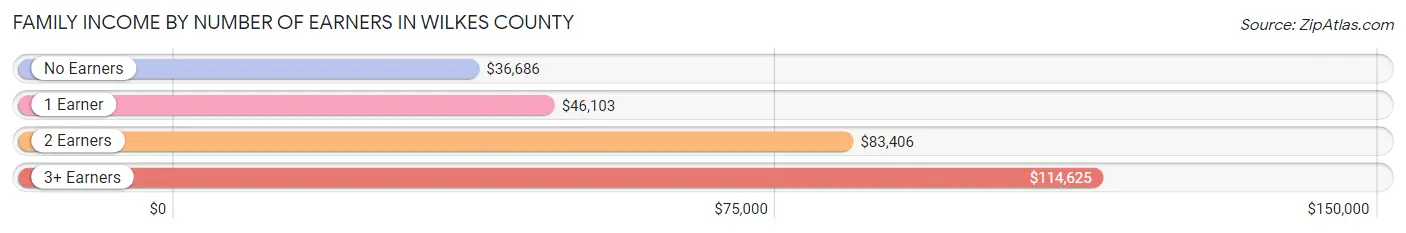
Family Income by Number of Earners in Wilkes County
The median family income in Wilkes County is $60,492, with families comprising 3+ earners (1,488) having the highest median family income of $114,625, while families with no earners (4,088) have the lowest median family income of $36,686, accounting for 8.3% and 22.7% of families, respectively.
| Number of Earners | # Families | Median Income |
| No Earners | 4,088 (22.7%) | $36,686 |
| 1 Earner | 5,852 (32.5%) | $46,103 |
| 2 Earners | 6,598 (36.6%) | $83,406 |
| 3+ Earners | 1,488 (8.3%) | $114,625 |
| Total | 18,026 (100.0%) | $60,492 |
Household Income in Wilkes County
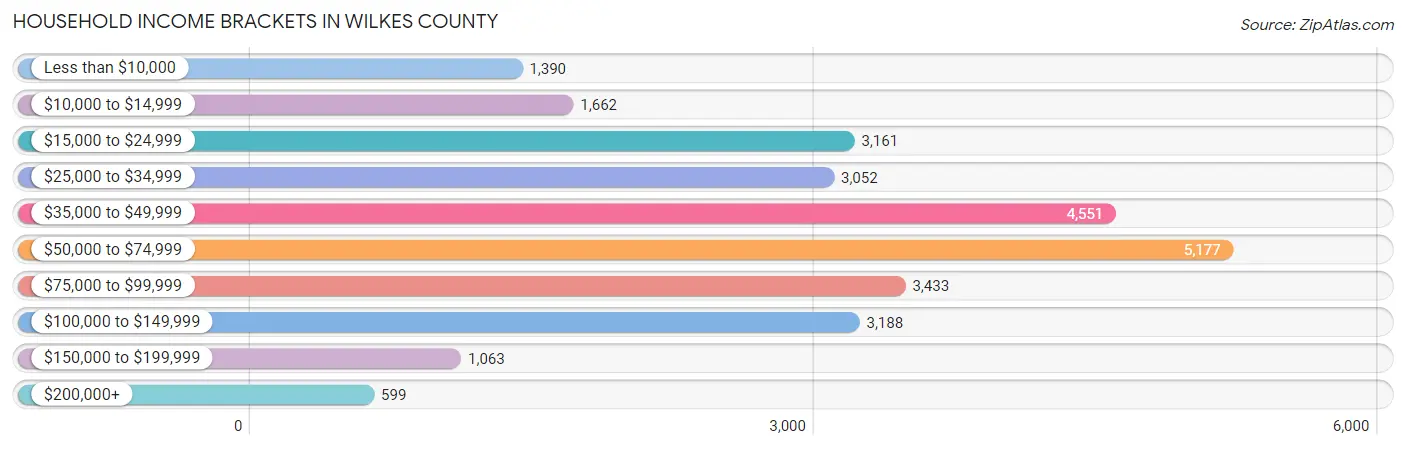
Household Income Brackets in Wilkes County
With 5,177 households falling in the category, the $50,000 to $74,999 income range is the most frequent in Wilkes County, accounting for 19.0% of all households. In contrast, only 599 households (2.2%) fall into the $200,000+ income bracket, making it the least populous group.
| Income Bracket | # Households | % Households |
| Less than $10,000 | 1,390 | 5.1% |
| $10,000 to $14,999 | 1,662 | 6.1% |
| $15,000 to $24,999 | 3,161 | 11.6% |
| $25,000 to $34,999 | 3,052 | 11.2% |
| $35,000 to $49,999 | 4,551 | 16.7% |
| $50,000 to $74,999 | 5,177 | 19.0% |
| $75,000 to $99,999 | 3,433 | 12.6% |
| $100,000 to $149,999 | 3,188 | 11.7% |
| $150,000 to $199,999 | 1,063 | 3.9% |
| $200,000+ | 599 | 2.2% |
Household Income by Householder Age in Wilkes County
The median household income in Wilkes County is $49,119, with the highest median household income of $62,011 found in the 45 to 64 years age bracket for the primary householder. A total of 9,962 households (36.6%) fall into this category. Meanwhile, the 15 to 24 years age bracket for the primary householder has the lowest median household income of $35,900, with 1,034 households (3.8%) in this group.

| Income Bracket | # Households | Median Income |
| 15 to 24 Years | 1,034 (3.8%) | $35,900 |
| 25 to 44 Years | 6,735 (24.7%) | $53,030 |
| 45 to 64 Years | 9,962 (36.6%) | $62,011 |
| 65+ Years | 9,518 (34.9%) | $39,594 |
| Total | 27,249 (100.0%) | $49,119 |
Poverty in Wilkes County
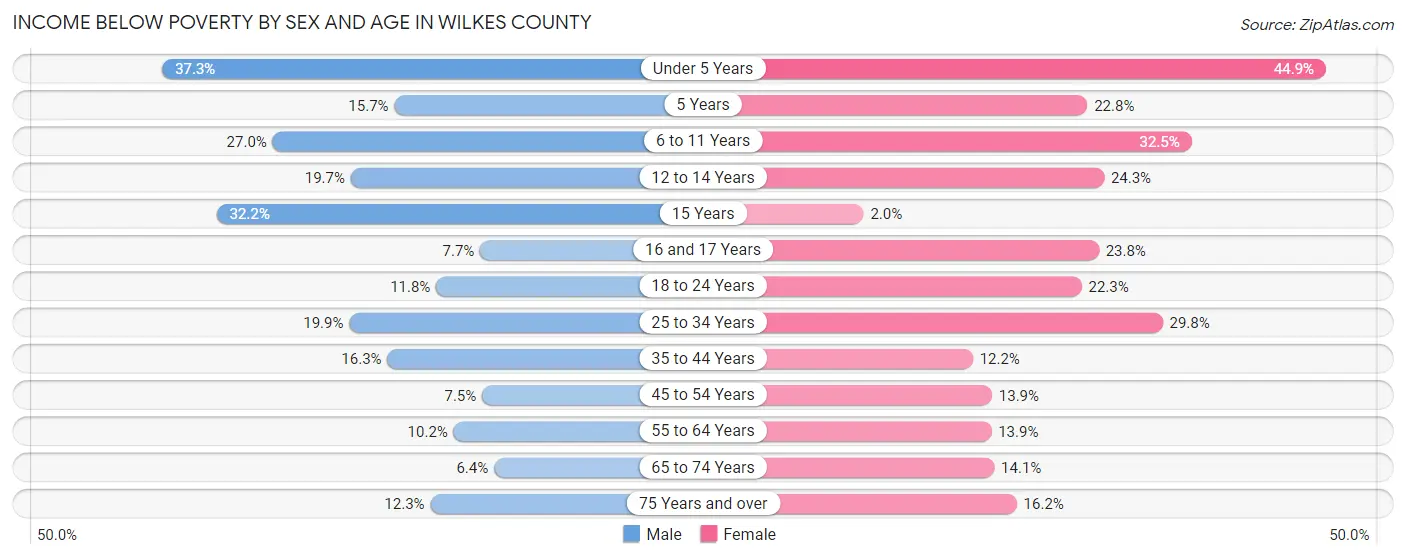
Income Below Poverty by Sex and Age in Wilkes County
With 14.6% poverty level for males and 19.7% for females among the residents of Wilkes County, under 5 year old males and under 5 year old females are the most vulnerable to poverty, with 590 males (37.2%) and 695 females (44.9%) in their respective age groups living below the poverty level.
| Age Bracket | Male | Female |
| Under 5 Years | 590 (37.2%) | 695 (44.9%) |
| 5 Years | 53 (15.7%) | 54 (22.8%) |
| 6 to 11 Years | 539 (27.0%) | 791 (32.5%) |
| 12 to 14 Years | 233 (19.7%) | 246 (24.3%) |
| 15 Years | 206 (32.2%) | 9 (2.0%) |
| 16 and 17 Years | 61 (7.7%) | 164 (23.8%) |
| 18 to 24 Years | 308 (11.8%) | 550 (22.3%) |
| 25 to 34 Years | 727 (19.9%) | 1,075 (29.8%) |
| 35 to 44 Years | 589 (16.3%) | 415 (12.1%) |
| 45 to 54 Years | 332 (7.5%) | 596 (13.9%) |
| 55 to 64 Years | 501 (10.2%) | 662 (13.9%) |
| 65 to 74 Years | 253 (6.4%) | 628 (14.1%) |
| 75 Years and over | 318 (12.3%) | 553 (16.2%) |
| Total | 4,710 (14.6%) | 6,438 (19.7%) |
Income Above Poverty by Sex and Age in Wilkes County
According to the poverty statistics in Wilkes County, males aged 65 to 74 years and females aged 15 years are the age groups that are most secure financially, with 93.6% of males and 98.0% of females in these age groups living above the poverty line.
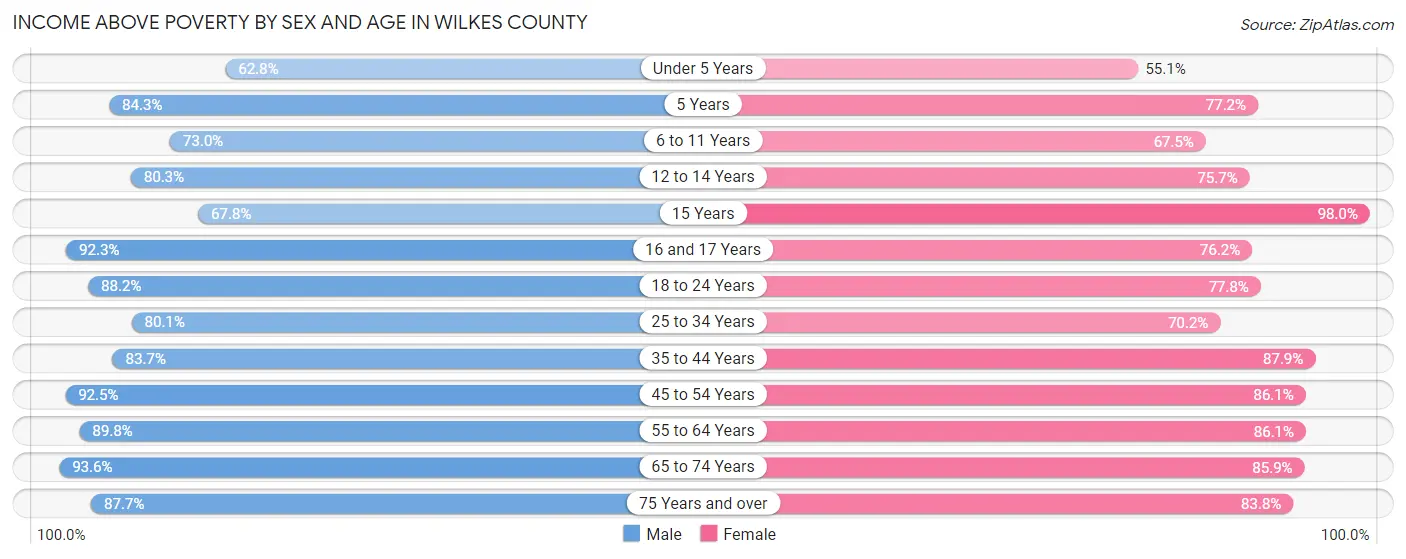
| Age Bracket | Male | Female |
| Under 5 Years | 994 (62.7%) | 852 (55.1%) |
| 5 Years | 285 (84.3%) | 183 (77.2%) |
| 6 to 11 Years | 1,459 (73.0%) | 1,646 (67.5%) |
| 12 to 14 Years | 948 (80.3%) | 765 (75.7%) |
| 15 Years | 434 (67.8%) | 438 (98.0%) |
| 16 and 17 Years | 729 (92.3%) | 524 (76.2%) |
| 18 to 24 Years | 2,302 (88.2%) | 1,922 (77.7%) |
| 25 to 34 Years | 2,931 (80.1%) | 2,536 (70.2%) |
| 35 to 44 Years | 3,018 (83.7%) | 3,001 (87.8%) |
| 45 to 54 Years | 4,072 (92.5%) | 3,683 (86.1%) |
| 55 to 64 Years | 4,418 (89.8%) | 4,111 (86.1%) |
| 65 to 74 Years | 3,681 (93.6%) | 3,812 (85.9%) |
| 75 Years and over | 2,259 (87.7%) | 2,855 (83.8%) |
| Total | 27,530 (85.4%) | 26,328 (80.3%) |
Income Below Poverty Among Married-Couple Families in Wilkes County
The poverty statistics for married-couple families in Wilkes County show that 6.2% or 851 of the total 13,680 families live below the poverty line. Families with 3 or 4 children have the highest poverty rate of 22.5%, comprising of 202 families. On the other hand, families with 5 or more children have the lowest poverty rate of 0.0%, which includes 0 families.
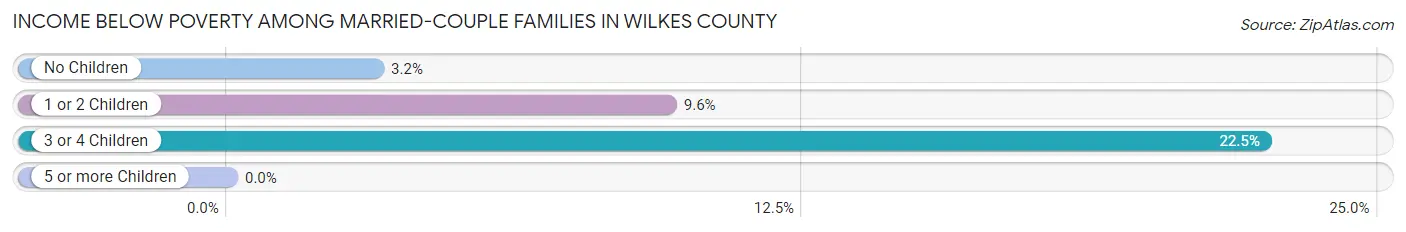
| Children | Above Poverty | Below Poverty |
| No Children | 8,524 (96.8%) | 280 (3.2%) |
| 1 or 2 Children | 3,494 (90.4%) | 369 (9.6%) |
| 3 or 4 Children | 696 (77.5%) | 202 (22.5%) |
| 5 or more Children | 115 (100.0%) | 0 (0.0%) |
| Total | 12,829 (93.8%) | 851 (6.2%) |
Income Below Poverty Among Single-Parent Households in Wilkes County
According to the poverty data in Wilkes County, 27.1% or 335 single-father households and 34.1% or 1,060 single-mother households are living below the poverty line. Among single-father households, those with 3 or 4 children have the highest poverty rate, with 69 households (79.3%) experiencing poverty. Likewise, among single-mother households, those with 5 or more children have the highest poverty rate, with 24 households (100.0%) falling below the poverty line.
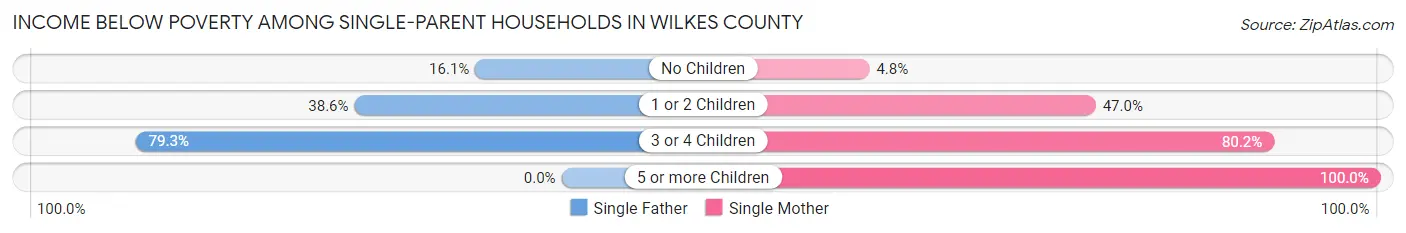
| Children | Single Father | Single Mother |
| No Children | 119 (16.1%) | 56 (4.8%) |
| 1 or 2 Children | 147 (38.6%) | 794 (46.9%) |
| 3 or 4 Children | 69 (79.3%) | 186 (80.2%) |
| 5 or more Children | 0 (0.0%) | 24 (100.0%) |
| Total | 335 (27.1%) | 1,060 (34.1%) |
Income Below Poverty Among Married-Couple vs Single-Parent Households in Wilkes County
The poverty data for Wilkes County shows that 851 of the married-couple family households (6.2%) and 1,395 of the single-parent households (32.1%) are living below the poverty level. Within the married-couple family households, those with 3 or 4 children have the highest poverty rate, with 202 households (22.5%) falling below the poverty line. Among the single-parent households, those with 3 or 4 children have the highest poverty rate, with 255 household (79.9%) living below poverty.
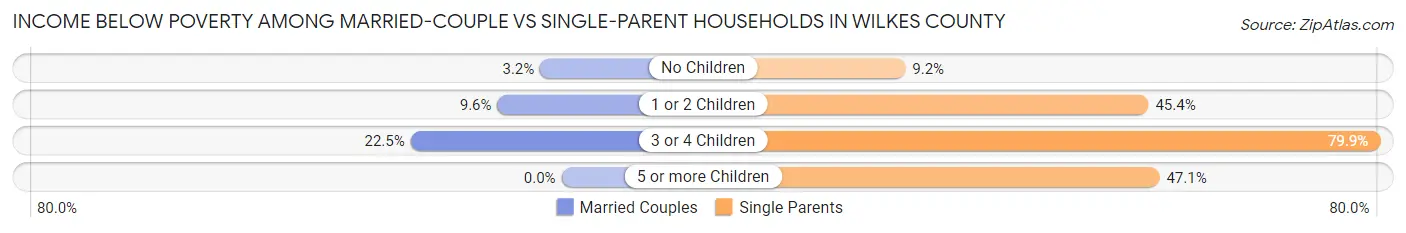
| Children | Married-Couple Families | Single-Parent Households |
| No Children | 280 (3.2%) | 175 (9.2%) |
| 1 or 2 Children | 369 (9.6%) | 941 (45.4%) |
| 3 or 4 Children | 202 (22.5%) | 255 (79.9%) |
| 5 or more Children | 0 (0.0%) | 24 (47.1%) |
| Total | 851 (6.2%) | 1,395 (32.1%) |
Employment Characteristics in Wilkes County
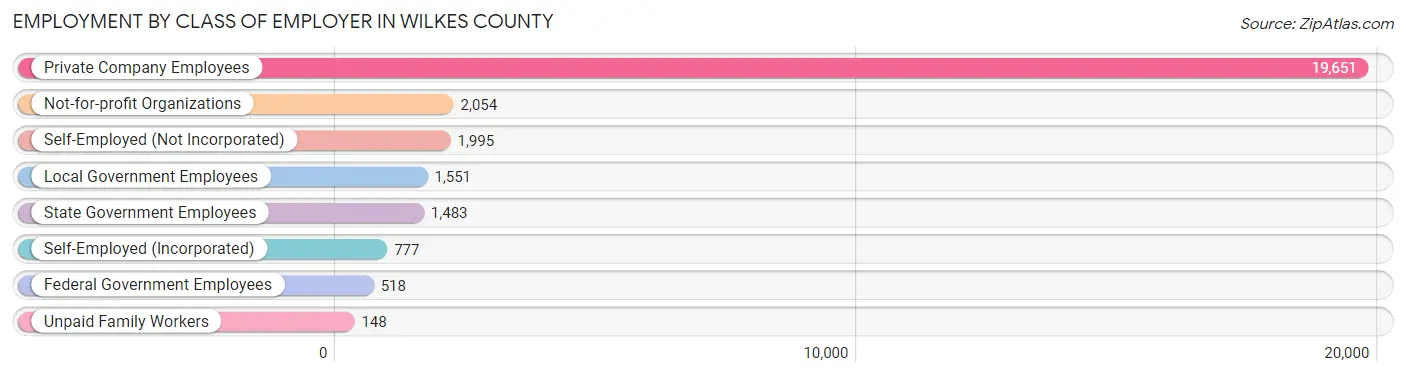
Employment by Class of Employer in Wilkes County
Among the 28,177 employed individuals in Wilkes County, private company employees (19,651 | 69.7%), not-for-profit organizations (2,054 | 7.3%), and self-employed (not incorporated) (1,995 | 7.1%) make up the most common classes of employment.
| Employer Class | # Employees | % Employees |
| Private Company Employees | 19,651 | 69.7% |
| Self-Employed (Incorporated) | 777 | 2.8% |
| Self-Employed (Not Incorporated) | 1,995 | 7.1% |
| Not-for-profit Organizations | 2,054 | 7.3% |
| Local Government Employees | 1,551 | 5.5% |
| State Government Employees | 1,483 | 5.3% |
| Federal Government Employees | 518 | 1.8% |
| Unpaid Family Workers | 148 | 0.5% |
| Total | 28,177 | 100.0% |
Employment Status by Age in Wilkes County
According to the labor force statistics for Wilkes County, out of the total population over 16 years of age (54,382), 56.0% or 30,454 individuals are in the labor force, with 6.0% or 1,827 of them unemployed. The age group with the highest labor force participation rate is 25 to 29 years, with 83.0% or 3,245 individuals in the labor force. Within the labor force, the 16 to 19 years age range has the highest percentage of unemployed individuals, with 20.9% or 326 of them being unemployed.

| Age Bracket | In Labor Force | Unemployed |
| 16 to 19 Years | 1,561 (53.2%) | 326 (20.9%) |
| 20 to 24 Years | 2,929 (79.3%) | 240 (8.2%) |
| 25 to 29 Years | 3,245 (83.0%) | 487 (15.0%) |
| 30 to 34 Years | 2,641 (77.0%) | 275 (10.4%) |
| 35 to 44 Years | 5,573 (78.0%) | 201 (3.6%) |
| 45 to 54 Years | 6,587 (74.9%) | 145 (2.2%) |
| 55 to 59 Years | 3,556 (68.5%) | 82 (2.3%) |
| 60 to 64 Years | 2,199 (48.3%) | 37 (1.7%) |
| 65 to 74 Years | 1,905 (22.6%) | 29 (1.5%) |
| 75 Years and over | 271 (4.3%) | 0 (0.0%) |
| Total | 30,454 (56.0%) | 1,827 (6.0%) |
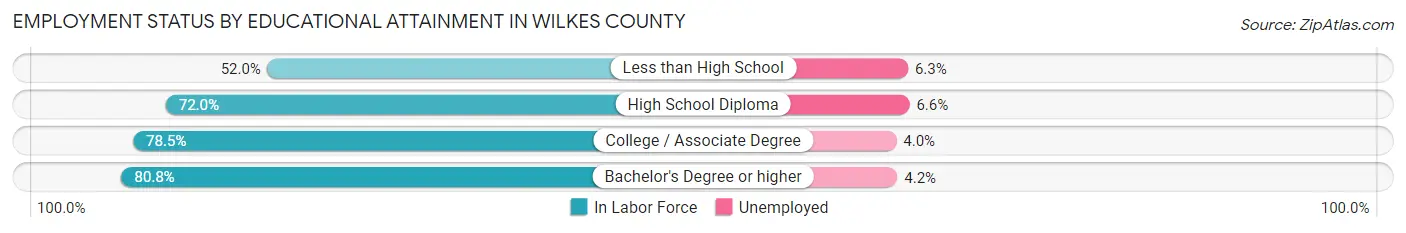
Employment Status by Educational Attainment in Wilkes County
According to labor force statistics for Wilkes County, 72.1% of individuals (23,810) out of the total population between 25 and 64 years of age (33,023) are in the labor force, with 5.1% or 1,214 of them being unemployed. The group with the highest labor force participation rate are those with the educational attainment of bachelor's degree or higher, with 80.8% or 4,451 individuals in the labor force. Within the labor force, individuals with high school diploma education have the highest percentage of unemployment, with 6.6% or 480 of them being unemployed.
| Educational Attainment | In Labor Force | Unemployed |
| Less than High School | 3,119 (52.0%) | 378 (6.3%) |
| High School Diploma | 7,268 (72.0%) | 666 (6.6%) |
| College / Associate Degree | 8,965 (78.5%) | 457 (4.0%) |
| Bachelor's Degree or higher | 4,451 (80.8%) | 231 (4.2%) |
| Total | 23,810 (72.1%) | 1,684 (5.1%) |
Employment Occupations by Sex in Wilkes County
Management, Business, Science and Arts Occupations
The most common Management, Business, Science and Arts occupations in Wilkes County are Community & Social Service (2,497 | 8.7%), Management (2,330 | 8.2%), Health Diagnosing & Treating (1,643 | 5.8%), Education Instruction & Library (1,384 | 4.8%), and Health Technologists (1,051 | 3.7%).

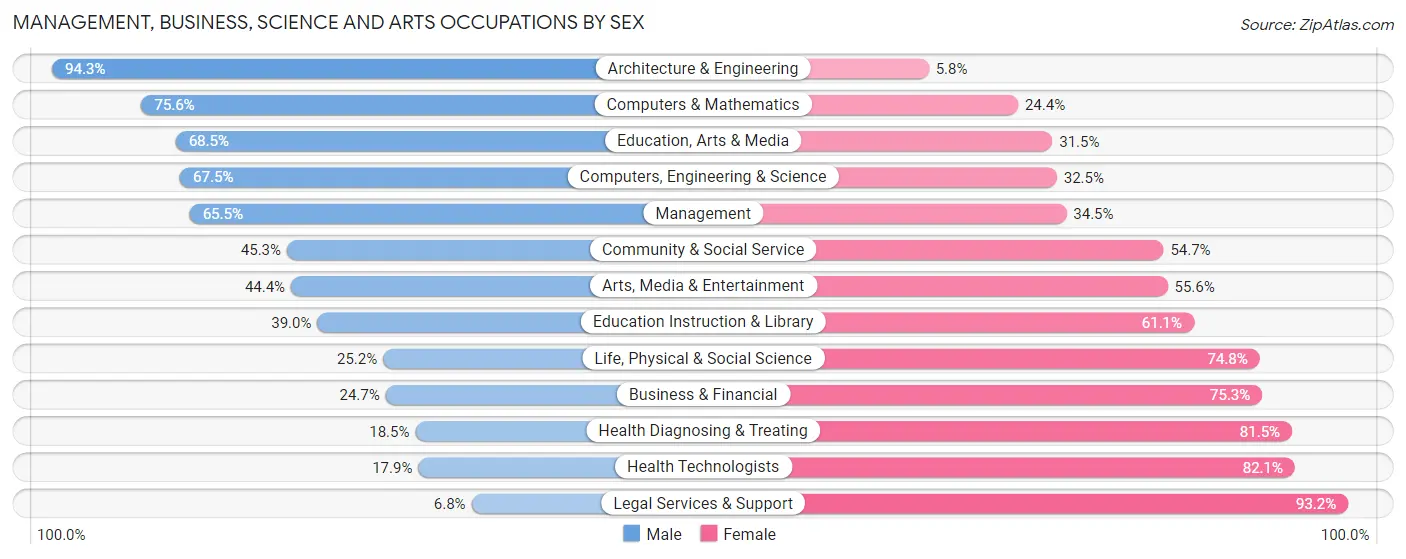
Management, Business, Science and Arts Occupations by Sex
Within the Management, Business, Science and Arts occupations in Wilkes County, the most male-oriented occupations are Architecture & Engineering (94.3%), Computers & Mathematics (75.6%), and Education, Arts & Media (68.5%), while the most female-oriented occupations are Legal Services & Support (93.2%), Health Technologists (82.1%), and Health Diagnosing & Treating (81.5%).
| Occupation | Male | Female |
| Management | 1,527 (65.5%) | 803 (34.5%) |
| Business & Financial | 190 (24.7%) | 579 (75.3%) |
| Computers, Engineering & Science | 566 (67.5%) | 272 (32.5%) |
| Computers & Mathematics | 298 (75.6%) | 96 (24.4%) |
| Architecture & Engineering | 213 (94.3%) | 13 (5.8%) |
| Life, Physical & Social Science | 55 (25.2%) | 163 (74.8%) |
| Community & Social Service | 1,131 (45.3%) | 1,366 (54.7%) |
| Education, Arts & Media | 404 (68.5%) | 186 (31.5%) |
| Legal Services & Support | 8 (6.8%) | 110 (93.2%) |
| Education Instruction & Library | 539 (39.0%) | 845 (61.1%) |
| Arts, Media & Entertainment | 180 (44.4%) | 225 (55.6%) |
| Health Diagnosing & Treating | 304 (18.5%) | 1,339 (81.5%) |
| Health Technologists | 188 (17.9%) | 863 (82.1%) |
| Total (Category) | 3,718 (46.0%) | 4,359 (54.0%) |
| Total (Overall) | 15,671 (54.9%) | 12,897 (45.1%) |
Services Occupations
The most common Services occupations in Wilkes County are Cleaning & Maintenance (1,507 | 5.3%), Food Preparation & Serving (1,394 | 4.9%), Healthcare Support (1,232 | 4.3%), Personal Care & Service (664 | 2.3%), and Security & Protection (591 | 2.1%).
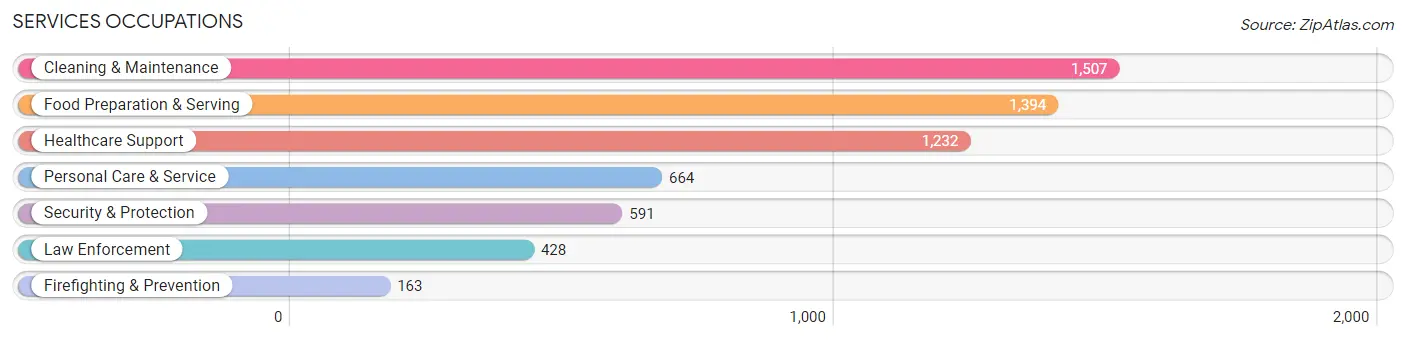
Services Occupations by Sex
Within the Services occupations in Wilkes County, the most male-oriented occupations are Firefighting & Prevention (95.1%), Security & Protection (76.5%), and Law Enforcement (69.4%), while the most female-oriented occupations are Healthcare Support (88.8%), Personal Care & Service (82.2%), and Food Preparation & Serving (66.5%).
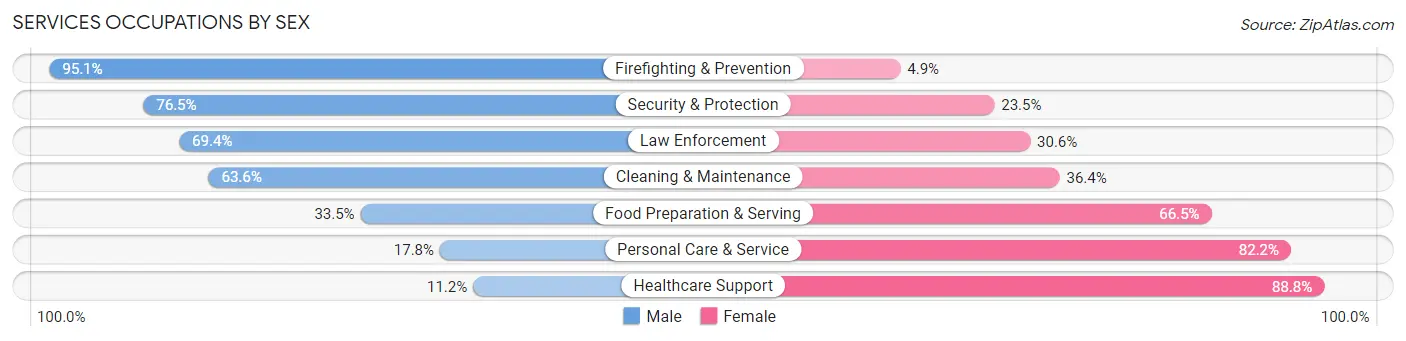
| Occupation | Male | Female |
| Healthcare Support | 138 (11.2%) | 1,094 (88.8%) |
| Security & Protection | 452 (76.5%) | 139 (23.5%) |
| Firefighting & Prevention | 155 (95.1%) | 8 (4.9%) |
| Law Enforcement | 297 (69.4%) | 131 (30.6%) |
| Food Preparation & Serving | 467 (33.5%) | 927 (66.5%) |
| Cleaning & Maintenance | 958 (63.6%) | 549 (36.4%) |
| Personal Care & Service | 118 (17.8%) | 546 (82.2%) |
| Total (Category) | 2,133 (39.6%) | 3,255 (60.4%) |
| Total (Overall) | 15,671 (54.9%) | 12,897 (45.1%) |
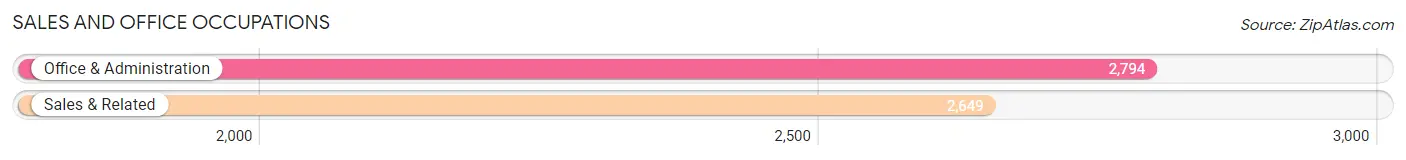
Sales and Office Occupations
The most common Sales and Office occupations in Wilkes County are Office & Administration (2,794 | 9.8%), and Sales & Related (2,649 | 9.3%).
Sales and Office Occupations by Sex
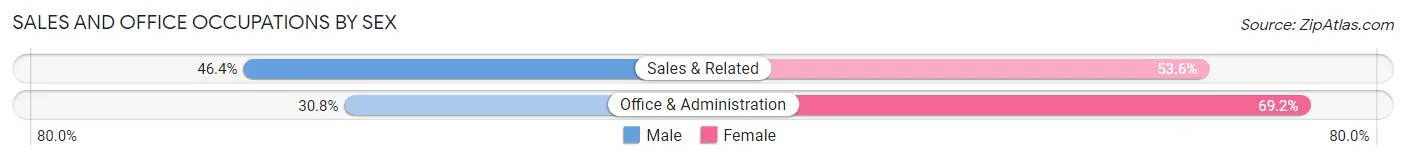
| Occupation | Male | Female |
| Sales & Related | 1,228 (46.4%) | 1,421 (53.6%) |
| Office & Administration | 861 (30.8%) | 1,933 (69.2%) |
| Total (Category) | 2,089 (38.4%) | 3,354 (61.6%) |
| Total (Overall) | 15,671 (54.9%) | 12,897 (45.1%) |
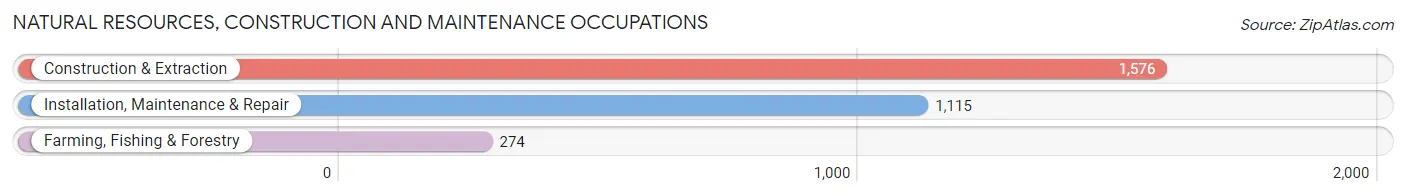
Natural Resources, Construction and Maintenance Occupations
The most common Natural Resources, Construction and Maintenance occupations in Wilkes County are Construction & Extraction (1,576 | 5.5%), Installation, Maintenance & Repair (1,115 | 3.9%), and Farming, Fishing & Forestry (274 | 1.0%).
Natural Resources, Construction and Maintenance Occupations by Sex
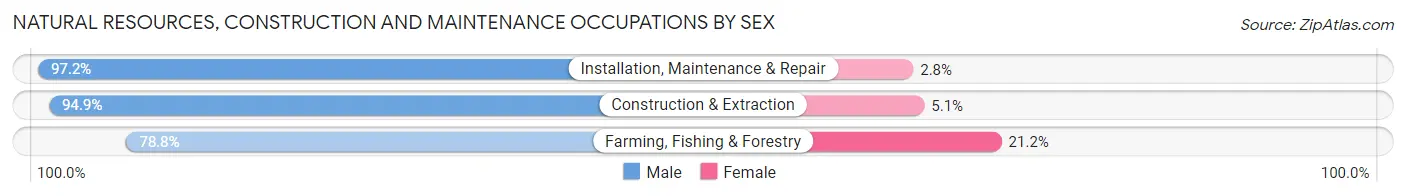
| Occupation | Male | Female |
| Farming, Fishing & Forestry | 216 (78.8%) | 58 (21.2%) |
| Construction & Extraction | 1,496 (94.9%) | 80 (5.1%) |
| Installation, Maintenance & Repair | 1,084 (97.2%) | 31 (2.8%) |
| Total (Category) | 2,796 (94.3%) | 169 (5.7%) |
| Total (Overall) | 15,671 (54.9%) | 12,897 (45.1%) |
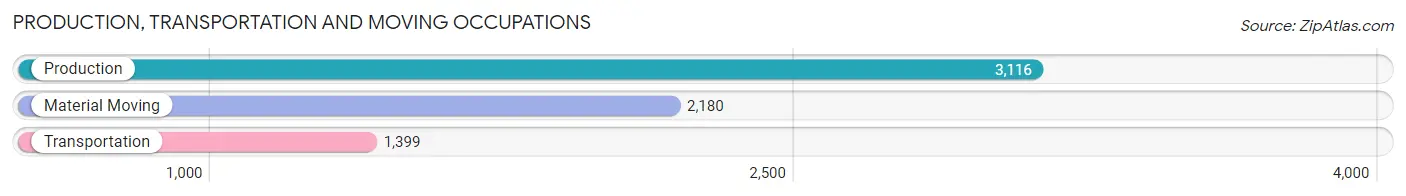
Production, Transportation and Moving Occupations
The most common Production, Transportation and Moving occupations in Wilkes County are Production (3,116 | 10.9%), Material Moving (2,180 | 7.6%), and Transportation (1,399 | 4.9%).
Production, Transportation and Moving Occupations by Sex
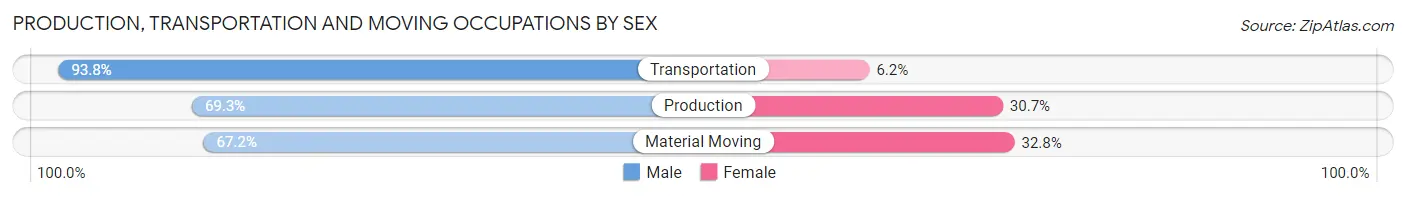
| Occupation | Male | Female |
| Production | 2,159 (69.3%) | 957 (30.7%) |
| Transportation | 1,312 (93.8%) | 87 (6.2%) |
| Material Moving | 1,464 (67.2%) | 716 (32.8%) |
| Total (Category) | 4,935 (73.7%) | 1,760 (26.3%) |
| Total (Overall) | 15,671 (54.9%) | 12,897 (45.1%) |
Employment Industries by Sex in Wilkes County
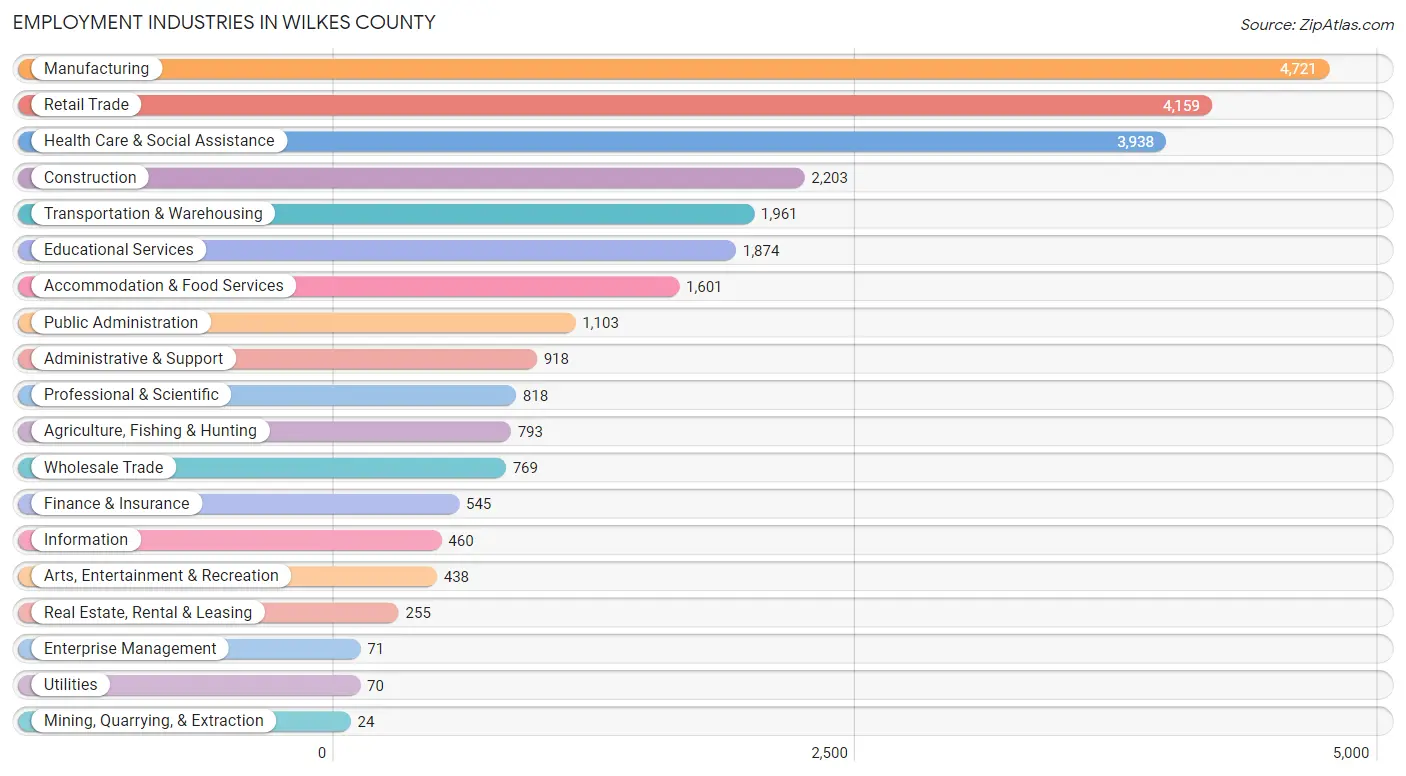
Employment Industries in Wilkes County
The major employment industries in Wilkes County include Manufacturing (4,721 | 16.5%), Retail Trade (4,159 | 14.6%), Health Care & Social Assistance (3,938 | 13.8%), Construction (2,203 | 7.7%), and Transportation & Warehousing (1,961 | 6.9%).
Employment Industries by Sex in Wilkes County
The Wilkes County industries that see more men than women are Mining, Quarrying, & Extraction (100.0%), Utilities (100.0%), and Construction (90.7%), whereas the industries that tend to have a higher number of women are Enterprise Management (100.0%), Finance & Insurance (86.8%), and Health Care & Social Assistance (81.3%).
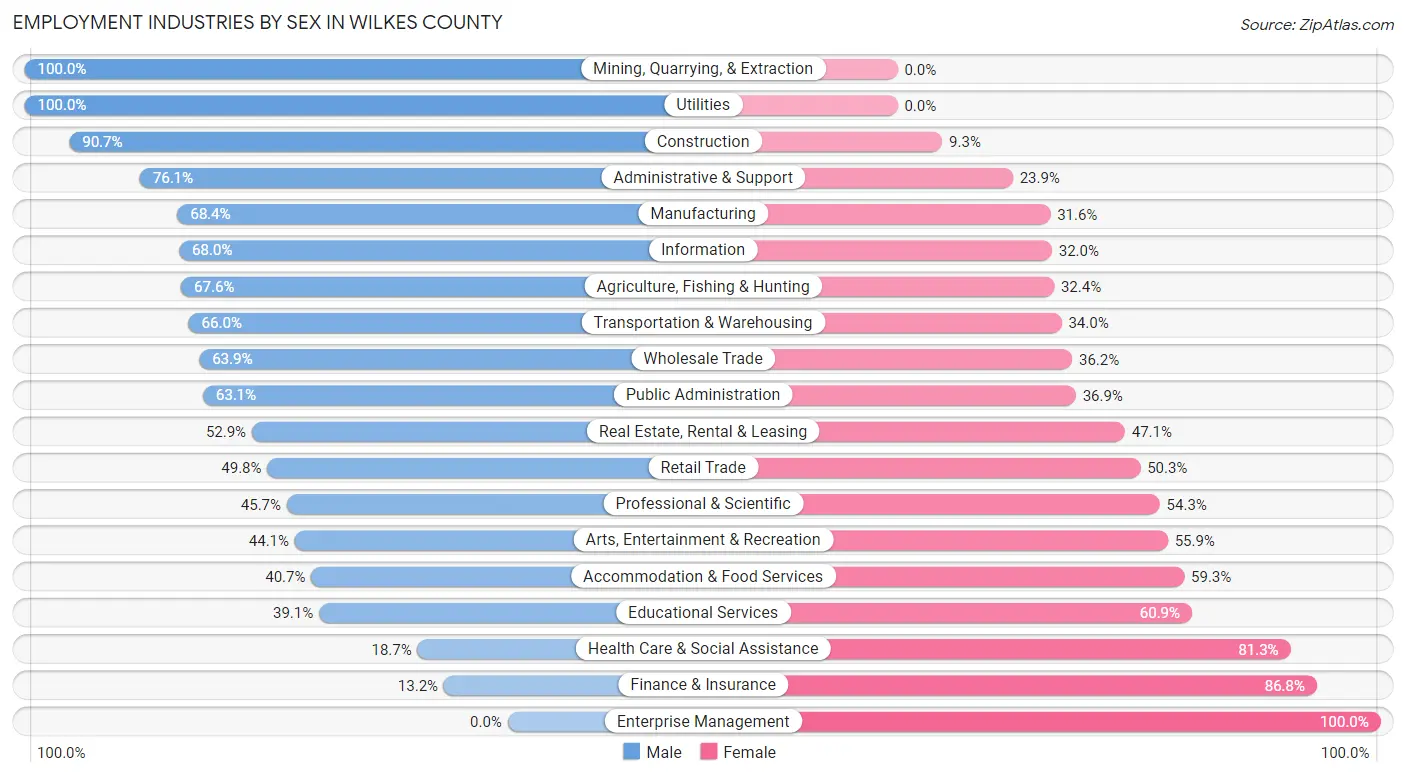
| Industry | Male | Female |
| Agriculture, Fishing & Hunting | 536 (67.6%) | 257 (32.4%) |
| Mining, Quarrying, & Extraction | 24 (100.0%) | 0 (0.0%) |
| Construction | 1,999 (90.7%) | 204 (9.3%) |
| Manufacturing | 3,228 (68.4%) | 1,493 (31.6%) |
| Wholesale Trade | 491 (63.8%) | 278 (36.1%) |
| Retail Trade | 2,069 (49.7%) | 2,090 (50.2%) |
| Transportation & Warehousing | 1,295 (66.0%) | 666 (34.0%) |
| Utilities | 70 (100.0%) | 0 (0.0%) |
| Information | 313 (68.0%) | 147 (32.0%) |
| Finance & Insurance | 72 (13.2%) | 473 (86.8%) |
| Real Estate, Rental & Leasing | 135 (52.9%) | 120 (47.1%) |
| Professional & Scientific | 374 (45.7%) | 444 (54.3%) |
| Enterprise Management | 0 (0.0%) | 71 (100.0%) |
| Administrative & Support | 699 (76.1%) | 219 (23.9%) |
| Educational Services | 732 (39.1%) | 1,142 (60.9%) |
| Health Care & Social Assistance | 735 (18.7%) | 3,203 (81.3%) |
| Arts, Entertainment & Recreation | 193 (44.1%) | 245 (55.9%) |
| Accommodation & Food Services | 651 (40.7%) | 950 (59.3%) |
| Public Administration | 696 (63.1%) | 407 (36.9%) |
| Total | 15,671 (54.9%) | 12,897 (45.1%) |
Education in Wilkes County
School Enrollment in Wilkes County
The most common levels of schooling among the 12,150 students in Wilkes County are elementary school (3,085 | 25.4%), high school (2,805 | 23.1%), and middle school (2,802 | 23.1%).

| School Level | # Students | % Students |
| Nursery / Preschool | 442 | 3.6% |
| Kindergarten | 677 | 5.6% |
| Elementary School | 3,085 | 25.4% |
| Middle School | 2,802 | 23.1% |
| High School | 2,805 | 23.1% |
| College / Undergraduate | 2,076 | 17.1% |
| Graduate / Professional | 263 | 2.2% |
| Total | 12,150 | 100.0% |
School Enrollment by Age by Funding Source in Wilkes County
Out of a total of 12,150 students who are enrolled in schools in Wilkes County, 1,713 (14.1%) attend a private institution, while the remaining 10,437 (85.9%) are enrolled in public schools. The age group of 35 years and over has the highest likelihood of being enrolled in private schools, with 213 (44.9% in the age bracket) enrolled. Conversely, the age group of 20 to 24 year olds has the lowest likelihood of being enrolled in a private school, with 849 (93.8% in the age bracket) attending a public institution.
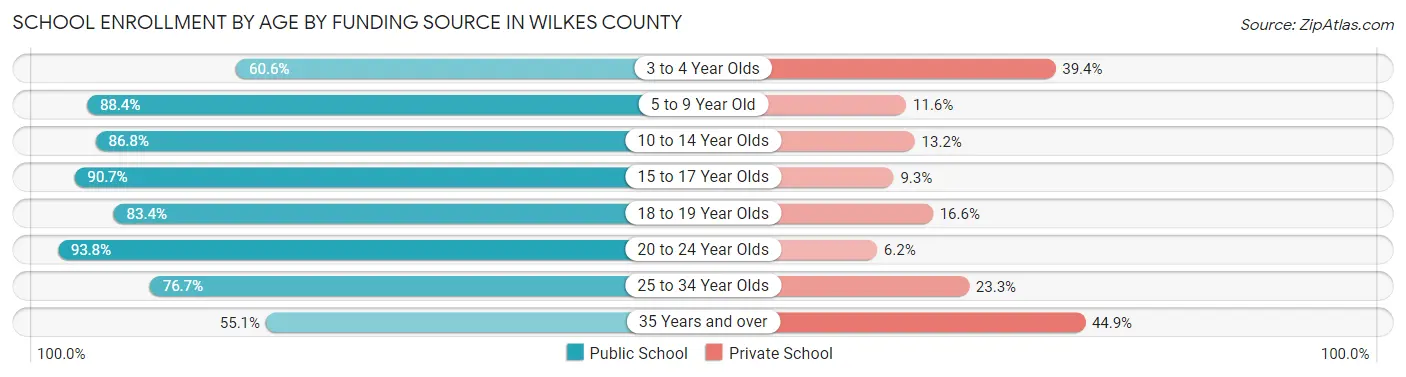
| Age Bracket | Public School | Private School |
| 3 to 4 Year Olds | 206 (60.6%) | 134 (39.4%) |
| 5 to 9 Year Old | 2,911 (88.4%) | 383 (11.6%) |
| 10 to 14 Year Olds | 3,130 (86.8%) | 477 (13.2%) |
| 15 to 17 Year Olds | 2,034 (90.7%) | 208 (9.3%) |
| 18 to 19 Year Olds | 749 (83.4%) | 149 (16.6%) |
| 20 to 24 Year Olds | 849 (93.8%) | 56 (6.2%) |
| 25 to 34 Year Olds | 299 (76.7%) | 91 (23.3%) |
| 35 Years and over | 261 (55.1%) | 213 (44.9%) |
| Total | 10,437 (85.9%) | 1,713 (14.1%) |
Educational Attainment by Field of Study in Wilkes County
Education (2,022 | 24.3%), business (1,391 | 16.7%), science & technology (1,185 | 14.2%), bio, nature & agricultural (561 | 6.7%), and arts & humanities (468 | 5.6%) are the most common fields of study among 8,321 individuals in Wilkes County who have obtained a bachelor's degree or higher.
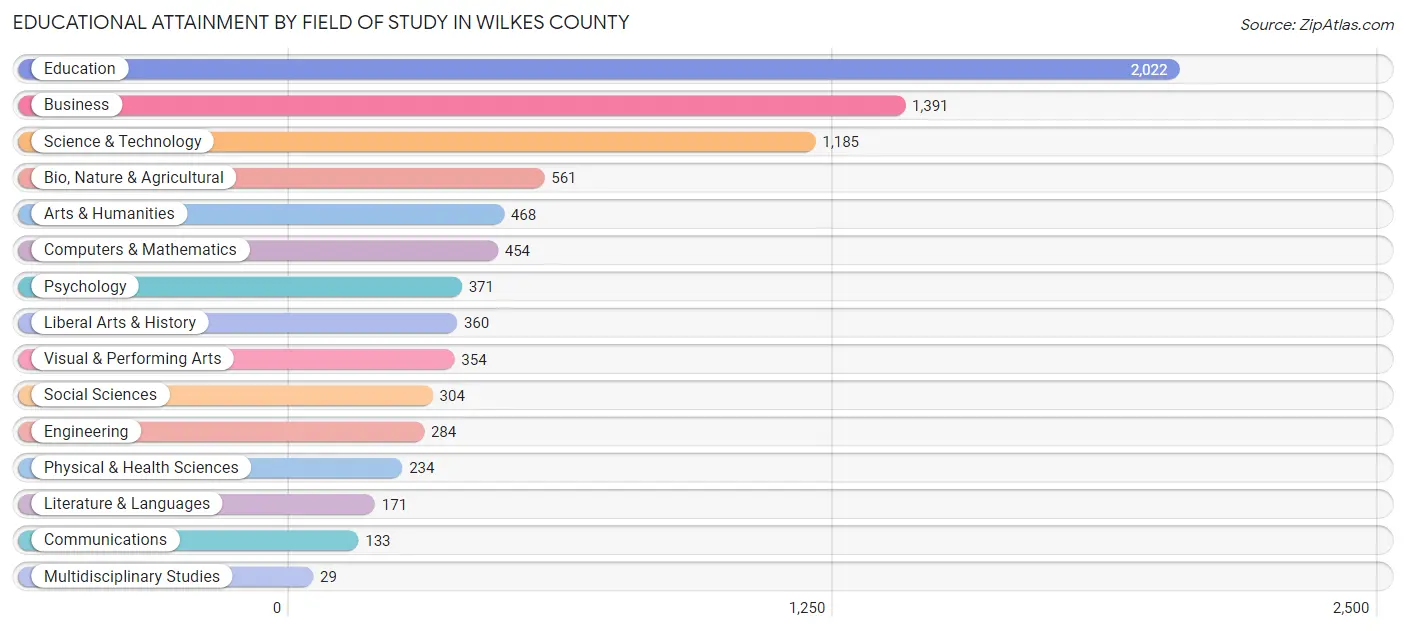
| Field of Study | # Graduates | % Graduates |
| Computers & Mathematics | 454 | 5.5% |
| Bio, Nature & Agricultural | 561 | 6.7% |
| Physical & Health Sciences | 234 | 2.8% |
| Psychology | 371 | 4.5% |
| Social Sciences | 304 | 3.6% |
| Engineering | 284 | 3.4% |
| Multidisciplinary Studies | 29 | 0.4% |
| Science & Technology | 1,185 | 14.2% |
| Business | 1,391 | 16.7% |
| Education | 2,022 | 24.3% |
| Literature & Languages | 171 | 2.1% |
| Liberal Arts & History | 360 | 4.3% |
| Visual & Performing Arts | 354 | 4.3% |
| Communications | 133 | 1.6% |
| Arts & Humanities | 468 | 5.6% |
| Total | 8,321 | 100.0% |
Transportation & Commute in Wilkes County
Vehicle Availability by Sex in Wilkes County
The most prevalent vehicle ownership categories in Wilkes County are males with 2 vehicles (5,514, accounting for 35.5%) and females with 2 vehicles (4,635, making up 43.7%).
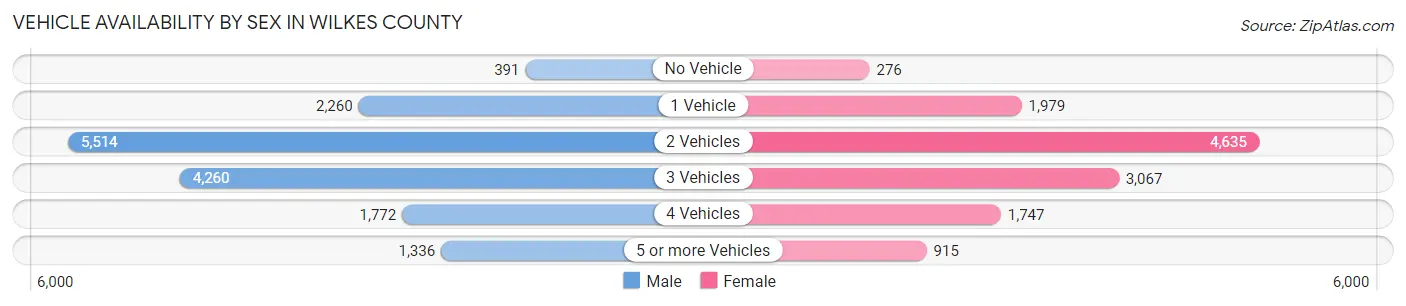
| Vehicles Available | Male | Female |
| No Vehicle | 391 (2.5%) | 276 (2.2%) |
| 1 Vehicle | 2,260 (14.5%) | 1,979 (15.7%) |
| 2 Vehicles | 5,514 (35.5%) | 4,635 (36.7%) |
| 3 Vehicles | 4,260 (27.4%) | 3,067 (24.3%) |
| 4 Vehicles | 1,772 (11.4%) | 1,747 (13.8%) |
| 5 or more Vehicles | 1,336 (8.6%) | 915 (7.2%) |
| Total | 15,533 (100.0%) | 12,619 (100.0%) |
Commute Time in Wilkes County
The most frequently occuring commute durations in Wilkes County are 15 to 19 minutes (4,875 commuters, 18.7%), 10 to 14 minutes (3,798 commuters, 14.6%), and 20 to 24 minutes (3,603 commuters, 13.8%).
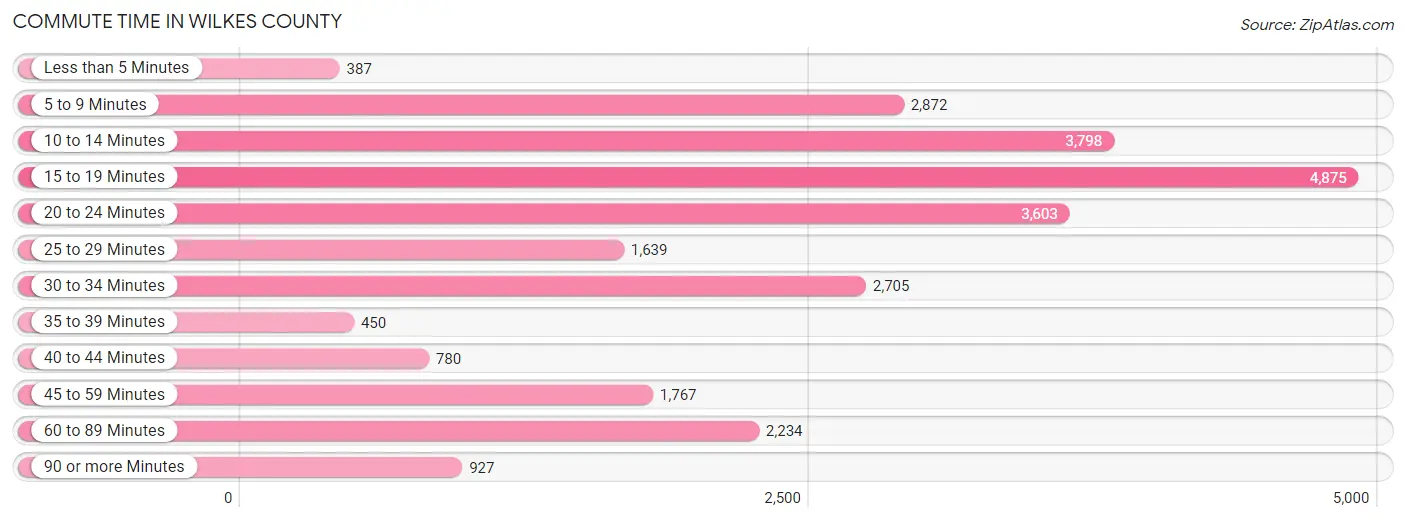
| Commute Time | # Commuters | % Commuters |
| Less than 5 Minutes | 387 | 1.5% |
| 5 to 9 Minutes | 2,872 | 11.0% |
| 10 to 14 Minutes | 3,798 | 14.6% |
| 15 to 19 Minutes | 4,875 | 18.7% |
| 20 to 24 Minutes | 3,603 | 13.8% |
| 25 to 29 Minutes | 1,639 | 6.3% |
| 30 to 34 Minutes | 2,705 | 10.4% |
| 35 to 39 Minutes | 450 | 1.7% |
| 40 to 44 Minutes | 780 | 3.0% |
| 45 to 59 Minutes | 1,767 | 6.8% |
| 60 to 89 Minutes | 2,234 | 8.6% |
| 90 or more Minutes | 927 | 3.6% |
Commute Time by Sex in Wilkes County
The most common commute times in Wilkes County are 15 to 19 minutes (2,528 commuters, 17.4%) for males and 15 to 19 minutes (2,347 commuters, 20.3%) for females.
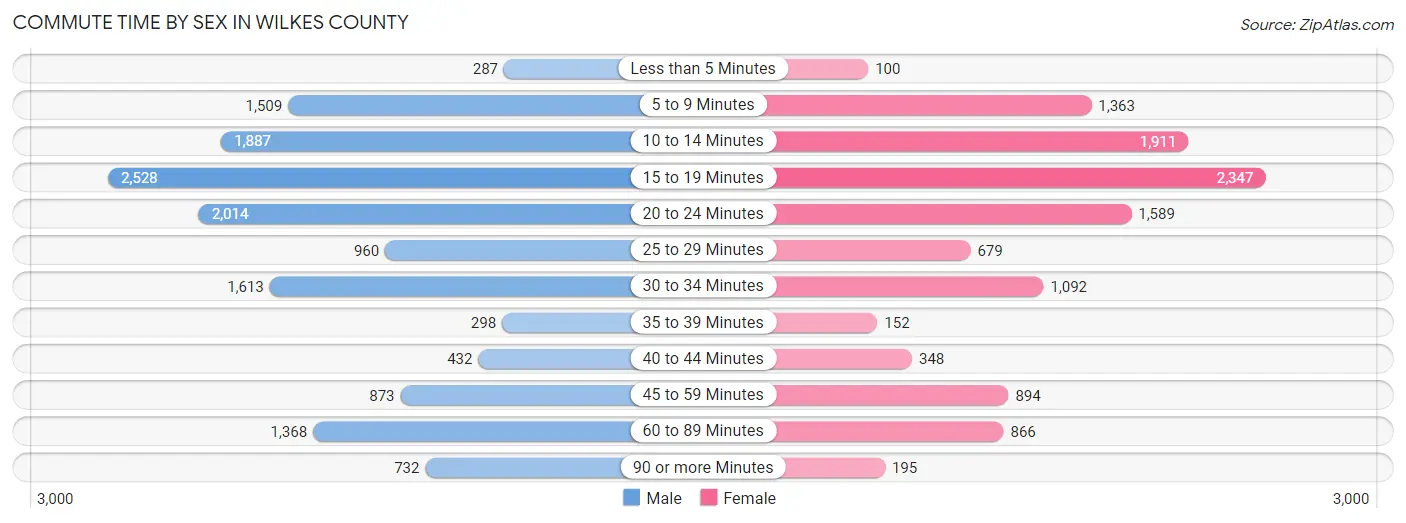
| Commute Time | Male | Female |
| Less than 5 Minutes | 287 (2.0%) | 100 (0.9%) |
| 5 to 9 Minutes | 1,509 (10.4%) | 1,363 (11.8%) |
| 10 to 14 Minutes | 1,887 (13.0%) | 1,911 (16.6%) |
| 15 to 19 Minutes | 2,528 (17.4%) | 2,347 (20.3%) |
| 20 to 24 Minutes | 2,014 (13.9%) | 1,589 (13.8%) |
| 25 to 29 Minutes | 960 (6.6%) | 679 (5.9%) |
| 30 to 34 Minutes | 1,613 (11.1%) | 1,092 (9.5%) |
| 35 to 39 Minutes | 298 (2.1%) | 152 (1.3%) |
| 40 to 44 Minutes | 432 (3.0%) | 348 (3.0%) |
| 45 to 59 Minutes | 873 (6.0%) | 894 (7.7%) |
| 60 to 89 Minutes | 1,368 (9.4%) | 866 (7.5%) |
| 90 or more Minutes | 732 (5.1%) | 195 (1.7%) |
Time of Departure to Work by Sex in Wilkes County
The most frequent times of departure to work in Wilkes County are 7:00 AM to 7:29 AM (2,222, 15.3%) for males and 7:30 AM to 7:59 AM (1,915, 16.6%) for females.
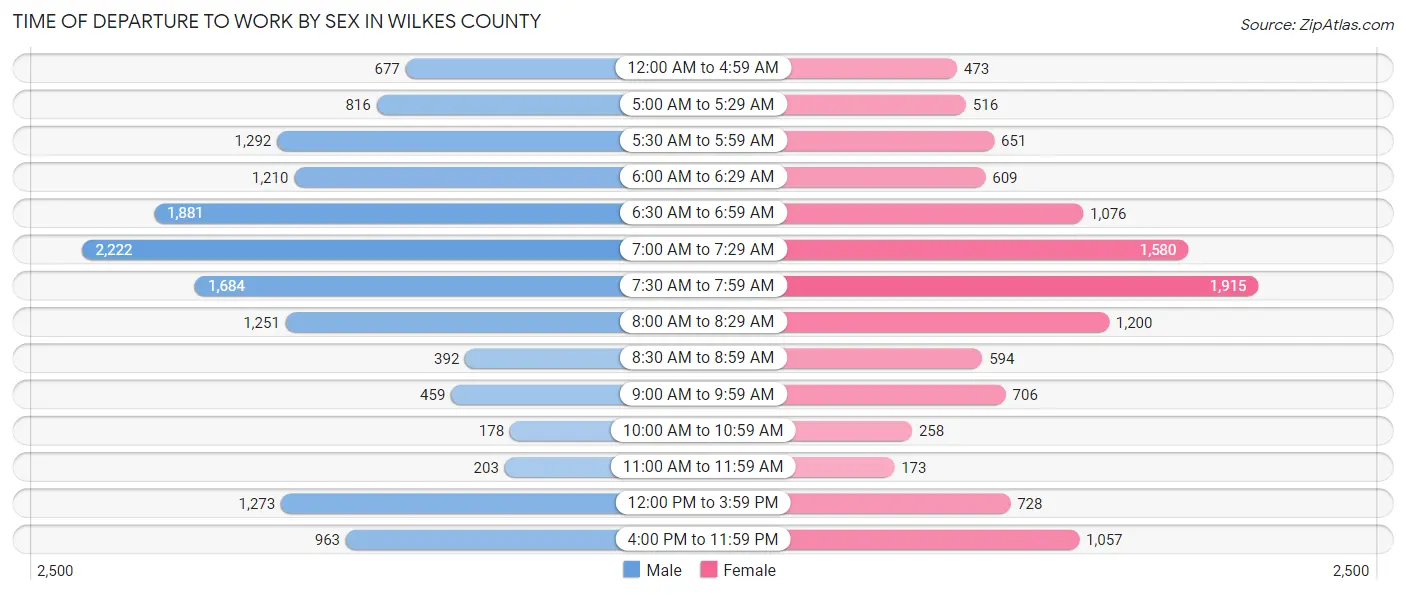
| Time of Departure | Male | Female |
| 12:00 AM to 4:59 AM | 677 (4.7%) | 473 (4.1%) |
| 5:00 AM to 5:29 AM | 816 (5.6%) | 516 (4.5%) |
| 5:30 AM to 5:59 AM | 1,292 (8.9%) | 651 (5.6%) |
| 6:00 AM to 6:29 AM | 1,210 (8.3%) | 609 (5.3%) |
| 6:30 AM to 6:59 AM | 1,881 (13.0%) | 1,076 (9.3%) |
| 7:00 AM to 7:29 AM | 2,222 (15.3%) | 1,580 (13.7%) |
| 7:30 AM to 7:59 AM | 1,684 (11.6%) | 1,915 (16.6%) |
| 8:00 AM to 8:29 AM | 1,251 (8.6%) | 1,200 (10.4%) |
| 8:30 AM to 8:59 AM | 392 (2.7%) | 594 (5.1%) |
| 9:00 AM to 9:59 AM | 459 (3.2%) | 706 (6.1%) |
| 10:00 AM to 10:59 AM | 178 (1.2%) | 258 (2.2%) |
| 11:00 AM to 11:59 AM | 203 (1.4%) | 173 (1.5%) |
| 12:00 PM to 3:59 PM | 1,273 (8.8%) | 728 (6.3%) |
| 4:00 PM to 11:59 PM | 963 (6.6%) | 1,057 (9.2%) |
| Total | 14,501 (100.0%) | 11,536 (100.0%) |
Housing Occupancy in Wilkes County
Occupancy by Ownership in Wilkes County
Of the total 27,249 dwellings in Wilkes County, owner-occupied units account for 19,892 (73.0%), while renter-occupied units make up 7,357 (27.0%).
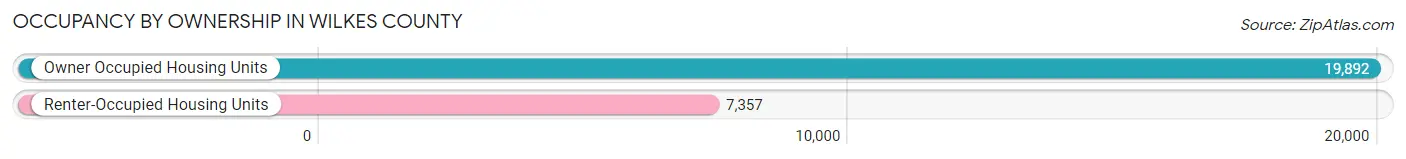
| Occupancy | # Housing Units | % Housing Units |
| Owner Occupied Housing Units | 19,892 | 73.0% |
| Renter-Occupied Housing Units | 7,357 | 27.0% |
| Total Occupied Housing Units | 27,249 | 100.0% |
Occupancy by Household Size in Wilkes County
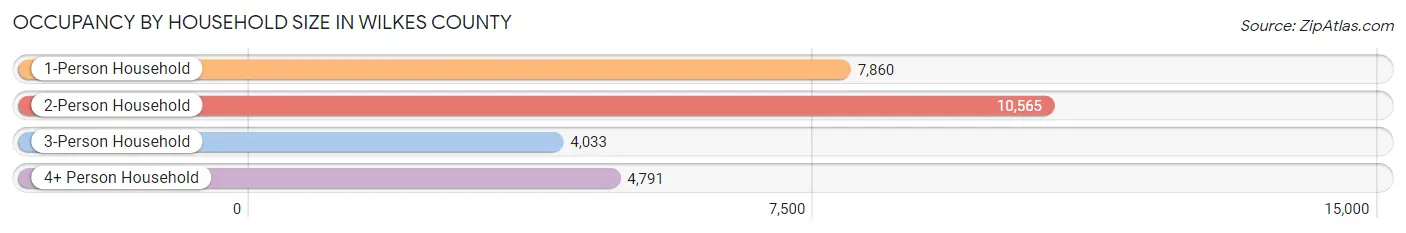
| Household Size | # Housing Units | % Housing Units |
| 1-Person Household | 7,860 | 28.8% |
| 2-Person Household | 10,565 | 38.8% |
| 3-Person Household | 4,033 | 14.8% |
| 4+ Person Household | 4,791 | 17.6% |
| Total Housing Units | 27,249 | 100.0% |
Occupancy by Ownership by Household Size in Wilkes County
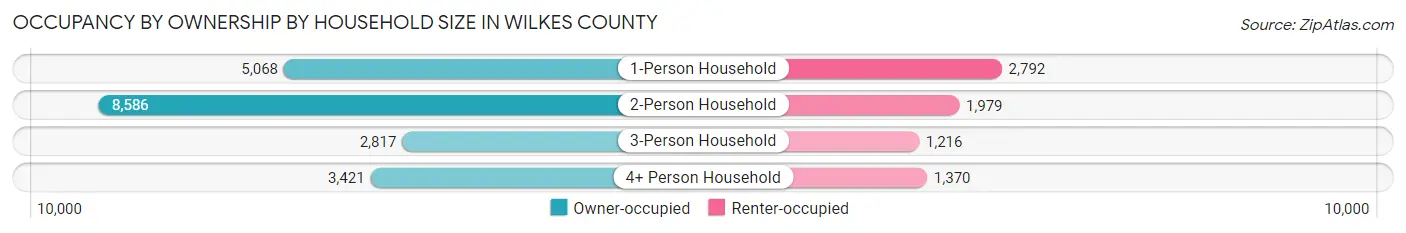
| Household Size | Owner-occupied | Renter-occupied |
| 1-Person Household | 5,068 (64.5%) | 2,792 (35.5%) |
| 2-Person Household | 8,586 (81.3%) | 1,979 (18.7%) |
| 3-Person Household | 2,817 (69.9%) | 1,216 (30.1%) |
| 4+ Person Household | 3,421 (71.4%) | 1,370 (28.6%) |
| Total Housing Units | 19,892 (73.0%) | 7,357 (27.0%) |
Occupancy by Educational Attainment in Wilkes County
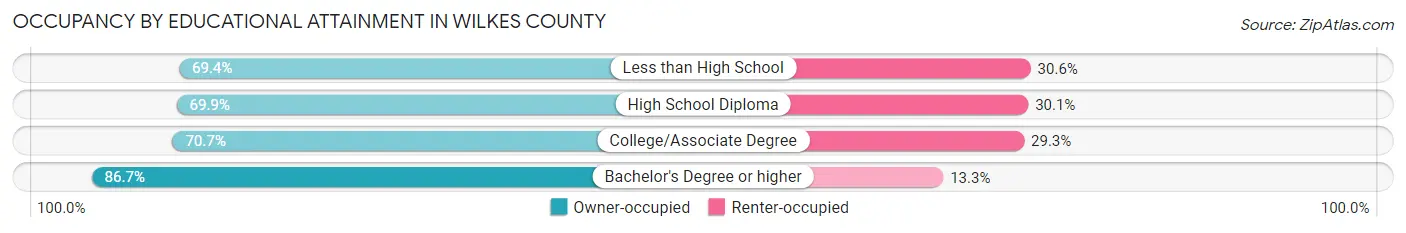
| Household Size | Owner-occupied | Renter-occupied |
| Less than High School | 3,256 (69.4%) | 1,438 (30.6%) |
| High School Diploma | 5,720 (69.9%) | 2,468 (30.1%) |
| College/Associate Degree | 6,790 (70.7%) | 2,818 (29.3%) |
| Bachelor's Degree or higher | 4,126 (86.7%) | 633 (13.3%) |
Occupancy by Age of Householder in Wilkes County
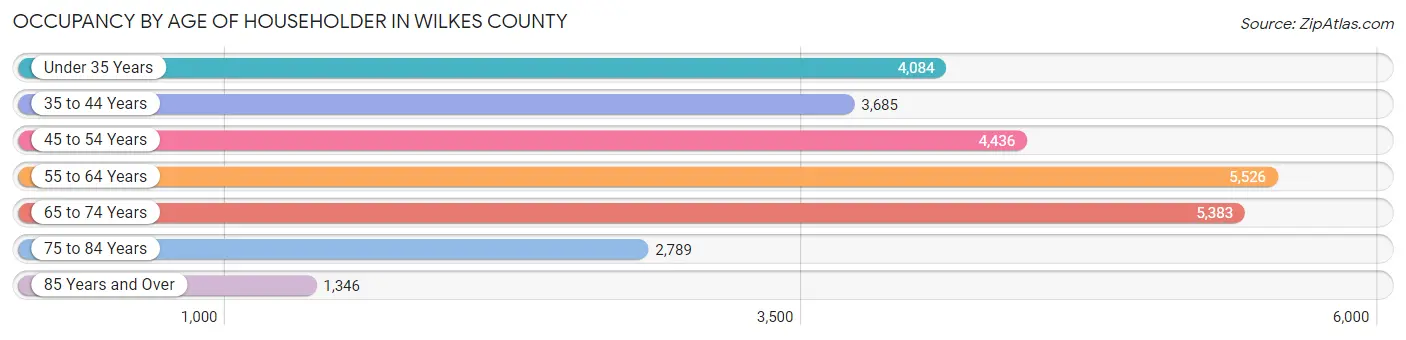
| Age Bracket | # Households | % Households |
| Under 35 Years | 4,084 | 15.0% |
| 35 to 44 Years | 3,685 | 13.5% |
| 45 to 54 Years | 4,436 | 16.3% |
| 55 to 64 Years | 5,526 | 20.3% |
| 65 to 74 Years | 5,383 | 19.8% |
| 75 to 84 Years | 2,789 | 10.2% |
| 85 Years and Over | 1,346 | 4.9% |
| Total | 27,249 | 100.0% |
Housing Finances in Wilkes County
Median Income by Occupancy in Wilkes County
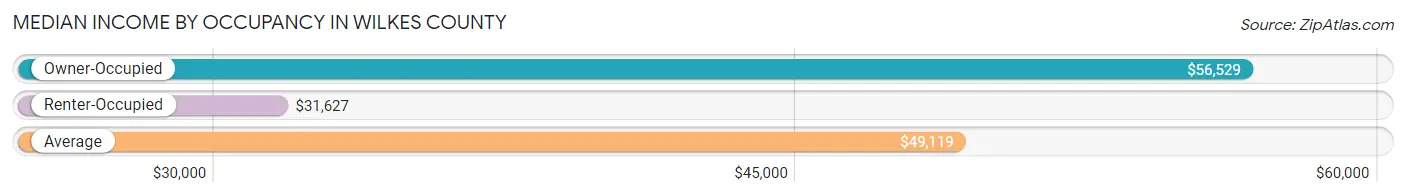
| Occupancy Type | # Households | Median Income |
| Owner-Occupied | 19,892 (73.0%) | $56,529 |
| Renter-Occupied | 7,357 (27.0%) | $31,627 |
| Average | 27,249 (100.0%) | $49,119 |
Occupancy by Householder Income Bracket in Wilkes County
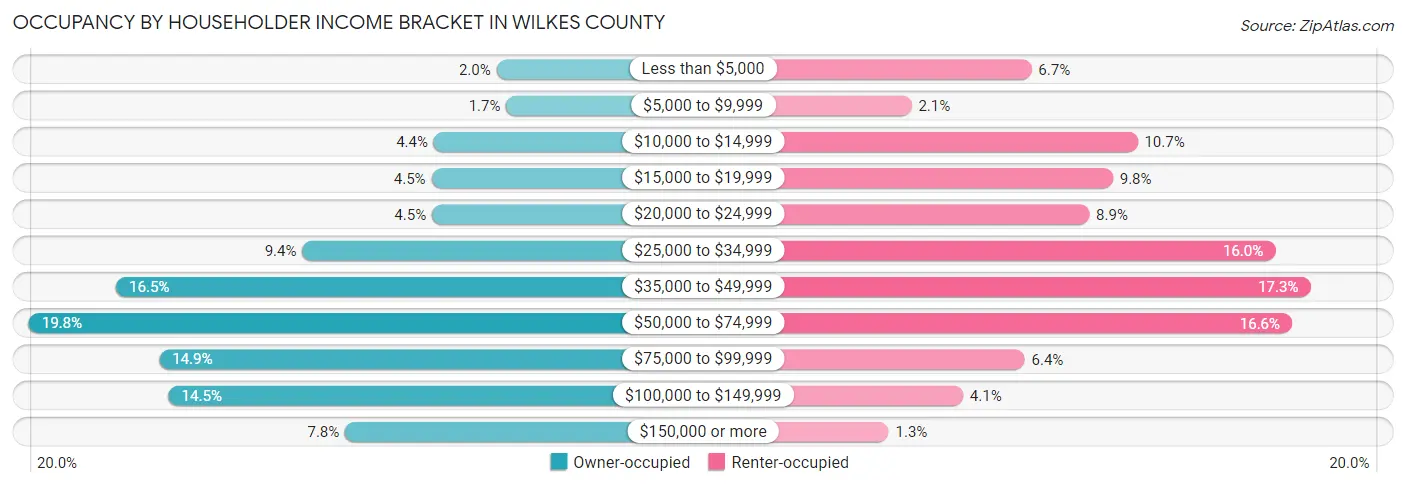
| Income Bracket | Owner-occupied | Renter-occupied |
| Less than $5,000 | 401 (2.0%) | 493 (6.7%) |
| $5,000 to $9,999 | 329 (1.7%) | 157 (2.1%) |
| $10,000 to $14,999 | 878 (4.4%) | 790 (10.7%) |
| $15,000 to $19,999 | 896 (4.5%) | 721 (9.8%) |
| $20,000 to $24,999 | 891 (4.5%) | 655 (8.9%) |
| $25,000 to $34,999 | 1,873 (9.4%) | 1,176 (16.0%) |
| $35,000 to $49,999 | 3,284 (16.5%) | 1,274 (17.3%) |
| $50,000 to $74,999 | 3,946 (19.8%) | 1,223 (16.6%) |
| $75,000 to $99,999 | 2,958 (14.9%) | 474 (6.4%) |
| $100,000 to $149,999 | 2,887 (14.5%) | 301 (4.1%) |
| $150,000 or more | 1,549 (7.8%) | 93 (1.3%) |
| Total | 19,892 (100.0%) | 7,357 (100.0%) |
Monthly Housing Cost Tiers in Wilkes County
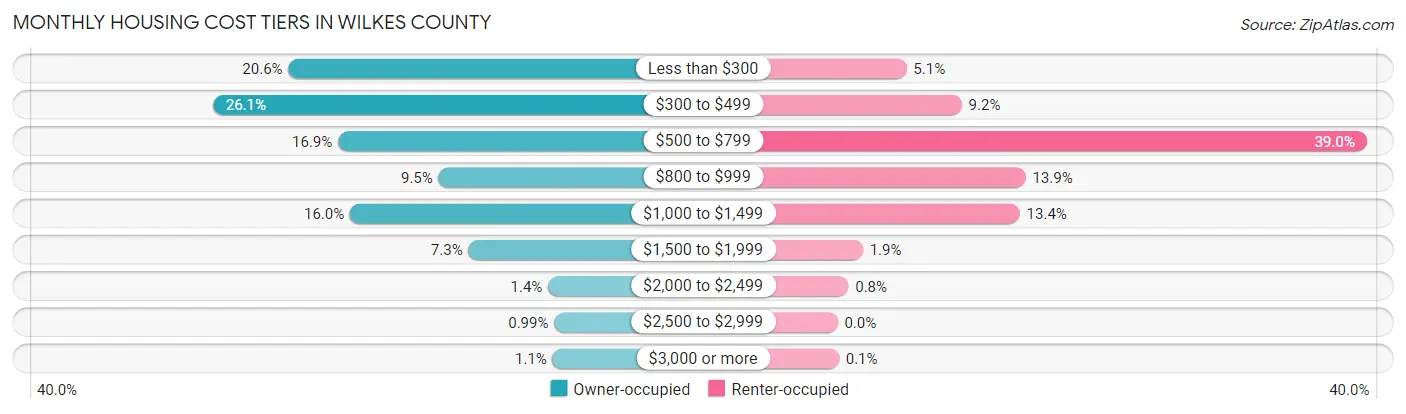
| Monthly Cost | Owner-occupied | Renter-occupied |
| Less than $300 | 4,091 (20.6%) | 374 (5.1%) |
| $300 to $499 | 5,199 (26.1%) | 673 (9.1%) |
| $500 to $799 | 3,363 (16.9%) | 2,868 (39.0%) |
| $800 to $999 | 1,892 (9.5%) | 1,019 (13.9%) |
| $1,000 to $1,499 | 3,189 (16.0%) | 987 (13.4%) |
| $1,500 to $1,999 | 1,455 (7.3%) | 137 (1.9%) |
| $2,000 to $2,499 | 286 (1.4%) | 59 (0.8%) |
| $2,500 to $2,999 | 196 (1.0%) | 0 (0.0%) |
| $3,000 or more | 221 (1.1%) | 7 (0.1%) |
| Total | 19,892 (100.0%) | 7,357 (100.0%) |
Physical Housing Characteristics in Wilkes County
Housing Structures in Wilkes County
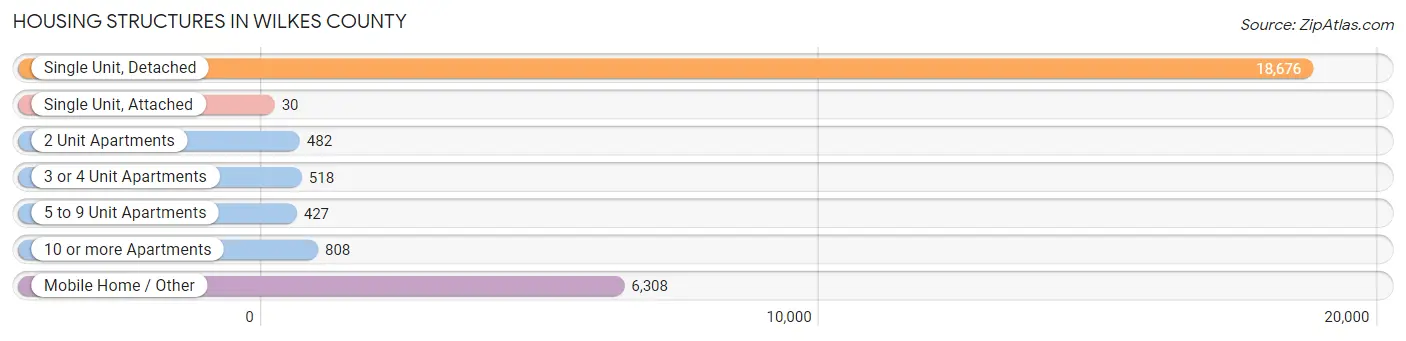
| Structure Type | # Housing Units | % Housing Units |
| Single Unit, Detached | 18,676 | 68.5% |
| Single Unit, Attached | 30 | 0.1% |
| 2 Unit Apartments | 482 | 1.8% |
| 3 or 4 Unit Apartments | 518 | 1.9% |
| 5 to 9 Unit Apartments | 427 | 1.6% |
| 10 or more Apartments | 808 | 3.0% |
| Mobile Home / Other | 6,308 | 23.2% |
| Total | 27,249 | 100.0% |
Housing Structures by Occupancy in Wilkes County
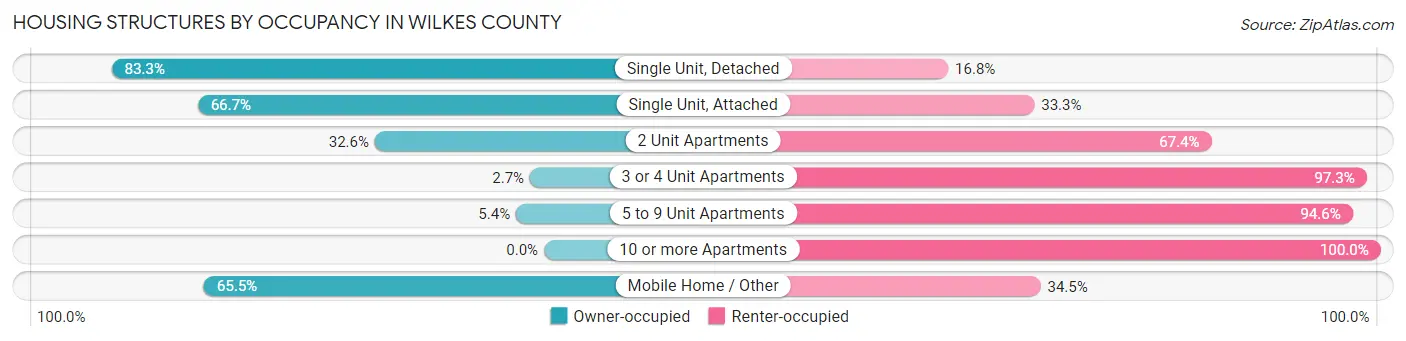
| Structure Type | Owner-occupied | Renter-occupied |
| Single Unit, Detached | 15,548 (83.3%) | 3,128 (16.8%) |
| Single Unit, Attached | 20 (66.7%) | 10 (33.3%) |
| 2 Unit Apartments | 157 (32.6%) | 325 (67.4%) |
| 3 or 4 Unit Apartments | 14 (2.7%) | 504 (97.3%) |
| 5 to 9 Unit Apartments | 23 (5.4%) | 404 (94.6%) |
| 10 or more Apartments | 0 (0.0%) | 808 (100.0%) |
| Mobile Home / Other | 4,130 (65.5%) | 2,178 (34.5%) |
| Total | 19,892 (73.0%) | 7,357 (27.0%) |
Housing Structures by Number of Rooms in Wilkes County
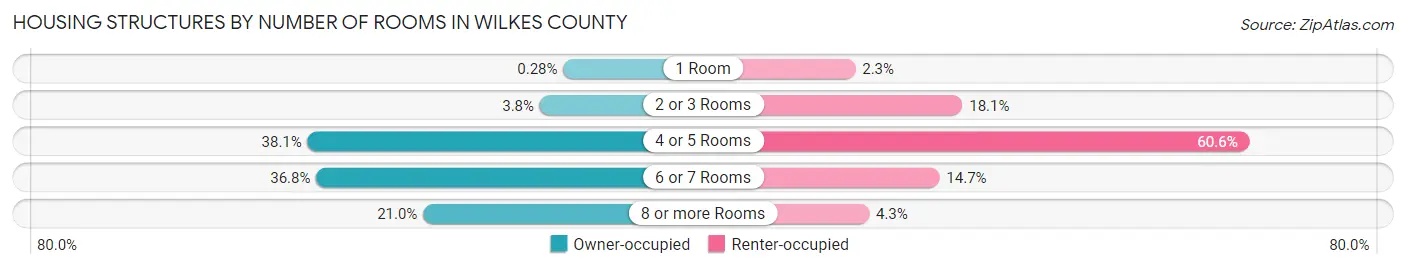
| Number of Rooms | Owner-occupied | Renter-occupied |
| 1 Room | 56 (0.3%) | 167 (2.3%) |
| 2 or 3 Rooms | 745 (3.7%) | 1,332 (18.1%) |
| 4 or 5 Rooms | 7,582 (38.1%) | 4,458 (60.6%) |
| 6 or 7 Rooms | 7,327 (36.8%) | 1,083 (14.7%) |
| 8 or more Rooms | 4,182 (21.0%) | 317 (4.3%) |
| Total | 19,892 (100.0%) | 7,357 (100.0%) |
Housing Structure by Heating Type in Wilkes County
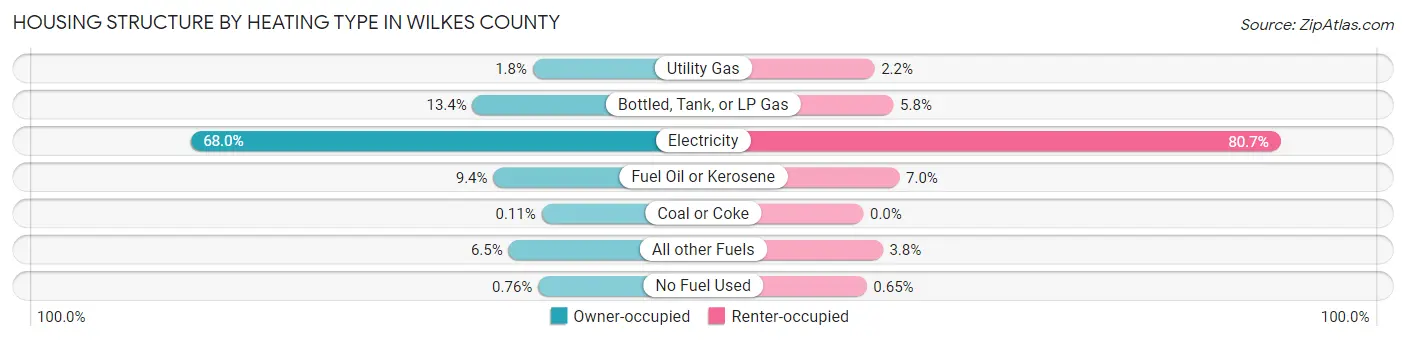
| Heating Type | Owner-occupied | Renter-occupied |
| Utility Gas | 359 (1.8%) | 159 (2.2%) |
| Bottled, Tank, or LP Gas | 2,673 (13.4%) | 428 (5.8%) |
| Electricity | 13,525 (68.0%) | 5,934 (80.7%) |
| Fuel Oil or Kerosene | 1,873 (9.4%) | 512 (7.0%) |
| Coal or Coke | 22 (0.1%) | 0 (0.0%) |
| All other Fuels | 1,289 (6.5%) | 276 (3.7%) |
| No Fuel Used | 151 (0.8%) | 48 (0.6%) |
| Total | 19,892 (100.0%) | 7,357 (100.0%) |
Household Vehicle Usage in Wilkes County
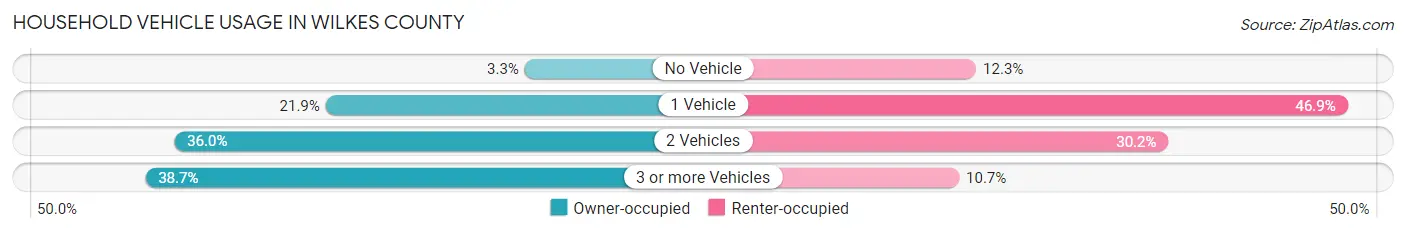
| Vehicles per Household | Owner-occupied | Renter-occupied |
| No Vehicle | 660 (3.3%) | 901 (12.2%) |
| 1 Vehicle | 4,357 (21.9%) | 3,452 (46.9%) |
| 2 Vehicles | 7,169 (36.0%) | 2,220 (30.2%) |
| 3 or more Vehicles | 7,706 (38.7%) | 784 (10.7%) |
| Total | 19,892 (100.0%) | 7,357 (100.0%) |
Real Estate & Mortgages in Wilkes County
Real Estate and Mortgage Overview in Wilkes County
| Characteristic | Without Mortgage | With Mortgage |
| Housing Units | 11,245 | 8,647 |
| Median Property Value | $125,600 | $174,800 |
| Median Household Income | $45,415 | $867 |
| Monthly Housing Costs | $349 | $221 |
| Real Estate Taxes | $889 | $170 |
Property Value by Mortgage Status in Wilkes County
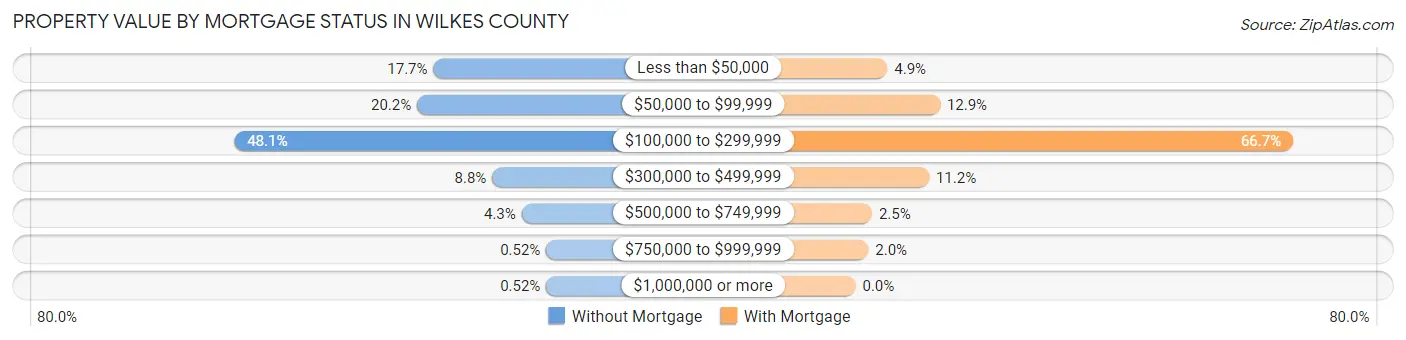
| Property Value | Without Mortgage | With Mortgage |
| Less than $50,000 | 1,991 (17.7%) | 419 (4.9%) |
| $50,000 to $99,999 | 2,271 (20.2%) | 1,112 (12.9%) |
| $100,000 to $299,999 | 5,403 (48.0%) | 5,763 (66.6%) |
| $300,000 to $499,999 | 984 (8.7%) | 968 (11.2%) |
| $500,000 to $749,999 | 479 (4.3%) | 216 (2.5%) |
| $750,000 to $999,999 | 59 (0.5%) | 169 (1.9%) |
| $1,000,000 or more | 58 (0.5%) | 0 (0.0%) |
| Total | 11,245 (100.0%) | 8,647 (100.0%) |
Household Income by Mortgage Status in Wilkes County
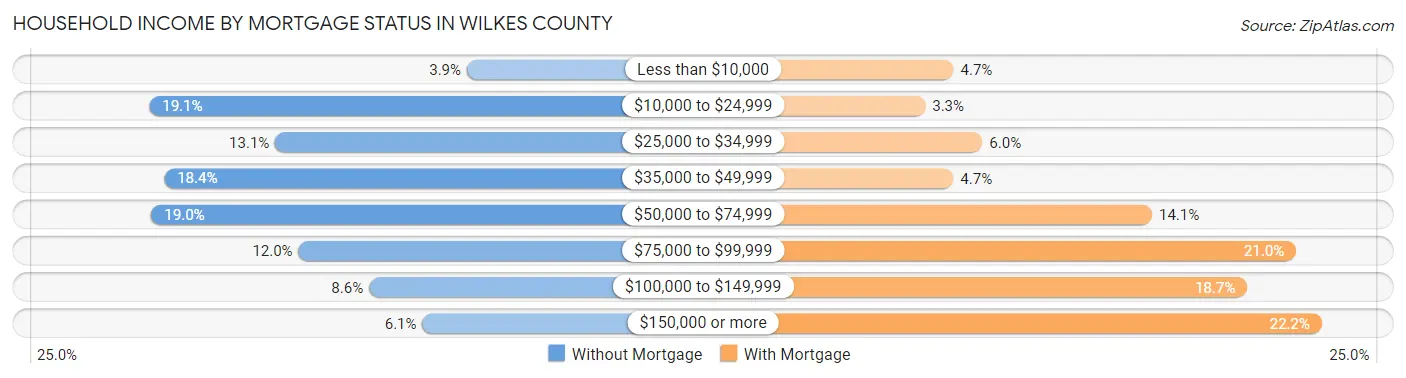
| Household Income | Without Mortgage | With Mortgage |
| Less than $10,000 | 443 (3.9%) | 404 (4.7%) |
| $10,000 to $24,999 | 2,143 (19.1%) | 287 (3.3%) |
| $25,000 to $34,999 | 1,470 (13.1%) | 522 (6.0%) |
| $35,000 to $49,999 | 2,063 (18.3%) | 403 (4.7%) |
| $50,000 to $74,999 | 2,132 (19.0%) | 1,221 (14.1%) |
| $75,000 to $99,999 | 1,345 (12.0%) | 1,814 (21.0%) |
| $100,000 to $149,999 | 967 (8.6%) | 1,613 (18.6%) |
| $150,000 or more | 682 (6.1%) | 1,920 (22.2%) |
| Total | 11,245 (100.0%) | 8,647 (100.0%) |
Property Value to Household Income Ratio in Wilkes County
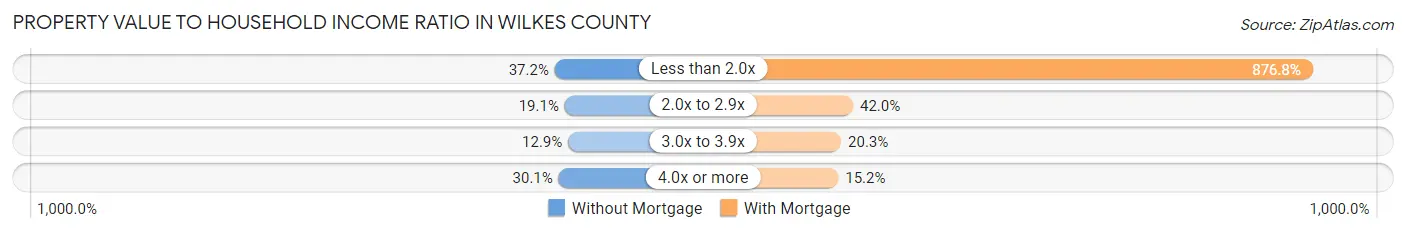
| Value-to-Income Ratio | Without Mortgage | With Mortgage |
| Less than 2.0x | 4,186 (37.2%) | 75,817 (876.8%) |
| 2.0x to 2.9x | 2,146 (19.1%) | 3,632 (42.0%) |
| 3.0x to 3.9x | 1,454 (12.9%) | 1,759 (20.3%) |
| 4.0x or more | 3,389 (30.1%) | 1,314 (15.2%) |
| Total | 11,245 (100.0%) | 8,647 (100.0%) |
Real Estate Taxes by Mortgage Status in Wilkes County
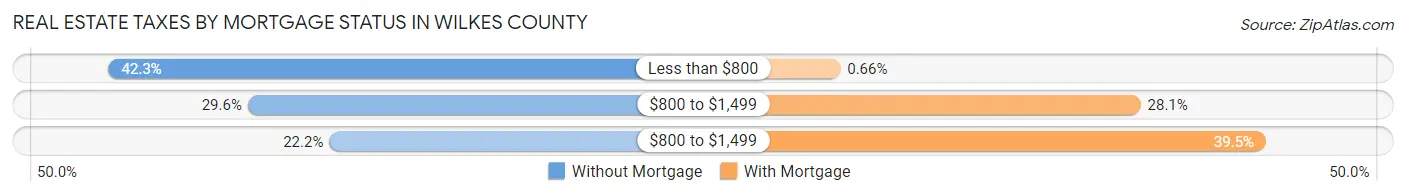
| Property Taxes | Without Mortgage | With Mortgage |
| Less than $800 | 4,761 (42.3%) | 57 (0.7%) |
| $800 to $1,499 | 3,331 (29.6%) | 2,429 (28.1%) |
| $800 to $1,499 | 2,494 (22.2%) | 3,418 (39.5%) |
| Total | 11,245 (100.0%) | 8,647 (100.0%) |
Health & Disability in Wilkes County
Health Insurance Coverage by Age in Wilkes County
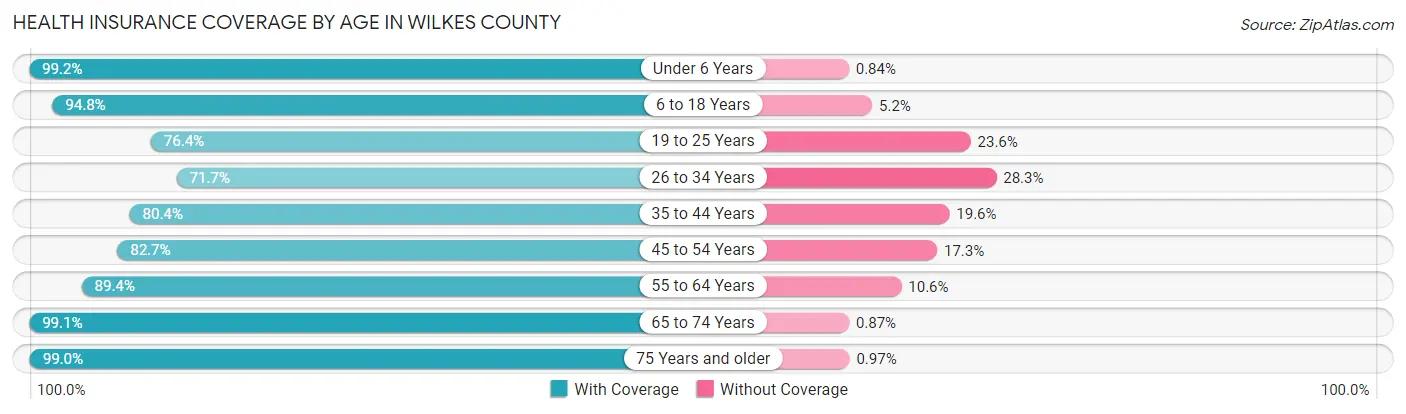
| Age Bracket | With Coverage | Without Coverage |
| Under 6 Years | 3,885 (99.2%) | 33 (0.8%) |
| 6 to 18 Years | 9,497 (94.8%) | 520 (5.2%) |
| 19 to 25 Years | 3,719 (76.4%) | 1,146 (23.6%) |
| 26 to 34 Years | 4,804 (71.7%) | 1,900 (28.3%) |
| 35 to 44 Years | 5,630 (80.4%) | 1,372 (19.6%) |
| 45 to 54 Years | 7,171 (82.7%) | 1,500 (17.3%) |
| 55 to 64 Years | 8,661 (89.4%) | 1,031 (10.6%) |
| 65 to 74 Years | 8,301 (99.1%) | 73 (0.9%) |
| 75 Years and older | 5,927 (99.0%) | 58 (1.0%) |
| Total | 57,595 (88.3%) | 7,633 (11.7%) |
Health Insurance Coverage by Citizenship Status in Wilkes County
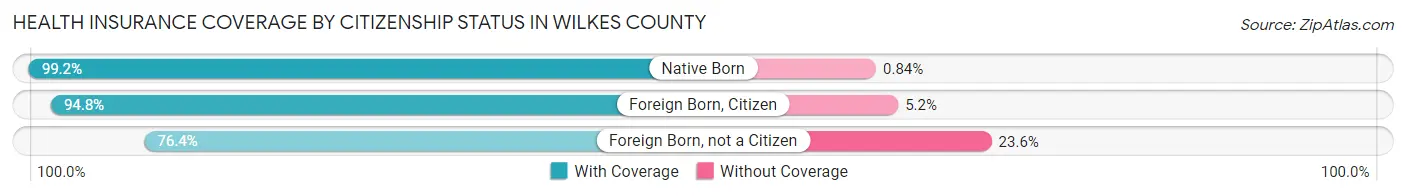
| Citizenship Status | With Coverage | Without Coverage |
| Native Born | 3,885 (99.2%) | 33 (0.8%) |
| Foreign Born, Citizen | 9,497 (94.8%) | 520 (5.2%) |
| Foreign Born, not a Citizen | 3,719 (76.4%) | 1,146 (23.6%) |
Health Insurance Coverage by Household Income in Wilkes County
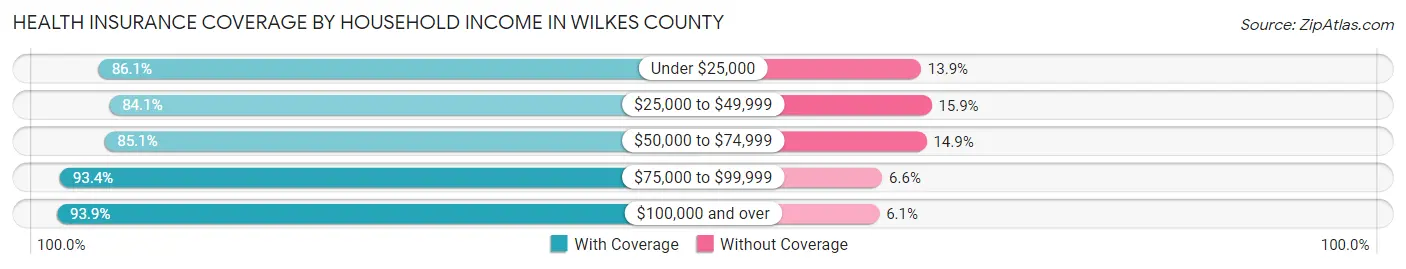
| Household Income | With Coverage | Without Coverage |
| Under $25,000 | 9,326 (86.1%) | 1,504 (13.9%) |
| $25,000 to $49,999 | 13,757 (84.1%) | 2,593 (15.9%) |
| $50,000 to $74,999 | 11,308 (85.1%) | 1,984 (14.9%) |
| $75,000 to $99,999 | 9,007 (93.4%) | 639 (6.6%) |
| $100,000 and over | 14,066 (93.9%) | 910 (6.1%) |
Public vs Private Health Insurance Coverage by Age in Wilkes County
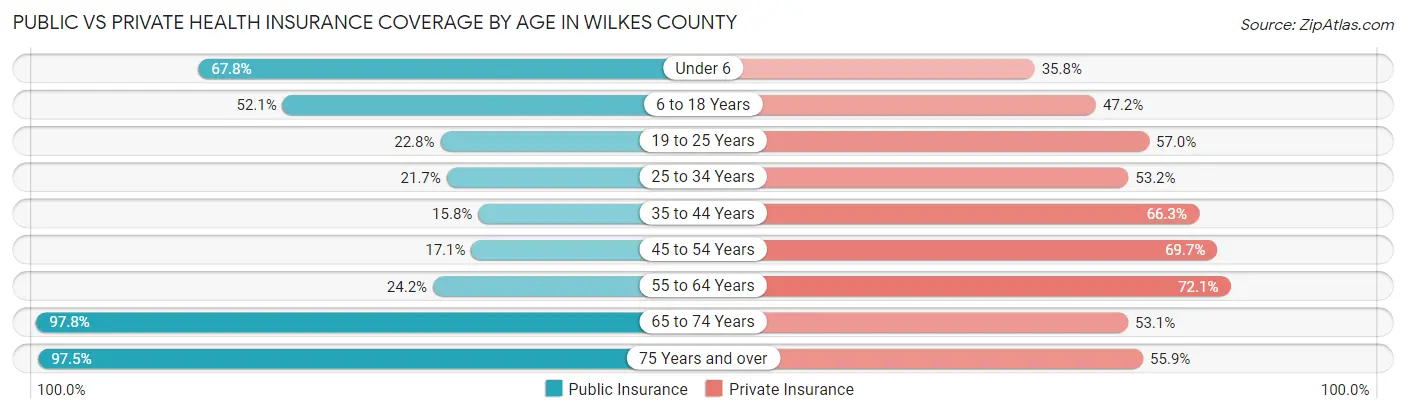
| Age Bracket | Public Insurance | Private Insurance |
| Under 6 | 2,655 (67.8%) | 1,403 (35.8%) |
| 6 to 18 Years | 5,221 (52.1%) | 4,727 (47.2%) |
| 19 to 25 Years | 1,111 (22.8%) | 2,775 (57.0%) |
| 25 to 34 Years | 1,453 (21.7%) | 3,566 (53.2%) |
| 35 to 44 Years | 1,107 (15.8%) | 4,639 (66.2%) |
| 45 to 54 Years | 1,482 (17.1%) | 6,042 (69.7%) |
| 55 to 64 Years | 2,346 (24.2%) | 6,987 (72.1%) |
| 65 to 74 Years | 8,190 (97.8%) | 4,449 (53.1%) |
| 75 Years and over | 5,833 (97.5%) | 3,348 (55.9%) |
| Total | 29,398 (45.1%) | 37,936 (58.2%) |
Disability Status by Sex by Age in Wilkes County
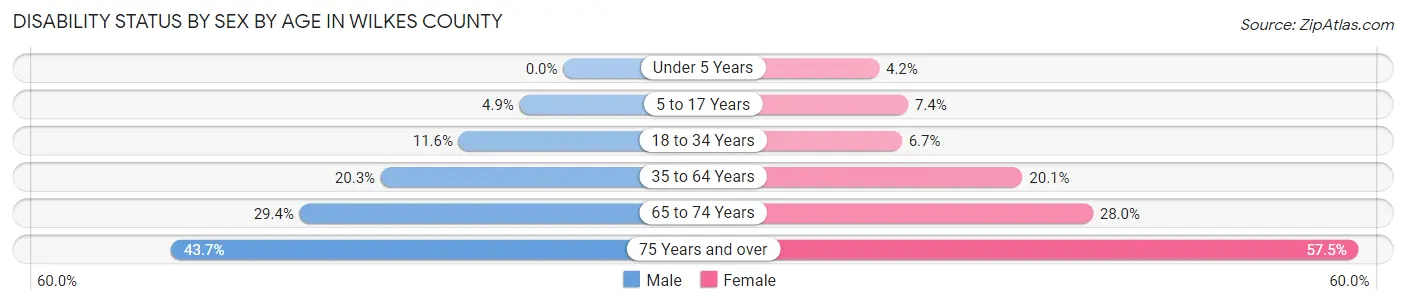
| Age Bracket | Male | Female |
| Under 5 Years | 0 (0.0%) | 66 (4.2%) |
| 5 to 17 Years | 248 (4.9%) | 358 (7.4%) |
| 18 to 34 Years | 723 (11.6%) | 406 (6.7%) |
| 35 to 64 Years | 2,623 (20.3%) | 2,505 (20.1%) |
| 65 to 74 Years | 1,155 (29.4%) | 1,241 (28.0%) |
| 75 Years and over | 1,126 (43.7%) | 1,961 (57.5%) |
Disability Class by Sex by Age in Wilkes County
Disability Class: Hearing Difficulty
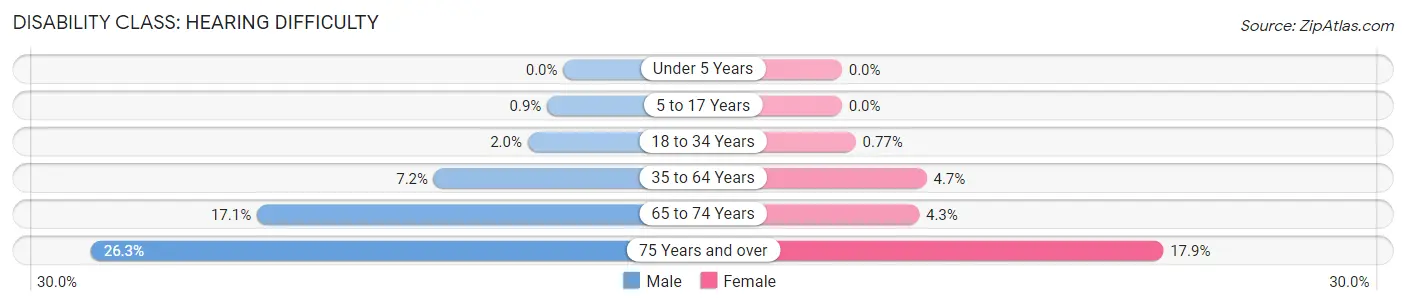
| Age Bracket | Male | Female |
| Under 5 Years | 0 (0.0%) | 0 (0.0%) |
| 5 to 17 Years | 46 (0.9%) | 0 (0.0%) |
| 18 to 34 Years | 123 (2.0%) | 47 (0.8%) |
| 35 to 64 Years | 931 (7.2%) | 588 (4.7%) |
| 65 to 74 Years | 671 (17.1%) | 191 (4.3%) |
| 75 Years and over | 678 (26.3%) | 610 (17.9%) |
Disability Class: Vision Difficulty
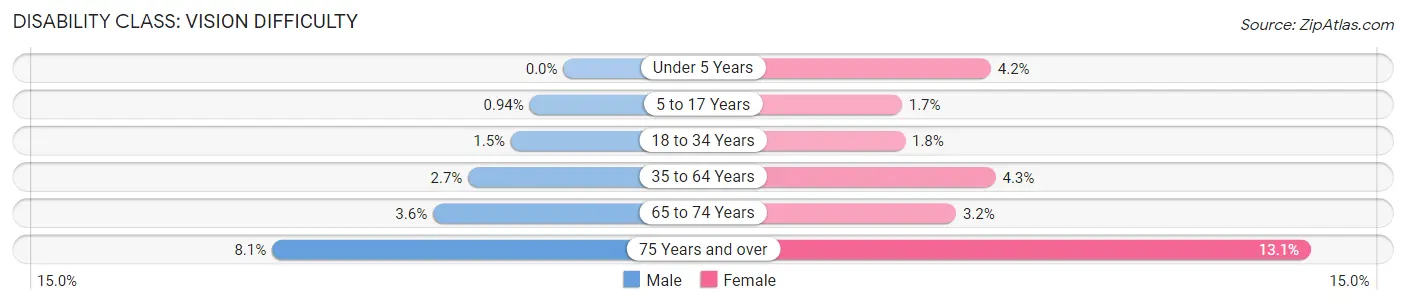
| Age Bracket | Male | Female |
| Under 5 Years | 0 (0.0%) | 66 (4.2%) |
| 5 to 17 Years | 48 (0.9%) | 81 (1.7%) |
| 18 to 34 Years | 91 (1.5%) | 107 (1.8%) |
| 35 to 64 Years | 342 (2.6%) | 533 (4.3%) |
| 65 to 74 Years | 143 (3.6%) | 141 (3.2%) |
| 75 Years and over | 209 (8.1%) | 445 (13.1%) |
Disability Class: Cognitive Difficulty
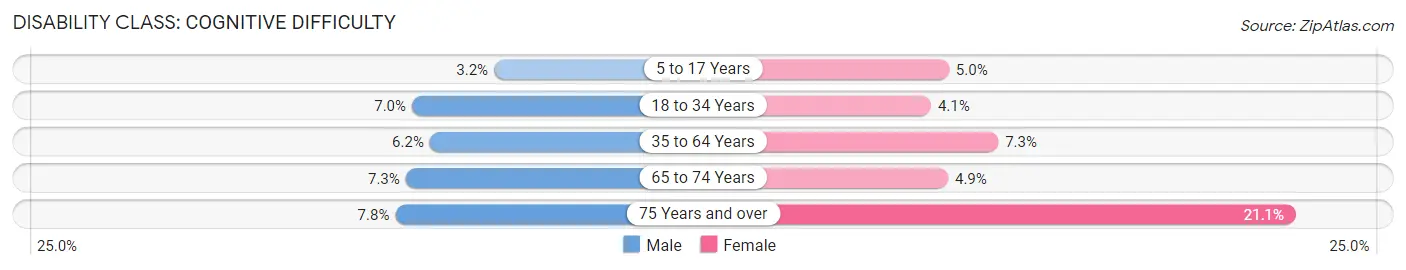
| Age Bracket | Male | Female |
| 5 to 17 Years | 164 (3.2%) | 241 (5.0%) |
| 18 to 34 Years | 437 (7.0%) | 252 (4.1%) |
| 35 to 64 Years | 800 (6.2%) | 904 (7.3%) |
| 65 to 74 Years | 288 (7.3%) | 219 (4.9%) |
| 75 Years and over | 201 (7.8%) | 718 (21.1%) |
Disability Class: Ambulatory Difficulty
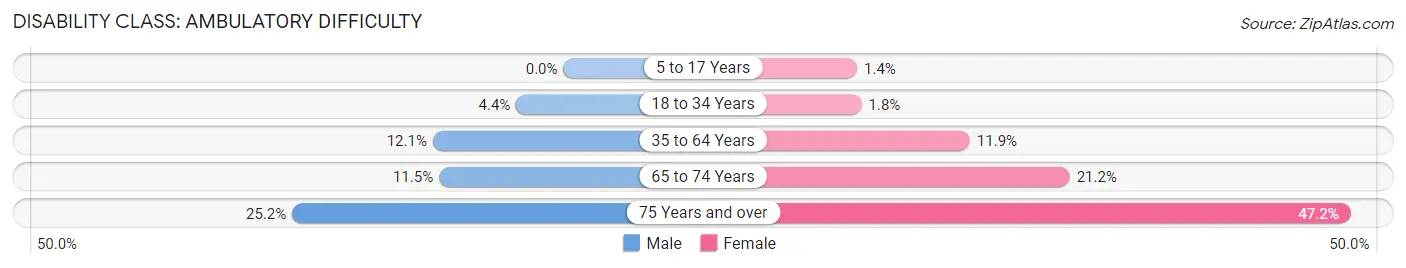
| Age Bracket | Male | Female |
| 5 to 17 Years | 0 (0.0%) | 69 (1.4%) |
| 18 to 34 Years | 272 (4.4%) | 112 (1.8%) |
| 35 to 64 Years | 1,564 (12.1%) | 1,481 (11.9%) |
| 65 to 74 Years | 454 (11.5%) | 939 (21.1%) |
| 75 Years and over | 649 (25.2%) | 1,609 (47.2%) |
Disability Class: Self-Care Difficulty
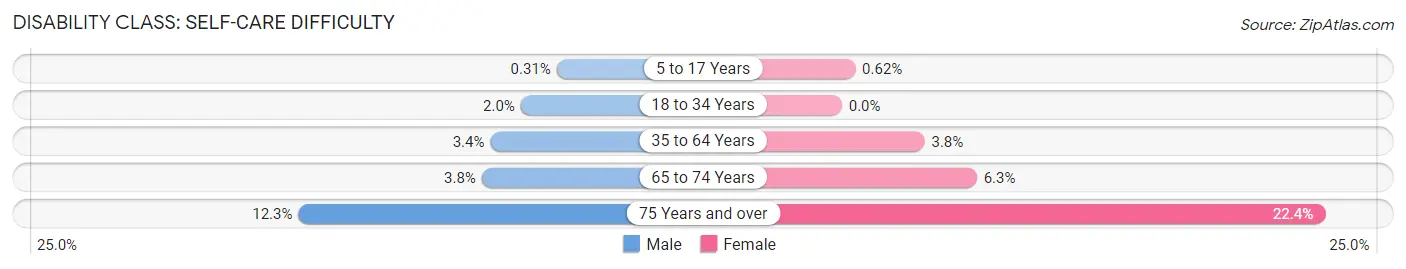
| Age Bracket | Male | Female |
| 5 to 17 Years | 16 (0.3%) | 30 (0.6%) |
| 18 to 34 Years | 123 (2.0%) | 0 (0.0%) |
| 35 to 64 Years | 437 (3.4%) | 478 (3.8%) |
| 65 to 74 Years | 149 (3.8%) | 278 (6.3%) |
| 75 Years and over | 317 (12.3%) | 764 (22.4%) |
Technology Access in Wilkes County
Computing Device Access in Wilkes County
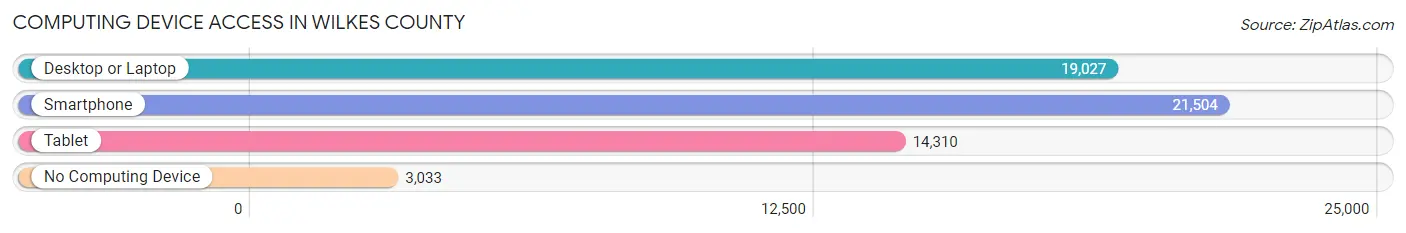
| Device Type | # Households | % Households |
| Desktop or Laptop | 19,027 | 69.8% |
| Smartphone | 21,504 | 78.9% |
| Tablet | 14,310 | 52.5% |
| No Computing Device | 3,033 | 11.1% |
| Total | 27,249 | 100.0% |
Internet Access in Wilkes County
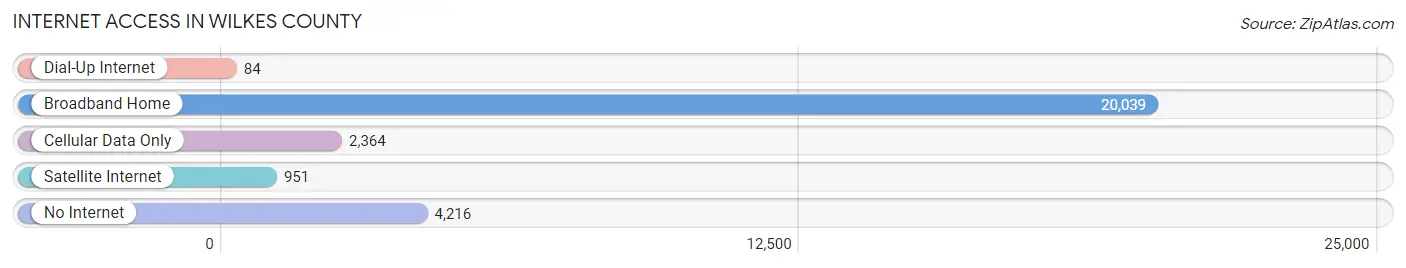
| Internet Type | # Households | % Households |
| Dial-Up Internet | 84 | 0.3% |
| Broadband Home | 20,039 | 73.5% |
| Cellular Data Only | 2,364 | 8.7% |
| Satellite Internet | 951 | 3.5% |
| No Internet | 4,216 | 15.5% |
| Total | 27,249 | 100.0% |
Wilkes County Summary
Wilkes County is located in the northwestern part of North Carolina, and is part of the Blue Ridge Mountains region. It is bordered by Alleghany County to the north, Caldwell County to the east, Alexander County to the south, and Ashe County to the west. Wilkes County is home to the cities of North Wilkesboro and Wilkesboro, as well as the towns of Ronda, Millers Creek, and Traphill. The county seat is Wilkesboro.
History
Wilkes County was formed in 1777 from parts of Surry and Washington Counties. It was named for John Wilkes, a British politician and journalist. The county was originally part of the Cherokee Nation, and the first European settlers arrived in the late 1700s. The county was home to several Revolutionary War battles, including the Battle of Wilkesboro in 1781.
In the early 1800s, Wilkes County was a major producer of tobacco, and the county seat of Wilkesboro became a major trading center. The county was also home to several gold mines, and the town of North Wilkesboro was founded in 1891.
In the late 1800s and early 1900s, Wilkes County was a major producer of textiles, and the county seat of Wilkesboro became a major manufacturing center. The county was also home to several furniture factories, and the town of North Wilkesboro became a major furniture manufacturing center.
Geography
Wilkes County is located in the northwestern part of North Carolina, and is part of the Blue Ridge Mountains region. The county is bordered by Alleghany County to the north, Caldwell County to the east, Alexander County to the south, and Ashe County to the west. The county covers an area of 545 square miles, and is home to the cities of North Wilkesboro and Wilkesboro, as well as the towns of Ronda, Millers Creek, and Traphill.
The terrain of Wilkes County is mostly mountainous, with the Blue Ridge Mountains to the west and the Brushy Mountains to the east. The county is home to several rivers, including the Yadkin River, the Catawba River, and the New River. The county is also home to several lakes, including W. Kerr Scott Lake, Stone Mountain State Park, and the Wilkes County Reservoir.
Economy
The economy of Wilkes County is largely based on agriculture, manufacturing, and tourism. The county is home to several large farms, and the major crops grown in the county include corn, soybeans, tobacco, and hay. The county is also home to several manufacturing companies, including furniture, textiles, and electronics.
The county is also home to several tourist attractions, including Stone Mountain State Park, the Wilkes County Reservoir, and the Yadkin Valley Wine Trail. The county is also home to several wineries, and the Yadkin Valley Wine Trail is a popular destination for wine enthusiasts.
Demographics
As of the 2010 census, Wilkes County had a population of 69,340. The racial makeup of the county was 87.3% White, 9.2% Black or African American, 0.7% Native American, 0.4% Asian, 0.1% Pacific Islander, 1.2% from other races, and 1.1% from two or more races. Hispanic or Latino of any race were 2.7% of the population.
The median income for a household in Wilkes County was $37,845, and the median income for a family was $45,945. The per capita income for the county was $20,845. About 15.2% of the population was below the poverty line.
Common Questions
What is the Total Population of Wilkes County?
Total Population of Wilkes County is 66,125.
What is the Total Male Population of Wilkes County?
Total Male Population of Wilkes County is 32,914.
What is the Total Female Population of Wilkes County?
Total Female Population of Wilkes County is 33,211.
What is the Ratio of Males per 100 Females in Wilkes County?
There are 99.11 Males per 100 Females in Wilkes County.
What is the Ratio of Females per 100 Males in Wilkes County?
There are 100.90 Females per 100 Males in Wilkes County.
What is the Median Population Age in Wilkes County?
Median Population Age in Wilkes County is 45.3 Years.
What is the Average Family Size in Wilkes County
Average Family Size in Wilkes County is 2.9 People.
What is the Average Household Size in Wilkes County
Average Household Size in Wilkes County is 2.4 People.
What is Per Capita Income in Wilkes County?
Per Capita income in Wilkes County is $27,592.
What is the Median Family Income in Wilkes County?
Median Family Income in Wilkes County is $60,492.
What is the Median Household income in Wilkes County?
Median Household Income in Wilkes County is $49,119.
What is Income or Wage Gap in Wilkes County?
Income or Wage Gap in Wilkes County is 21.5%.
Women in Wilkes County earn 78.5 cents for every dollar earned by a man.
What is Family Income Deficit in Wilkes County?
Family Income Deficit in Wilkes County is $12,712.
Families that are below poverty line in Wilkes County earn $12,712 less on average than the poverty threshold level.
What is Inequality or Gini Index in Wilkes County?
Inequality or Gini Index in Wilkes County is 0.44.
How Large is the Labor Force in Wilkes County?
There are 30,454 People in the Labor Forcein in Wilkes County.
What is the Percentage of People in the Labor Force in Wilkes County?
56.0% of People are in the Labor Force in Wilkes County.
What is the Unemployment Rate in Wilkes County?
Unemployment Rate in Wilkes County is 6.0%.