Wayne County, NC
Wayne County Map
Wayne County Overview
117,480
TOTAL POPULATION
58,498
MALE POPULATION
58,982
FEMALE POPULATION
99.18
MALES / 100 FEMALES
100.83
FEMALES / 100 MALES
37.5
MEDIAN AGE
3.0
AVG FAMILY SIZE
2.4
AVG HOUSEHOLD SIZE
$30,540
PER CAPITA INCOME
$67,681
AVG FAMILY INCOME
$54,323
AVG HOUSEHOLD INCOME
30.2%
WAGE / INCOME GAP [ % ]
69.8¢/ $1
WAGE / INCOME GAP [ $ ]
$10,955
FAMILY INCOME DEFICIT
0.47
INEQUALITY / GINI INDEX
56,643
LABOR FORCE [ PEOPLE ]
60.9%
PERCENT IN LABOR FORCE
5.0%
UNEMPLOYMENT RATE
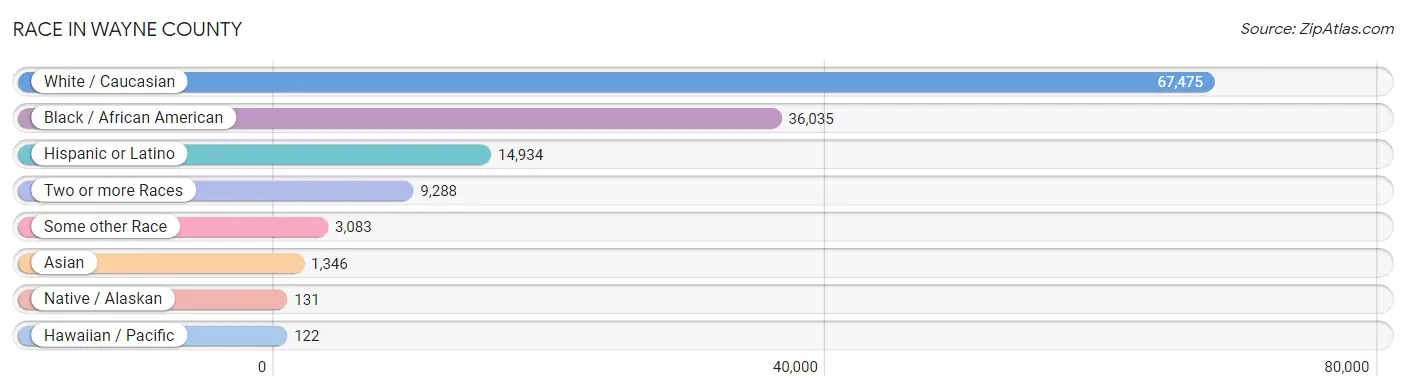
Race in Wayne County
The most populous races in Wayne County are White / Caucasian (67,475 | 57.4%), Black / African American (36,035 | 30.7%), and Hispanic or Latino (14,934 | 12.7%).
| Race | # Population | % Population |
| Asian | 1,346 | 1.1% |
| Black / African American | 36,035 | 30.7% |
| Hawaiian / Pacific | 122 | 0.1% |
| Hispanic or Latino | 14,934 | 12.7% |
| Native / Alaskan | 131 | 0.1% |
| White / Caucasian | 67,475 | 57.4% |
| Two or more Races | 9,288 | 7.9% |
| Some other Race | 3,083 | 2.6% |
| Total | 117,480 | 100.0% |
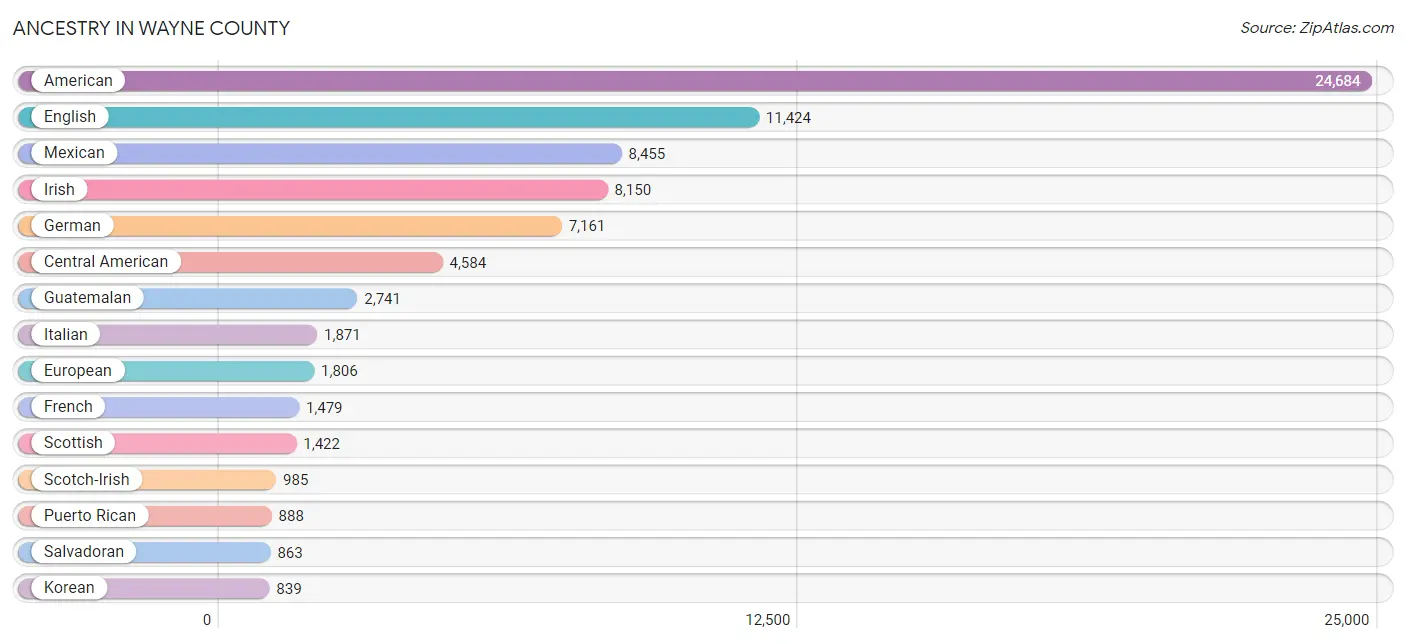
Ancestry in Wayne County
The most populous ancestries reported in Wayne County are American (24,684 | 21.0%), English (11,424 | 9.7%), Mexican (8,455 | 7.2%), Irish (8,150 | 6.9%), and German (7,161 | 6.1%), together accounting for 51.0% of all Wayne County residents.
| Ancestry | # Population | % Population |
| African | 379 | 0.3% |
| Albanian | 11 | 0.0% |
| American | 24,684 | 21.0% |
| Arab | 485 | 0.4% |
| Armenian | 16 | 0.0% |
| Australian | 15 | 0.0% |
| Austrian | 24 | 0.0% |
| Bangladeshi | 41 | 0.0% |
| Belgian | 51 | 0.0% |
| Bhutanese | 158 | 0.1% |
| Blackfeet | 21 | 0.0% |
| Brazilian | 47 | 0.0% |
| British | 669 | 0.6% |
| Burmese | 379 | 0.3% |
| Cajun | 2 | 0.0% |
| Cambodian | 24 | 0.0% |
| Canadian | 72 | 0.1% |
| Cape Verdean | 22 | 0.0% |
| Celtic | 9 | 0.0% |
| Central American | 4,584 | 3.9% |
| Central American Indian | 60 | 0.1% |
| Cherokee | 457 | 0.4% |
| Chilean | 1 | 0.0% |
| Chippewa | 11 | 0.0% |
| Choctaw | 4 | 0.0% |
| Colombian | 293 | 0.3% |
| Costa Rican | 21 | 0.0% |
| Croatian | 4 | 0.0% |
| Cuban | 103 | 0.1% |
| Czech | 33 | 0.0% |
| Danish | 42 | 0.0% |
| Dominican | 87 | 0.1% |
| Dutch | 581 | 0.5% |
| Dutch West Indian | 1 | 0.0% |
| Eastern European | 130 | 0.1% |
| Ecuadorian | 47 | 0.0% |
| Egyptian | 27 | 0.0% |
| English | 11,424 | 9.7% |
| European | 1,806 | 1.5% |
| Filipino | 6 | 0.0% |
| French | 1,479 | 1.3% |
| French Canadian | 303 | 0.3% |
| German | 7,161 | 6.1% |
| Ghanaian | 57 | 0.1% |
| Greek | 170 | 0.1% |
| Guamanian / Chamorro | 79 | 0.1% |
| Guatemalan | 2,741 | 2.3% |
| Haitian | 576 | 0.5% |
| Honduran | 808 | 0.7% |
| Hungarian | 84 | 0.1% |
| Indian (Asian) | 291 | 0.3% |
| Inupiat | 9 | 0.0% |
| Irish | 8,150 | 6.9% |
| Iroquois | 7 | 0.0% |
| Italian | 1,871 | 1.6% |
| Jamaican | 224 | 0.2% |
| Japanese | 9 | 0.0% |
| Jordanian | 8 | 0.0% |
| Kenyan | 98 | 0.1% |
| Korean | 839 | 0.7% |
| Laotian | 30 | 0.0% |
| Lebanese | 134 | 0.1% |
| Lithuanian | 11 | 0.0% |
| Lumbee | 69 | 0.1% |
| Malaysian | 14 | 0.0% |
| Mexican | 8,455 | 7.2% |
| Mexican American Indian | 14 | 0.0% |
| Moroccan | 3 | 0.0% |
| Native Hawaiian | 67 | 0.1% |
| Nicaraguan | 151 | 0.1% |
| Nigerian | 24 | 0.0% |
| Northern European | 52 | 0.0% |
| Norwegian | 208 | 0.2% |
| Osage | 34 | 0.0% |
| Pakistani | 215 | 0.2% |
| Palestinian | 13 | 0.0% |
| Pennsylvania German | 12 | 0.0% |
| Peruvian | 11 | 0.0% |
| Polish | 363 | 0.3% |
| Portuguese | 184 | 0.2% |
| Puerto Rican | 888 | 0.8% |
| Romanian | 12 | 0.0% |
| Russian | 94 | 0.1% |
| Salvadoran | 863 | 0.7% |
| Samoan | 52 | 0.0% |
| Scandinavian | 157 | 0.1% |
| Scotch-Irish | 985 | 0.8% |
| Scottish | 1,422 | 1.2% |
| Sioux | 17 | 0.0% |
| Slavic | 12 | 0.0% |
| Slovak | 65 | 0.1% |
| Slovene | 17 | 0.0% |
| South African | 29 | 0.0% |
| South American | 419 | 0.4% |
| South American Indian | 32 | 0.0% |
| Spaniard | 80 | 0.1% |
| Spanish | 109 | 0.1% |
| Sri Lankan | 51 | 0.0% |
| Subsaharan African | 613 | 0.5% |
| Sudanese | 5 | 0.0% |
| Swedish | 378 | 0.3% |
| Swiss | 41 | 0.0% |
| Syrian | 2 | 0.0% |
| Thai | 473 | 0.4% |
| Tongan | 15 | 0.0% |
| Trinidadian and Tobagonian | 1 | 0.0% |
| Turkish | 12 | 0.0% |
| Ugandan | 10 | 0.0% |
| Ukrainian | 155 | 0.1% |
| Uruguayan | 9 | 0.0% |
| Venezuelan | 58 | 0.1% |
| Welsh | 376 | 0.3% |
| West Indian | 80 | 0.1% |
| Yugoslavian | 15 | 0.0% | View All 114 Rows |
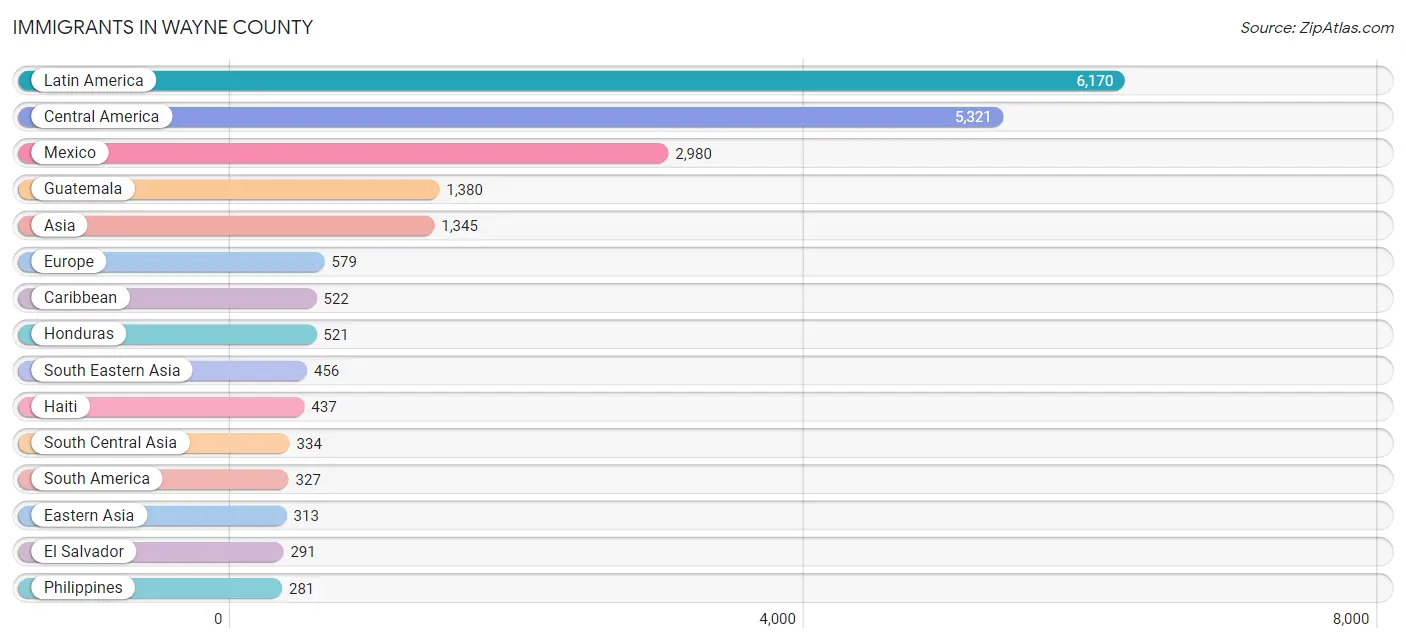
Immigrants in Wayne County
The most numerous immigrant groups reported in Wayne County came from Latin America (6,170 | 5.2%), Central America (5,321 | 4.5%), Mexico (2,980 | 2.5%), Guatemala (1,380 | 1.2%), and Asia (1,345 | 1.1%), together accounting for 14.6% of all Wayne County residents.
| Immigration Origin | # Population | % Population |
| Africa | 184 | 0.2% |
| Argentina | 33 | 0.0% |
| Asia | 1,345 | 1.1% |
| Bangladesh | 15 | 0.0% |
| Belgium | 21 | 0.0% |
| Bosnia and Herzegovina | 15 | 0.0% |
| Brazil | 44 | 0.0% |
| Canada | 38 | 0.0% |
| Caribbean | 522 | 0.4% |
| Central America | 5,321 | 4.5% |
| China | 104 | 0.1% |
| Colombia | 185 | 0.2% |
| Costa Rica | 21 | 0.0% |
| Cuba | 11 | 0.0% |
| Dominican Republic | 10 | 0.0% |
| Eastern Africa | 68 | 0.1% |
| Eastern Asia | 313 | 0.3% |
| Eastern Europe | 150 | 0.1% |
| Ecuador | 34 | 0.0% |
| Egypt | 15 | 0.0% |
| El Salvador | 291 | 0.3% |
| England | 26 | 0.0% |
| Europe | 579 | 0.5% |
| France | 23 | 0.0% |
| Germany | 145 | 0.1% |
| Ghana | 77 | 0.1% |
| Guatemala | 1,380 | 1.2% |
| Haiti | 437 | 0.4% |
| Honduras | 521 | 0.4% |
| Hong Kong | 40 | 0.0% |
| India | 279 | 0.2% |
| Indonesia | 83 | 0.1% |
| Italy | 12 | 0.0% |
| Jamaica | 48 | 0.0% |
| Japan | 59 | 0.1% |
| Jordan | 8 | 0.0% |
| Kazakhstan | 2 | 0.0% |
| Kenya | 58 | 0.1% |
| Korea | 150 | 0.1% |
| Laos | 9 | 0.0% |
| Latin America | 6,170 | 5.2% |
| Latvia | 38 | 0.0% |
| Mexico | 2,980 | 2.5% |
| Netherlands | 11 | 0.0% |
| Nicaragua | 128 | 0.1% |
| Northern Africa | 15 | 0.0% |
| Northern Europe | 122 | 0.1% |
| Oceania | 33 | 0.0% |
| Philippines | 281 | 0.2% |
| Romania | 3 | 0.0% |
| Russia | 94 | 0.1% |
| Scotland | 5 | 0.0% |
| South Africa | 24 | 0.0% |
| South America | 327 | 0.3% |
| South Central Asia | 334 | 0.3% |
| South Eastern Asia | 456 | 0.4% |
| Southern Europe | 83 | 0.1% |
| Spain | 71 | 0.1% |
| Sweden | 10 | 0.0% |
| Taiwan | 7 | 0.0% |
| Thailand | 54 | 0.1% |
| Trinidad and Tobago | 16 | 0.0% |
| Turkey | 12 | 0.0% |
| Uganda | 10 | 0.0% |
| Uruguay | 9 | 0.0% |
| Venezuela | 22 | 0.0% |
| Vietnam | 18 | 0.0% |
| Western Africa | 77 | 0.1% |
| Western Asia | 214 | 0.2% |
| Western Europe | 200 | 0.2% |
| Yemen | 194 | 0.2% | View All 71 Rows |
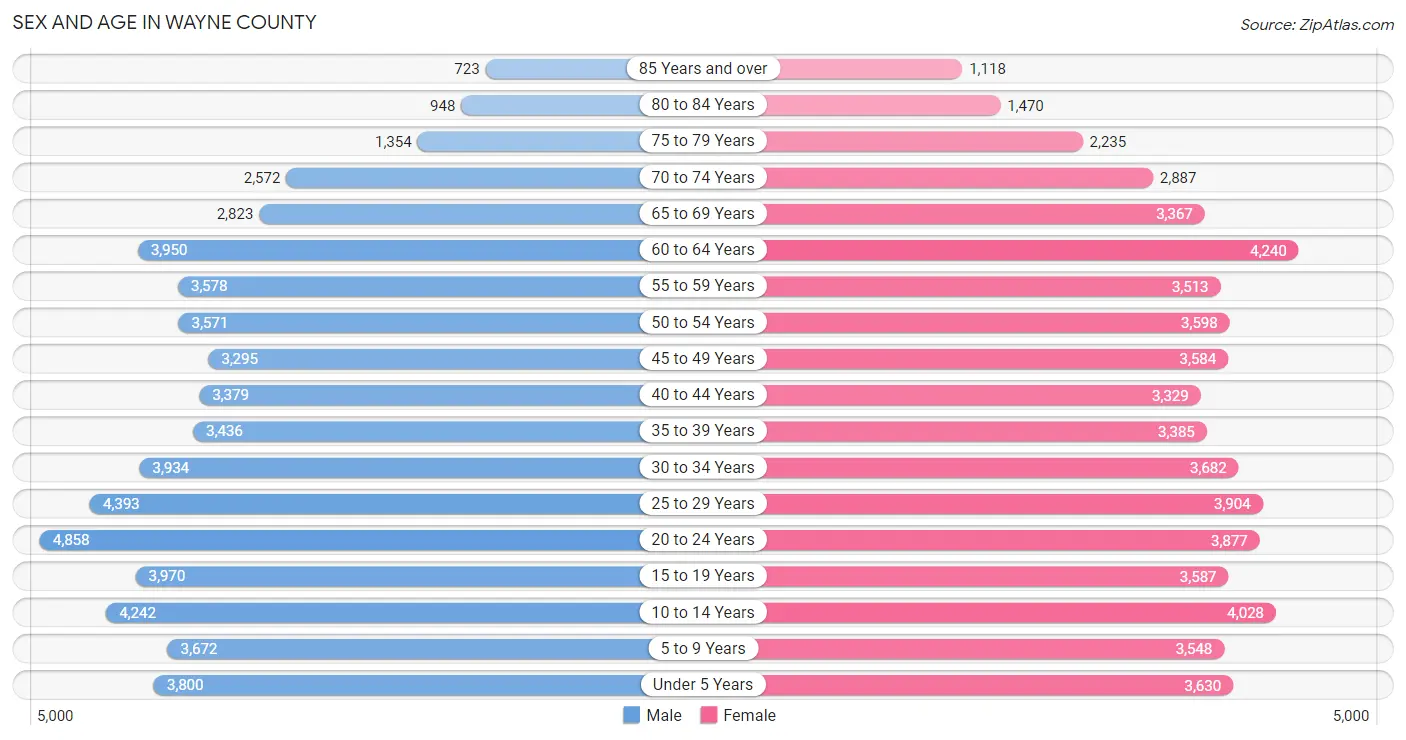
Sex and Age in Wayne County
Sex and Age in Wayne County
The most populous age groups in Wayne County are 20 to 24 Years (4,858 | 8.3%) for men and 60 to 64 Years (4,240 | 7.2%) for women.
| Age Bracket | Male | Female |
| Under 5 Years | 3,800 (6.5%) | 3,630 (6.1%) |
| 5 to 9 Years | 3,672 (6.3%) | 3,548 (6.0%) |
| 10 to 14 Years | 4,242 (7.2%) | 4,028 (6.8%) |
| 15 to 19 Years | 3,970 (6.8%) | 3,587 (6.1%) |
| 20 to 24 Years | 4,858 (8.3%) | 3,877 (6.6%) |
| 25 to 29 Years | 4,393 (7.5%) | 3,904 (6.6%) |
| 30 to 34 Years | 3,934 (6.7%) | 3,682 (6.2%) |
| 35 to 39 Years | 3,436 (5.9%) | 3,385 (5.7%) |
| 40 to 44 Years | 3,379 (5.8%) | 3,329 (5.6%) |
| 45 to 49 Years | 3,295 (5.6%) | 3,584 (6.1%) |
| 50 to 54 Years | 3,571 (6.1%) | 3,598 (6.1%) |
| 55 to 59 Years | 3,578 (6.1%) | 3,513 (6.0%) |
| 60 to 64 Years | 3,950 (6.8%) | 4,240 (7.2%) |
| 65 to 69 Years | 2,823 (4.8%) | 3,367 (5.7%) |
| 70 to 74 Years | 2,572 (4.4%) | 2,887 (4.9%) |
| 75 to 79 Years | 1,354 (2.3%) | 2,235 (3.8%) |
| 80 to 84 Years | 948 (1.6%) | 1,470 (2.5%) |
| 85 Years and over | 723 (1.2%) | 1,118 (1.9%) |
| Total | 58,498 (100.0%) | 58,982 (100.0%) |
Families and Households in Wayne County
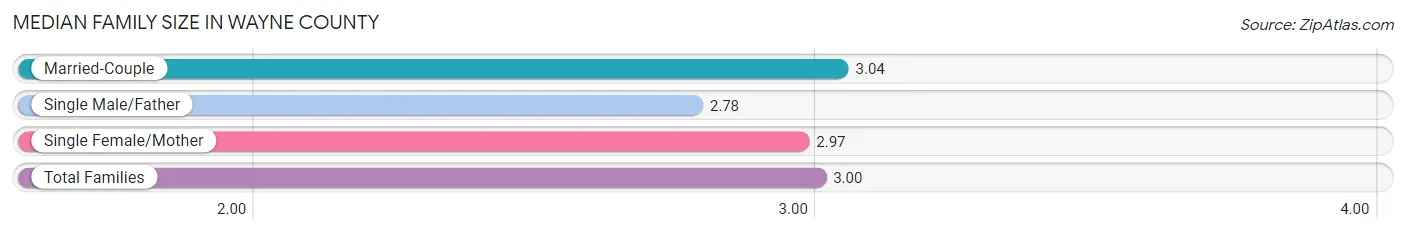
Median Family Size in Wayne County
The median family size in Wayne County is 3.00 persons per family, with married-couple families (20,762 | 67.1%) accounting for the largest median family size of 3.04 persons per family. On the other hand, single male/father families (2,534 | 8.2%) represent the smallest median family size with 2.78 persons per family.
| Family Type | # Families | Family Size |
| Married-Couple | 20,762 (67.1%) | 3.04 |
| Single Male/Father | 2,534 (8.2%) | 2.78 |
| Single Female/Mother | 7,637 (24.7%) | 2.97 |
| Total Families | 30,933 (100.0%) | 3.00 |
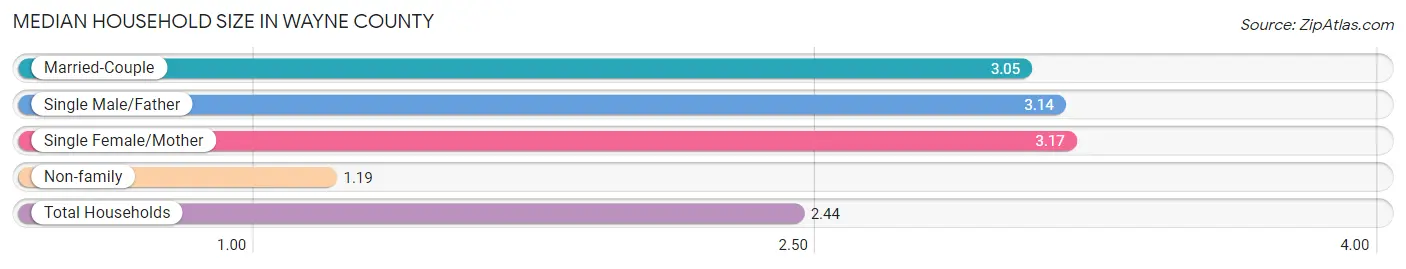
Median Household Size in Wayne County
The median household size in Wayne County is 2.44 persons per household, with single female/mother households (7,637 | 16.3%) accounting for the largest median household size of 3.17 persons per household. non-family households (16,016 | 34.1%) represent the smallest median household size with 1.19 persons per household.
| Household Type | # Households | Household Size |
| Married-Couple | 20,762 (44.2%) | 3.05 |
| Single Male/Father | 2,534 (5.4%) | 3.14 |
| Single Female/Mother | 7,637 (16.3%) | 3.17 |
| Non-family | 16,016 (34.1%) | 1.19 |
| Total Households | 46,949 (100.0%) | 2.44 |
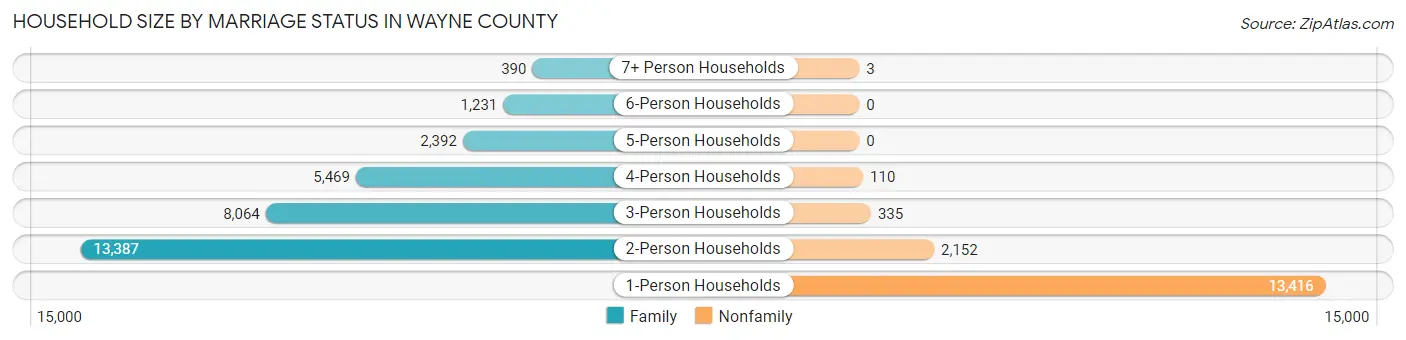
Household Size by Marriage Status in Wayne County
Out of a total of 46,949 households in Wayne County, 30,933 (65.9%) are family households, while 16,016 (34.1%) are nonfamily households. The most numerous type of family households are 2-person households, comprising 13,387, and the most common type of nonfamily households are 1-person households, comprising 13,416.
| Household Size | Family Households | Nonfamily Households |
| 1-Person Households | - | 13,416 (28.6%) |
| 2-Person Households | 13,387 (28.5%) | 2,152 (4.6%) |
| 3-Person Households | 8,064 (17.2%) | 335 (0.7%) |
| 4-Person Households | 5,469 (11.7%) | 110 (0.2%) |
| 5-Person Households | 2,392 (5.1%) | 0 (0.0%) |
| 6-Person Households | 1,231 (2.6%) | 0 (0.0%) |
| 7+ Person Households | 390 (0.8%) | 3 (0.0%) |
| Total | 30,933 (65.9%) | 16,016 (34.1%) |
Female Fertility in Wayne County
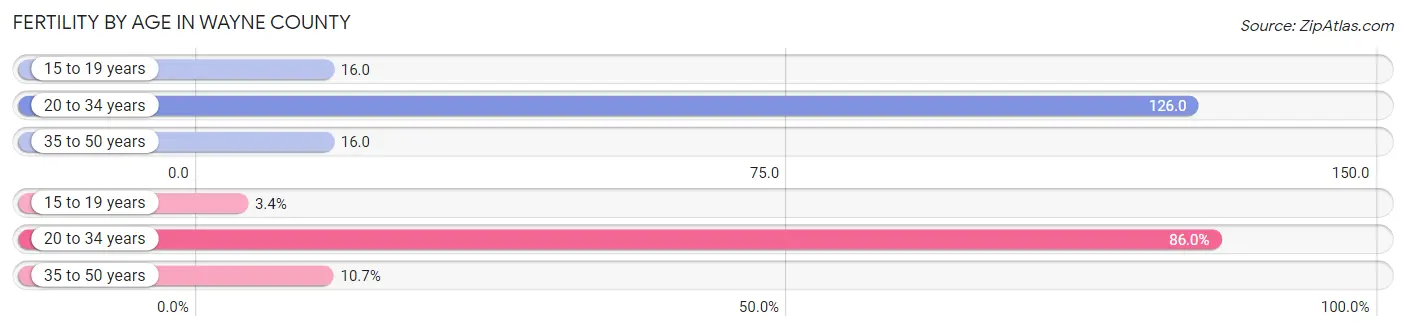
Fertility by Age in Wayne County
Average fertility rate in Wayne County is 64.0 births per 1,000 women. Women in the age bracket of 20 to 34 years have the highest fertility rate with 126.0 births per 1,000 women. Women in the age bracket of 20 to 34 years acount for 86.0% of all women with births.
| Age Bracket | Women with Births | Births / 1,000 Women |
| 15 to 19 years | 57 (3.4%) | 16.0 |
| 20 to 34 years | 1,445 (86.0%) | 126.0 |
| 35 to 50 years | 179 (10.6%) | 16.0 |
| Total | 1,681 (100.0%) | 64.0 |
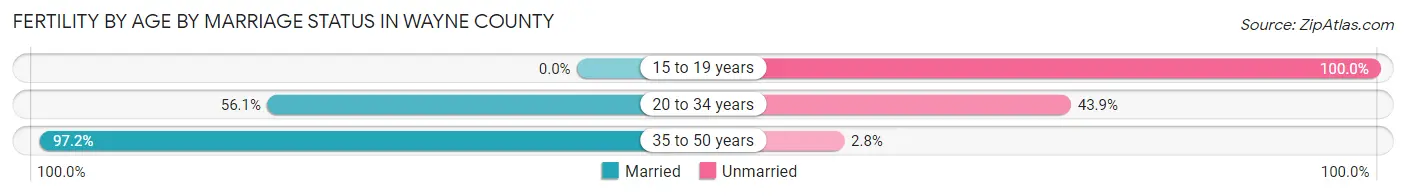
Fertility by Age by Marriage Status in Wayne County
58.6% of women with births (1,681) in Wayne County are married. The highest percentage of unmarried women with births falls into 15 to 19 years age bracket with 100.0% of them unmarried at the time of birth, while the lowest percentage of unmarried women with births belong to 35 to 50 years age bracket with 2.8% of them unmarried.
| Age Bracket | Married | Unmarried |
| 15 to 19 years | 0 (0.0%) | 57 (100.0%) |
| 20 to 34 years | 811 (56.1%) | 634 (43.9%) |
| 35 to 50 years | 174 (97.2%) | 5 (2.8%) |
| Total | 985 (58.6%) | 696 (41.4%) |
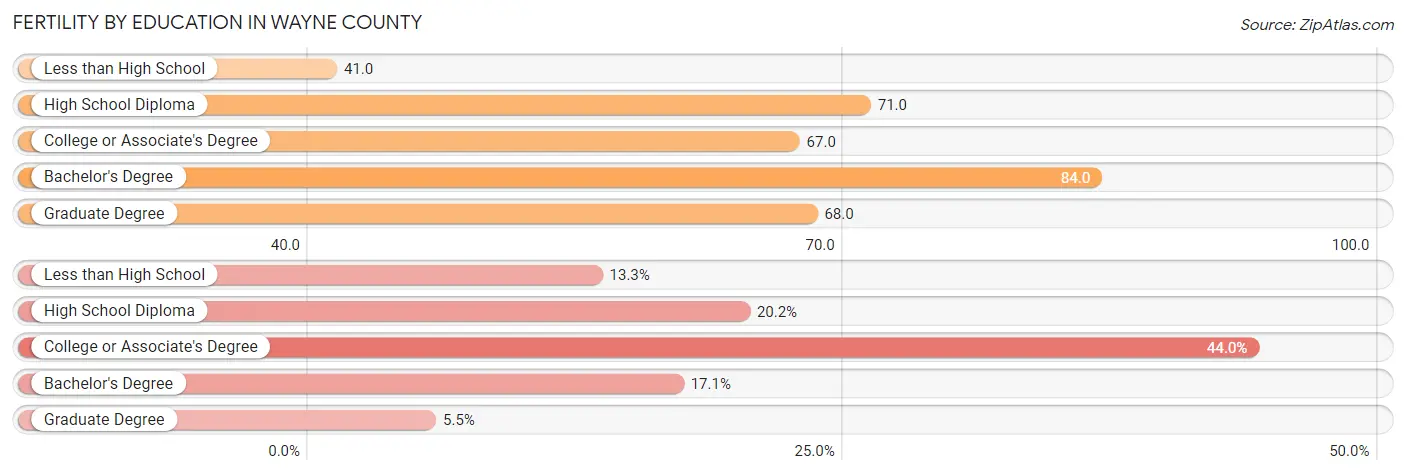
Fertility by Education in Wayne County
Average fertility rate in Wayne County is 64.0 births per 1,000 women. Women with the education attainment of bachelor's degree have the highest fertility rate of 84.0 births per 1,000 women, while women with the education attainment of less than high school have the lowest fertility at 41.0 births per 1,000 women. Women with the education attainment of college or associate's degree represent 44.0% of all women with births.
| Educational Attainment | Women with Births | Births / 1,000 Women |
| Less than High School | 223 (13.3%) | 41.0 |
| High School Diploma | 339 (20.2%) | 71.0 |
| College or Associate's Degree | 740 (44.0%) | 67.0 |
| Bachelor's Degree | 287 (17.1%) | 84.0 |
| Graduate Degree | 92 (5.5%) | 68.0 |
| Total | 1,681 (100.0%) | 64.0 |
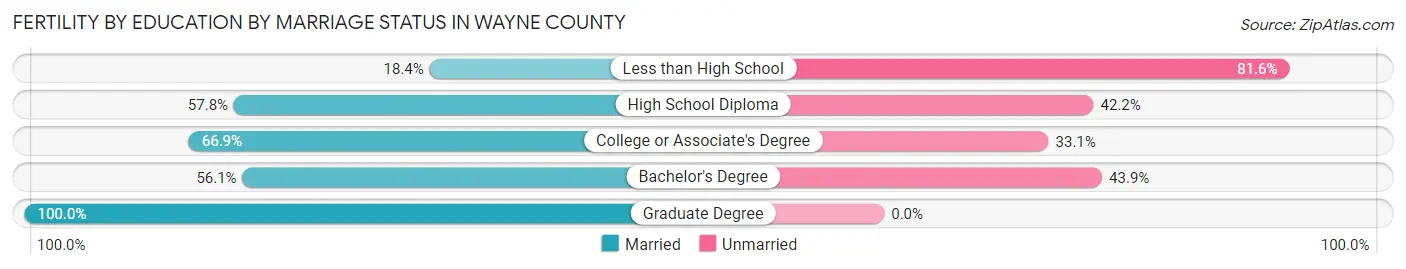
Fertility by Education by Marriage Status in Wayne County
41.4% of women with births in Wayne County are unmarried. Women with the educational attainment of graduate degree are most likely to be married with 100.0% of them married at childbirth, while women with the educational attainment of less than high school are least likely to be married with 81.6% of them unmarried at childbirth.
| Educational Attainment | Married | Unmarried |
| Less than High School | 41 (18.4%) | 182 (81.6%) |
| High School Diploma | 196 (57.8%) | 143 (42.2%) |
| College or Associate's Degree | 495 (66.9%) | 245 (33.1%) |
| Bachelor's Degree | 161 (56.1%) | 126 (43.9%) |
| Graduate Degree | 92 (100.0%) | 0 (0.0%) |
| Total | 985 (58.6%) | 696 (41.4%) |
Income in Wayne County
Income Overview in Wayne County
Per Capita Income in Wayne County is $30,540, while median incomes of families and households are $67,681 and $54,323 respectively.
| Characteristic | Number | Measure |
| Per Capita Income | 117,480 | $30,540 |
| Median Family Income | 30,933 | $67,681 |
| Mean Family Income | 30,933 | $89,804 |
| Median Household Income | 46,949 | $54,323 |
| Mean Household Income | 46,949 | $74,878 |
| Income Deficit | 30,933 | $10,955 |
| Wage / Income Gap (%) | 117,480 | 30.20% |
| Wage / Income Gap ($) | 117,480 | 69.80¢ per $1 |
| Gini / Inequality Index | 117,480 | 0.47 |
Earnings by Sex in Wayne County
Average Earnings in Wayne County are $33,858, $39,897 for men and $27,847 for women, a difference of 30.2%.
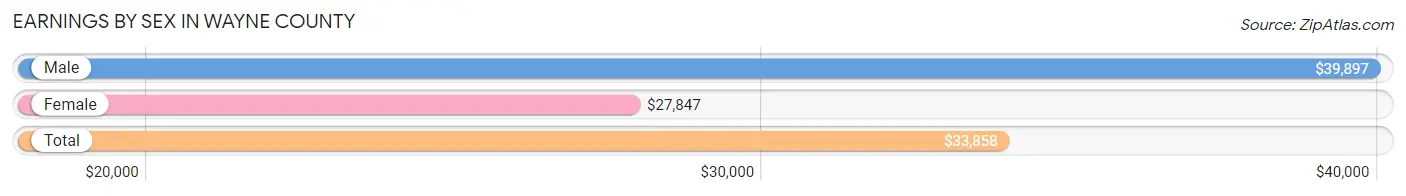
| Sex | Number | Average Earnings |
| Male | 31,435 (53.3%) | $39,897 |
| Female | 27,566 (46.7%) | $27,847 |
| Total | 59,001 (100.0%) | $33,858 |
Earnings by Sex by Income Bracket in Wayne County
The most common earnings brackets in Wayne County are $55,000 to $64,999 for men (2,869 | 9.1%) and $25,000 to $29,999 for women (2,244 | 8.1%).
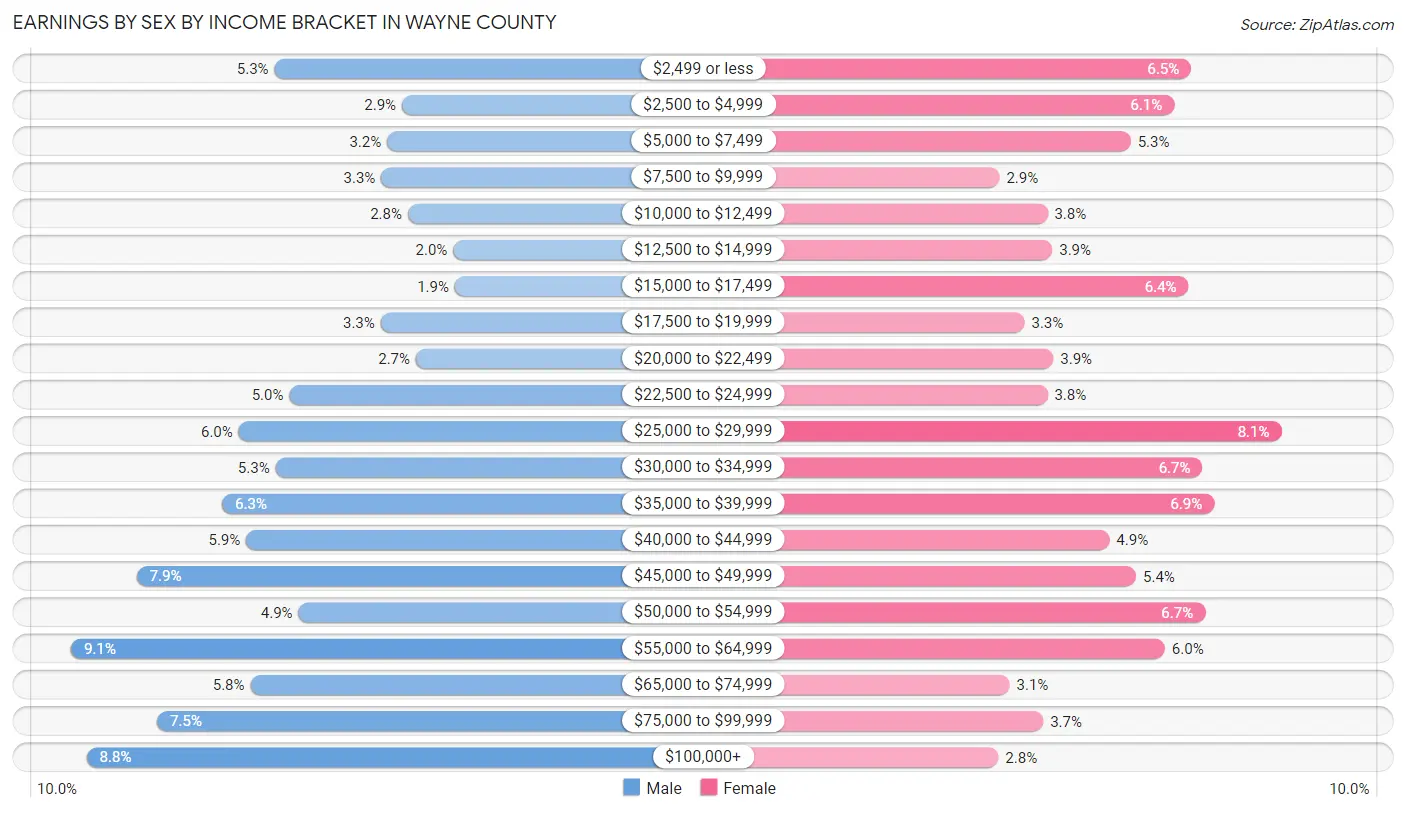
| Income | Male | Female |
| $2,499 or less | 1,673 (5.3%) | 1,778 (6.5%) |
| $2,500 to $4,999 | 920 (2.9%) | 1,690 (6.1%) |
| $5,000 to $7,499 | 1,008 (3.2%) | 1,467 (5.3%) |
| $7,500 to $9,999 | 1,045 (3.3%) | 788 (2.9%) |
| $10,000 to $12,499 | 888 (2.8%) | 1,037 (3.8%) |
| $12,500 to $14,999 | 620 (2.0%) | 1,061 (3.8%) |
| $15,000 to $17,499 | 609 (1.9%) | 1,763 (6.4%) |
| $17,500 to $19,999 | 1,046 (3.3%) | 917 (3.3%) |
| $20,000 to $22,499 | 840 (2.7%) | 1,068 (3.9%) |
| $22,500 to $24,999 | 1,583 (5.0%) | 1,037 (3.8%) |
| $25,000 to $29,999 | 1,882 (6.0%) | 2,244 (8.1%) |
| $30,000 to $34,999 | 1,666 (5.3%) | 1,837 (6.7%) |
| $35,000 to $39,999 | 1,979 (6.3%) | 1,896 (6.9%) |
| $40,000 to $44,999 | 1,838 (5.9%) | 1,357 (4.9%) |
| $45,000 to $49,999 | 2,482 (7.9%) | 1,494 (5.4%) |
| $50,000 to $54,999 | 1,531 (4.9%) | 1,851 (6.7%) |
| $55,000 to $64,999 | 2,869 (9.1%) | 1,643 (6.0%) |
| $65,000 to $74,999 | 1,814 (5.8%) | 840 (3.0%) |
| $75,000 to $99,999 | 2,364 (7.5%) | 1,015 (3.7%) |
| $100,000+ | 2,778 (8.8%) | 783 (2.8%) |
| Total | 31,435 (100.0%) | 27,566 (100.0%) |
Earnings by Sex by Educational Attainment in Wayne County
Average earnings in Wayne County are $45,269 for men and $32,892 for women, a difference of 27.3%. Men with an educational attainment of graduate degree enjoy the highest average annual earnings of $91,180, while those with less than high school education earn the least with $28,221. Women with an educational attainment of graduate degree earn the most with the average annual earnings of $54,477, while those with less than high school education have the smallest earnings of $17,790.
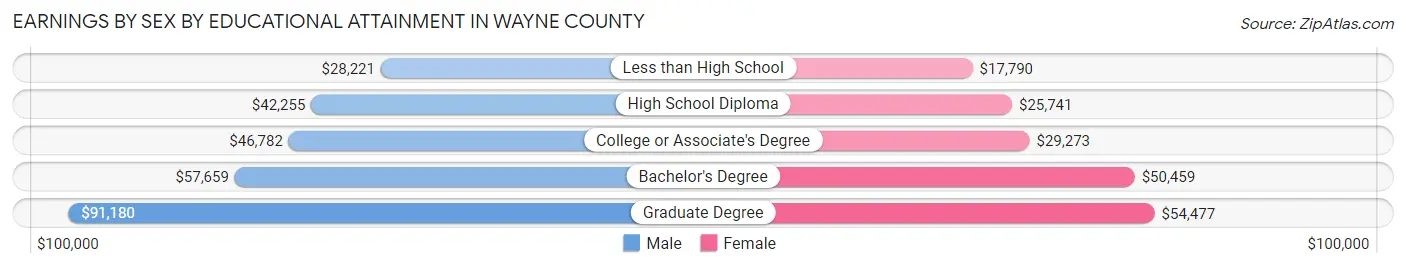
| Educational Attainment | Male Income | Female Income |
| Less than High School | $28,221 | $17,790 |
| High School Diploma | $42,255 | $25,741 |
| College or Associate's Degree | $46,782 | $29,273 |
| Bachelor's Degree | $57,659 | $50,459 |
| Graduate Degree | $91,180 | $54,477 |
| Total | $45,269 | $32,892 |
Family Income in Wayne County
Family Income Brackets in Wayne County
According to the Wayne County family income data, there are 5,815 families falling into the $50,000 to $74,999 income range, which is the most common income bracket and makes up 18.8% of all families. Conversely, the $10,000 to $14,999 income bracket is the least frequent group with only 804 families (2.6%) belonging to this category.
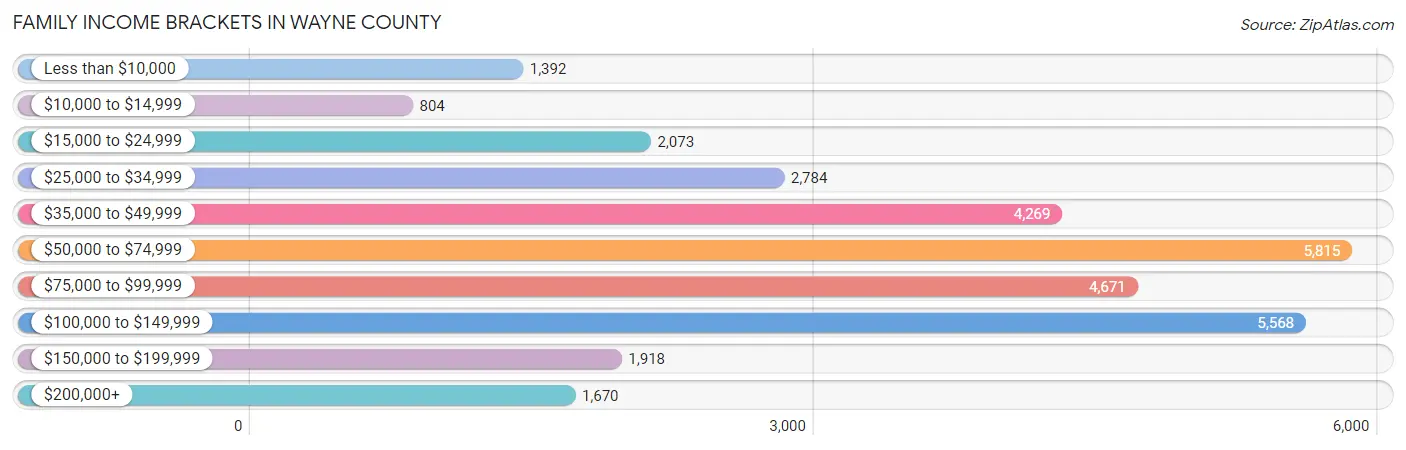
| Income Bracket | # Families | % Families |
| Less than $10,000 | 1,392 | 4.5% |
| $10,000 to $14,999 | 804 | 2.6% |
| $15,000 to $24,999 | 2,073 | 6.7% |
| $25,000 to $34,999 | 2,784 | 9.0% |
| $35,000 to $49,999 | 4,269 | 13.8% |
| $50,000 to $74,999 | 5,815 | 18.8% |
| $75,000 to $99,999 | 4,671 | 15.1% |
| $100,000 to $149,999 | 5,568 | 18.0% |
| $150,000 to $199,999 | 1,918 | 6.2% |
| $200,000+ | 1,670 | 5.4% |
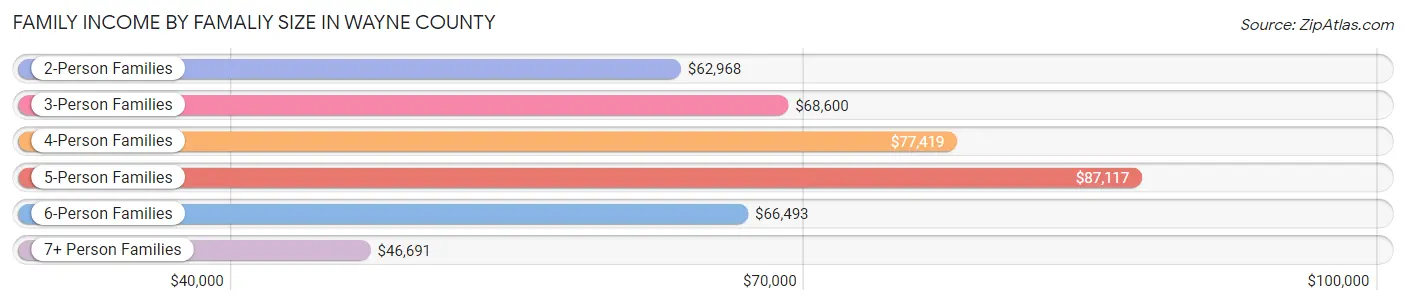
Family Income by Famaliy Size in Wayne County
5-person families (2,244 | 7.2%) account for the highest median family income in Wayne County with $87,117 per family, while 2-person families (14,545 | 47.0%) have the highest median income of $31,484 per family member.
| Income Bracket | # Families | Median Income |
| 2-Person Families | 14,545 (47.0%) | $62,968 |
| 3-Person Families | 7,787 (25.2%) | $68,600 |
| 4-Person Families | 4,936 (16.0%) | $77,419 |
| 5-Person Families | 2,244 (7.2%) | $87,117 |
| 6-Person Families | 1,072 (3.5%) | $66,493 |
| 7+ Person Families | 349 (1.1%) | $46,691 |
| Total | 30,933 (100.0%) | $67,681 |
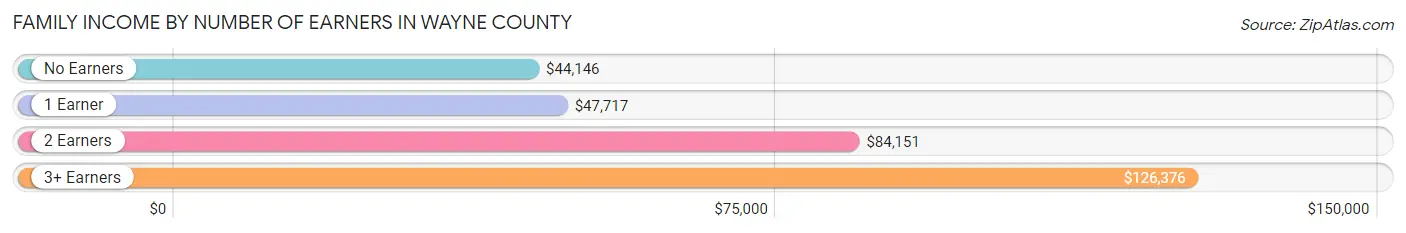
Family Income by Number of Earners in Wayne County
The median family income in Wayne County is $67,681, with families comprising 3+ earners (2,861) having the highest median family income of $126,376, while families with no earners (4,910) have the lowest median family income of $44,146, accounting for 9.2% and 15.9% of families, respectively.
| Number of Earners | # Families | Median Income |
| No Earners | 4,910 (15.9%) | $44,146 |
| 1 Earner | 11,891 (38.4%) | $47,717 |
| 2 Earners | 11,271 (36.4%) | $84,151 |
| 3+ Earners | 2,861 (9.2%) | $126,376 |
| Total | 30,933 (100.0%) | $67,681 |
Household Income in Wayne County
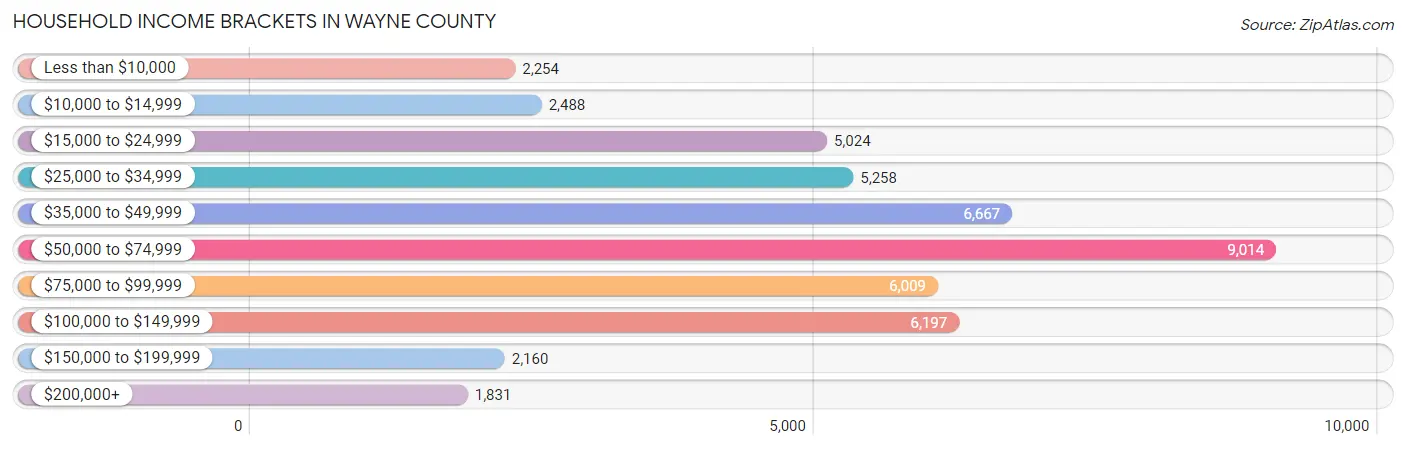
Household Income Brackets in Wayne County
With 9,014 households falling in the category, the $50,000 to $74,999 income range is the most frequent in Wayne County, accounting for 19.2% of all households. In contrast, only 1,831 households (3.9%) fall into the $200,000+ income bracket, making it the least populous group.
| Income Bracket | # Households | % Households |
| Less than $10,000 | 2,254 | 4.8% |
| $10,000 to $14,999 | 2,488 | 5.3% |
| $15,000 to $24,999 | 5,024 | 10.7% |
| $25,000 to $34,999 | 5,258 | 11.2% |
| $35,000 to $49,999 | 6,667 | 14.2% |
| $50,000 to $74,999 | 9,014 | 19.2% |
| $75,000 to $99,999 | 6,009 | 12.8% |
| $100,000 to $149,999 | 6,197 | 13.2% |
| $150,000 to $199,999 | 2,160 | 4.6% |
| $200,000+ | 1,831 | 3.9% |
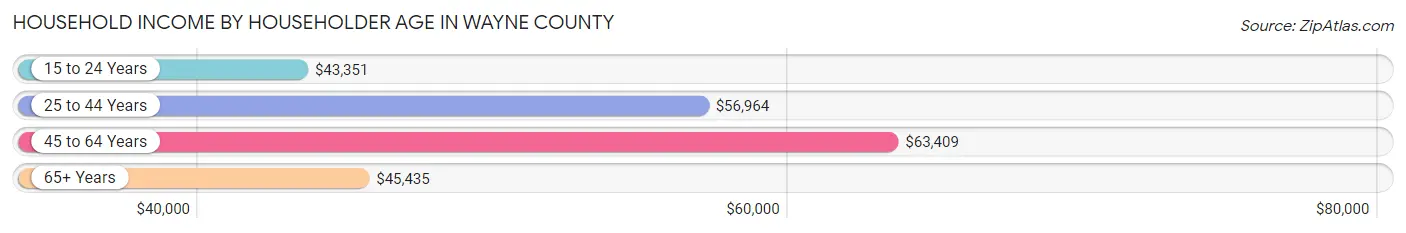
Household Income by Householder Age in Wayne County
The median household income in Wayne County is $54,323, with the highest median household income of $63,409 found in the 45 to 64 years age bracket for the primary householder. A total of 16,490 households (35.1%) fall into this category. Meanwhile, the 15 to 24 years age bracket for the primary householder has the lowest median household income of $43,351, with 2,330 households (5.0%) in this group.
| Income Bracket | # Households | Median Income |
| 15 to 24 Years | 2,330 (5.0%) | $43,351 |
| 25 to 44 Years | 14,762 (31.4%) | $56,964 |
| 45 to 64 Years | 16,490 (35.1%) | $63,409 |
| 65+ Years | 13,367 (28.5%) | $45,435 |
| Total | 46,949 (100.0%) | $54,323 |
Poverty in Wayne County
Income Below Poverty by Sex and Age in Wayne County
With 15.8% poverty level for males and 20.1% for females among the residents of Wayne County, 6 to 11 year old males and 5 year old females are the most vulnerable to poverty, with 1,664 males (35.2%) and 276 females (36.2%) in their respective age groups living below the poverty level.
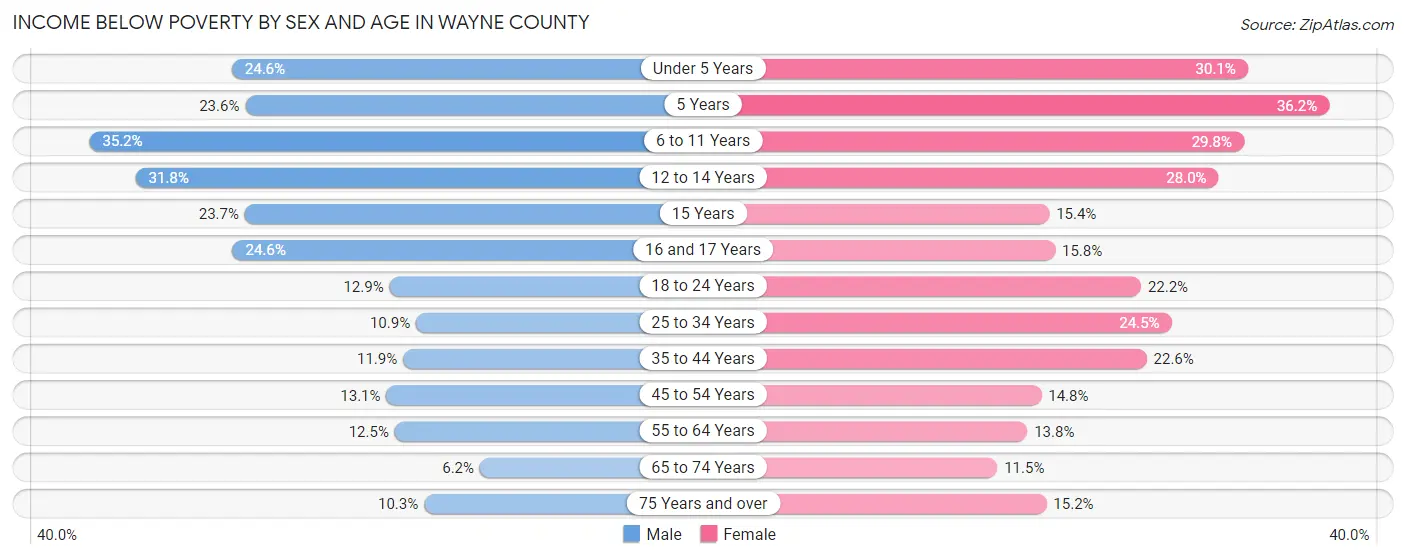
| Age Bracket | Male | Female |
| Under 5 Years | 929 (24.6%) | 1,088 (30.1%) |
| 5 Years | 158 (23.6%) | 276 (36.2%) |
| 6 to 11 Years | 1,664 (35.2%) | 1,280 (29.8%) |
| 12 to 14 Years | 745 (31.8%) | 684 (28.0%) |
| 15 Years | 179 (23.6%) | 122 (15.4%) |
| 16 and 17 Years | 390 (24.6%) | 233 (15.8%) |
| 18 to 24 Years | 724 (12.9%) | 1,104 (22.2%) |
| 25 to 34 Years | 876 (10.9%) | 1,854 (24.5%) |
| 35 to 44 Years | 778 (11.9%) | 1,514 (22.6%) |
| 45 to 54 Years | 883 (13.1%) | 1,059 (14.8%) |
| 55 to 64 Years | 922 (12.5%) | 1,060 (13.8%) |
| 65 to 74 Years | 333 (6.2%) | 716 (11.5%) |
| 75 Years and over | 307 (10.3%) | 703 (15.2%) |
| Total | 8,888 (15.8%) | 11,693 (20.1%) |
Income Above Poverty by Sex and Age in Wayne County
According to the poverty statistics in Wayne County, males aged 65 to 74 years and females aged 65 to 74 years are the age groups that are most secure financially, with 93.8% of males and 88.5% of females in these age groups living above the poverty line.
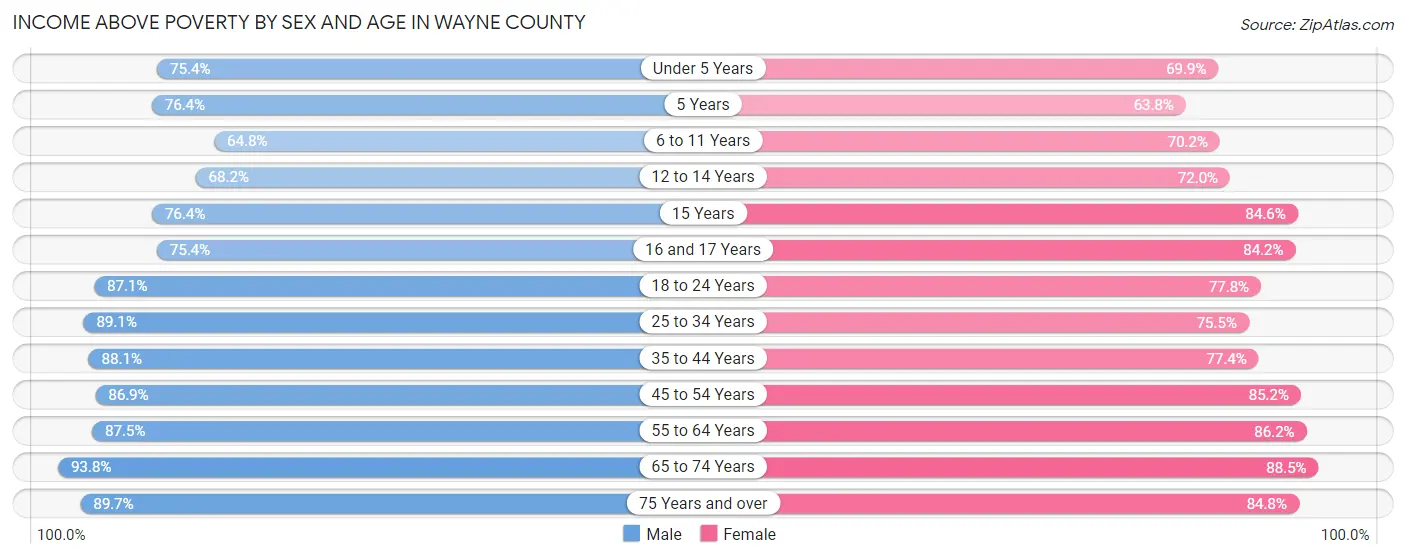
| Age Bracket | Male | Female |
| Under 5 Years | 2,846 (75.4%) | 2,523 (69.9%) |
| 5 Years | 511 (76.4%) | 487 (63.8%) |
| 6 to 11 Years | 3,064 (64.8%) | 3,009 (70.2%) |
| 12 to 14 Years | 1,601 (68.2%) | 1,762 (72.0%) |
| 15 Years | 578 (76.3%) | 670 (84.6%) |
| 16 and 17 Years | 1,198 (75.4%) | 1,239 (84.2%) |
| 18 to 24 Years | 4,882 (87.1%) | 3,867 (77.8%) |
| 25 to 34 Years | 7,133 (89.1%) | 5,724 (75.5%) |
| 35 to 44 Years | 5,758 (88.1%) | 5,177 (77.4%) |
| 45 to 54 Years | 5,835 (86.9%) | 6,090 (85.2%) |
| 55 to 64 Years | 6,445 (87.5%) | 6,640 (86.2%) |
| 65 to 74 Years | 5,038 (93.8%) | 5,491 (88.5%) |
| 75 Years and over | 2,661 (89.7%) | 3,926 (84.8%) |
| Total | 47,550 (84.3%) | 46,605 (79.9%) |
Income Below Poverty Among Married-Couple Families in Wayne County
The poverty statistics for married-couple families in Wayne County show that 4.9% or 1,010 of the total 20,762 families live below the poverty line. Families with 5 or more children have the highest poverty rate of 34.0%, comprising of 32 families. On the other hand, families with no children have the lowest poverty rate of 3.3%, which includes 412 families.
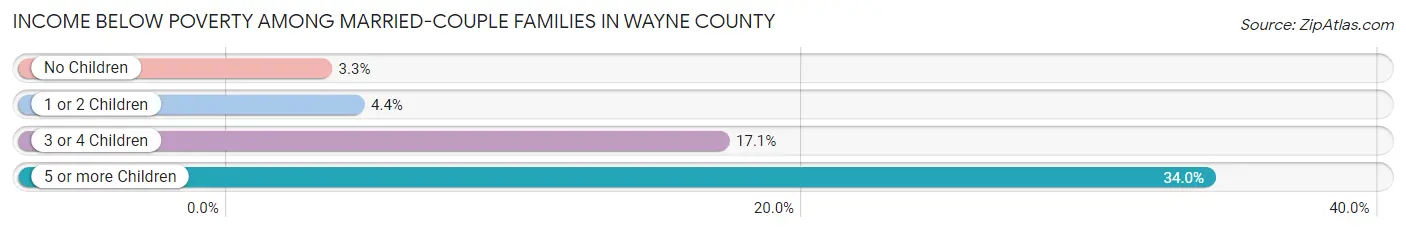
| Children | Above Poverty | Below Poverty |
| No Children | 12,219 (96.7%) | 412 (3.3%) |
| 1 or 2 Children | 6,080 (95.6%) | 279 (4.4%) |
| 3 or 4 Children | 1,391 (82.9%) | 287 (17.1%) |
| 5 or more Children | 62 (66.0%) | 32 (34.0%) |
| Total | 19,752 (95.1%) | 1,010 (4.9%) |
Income Below Poverty Among Single-Parent Households in Wayne County
According to the poverty data in Wayne County, 16.1% or 409 single-father households and 35.2% or 2,692 single-mother households are living below the poverty line. Among single-father households, those with 5 or more children have the highest poverty rate, with 19 households (100.0%) experiencing poverty. Likewise, among single-mother households, those with 3 or 4 children have the highest poverty rate, with 617 households (73.5%) falling below the poverty line.
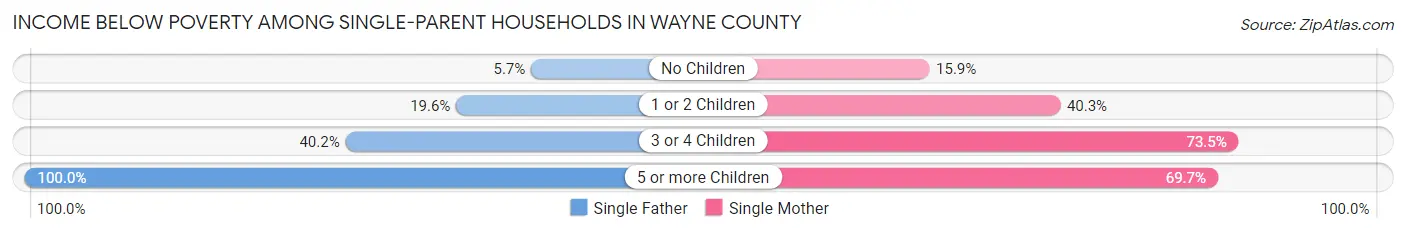
| Children | Single Father | Single Mother |
| No Children | 64 (5.7%) | 469 (15.9%) |
| 1 or 2 Children | 219 (19.6%) | 1,475 (40.3%) |
| 3 or 4 Children | 107 (40.2%) | 617 (73.5%) |
| 5 or more Children | 19 (100.0%) | 131 (69.7%) |
| Total | 409 (16.1%) | 2,692 (35.2%) |
Income Below Poverty Among Married-Couple vs Single-Parent Households in Wayne County
The poverty data for Wayne County shows that 1,010 of the married-couple family households (4.9%) and 3,101 of the single-parent households (30.5%) are living below the poverty level. Within the married-couple family households, those with 5 or more children have the highest poverty rate, with 32 households (34.0%) falling below the poverty line. Among the single-parent households, those with 5 or more children have the highest poverty rate, with 150 household (72.5%) living below poverty.
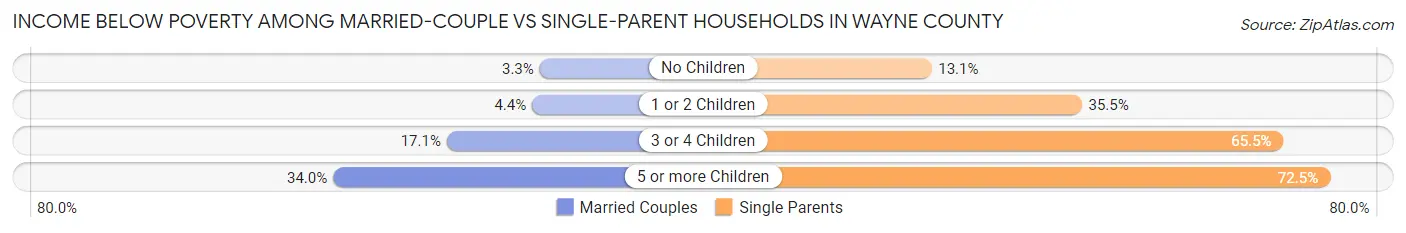
| Children | Married-Couple Families | Single-Parent Households |
| No Children | 412 (3.3%) | 533 (13.1%) |
| 1 or 2 Children | 279 (4.4%) | 1,694 (35.4%) |
| 3 or 4 Children | 287 (17.1%) | 724 (65.5%) |
| 5 or more Children | 32 (34.0%) | 150 (72.5%) |
| Total | 1,010 (4.9%) | 3,101 (30.5%) |
Employment Characteristics in Wayne County
Employment by Class of Employer in Wayne County
Among the 52,846 employed individuals in Wayne County, private company employees (33,845 | 64.0%), federal government employees (5,422 | 10.3%), and state government employees (4,522 | 8.6%) make up the most common classes of employment.
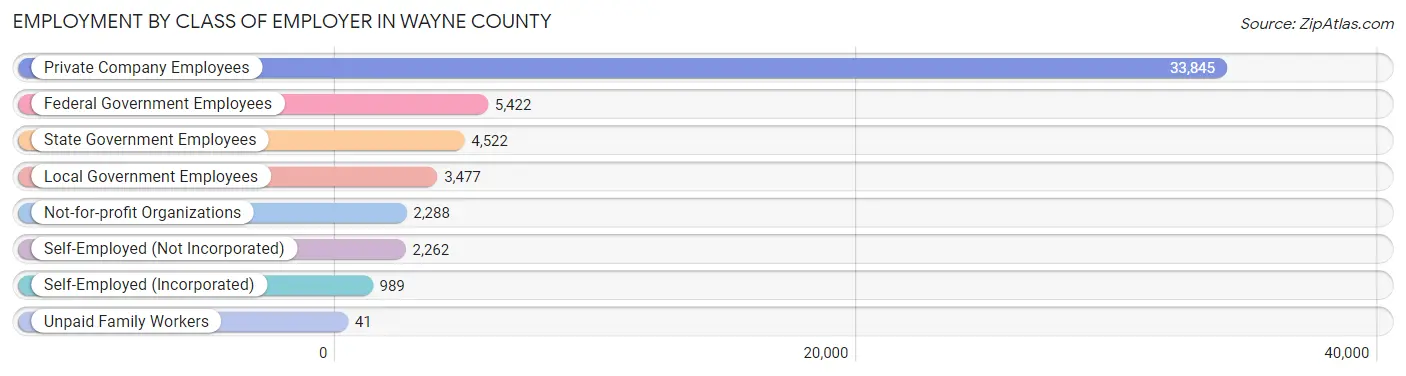
| Employer Class | # Employees | % Employees |
| Private Company Employees | 33,845 | 64.0% |
| Self-Employed (Incorporated) | 989 | 1.9% |
| Self-Employed (Not Incorporated) | 2,262 | 4.3% |
| Not-for-profit Organizations | 2,288 | 4.3% |
| Local Government Employees | 3,477 | 6.6% |
| State Government Employees | 4,522 | 8.6% |
| Federal Government Employees | 5,422 | 10.3% |
| Unpaid Family Workers | 41 | 0.1% |
| Total | 52,846 | 100.0% |
Employment Status by Age in Wayne County
According to the labor force statistics for Wayne County, out of the total population over 16 years of age (93,010), 60.9% or 56,643 individuals are in the labor force, with 5.0% or 2,832 of them unemployed. The age group with the highest labor force participation rate is 25 to 29 years, with 82.4% or 6,837 individuals in the labor force. Within the labor force, the 20 to 24 years age range has the highest percentage of unemployed individuals, with 11.0% or 743 of them being unemployed.
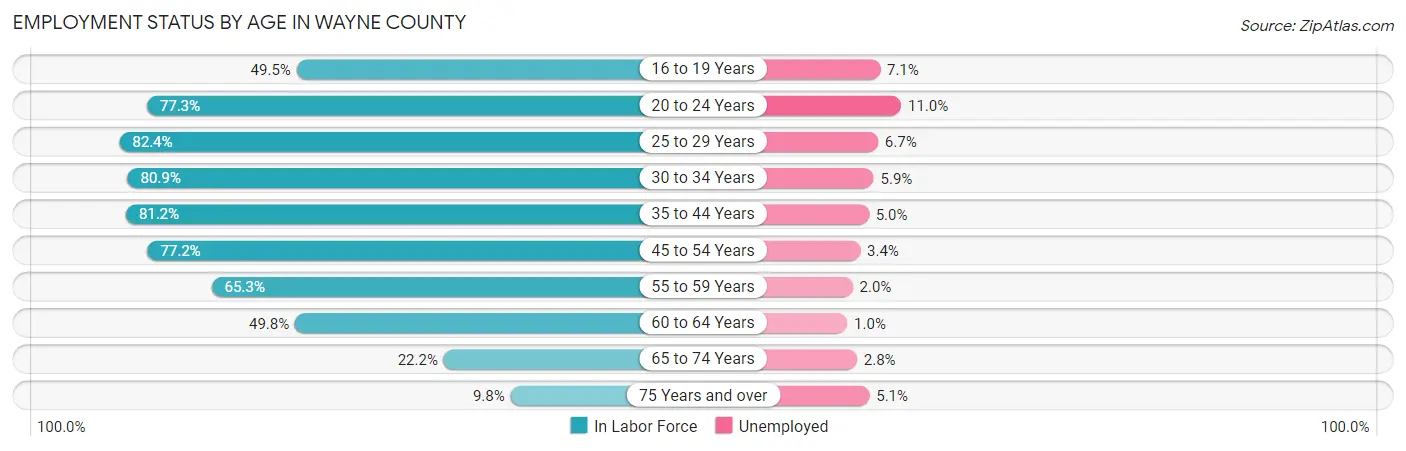
| Age Bracket | In Labor Force | Unemployed |
| 16 to 19 Years | 2,973 (49.5%) | 211 (7.1%) |
| 20 to 24 Years | 6,752 (77.3%) | 743 (11.0%) |
| 25 to 29 Years | 6,837 (82.4%) | 458 (6.7%) |
| 30 to 34 Years | 6,161 (80.9%) | 363 (5.9%) |
| 35 to 44 Years | 10,986 (81.2%) | 549 (5.0%) |
| 45 to 54 Years | 10,845 (77.2%) | 369 (3.4%) |
| 55 to 59 Years | 4,630 (65.3%) | 93 (2.0%) |
| 60 to 64 Years | 4,079 (49.8%) | 41 (1.0%) |
| 65 to 74 Years | 2,586 (22.2%) | 72 (2.8%) |
| 75 Years and over | 769 (9.8%) | 39 (5.1%) |
| Total | 56,643 (60.9%) | 2,832 (5.0%) |
Employment Status by Educational Attainment in Wayne County
According to labor force statistics for Wayne County, 74.1% of individuals (43,549) out of the total population between 25 and 64 years of age (58,771) are in the labor force, with 4.2% or 1,829 of them being unemployed. The group with the highest labor force participation rate are those with the educational attainment of bachelor's degree or higher, with 85.1% or 10,145 individuals in the labor force. Within the labor force, individuals with less than high school education have the highest percentage of unemployment, with 9.2% or 480 of them being unemployed.
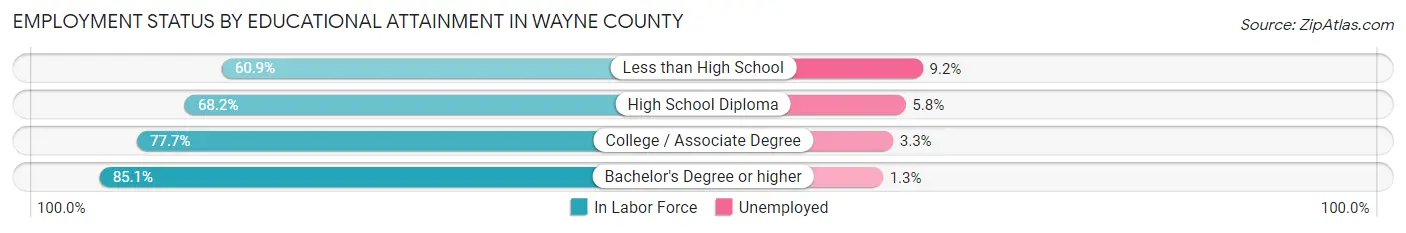
| Educational Attainment | In Labor Force | Unemployed |
| Less than High School | 5,212 (60.9%) | 787 (9.2%) |
| High School Diploma | 11,286 (68.2%) | 960 (5.8%) |
| College / Associate Degree | 16,894 (77.7%) | 718 (3.3%) |
| Bachelor's Degree or higher | 10,145 (85.1%) | 155 (1.3%) |
| Total | 43,549 (74.1%) | 2,468 (4.2%) |
Employment Occupations by Sex in Wayne County
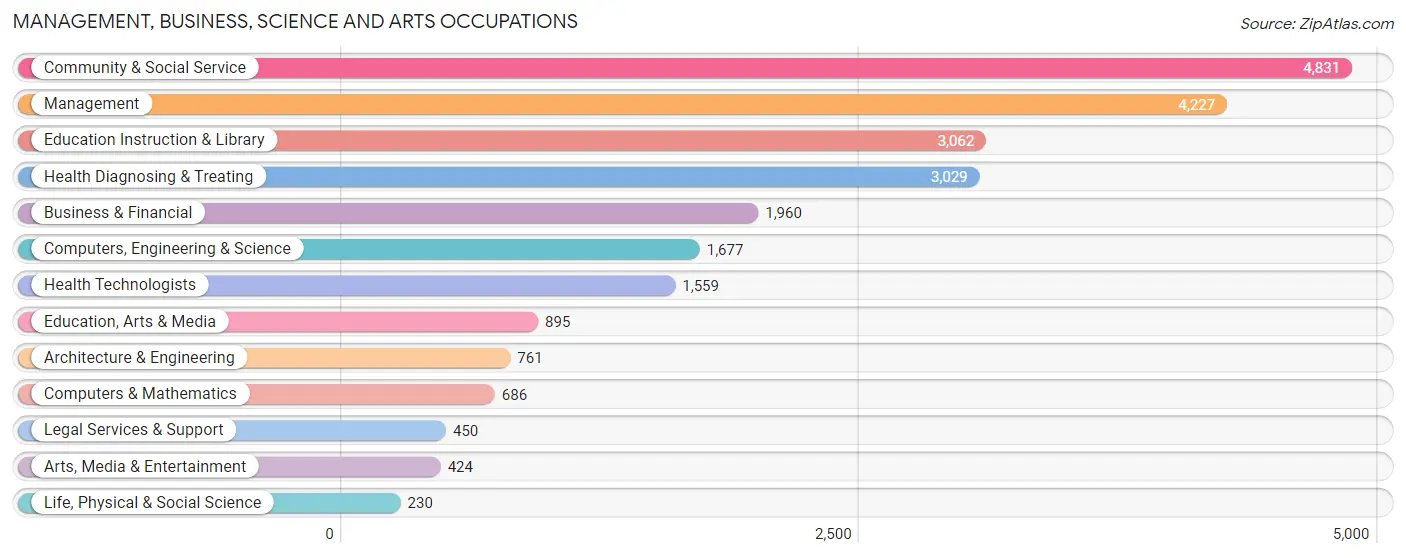
Management, Business, Science and Arts Occupations
The most common Management, Business, Science and Arts occupations in Wayne County are Community & Social Service (4,831 | 9.6%), Management (4,227 | 8.4%), Education Instruction & Library (3,062 | 6.1%), Health Diagnosing & Treating (3,029 | 6.0%), and Business & Financial (1,960 | 3.9%).
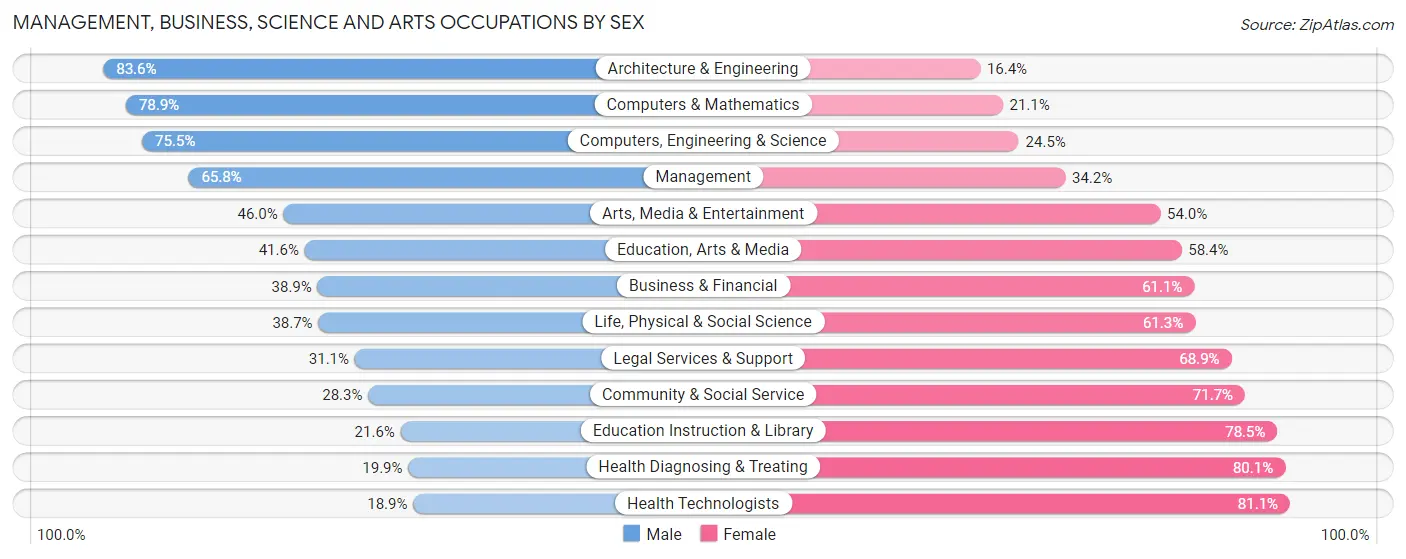
Management, Business, Science and Arts Occupations by Sex
Within the Management, Business, Science and Arts occupations in Wayne County, the most male-oriented occupations are Architecture & Engineering (83.6%), Computers & Mathematics (78.9%), and Computers, Engineering & Science (75.5%), while the most female-oriented occupations are Health Technologists (81.1%), Health Diagnosing & Treating (80.1%), and Education Instruction & Library (78.4%).
| Occupation | Male | Female |
| Management | 2,782 (65.8%) | 1,445 (34.2%) |
| Business & Financial | 762 (38.9%) | 1,198 (61.1%) |
| Computers, Engineering & Science | 1,266 (75.5%) | 411 (24.5%) |
| Computers & Mathematics | 541 (78.9%) | 145 (21.1%) |
| Architecture & Engineering | 636 (83.6%) | 125 (16.4%) |
| Life, Physical & Social Science | 89 (38.7%) | 141 (61.3%) |
| Community & Social Service | 1,367 (28.3%) | 3,464 (71.7%) |
| Education, Arts & Media | 372 (41.6%) | 523 (58.4%) |
| Legal Services & Support | 140 (31.1%) | 310 (68.9%) |
| Education Instruction & Library | 660 (21.5%) | 2,402 (78.4%) |
| Arts, Media & Entertainment | 195 (46.0%) | 229 (54.0%) |
| Health Diagnosing & Treating | 604 (19.9%) | 2,425 (80.1%) |
| Health Technologists | 295 (18.9%) | 1,264 (81.1%) |
| Total (Category) | 6,781 (43.1%) | 8,943 (56.9%) |
| Total (Overall) | 26,142 (51.8%) | 24,286 (48.2%) |
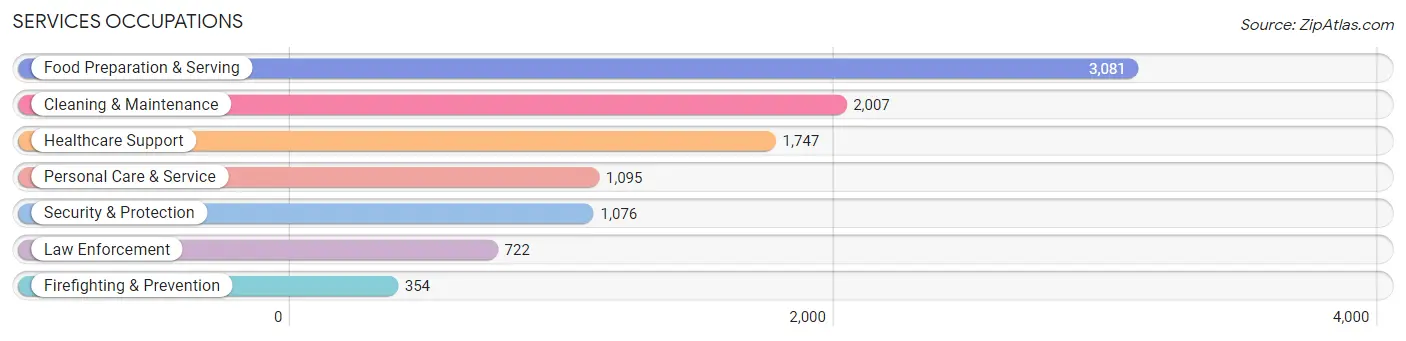
Services Occupations
The most common Services occupations in Wayne County are Food Preparation & Serving (3,081 | 6.1%), Cleaning & Maintenance (2,007 | 4.0%), Healthcare Support (1,747 | 3.5%), Personal Care & Service (1,095 | 2.2%), and Security & Protection (1,076 | 2.1%).
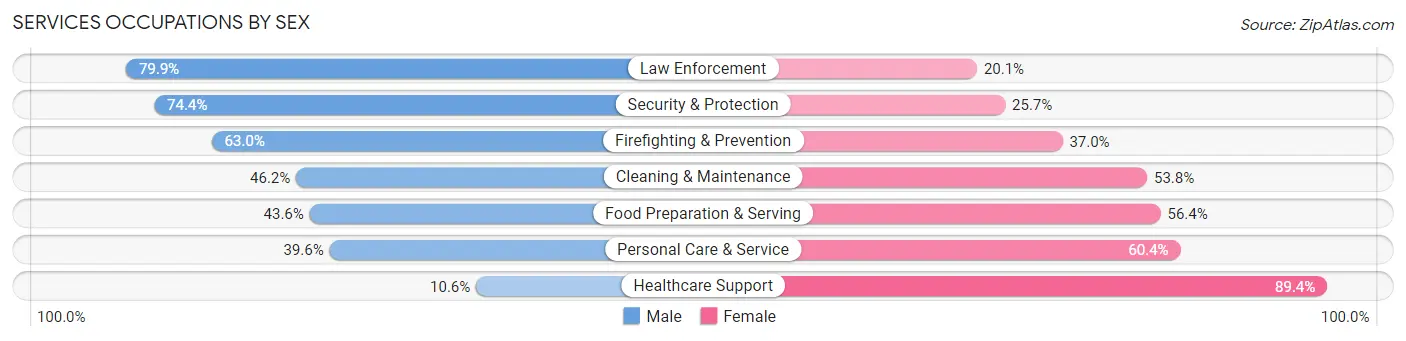
Services Occupations by Sex
Within the Services occupations in Wayne County, the most male-oriented occupations are Law Enforcement (79.9%), Security & Protection (74.4%), and Firefighting & Prevention (63.0%), while the most female-oriented occupations are Healthcare Support (89.4%), Personal Care & Service (60.4%), and Food Preparation & Serving (56.4%).
| Occupation | Male | Female |
| Healthcare Support | 185 (10.6%) | 1,562 (89.4%) |
| Security & Protection | 800 (74.4%) | 276 (25.7%) |
| Firefighting & Prevention | 223 (63.0%) | 131 (37.0%) |
| Law Enforcement | 577 (79.9%) | 145 (20.1%) |
| Food Preparation & Serving | 1,342 (43.6%) | 1,739 (56.4%) |
| Cleaning & Maintenance | 928 (46.2%) | 1,079 (53.8%) |
| Personal Care & Service | 434 (39.6%) | 661 (60.4%) |
| Total (Category) | 3,689 (41.0%) | 5,317 (59.0%) |
| Total (Overall) | 26,142 (51.8%) | 24,286 (48.2%) |
Sales and Office Occupations
The most common Sales and Office occupations in Wayne County are Office & Administration (5,034 | 10.0%), and Sales & Related (4,818 | 9.6%).

Sales and Office Occupations by Sex

| Occupation | Male | Female |
| Sales & Related | 2,010 (41.7%) | 2,808 (58.3%) |
| Office & Administration | 990 (19.7%) | 4,044 (80.3%) |
| Total (Category) | 3,000 (30.4%) | 6,852 (69.6%) |
| Total (Overall) | 26,142 (51.8%) | 24,286 (48.2%) |
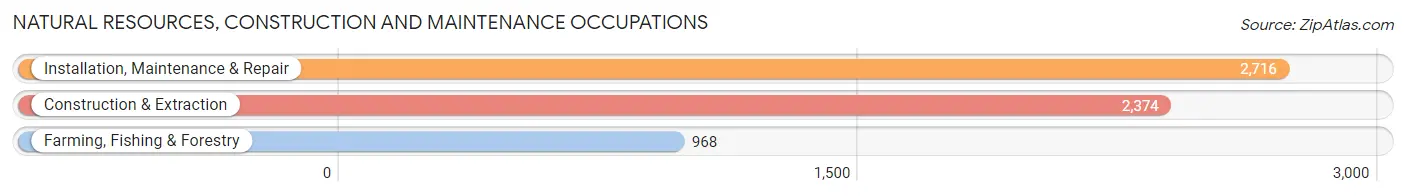
Natural Resources, Construction and Maintenance Occupations
The most common Natural Resources, Construction and Maintenance occupations in Wayne County are Installation, Maintenance & Repair (2,716 | 5.4%), Construction & Extraction (2,374 | 4.7%), and Farming, Fishing & Forestry (968 | 1.9%).
Natural Resources, Construction and Maintenance Occupations by Sex
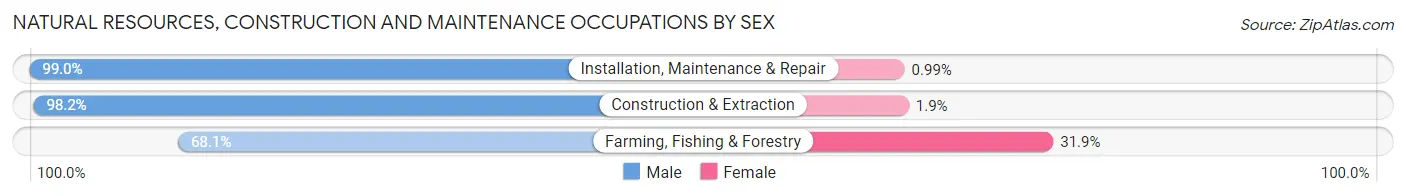
| Occupation | Male | Female |
| Farming, Fishing & Forestry | 659 (68.1%) | 309 (31.9%) |
| Construction & Extraction | 2,330 (98.2%) | 44 (1.8%) |
| Installation, Maintenance & Repair | 2,689 (99.0%) | 27 (1.0%) |
| Total (Category) | 5,678 (93.7%) | 380 (6.3%) |
| Total (Overall) | 26,142 (51.8%) | 24,286 (48.2%) |
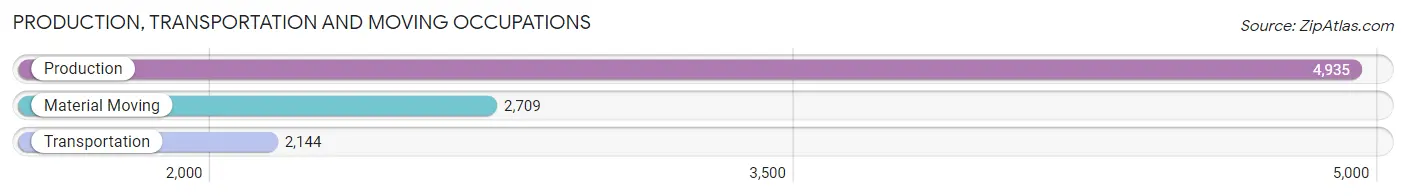
Production, Transportation and Moving Occupations
The most common Production, Transportation and Moving occupations in Wayne County are Production (4,935 | 9.8%), Material Moving (2,709 | 5.4%), and Transportation (2,144 | 4.3%).
Production, Transportation and Moving Occupations by Sex
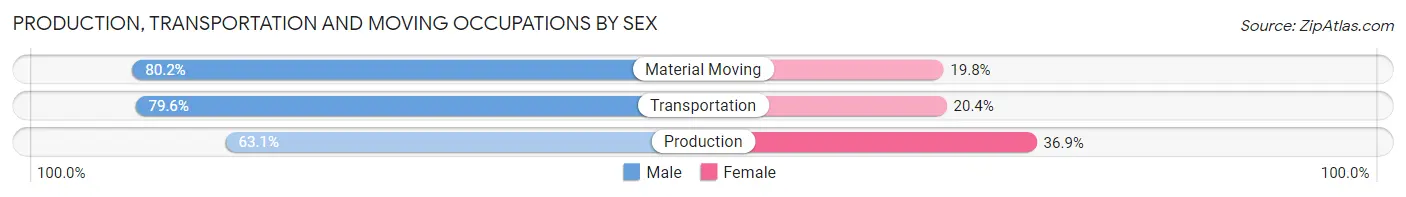
| Occupation | Male | Female |
| Production | 3,114 (63.1%) | 1,821 (36.9%) |
| Transportation | 1,707 (79.6%) | 437 (20.4%) |
| Material Moving | 2,173 (80.2%) | 536 (19.8%) |
| Total (Category) | 6,994 (71.5%) | 2,794 (28.5%) |
| Total (Overall) | 26,142 (51.8%) | 24,286 (48.2%) |
Employment Industries by Sex in Wayne County
Employment Industries in Wayne County
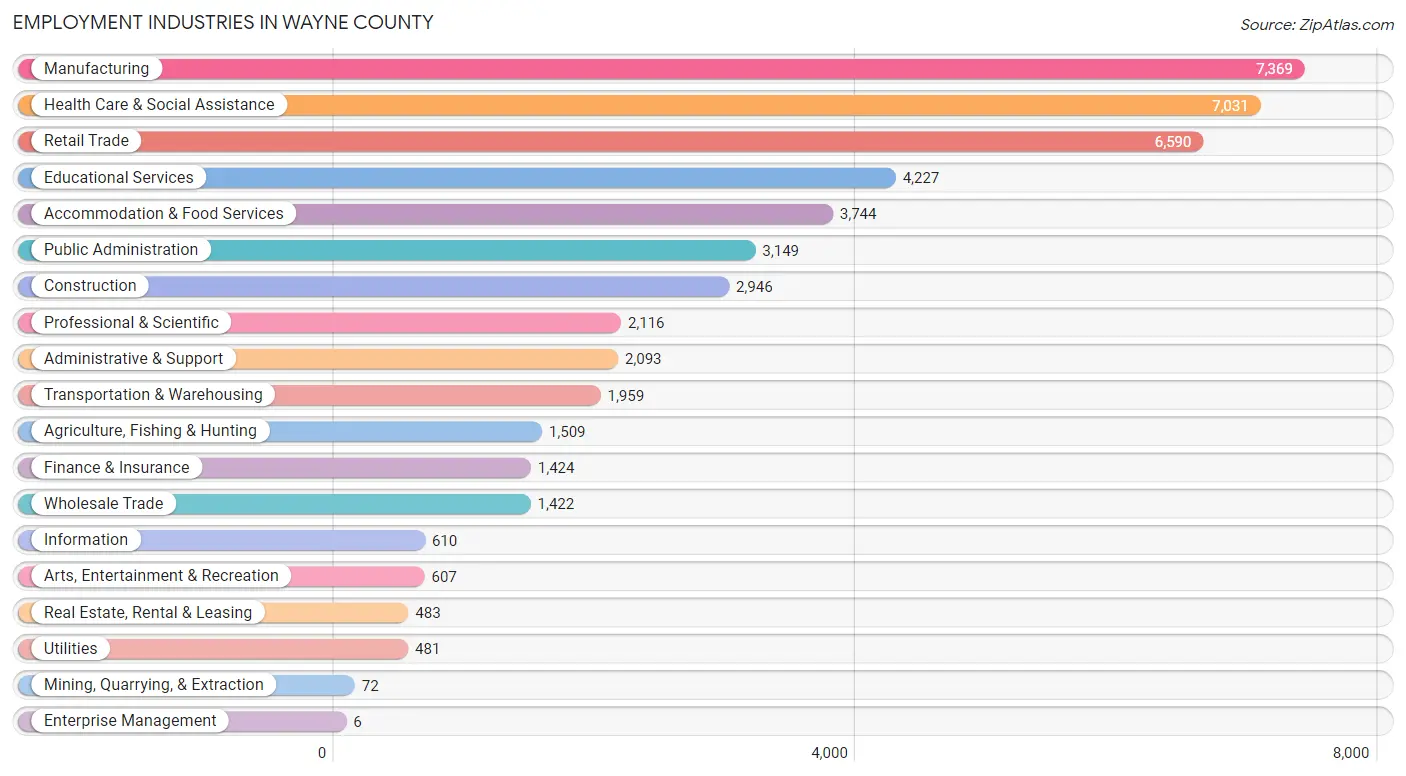
The major employment industries in Wayne County include Manufacturing (7,369 | 14.6%), Health Care & Social Assistance (7,031 | 13.9%), Retail Trade (6,590 | 13.1%), Educational Services (4,227 | 8.4%), and Accommodation & Food Services (3,744 | 7.4%).
Employment Industries by Sex in Wayne County
The Wayne County industries that see more men than women are Mining, Quarrying, & Extraction (100.0%), Construction (95.5%), and Utilities (95.2%), whereas the industries that tend to have a higher number of women are Enterprise Management (100.0%), Health Care & Social Assistance (83.7%), and Finance & Insurance (74.2%).
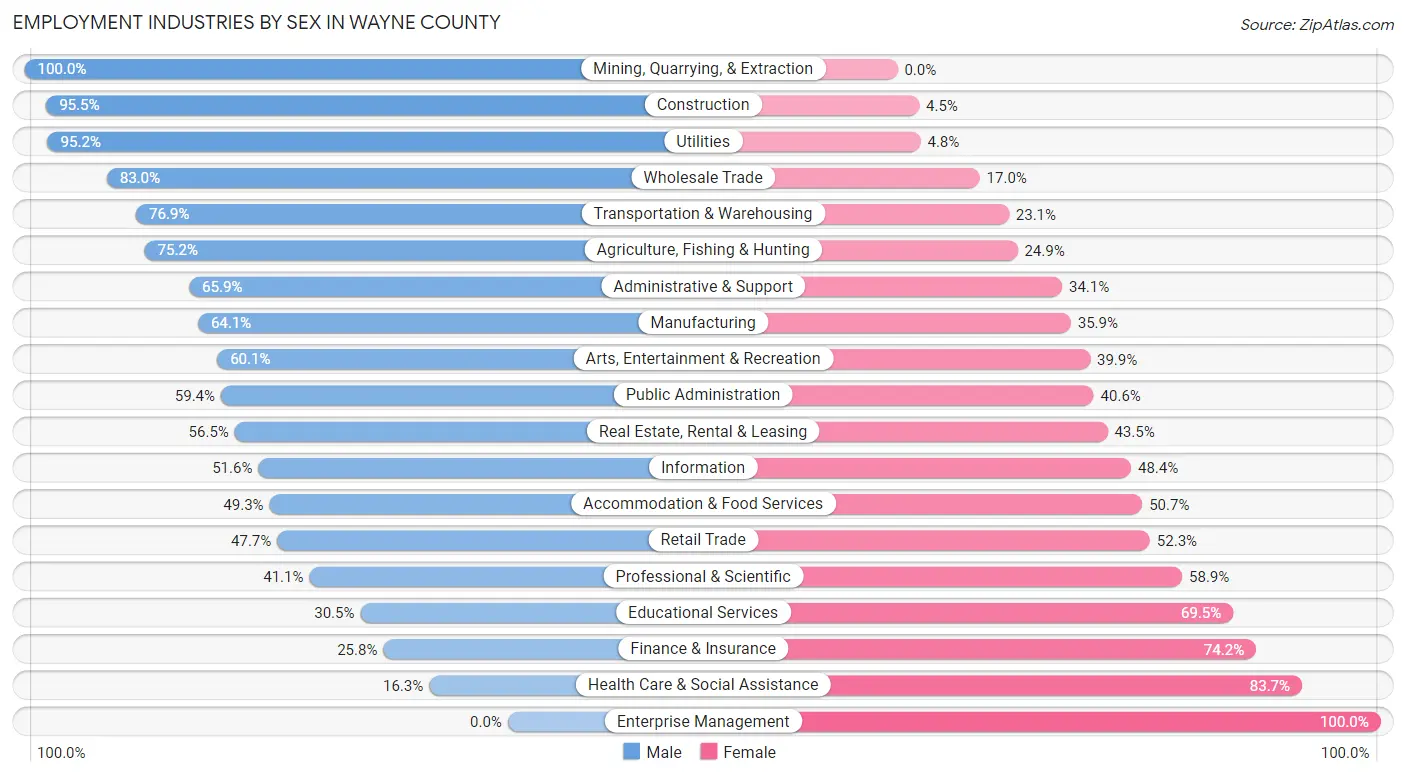
| Industry | Male | Female |
| Agriculture, Fishing & Hunting | 1,134 (75.1%) | 375 (24.8%) |
| Mining, Quarrying, & Extraction | 72 (100.0%) | 0 (0.0%) |
| Construction | 2,814 (95.5%) | 132 (4.5%) |
| Manufacturing | 4,724 (64.1%) | 2,645 (35.9%) |
| Wholesale Trade | 1,180 (83.0%) | 242 (17.0%) |
| Retail Trade | 3,146 (47.7%) | 3,444 (52.3%) |
| Transportation & Warehousing | 1,507 (76.9%) | 452 (23.1%) |
| Utilities | 458 (95.2%) | 23 (4.8%) |
| Information | 315 (51.6%) | 295 (48.4%) |
| Finance & Insurance | 367 (25.8%) | 1,057 (74.2%) |
| Real Estate, Rental & Leasing | 273 (56.5%) | 210 (43.5%) |
| Professional & Scientific | 869 (41.1%) | 1,247 (58.9%) |
| Enterprise Management | 0 (0.0%) | 6 (100.0%) |
| Administrative & Support | 1,380 (65.9%) | 713 (34.1%) |
| Educational Services | 1,290 (30.5%) | 2,937 (69.5%) |
| Health Care & Social Assistance | 1,145 (16.3%) | 5,886 (83.7%) |
| Arts, Entertainment & Recreation | 365 (60.1%) | 242 (39.9%) |
| Accommodation & Food Services | 1,847 (49.3%) | 1,897 (50.7%) |
| Public Administration | 1,870 (59.4%) | 1,279 (40.6%) |
| Total | 26,142 (51.8%) | 24,286 (48.2%) |
Education in Wayne County
School Enrollment in Wayne County
The most common levels of schooling among the 28,464 students in Wayne County are middle school (6,807 | 23.9%), high school (6,276 | 22.1%), and college / undergraduate (6,250 | 22.0%).
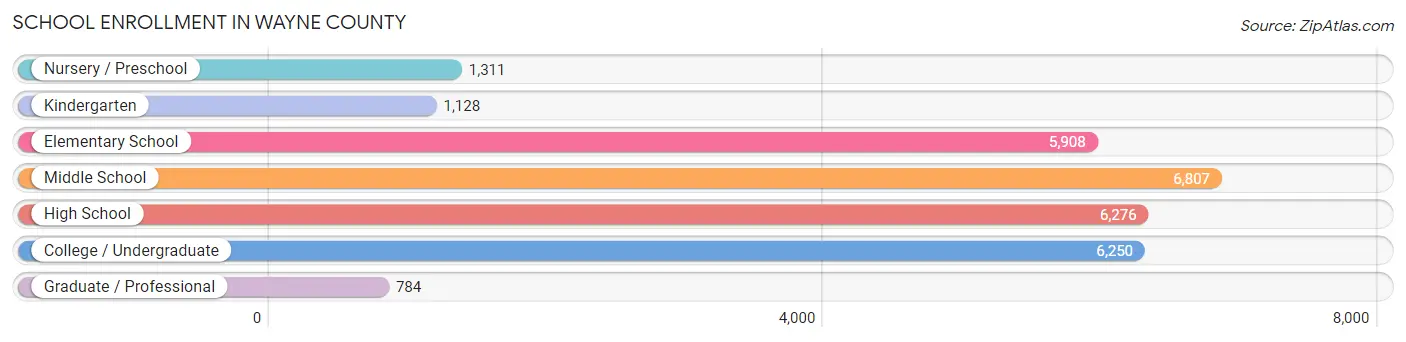
| School Level | # Students | % Students |
| Nursery / Preschool | 1,311 | 4.6% |
| Kindergarten | 1,128 | 4.0% |
| Elementary School | 5,908 | 20.8% |
| Middle School | 6,807 | 23.9% |
| High School | 6,276 | 22.1% |
| College / Undergraduate | 6,250 | 22.0% |
| Graduate / Professional | 784 | 2.8% |
| Total | 28,464 | 100.0% |
School Enrollment by Age by Funding Source in Wayne County
Out of a total of 28,464 students who are enrolled in schools in Wayne County, 3,729 (13.1%) attend a private institution, while the remaining 24,735 (86.9%) are enrolled in public schools. The age group of 3 to 4 year olds has the highest likelihood of being enrolled in private schools, with 224 (28.9% in the age bracket) enrolled. Conversely, the age group of 10 to 14 year olds has the lowest likelihood of being enrolled in a private school, with 7,710 (93.5% in the age bracket) attending a public institution.
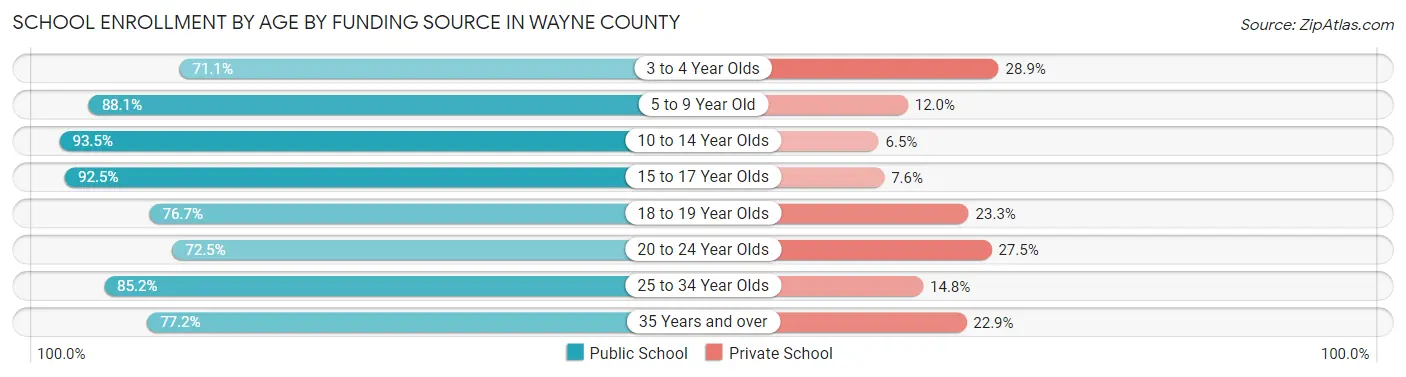
| Age Bracket | Public School | Private School |
| 3 to 4 Year Olds | 552 (71.1%) | 224 (28.9%) |
| 5 to 9 Year Old | 6,056 (88.0%) | 822 (11.9%) |
| 10 to 14 Year Olds | 7,710 (93.5%) | 537 (6.5%) |
| 15 to 17 Year Olds | 4,223 (92.4%) | 345 (7.5%) |
| 18 to 19 Year Olds | 1,371 (76.7%) | 416 (23.3%) |
| 20 to 24 Year Olds | 1,837 (72.5%) | 698 (27.5%) |
| 25 to 34 Year Olds | 1,716 (85.2%) | 298 (14.8%) |
| 35 Years and over | 1,280 (77.1%) | 379 (22.9%) |
| Total | 24,735 (86.9%) | 3,729 (13.1%) |
Educational Attainment by Field of Study in Wayne County
Business (3,431 | 20.4%), education (2,866 | 17.1%), arts & humanities (2,071 | 12.3%), science & technology (1,747 | 10.4%), and social sciences (999 | 5.9%) are the most common fields of study among 16,787 individuals in Wayne County who have obtained a bachelor's degree or higher.
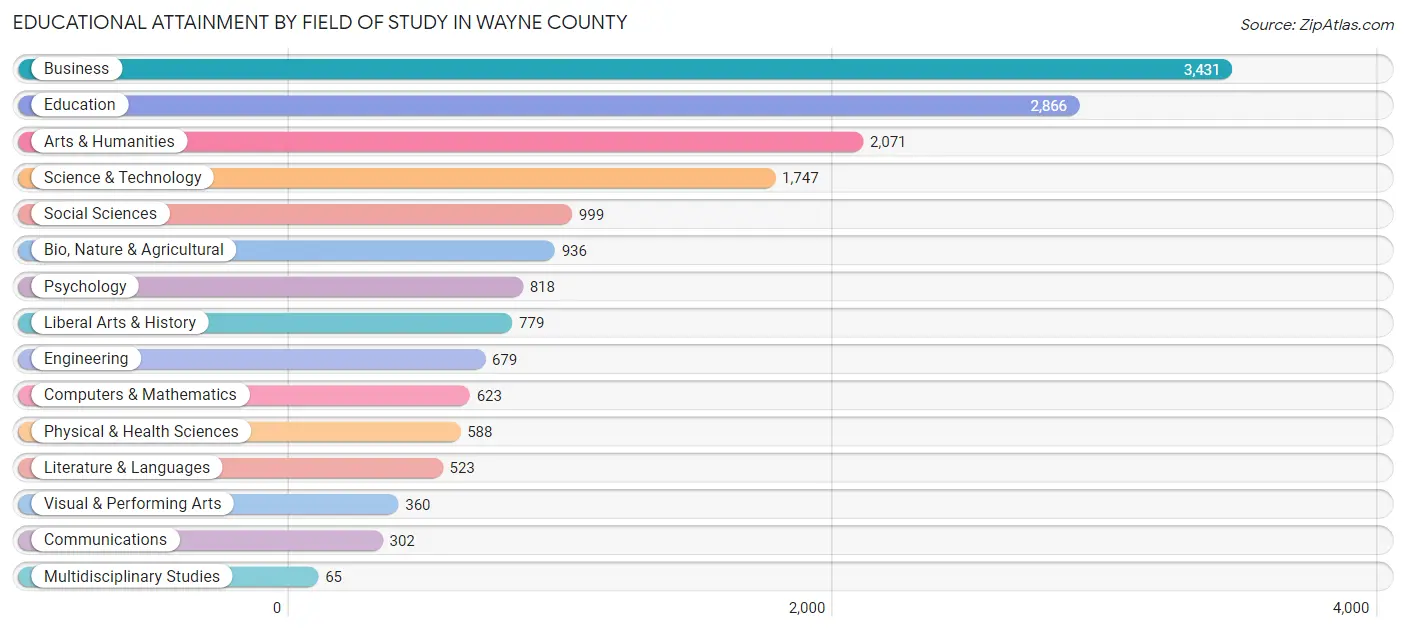
| Field of Study | # Graduates | % Graduates |
| Computers & Mathematics | 623 | 3.7% |
| Bio, Nature & Agricultural | 936 | 5.6% |
| Physical & Health Sciences | 588 | 3.5% |
| Psychology | 818 | 4.9% |
| Social Sciences | 999 | 5.9% |
| Engineering | 679 | 4.0% |
| Multidisciplinary Studies | 65 | 0.4% |
| Science & Technology | 1,747 | 10.4% |
| Business | 3,431 | 20.4% |
| Education | 2,866 | 17.1% |
| Literature & Languages | 523 | 3.1% |
| Liberal Arts & History | 779 | 4.6% |
| Visual & Performing Arts | 360 | 2.1% |
| Communications | 302 | 1.8% |
| Arts & Humanities | 2,071 | 12.3% |
| Total | 16,787 | 100.0% |
Transportation & Commute in Wayne County
Vehicle Availability by Sex in Wayne County
The most prevalent vehicle ownership categories in Wayne County are males with 2 vehicles (10,562, accounting for 37.8%) and females with 2 vehicles (8,174, making up 43.8%).
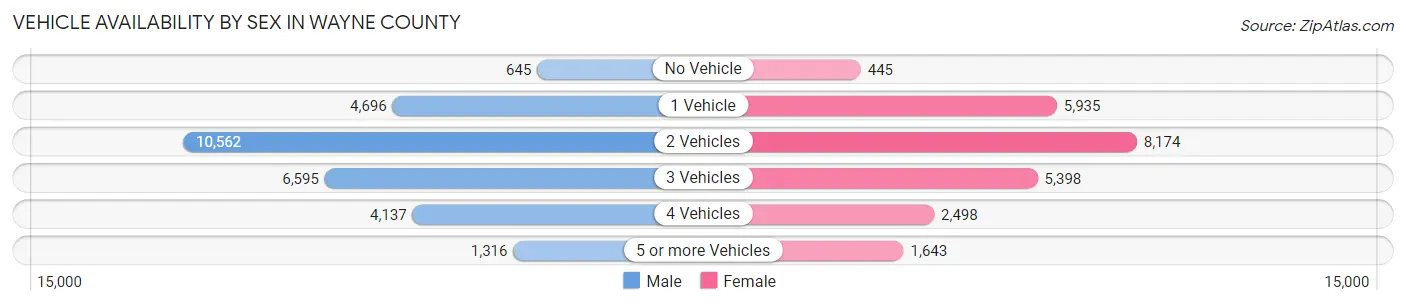
| Vehicles Available | Male | Female |
| No Vehicle | 645 (2.3%) | 445 (1.8%) |
| 1 Vehicle | 4,696 (16.8%) | 5,935 (24.6%) |
| 2 Vehicles | 10,562 (37.8%) | 8,174 (33.9%) |
| 3 Vehicles | 6,595 (23.6%) | 5,398 (22.4%) |
| 4 Vehicles | 4,137 (14.8%) | 2,498 (10.4%) |
| 5 or more Vehicles | 1,316 (4.7%) | 1,643 (6.8%) |
| Total | 27,951 (100.0%) | 24,093 (100.0%) |
Commute Time in Wayne County
The most frequently occuring commute durations in Wayne County are 15 to 19 minutes (9,375 commuters, 18.4%), 10 to 14 minutes (9,304 commuters, 18.3%), and 5 to 9 minutes (7,289 commuters, 14.3%).
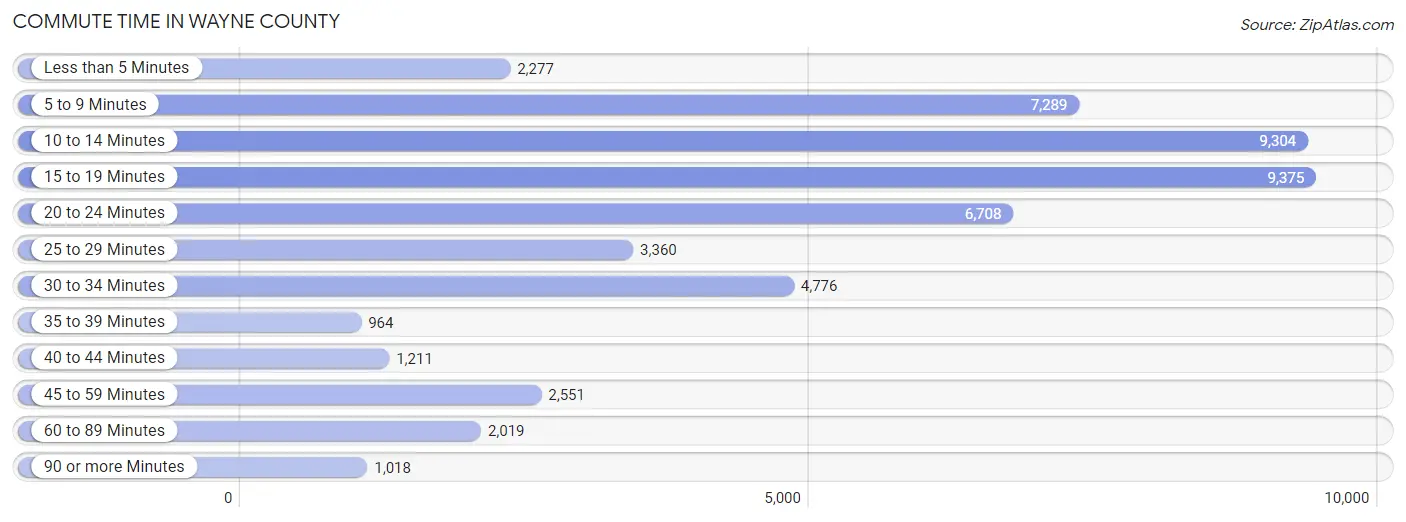
| Commute Time | # Commuters | % Commuters |
| Less than 5 Minutes | 2,277 | 4.5% |
| 5 to 9 Minutes | 7,289 | 14.3% |
| 10 to 14 Minutes | 9,304 | 18.3% |
| 15 to 19 Minutes | 9,375 | 18.4% |
| 20 to 24 Minutes | 6,708 | 13.2% |
| 25 to 29 Minutes | 3,360 | 6.6% |
| 30 to 34 Minutes | 4,776 | 9.4% |
| 35 to 39 Minutes | 964 | 1.9% |
| 40 to 44 Minutes | 1,211 | 2.4% |
| 45 to 59 Minutes | 2,551 | 5.0% |
| 60 to 89 Minutes | 2,019 | 4.0% |
| 90 or more Minutes | 1,018 | 2.0% |
Commute Time by Sex in Wayne County
The most common commute times in Wayne County are 15 to 19 minutes (5,304 commuters, 19.0%) for males and 10 to 14 minutes (4,590 commuters, 20.0%) for females.
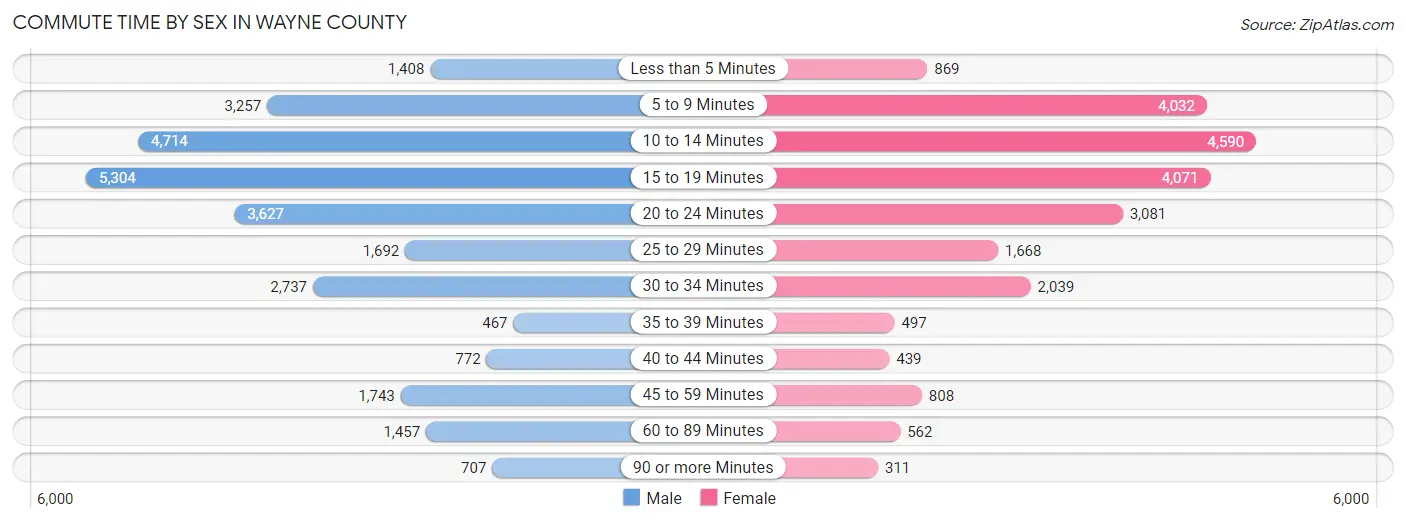
| Commute Time | Male | Female |
| Less than 5 Minutes | 1,408 (5.1%) | 869 (3.8%) |
| 5 to 9 Minutes | 3,257 (11.7%) | 4,032 (17.6%) |
| 10 to 14 Minutes | 4,714 (16.9%) | 4,590 (20.0%) |
| 15 to 19 Minutes | 5,304 (19.0%) | 4,071 (17.7%) |
| 20 to 24 Minutes | 3,627 (13.0%) | 3,081 (13.4%) |
| 25 to 29 Minutes | 1,692 (6.1%) | 1,668 (7.3%) |
| 30 to 34 Minutes | 2,737 (9.8%) | 2,039 (8.9%) |
| 35 to 39 Minutes | 467 (1.7%) | 497 (2.2%) |
| 40 to 44 Minutes | 772 (2.8%) | 439 (1.9%) |
| 45 to 59 Minutes | 1,743 (6.2%) | 808 (3.5%) |
| 60 to 89 Minutes | 1,457 (5.2%) | 562 (2.5%) |
| 90 or more Minutes | 707 (2.5%) | 311 (1.3%) |
Time of Departure to Work by Sex in Wayne County
The most frequent times of departure to work in Wayne County are 7:00 AM to 7:29 AM (3,923, 14.1%) for males and 7:00 AM to 7:29 AM (3,992, 17.4%) for females.
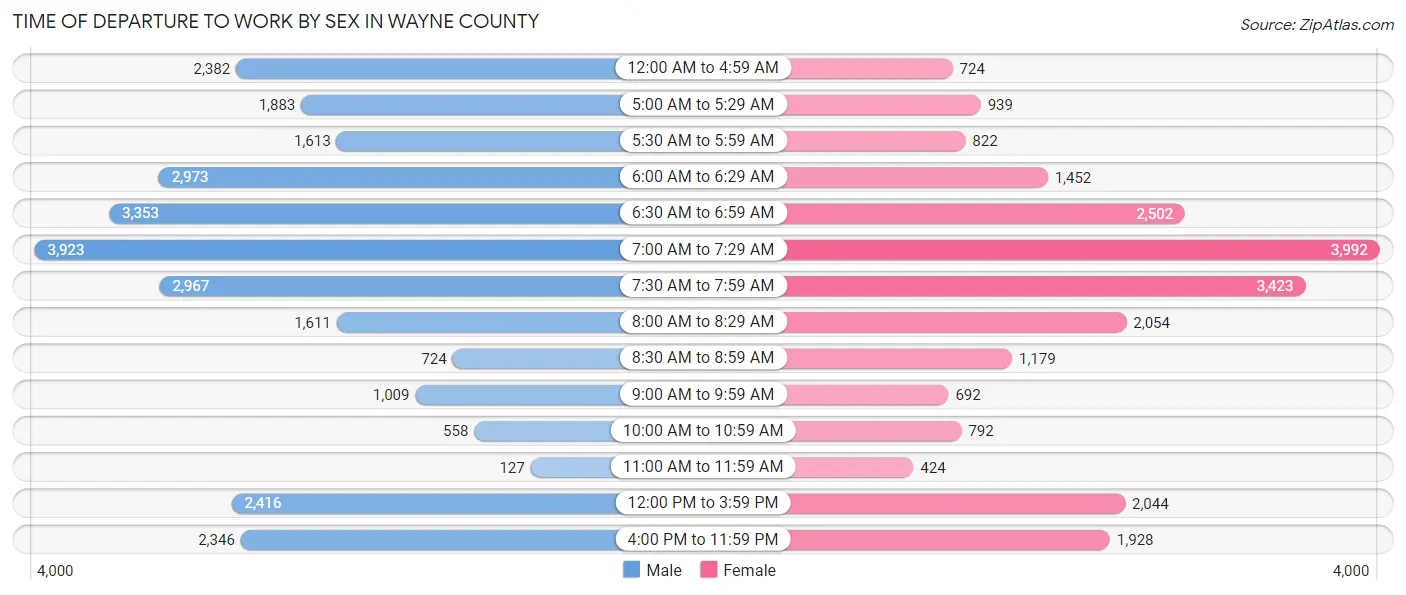
| Time of Departure | Male | Female |
| 12:00 AM to 4:59 AM | 2,382 (8.5%) | 724 (3.2%) |
| 5:00 AM to 5:29 AM | 1,883 (6.8%) | 939 (4.1%) |
| 5:30 AM to 5:59 AM | 1,613 (5.8%) | 822 (3.6%) |
| 6:00 AM to 6:29 AM | 2,973 (10.7%) | 1,452 (6.3%) |
| 6:30 AM to 6:59 AM | 3,353 (12.0%) | 2,502 (10.9%) |
| 7:00 AM to 7:29 AM | 3,923 (14.1%) | 3,992 (17.4%) |
| 7:30 AM to 7:59 AM | 2,967 (10.6%) | 3,423 (14.9%) |
| 8:00 AM to 8:29 AM | 1,611 (5.8%) | 2,054 (8.9%) |
| 8:30 AM to 8:59 AM | 724 (2.6%) | 1,179 (5.1%) |
| 9:00 AM to 9:59 AM | 1,009 (3.6%) | 692 (3.0%) |
| 10:00 AM to 10:59 AM | 558 (2.0%) | 792 (3.5%) |
| 11:00 AM to 11:59 AM | 127 (0.5%) | 424 (1.8%) |
| 12:00 PM to 3:59 PM | 2,416 (8.7%) | 2,044 (8.9%) |
| 4:00 PM to 11:59 PM | 2,346 (8.4%) | 1,928 (8.4%) |
| Total | 27,885 (100.0%) | 22,967 (100.0%) |
Housing Occupancy in Wayne County
Occupancy by Ownership in Wayne County
Of the total 46,949 dwellings in Wayne County, owner-occupied units account for 28,798 (61.3%), while renter-occupied units make up 18,151 (38.7%).
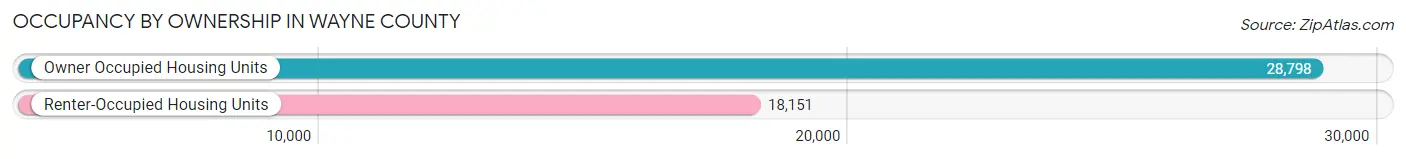
| Occupancy | # Housing Units | % Housing Units |
| Owner Occupied Housing Units | 28,798 | 61.3% |
| Renter-Occupied Housing Units | 18,151 | 38.7% |
| Total Occupied Housing Units | 46,949 | 100.0% |
Occupancy by Household Size in Wayne County
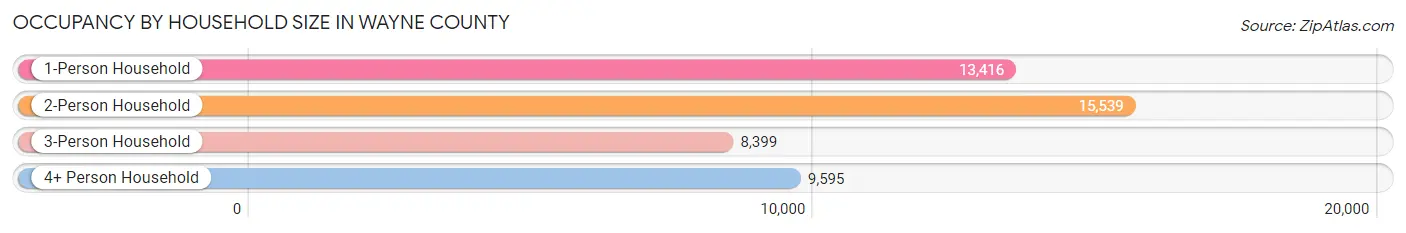
| Household Size | # Housing Units | % Housing Units |
| 1-Person Household | 13,416 | 28.6% |
| 2-Person Household | 15,539 | 33.1% |
| 3-Person Household | 8,399 | 17.9% |
| 4+ Person Household | 9,595 | 20.4% |
| Total Housing Units | 46,949 | 100.0% |
Occupancy by Ownership by Household Size in Wayne County
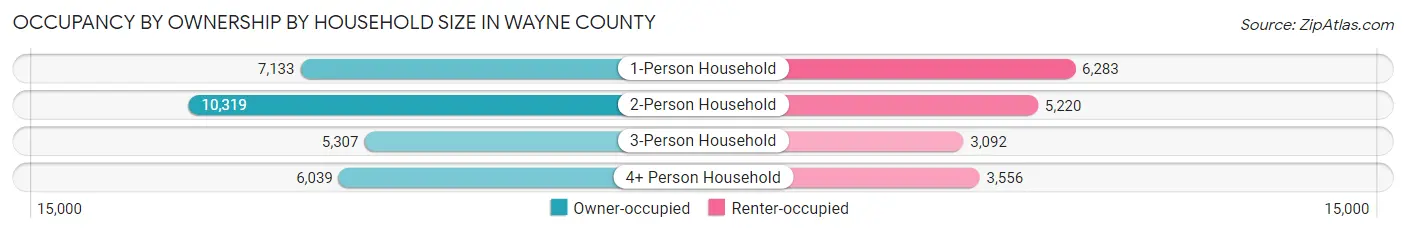
| Household Size | Owner-occupied | Renter-occupied |
| 1-Person Household | 7,133 (53.2%) | 6,283 (46.8%) |
| 2-Person Household | 10,319 (66.4%) | 5,220 (33.6%) |
| 3-Person Household | 5,307 (63.2%) | 3,092 (36.8%) |
| 4+ Person Household | 6,039 (62.9%) | 3,556 (37.1%) |
| Total Housing Units | 28,798 (61.3%) | 18,151 (38.7%) |
Occupancy by Educational Attainment in Wayne County
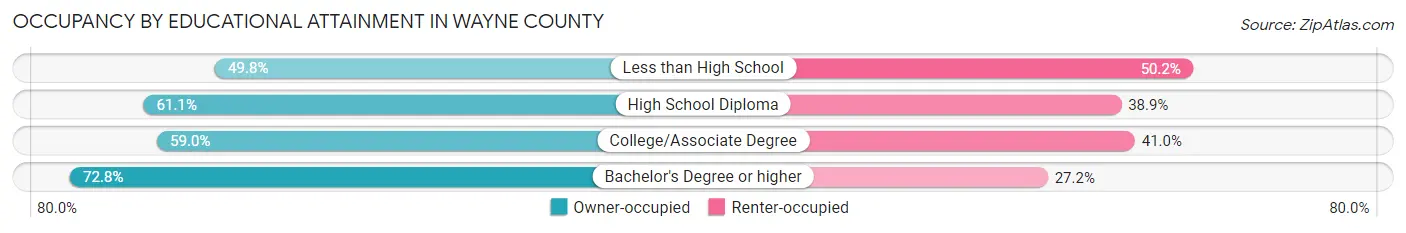
| Household Size | Owner-occupied | Renter-occupied |
| Less than High School | 2,834 (49.8%) | 2,857 (50.2%) |
| High School Diploma | 7,883 (61.1%) | 5,010 (38.9%) |
| College/Associate Degree | 10,956 (59.0%) | 7,620 (41.0%) |
| Bachelor's Degree or higher | 7,125 (72.8%) | 2,664 (27.2%) |
Occupancy by Age of Householder in Wayne County
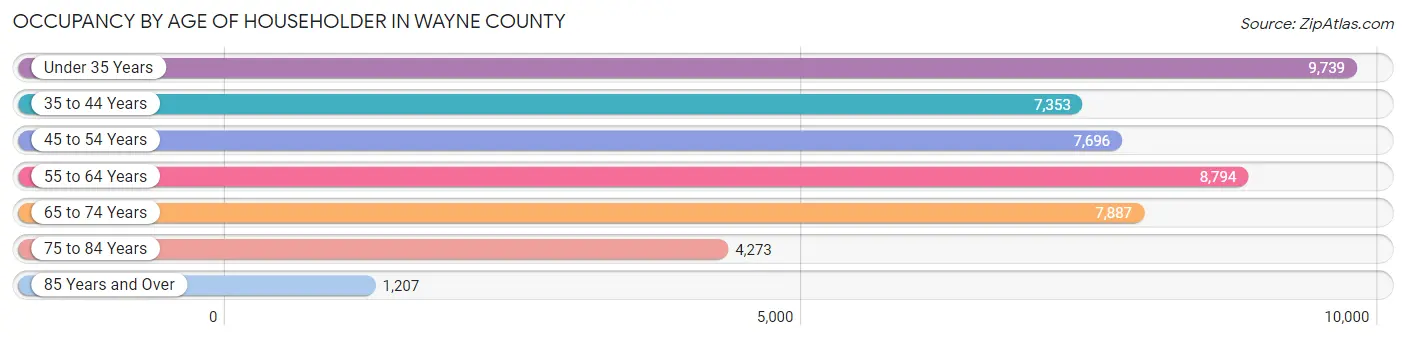
| Age Bracket | # Households | % Households |
| Under 35 Years | 9,739 | 20.7% |
| 35 to 44 Years | 7,353 | 15.7% |
| 45 to 54 Years | 7,696 | 16.4% |
| 55 to 64 Years | 8,794 | 18.7% |
| 65 to 74 Years | 7,887 | 16.8% |
| 75 to 84 Years | 4,273 | 9.1% |
| 85 Years and Over | 1,207 | 2.6% |
| Total | 46,949 | 100.0% |
Housing Finances in Wayne County
Median Income by Occupancy in Wayne County
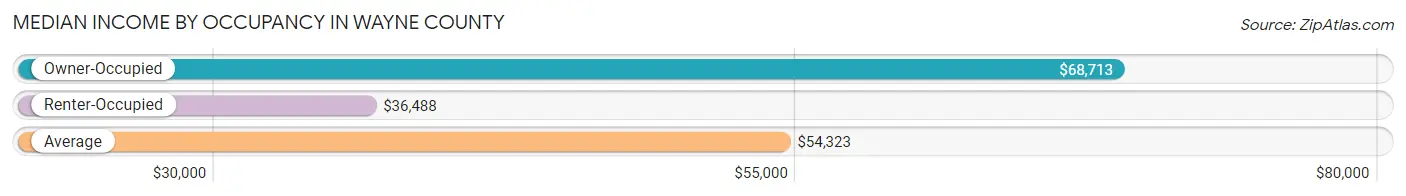
| Occupancy Type | # Households | Median Income |
| Owner-Occupied | 28,798 (61.3%) | $68,713 |
| Renter-Occupied | 18,151 (38.7%) | $36,488 |
| Average | 46,949 (100.0%) | $54,323 |
Occupancy by Householder Income Bracket in Wayne County
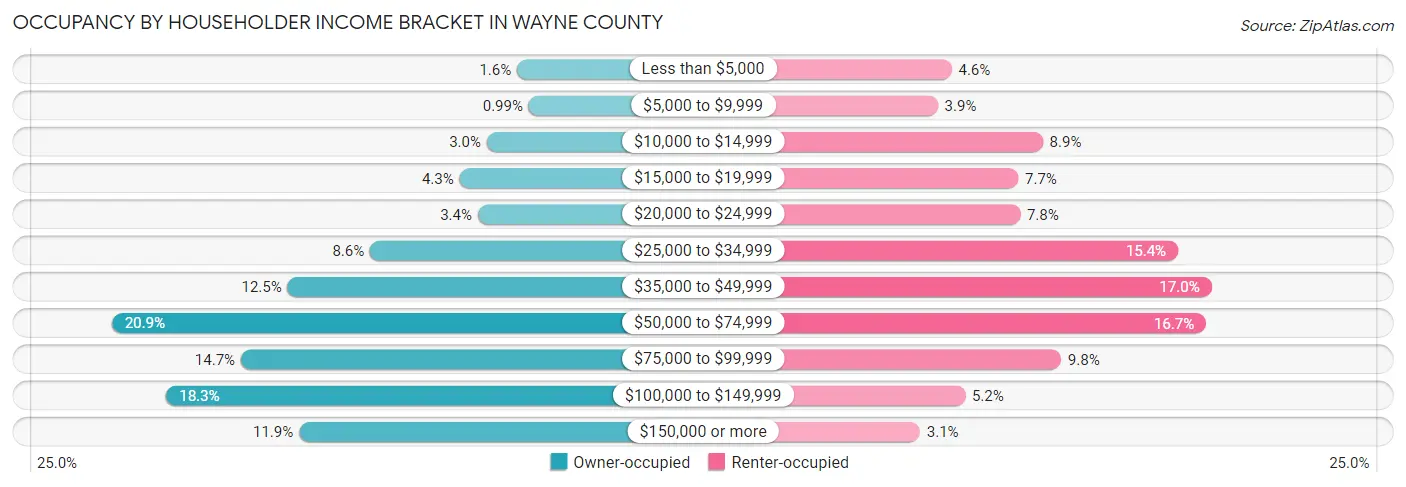
| Income Bracket | Owner-occupied | Renter-occupied |
| Less than $5,000 | 447 (1.5%) | 830 (4.6%) |
| $5,000 to $9,999 | 284 (1.0%) | 709 (3.9%) |
| $10,000 to $14,999 | 860 (3.0%) | 1,618 (8.9%) |
| $15,000 to $19,999 | 1,236 (4.3%) | 1,404 (7.7%) |
| $20,000 to $24,999 | 985 (3.4%) | 1,422 (7.8%) |
| $25,000 to $34,999 | 2,463 (8.6%) | 2,786 (15.3%) |
| $35,000 to $49,999 | 3,594 (12.5%) | 3,076 (17.0%) |
| $50,000 to $74,999 | 6,005 (20.8%) | 3,029 (16.7%) |
| $75,000 to $99,999 | 4,232 (14.7%) | 1,776 (9.8%) |
| $100,000 to $149,999 | 5,256 (18.2%) | 945 (5.2%) |
| $150,000 or more | 3,436 (11.9%) | 556 (3.1%) |
| Total | 28,798 (100.0%) | 18,151 (100.0%) |
Monthly Housing Cost Tiers in Wayne County
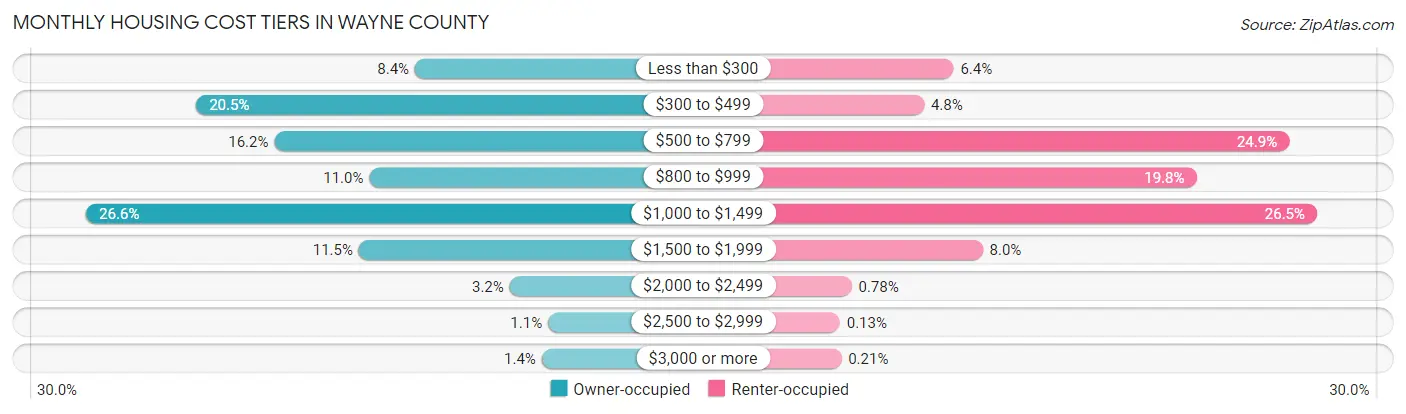
| Monthly Cost | Owner-occupied | Renter-occupied |
| Less than $300 | 2,431 (8.4%) | 1,164 (6.4%) |
| $300 to $499 | 5,909 (20.5%) | 868 (4.8%) |
| $500 to $799 | 4,667 (16.2%) | 4,527 (24.9%) |
| $800 to $999 | 3,155 (11.0%) | 3,597 (19.8%) |
| $1,000 to $1,499 | 7,660 (26.6%) | 4,806 (26.5%) |
| $1,500 to $1,999 | 3,323 (11.5%) | 1,456 (8.0%) |
| $2,000 to $2,499 | 924 (3.2%) | 142 (0.8%) |
| $2,500 to $2,999 | 314 (1.1%) | 23 (0.1%) |
| $3,000 or more | 415 (1.4%) | 38 (0.2%) |
| Total | 28,798 (100.0%) | 18,151 (100.0%) |
Physical Housing Characteristics in Wayne County
Housing Structures in Wayne County
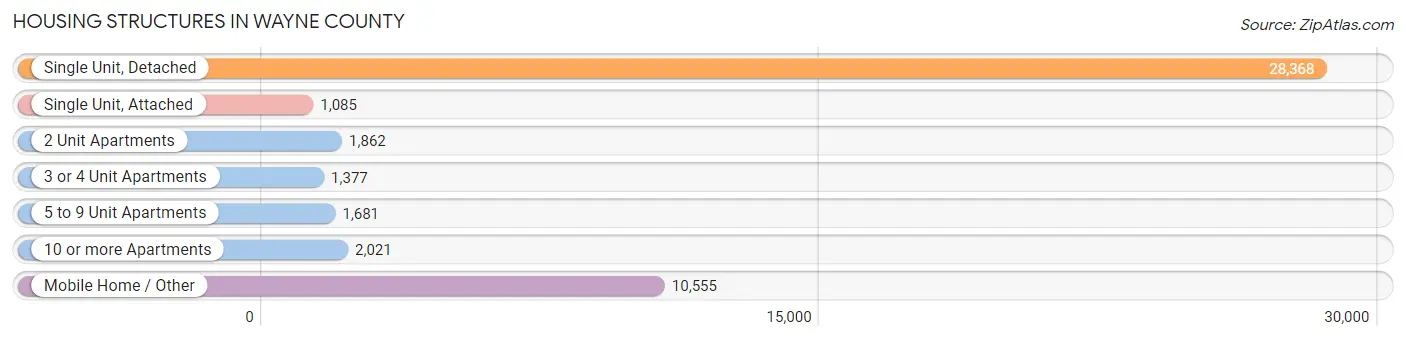
| Structure Type | # Housing Units | % Housing Units |
| Single Unit, Detached | 28,368 | 60.4% |
| Single Unit, Attached | 1,085 | 2.3% |
| 2 Unit Apartments | 1,862 | 4.0% |
| 3 or 4 Unit Apartments | 1,377 | 2.9% |
| 5 to 9 Unit Apartments | 1,681 | 3.6% |
| 10 or more Apartments | 2,021 | 4.3% |
| Mobile Home / Other | 10,555 | 22.5% |
| Total | 46,949 | 100.0% |
Housing Structures by Occupancy in Wayne County
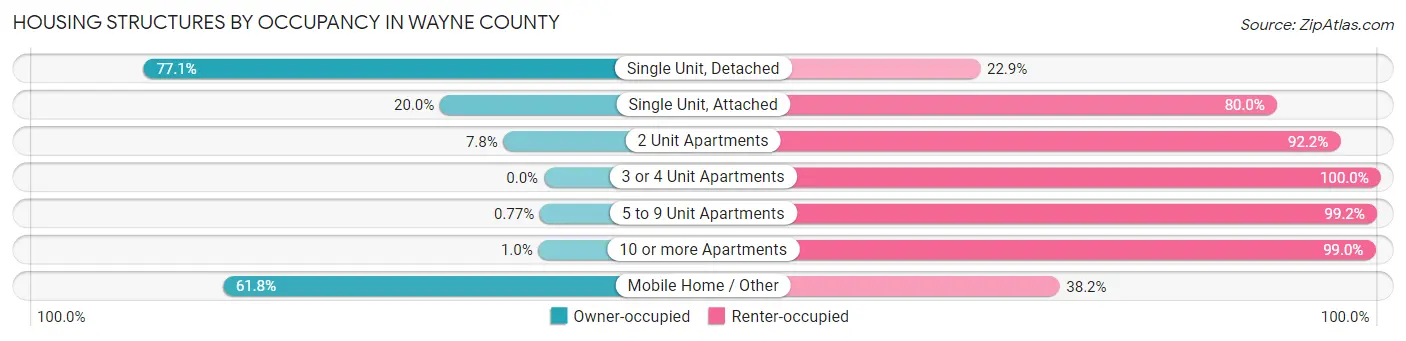
| Structure Type | Owner-occupied | Renter-occupied |
| Single Unit, Detached | 21,875 (77.1%) | 6,493 (22.9%) |
| Single Unit, Attached | 217 (20.0%) | 868 (80.0%) |
| 2 Unit Apartments | 145 (7.8%) | 1,717 (92.2%) |
| 3 or 4 Unit Apartments | 0 (0.0%) | 1,377 (100.0%) |
| 5 to 9 Unit Apartments | 13 (0.8%) | 1,668 (99.2%) |
| 10 or more Apartments | 21 (1.0%) | 2,000 (99.0%) |
| Mobile Home / Other | 6,527 (61.8%) | 4,028 (38.2%) |
| Total | 28,798 (61.3%) | 18,151 (38.7%) |
Housing Structures by Number of Rooms in Wayne County
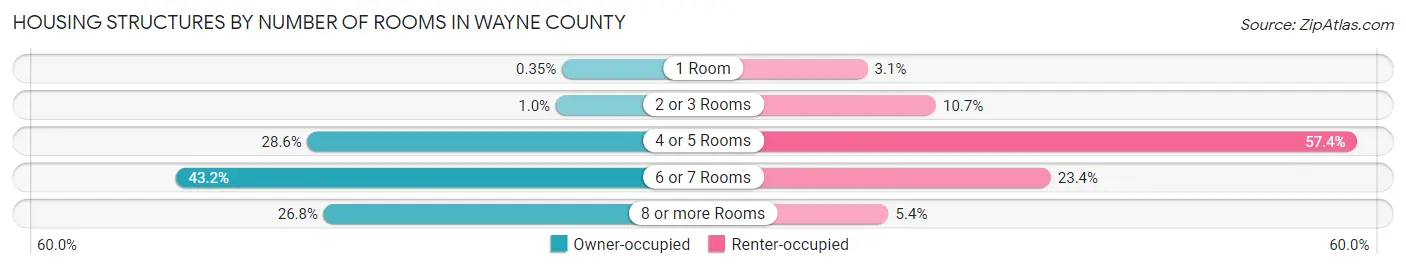
| Number of Rooms | Owner-occupied | Renter-occupied |
| 1 Room | 100 (0.4%) | 559 (3.1%) |
| 2 or 3 Rooms | 298 (1.0%) | 1,936 (10.7%) |
| 4 or 5 Rooms | 8,234 (28.6%) | 10,424 (57.4%) |
| 6 or 7 Rooms | 12,450 (43.2%) | 4,250 (23.4%) |
| 8 or more Rooms | 7,716 (26.8%) | 982 (5.4%) |
| Total | 28,798 (100.0%) | 18,151 (100.0%) |
Housing Structure by Heating Type in Wayne County
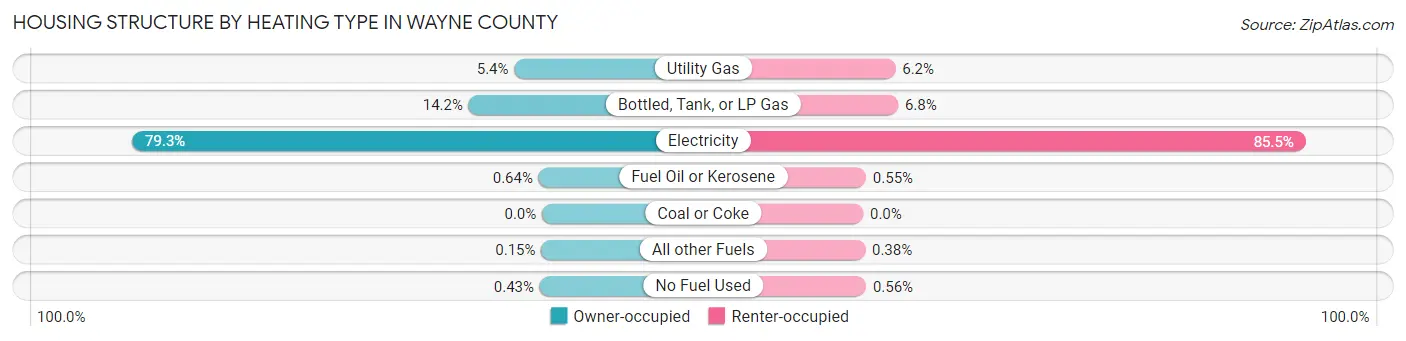
| Heating Type | Owner-occupied | Renter-occupied |
| Utility Gas | 1,544 (5.4%) | 1,131 (6.2%) |
| Bottled, Tank, or LP Gas | 4,081 (14.2%) | 1,225 (6.8%) |
| Electricity | 22,825 (79.3%) | 15,524 (85.5%) |
| Fuel Oil or Kerosene | 183 (0.6%) | 100 (0.5%) |
| Coal or Coke | 0 (0.0%) | 0 (0.0%) |
| All other Fuels | 42 (0.2%) | 69 (0.4%) |
| No Fuel Used | 123 (0.4%) | 102 (0.6%) |
| Total | 28,798 (100.0%) | 18,151 (100.0%) |
Household Vehicle Usage in Wayne County
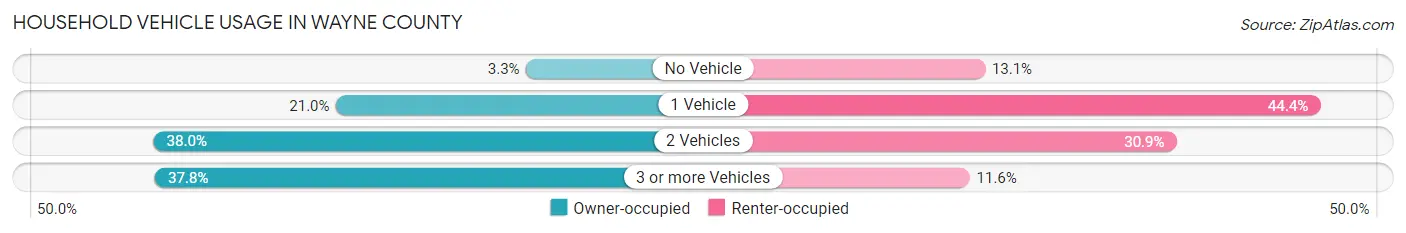
| Vehicles per Household | Owner-occupied | Renter-occupied |
| No Vehicle | 935 (3.3%) | 2,372 (13.1%) |
| 1 Vehicle | 6,045 (21.0%) | 8,051 (44.4%) |
| 2 Vehicles | 10,928 (38.0%) | 5,615 (30.9%) |
| 3 or more Vehicles | 10,890 (37.8%) | 2,113 (11.6%) |
| Total | 28,798 (100.0%) | 18,151 (100.0%) |
Real Estate & Mortgages in Wayne County
Real Estate and Mortgage Overview in Wayne County
| Characteristic | Without Mortgage | With Mortgage |
| Housing Units | 12,478 | 16,320 |
| Median Property Value | $116,100 | $170,100 |
| Median Household Income | $53,477 | $2,379 |
| Monthly Housing Costs | $442 | $377 |
| Real Estate Taxes | $928 | $397 |
Property Value by Mortgage Status in Wayne County
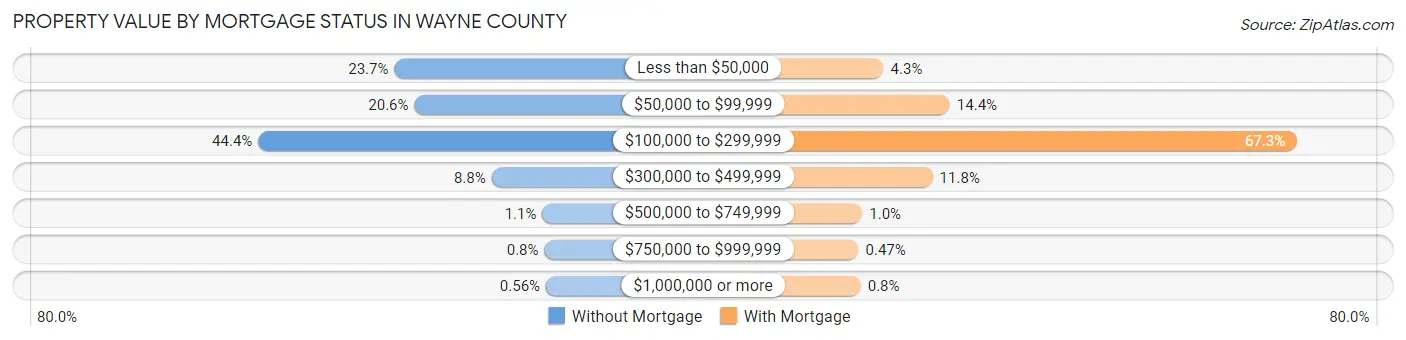
| Property Value | Without Mortgage | With Mortgage |
| Less than $50,000 | 2,953 (23.7%) | 699 (4.3%) |
| $50,000 to $99,999 | 2,572 (20.6%) | 2,347 (14.4%) |
| $100,000 to $299,999 | 5,541 (44.4%) | 10,978 (67.3%) |
| $300,000 to $499,999 | 1,103 (8.8%) | 1,918 (11.7%) |
| $500,000 to $749,999 | 139 (1.1%) | 170 (1.0%) |
| $750,000 to $999,999 | 100 (0.8%) | 77 (0.5%) |
| $1,000,000 or more | 70 (0.6%) | 131 (0.8%) |
| Total | 12,478 (100.0%) | 16,320 (100.0%) |
Household Income by Mortgage Status in Wayne County
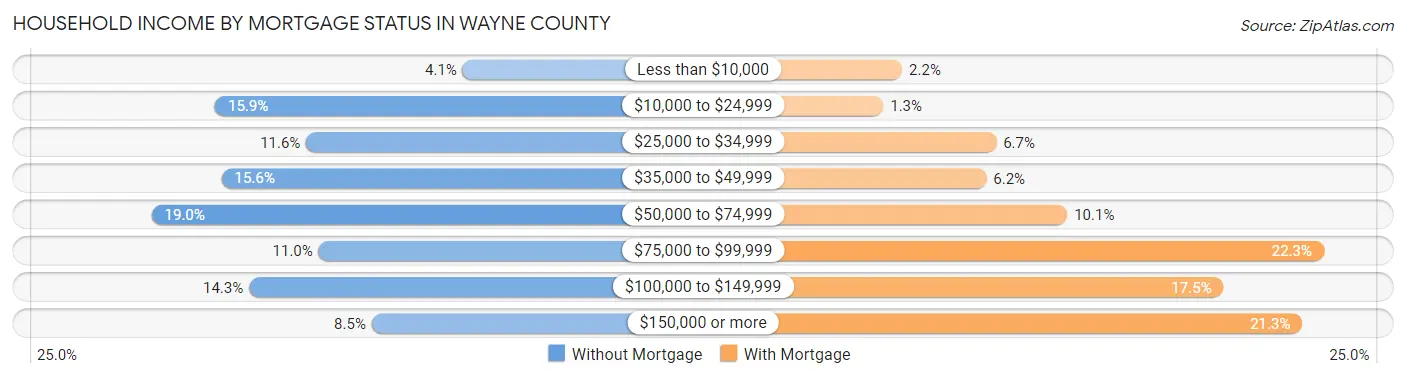
| Household Income | Without Mortgage | With Mortgage |
| Less than $10,000 | 516 (4.1%) | 362 (2.2%) |
| $10,000 to $24,999 | 1,988 (15.9%) | 215 (1.3%) |
| $25,000 to $34,999 | 1,446 (11.6%) | 1,093 (6.7%) |
| $35,000 to $49,999 | 1,949 (15.6%) | 1,017 (6.2%) |
| $50,000 to $74,999 | 2,365 (19.0%) | 1,645 (10.1%) |
| $75,000 to $99,999 | 1,372 (11.0%) | 3,640 (22.3%) |
| $100,000 to $149,999 | 1,785 (14.3%) | 2,860 (17.5%) |
| $150,000 or more | 1,057 (8.5%) | 3,471 (21.3%) |
| Total | 12,478 (100.0%) | 16,320 (100.0%) |
Property Value to Household Income Ratio in Wayne County
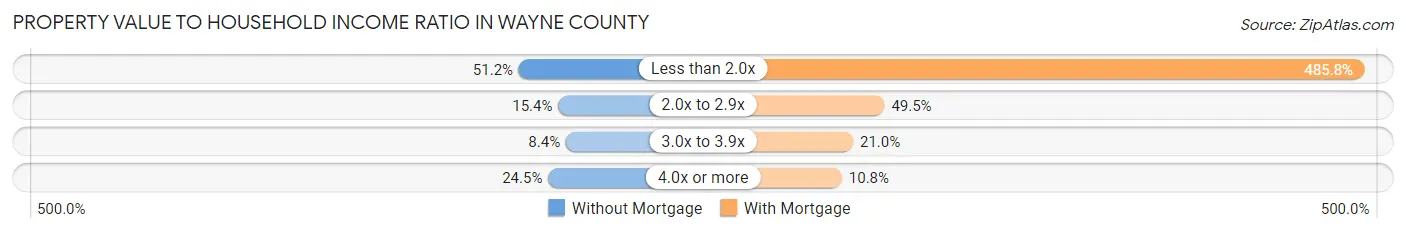
| Value-to-Income Ratio | Without Mortgage | With Mortgage |
| Less than 2.0x | 6,383 (51.1%) | 79,282 (485.8%) |
| 2.0x to 2.9x | 1,920 (15.4%) | 8,082 (49.5%) |
| 3.0x to 3.9x | 1,047 (8.4%) | 3,429 (21.0%) |
| 4.0x or more | 3,057 (24.5%) | 1,768 (10.8%) |
| Total | 12,478 (100.0%) | 16,320 (100.0%) |
Real Estate Taxes by Mortgage Status in Wayne County
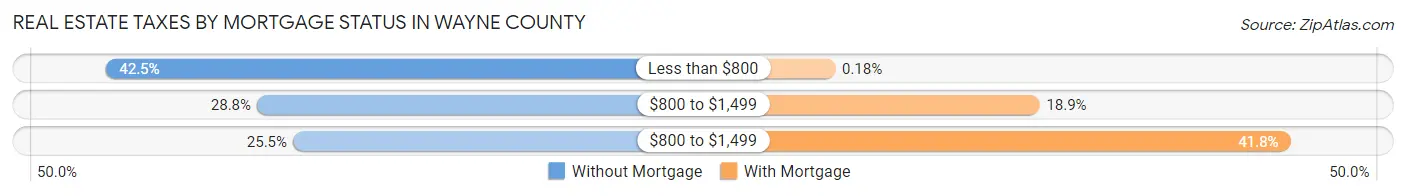
| Property Taxes | Without Mortgage | With Mortgage |
| Less than $800 | 5,307 (42.5%) | 30 (0.2%) |
| $800 to $1,499 | 3,593 (28.8%) | 3,076 (18.9%) |
| $800 to $1,499 | 3,182 (25.5%) | 6,817 (41.8%) |
| Total | 12,478 (100.0%) | 16,320 (100.0%) |
Health & Disability in Wayne County
Health Insurance Coverage by Age in Wayne County
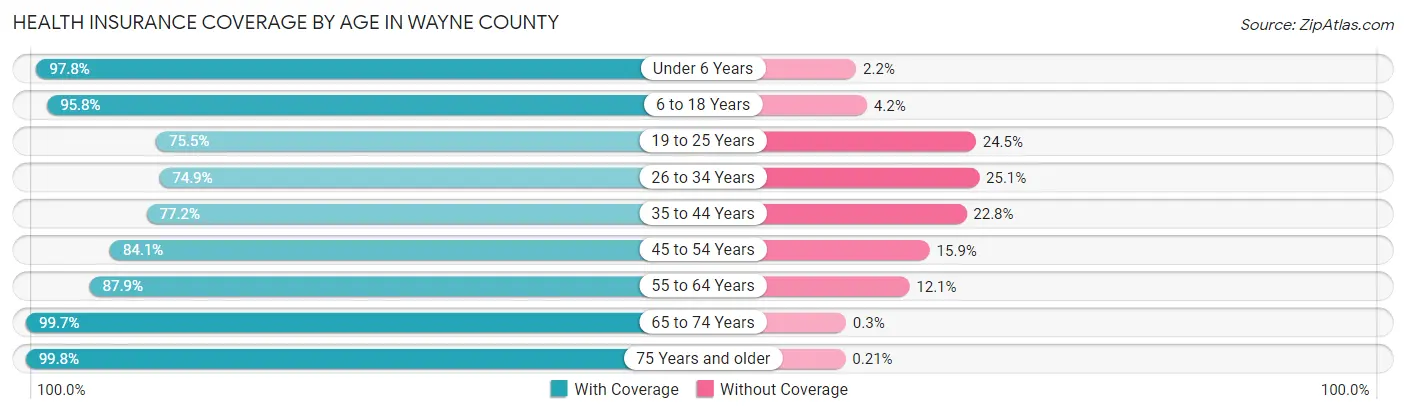
| Age Bracket | With Coverage | Without Coverage |
| Under 6 Years | 8,675 (97.8%) | 196 (2.2%) |
| 6 to 18 Years | 19,289 (95.8%) | 850 (4.2%) |
| 19 to 25 Years | 7,636 (75.5%) | 2,480 (24.5%) |
| 26 to 34 Years | 9,465 (74.9%) | 3,179 (25.1%) |
| 35 to 44 Years | 9,834 (77.2%) | 2,897 (22.8%) |
| 45 to 54 Years | 11,622 (84.1%) | 2,200 (15.9%) |
| 55 to 64 Years | 13,227 (87.9%) | 1,826 (12.1%) |
| 65 to 74 Years | 11,543 (99.7%) | 35 (0.3%) |
| 75 Years and older | 7,581 (99.8%) | 16 (0.2%) |
| Total | 98,872 (87.8%) | 13,679 (12.1%) |
Health Insurance Coverage by Citizenship Status in Wayne County
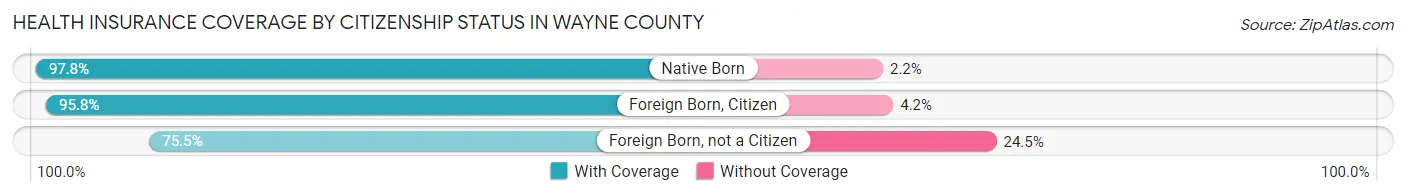
| Citizenship Status | With Coverage | Without Coverage |
| Native Born | 8,675 (97.8%) | 196 (2.2%) |
| Foreign Born, Citizen | 19,289 (95.8%) | 850 (4.2%) |
| Foreign Born, not a Citizen | 7,636 (75.5%) | 2,480 (24.5%) |
Health Insurance Coverage by Household Income in Wayne County
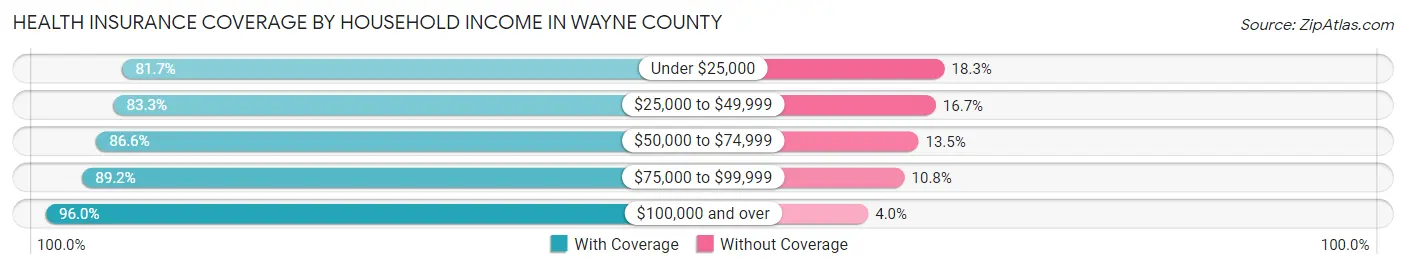
| Household Income | With Coverage | Without Coverage |
| Under $25,000 | 15,389 (81.7%) | 3,457 (18.3%) |
| $25,000 to $49,999 | 21,449 (83.3%) | 4,298 (16.7%) |
| $50,000 to $74,999 | 17,866 (86.6%) | 2,777 (13.5%) |
| $75,000 to $99,999 | 14,932 (89.2%) | 1,814 (10.8%) |
| $100,000 and over | 28,515 (96.0%) | 1,197 (4.0%) |
Public vs Private Health Insurance Coverage by Age in Wayne County
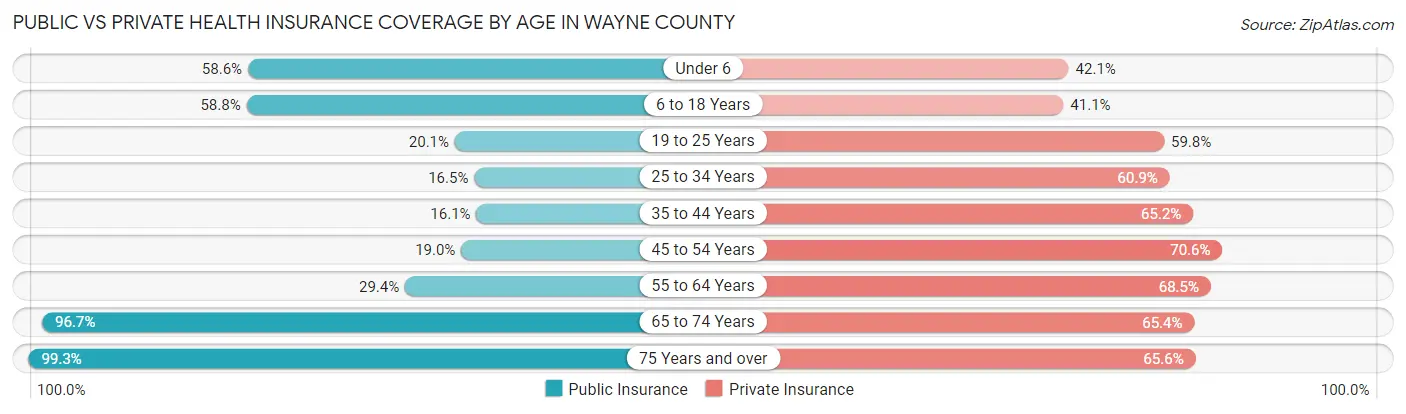
| Age Bracket | Public Insurance | Private Insurance |
| Under 6 | 5,194 (58.6%) | 3,736 (42.1%) |
| 6 to 18 Years | 11,844 (58.8%) | 8,283 (41.1%) |
| 19 to 25 Years | 2,037 (20.1%) | 6,050 (59.8%) |
| 25 to 34 Years | 2,091 (16.5%) | 7,694 (60.9%) |
| 35 to 44 Years | 2,055 (16.1%) | 8,302 (65.2%) |
| 45 to 54 Years | 2,621 (19.0%) | 9,761 (70.6%) |
| 55 to 64 Years | 4,424 (29.4%) | 10,309 (68.5%) |
| 65 to 74 Years | 11,201 (96.7%) | 7,574 (65.4%) |
| 75 Years and over | 7,542 (99.3%) | 4,987 (65.6%) |
| Total | 49,009 (43.5%) | 66,696 (59.3%) |
Disability Status by Sex by Age in Wayne County
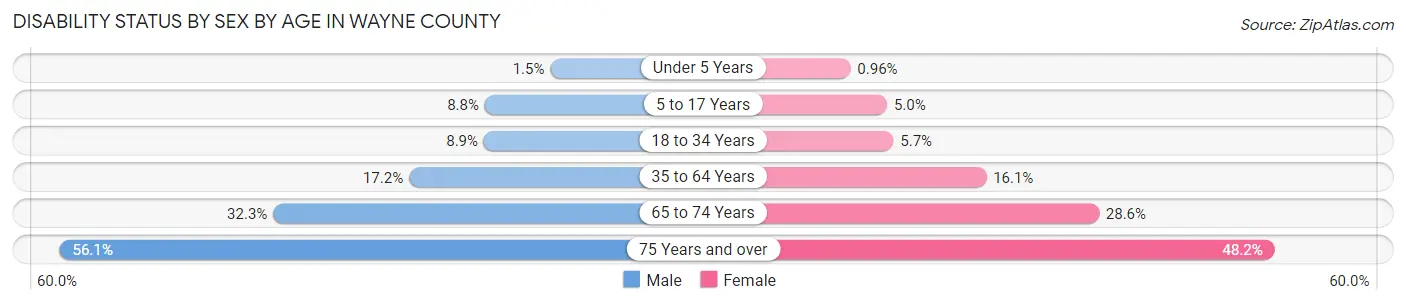
| Age Bracket | Male | Female |
| Under 5 Years | 55 (1.5%) | 35 (1.0%) |
| 5 to 17 Years | 897 (8.7%) | 495 (5.0%) |
| 18 to 34 Years | 1,063 (8.8%) | 702 (5.7%) |
| 35 to 64 Years | 3,460 (17.2%) | 3,454 (16.1%) |
| 65 to 74 Years | 1,736 (32.3%) | 1,777 (28.6%) |
| 75 Years and over | 1,665 (56.1%) | 2,231 (48.2%) |
Disability Class by Sex by Age in Wayne County
Disability Class: Hearing Difficulty
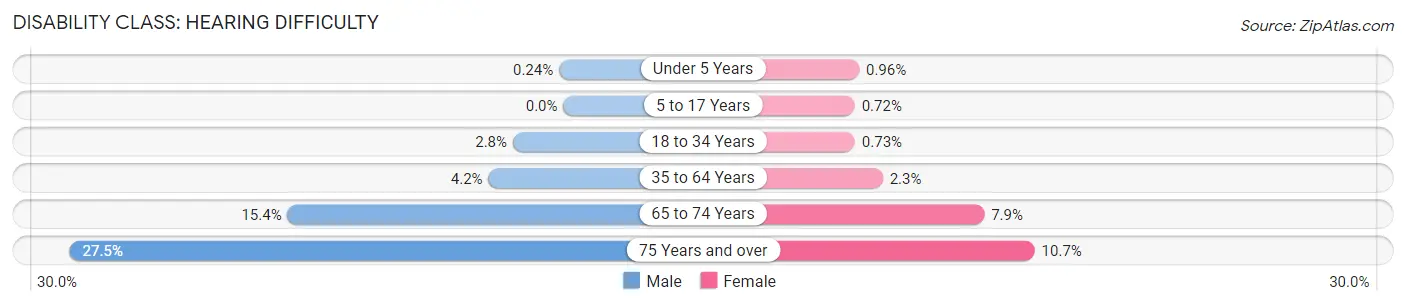
| Age Bracket | Male | Female |
| Under 5 Years | 9 (0.2%) | 35 (1.0%) |
| 5 to 17 Years | 0 (0.0%) | 71 (0.7%) |
| 18 to 34 Years | 338 (2.8%) | 89 (0.7%) |
| 35 to 64 Years | 840 (4.2%) | 489 (2.3%) |
| 65 to 74 Years | 825 (15.4%) | 492 (7.9%) |
| 75 Years and over | 816 (27.5%) | 497 (10.7%) |
Disability Class: Vision Difficulty
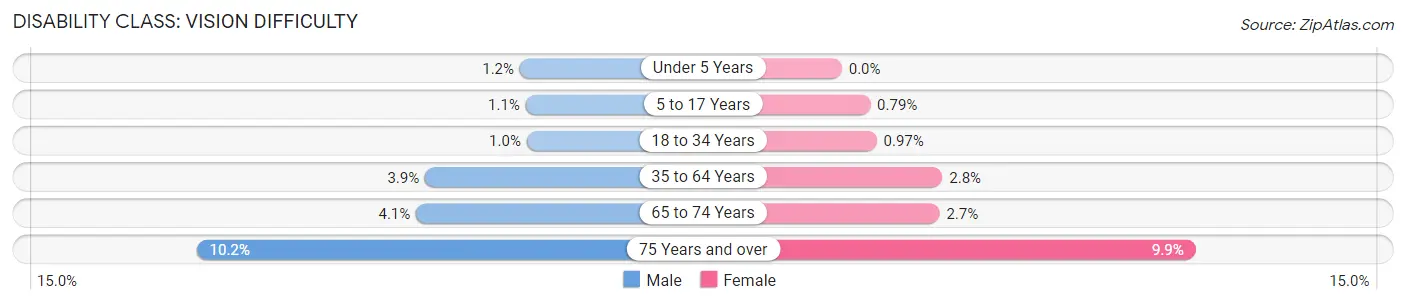
| Age Bracket | Male | Female |
| Under 5 Years | 46 (1.2%) | 0 (0.0%) |
| 5 to 17 Years | 108 (1.1%) | 78 (0.8%) |
| 18 to 34 Years | 122 (1.0%) | 118 (1.0%) |
| 35 to 64 Years | 775 (3.8%) | 601 (2.8%) |
| 65 to 74 Years | 220 (4.1%) | 169 (2.7%) |
| 75 Years and over | 303 (10.2%) | 456 (9.9%) |
Disability Class: Cognitive Difficulty
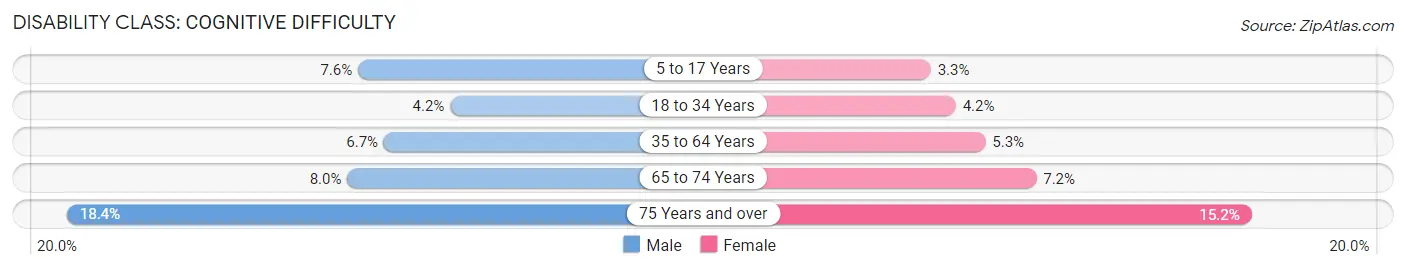
| Age Bracket | Male | Female |
| 5 to 17 Years | 782 (7.6%) | 325 (3.3%) |
| 18 to 34 Years | 505 (4.2%) | 517 (4.2%) |
| 35 to 64 Years | 1,341 (6.7%) | 1,144 (5.3%) |
| 65 to 74 Years | 431 (8.0%) | 448 (7.2%) |
| 75 Years and over | 547 (18.4%) | 704 (15.2%) |
Disability Class: Ambulatory Difficulty
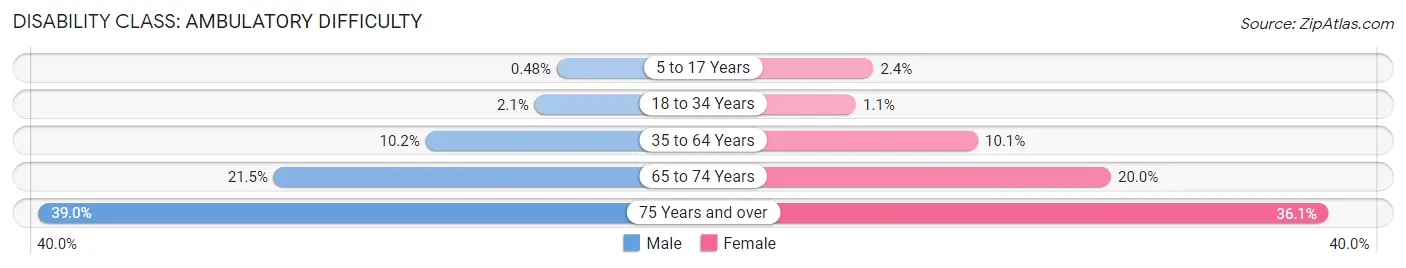
| Age Bracket | Male | Female |
| 5 to 17 Years | 49 (0.5%) | 231 (2.4%) |
| 18 to 34 Years | 257 (2.1%) | 129 (1.1%) |
| 35 to 64 Years | 2,059 (10.2%) | 2,173 (10.1%) |
| 65 to 74 Years | 1,155 (21.5%) | 1,241 (20.0%) |
| 75 Years and over | 1,157 (39.0%) | 1,673 (36.1%) |
Disability Class: Self-Care Difficulty
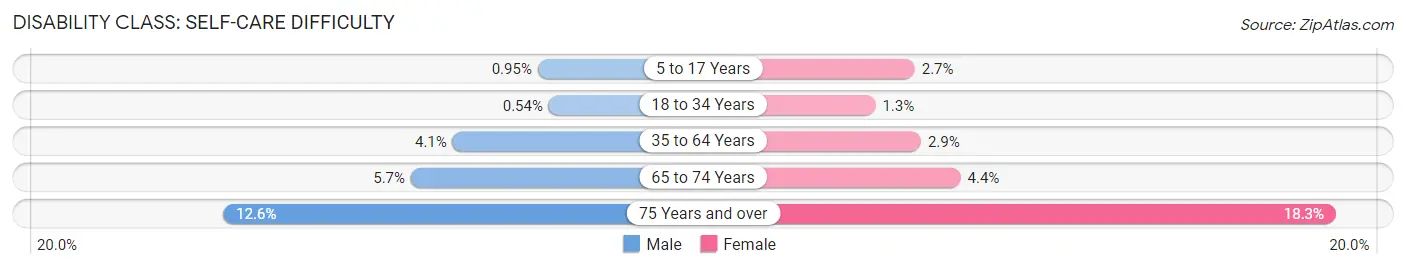
| Age Bracket | Male | Female |
| 5 to 17 Years | 97 (0.9%) | 267 (2.7%) |
| 18 to 34 Years | 65 (0.5%) | 153 (1.3%) |
| 35 to 64 Years | 828 (4.1%) | 632 (2.9%) |
| 65 to 74 Years | 304 (5.7%) | 274 (4.4%) |
| 75 Years and over | 375 (12.6%) | 849 (18.3%) |
Technology Access in Wayne County
Computing Device Access in Wayne County
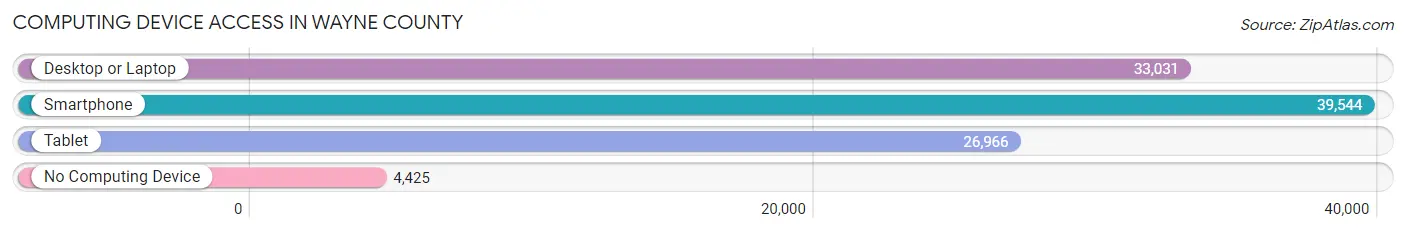
| Device Type | # Households | % Households |
| Desktop or Laptop | 33,031 | 70.4% |
| Smartphone | 39,544 | 84.2% |
| Tablet | 26,966 | 57.4% |
| No Computing Device | 4,425 | 9.4% |
| Total | 46,949 | 100.0% |
Internet Access in Wayne County
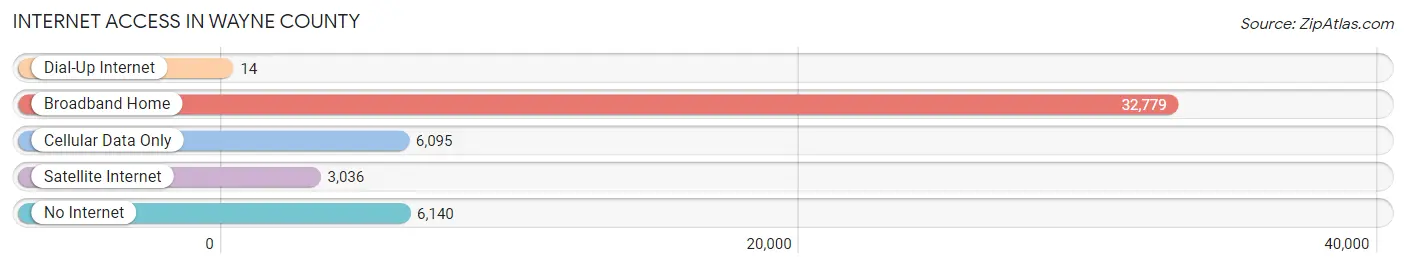
| Internet Type | # Households | % Households |
| Dial-Up Internet | 14 | 0.0% |
| Broadband Home | 32,779 | 69.8% |
| Cellular Data Only | 6,095 | 13.0% |
| Satellite Internet | 3,036 | 6.5% |
| No Internet | 6,140 | 13.1% |
| Total | 46,949 | 100.0% |
Wayne County Summary
Wayne County is located in the eastern part of North Carolina, and is part of the Goldsboro Metropolitan Statistical Area. The county was formed in 1779 from the eastern part of Dobbs County. It is named for General “Mad” Anthony Wayne, a Revolutionary War hero. The county seat is Goldsboro, which is also the largest city in the county.
Geography
Wayne County is located in the Coastal Plain region of North Carolina. It is bordered by Johnston County to the north, Wilson County to the east, Greene County to the south, and Duplin County to the west. The county covers an area of 545 square miles, with approximately 441 square miles of land and 104 square miles of water. The Neuse River forms the northern border of the county, and the Little River forms the eastern border. The county is mostly flat, with some rolling hills in the western part. The highest point in the county is located in the western part, at an elevation of 140 feet.
The county is home to several state parks, including Cliffs of the Neuse State Park, which is located along the Neuse River. The park features a variety of outdoor activities, including camping, fishing, hiking, and canoeing. Other parks in the county include the Wayne County Recreational Park, which offers a variety of sports fields and courts, and the Wayne County Nature Preserve, which is home to a variety of wildlife.
Economy
Wayne County’s economy is largely based on agriculture and manufacturing. The county is home to several large agricultural operations, including hog farms, poultry farms, and vegetable farms. The county is also home to several large manufacturing companies, including Wayne Farms, a poultry processing plant, and Smithfield Foods, a pork processing plant.
The county is also home to several military installations, including Seymour Johnson Air Force Base and Camp Lejeune Marine Corps Base. These installations provide a significant economic boost to the county, as they employ thousands of people and generate millions of dollars in revenue.
Demographics
As of the 2010 census, Wayne County had a population of 122,623. The population was 53.2% White, 37.7% African American, 0.5% Native American, 1.7% Asian, 0.1% Pacific Islander, and 5.8% from two or more races. The median household income was $41,945, and the median family income was $50,945. The per capita income was $20,945.
Conclusion
Wayne County is a rural county located in the eastern part of North Carolina. The county is home to several large agricultural and manufacturing operations, as well as several military installations. The county has a diverse population, with a median household income of $41,945. The county is home to several state parks, which provide a variety of outdoor activities for residents and visitors alike.
Common Questions
What is the Total Population of Wayne County?
Total Population of Wayne County is 117,480.
What is the Total Male Population of Wayne County?
Total Male Population of Wayne County is 58,498.
What is the Total Female Population of Wayne County?
Total Female Population of Wayne County is 58,982.
What is the Ratio of Males per 100 Females in Wayne County?
There are 99.18 Males per 100 Females in Wayne County.
What is the Ratio of Females per 100 Males in Wayne County?
There are 100.83 Females per 100 Males in Wayne County.
What is the Median Population Age in Wayne County?
Median Population Age in Wayne County is 37.5 Years.
What is the Average Family Size in Wayne County
Average Family Size in Wayne County is 3.0 People.
What is the Average Household Size in Wayne County
Average Household Size in Wayne County is 2.4 People.
What is Per Capita Income in Wayne County?
Per Capita income in Wayne County is $30,540.
What is the Median Family Income in Wayne County?
Median Family Income in Wayne County is $67,681.
What is the Median Household income in Wayne County?
Median Household Income in Wayne County is $54,323.
What is Income or Wage Gap in Wayne County?
Income or Wage Gap in Wayne County is 30.2%.
Women in Wayne County earn 69.8 cents for every dollar earned by a man.
What is Family Income Deficit in Wayne County?
Family Income Deficit in Wayne County is $10,955.
Families that are below poverty line in Wayne County earn $10,955 less on average than the poverty threshold level.
What is Inequality or Gini Index in Wayne County?
Inequality or Gini Index in Wayne County is 0.47.
How Large is the Labor Force in Wayne County?
There are 56,643 People in the Labor Forcein in Wayne County.
What is the Percentage of People in the Labor Force in Wayne County?
60.9% of People are in the Labor Force in Wayne County.
What is the Unemployment Rate in Wayne County?
Unemployment Rate in Wayne County is 5.0%.