Watauga County, NC
Watauga County Map
Watauga County Overview
54,540
TOTAL POPULATION
27,205
MALE POPULATION
27,335
FEMALE POPULATION
99.52
MALES / 100 FEMALES
100.48
FEMALES / 100 MALES
32.1
MEDIAN AGE
2.8
AVG FAMILY SIZE
2.3
AVG HOUSEHOLD SIZE
$30,807
PER CAPITA INCOME
$85,689
AVG FAMILY INCOME
$50,034
AVG HOUSEHOLD INCOME
28.2%
WAGE / INCOME GAP [ % ]
71.8¢/ $1
WAGE / INCOME GAP [ $ ]
$7,299
FAMILY INCOME DEFICIT
0.51
INEQUALITY / GINI INDEX
29,166
LABOR FORCE [ PEOPLE ]
59.8%
PERCENT IN LABOR FORCE
9.3%
UNEMPLOYMENT RATE
Watauga County Area Codes
Race in Watauga County
The most populous races in Watauga County are White / Caucasian (50,349 | 92.3%), Hispanic or Latino (2,165 | 4.0%), and Two or more Races (1,737 | 3.2%).
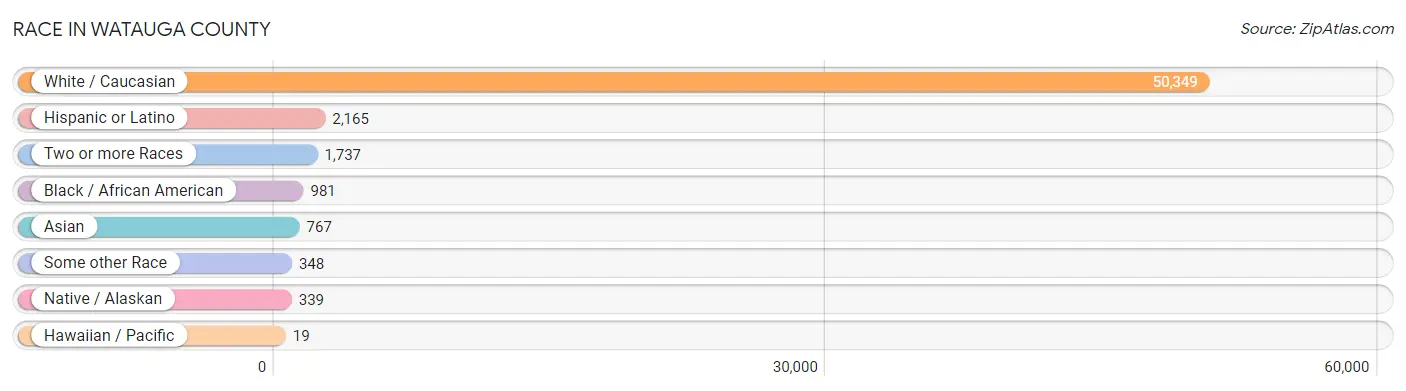
| Race | # Population | % Population |
| Asian | 767 | 1.4% |
| Black / African American | 981 | 1.8% |
| Hawaiian / Pacific | 19 | 0.0% |
| Hispanic or Latino | 2,165 | 4.0% |
| Native / Alaskan | 339 | 0.6% |
| White / Caucasian | 50,349 | 92.3% |
| Two or more Races | 1,737 | 3.2% |
| Some other Race | 348 | 0.6% |
| Total | 54,540 | 100.0% |
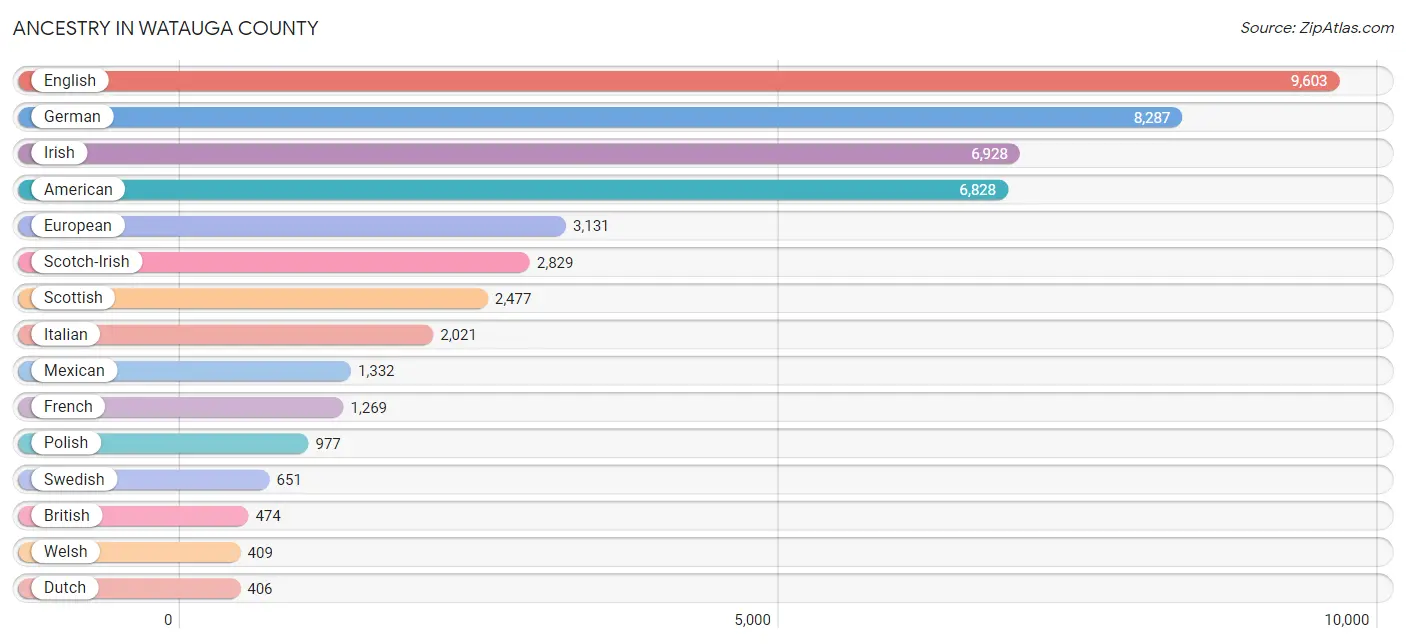
Ancestry in Watauga County
The most populous ancestries reported in Watauga County are English (9,603 | 17.6%), German (8,287 | 15.2%), Irish (6,928 | 12.7%), American (6,828 | 12.5%), and European (3,131 | 5.7%), together accounting for 63.8% of all Watauga County residents.
| Ancestry | # Population | % Population |
| African | 315 | 0.6% |
| American | 6,828 | 12.5% |
| Arab | 109 | 0.2% |
| Argentinean | 2 | 0.0% |
| Armenian | 1 | 0.0% |
| Australian | 26 | 0.1% |
| Austrian | 149 | 0.3% |
| Bangladeshi | 22 | 0.0% |
| Belgian | 28 | 0.1% |
| Bhutanese | 27 | 0.1% |
| Bolivian | 20 | 0.0% |
| Brazilian | 25 | 0.1% |
| British | 474 | 0.9% |
| British West Indian | 23 | 0.0% |
| Bulgarian | 54 | 0.1% |
| Burmese | 230 | 0.4% |
| Canadian | 158 | 0.3% |
| Celtic | 54 | 0.1% |
| Central American | 98 | 0.2% |
| Central American Indian | 54 | 0.1% |
| Cherokee | 112 | 0.2% |
| Chickasaw | 6 | 0.0% |
| Chilean | 69 | 0.1% |
| Choctaw | 10 | 0.0% |
| Colombian | 95 | 0.2% |
| Costa Rican | 4 | 0.0% |
| Croatian | 33 | 0.1% |
| Cuban | 122 | 0.2% |
| Czech | 109 | 0.2% |
| Czechoslovakian | 17 | 0.0% |
| Danish | 100 | 0.2% |
| Dominican | 22 | 0.0% |
| Dutch | 406 | 0.7% |
| Eastern European | 110 | 0.2% |
| English | 9,603 | 17.6% |
| European | 3,131 | 5.7% |
| Finnish | 76 | 0.1% |
| French | 1,269 | 2.3% |
| French American Indian | 2 | 0.0% |
| French Canadian | 233 | 0.4% |
| German | 8,287 | 15.2% |
| Greek | 65 | 0.1% |
| Guatemalan | 1 | 0.0% |
| Honduran | 59 | 0.1% |
| Hungarian | 221 | 0.4% |
| Indian (Asian) | 190 | 0.4% |
| Indonesian | 46 | 0.1% |
| Irish | 6,928 | 12.7% |
| Iroquois | 9 | 0.0% |
| Italian | 2,021 | 3.7% |
| Jamaican | 46 | 0.1% |
| Kenyan | 15 | 0.0% |
| Kiowa | 5 | 0.0% |
| Korean | 92 | 0.2% |
| Laotian | 9 | 0.0% |
| Latvian | 19 | 0.0% |
| Lebanese | 4 | 0.0% |
| Lithuanian | 104 | 0.2% |
| Lumbee | 57 | 0.1% |
| Mexican | 1,332 | 2.4% |
| Mexican American Indian | 168 | 0.3% |
| Native Hawaiian | 34 | 0.1% |
| Navajo | 3 | 0.0% |
| Nicaraguan | 8 | 0.0% |
| Nigerian | 5 | 0.0% |
| Northern European | 166 | 0.3% |
| Norwegian | 373 | 0.7% |
| Pakistani | 37 | 0.1% |
| Panamanian | 14 | 0.0% |
| Pennsylvania German | 75 | 0.1% |
| Peruvian | 15 | 0.0% |
| Polish | 977 | 1.8% |
| Portuguese | 43 | 0.1% |
| Puerto Rican | 259 | 0.5% |
| Romanian | 30 | 0.1% |
| Russian | 348 | 0.6% |
| Salvadoran | 12 | 0.0% |
| Scandinavian | 281 | 0.5% |
| Scotch-Irish | 2,829 | 5.2% |
| Scottish | 2,477 | 4.5% |
| Serbian | 7 | 0.0% |
| Slavic | 25 | 0.1% |
| Slovak | 18 | 0.0% |
| Slovene | 11 | 0.0% |
| South American | 204 | 0.4% |
| Spaniard | 62 | 0.1% |
| Spanish | 12 | 0.0% |
| Sri Lankan | 188 | 0.3% |
| Subsaharan African | 358 | 0.7% |
| Swedish | 651 | 1.2% |
| Swiss | 143 | 0.3% |
| Syrian | 19 | 0.0% |
| Thai | 40 | 0.1% |
| Trinidadian and Tobagonian | 14 | 0.0% |
| Turkish | 25 | 0.1% |
| Ukrainian | 349 | 0.6% |
| Venezuelan | 3 | 0.0% |
| Welsh | 409 | 0.7% |
| West Indian | 27 | 0.1% |
| Yugoslavian | 4 | 0.0% | View All 100 Rows |
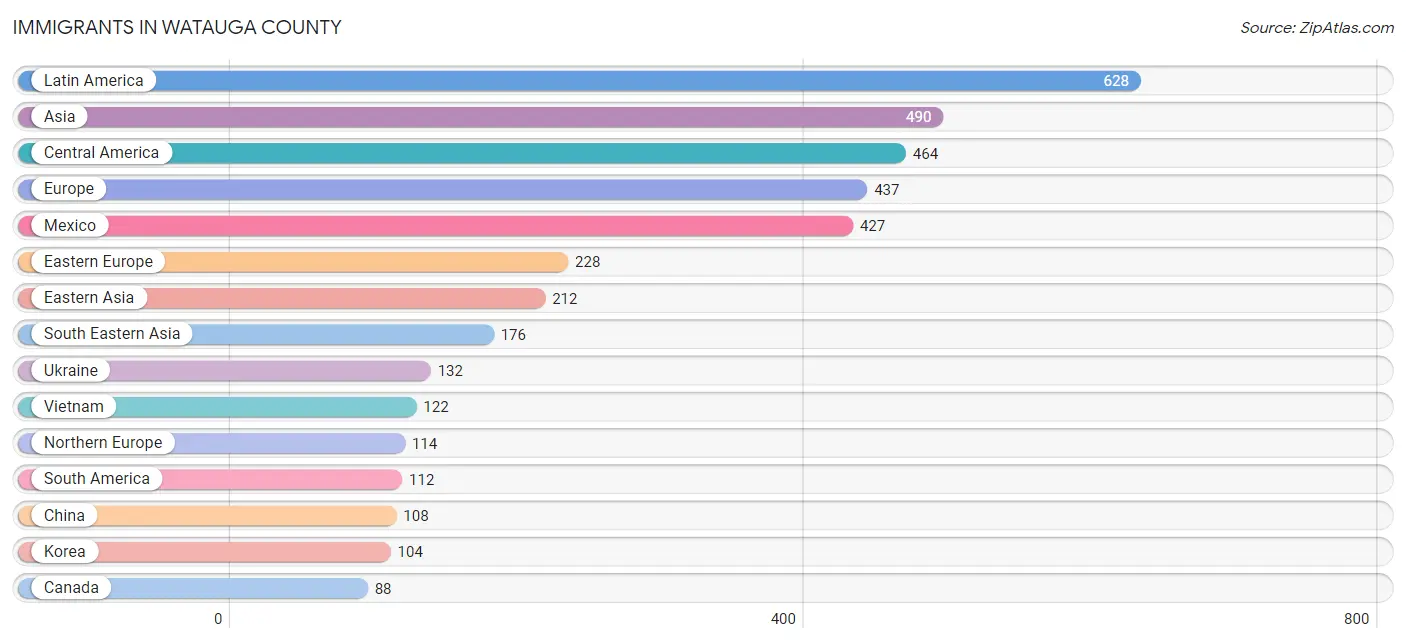
Immigrants in Watauga County
The most numerous immigrant groups reported in Watauga County came from Latin America (628 | 1.1%), Asia (490 | 0.9%), Central America (464 | 0.9%), Europe (437 | 0.8%), and Mexico (427 | 0.8%), together accounting for 4.5% of all Watauga County residents.
| Immigration Origin | # Population | % Population |
| Africa | 84 | 0.2% |
| Argentina | 2 | 0.0% |
| Asia | 490 | 0.9% |
| Austria | 1 | 0.0% |
| Bolivia | 15 | 0.0% |
| Brazil | 18 | 0.0% |
| Canada | 88 | 0.2% |
| Caribbean | 52 | 0.1% |
| Central America | 464 | 0.9% |
| China | 108 | 0.2% |
| Colombia | 48 | 0.1% |
| Costa Rica | 4 | 0.0% |
| Cuba | 42 | 0.1% |
| Denmark | 11 | 0.0% |
| Eastern Africa | 62 | 0.1% |
| Eastern Asia | 212 | 0.4% |
| Eastern Europe | 228 | 0.4% |
| Ecuador | 11 | 0.0% |
| England | 64 | 0.1% |
| Europe | 437 | 0.8% |
| France | 22 | 0.0% |
| Germany | 36 | 0.1% |
| Greece | 1 | 0.0% |
| Guatemala | 1 | 0.0% |
| Haiti | 10 | 0.0% |
| Honduras | 32 | 0.1% |
| Hungary | 1 | 0.0% |
| India | 24 | 0.0% |
| Iran | 21 | 0.0% |
| Kenya | 15 | 0.0% |
| Korea | 104 | 0.2% |
| Latin America | 628 | 1.1% |
| Latvia | 20 | 0.0% |
| Mexico | 427 | 0.8% |
| Nepal | 22 | 0.0% |
| Northern Africa | 6 | 0.0% |
| Northern Europe | 114 | 0.2% |
| Norway | 10 | 0.0% |
| Peru | 17 | 0.0% |
| Philippines | 9 | 0.0% |
| Russia | 75 | 0.1% |
| South Africa | 1 | 0.0% |
| South America | 112 | 0.2% |
| South Central Asia | 67 | 0.1% |
| South Eastern Asia | 176 | 0.3% |
| Southern Europe | 36 | 0.1% |
| Spain | 35 | 0.1% |
| Sweden | 16 | 0.0% |
| Syria | 10 | 0.0% |
| Thailand | 8 | 0.0% |
| Turkey | 25 | 0.1% |
| Ukraine | 132 | 0.2% |
| Venezuela | 1 | 0.0% |
| Vietnam | 122 | 0.2% |
| Western Asia | 35 | 0.1% |
| Western Europe | 59 | 0.1% | View All 56 Rows |
Sex and Age in Watauga County
Sex and Age in Watauga County
The most populous age groups in Watauga County are 20 to 24 Years (5,557 | 20.4%) for men and 20 to 24 Years (4,832 | 17.7%) for women.
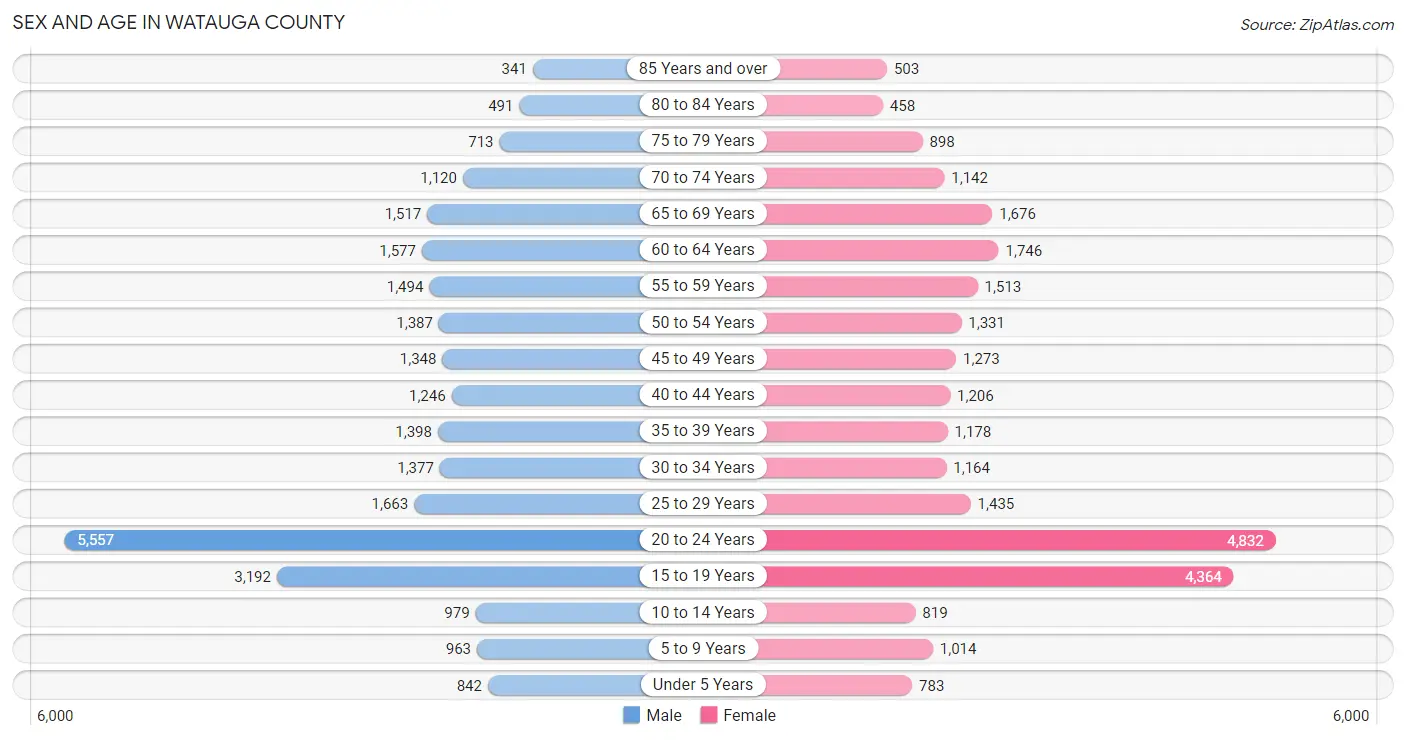
| Age Bracket | Male | Female |
| Under 5 Years | 842 (3.1%) | 783 (2.9%) |
| 5 to 9 Years | 963 (3.5%) | 1,014 (3.7%) |
| 10 to 14 Years | 979 (3.6%) | 819 (3.0%) |
| 15 to 19 Years | 3,192 (11.7%) | 4,364 (16.0%) |
| 20 to 24 Years | 5,557 (20.4%) | 4,832 (17.7%) |
| 25 to 29 Years | 1,663 (6.1%) | 1,435 (5.2%) |
| 30 to 34 Years | 1,377 (5.1%) | 1,164 (4.3%) |
| 35 to 39 Years | 1,398 (5.1%) | 1,178 (4.3%) |
| 40 to 44 Years | 1,246 (4.6%) | 1,206 (4.4%) |
| 45 to 49 Years | 1,348 (5.0%) | 1,273 (4.7%) |
| 50 to 54 Years | 1,387 (5.1%) | 1,331 (4.9%) |
| 55 to 59 Years | 1,494 (5.5%) | 1,513 (5.5%) |
| 60 to 64 Years | 1,577 (5.8%) | 1,746 (6.4%) |
| 65 to 69 Years | 1,517 (5.6%) | 1,676 (6.1%) |
| 70 to 74 Years | 1,120 (4.1%) | 1,142 (4.2%) |
| 75 to 79 Years | 713 (2.6%) | 898 (3.3%) |
| 80 to 84 Years | 491 (1.8%) | 458 (1.7%) |
| 85 Years and over | 341 (1.3%) | 503 (1.8%) |
| Total | 27,205 (100.0%) | 27,335 (100.0%) |
Families and Households in Watauga County
Median Family Size in Watauga County
The median family size in Watauga County is 2.82 persons per family, with married-couple families (9,016 | 83.6%) accounting for the largest median family size of 2.83 persons per family. On the other hand, single male/father families (527 | 4.9%) represent the smallest median family size with 2.73 persons per family.
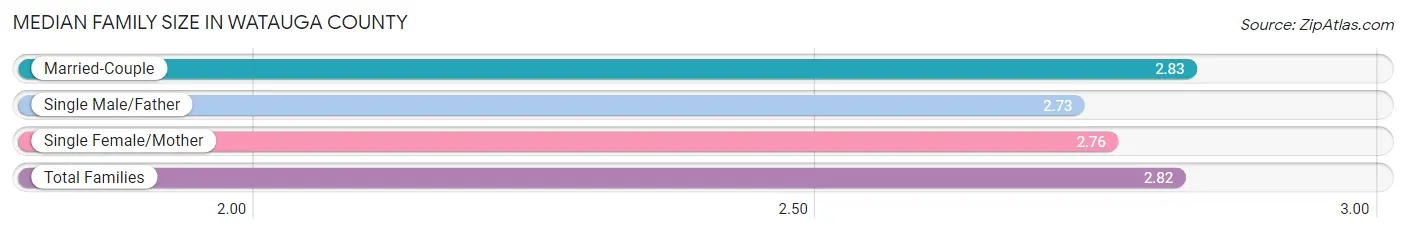
| Family Type | # Families | Family Size |
| Married-Couple | 9,016 (83.6%) | 2.83 |
| Single Male/Father | 527 (4.9%) | 2.73 |
| Single Female/Mother | 1,242 (11.5%) | 2.76 |
| Total Families | 10,785 (100.0%) | 2.82 |
Median Household Size in Watauga County
The median household size in Watauga County is 2.30 persons per household, with single male/father households (527 | 2.5%) accounting for the largest median household size of 3.55 persons per household. non-family households (10,409 | 49.1%) represent the smallest median household size with 1.68 persons per household.
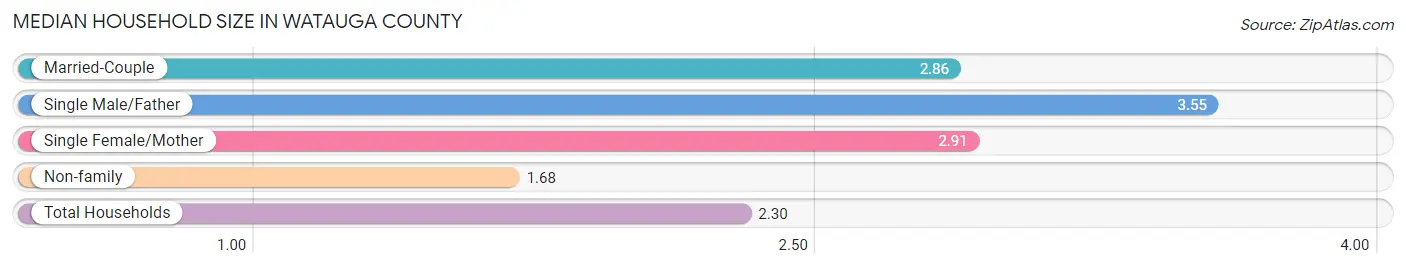
| Household Type | # Households | Household Size |
| Married-Couple | 9,016 (42.5%) | 2.86 |
| Single Male/Father | 527 (2.5%) | 3.55 |
| Single Female/Mother | 1,242 (5.9%) | 2.91 |
| Non-family | 10,409 (49.1%) | 1.68 |
| Total Households | 21,194 (100.0%) | 2.30 |
Household Size by Marriage Status in Watauga County
Out of a total of 21,194 households in Watauga County, 10,785 (50.9%) are family households, while 10,409 (49.1%) are nonfamily households. The most numerous type of family households are 2-person households, comprising 6,501, and the most common type of nonfamily households are 1-person households, comprising 6,427.
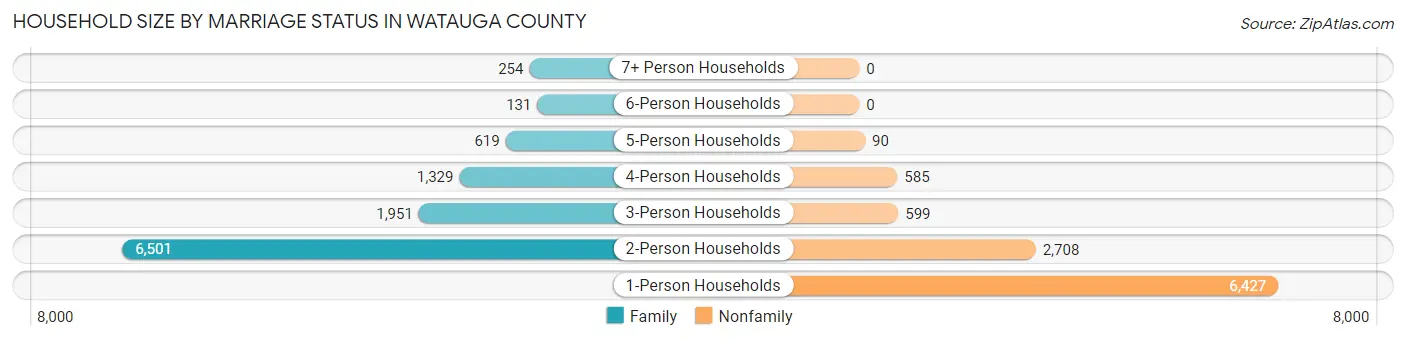
| Household Size | Family Households | Nonfamily Households |
| 1-Person Households | - | 6,427 (30.3%) |
| 2-Person Households | 6,501 (30.7%) | 2,708 (12.8%) |
| 3-Person Households | 1,951 (9.2%) | 599 (2.8%) |
| 4-Person Households | 1,329 (6.3%) | 585 (2.8%) |
| 5-Person Households | 619 (2.9%) | 90 (0.4%) |
| 6-Person Households | 131 (0.6%) | 0 (0.0%) |
| 7+ Person Households | 254 (1.2%) | 0 (0.0%) |
| Total | 10,785 (50.9%) | 10,409 (49.1%) |
Female Fertility in Watauga County
Fertility by Age in Watauga County
Average fertility rate in Watauga County is 20.0 births per 1,000 women. Women in the age bracket of 35 to 50 years have the highest fertility rate with 29.0 births per 1,000 women. Women in the age bracket of 20 to 34 years acount for 63.7% of all women with births.
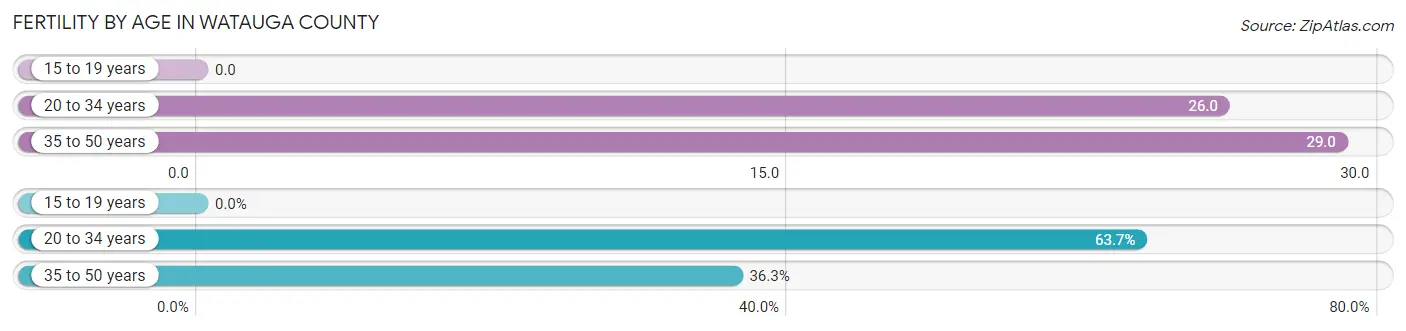
| Age Bracket | Women with Births | Births / 1,000 Women |
| 15 to 19 years | 0 (0.0%) | 0.0 |
| 20 to 34 years | 195 (63.7%) | 26.0 |
| 35 to 50 years | 111 (36.3%) | 29.0 |
| Total | 306 (100.0%) | 20.0 |
Fertility by Age by Marriage Status in Watauga County
81.4% of women with births (306) in Watauga County are married. The highest percentage of unmarried women with births falls into 20 to 34 years age bracket with 25.1% of them unmarried at the time of birth, while the lowest percentage of unmarried women with births belong to 35 to 50 years age bracket with 7.2% of them unmarried.
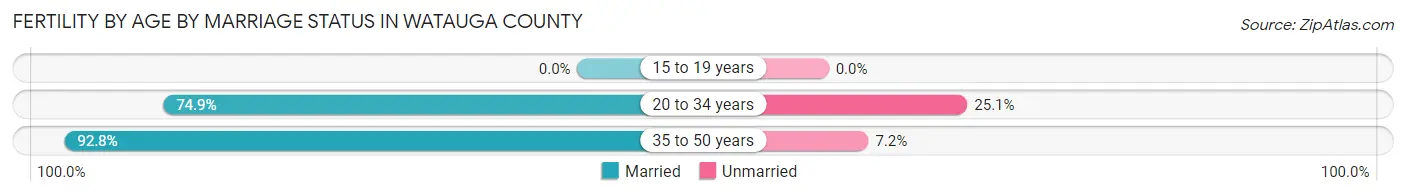
| Age Bracket | Married | Unmarried |
| 15 to 19 years | 0 (0.0%) | 0 (0.0%) |
| 20 to 34 years | 146 (74.9%) | 49 (25.1%) |
| 35 to 50 years | 103 (92.8%) | 8 (7.2%) |
| Total | 249 (81.4%) | 57 (18.6%) |
Fertility by Education in Watauga County
Average fertility rate in Watauga County is 20.0 births per 1,000 women. Women with the education attainment of bachelor's degree have the highest fertility rate of 40.0 births per 1,000 women, while women with the education attainment of less than high school have the lowest fertility at 6.0 births per 1,000 women. Women with the education attainment of college or associate's degree represent 40.2% of all women with births.
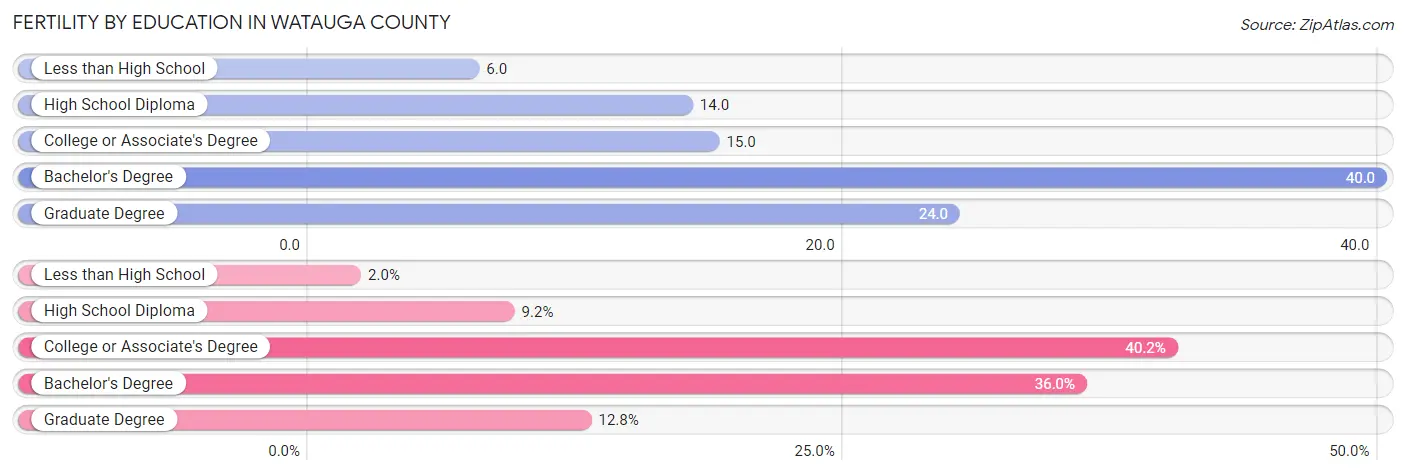
| Educational Attainment | Women with Births | Births / 1,000 Women |
| Less than High School | 6 (2.0%) | 6.0 |
| High School Diploma | 28 (9.1%) | 14.0 |
| College or Associate's Degree | 123 (40.2%) | 15.0 |
| Bachelor's Degree | 110 (35.9%) | 40.0 |
| Graduate Degree | 39 (12.8%) | 24.0 |
| Total | 306 (100.0%) | 20.0 |
Fertility by Education by Marriage Status in Watauga County
18.6% of women with births in Watauga County are unmarried. Women with the educational attainment of bachelor's degree are most likely to be married with 100.0% of them married at childbirth, while women with the educational attainment of less than high school are least likely to be married with 100.0% of them unmarried at childbirth.
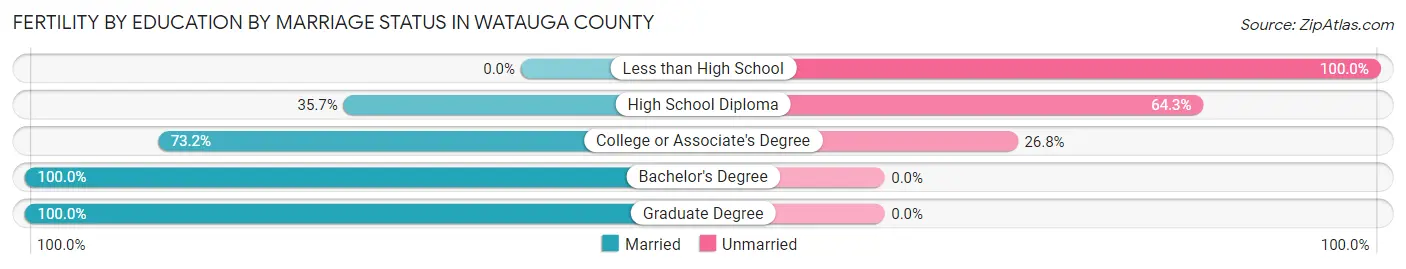
| Educational Attainment | Married | Unmarried |
| Less than High School | 0 (0.0%) | 6 (100.0%) |
| High School Diploma | 10 (35.7%) | 18 (64.3%) |
| College or Associate's Degree | 90 (73.2%) | 33 (26.8%) |
| Bachelor's Degree | 110 (100.0%) | 0 (0.0%) |
| Graduate Degree | 39 (100.0%) | 0 (0.0%) |
| Total | 249 (81.4%) | 57 (18.6%) |
Income in Watauga County
Income Overview in Watauga County
Per Capita Income in Watauga County is $30,807, while median incomes of families and households are $85,689 and $50,034 respectively.
| Characteristic | Number | Measure |
| Per Capita Income | 54,540 | $30,807 |
| Median Family Income | 10,785 | $85,689 |
| Mean Family Income | 10,785 | $107,151 |
| Median Household Income | 21,194 | $50,034 |
| Mean Household Income | 21,194 | $75,648 |
| Income Deficit | 10,785 | $7,299 |
| Wage / Income Gap (%) | 54,540 | 28.19% |
| Wage / Income Gap ($) | 54,540 | 71.81¢ per $1 |
| Gini / Inequality Index | 54,540 | 0.51 |
Earnings by Sex in Watauga County
Average Earnings in Watauga County are $20,673, $24,380 for men and $17,508 for women, a difference of 28.2%.
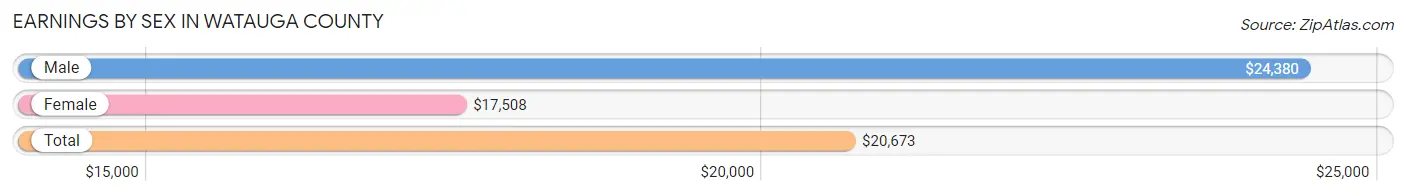
| Sex | Number | Average Earnings |
| Male | 17,609 (53.0%) | $24,380 |
| Female | 15,592 (47.0%) | $17,508 |
| Total | 33,201 (100.0%) | $20,673 |
Earnings by Sex by Income Bracket in Watauga County
The most common earnings brackets in Watauga County are $2,500 to $4,999 for men (2,336 | 13.3%) and $2,499 or less for women (2,420 | 15.5%).
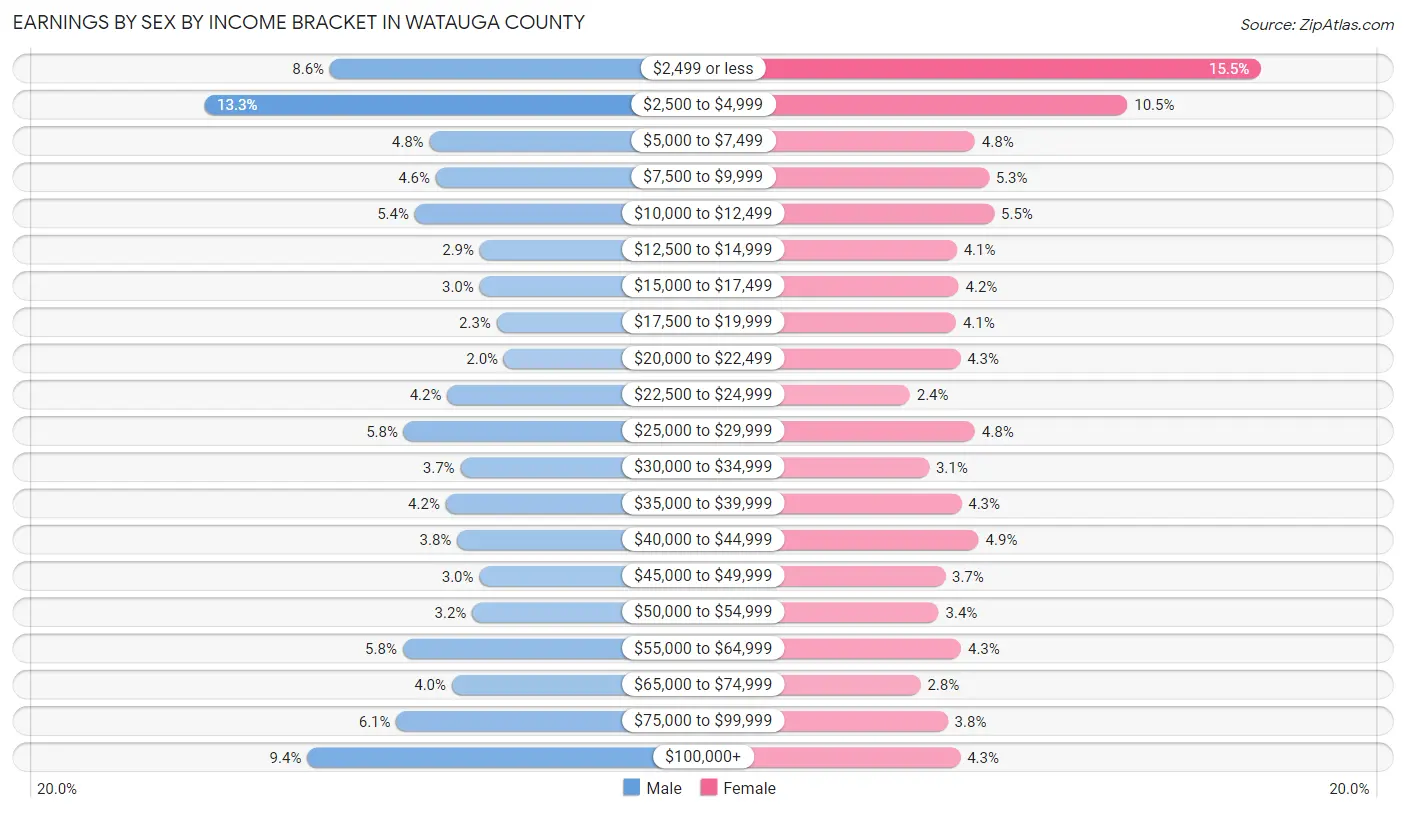
| Income | Male | Female |
| $2,499 or less | 1,508 (8.6%) | 2,420 (15.5%) |
| $2,500 to $4,999 | 2,336 (13.3%) | 1,639 (10.5%) |
| $5,000 to $7,499 | 851 (4.8%) | 749 (4.8%) |
| $7,500 to $9,999 | 809 (4.6%) | 829 (5.3%) |
| $10,000 to $12,499 | 948 (5.4%) | 860 (5.5%) |
| $12,500 to $14,999 | 517 (2.9%) | 643 (4.1%) |
| $15,000 to $17,499 | 519 (2.9%) | 654 (4.2%) |
| $17,500 to $19,999 | 406 (2.3%) | 637 (4.1%) |
| $20,000 to $22,499 | 360 (2.0%) | 663 (4.3%) |
| $22,500 to $24,999 | 732 (4.2%) | 368 (2.4%) |
| $25,000 to $29,999 | 1,019 (5.8%) | 749 (4.8%) |
| $30,000 to $34,999 | 647 (3.7%) | 481 (3.1%) |
| $35,000 to $39,999 | 743 (4.2%) | 669 (4.3%) |
| $40,000 to $44,999 | 668 (3.8%) | 771 (4.9%) |
| $45,000 to $49,999 | 522 (3.0%) | 574 (3.7%) |
| $50,000 to $54,999 | 568 (3.2%) | 536 (3.4%) |
| $55,000 to $64,999 | 1,027 (5.8%) | 668 (4.3%) |
| $65,000 to $74,999 | 703 (4.0%) | 430 (2.8%) |
| $75,000 to $99,999 | 1,069 (6.1%) | 589 (3.8%) |
| $100,000+ | 1,657 (9.4%) | 663 (4.3%) |
| Total | 17,609 (100.0%) | 15,592 (100.0%) |
Earnings by Sex by Educational Attainment in Watauga County
Average earnings in Watauga County are $42,062 for men and $35,682 for women, a difference of 15.2%. Men with an educational attainment of graduate degree enjoy the highest average annual earnings of $82,250, while those with less than high school education earn the least with $26,003. Women with an educational attainment of graduate degree earn the most with the average annual earnings of $49,920, while those with less than high school education have the smallest earnings of $20,979.
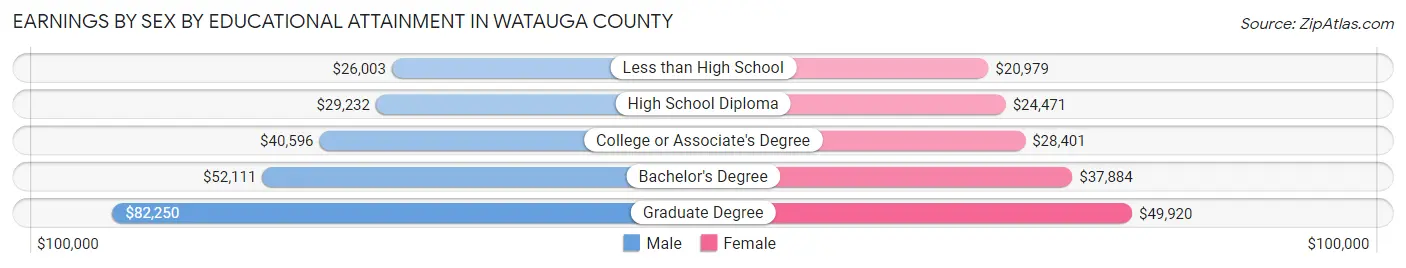
| Educational Attainment | Male Income | Female Income |
| Less than High School | $26,003 | $20,979 |
| High School Diploma | $29,232 | $24,471 |
| College or Associate's Degree | $40,596 | $28,401 |
| Bachelor's Degree | $52,111 | $37,884 |
| Graduate Degree | $82,250 | $49,920 |
| Total | $42,062 | $35,682 |
Family Income in Watauga County
Family Income Brackets in Watauga County
According to the Watauga County family income data, there are 2,405 families falling into the $100,000 to $149,999 income range, which is the most common income bracket and makes up 22.3% of all families. Conversely, the $10,000 to $14,999 income bracket is the least frequent group with only 140 families (1.3%) belonging to this category.
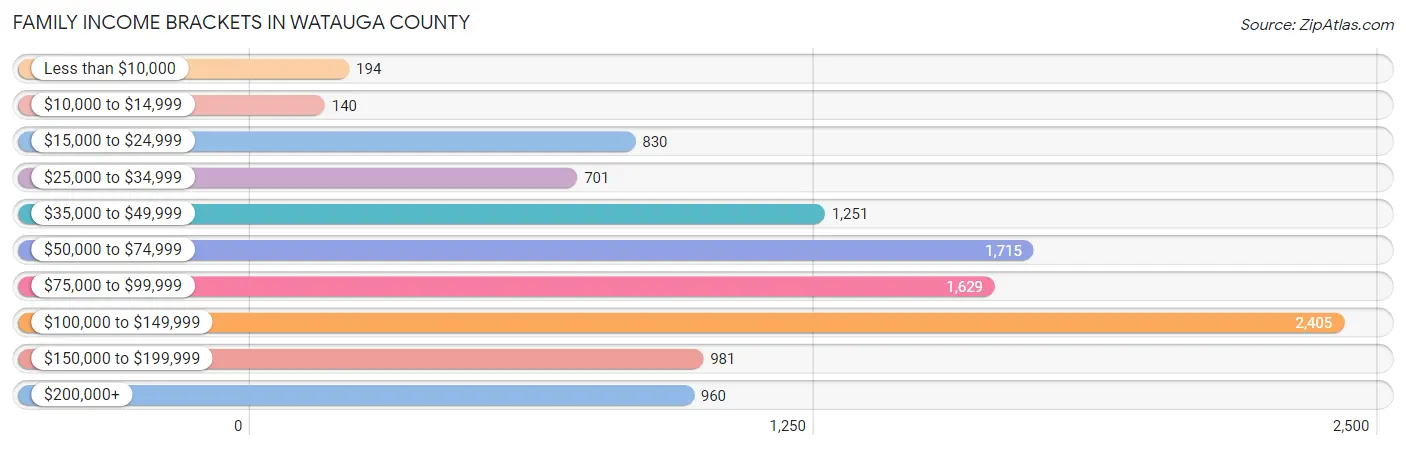
| Income Bracket | # Families | % Families |
| Less than $10,000 | 194 | 1.8% |
| $10,000 to $14,999 | 140 | 1.3% |
| $15,000 to $24,999 | 830 | 7.7% |
| $25,000 to $34,999 | 701 | 6.5% |
| $35,000 to $49,999 | 1,251 | 11.6% |
| $50,000 to $74,999 | 1,715 | 15.9% |
| $75,000 to $99,999 | 1,629 | 15.1% |
| $100,000 to $149,999 | 2,405 | 22.3% |
| $150,000 to $199,999 | 981 | 9.1% |
| $200,000+ | 960 | 8.9% |
Family Income by Famaliy Size in Watauga County
7+ person families (193 | 1.8%) account for the highest median family income in Watauga County with $117,371 per family, while 2-person families (6,696 | 62.1%) have the highest median income of $38,306 per family member.
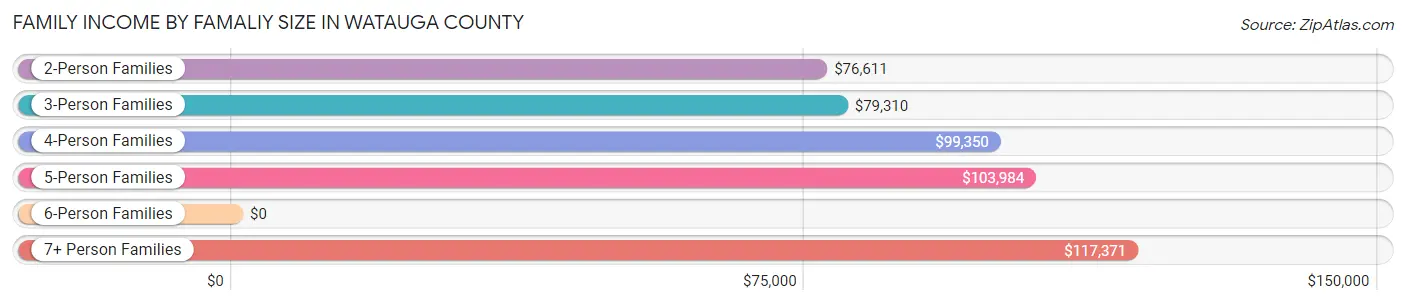
| Income Bracket | # Families | Median Income |
| 2-Person Families | 6,696 (62.1%) | $76,611 |
| 3-Person Families | 2,021 (18.7%) | $79,310 |
| 4-Person Families | 1,260 (11.7%) | $99,350 |
| 5-Person Families | 488 (4.5%) | $103,984 |
| 6-Person Families | 127 (1.2%) | $0 |
| 7+ Person Families | 193 (1.8%) | $117,371 |
| Total | 10,785 (100.0%) | $85,689 |
Family Income by Number of Earners in Watauga County
The median family income in Watauga County is $85,689, with families comprising 3+ earners (967) having the highest median family income of $115,031, while families with no earners (2,111) have the lowest median family income of $47,055, accounting for 9.0% and 19.6% of families, respectively.
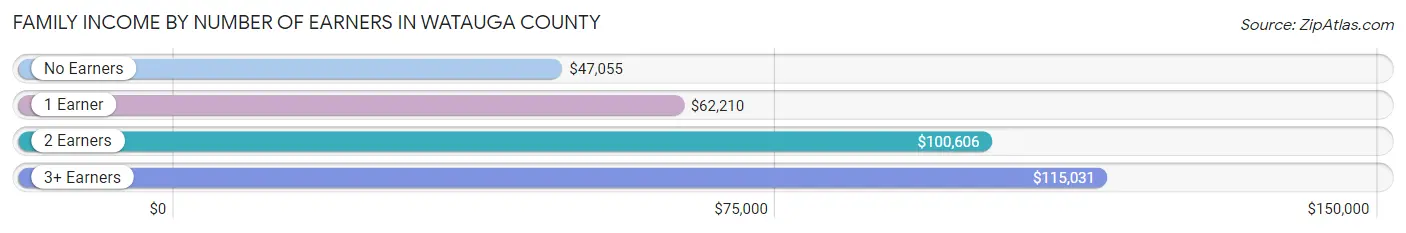
| Number of Earners | # Families | Median Income |
| No Earners | 2,111 (19.6%) | $47,055 |
| 1 Earner | 3,046 (28.2%) | $62,210 |
| 2 Earners | 4,661 (43.2%) | $100,606 |
| 3+ Earners | 967 (9.0%) | $115,031 |
| Total | 10,785 (100.0%) | $85,689 |
Household Income in Watauga County
Household Income Brackets in Watauga County
With 3,031 households falling in the category, the $50,000 to $74,999 income range is the most frequent in Watauga County, accounting for 14.3% of all households. In contrast, only 1,144 households (5.4%) fall into the $150,000 to $199,999 income bracket, making it the least populous group.
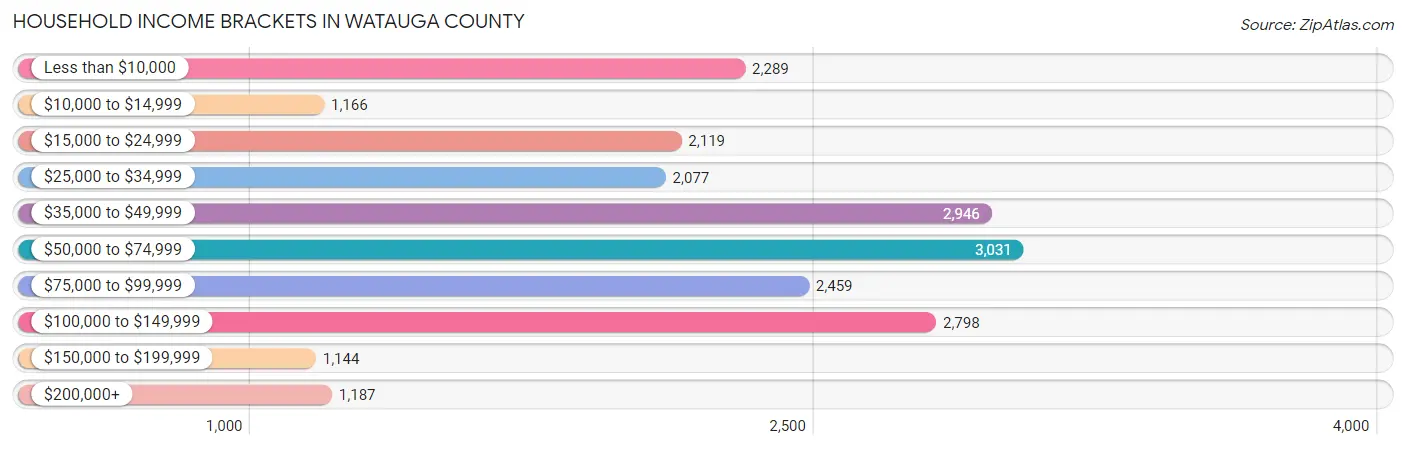
| Income Bracket | # Households | % Households |
| Less than $10,000 | 2,289 | 10.8% |
| $10,000 to $14,999 | 1,166 | 5.5% |
| $15,000 to $24,999 | 2,119 | 10.0% |
| $25,000 to $34,999 | 2,077 | 9.8% |
| $35,000 to $49,999 | 2,946 | 13.9% |
| $50,000 to $74,999 | 3,031 | 14.3% |
| $75,000 to $99,999 | 2,459 | 11.6% |
| $100,000 to $149,999 | 2,798 | 13.2% |
| $150,000 to $199,999 | 1,144 | 5.4% |
| $200,000+ | 1,187 | 5.6% |
Household Income by Householder Age in Watauga County
The median household income in Watauga County is $50,034, with the highest median household income of $68,111 found in the 45 to 64 years age bracket for the primary householder. A total of 6,421 households (30.3%) fall into this category. Meanwhile, the 15 to 24 years age bracket for the primary householder has the lowest median household income of $14,917, with 3,743 households (17.7%) in this group.
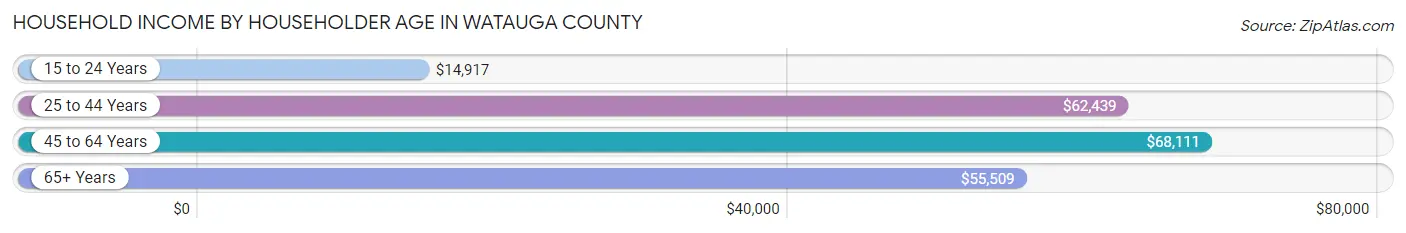
| Income Bracket | # Households | Median Income |
| 15 to 24 Years | 3,743 (17.7%) | $14,917 |
| 25 to 44 Years | 5,236 (24.7%) | $62,439 |
| 45 to 64 Years | 6,421 (30.3%) | $68,111 |
| 65+ Years | 5,794 (27.3%) | $55,509 |
| Total | 21,194 (100.0%) | $50,034 |
Poverty in Watauga County
Income Below Poverty by Sex and Age in Watauga County
With 25.7% poverty level for males and 24.1% for females among the residents of Watauga County, 18 to 24 year old males and 18 to 24 year old females are the most vulnerable to poverty, with 4,600 males (71.9%) and 3,544 females (70.9%) in their respective age groups living below the poverty level.
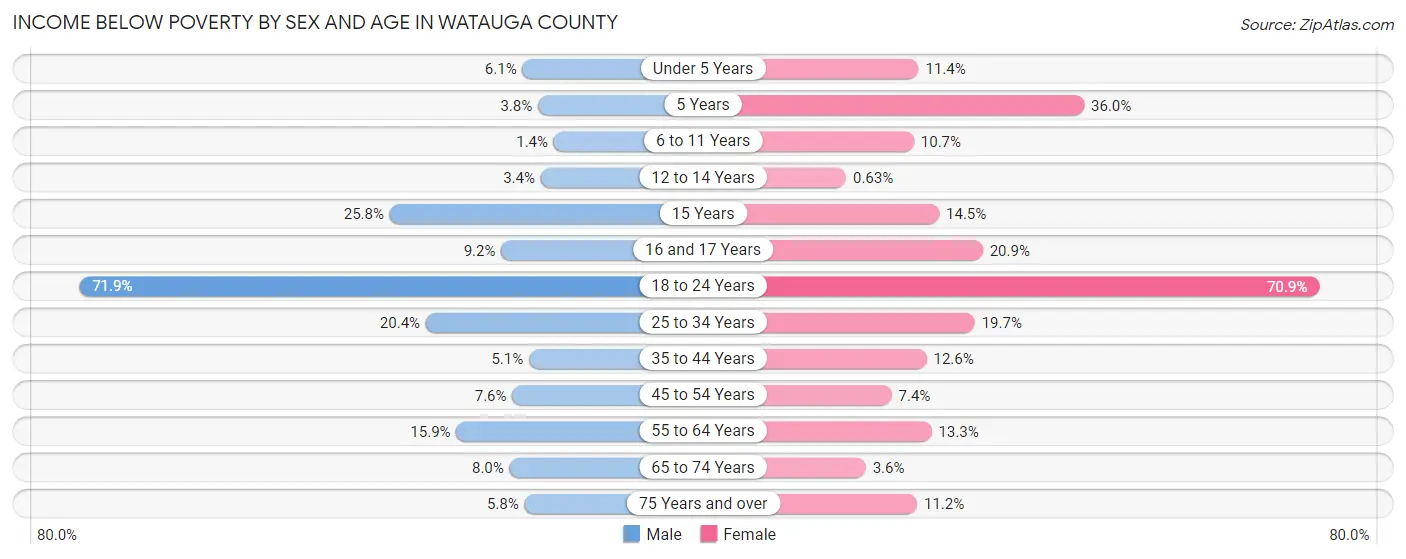
| Age Bracket | Male | Female |
| Under 5 Years | 51 (6.1%) | 89 (11.4%) |
| 5 Years | 7 (3.8%) | 68 (36.0%) |
| 6 to 11 Years | 18 (1.4%) | 123 (10.7%) |
| 12 to 14 Years | 15 (3.4%) | 3 (0.6%) |
| 15 Years | 50 (25.8%) | 25 (14.4%) |
| 16 and 17 Years | 36 (9.2%) | 90 (20.9%) |
| 18 to 24 Years | 4,600 (71.9%) | 3,544 (70.9%) |
| 25 to 34 Years | 611 (20.4%) | 513 (19.7%) |
| 35 to 44 Years | 134 (5.1%) | 300 (12.6%) |
| 45 to 54 Years | 207 (7.6%) | 192 (7.4%) |
| 55 to 64 Years | 487 (15.9%) | 434 (13.3%) |
| 65 to 74 Years | 209 (8.0%) | 99 (3.5%) |
| 75 Years and over | 89 (5.8%) | 196 (11.2%) |
| Total | 6,514 (25.7%) | 5,676 (24.1%) |
Income Above Poverty by Sex and Age in Watauga County
According to the poverty statistics in Watauga County, males aged 6 to 11 years and females aged 12 to 14 years are the age groups that are most secure financially, with 98.6% of males and 99.4% of females in these age groups living above the poverty line.
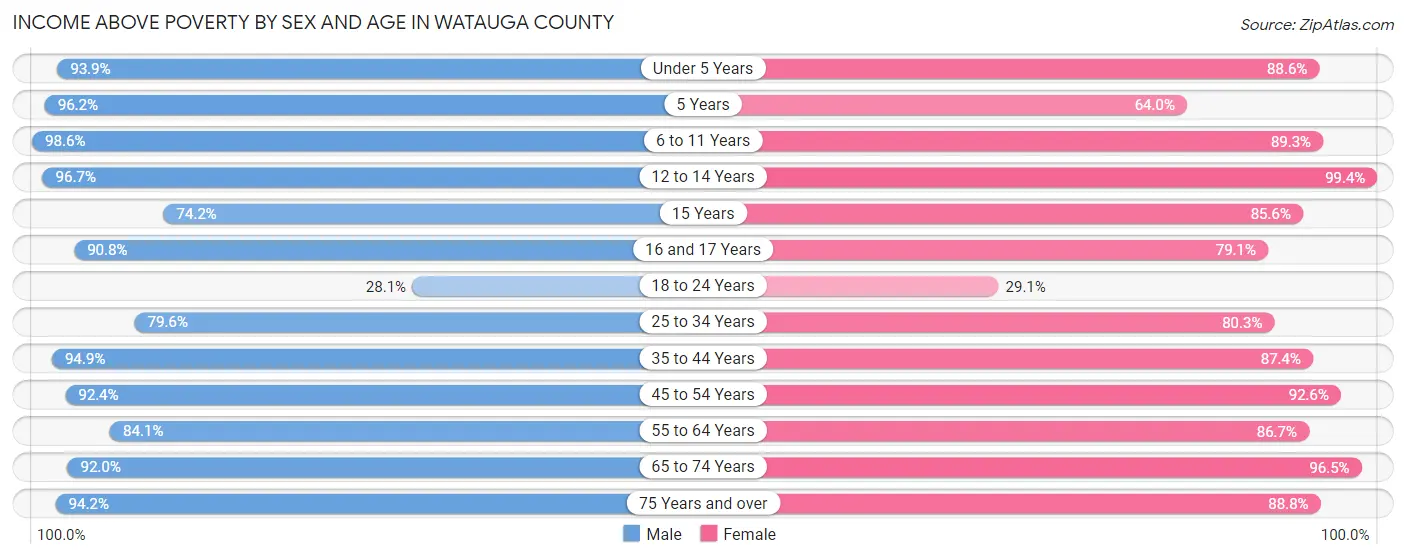
| Age Bracket | Male | Female |
| Under 5 Years | 789 (93.9%) | 692 (88.6%) |
| 5 Years | 179 (96.2%) | 121 (64.0%) |
| 6 to 11 Years | 1,262 (98.6%) | 1,027 (89.3%) |
| 12 to 14 Years | 433 (96.7%) | 470 (99.4%) |
| 15 Years | 144 (74.2%) | 148 (85.6%) |
| 16 and 17 Years | 355 (90.8%) | 340 (79.1%) |
| 18 to 24 Years | 1,799 (28.1%) | 1,455 (29.1%) |
| 25 to 34 Years | 2,382 (79.6%) | 2,086 (80.3%) |
| 35 to 44 Years | 2,497 (94.9%) | 2,084 (87.4%) |
| 45 to 54 Years | 2,528 (92.4%) | 2,406 (92.6%) |
| 55 to 64 Years | 2,580 (84.1%) | 2,825 (86.7%) |
| 65 to 74 Years | 2,410 (92.0%) | 2,692 (96.5%) |
| 75 Years and over | 1,456 (94.2%) | 1,558 (88.8%) |
| Total | 18,814 (74.3%) | 17,904 (75.9%) |
Income Below Poverty Among Married-Couple Families in Watauga County
The poverty statistics for married-couple families in Watauga County show that 3.7% or 335 of the total 9,016 families live below the poverty line. Families with 5 or more children have the highest poverty rate of 14.9%, comprising of 13 families. On the other hand, families with 3 or 4 children have the lowest poverty rate of 1.8%, which includes 8 families.
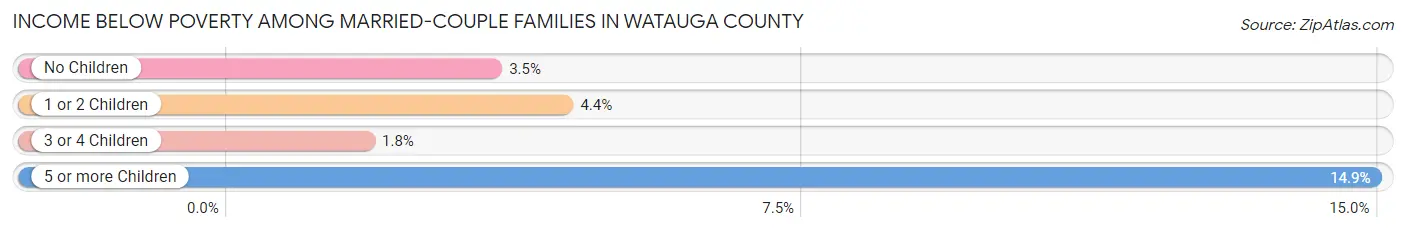
| Children | Above Poverty | Below Poverty |
| No Children | 5,960 (96.6%) | 213 (3.5%) |
| 1 or 2 Children | 2,207 (95.6%) | 101 (4.4%) |
| 3 or 4 Children | 440 (98.2%) | 8 (1.8%) |
| 5 or more Children | 74 (85.1%) | 13 (14.9%) |
| Total | 8,681 (96.3%) | 335 (3.7%) |
Income Below Poverty Among Single-Parent Households in Watauga County
According to the poverty data in Watauga County, 24.3% or 128 single-father households and 23.6% or 293 single-mother households are living below the poverty line. Among single-father households, those with 1 or 2 children have the highest poverty rate, with 49 households (25.3%) experiencing poverty. Likewise, among single-mother households, those with 3 or 4 children have the highest poverty rate, with 28 households (63.6%) falling below the poverty line.

| Children | Single Father | Single Mother |
| No Children | 79 (24.1%) | 82 (14.2%) |
| 1 or 2 Children | 49 (25.3%) | 183 (29.4%) |
| 3 or 4 Children | 0 (0.0%) | 28 (63.6%) |
| 5 or more Children | 0 (0.0%) | 0 (0.0%) |
| Total | 128 (24.3%) | 293 (23.6%) |
Income Below Poverty Among Married-Couple vs Single-Parent Households in Watauga County
The poverty data for Watauga County shows that 335 of the married-couple family households (3.7%) and 421 of the single-parent households (23.8%) are living below the poverty level. Within the married-couple family households, those with 5 or more children have the highest poverty rate, with 13 households (14.9%) falling below the poverty line. Among the single-parent households, those with 3 or 4 children have the highest poverty rate, with 28 household (57.1%) living below poverty.
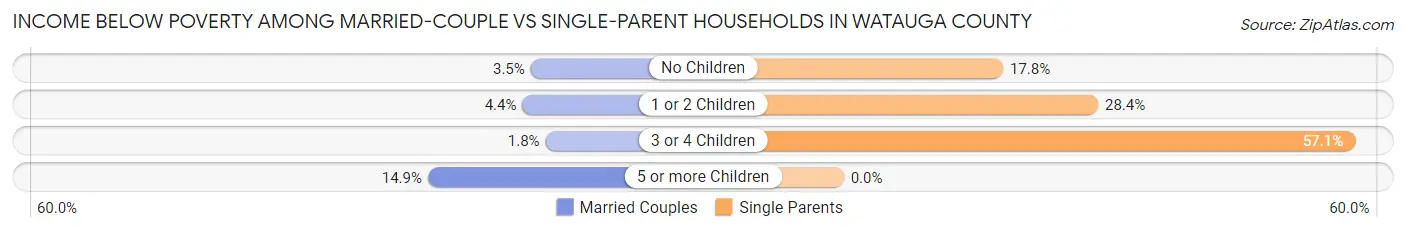
| Children | Married-Couple Families | Single-Parent Households |
| No Children | 213 (3.5%) | 161 (17.8%) |
| 1 or 2 Children | 101 (4.4%) | 232 (28.4%) |
| 3 or 4 Children | 8 (1.8%) | 28 (57.1%) |
| 5 or more Children | 13 (14.9%) | 0 (0.0%) |
| Total | 335 (3.7%) | 421 (23.8%) |
Employment Characteristics in Watauga County
Employment by Class of Employer in Watauga County
Among the 25,360 employed individuals in Watauga County, private company employees (14,244 | 56.2%), state government employees (3,386 | 13.4%), and not-for-profit organizations (2,548 | 10.1%) make up the most common classes of employment.
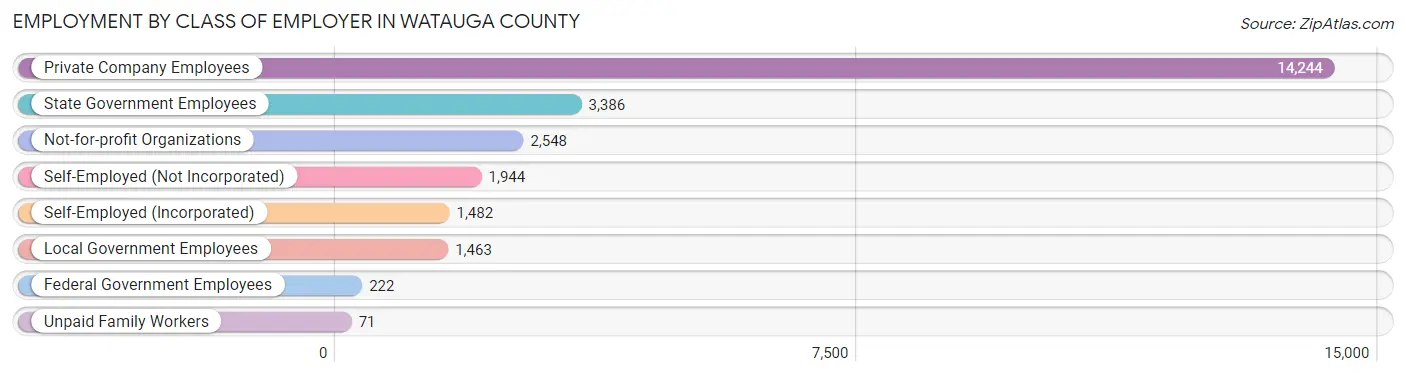
| Employer Class | # Employees | % Employees |
| Private Company Employees | 14,244 | 56.2% |
| Self-Employed (Incorporated) | 1,482 | 5.8% |
| Self-Employed (Not Incorporated) | 1,944 | 7.7% |
| Not-for-profit Organizations | 2,548 | 10.1% |
| Local Government Employees | 1,463 | 5.8% |
| State Government Employees | 3,386 | 13.4% |
| Federal Government Employees | 222 | 0.9% |
| Unpaid Family Workers | 71 | 0.3% |
| Total | 25,360 | 100.0% |
Employment Status by Age in Watauga County
According to the labor force statistics for Watauga County, out of the total population over 16 years of age (48,773), 59.8% or 29,166 individuals are in the labor force, with 9.3% or 2,712 of them unemployed. The age group with the highest labor force participation rate is 35 to 44 years, with 87.9% or 4,420 individuals in the labor force. Within the labor force, the 16 to 19 years age range has the highest percentage of unemployed individuals, with 27.8% or 775 of them being unemployed.
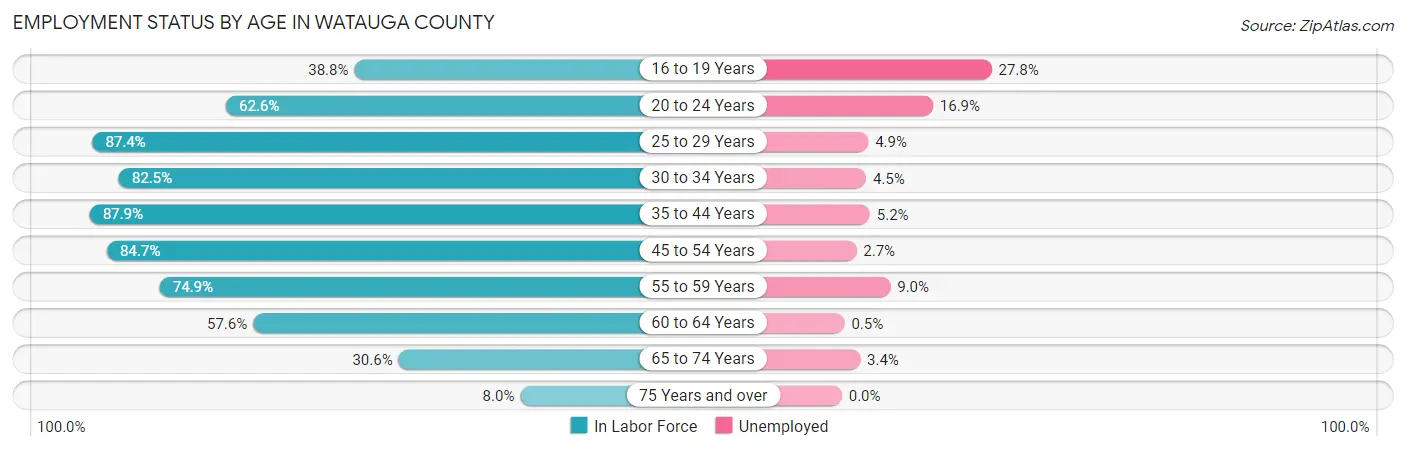
| Age Bracket | In Labor Force | Unemployed |
| 16 to 19 Years | 2,789 (38.8%) | 775 (27.8%) |
| 20 to 24 Years | 6,504 (62.6%) | 1,099 (16.9%) |
| 25 to 29 Years | 2,708 (87.4%) | 133 (4.9%) |
| 30 to 34 Years | 2,096 (82.5%) | 94 (4.5%) |
| 35 to 44 Years | 4,420 (87.9%) | 230 (5.2%) |
| 45 to 54 Years | 4,522 (84.7%) | 122 (2.7%) |
| 55 to 59 Years | 2,252 (74.9%) | 203 (9.0%) |
| 60 to 64 Years | 1,914 (57.6%) | 10 (0.5%) |
| 65 to 74 Years | 1,669 (30.6%) | 57 (3.4%) |
| 75 Years and over | 272 (8.0%) | 0 (0.0%) |
| Total | 29,166 (59.8%) | 2,712 (9.3%) |
Employment Status by Educational Attainment in Watauga County
According to labor force statistics for Watauga County, 80.2% of individuals (17,913) out of the total population between 25 and 64 years of age (22,336) are in the labor force, with 4.4% or 788 of them being unemployed. The group with the highest labor force participation rate are those with the educational attainment of bachelor's degree or higher, with 87.8% or 8,862 individuals in the labor force. Within the labor force, individuals with college / associate degree education have the highest percentage of unemployment, with 6.4% or 283 of them being unemployed.
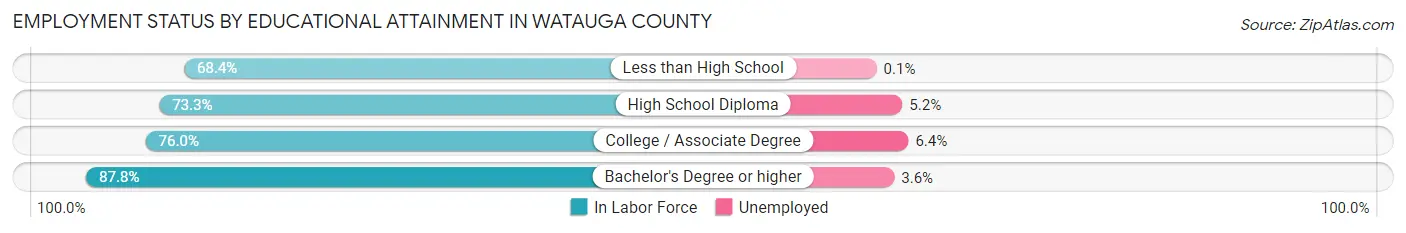
| Educational Attainment | In Labor Force | Unemployed |
| Less than High School | 1,072 (68.4%) | 2 (0.1%) |
| High School Diploma | 3,554 (73.3%) | 252 (5.2%) |
| College / Associate Degree | 4,429 (76.0%) | 373 (6.4%) |
| Bachelor's Degree or higher | 8,862 (87.8%) | 363 (3.6%) |
| Total | 17,913 (80.2%) | 983 (4.4%) |
Employment Occupations by Sex in Watauga County
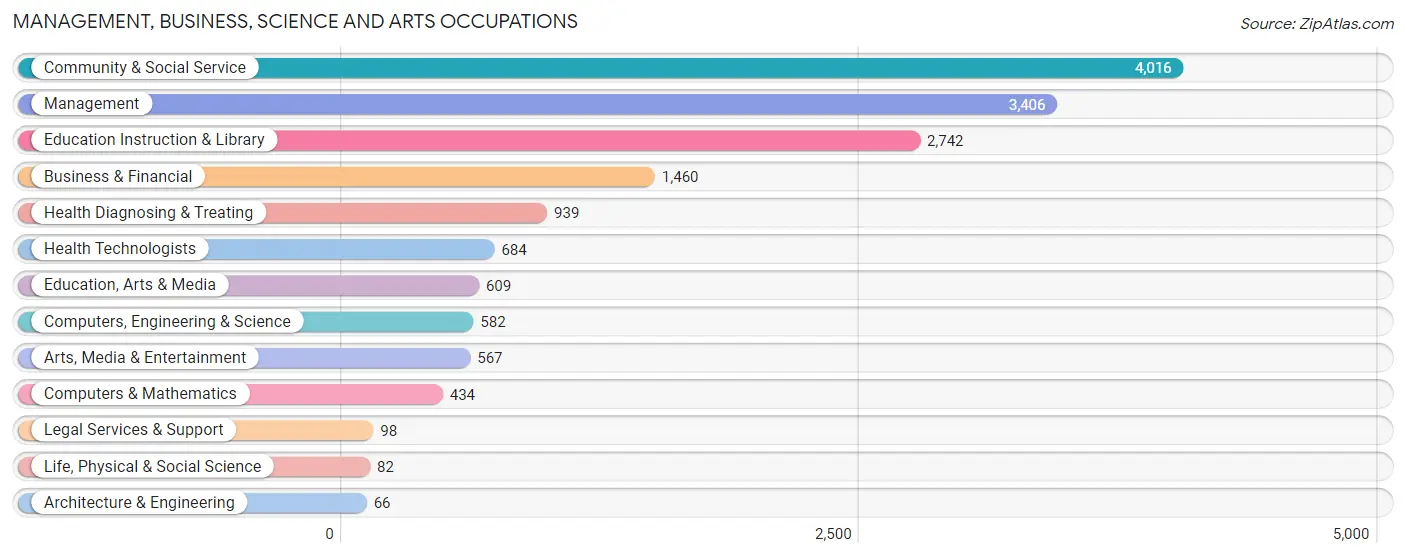
Management, Business, Science and Arts Occupations
The most common Management, Business, Science and Arts occupations in Watauga County are Community & Social Service (4,016 | 15.2%), Management (3,406 | 12.9%), Education Instruction & Library (2,742 | 10.4%), Business & Financial (1,460 | 5.5%), and Health Diagnosing & Treating (939 | 3.6%).
Management, Business, Science and Arts Occupations by Sex
Within the Management, Business, Science and Arts occupations in Watauga County, the most male-oriented occupations are Legal Services & Support (80.6%), Architecture & Engineering (75.8%), and Computers & Mathematics (71.4%), while the most female-oriented occupations are Health Diagnosing & Treating (78.1%), Health Technologists (71.6%), and Education Instruction & Library (66.3%).
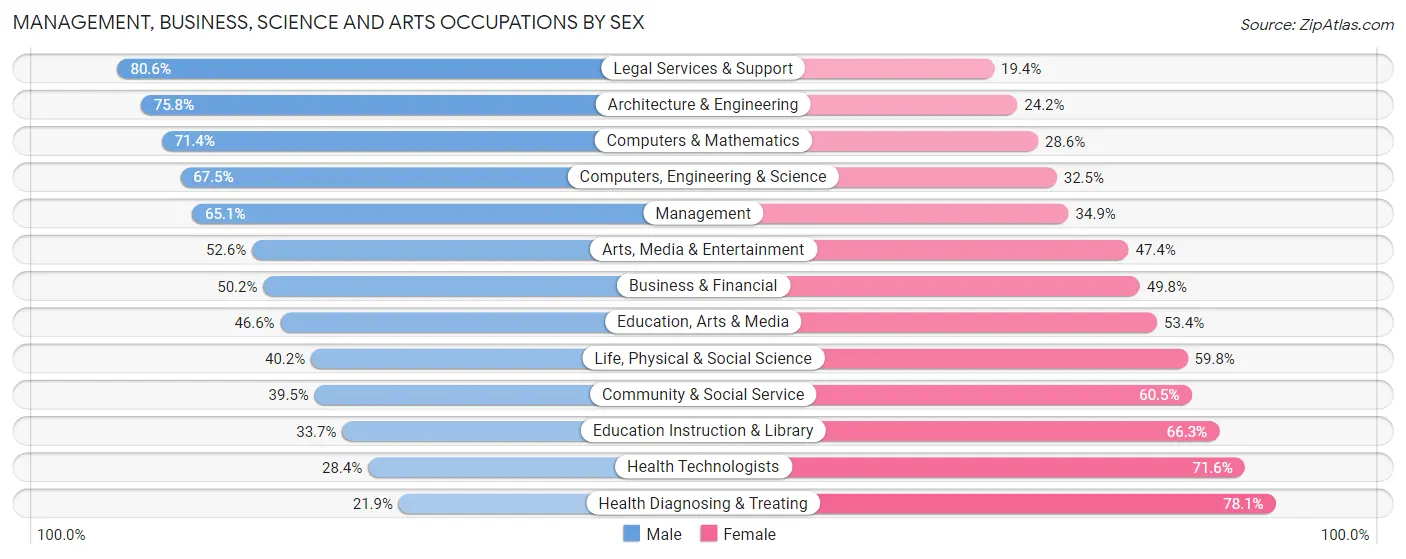
| Occupation | Male | Female |
| Management | 2,216 (65.1%) | 1,190 (34.9%) |
| Business & Financial | 733 (50.2%) | 727 (49.8%) |
| Computers, Engineering & Science | 393 (67.5%) | 189 (32.5%) |
| Computers & Mathematics | 310 (71.4%) | 124 (28.6%) |
| Architecture & Engineering | 50 (75.8%) | 16 (24.2%) |
| Life, Physical & Social Science | 33 (40.2%) | 49 (59.8%) |
| Community & Social Service | 1,586 (39.5%) | 2,430 (60.5%) |
| Education, Arts & Media | 284 (46.6%) | 325 (53.4%) |
| Legal Services & Support | 79 (80.6%) | 19 (19.4%) |
| Education Instruction & Library | 925 (33.7%) | 1,817 (66.3%) |
| Arts, Media & Entertainment | 298 (52.6%) | 269 (47.4%) |
| Health Diagnosing & Treating | 206 (21.9%) | 733 (78.1%) |
| Health Technologists | 194 (28.4%) | 490 (71.6%) |
| Total (Category) | 5,134 (49.3%) | 5,269 (50.6%) |
| Total (Overall) | 14,109 (53.4%) | 12,295 (46.6%) |
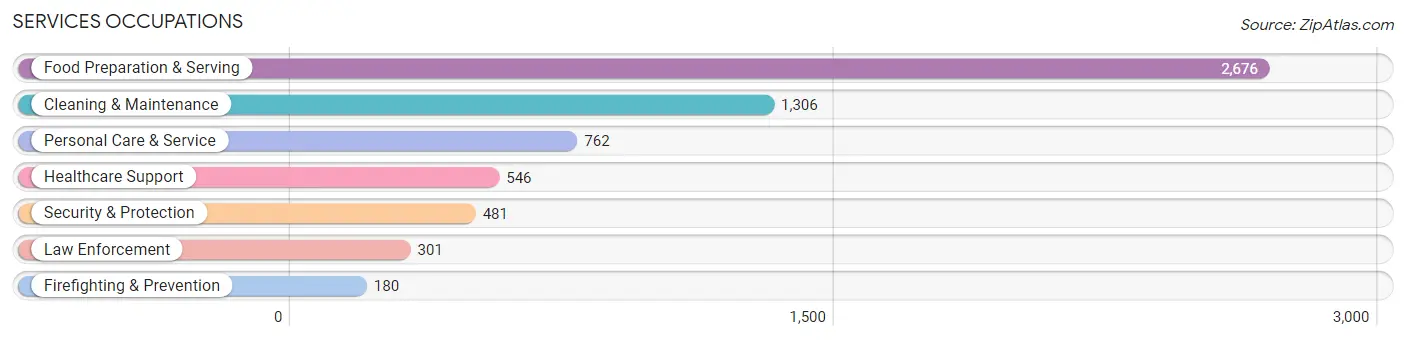
Services Occupations
The most common Services occupations in Watauga County are Food Preparation & Serving (2,676 | 10.1%), Cleaning & Maintenance (1,306 | 5.0%), Personal Care & Service (762 | 2.9%), Healthcare Support (546 | 2.1%), and Security & Protection (481 | 1.8%).
Services Occupations by Sex
Within the Services occupations in Watauga County, the most male-oriented occupations are Law Enforcement (92.4%), Security & Protection (74.4%), and Cleaning & Maintenance (65.7%), while the most female-oriented occupations are Healthcare Support (82.2%), Personal Care & Service (77.8%), and Firefighting & Prevention (55.6%).
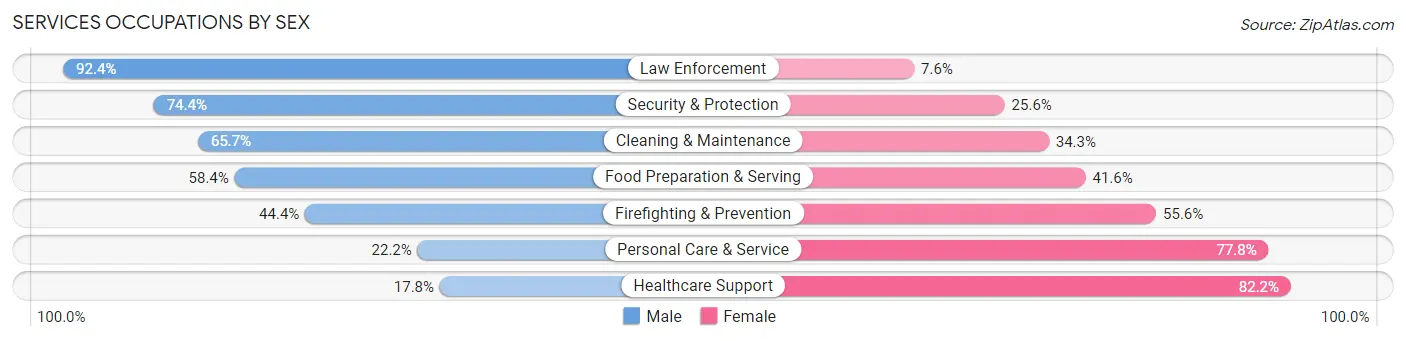
| Occupation | Male | Female |
| Healthcare Support | 97 (17.8%) | 449 (82.2%) |
| Security & Protection | 358 (74.4%) | 123 (25.6%) |
| Firefighting & Prevention | 80 (44.4%) | 100 (55.6%) |
| Law Enforcement | 278 (92.4%) | 23 (7.6%) |
| Food Preparation & Serving | 1,563 (58.4%) | 1,113 (41.6%) |
| Cleaning & Maintenance | 858 (65.7%) | 448 (34.3%) |
| Personal Care & Service | 169 (22.2%) | 593 (77.8%) |
| Total (Category) | 3,045 (52.8%) | 2,726 (47.2%) |
| Total (Overall) | 14,109 (53.4%) | 12,295 (46.6%) |
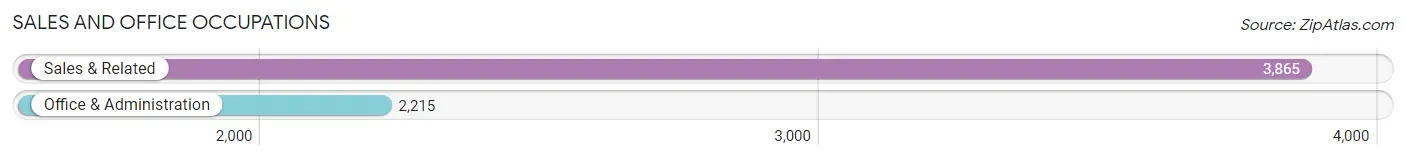
Sales and Office Occupations
The most common Sales and Office occupations in Watauga County are Sales & Related (3,865 | 14.6%), and Office & Administration (2,215 | 8.4%).
Sales and Office Occupations by Sex
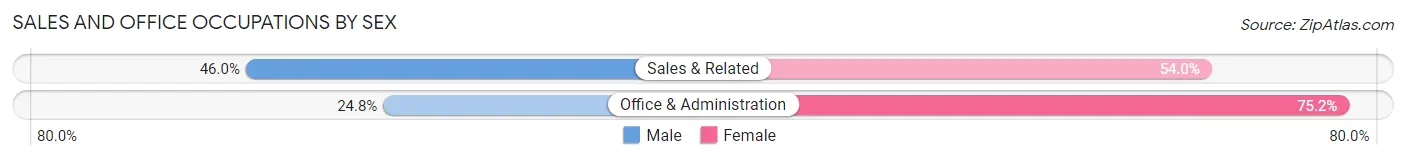
| Occupation | Male | Female |
| Sales & Related | 1,777 (46.0%) | 2,088 (54.0%) |
| Office & Administration | 550 (24.8%) | 1,665 (75.2%) |
| Total (Category) | 2,327 (38.3%) | 3,753 (61.7%) |
| Total (Overall) | 14,109 (53.4%) | 12,295 (46.6%) |
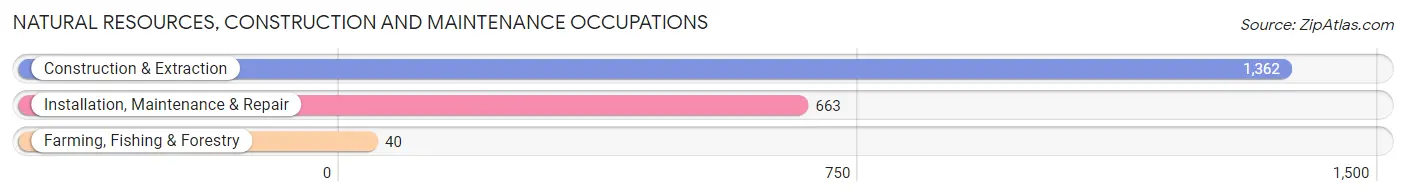
Natural Resources, Construction and Maintenance Occupations
The most common Natural Resources, Construction and Maintenance occupations in Watauga County are Construction & Extraction (1,362 | 5.2%), Installation, Maintenance & Repair (663 | 2.5%), and Farming, Fishing & Forestry (40 | 0.2%).
Natural Resources, Construction and Maintenance Occupations by Sex
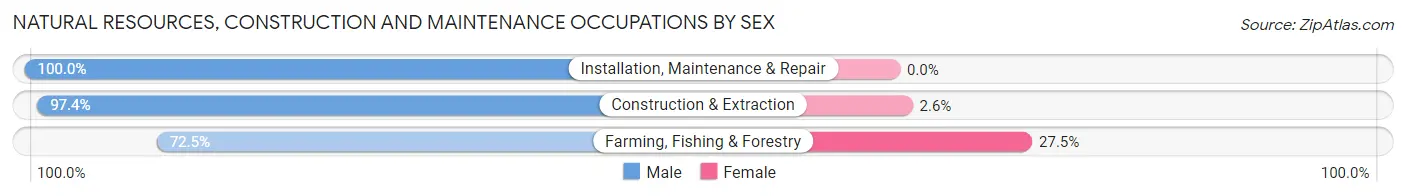
| Occupation | Male | Female |
| Farming, Fishing & Forestry | 29 (72.5%) | 11 (27.5%) |
| Construction & Extraction | 1,326 (97.4%) | 36 (2.6%) |
| Installation, Maintenance & Repair | 663 (100.0%) | 0 (0.0%) |
| Total (Category) | 2,018 (97.7%) | 47 (2.3%) |
| Total (Overall) | 14,109 (53.4%) | 12,295 (46.6%) |
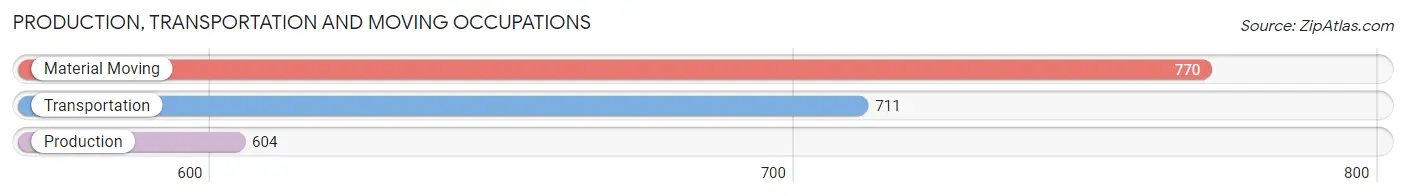
Production, Transportation and Moving Occupations
The most common Production, Transportation and Moving occupations in Watauga County are Material Moving (770 | 2.9%), Transportation (711 | 2.7%), and Production (604 | 2.3%).
Production, Transportation and Moving Occupations by Sex
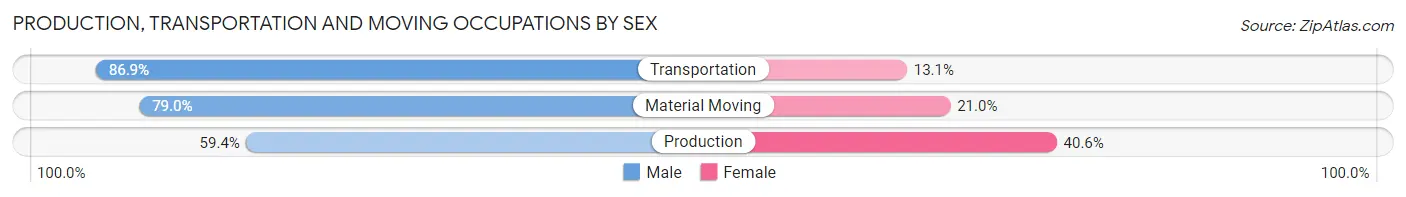
| Occupation | Male | Female |
| Production | 359 (59.4%) | 245 (40.6%) |
| Transportation | 618 (86.9%) | 93 (13.1%) |
| Material Moving | 608 (79.0%) | 162 (21.0%) |
| Total (Category) | 1,585 (76.0%) | 500 (24.0%) |
| Total (Overall) | 14,109 (53.4%) | 12,295 (46.6%) |
Employment Industries by Sex in Watauga County
Employment Industries in Watauga County
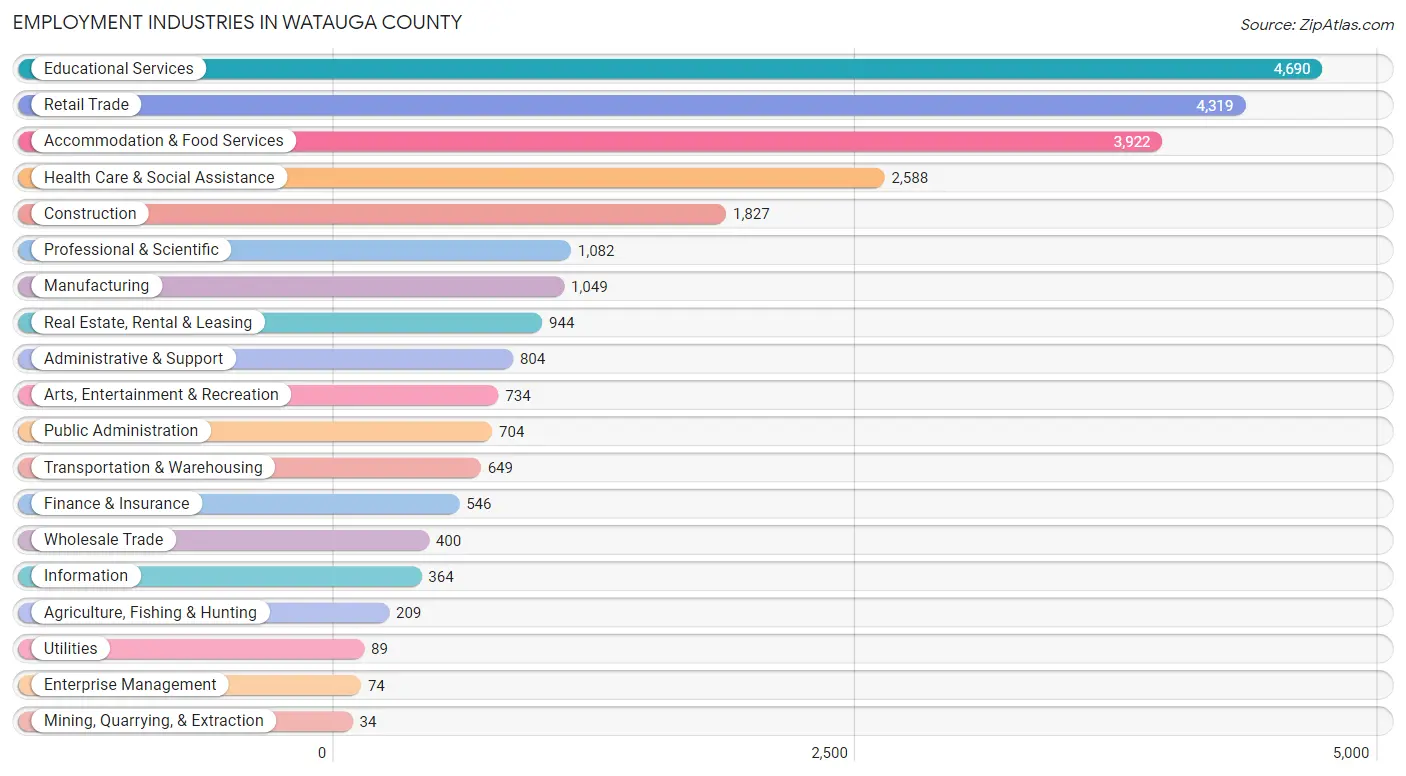
The major employment industries in Watauga County include Educational Services (4,690 | 17.8%), Retail Trade (4,319 | 16.4%), Accommodation & Food Services (3,922 | 14.8%), Health Care & Social Assistance (2,588 | 9.8%), and Construction (1,827 | 6.9%).
Employment Industries by Sex in Watauga County
The Watauga County industries that see more men than women are Mining, Quarrying, & Extraction (100.0%), Construction (92.2%), and Utilities (91.0%), whereas the industries that tend to have a higher number of women are Enterprise Management (81.1%), Health Care & Social Assistance (71.8%), and Arts, Entertainment & Recreation (61.9%).
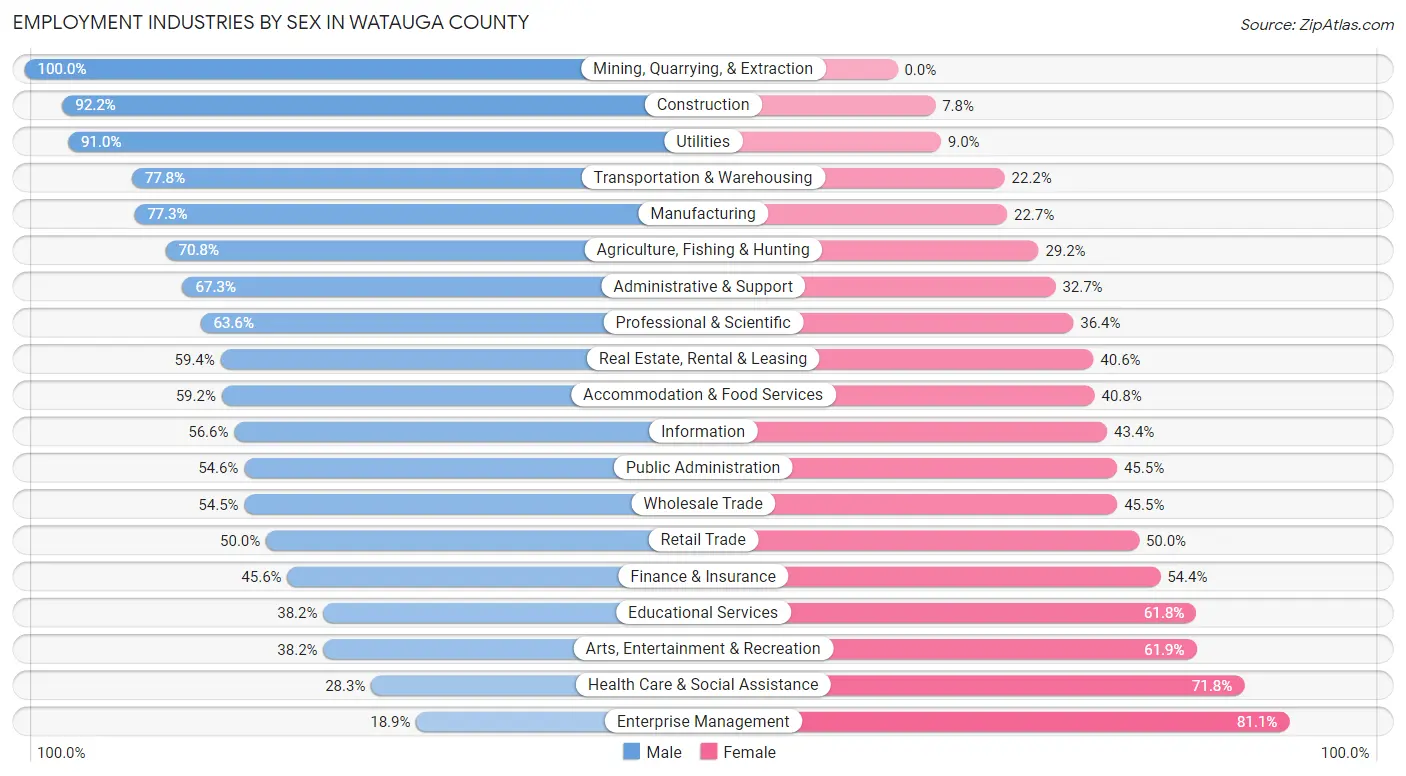
| Industry | Male | Female |
| Agriculture, Fishing & Hunting | 148 (70.8%) | 61 (29.2%) |
| Mining, Quarrying, & Extraction | 34 (100.0%) | 0 (0.0%) |
| Construction | 1,684 (92.2%) | 143 (7.8%) |
| Manufacturing | 811 (77.3%) | 238 (22.7%) |
| Wholesale Trade | 218 (54.5%) | 182 (45.5%) |
| Retail Trade | 2,160 (50.0%) | 2,159 (50.0%) |
| Transportation & Warehousing | 505 (77.8%) | 144 (22.2%) |
| Utilities | 81 (91.0%) | 8 (9.0%) |
| Information | 206 (56.6%) | 158 (43.4%) |
| Finance & Insurance | 249 (45.6%) | 297 (54.4%) |
| Real Estate, Rental & Leasing | 561 (59.4%) | 383 (40.6%) |
| Professional & Scientific | 688 (63.6%) | 394 (36.4%) |
| Enterprise Management | 14 (18.9%) | 60 (81.1%) |
| Administrative & Support | 541 (67.3%) | 263 (32.7%) |
| Educational Services | 1,790 (38.2%) | 2,900 (61.8%) |
| Health Care & Social Assistance | 731 (28.2%) | 1,857 (71.8%) |
| Arts, Entertainment & Recreation | 280 (38.2%) | 454 (61.9%) |
| Accommodation & Food Services | 2,322 (59.2%) | 1,600 (40.8%) |
| Public Administration | 384 (54.5%) | 320 (45.5%) |
| Total | 14,109 (53.4%) | 12,295 (46.6%) |
Education in Watauga County
School Enrollment in Watauga County
The most common levels of schooling among the 21,491 students in Watauga County are college / undergraduate (14,444 | 67.2%), high school (1,731 | 8.1%), and elementary school (1,600 | 7.4%).
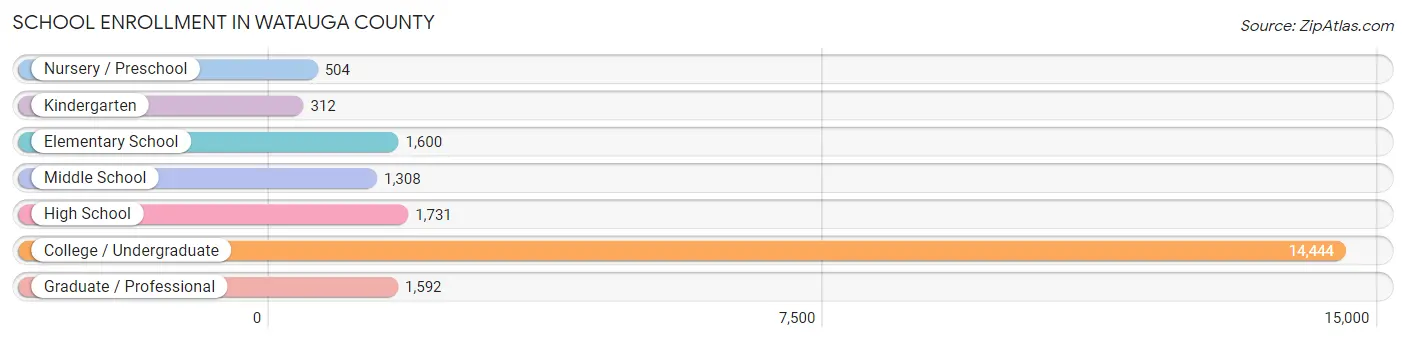
| School Level | # Students | % Students |
| Nursery / Preschool | 504 | 2.4% |
| Kindergarten | 312 | 1.5% |
| Elementary School | 1,600 | 7.4% |
| Middle School | 1,308 | 6.1% |
| High School | 1,731 | 8.1% |
| College / Undergraduate | 14,444 | 67.2% |
| Graduate / Professional | 1,592 | 7.4% |
| Total | 21,491 | 100.0% |
School Enrollment by Age by Funding Source in Watauga County
Out of a total of 21,491 students who are enrolled in schools in Watauga County, 1,289 (6.0%) attend a private institution, while the remaining 20,202 (94.0%) are enrolled in public schools. The age group of 3 to 4 year olds has the highest likelihood of being enrolled in private schools, with 170 (41.6% in the age bracket) enrolled. Conversely, the age group of 18 to 19 year olds has the lowest likelihood of being enrolled in a private school, with 6,110 (99.6% in the age bracket) attending a public institution.
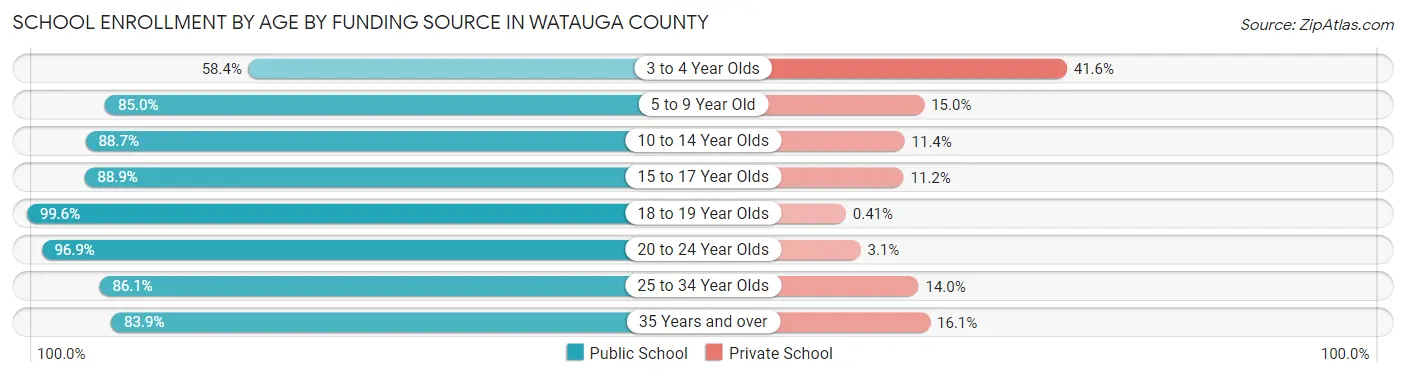
| Age Bracket | Public School | Private School |
| 3 to 4 Year Olds | 239 (58.4%) | 170 (41.6%) |
| 5 to 9 Year Old | 1,568 (85.0%) | 277 (15.0%) |
| 10 to 14 Year Olds | 1,562 (88.6%) | 200 (11.4%) |
| 15 to 17 Year Olds | 1,068 (88.8%) | 134 (11.2%) |
| 18 to 19 Year Olds | 6,110 (99.6%) | 25 (0.4%) |
| 20 to 24 Year Olds | 8,413 (96.9%) | 273 (3.1%) |
| 25 to 34 Year Olds | 870 (86.1%) | 141 (14.0%) |
| 35 Years and over | 370 (83.9%) | 71 (16.1%) |
| Total | 20,202 (94.0%) | 1,289 (6.0%) |
Educational Attainment by Field of Study in Watauga County
Education (2,276 | 15.1%), business (1,995 | 13.3%), science & technology (1,413 | 9.4%), literature & languages (1,226 | 8.2%), and visual & performing arts (1,129 | 7.5%) are the most common fields of study among 15,037 individuals in Watauga County who have obtained a bachelor's degree or higher.
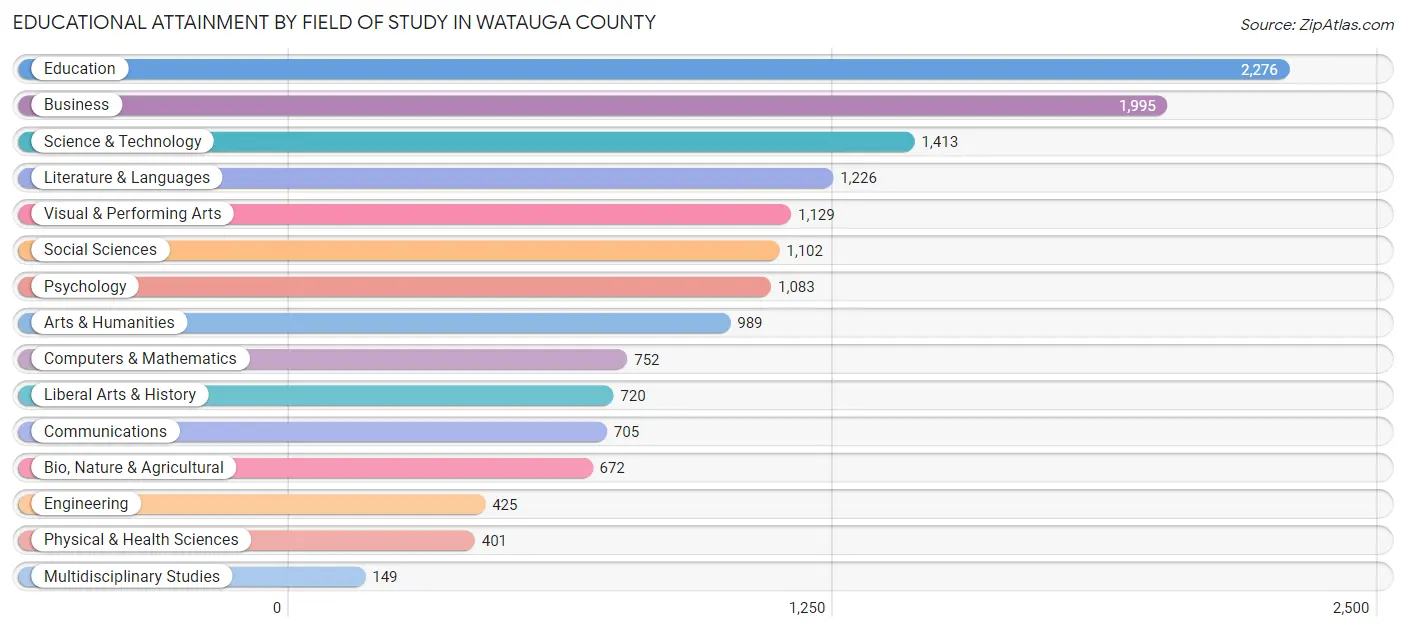
| Field of Study | # Graduates | % Graduates |
| Computers & Mathematics | 752 | 5.0% |
| Bio, Nature & Agricultural | 672 | 4.5% |
| Physical & Health Sciences | 401 | 2.7% |
| Psychology | 1,083 | 7.2% |
| Social Sciences | 1,102 | 7.3% |
| Engineering | 425 | 2.8% |
| Multidisciplinary Studies | 149 | 1.0% |
| Science & Technology | 1,413 | 9.4% |
| Business | 1,995 | 13.3% |
| Education | 2,276 | 15.1% |
| Literature & Languages | 1,226 | 8.2% |
| Liberal Arts & History | 720 | 4.8% |
| Visual & Performing Arts | 1,129 | 7.5% |
| Communications | 705 | 4.7% |
| Arts & Humanities | 989 | 6.6% |
| Total | 15,037 | 100.0% |
Transportation & Commute in Watauga County
Vehicle Availability by Sex in Watauga County
The most prevalent vehicle ownership categories in Watauga County are males with 2 vehicles (5,321, accounting for 40.0%) and females with 2 vehicles (4,861, making up 46.5%).
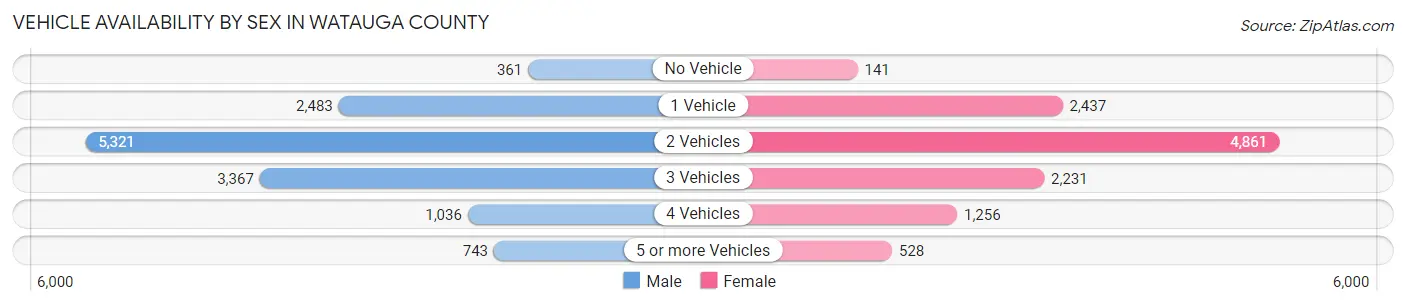
| Vehicles Available | Male | Female |
| No Vehicle | 361 (2.7%) | 141 (1.2%) |
| 1 Vehicle | 2,483 (18.6%) | 2,437 (21.3%) |
| 2 Vehicles | 5,321 (40.0%) | 4,861 (42.4%) |
| 3 Vehicles | 3,367 (25.3%) | 2,231 (19.5%) |
| 4 Vehicles | 1,036 (7.8%) | 1,256 (11.0%) |
| 5 or more Vehicles | 743 (5.6%) | 528 (4.6%) |
| Total | 13,311 (100.0%) | 11,454 (100.0%) |
Commute Time in Watauga County
The most frequently occuring commute durations in Watauga County are 10 to 14 minutes (5,009 commuters, 21.7%), 15 to 19 minutes (4,517 commuters, 19.6%), and 20 to 24 minutes (3,549 commuters, 15.4%).
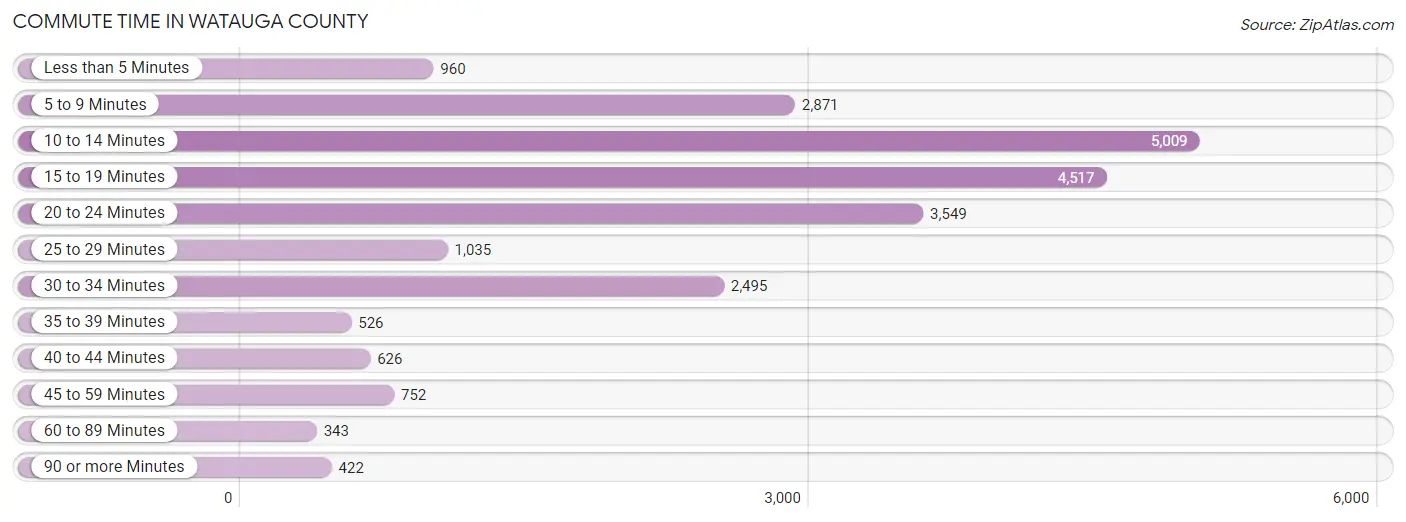
| Commute Time | # Commuters | % Commuters |
| Less than 5 Minutes | 960 | 4.2% |
| 5 to 9 Minutes | 2,871 | 12.4% |
| 10 to 14 Minutes | 5,009 | 21.7% |
| 15 to 19 Minutes | 4,517 | 19.6% |
| 20 to 24 Minutes | 3,549 | 15.4% |
| 25 to 29 Minutes | 1,035 | 4.5% |
| 30 to 34 Minutes | 2,495 | 10.8% |
| 35 to 39 Minutes | 526 | 2.3% |
| 40 to 44 Minutes | 626 | 2.7% |
| 45 to 59 Minutes | 752 | 3.3% |
| 60 to 89 Minutes | 343 | 1.5% |
| 90 or more Minutes | 422 | 1.8% |
Commute Time by Sex in Watauga County
The most common commute times in Watauga County are 15 to 19 minutes (2,714 commuters, 21.9%) for males and 10 to 14 minutes (2,852 commuters, 26.6%) for females.
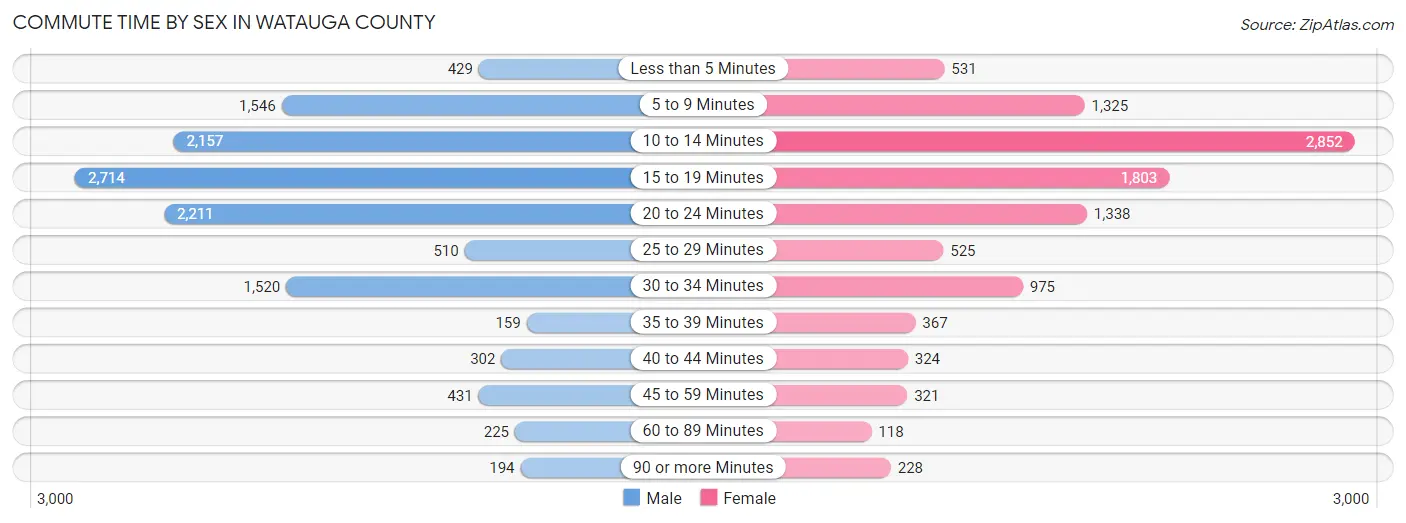
| Commute Time | Male | Female |
| Less than 5 Minutes | 429 (3.5%) | 531 (5.0%) |
| 5 to 9 Minutes | 1,546 (12.5%) | 1,325 (12.4%) |
| 10 to 14 Minutes | 2,157 (17.4%) | 2,852 (26.6%) |
| 15 to 19 Minutes | 2,714 (21.9%) | 1,803 (16.8%) |
| 20 to 24 Minutes | 2,211 (17.8%) | 1,338 (12.5%) |
| 25 to 29 Minutes | 510 (4.1%) | 525 (4.9%) |
| 30 to 34 Minutes | 1,520 (12.3%) | 975 (9.1%) |
| 35 to 39 Minutes | 159 (1.3%) | 367 (3.4%) |
| 40 to 44 Minutes | 302 (2.4%) | 324 (3.0%) |
| 45 to 59 Minutes | 431 (3.5%) | 321 (3.0%) |
| 60 to 89 Minutes | 225 (1.8%) | 118 (1.1%) |
| 90 or more Minutes | 194 (1.6%) | 228 (2.1%) |
Time of Departure to Work by Sex in Watauga County
The most frequent times of departure to work in Watauga County are 7:30 AM to 7:59 AM (2,312, 18.6%) for males and 7:30 AM to 7:59 AM (2,008, 18.8%) for females.
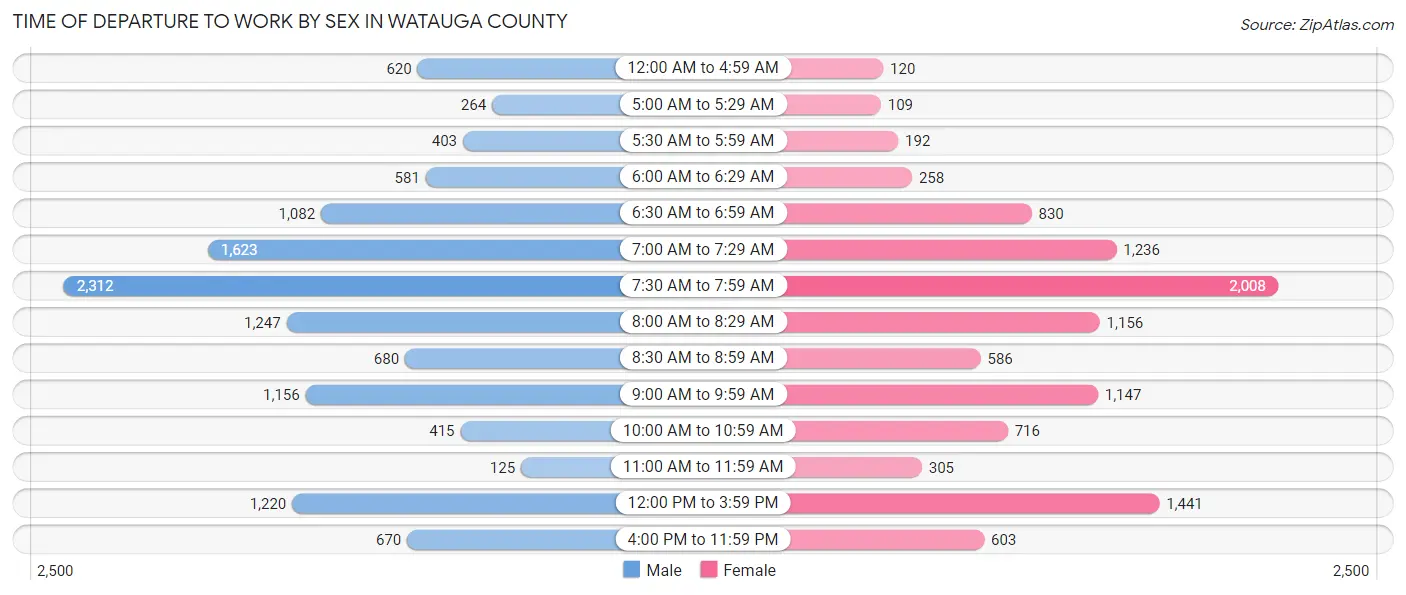
| Time of Departure | Male | Female |
| 12:00 AM to 4:59 AM | 620 (5.0%) | 120 (1.1%) |
| 5:00 AM to 5:29 AM | 264 (2.1%) | 109 (1.0%) |
| 5:30 AM to 5:59 AM | 403 (3.3%) | 192 (1.8%) |
| 6:00 AM to 6:29 AM | 581 (4.7%) | 258 (2.4%) |
| 6:30 AM to 6:59 AM | 1,082 (8.7%) | 830 (7.7%) |
| 7:00 AM to 7:29 AM | 1,623 (13.1%) | 1,236 (11.5%) |
| 7:30 AM to 7:59 AM | 2,312 (18.6%) | 2,008 (18.8%) |
| 8:00 AM to 8:29 AM | 1,247 (10.1%) | 1,156 (10.8%) |
| 8:30 AM to 8:59 AM | 680 (5.5%) | 586 (5.5%) |
| 9:00 AM to 9:59 AM | 1,156 (9.3%) | 1,147 (10.7%) |
| 10:00 AM to 10:59 AM | 415 (3.4%) | 716 (6.7%) |
| 11:00 AM to 11:59 AM | 125 (1.0%) | 305 (2.9%) |
| 12:00 PM to 3:59 PM | 1,220 (9.8%) | 1,441 (13.5%) |
| 4:00 PM to 11:59 PM | 670 (5.4%) | 603 (5.6%) |
| Total | 12,398 (100.0%) | 10,707 (100.0%) |
Housing Occupancy in Watauga County
Occupancy by Ownership in Watauga County
Of the total 21,194 dwellings in Watauga County, owner-occupied units account for 12,922 (61.0%), while renter-occupied units make up 8,272 (39.0%).
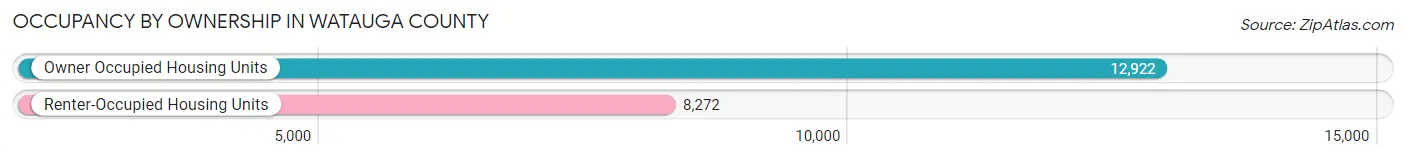
| Occupancy | # Housing Units | % Housing Units |
| Owner Occupied Housing Units | 12,922 | 61.0% |
| Renter-Occupied Housing Units | 8,272 | 39.0% |
| Total Occupied Housing Units | 21,194 | 100.0% |
Occupancy by Household Size in Watauga County
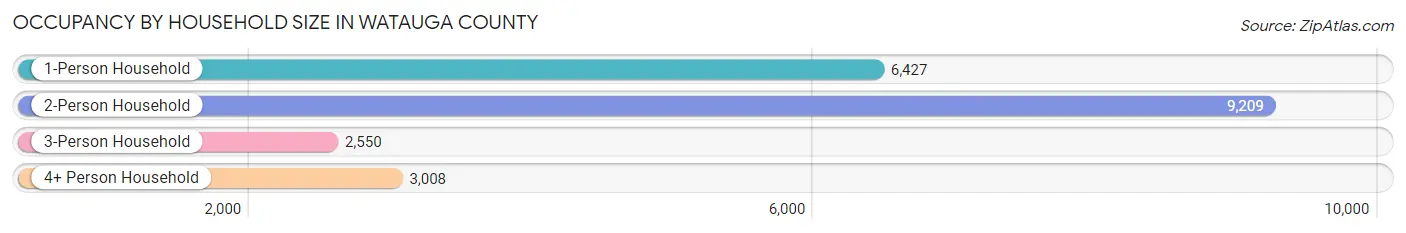
| Household Size | # Housing Units | % Housing Units |
| 1-Person Household | 6,427 | 30.3% |
| 2-Person Household | 9,209 | 43.4% |
| 3-Person Household | 2,550 | 12.0% |
| 4+ Person Household | 3,008 | 14.2% |
| Total Housing Units | 21,194 | 100.0% |
Occupancy by Ownership by Household Size in Watauga County
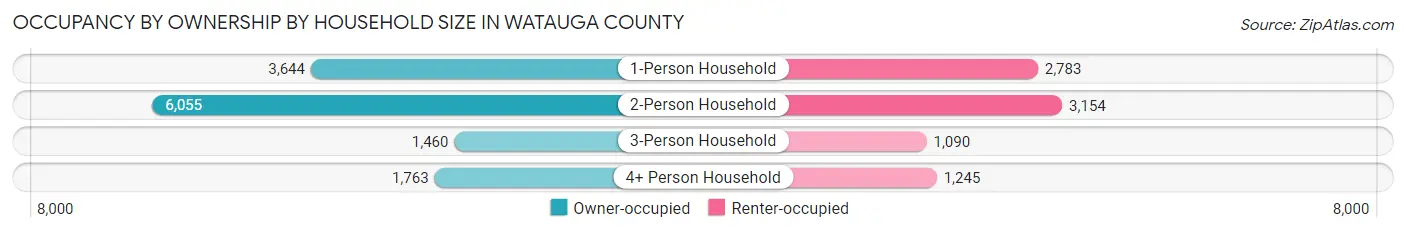
| Household Size | Owner-occupied | Renter-occupied |
| 1-Person Household | 3,644 (56.7%) | 2,783 (43.3%) |
| 2-Person Household | 6,055 (65.7%) | 3,154 (34.3%) |
| 3-Person Household | 1,460 (57.3%) | 1,090 (42.7%) |
| 4+ Person Household | 1,763 (58.6%) | 1,245 (41.4%) |
| Total Housing Units | 12,922 (61.0%) | 8,272 (39.0%) |
Occupancy by Educational Attainment in Watauga County

| Household Size | Owner-occupied | Renter-occupied |
| Less than High School | 683 (60.1%) | 453 (39.9%) |
| High School Diploma | 2,780 (66.2%) | 1,417 (33.8%) |
| College/Associate Degree | 3,004 (43.1%) | 3,969 (56.9%) |
| Bachelor's Degree or higher | 6,455 (72.6%) | 2,433 (27.4%) |
Occupancy by Age of Householder in Watauga County
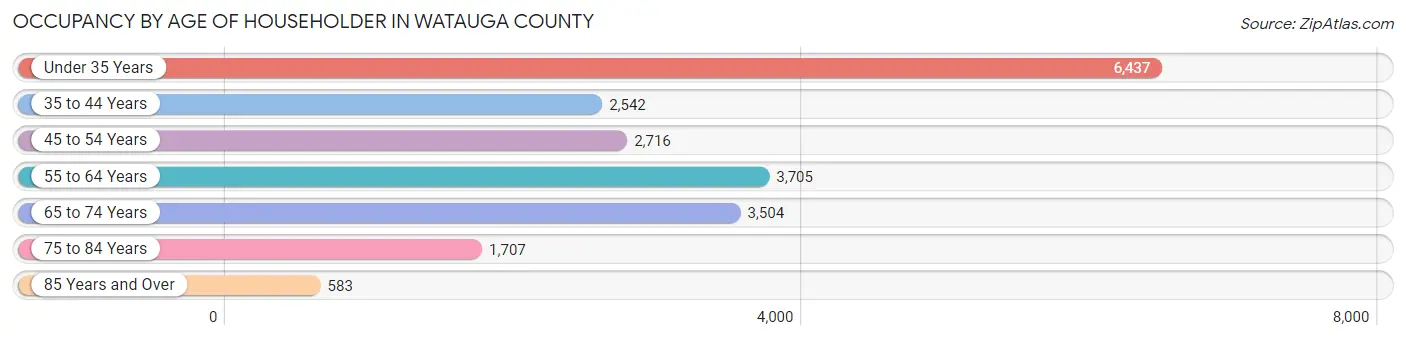
| Age Bracket | # Households | % Households |
| Under 35 Years | 6,437 | 30.4% |
| 35 to 44 Years | 2,542 | 12.0% |
| 45 to 54 Years | 2,716 | 12.8% |
| 55 to 64 Years | 3,705 | 17.5% |
| 65 to 74 Years | 3,504 | 16.5% |
| 75 to 84 Years | 1,707 | 8.1% |
| 85 Years and Over | 583 | 2.8% |
| Total | 21,194 | 100.0% |
Housing Finances in Watauga County
Median Income by Occupancy in Watauga County
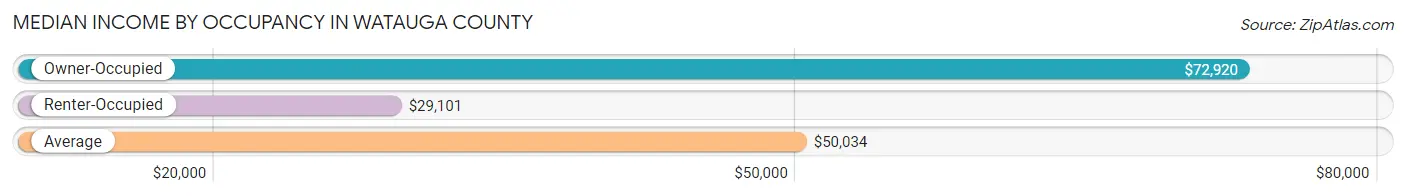
| Occupancy Type | # Households | Median Income |
| Owner-Occupied | 12,922 (61.0%) | $72,920 |
| Renter-Occupied | 8,272 (39.0%) | $29,101 |
| Average | 21,194 (100.0%) | $50,034 |
Occupancy by Householder Income Bracket in Watauga County
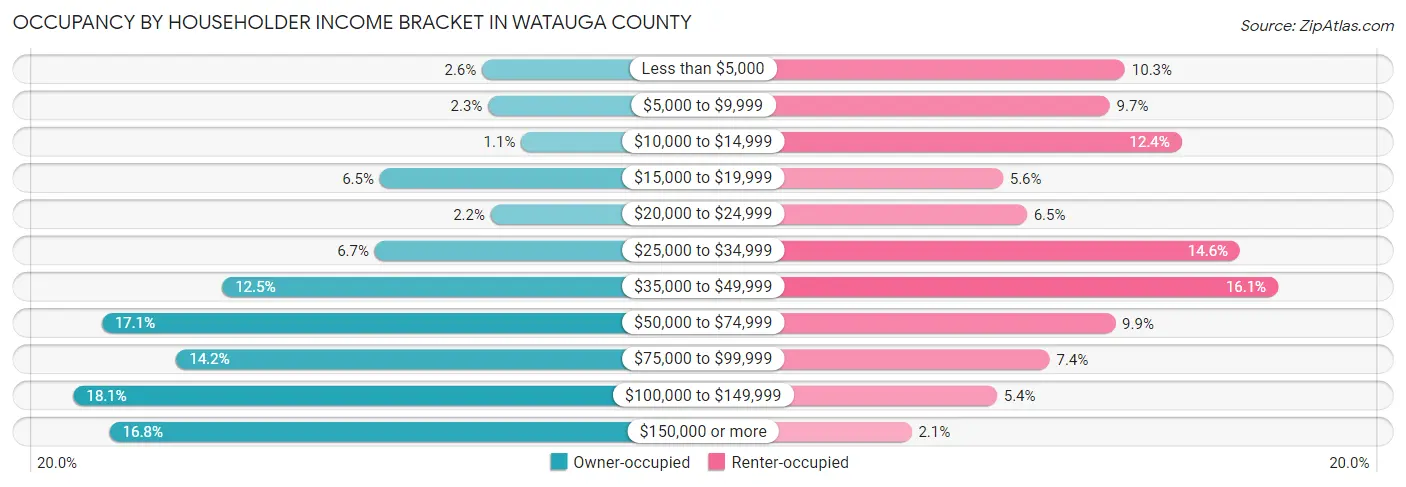
| Income Bracket | Owner-occupied | Renter-occupied |
| Less than $5,000 | 332 (2.6%) | 849 (10.3%) |
| $5,000 to $9,999 | 302 (2.3%) | 801 (9.7%) |
| $10,000 to $14,999 | 139 (1.1%) | 1,027 (12.4%) |
| $15,000 to $19,999 | 836 (6.5%) | 464 (5.6%) |
| $20,000 to $24,999 | 290 (2.2%) | 539 (6.5%) |
| $25,000 to $34,999 | 861 (6.7%) | 1,211 (14.6%) |
| $35,000 to $49,999 | 1,611 (12.5%) | 1,331 (16.1%) |
| $50,000 to $74,999 | 2,204 (17.1%) | 818 (9.9%) |
| $75,000 to $99,999 | 1,837 (14.2%) | 611 (7.4%) |
| $100,000 to $149,999 | 2,344 (18.1%) | 445 (5.4%) |
| $150,000 or more | 2,166 (16.8%) | 176 (2.1%) |
| Total | 12,922 (100.0%) | 8,272 (100.0%) |
Monthly Housing Cost Tiers in Watauga County
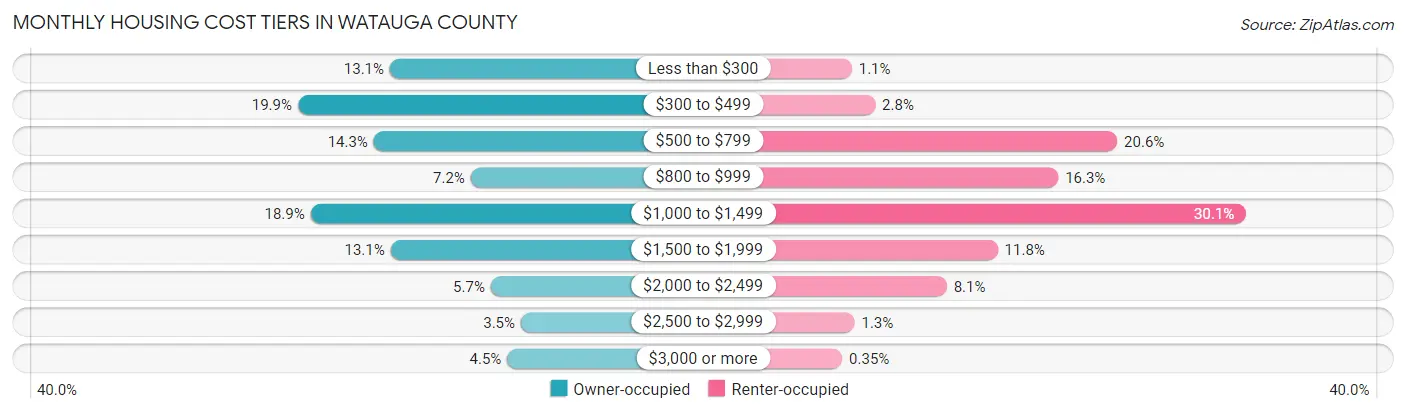
| Monthly Cost | Owner-occupied | Renter-occupied |
| Less than $300 | 1,693 (13.1%) | 88 (1.1%) |
| $300 to $499 | 2,569 (19.9%) | 230 (2.8%) |
| $500 to $799 | 1,847 (14.3%) | 1,704 (20.6%) |
| $800 to $999 | 924 (7.1%) | 1,345 (16.3%) |
| $1,000 to $1,499 | 2,448 (18.9%) | 2,490 (30.1%) |
| $1,500 to $1,999 | 1,686 (13.1%) | 976 (11.8%) |
| $2,000 to $2,499 | 733 (5.7%) | 666 (8.1%) |
| $2,500 to $2,999 | 446 (3.5%) | 104 (1.3%) |
| $3,000 or more | 576 (4.5%) | 29 (0.4%) |
| Total | 12,922 (100.0%) | 8,272 (100.0%) |
Physical Housing Characteristics in Watauga County
Housing Structures in Watauga County
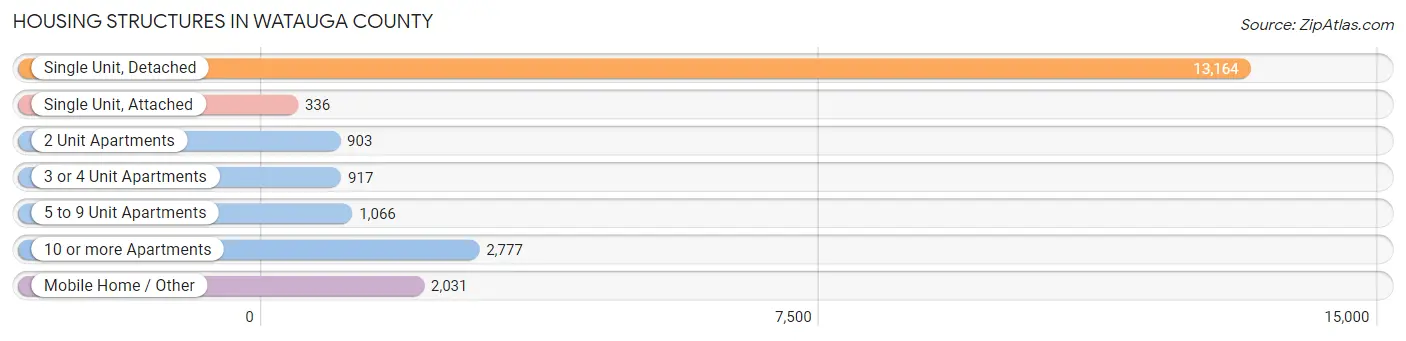
| Structure Type | # Housing Units | % Housing Units |
| Single Unit, Detached | 13,164 | 62.1% |
| Single Unit, Attached | 336 | 1.6% |
| 2 Unit Apartments | 903 | 4.3% |
| 3 or 4 Unit Apartments | 917 | 4.3% |
| 5 to 9 Unit Apartments | 1,066 | 5.0% |
| 10 or more Apartments | 2,777 | 13.1% |
| Mobile Home / Other | 2,031 | 9.6% |
| Total | 21,194 | 100.0% |
Housing Structures by Occupancy in Watauga County
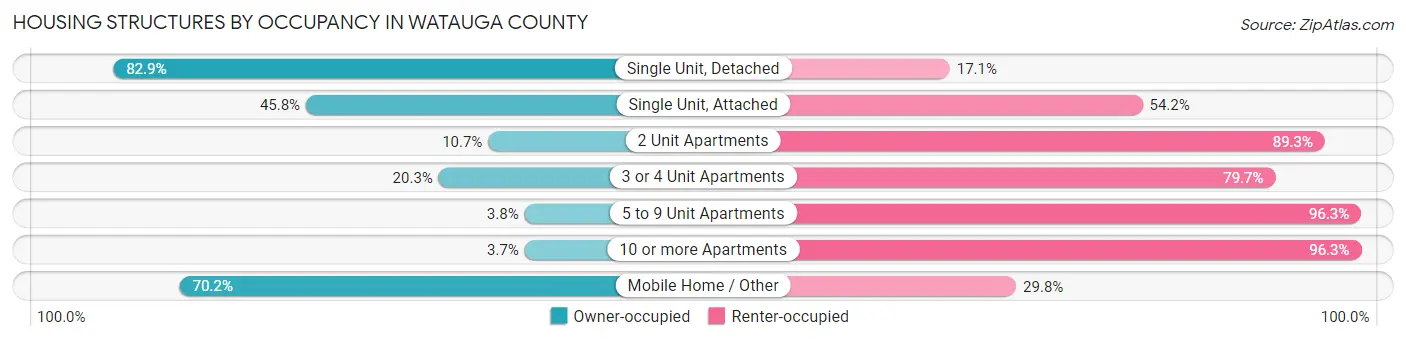
| Structure Type | Owner-occupied | Renter-occupied |
| Single Unit, Detached | 10,917 (82.9%) | 2,247 (17.1%) |
| Single Unit, Attached | 154 (45.8%) | 182 (54.2%) |
| 2 Unit Apartments | 97 (10.7%) | 806 (89.3%) |
| 3 or 4 Unit Apartments | 186 (20.3%) | 731 (79.7%) |
| 5 to 9 Unit Apartments | 40 (3.7%) | 1,026 (96.3%) |
| 10 or more Apartments | 103 (3.7%) | 2,674 (96.3%) |
| Mobile Home / Other | 1,425 (70.2%) | 606 (29.8%) |
| Total | 12,922 (61.0%) | 8,272 (39.0%) |
Housing Structures by Number of Rooms in Watauga County
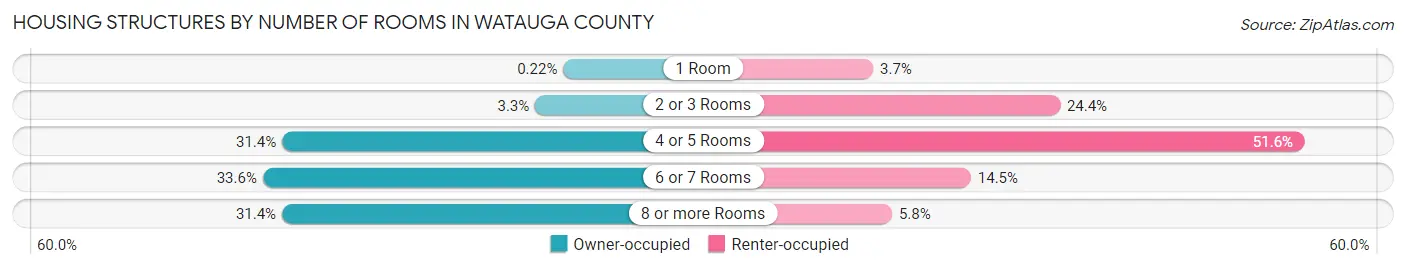
| Number of Rooms | Owner-occupied | Renter-occupied |
| 1 Room | 29 (0.2%) | 304 (3.7%) |
| 2 or 3 Rooms | 431 (3.3%) | 2,020 (24.4%) |
| 4 or 5 Rooms | 4,061 (31.4%) | 4,268 (51.6%) |
| 6 or 7 Rooms | 4,338 (33.6%) | 1,202 (14.5%) |
| 8 or more Rooms | 4,063 (31.4%) | 478 (5.8%) |
| Total | 12,922 (100.0%) | 8,272 (100.0%) |
Housing Structure by Heating Type in Watauga County
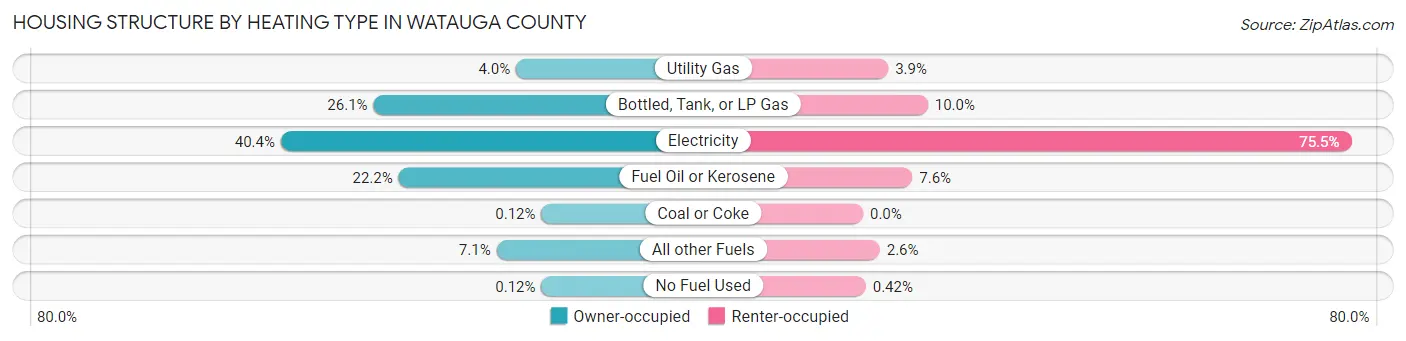
| Heating Type | Owner-occupied | Renter-occupied |
| Utility Gas | 521 (4.0%) | 322 (3.9%) |
| Bottled, Tank, or LP Gas | 3,370 (26.1%) | 828 (10.0%) |
| Electricity | 5,220 (40.4%) | 6,243 (75.5%) |
| Fuel Oil or Kerosene | 2,868 (22.2%) | 630 (7.6%) |
| Coal or Coke | 16 (0.1%) | 0 (0.0%) |
| All other Fuels | 911 (7.0%) | 214 (2.6%) |
| No Fuel Used | 16 (0.1%) | 35 (0.4%) |
| Total | 12,922 (100.0%) | 8,272 (100.0%) |
Household Vehicle Usage in Watauga County
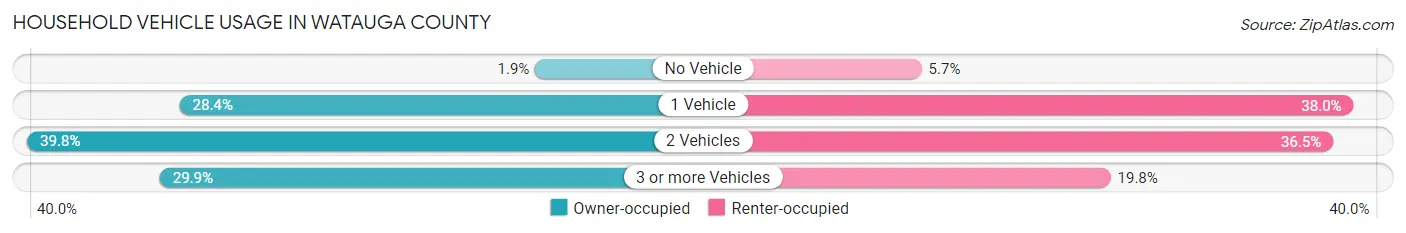
| Vehicles per Household | Owner-occupied | Renter-occupied |
| No Vehicle | 242 (1.9%) | 474 (5.7%) |
| 1 Vehicle | 3,672 (28.4%) | 3,141 (38.0%) |
| 2 Vehicles | 5,144 (39.8%) | 3,016 (36.5%) |
| 3 or more Vehicles | 3,864 (29.9%) | 1,641 (19.8%) |
| Total | 12,922 (100.0%) | 8,272 (100.0%) |
Real Estate & Mortgages in Watauga County
Real Estate and Mortgage Overview in Watauga County
| Characteristic | Without Mortgage | With Mortgage |
| Housing Units | 6,184 | 6,738 |
| Median Property Value | $259,800 | $305,700 |
| Median Household Income | $56,537 | $1,494 |
| Monthly Housing Costs | $411 | $554 |
| Real Estate Taxes | $1,111 | $20 |
Property Value by Mortgage Status in Watauga County
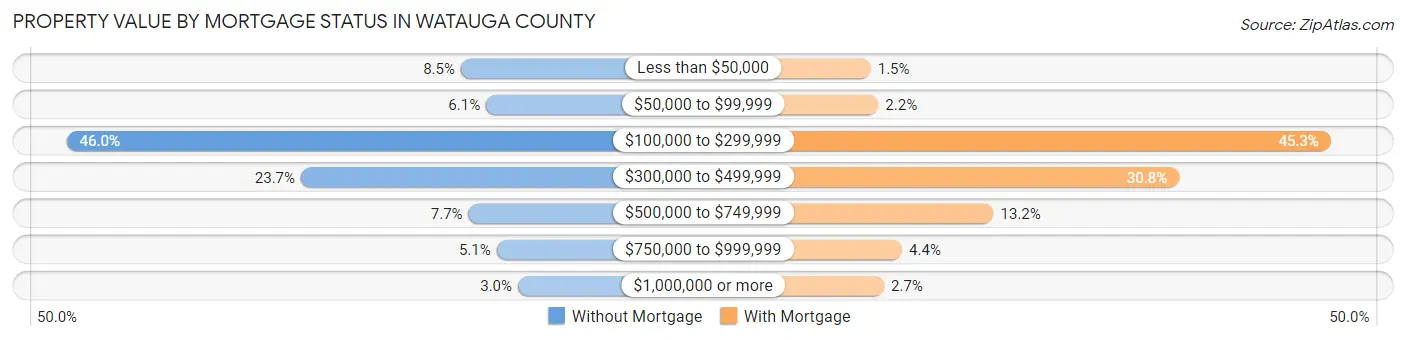
| Property Value | Without Mortgage | With Mortgage |
| Less than $50,000 | 523 (8.5%) | 98 (1.5%) |
| $50,000 to $99,999 | 375 (6.1%) | 147 (2.2%) |
| $100,000 to $299,999 | 2,844 (46.0%) | 3,049 (45.3%) |
| $300,000 to $499,999 | 1,465 (23.7%) | 2,076 (30.8%) |
| $500,000 to $749,999 | 478 (7.7%) | 886 (13.2%) |
| $750,000 to $999,999 | 312 (5.1%) | 299 (4.4%) |
| $1,000,000 or more | 187 (3.0%) | 183 (2.7%) |
| Total | 6,184 (100.0%) | 6,738 (100.0%) |
Household Income by Mortgage Status in Watauga County
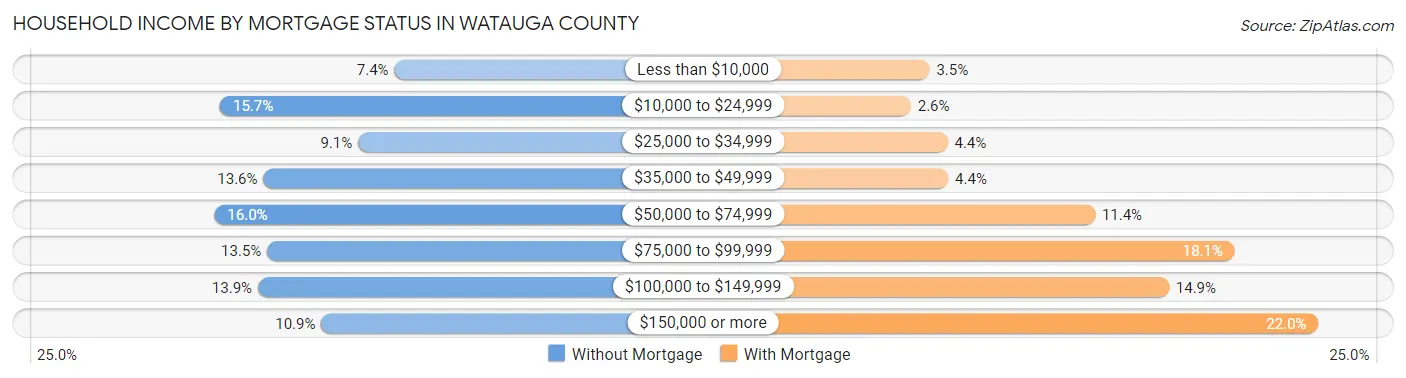
| Household Income | Without Mortgage | With Mortgage |
| Less than $10,000 | 457 (7.4%) | 237 (3.5%) |
| $10,000 to $24,999 | 970 (15.7%) | 177 (2.6%) |
| $25,000 to $34,999 | 564 (9.1%) | 295 (4.4%) |
| $35,000 to $49,999 | 843 (13.6%) | 297 (4.4%) |
| $50,000 to $74,999 | 987 (16.0%) | 768 (11.4%) |
| $75,000 to $99,999 | 832 (13.5%) | 1,217 (18.1%) |
| $100,000 to $149,999 | 859 (13.9%) | 1,005 (14.9%) |
| $150,000 or more | 672 (10.9%) | 1,485 (22.0%) |
| Total | 6,184 (100.0%) | 6,738 (100.0%) |
Property Value to Household Income Ratio in Watauga County
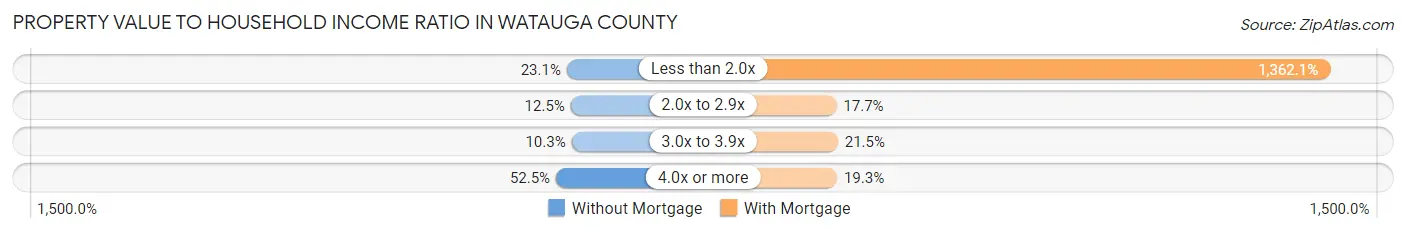
| Value-to-Income Ratio | Without Mortgage | With Mortgage |
| Less than 2.0x | 1,431 (23.1%) | 91,779 (1,362.1%) |
| 2.0x to 2.9x | 773 (12.5%) | 1,194 (17.7%) |
| 3.0x to 3.9x | 634 (10.2%) | 1,447 (21.5%) |
| 4.0x or more | 3,246 (52.5%) | 1,298 (19.3%) |
| Total | 6,184 (100.0%) | 6,738 (100.0%) |
Real Estate Taxes by Mortgage Status in Watauga County
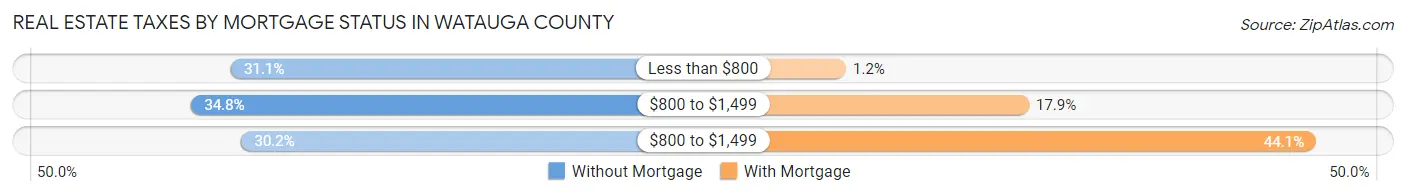
| Property Taxes | Without Mortgage | With Mortgage |
| Less than $800 | 1,926 (31.1%) | 80 (1.2%) |
| $800 to $1,499 | 2,150 (34.8%) | 1,206 (17.9%) |
| $800 to $1,499 | 1,868 (30.2%) | 2,972 (44.1%) |
| Total | 6,184 (100.0%) | 6,738 (100.0%) |
Health & Disability in Watauga County
Health Insurance Coverage by Age in Watauga County
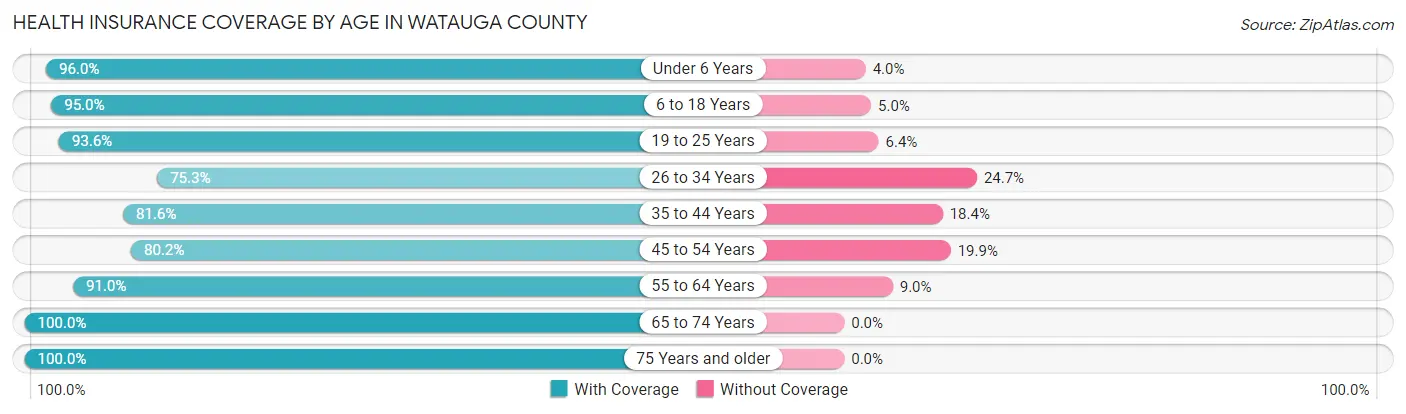
| Age Bracket | With Coverage | Without Coverage |
| Under 6 Years | 1,920 (96.0%) | 80 (4.0%) |
| 6 to 18 Years | 6,765 (95.0%) | 355 (5.0%) |
| 19 to 25 Years | 14,224 (93.6%) | 972 (6.4%) |
| 26 to 34 Years | 3,443 (75.3%) | 1,132 (24.7%) |
| 35 to 44 Years | 4,094 (81.6%) | 921 (18.4%) |
| 45 to 54 Years | 4,273 (80.1%) | 1,058 (19.9%) |
| 55 to 64 Years | 5,754 (91.0%) | 572 (9.0%) |
| 65 to 74 Years | 5,410 (100.0%) | 0 (0.0%) |
| 75 Years and older | 3,299 (100.0%) | 0 (0.0%) |
| Total | 49,182 (90.6%) | 5,090 (9.4%) |
Health Insurance Coverage by Citizenship Status in Watauga County
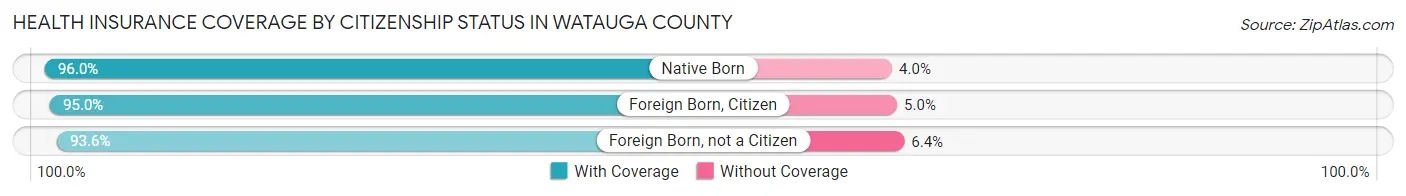
| Citizenship Status | With Coverage | Without Coverage |
| Native Born | 1,920 (96.0%) | 80 (4.0%) |
| Foreign Born, Citizen | 6,765 (95.0%) | 355 (5.0%) |
| Foreign Born, not a Citizen | 14,224 (93.6%) | 972 (6.4%) |
Health Insurance Coverage by Household Income in Watauga County
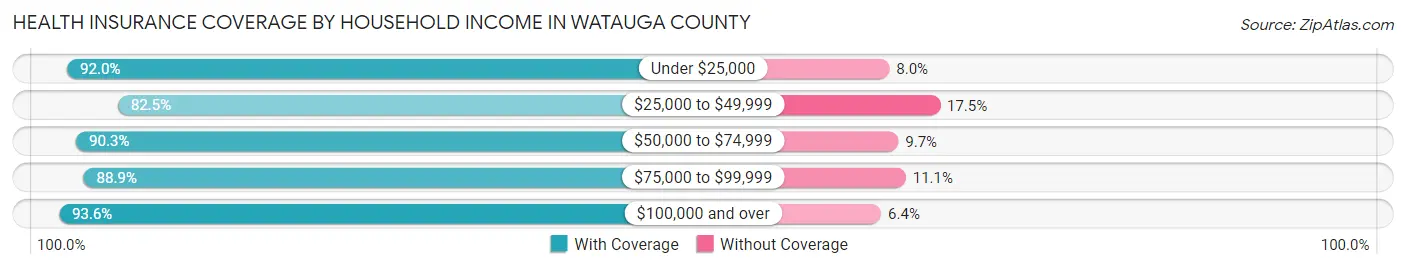
| Household Income | With Coverage | Without Coverage |
| Under $25,000 | 9,702 (92.0%) | 841 (8.0%) |
| $25,000 to $49,999 | 9,026 (82.5%) | 1,911 (17.5%) |
| $50,000 to $74,999 | 5,828 (90.3%) | 623 (9.7%) |
| $75,000 to $99,999 | 5,516 (88.9%) | 686 (11.1%) |
| $100,000 and over | 13,642 (93.6%) | 939 (6.4%) |
Public vs Private Health Insurance Coverage by Age in Watauga County
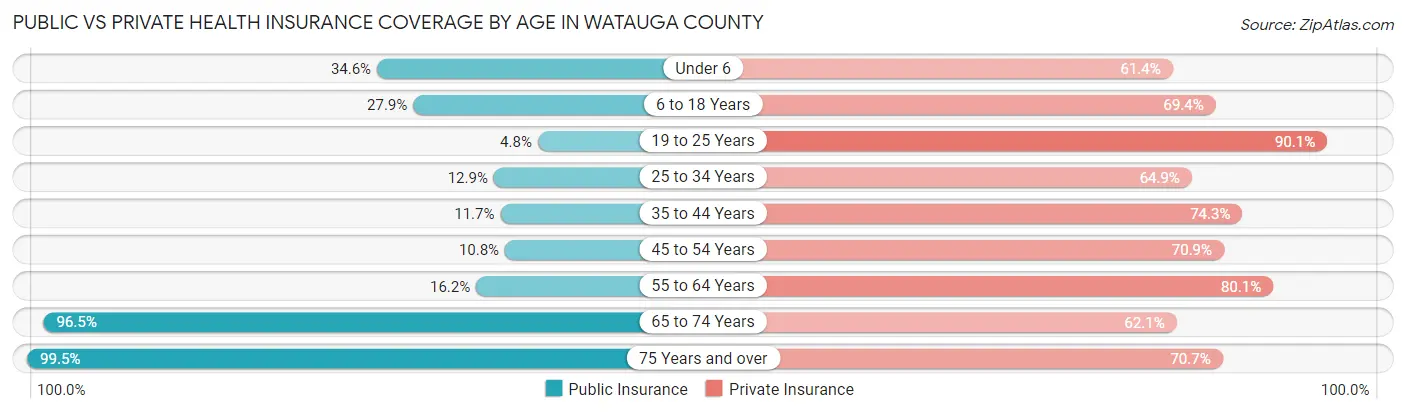
| Age Bracket | Public Insurance | Private Insurance |
| Under 6 | 692 (34.6%) | 1,228 (61.4%) |
| 6 to 18 Years | 1,986 (27.9%) | 4,940 (69.4%) |
| 19 to 25 Years | 722 (4.8%) | 13,685 (90.1%) |
| 25 to 34 Years | 591 (12.9%) | 2,971 (64.9%) |
| 35 to 44 Years | 587 (11.7%) | 3,727 (74.3%) |
| 45 to 54 Years | 578 (10.8%) | 3,780 (70.9%) |
| 55 to 64 Years | 1,025 (16.2%) | 5,064 (80.0%) |
| 65 to 74 Years | 5,220 (96.5%) | 3,362 (62.1%) |
| 75 Years and over | 3,283 (99.5%) | 2,331 (70.7%) |
| Total | 14,684 (27.1%) | 41,088 (75.7%) |
Disability Status by Sex by Age in Watauga County
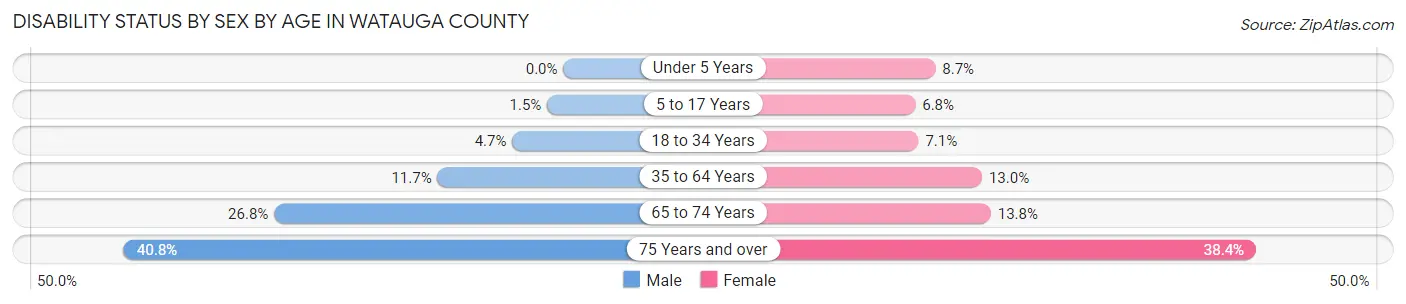
| Age Bracket | Male | Female |
| Under 5 Years | 0 (0.0%) | 68 (8.7%) |
| 5 to 17 Years | 38 (1.5%) | 167 (6.8%) |
| 18 to 34 Years | 527 (4.7%) | 796 (7.1%) |
| 35 to 64 Years | 985 (11.7%) | 1,072 (13.0%) |
| 65 to 74 Years | 703 (26.8%) | 386 (13.8%) |
| 75 Years and over | 630 (40.8%) | 674 (38.4%) |
Disability Class by Sex by Age in Watauga County
Disability Class: Hearing Difficulty
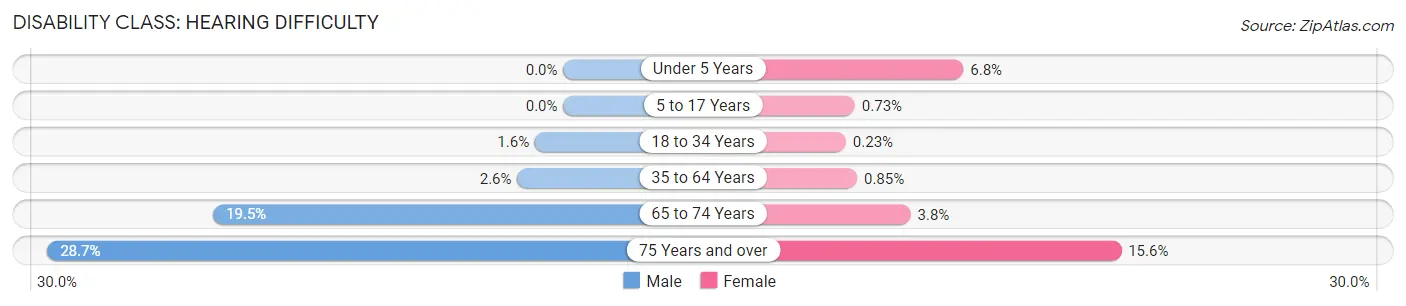
| Age Bracket | Male | Female |
| Under 5 Years | 0 (0.0%) | 53 (6.8%) |
| 5 to 17 Years | 0 (0.0%) | 18 (0.7%) |
| 18 to 34 Years | 175 (1.6%) | 26 (0.2%) |
| 35 to 64 Years | 216 (2.6%) | 70 (0.9%) |
| 65 to 74 Years | 511 (19.5%) | 107 (3.8%) |
| 75 Years and over | 444 (28.7%) | 273 (15.6%) |
Disability Class: Vision Difficulty
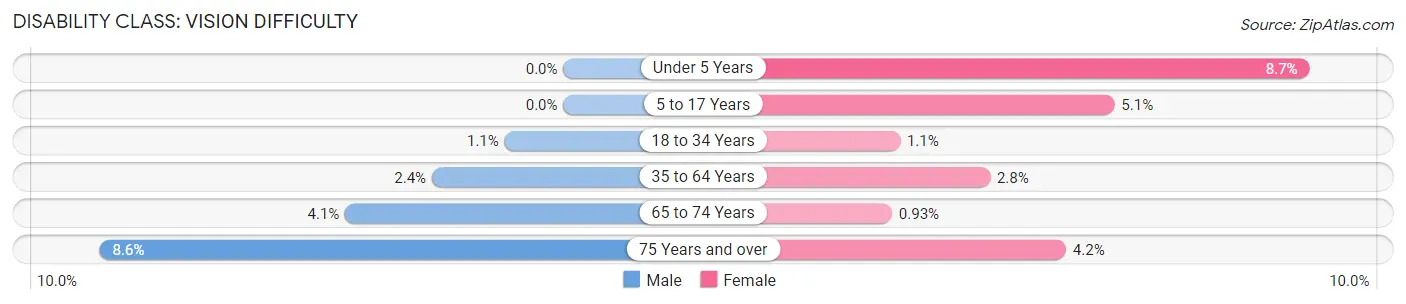
| Age Bracket | Male | Female |
| Under 5 Years | 0 (0.0%) | 68 (8.7%) |
| 5 to 17 Years | 0 (0.0%) | 124 (5.1%) |
| 18 to 34 Years | 121 (1.1%) | 121 (1.1%) |
| 35 to 64 Years | 206 (2.4%) | 227 (2.8%) |
| 65 to 74 Years | 106 (4.1%) | 26 (0.9%) |
| 75 Years and over | 133 (8.6%) | 73 (4.2%) |
Disability Class: Cognitive Difficulty
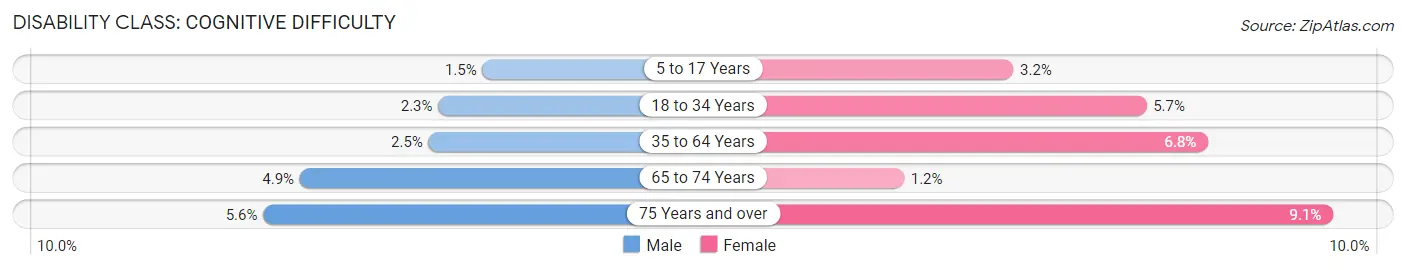
| Age Bracket | Male | Female |
| 5 to 17 Years | 38 (1.5%) | 78 (3.2%) |
| 18 to 34 Years | 258 (2.3%) | 632 (5.7%) |
| 35 to 64 Years | 211 (2.5%) | 560 (6.8%) |
| 65 to 74 Years | 128 (4.9%) | 32 (1.1%) |
| 75 Years and over | 86 (5.6%) | 160 (9.1%) |
Disability Class: Ambulatory Difficulty
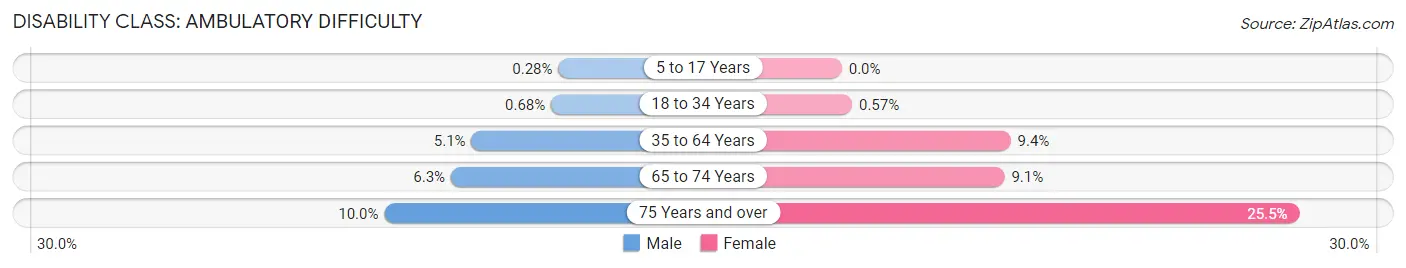
| Age Bracket | Male | Female |
| 5 to 17 Years | 7 (0.3%) | 0 (0.0%) |
| 18 to 34 Years | 75 (0.7%) | 64 (0.6%) |
| 35 to 64 Years | 432 (5.1%) | 775 (9.4%) |
| 65 to 74 Years | 164 (6.3%) | 253 (9.1%) |
| 75 Years and over | 154 (10.0%) | 447 (25.5%) |
Disability Class: Self-Care Difficulty
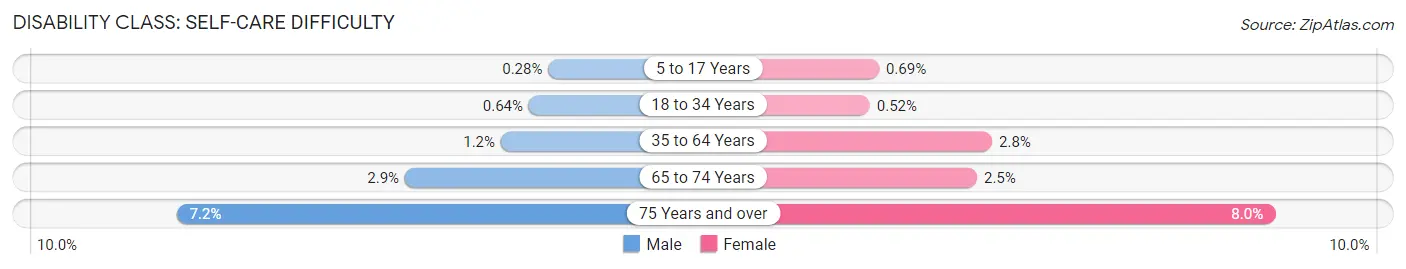
| Age Bracket | Male | Female |
| 5 to 17 Years | 7 (0.3%) | 17 (0.7%) |
| 18 to 34 Years | 71 (0.6%) | 58 (0.5%) |
| 35 to 64 Years | 98 (1.2%) | 230 (2.8%) |
| 65 to 74 Years | 77 (2.9%) | 70 (2.5%) |
| 75 Years and over | 111 (7.2%) | 141 (8.0%) |
Technology Access in Watauga County
Computing Device Access in Watauga County
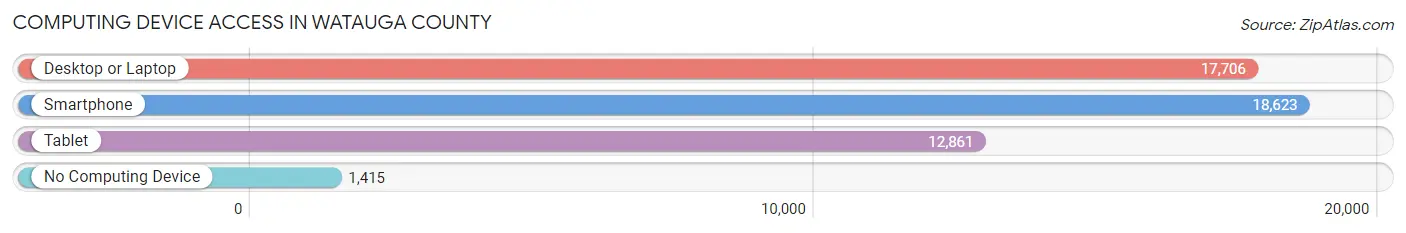
| Device Type | # Households | % Households |
| Desktop or Laptop | 17,706 | 83.5% |
| Smartphone | 18,623 | 87.9% |
| Tablet | 12,861 | 60.7% |
| No Computing Device | 1,415 | 6.7% |
| Total | 21,194 | 100.0% |
Internet Access in Watauga County
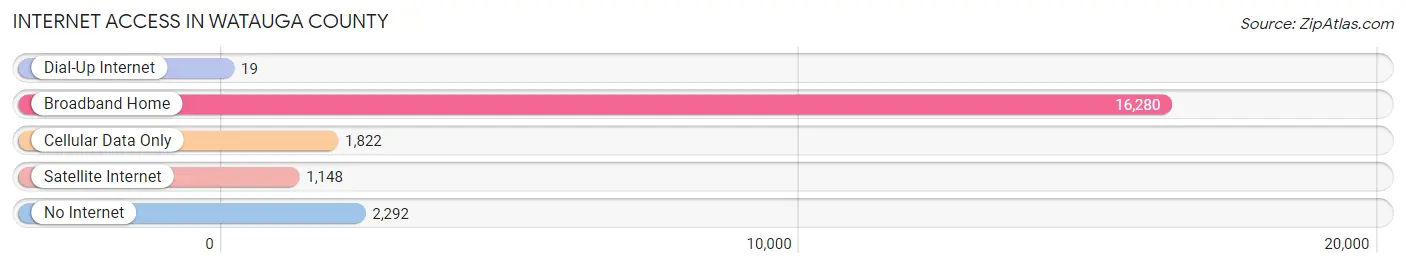
| Internet Type | # Households | % Households |
| Dial-Up Internet | 19 | 0.1% |
| Broadband Home | 16,280 | 76.8% |
| Cellular Data Only | 1,822 | 8.6% |
| Satellite Internet | 1,148 | 5.4% |
| No Internet | 2,292 | 10.8% |
| Total | 21,194 | 100.0% |
Watauga County Summary
Watauga County is located in the northwestern corner of North Carolina, and is part of the Appalachian Mountains region. It is bordered by Ashe County to the north, Avery County to the east, Caldwell County to the south, and Johnson County, Tennessee to the west. The county seat is Boone, and the county is named after the Watauga River, which flows through the county.
History
The area that is now Watauga County was originally inhabited by the Cherokee and Catawba Native American tribes. The first European settlers arrived in the area in the late 1700s, and the county was officially established in 1849. The county was named after the Watauga River, which was named by the Cherokee for the phrase “beautiful water.”
During the Civil War, Watauga County was a hotbed of Unionist sentiment, and the county was the site of several skirmishes between Union and Confederate forces. After the war, the county experienced a period of economic growth, as the railroad and timber industries flourished.
Geography
Watauga County is located in the Appalachian Mountains region of North Carolina. The county is home to the Blue Ridge Mountains, which are part of the Appalachian Mountain Range. The highest point in the county is Grandfather Mountain, which has an elevation of 5,946 feet. The county is also home to several rivers, including the Watauga River, the New River, and the Elk River.
The county has a total area of 437 square miles, of which 434 square miles is land and 3 square miles is water. The county is home to several state parks, including Grandfather Mountain State Park, Elk Knob State Park, and New River State Park.
Economy
The economy of Watauga County is largely based on tourism, agriculture, and manufacturing. The county is home to several ski resorts, including Appalachian Ski Mountain and Beech Mountain Resort. Agriculture is also an important part of the county’s economy, with the main crops being corn, soybeans, and hay. The county is also home to several manufacturing companies, including Broyhill Furniture Industries and Mast General Store.
Demographics
As of the 2010 census, Watauga County had a population of 51,079. The population was spread out, with 24.3% under the age of 18, 11.2% from 18 to 24, 28.2% from 25 to 44, 22.2% from 45 to 64, and 14.1% who were 65 years of age or older. The median age was 35.4 years.
The racial makeup of the county was 92.2% White, 3.7% Black or African American, 0.3% Native American, 1.7% Asian, 0.1% Pacific Islander, 1.2% from other races, and 1.6% from two or more races. The median income for a household in the county was $41,945, and the median income for a family was $50,945. The per capita income for the county was $22,845.
Common Questions
What is the Total Population of Watauga County?
Total Population of Watauga County is 54,540.
What is the Total Male Population of Watauga County?
Total Male Population of Watauga County is 27,205.
What is the Total Female Population of Watauga County?
Total Female Population of Watauga County is 27,335.
What is the Ratio of Males per 100 Females in Watauga County?
There are 99.52 Males per 100 Females in Watauga County.
What is the Ratio of Females per 100 Males in Watauga County?
There are 100.48 Females per 100 Males in Watauga County.
What is the Median Population Age in Watauga County?
Median Population Age in Watauga County is 32.1 Years.
What is the Average Family Size in Watauga County
Average Family Size in Watauga County is 2.8 People.
What is the Average Household Size in Watauga County
Average Household Size in Watauga County is 2.3 People.
What is Per Capita Income in Watauga County?
Per Capita income in Watauga County is $30,807.
What is the Median Family Income in Watauga County?
Median Family Income in Watauga County is $85,689.
What is the Median Household income in Watauga County?
Median Household Income in Watauga County is $50,034.
What is Income or Wage Gap in Watauga County?
Income or Wage Gap in Watauga County is 28.2%.
Women in Watauga County earn 71.8 cents for every dollar earned by a man.
What is Family Income Deficit in Watauga County?
Family Income Deficit in Watauga County is $7,299.
Families that are below poverty line in Watauga County earn $7,299 less on average than the poverty threshold level.
What is Inequality or Gini Index in Watauga County?
Inequality or Gini Index in Watauga County is 0.51.
How Large is the Labor Force in Watauga County?
There are 29,166 People in the Labor Forcein in Watauga County.
What is the Percentage of People in the Labor Force in Watauga County?
59.8% of People are in the Labor Force in Watauga County.
What is the Unemployment Rate in Watauga County?
Unemployment Rate in Watauga County is 9.3%.