Wake County, NC
Wake County Map
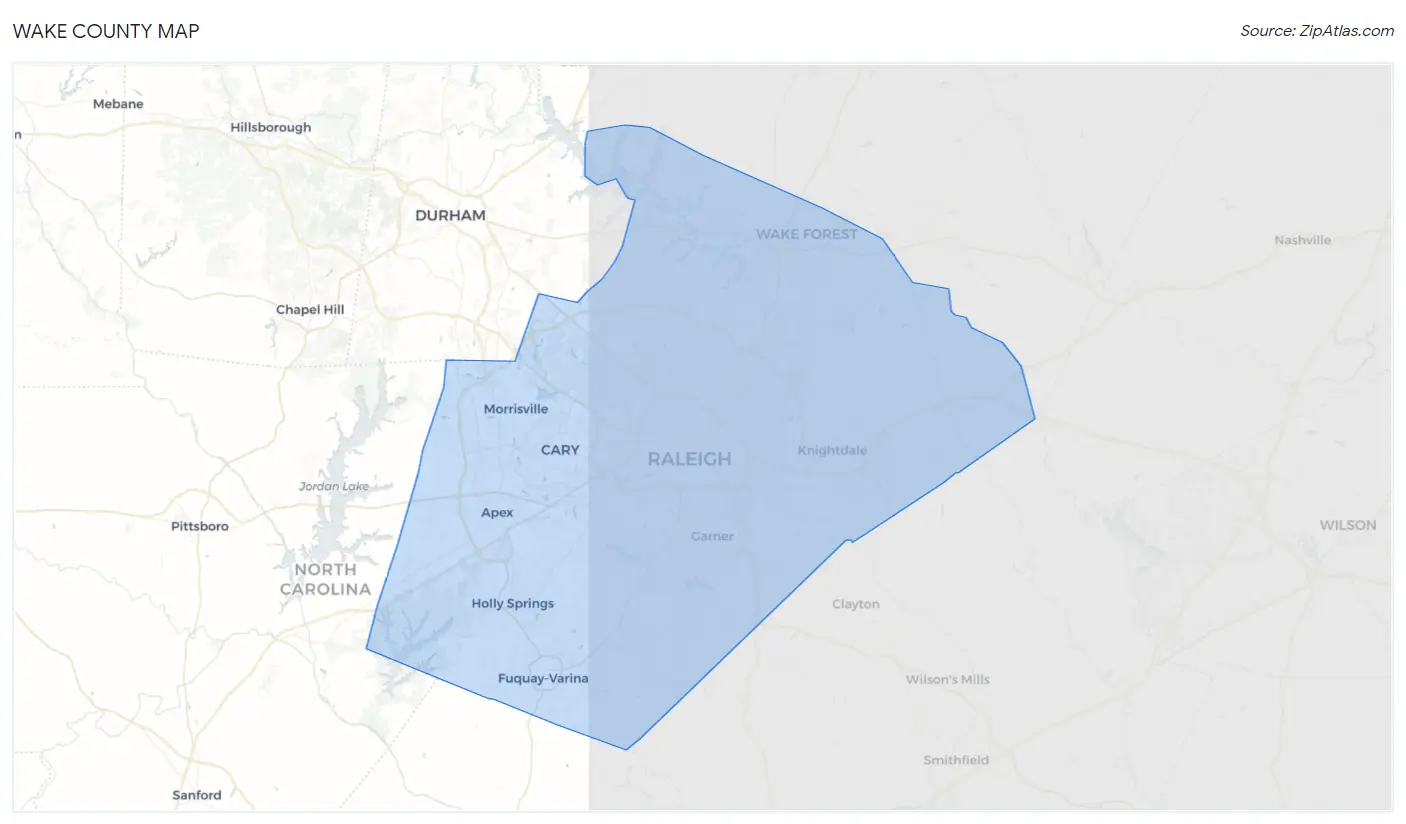
Wake County Overview
1,132,103
TOTAL POPULATION
555,563
MALE POPULATION
576,540
FEMALE POPULATION
96.36
MALES / 100 FEMALES
103.78
FEMALES / 100 MALES
37.0
MEDIAN AGE
3.2
AVG FAMILY SIZE
2.6
AVG HOUSEHOLD SIZE
$50,188
PER CAPITA INCOME
$121,682
AVG FAMILY INCOME
$96,734
AVG HOUSEHOLD INCOME
26.7%
WAGE / INCOME GAP [ % ]
73.3¢/ $1
WAGE / INCOME GAP [ $ ]
$10,955
FAMILY INCOME DEFICIT
0.45
INEQUALITY / GINI INDEX
628,681
LABOR FORCE [ PEOPLE ]
69.9%
PERCENT IN LABOR FORCE
4.2%
UNEMPLOYMENT RATE
Wake County Area Codes
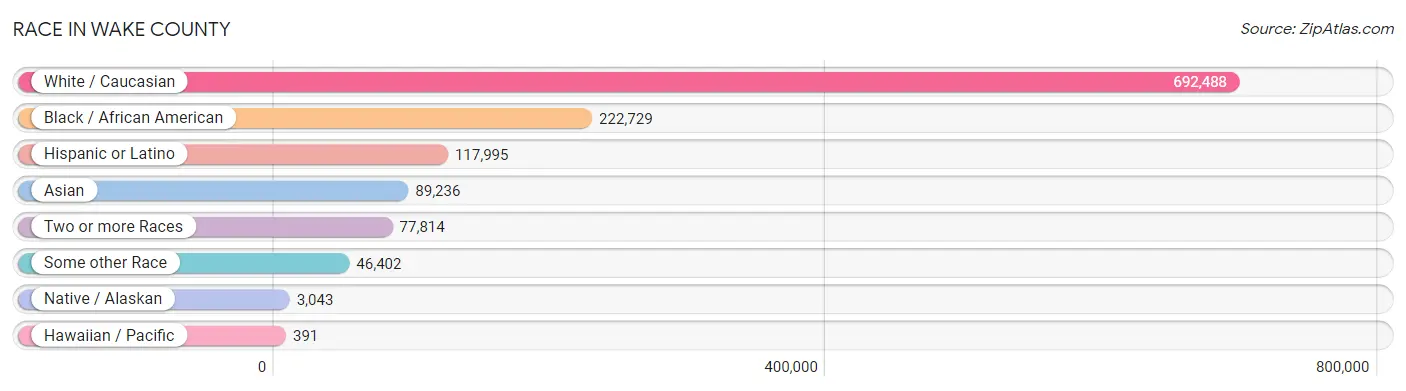
Race in Wake County
The most populous races in Wake County are White / Caucasian (692,488 | 61.2%), Black / African American (222,729 | 19.7%), and Hispanic or Latino (117,995 | 10.4%).
| Race | # Population | % Population |
| Asian | 89,236 | 7.9% |
| Black / African American | 222,729 | 19.7% |
| Hawaiian / Pacific | 391 | 0.0% |
| Hispanic or Latino | 117,995 | 10.4% |
| Native / Alaskan | 3,043 | 0.3% |
| White / Caucasian | 692,488 | 61.2% |
| Two or more Races | 77,814 | 6.9% |
| Some other Race | 46,402 | 4.1% |
| Total | 1,132,103 | 100.0% |
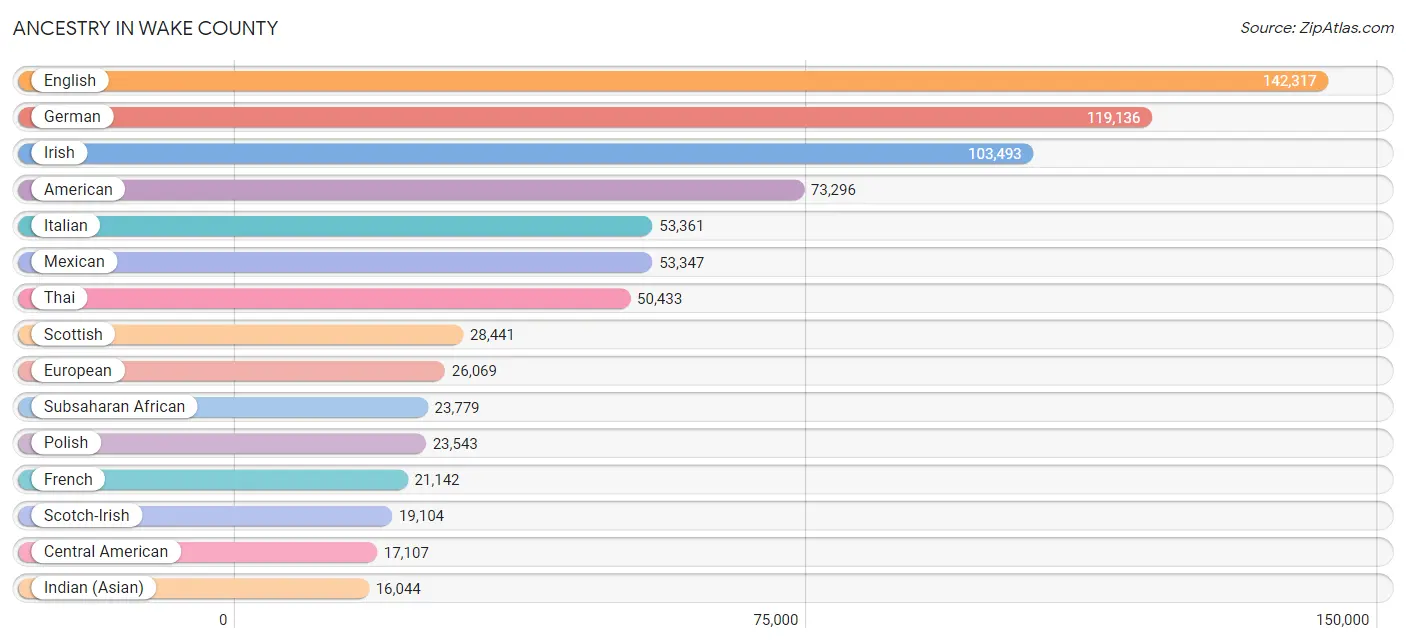
Ancestry in Wake County
The most populous ancestries reported in Wake County are English (142,317 | 12.6%), German (119,136 | 10.5%), Irish (103,493 | 9.1%), American (73,296 | 6.5%), and Italian (53,361 | 4.7%), together accounting for 43.4% of all Wake County residents.
| Ancestry | # Population | % Population |
| Afghan | 620 | 0.1% |
| African | 10,570 | 0.9% |
| Alaskan Athabascan | 16 | 0.0% |
| Albanian | 194 | 0.0% |
| Aleut | 49 | 0.0% |
| Alsatian | 25 | 0.0% |
| American | 73,296 | 6.5% |
| Apache | 136 | 0.0% |
| Arab | 11,435 | 1.0% |
| Argentinean | 703 | 0.1% |
| Armenian | 458 | 0.0% |
| Assyrian / Chaldean / Syriac | 7 | 0.0% |
| Australian | 113 | 0.0% |
| Austrian | 1,883 | 0.2% |
| Bahamian | 74 | 0.0% |
| Bangladeshi | 334 | 0.0% |
| Barbadian | 101 | 0.0% |
| Basque | 41 | 0.0% |
| Belgian | 956 | 0.1% |
| Belizean | 259 | 0.0% |
| Bermudan | 111 | 0.0% |
| Bhutanese | 3,050 | 0.3% |
| Blackfeet | 603 | 0.1% |
| Bolivian | 64 | 0.0% |
| Brazilian | 1,559 | 0.1% |
| British | 10,310 | 0.9% |
| British West Indian | 325 | 0.0% |
| Bulgarian | 727 | 0.1% |
| Burmese | 7,337 | 0.6% |
| Cajun | 297 | 0.0% |
| Cambodian | 134 | 0.0% |
| Canadian | 2,659 | 0.2% |
| Cape Verdean | 189 | 0.0% |
| Carpatho Rusyn | 36 | 0.0% |
| Celtic | 129 | 0.0% |
| Central American | 17,107 | 1.5% |
| Central American Indian | 921 | 0.1% |
| Cherokee | 3,460 | 0.3% |
| Cheyenne | 42 | 0.0% |
| Chickasaw | 33 | 0.0% |
| Chilean | 520 | 0.1% |
| Chinese | 53 | 0.0% |
| Chippewa | 100 | 0.0% |
| Choctaw | 267 | 0.0% |
| Colombian | 3,743 | 0.3% |
| Comanche | 22 | 0.0% |
| Costa Rican | 459 | 0.0% |
| Cree | 29 | 0.0% |
| Creek | 422 | 0.0% |
| Croatian | 845 | 0.1% |
| Cuban | 4,555 | 0.4% |
| Cypriot | 64 | 0.0% |
| Czech | 4,086 | 0.4% |
| Czechoslovakian | 804 | 0.1% |
| Danish | 2,197 | 0.2% |
| Delaware | 21 | 0.0% |
| Dominican | 7,431 | 0.7% |
| Dutch | 9,521 | 0.8% |
| Eastern European | 3,248 | 0.3% |
| Ecuadorian | 1,420 | 0.1% |
| Egyptian | 3,166 | 0.3% |
| English | 142,317 | 12.6% |
| Estonian | 92 | 0.0% |
| Ethiopian | 1,672 | 0.2% |
| European | 26,069 | 2.3% |
| Filipino | 932 | 0.1% |
| Finnish | 1,230 | 0.1% |
| French | 21,142 | 1.9% |
| French American Indian | 36 | 0.0% |
| French Canadian | 4,413 | 0.4% |
| German | 119,136 | 10.5% |
| Ghanaian | 495 | 0.0% |
| Greek | 4,137 | 0.4% |
| Guamanian / Chamorro | 300 | 0.0% |
| Guatemalan | 2,946 | 0.3% |
| Guyanese | 268 | 0.0% |
| Haitian | 2,289 | 0.2% |
| Honduran | 4,152 | 0.4% |
| Houma | 27 | 0.0% |
| Hungarian | 6,000 | 0.5% |
| Icelander | 161 | 0.0% |
| Indian (Asian) | 16,044 | 1.4% |
| Indonesian | 438 | 0.0% |
| Inupiat | 19 | 0.0% |
| Iranian | 2,245 | 0.2% |
| Iraqi | 603 | 0.1% |
| Irish | 103,493 | 9.1% |
| Iroquois | 303 | 0.0% |
| Israeli | 315 | 0.0% |
| Italian | 53,361 | 4.7% |
| Jamaican | 2,527 | 0.2% |
| Japanese | 351 | 0.0% |
| Jordanian | 641 | 0.1% |
| Kenyan | 1,437 | 0.1% |
| Korean | 7,596 | 0.7% |
| Laotian | 249 | 0.0% |
| Latvian | 185 | 0.0% |
| Lebanese | 2,725 | 0.2% |
| Liberian | 393 | 0.0% |
| Lithuanian | 2,298 | 0.2% |
| Lumbee | 762 | 0.1% |
| Luxembourger | 138 | 0.0% |
| Macedonian | 121 | 0.0% |
| Malaysian | 201 | 0.0% |
| Maltese | 34 | 0.0% |
| Mexican | 53,347 | 4.7% |
| Mexican American Indian | 709 | 0.1% |
| Mongolian | 145 | 0.0% |
| Moroccan | 1,411 | 0.1% |
| Native Hawaiian | 662 | 0.1% |
| Navajo | 123 | 0.0% |
| New Zealander | 38 | 0.0% |
| Nicaraguan | 442 | 0.0% |
| Nigerian | 4,381 | 0.4% |
| Northern European | 2,439 | 0.2% |
| Norwegian | 7,319 | 0.6% |
| Okinawan | 68 | 0.0% |
| Osage | 11 | 0.0% |
| Paiute | 6 | 0.0% |
| Pakistani | 1,032 | 0.1% |
| Palestinian | 892 | 0.1% |
| Panamanian | 930 | 0.1% |
| Paraguayan | 136 | 0.0% |
| Pennsylvania German | 145 | 0.0% |
| Peruvian | 1,676 | 0.2% |
| Polish | 23,543 | 2.1% |
| Portuguese | 3,834 | 0.3% |
| Potawatomi | 45 | 0.0% |
| Pueblo | 41 | 0.0% |
| Puerto Rican | 15,865 | 1.4% |
| Romanian | 1,582 | 0.1% |
| Russian | 7,806 | 0.7% |
| Salvadoran | 7,862 | 0.7% |
| Samoan | 141 | 0.0% |
| Scandinavian | 2,740 | 0.2% |
| Scotch-Irish | 19,104 | 1.7% |
| Scottish | 28,441 | 2.5% |
| Seminole | 12 | 0.0% |
| Senegalese | 311 | 0.0% |
| Serbian | 447 | 0.0% |
| Sierra Leonean | 466 | 0.0% |
| Sioux | 233 | 0.0% |
| Slavic | 447 | 0.0% |
| Slovak | 2,208 | 0.2% |
| Slovene | 621 | 0.1% |
| Somali | 350 | 0.0% |
| South African | 322 | 0.0% |
| South American | 10,908 | 1.0% |
| South American Indian | 332 | 0.0% |
| Spaniard | 2,104 | 0.2% |
| Spanish | 1,482 | 0.1% |
| Spanish American | 26 | 0.0% |
| Sri Lankan | 7,641 | 0.7% |
| Subsaharan African | 23,779 | 2.1% |
| Sudanese | 135 | 0.0% |
| Swedish | 8,867 | 0.8% |
| Swiss | 2,935 | 0.3% |
| Syrian | 657 | 0.1% |
| Thai | 50,433 | 4.4% |
| Tlingit-Haida | 7 | 0.0% |
| Trinidadian and Tobagonian | 317 | 0.0% |
| Turkish | 1,271 | 0.1% |
| U.S. Virgin Islander | 196 | 0.0% |
| Ugandan | 39 | 0.0% |
| Ukrainian | 3,633 | 0.3% |
| Uruguayan | 223 | 0.0% |
| Venezuelan | 2,335 | 0.2% |
| Vietnamese | 1,148 | 0.1% |
| Welsh | 7,583 | 0.7% |
| West Indian | 904 | 0.1% |
| Yaqui | 36 | 0.0% |
| Yugoslavian | 512 | 0.1% |
| Yup'ik | 34 | 0.0% |
| Zimbabwean | 90 | 0.0% | View All 174 Rows |
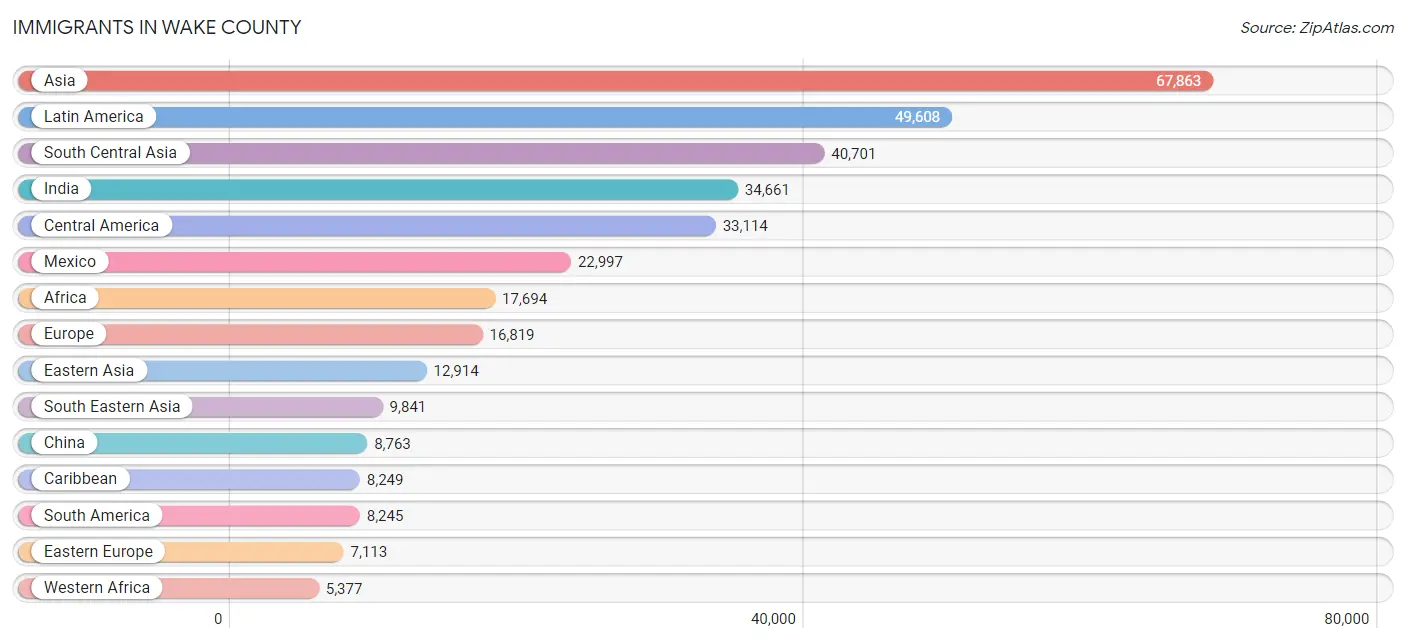
Immigrants in Wake County
The most numerous immigrant groups reported in Wake County came from Asia (67,863 | 6.0%), Latin America (49,608 | 4.4%), South Central Asia (40,701 | 3.6%), India (34,661 | 3.1%), and Central America (33,114 | 2.9%), together accounting for 19.9% of all Wake County residents.
| Immigration Origin | # Population | % Population |
| Afghanistan | 405 | 0.0% |
| Africa | 17,694 | 1.6% |
| Albania | 53 | 0.0% |
| Argentina | 535 | 0.1% |
| Asia | 67,863 | 6.0% |
| Australia | 332 | 0.0% |
| Austria | 93 | 0.0% |
| Azores | 8 | 0.0% |
| Bahamas | 298 | 0.0% |
| Bangladesh | 907 | 0.1% |
| Barbados | 58 | 0.0% |
| Belarus | 283 | 0.0% |
| Belgium | 216 | 0.0% |
| Belize | 172 | 0.0% |
| Bolivia | 110 | 0.0% |
| Bosnia and Herzegovina | 97 | 0.0% |
| Brazil | 1,293 | 0.1% |
| Bulgaria | 316 | 0.0% |
| Cambodia | 97 | 0.0% |
| Cameroon | 380 | 0.0% |
| Canada | 3,743 | 0.3% |
| Caribbean | 8,249 | 0.7% |
| Central America | 33,114 | 2.9% |
| Chile | 211 | 0.0% |
| China | 8,763 | 0.8% |
| Colombia | 1,965 | 0.2% |
| Congo | 1,313 | 0.1% |
| Costa Rica | 144 | 0.0% |
| Croatia | 170 | 0.0% |
| Cuba | 839 | 0.1% |
| Czechoslovakia | 555 | 0.1% |
| Denmark | 93 | 0.0% |
| Dominica | 491 | 0.0% |
| Dominican Republic | 3,622 | 0.3% |
| Eastern Africa | 4,549 | 0.4% |
| Eastern Asia | 12,914 | 1.1% |
| Eastern Europe | 7,113 | 0.6% |
| Ecuador | 570 | 0.1% |
| Egypt | 2,025 | 0.2% |
| El Salvador | 4,711 | 0.4% |
| England | 1,372 | 0.1% |
| Eritrea | 372 | 0.0% |
| Ethiopia | 965 | 0.1% |
| Europe | 16,819 | 1.5% |
| Fiji | 29 | 0.0% |
| France | 885 | 0.1% |
| Germany | 1,999 | 0.2% |
| Ghana | 512 | 0.1% |
| Greece | 326 | 0.0% |
| Grenada | 529 | 0.1% |
| Guatemala | 1,285 | 0.1% |
| Guyana | 111 | 0.0% |
| Haiti | 791 | 0.1% |
| Honduras | 3,058 | 0.3% |
| Hong Kong | 445 | 0.0% |
| Hungary | 554 | 0.1% |
| India | 34,661 | 3.1% |
| Indonesia | 265 | 0.0% |
| Iran | 1,453 | 0.1% |
| Iraq | 805 | 0.1% |
| Ireland | 336 | 0.0% |
| Israel | 216 | 0.0% |
| Italy | 434 | 0.0% |
| Jamaica | 840 | 0.1% |
| Japan | 824 | 0.1% |
| Jordan | 701 | 0.1% |
| Kazakhstan | 308 | 0.0% |
| Kenya | 1,976 | 0.2% |
| Korea | 3,327 | 0.3% |
| Kuwait | 122 | 0.0% |
| Laos | 121 | 0.0% |
| Latin America | 49,608 | 4.4% |
| Latvia | 54 | 0.0% |
| Lebanon | 349 | 0.0% |
| Liberia | 273 | 0.0% |
| Lithuania | 73 | 0.0% |
| Malaysia | 523 | 0.1% |
| Mexico | 22,997 | 2.0% |
| Micronesia | 19 | 0.0% |
| Middle Africa | 2,658 | 0.2% |
| Moldova | 239 | 0.0% |
| Morocco | 1,127 | 0.1% |
| Nepal | 1,170 | 0.1% |
| Netherlands | 254 | 0.0% |
| Nicaragua | 184 | 0.0% |
| Nigeria | 2,992 | 0.3% |
| North Macedonia | 6 | 0.0% |
| Northern Africa | 3,565 | 0.3% |
| Northern Europe | 4,697 | 0.4% |
| Norway | 36 | 0.0% |
| Oceania | 547 | 0.1% |
| Pakistan | 1,364 | 0.1% |
| Panama | 476 | 0.0% |
| Peru | 1,029 | 0.1% |
| Philippines | 3,287 | 0.3% |
| Poland | 794 | 0.1% |
| Portugal | 276 | 0.0% |
| Romania | 493 | 0.0% |
| Russia | 1,864 | 0.2% |
| Saudi Arabia | 55 | 0.0% |
| Scotland | 268 | 0.0% |
| Senegal | 348 | 0.0% |
| Serbia | 57 | 0.0% |
| Sierra Leone | 332 | 0.0% |
| Singapore | 174 | 0.0% |
| Somalia | 199 | 0.0% |
| South Africa | 858 | 0.1% |
| South America | 8,245 | 0.7% |
| South Central Asia | 40,701 | 3.6% |
| South Eastern Asia | 9,841 | 0.9% |
| Southern Europe | 1,467 | 0.1% |
| Spain | 431 | 0.0% |
| Sri Lanka | 276 | 0.0% |
| St. Vincent and the Grenadines | 22 | 0.0% |
| Sudan | 157 | 0.0% |
| Sweden | 305 | 0.0% |
| Switzerland | 83 | 0.0% |
| Syria | 442 | 0.0% |
| Taiwan | 1,248 | 0.1% |
| Thailand | 360 | 0.0% |
| Trinidad and Tobago | 580 | 0.1% |
| Turkey | 697 | 0.1% |
| Uganda | 112 | 0.0% |
| Ukraine | 936 | 0.1% |
| Uruguay | 158 | 0.0% |
| Uzbekistan | 74 | 0.0% |
| Venezuela | 2,155 | 0.2% |
| Vietnam | 4,638 | 0.4% |
| West Indies | 52 | 0.0% |
| Western Africa | 5,377 | 0.5% |
| Western Asia | 4,159 | 0.4% |
| Western Europe | 3,530 | 0.3% |
| Yemen | 391 | 0.0% |
| Zaire | 810 | 0.1% |
| Zimbabwe | 413 | 0.0% | View All 135 Rows |
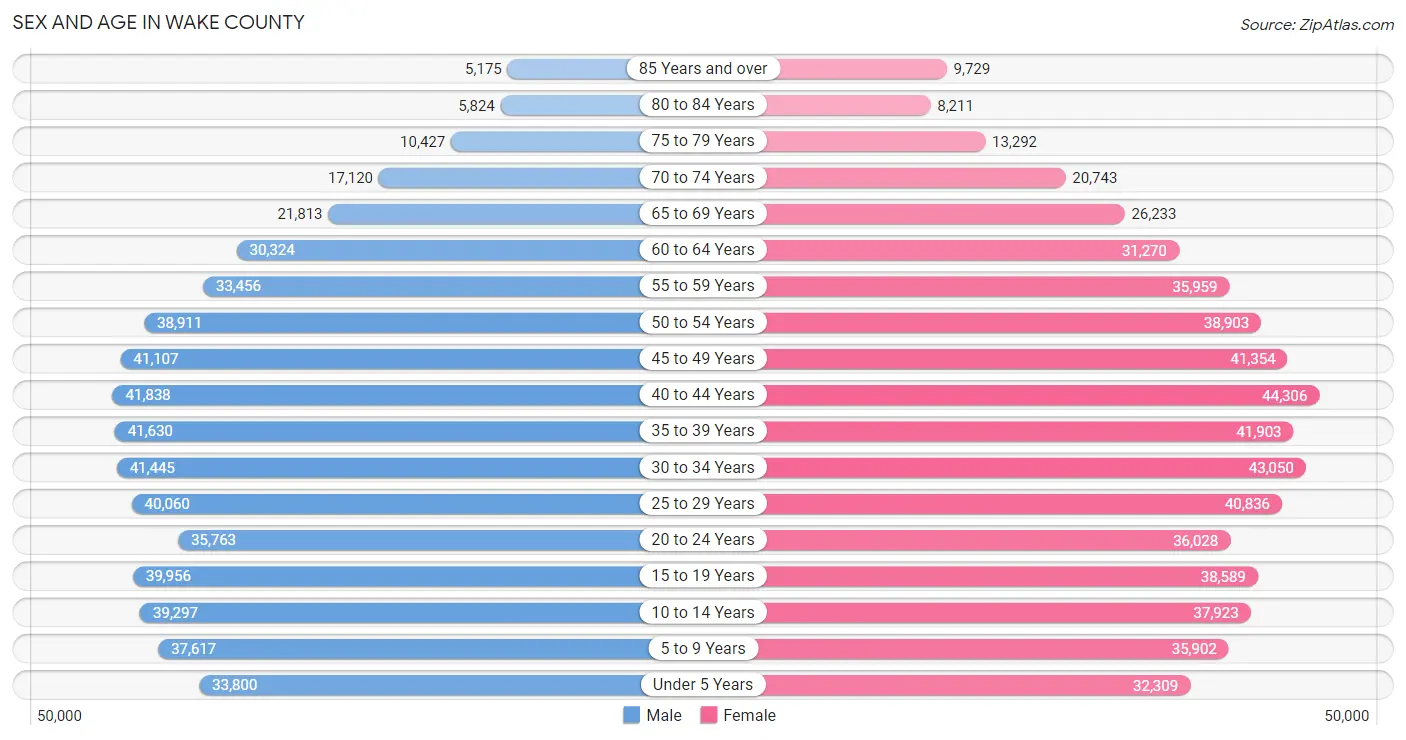
Sex and Age in Wake County
Sex and Age in Wake County
The most populous age groups in Wake County are 40 to 44 Years (41,838 | 7.5%) for men and 40 to 44 Years (44,306 | 7.7%) for women.
| Age Bracket | Male | Female |
| Under 5 Years | 33,800 (6.1%) | 32,309 (5.6%) |
| 5 to 9 Years | 37,617 (6.8%) | 35,902 (6.2%) |
| 10 to 14 Years | 39,297 (7.1%) | 37,923 (6.6%) |
| 15 to 19 Years | 39,956 (7.2%) | 38,589 (6.7%) |
| 20 to 24 Years | 35,763 (6.4%) | 36,028 (6.2%) |
| 25 to 29 Years | 40,060 (7.2%) | 40,836 (7.1%) |
| 30 to 34 Years | 41,445 (7.5%) | 43,050 (7.5%) |
| 35 to 39 Years | 41,630 (7.5%) | 41,903 (7.3%) |
| 40 to 44 Years | 41,838 (7.5%) | 44,306 (7.7%) |
| 45 to 49 Years | 41,107 (7.4%) | 41,354 (7.2%) |
| 50 to 54 Years | 38,911 (7.0%) | 38,903 (6.8%) |
| 55 to 59 Years | 33,456 (6.0%) | 35,959 (6.2%) |
| 60 to 64 Years | 30,324 (5.5%) | 31,270 (5.4%) |
| 65 to 69 Years | 21,813 (3.9%) | 26,233 (4.5%) |
| 70 to 74 Years | 17,120 (3.1%) | 20,743 (3.6%) |
| 75 to 79 Years | 10,427 (1.9%) | 13,292 (2.3%) |
| 80 to 84 Years | 5,824 (1.1%) | 8,211 (1.4%) |
| 85 Years and over | 5,175 (0.9%) | 9,729 (1.7%) |
| Total | 555,563 (100.0%) | 576,540 (100.0%) |
Families and Households in Wake County
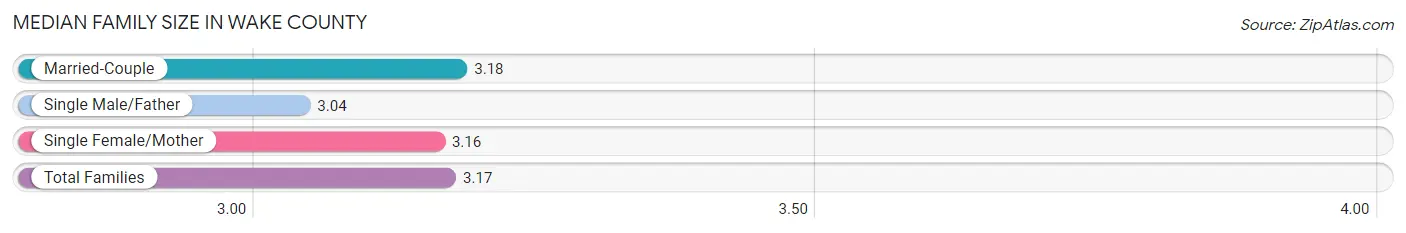
Median Family Size in Wake County
The median family size in Wake County is 3.17 persons per family, with married-couple families (221,243 | 78.4%) accounting for the largest median family size of 3.18 persons per family. On the other hand, single male/father families (15,689 | 5.6%) represent the smallest median family size with 3.04 persons per family.
| Family Type | # Families | Family Size |
| Married-Couple | 221,243 (78.4%) | 3.18 |
| Single Male/Father | 15,689 (5.6%) | 3.04 |
| Single Female/Mother | 45,142 (16.0%) | 3.16 |
| Total Families | 282,074 (100.0%) | 3.17 |
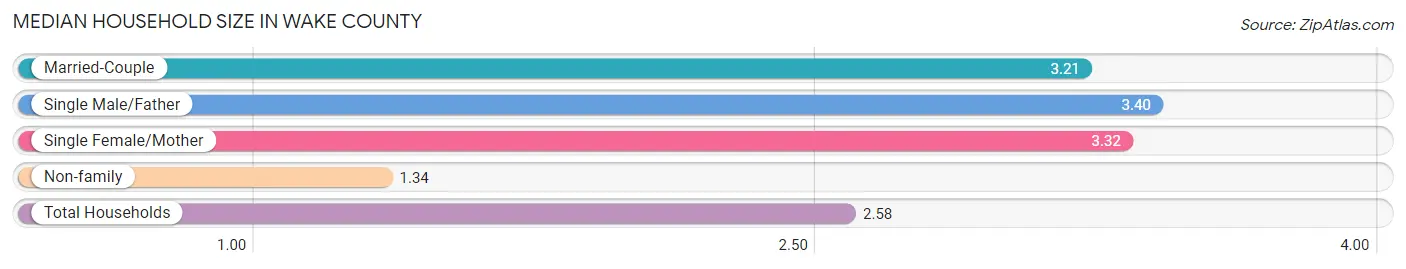
Median Household Size in Wake County
The median household size in Wake County is 2.58 persons per household, with single male/father households (15,689 | 3.6%) accounting for the largest median household size of 3.4 persons per household. non-family households (148,423 | 34.5%) represent the smallest median household size with 1.34 persons per household.
| Household Type | # Households | Household Size |
| Married-Couple | 221,243 (51.4%) | 3.21 |
| Single Male/Father | 15,689 (3.6%) | 3.40 |
| Single Female/Mother | 45,142 (10.5%) | 3.32 |
| Non-family | 148,423 (34.5%) | 1.34 |
| Total Households | 430,497 (100.0%) | 2.58 |
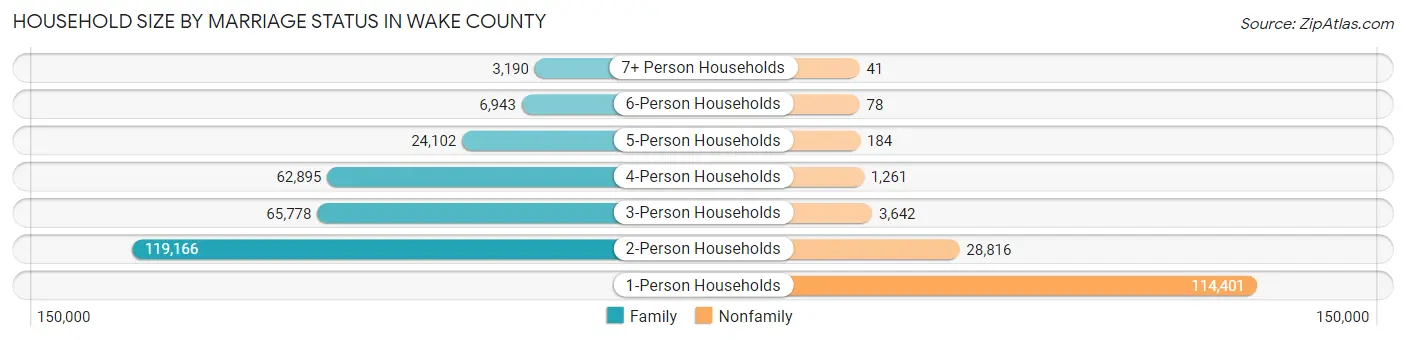
Household Size by Marriage Status in Wake County
Out of a total of 430,497 households in Wake County, 282,074 (65.5%) are family households, while 148,423 (34.5%) are nonfamily households. The most numerous type of family households are 2-person households, comprising 119,166, and the most common type of nonfamily households are 1-person households, comprising 114,401.
| Household Size | Family Households | Nonfamily Households |
| 1-Person Households | - | 114,401 (26.6%) |
| 2-Person Households | 119,166 (27.7%) | 28,816 (6.7%) |
| 3-Person Households | 65,778 (15.3%) | 3,642 (0.9%) |
| 4-Person Households | 62,895 (14.6%) | 1,261 (0.3%) |
| 5-Person Households | 24,102 (5.6%) | 184 (0.0%) |
| 6-Person Households | 6,943 (1.6%) | 78 (0.0%) |
| 7+ Person Households | 3,190 (0.7%) | 41 (0.0%) |
| Total | 282,074 (65.5%) | 148,423 (34.5%) |
Female Fertility in Wake County
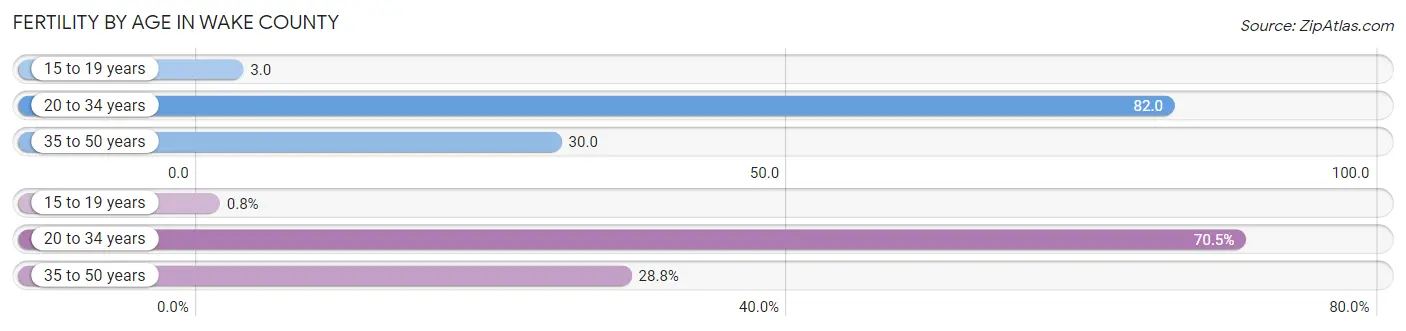
Fertility by Age in Wake County
Average fertility rate in Wake County is 48.0 births per 1,000 women. Women in the age bracket of 20 to 34 years have the highest fertility rate with 82.0 births per 1,000 women. Women in the age bracket of 20 to 34 years acount for 70.5% of all women with births.
| Age Bracket | Women with Births | Births / 1,000 Women |
| 15 to 19 years | 113 (0.8%) | 3.0 |
| 20 to 34 years | 9,891 (70.5%) | 82.0 |
| 35 to 50 years | 4,036 (28.7%) | 30.0 |
| Total | 14,040 (100.0%) | 48.0 |
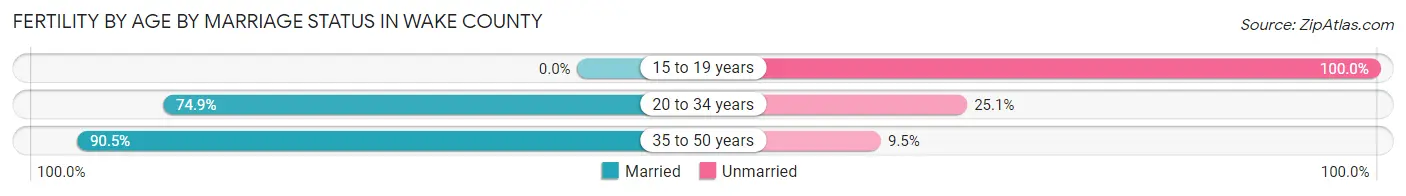
Fertility by Age by Marriage Status in Wake County
78.7% of women with births (14,040) in Wake County are married. The highest percentage of unmarried women with births falls into 15 to 19 years age bracket with 100.0% of them unmarried at the time of birth, while the lowest percentage of unmarried women with births belong to 35 to 50 years age bracket with 9.5% of them unmarried.
| Age Bracket | Married | Unmarried |
| 15 to 19 years | 0 (0.0%) | 113 (100.0%) |
| 20 to 34 years | 7,408 (74.9%) | 2,483 (25.1%) |
| 35 to 50 years | 3,653 (90.5%) | 383 (9.5%) |
| Total | 11,049 (78.7%) | 2,991 (21.3%) |
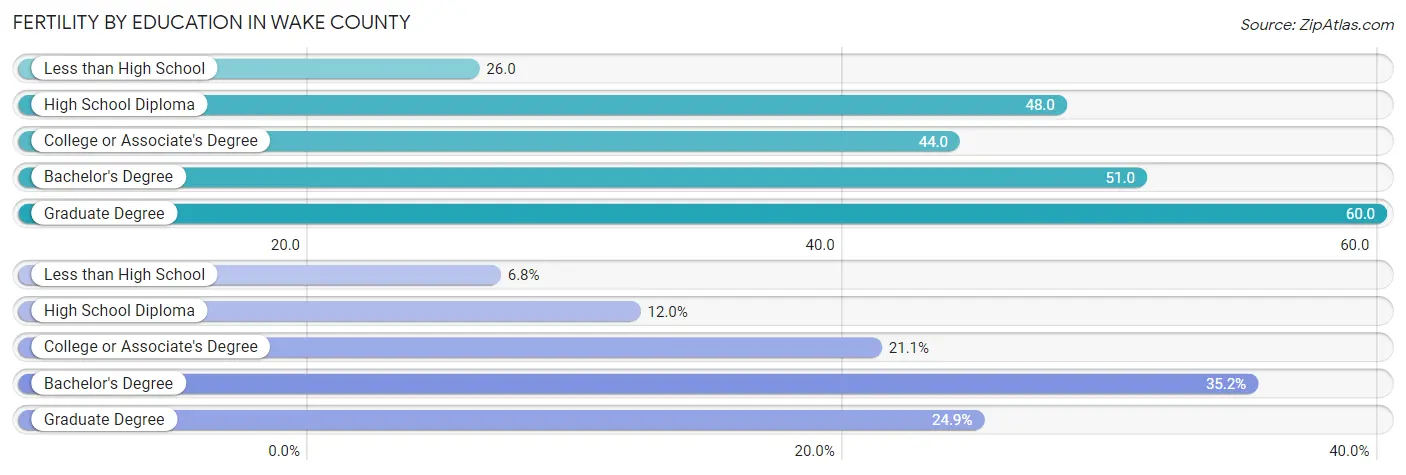
Fertility by Education in Wake County
Average fertility rate in Wake County is 48.0 births per 1,000 women. Women with the education attainment of graduate degree have the highest fertility rate of 60.0 births per 1,000 women, while women with the education attainment of less than high school have the lowest fertility at 26.0 births per 1,000 women. Women with the education attainment of bachelor's degree represent 35.2% of all women with births.
| Educational Attainment | Women with Births | Births / 1,000 Women |
| Less than High School | 955 (6.8%) | 26.0 |
| High School Diploma | 1,691 (12.0%) | 48.0 |
| College or Associate's Degree | 2,959 (21.1%) | 44.0 |
| Bachelor's Degree | 4,938 (35.2%) | 51.0 |
| Graduate Degree | 3,497 (24.9%) | 60.0 |
| Total | 14,040 (100.0%) | 48.0 |
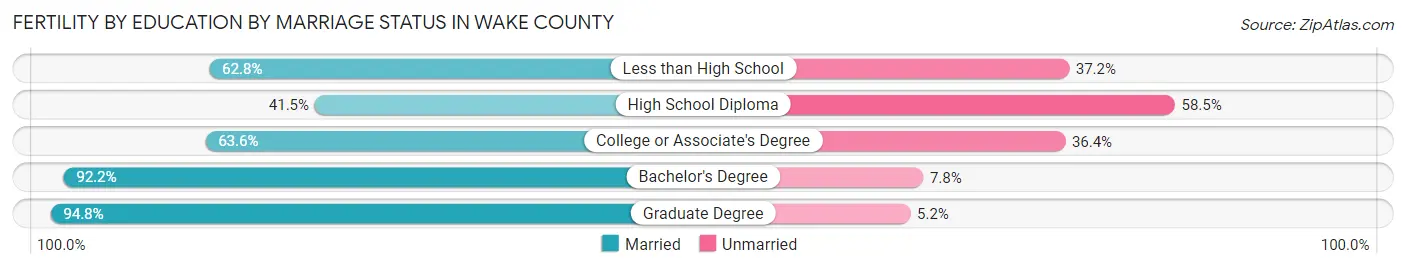
Fertility by Education by Marriage Status in Wake County
21.3% of women with births in Wake County are unmarried. Women with the educational attainment of graduate degree are most likely to be married with 94.8% of them married at childbirth, while women with the educational attainment of high school diploma are least likely to be married with 58.5% of them unmarried at childbirth.
| Educational Attainment | Married | Unmarried |
| Less than High School | 600 (62.8%) | 355 (37.2%) |
| High School Diploma | 702 (41.5%) | 989 (58.5%) |
| College or Associate's Degree | 1,882 (63.6%) | 1,077 (36.4%) |
| Bachelor's Degree | 4,553 (92.2%) | 385 (7.8%) |
| Graduate Degree | 3,315 (94.8%) | 182 (5.2%) |
| Total | 11,049 (78.7%) | 2,991 (21.3%) |
Income in Wake County
Income Overview in Wake County
Per Capita Income in Wake County is $50,188, while median incomes of families and households are $121,682 and $96,734 respectively.
| Characteristic | Number | Measure |
| Per Capita Income | 1,132,103 | $50,188 |
| Median Family Income | 282,074 | $121,682 |
| Mean Family Income | 282,074 | $153,388 |
| Median Household Income | 430,497 | $96,734 |
| Mean Household Income | 430,497 | $128,312 |
| Income Deficit | 282,074 | $10,955 |
| Wage / Income Gap (%) | 1,132,103 | 26.72% |
| Wage / Income Gap ($) | 1,132,103 | 73.28¢ per $1 |
| Gini / Inequality Index | 1,132,103 | 0.45 |
Earnings by Sex in Wake County
Average Earnings in Wake County are $51,479, $60,510 for men and $44,344 for women, a difference of 26.7%.
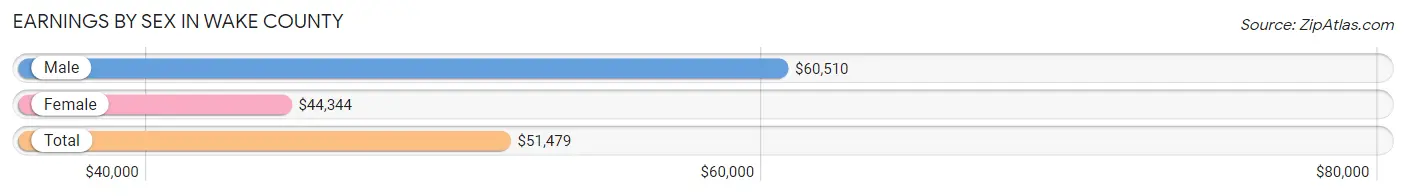
| Sex | Number | Average Earnings |
| Male | 342,729 (52.6%) | $60,510 |
| Female | 309,258 (47.4%) | $44,344 |
| Total | 651,987 (100.0%) | $51,479 |
Earnings by Sex by Income Bracket in Wake County
The most common earnings brackets in Wake County are $100,000+ for men (107,589 | 31.4%) and $100,000+ for women (47,770 | 15.4%).
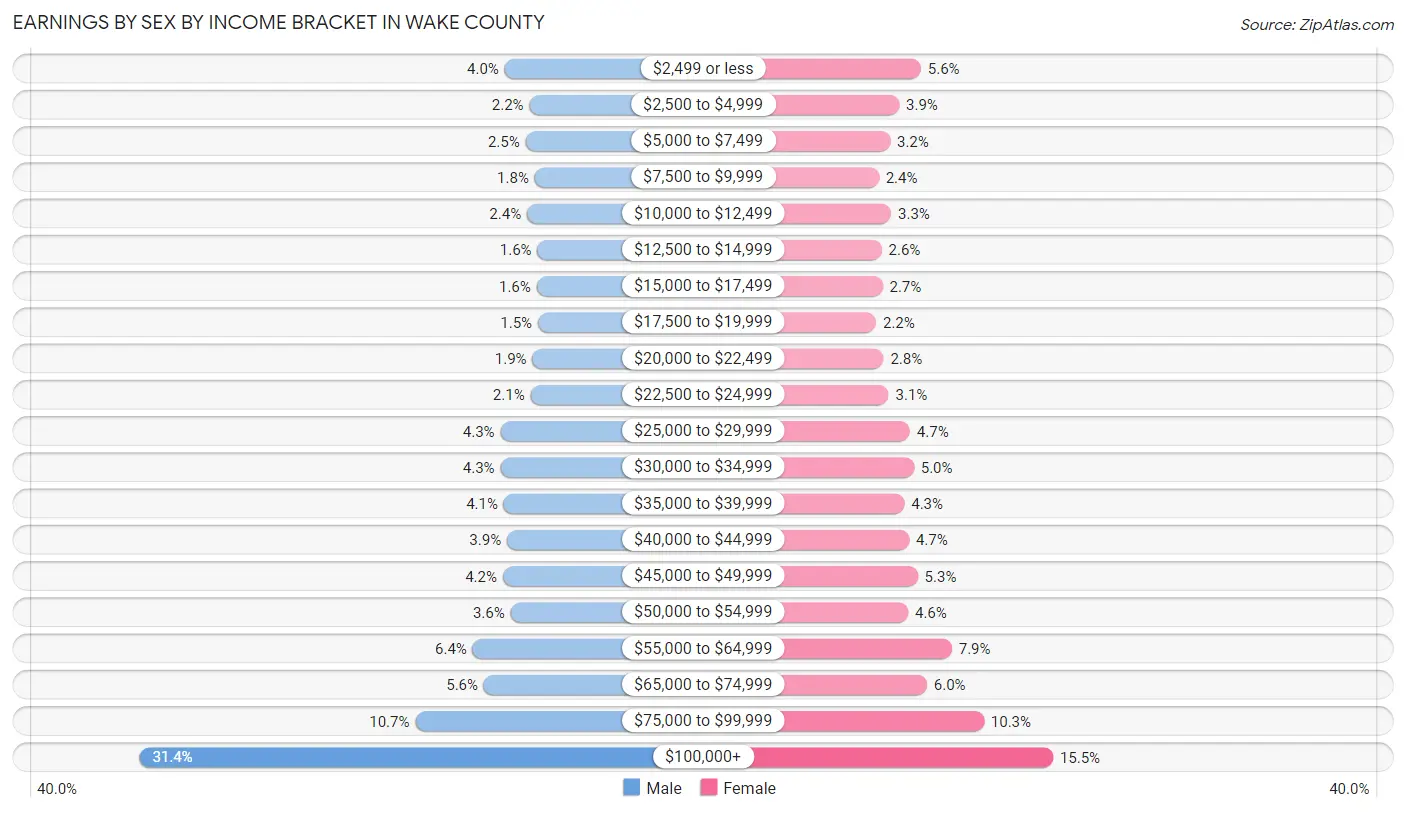
| Income | Male | Female |
| $2,499 or less | 13,780 (4.0%) | 17,169 (5.6%) |
| $2,500 to $4,999 | 7,424 (2.2%) | 12,109 (3.9%) |
| $5,000 to $7,499 | 8,440 (2.5%) | 10,018 (3.2%) |
| $7,500 to $9,999 | 6,067 (1.8%) | 7,401 (2.4%) |
| $10,000 to $12,499 | 8,056 (2.4%) | 10,282 (3.3%) |
| $12,500 to $14,999 | 5,395 (1.6%) | 8,079 (2.6%) |
| $15,000 to $17,499 | 5,581 (1.6%) | 8,276 (2.7%) |
| $17,500 to $19,999 | 5,233 (1.5%) | 6,770 (2.2%) |
| $20,000 to $22,499 | 6,643 (1.9%) | 8,520 (2.8%) |
| $22,500 to $24,999 | 7,170 (2.1%) | 9,694 (3.1%) |
| $25,000 to $29,999 | 14,876 (4.3%) | 14,616 (4.7%) |
| $30,000 to $34,999 | 14,864 (4.3%) | 15,526 (5.0%) |
| $35,000 to $39,999 | 14,015 (4.1%) | 13,334 (4.3%) |
| $40,000 to $44,999 | 13,193 (3.8%) | 14,398 (4.7%) |
| $45,000 to $49,999 | 14,243 (4.2%) | 16,430 (5.3%) |
| $50,000 to $54,999 | 12,276 (3.6%) | 14,209 (4.6%) |
| $55,000 to $64,999 | 21,990 (6.4%) | 24,330 (7.9%) |
| $65,000 to $74,999 | 19,138 (5.6%) | 18,559 (6.0%) |
| $75,000 to $99,999 | 36,756 (10.7%) | 31,768 (10.3%) |
| $100,000+ | 107,589 (31.4%) | 47,770 (15.4%) |
| Total | 342,729 (100.0%) | 309,258 (100.0%) |
Earnings by Sex by Educational Attainment in Wake County
Average earnings in Wake County are $71,083 for men and $49,980 for women, a difference of 29.7%. Men with an educational attainment of graduate degree enjoy the highest average annual earnings of $116,101, while those with less than high school education earn the least with $33,969. Women with an educational attainment of graduate degree earn the most with the average annual earnings of $71,632, while those with less than high school education have the smallest earnings of $21,194.
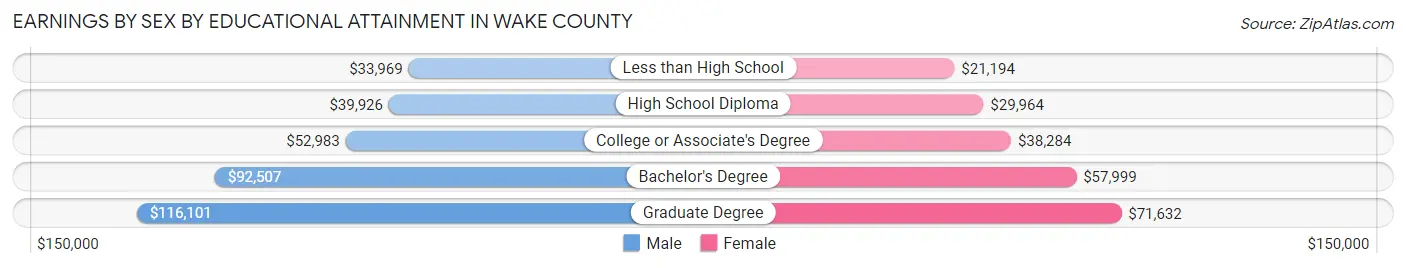
| Educational Attainment | Male Income | Female Income |
| Less than High School | $33,969 | $21,194 |
| High School Diploma | $39,926 | $29,964 |
| College or Associate's Degree | $52,983 | $38,284 |
| Bachelor's Degree | $92,507 | $57,999 |
| Graduate Degree | $116,101 | $71,632 |
| Total | $71,083 | $49,980 |
Family Income in Wake County
Family Income Brackets in Wake County
According to the Wake County family income data, there are 65,441 families falling into the $200,000+ income range, which is the most common income bracket and makes up 23.2% of all families. Conversely, the $10,000 to $14,999 income bracket is the least frequent group with only 3,103 families (1.1%) belonging to this category.
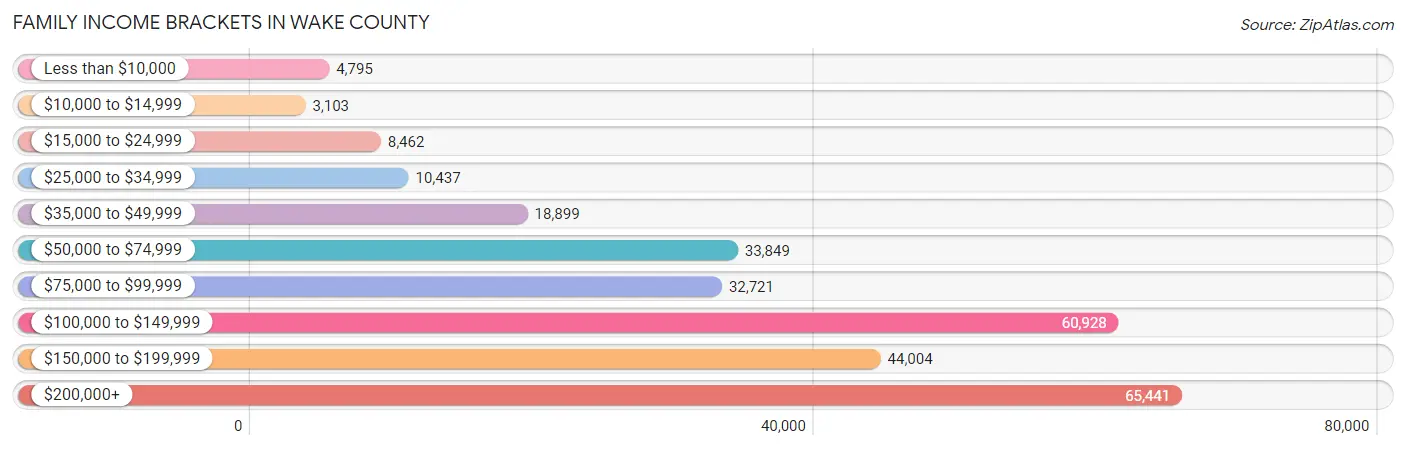
| Income Bracket | # Families | % Families |
| Less than $10,000 | 4,795 | 1.7% |
| $10,000 to $14,999 | 3,103 | 1.1% |
| $15,000 to $24,999 | 8,462 | 3.0% |
| $25,000 to $34,999 | 10,437 | 3.7% |
| $35,000 to $49,999 | 18,899 | 6.7% |
| $50,000 to $74,999 | 33,849 | 12.0% |
| $75,000 to $99,999 | 32,721 | 11.6% |
| $100,000 to $149,999 | 60,928 | 21.6% |
| $150,000 to $199,999 | 44,004 | 15.6% |
| $200,000+ | 65,441 | 23.2% |
Family Income by Famaliy Size in Wake County
6-person families (5,842 | 2.1%) account for the highest median family income in Wake County with $155,417 per family, while 2-person families (125,215 | 44.4%) have the highest median income of $52,042 per family member.
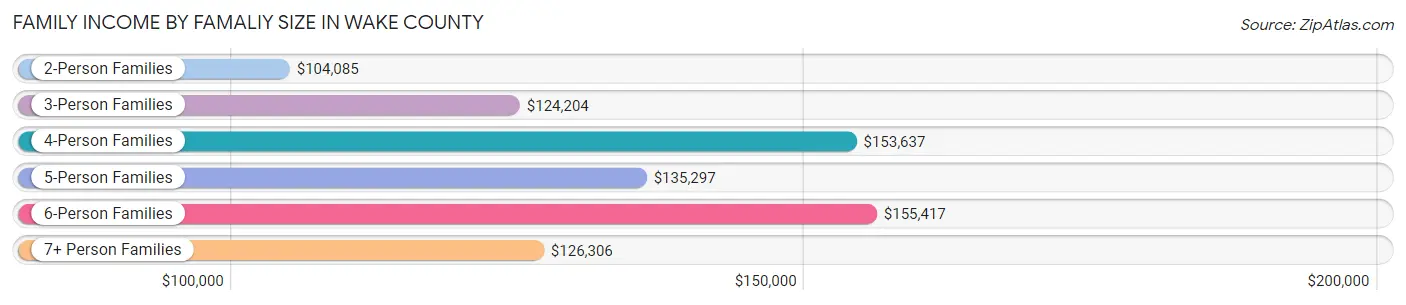
| Income Bracket | # Families | Median Income |
| 2-Person Families | 125,215 (44.4%) | $104,085 |
| 3-Person Families | 64,168 (22.8%) | $124,204 |
| 4-Person Families | 61,359 (21.7%) | $153,637 |
| 5-Person Families | 22,661 (8.0%) | $135,297 |
| 6-Person Families | 5,842 (2.1%) | $155,417 |
| 7+ Person Families | 2,829 (1.0%) | $126,306 |
| Total | 282,074 (100.0%) | $121,682 |
Family Income by Number of Earners in Wake County
The median family income in Wake County is $121,682, with families comprising 3+ earners (29,078) having the highest median family income of $159,578, while families with no earners (28,843) have the lowest median family income of $69,906, accounting for 10.3% and 10.2% of families, respectively.
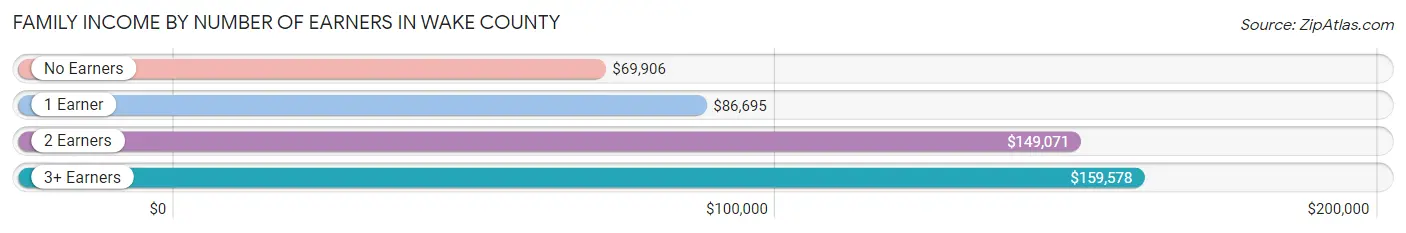
| Number of Earners | # Families | Median Income |
| No Earners | 28,843 (10.2%) | $69,906 |
| 1 Earner | 84,477 (29.9%) | $86,695 |
| 2 Earners | 139,676 (49.5%) | $149,071 |
| 3+ Earners | 29,078 (10.3%) | $159,578 |
| Total | 282,074 (100.0%) | $121,682 |
Household Income in Wake County
Household Income Brackets in Wake County
With 82,655 households falling in the category, the $100,000 to $149,999 income range is the most frequent in Wake County, accounting for 19.2% of all households. In contrast, only 8,610 households (2.0%) fall into the $10,000 to $14,999 income bracket, making it the least populous group.
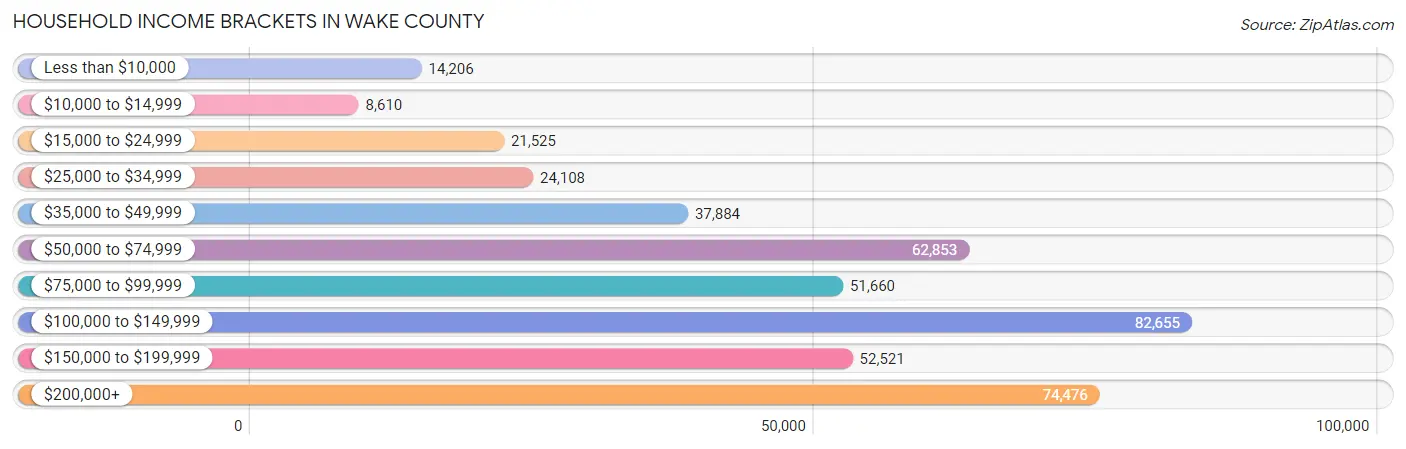
| Income Bracket | # Households | % Households |
| Less than $10,000 | 14,206 | 3.3% |
| $10,000 to $14,999 | 8,610 | 2.0% |
| $15,000 to $24,999 | 21,525 | 5.0% |
| $25,000 to $34,999 | 24,108 | 5.6% |
| $35,000 to $49,999 | 37,884 | 8.8% |
| $50,000 to $74,999 | 62,853 | 14.6% |
| $75,000 to $99,999 | 51,660 | 12.0% |
| $100,000 to $149,999 | 82,655 | 19.2% |
| $150,000 to $199,999 | 52,521 | 12.2% |
| $200,000+ | 74,476 | 17.3% |
Household Income by Householder Age in Wake County
The median household income in Wake County is $96,734, with the highest median household income of $115,770 found in the 45 to 64 years age bracket for the primary householder. A total of 164,988 households (38.3%) fall into this category. Meanwhile, the 15 to 24 years age bracket for the primary householder has the lowest median household income of $49,324, with 16,668 households (3.9%) in this group.
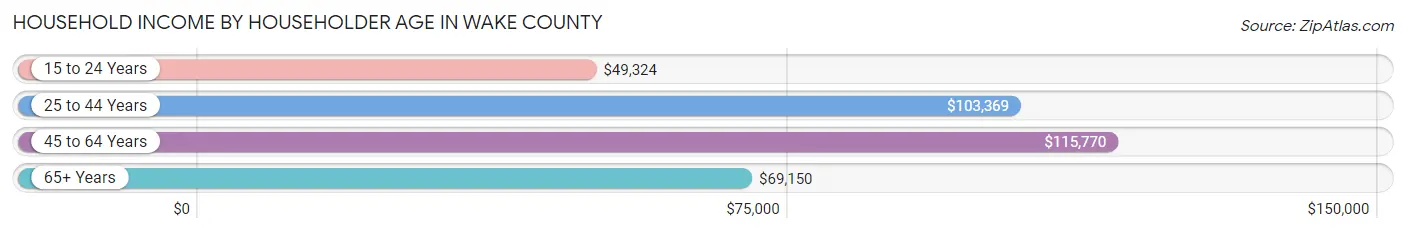
| Income Bracket | # Households | Median Income |
| 15 to 24 Years | 16,668 (3.9%) | $49,324 |
| 25 to 44 Years | 165,578 (38.5%) | $103,369 |
| 45 to 64 Years | 164,988 (38.3%) | $115,770 |
| 65+ Years | 83,263 (19.3%) | $69,150 |
| Total | 430,497 (100.0%) | $96,734 |
Poverty in Wake County
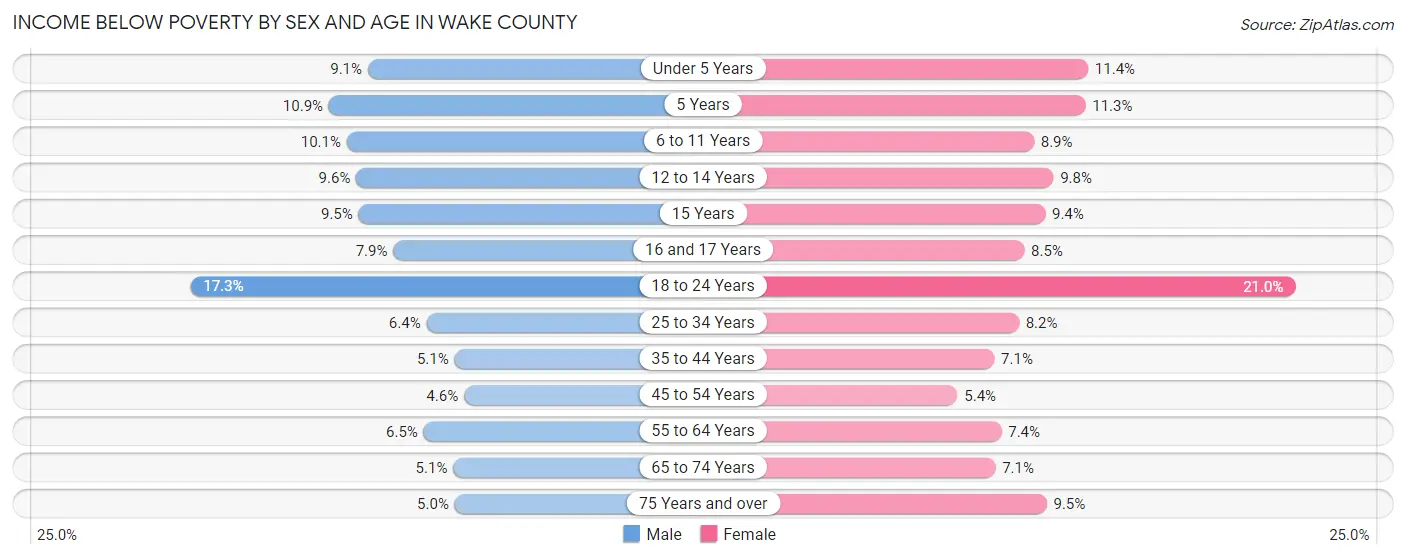
Income Below Poverty by Sex and Age in Wake County
With 7.5% poverty level for males and 8.9% for females among the residents of Wake County, 18 to 24 year old males and 18 to 24 year old females are the most vulnerable to poverty, with 7,939 males (17.3%) and 9,354 females (21.0%) in their respective age groups living below the poverty level.
| Age Bracket | Male | Female |
| Under 5 Years | 3,027 (9.1%) | 3,618 (11.4%) |
| 5 Years | 843 (10.9%) | 887 (11.3%) |
| 6 to 11 Years | 4,540 (10.1%) | 3,843 (8.9%) |
| 12 to 14 Years | 2,232 (9.6%) | 2,164 (9.8%) |
| 15 Years | 740 (9.5%) | 760 (9.4%) |
| 16 and 17 Years | 1,282 (7.9%) | 1,292 (8.5%) |
| 18 to 24 Years | 7,939 (17.3%) | 9,354 (21.0%) |
| 25 to 34 Years | 5,108 (6.4%) | 6,829 (8.2%) |
| 35 to 44 Years | 4,181 (5.1%) | 6,059 (7.1%) |
| 45 to 54 Years | 3,665 (4.6%) | 4,280 (5.4%) |
| 55 to 64 Years | 4,101 (6.5%) | 4,950 (7.4%) |
| 65 to 74 Years | 1,971 (5.1%) | 3,332 (7.1%) |
| 75 Years and over | 1,059 (5.0%) | 2,853 (9.5%) |
| Total | 40,688 (7.5%) | 50,221 (8.9%) |
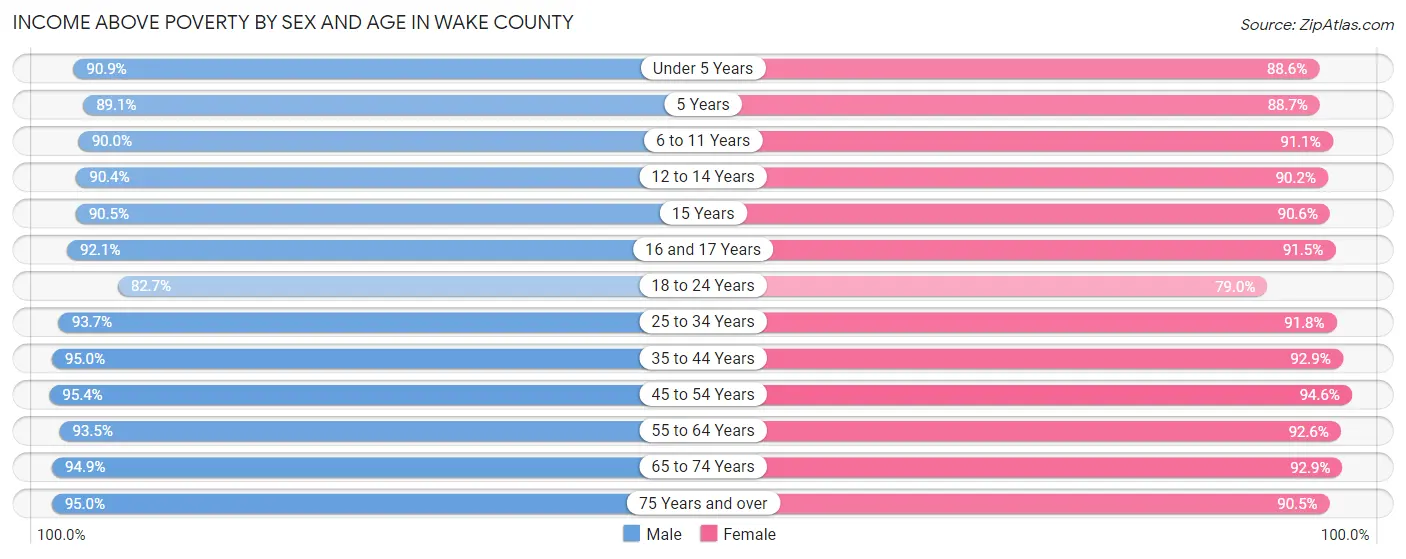
Income Above Poverty by Sex and Age in Wake County
According to the poverty statistics in Wake County, males aged 45 to 54 years and females aged 45 to 54 years are the age groups that are most secure financially, with 95.4% of males and 94.6% of females in these age groups living above the poverty line.
| Age Bracket | Male | Female |
| Under 5 Years | 30,329 (90.9%) | 28,066 (88.6%) |
| 5 Years | 6,903 (89.1%) | 6,963 (88.7%) |
| 6 to 11 Years | 40,643 (89.9%) | 39,303 (91.1%) |
| 12 to 14 Years | 20,996 (90.4%) | 19,884 (90.2%) |
| 15 Years | 7,053 (90.5%) | 7,296 (90.6%) |
| 16 and 17 Years | 14,970 (92.1%) | 13,982 (91.5%) |
| 18 to 24 Years | 37,929 (82.7%) | 35,110 (79.0%) |
| 25 to 34 Years | 75,308 (93.6%) | 76,389 (91.8%) |
| 35 to 44 Years | 78,586 (95.0%) | 79,683 (92.9%) |
| 45 to 54 Years | 75,884 (95.4%) | 75,523 (94.6%) |
| 55 to 64 Years | 59,223 (93.5%) | 61,920 (92.6%) |
| 65 to 74 Years | 36,588 (94.9%) | 43,444 (92.9%) |
| 75 Years and over | 19,959 (95.0%) | 27,183 (90.5%) |
| Total | 504,371 (92.5%) | 514,746 (91.1%) |
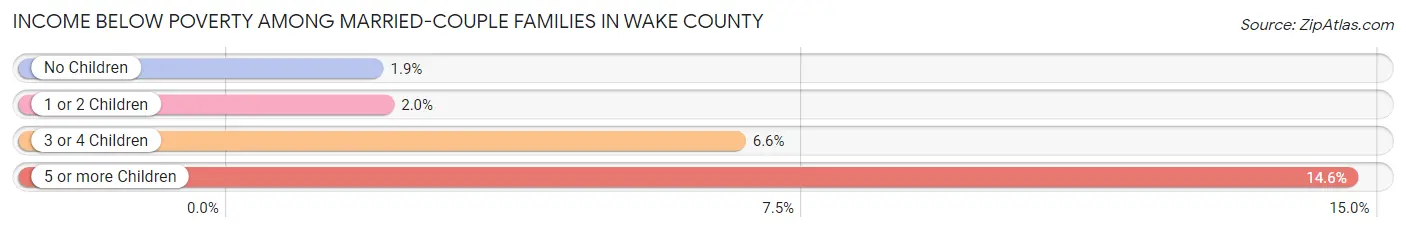
Income Below Poverty Among Married-Couple Families in Wake County
The poverty statistics for married-couple families in Wake County show that 2.4% or 5,261 of the total 221,243 families live below the poverty line. Families with 5 or more children have the highest poverty rate of 14.6%, comprising of 147 families. On the other hand, families with no children have the lowest poverty rate of 1.9%, which includes 2,201 families.
| Children | Above Poverty | Below Poverty |
| No Children | 113,659 (98.1%) | 2,201 (1.9%) |
| 1 or 2 Children | 85,489 (98.0%) | 1,779 (2.0%) |
| 3 or 4 Children | 15,976 (93.4%) | 1,134 (6.6%) |
| 5 or more Children | 858 (85.4%) | 147 (14.6%) |
| Total | 215,982 (97.6%) | 5,261 (2.4%) |
Income Below Poverty Among Single-Parent Households in Wake County
According to the poverty data in Wake County, 8.4% or 1,323 single-father households and 16.9% or 7,622 single-mother households are living below the poverty line. Among single-father households, those with 3 or 4 children have the highest poverty rate, with 587 households (31.9%) experiencing poverty. Likewise, among single-mother households, those with 3 or 4 children have the highest poverty rate, with 1,907 households (44.7%) falling below the poverty line.

| Children | Single Father | Single Mother |
| No Children | 261 (4.0%) | 1,230 (7.3%) |
| 1 or 2 Children | 475 (6.5%) | 4,421 (18.6%) |
| 3 or 4 Children | 587 (31.9%) | 1,907 (44.7%) |
| 5 or more Children | 0 (0.0%) | 64 (29.6%) |
| Total | 1,323 (8.4%) | 7,622 (16.9%) |
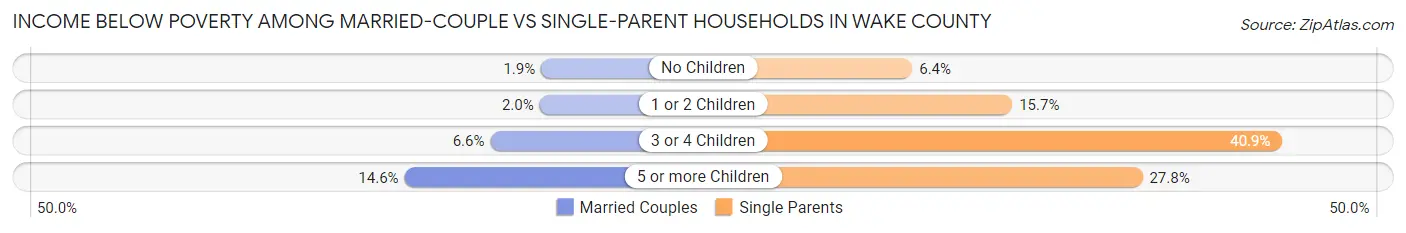
Income Below Poverty Among Married-Couple vs Single-Parent Households in Wake County
The poverty data for Wake County shows that 5,261 of the married-couple family households (2.4%) and 8,945 of the single-parent households (14.7%) are living below the poverty level. Within the married-couple family households, those with 5 or more children have the highest poverty rate, with 147 households (14.6%) falling below the poverty line. Among the single-parent households, those with 3 or 4 children have the highest poverty rate, with 2,494 household (40.8%) living below poverty.
| Children | Married-Couple Families | Single-Parent Households |
| No Children | 2,201 (1.9%) | 1,491 (6.4%) |
| 1 or 2 Children | 1,779 (2.0%) | 4,896 (15.7%) |
| 3 or 4 Children | 1,134 (6.6%) | 2,494 (40.8%) |
| 5 or more Children | 147 (14.6%) | 64 (27.8%) |
| Total | 5,261 (2.4%) | 8,945 (14.7%) |
Employment Characteristics in Wake County
Employment by Class of Employer in Wake County
Among the 591,910 employed individuals in Wake County, private company employees (417,462 | 70.5%), not-for-profit organizations (45,460 | 7.7%), and state government employees (40,130 | 6.8%) make up the most common classes of employment.
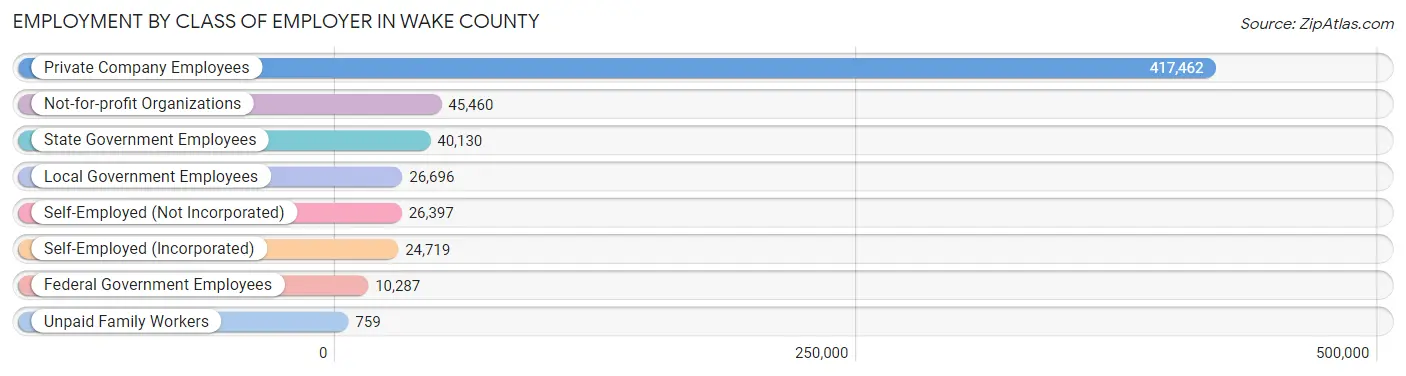
| Employer Class | # Employees | % Employees |
| Private Company Employees | 417,462 | 70.5% |
| Self-Employed (Incorporated) | 24,719 | 4.2% |
| Self-Employed (Not Incorporated) | 26,397 | 4.5% |
| Not-for-profit Organizations | 45,460 | 7.7% |
| Local Government Employees | 26,696 | 4.5% |
| State Government Employees | 40,130 | 6.8% |
| Federal Government Employees | 10,287 | 1.7% |
| Unpaid Family Workers | 759 | 0.1% |
| Total | 591,910 | 100.0% |
Employment Status by Age in Wake County
According to the labor force statistics for Wake County, out of the total population over 16 years of age (899,401), 69.9% or 628,681 individuals are in the labor force, with 4.2% or 26,405 of them unemployed. The age group with the highest labor force participation rate is 25 to 29 years, with 88.2% or 71,350 individuals in the labor force. Within the labor force, the 16 to 19 years age range has the highest percentage of unemployed individuals, with 16.0% or 3,561 of them being unemployed.
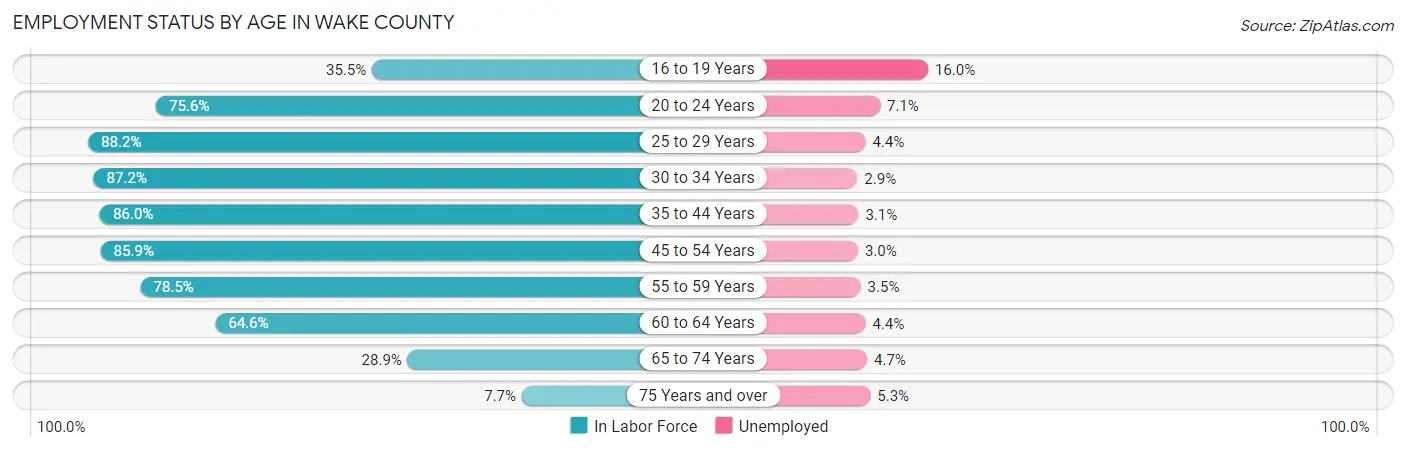
| Age Bracket | In Labor Force | Unemployed |
| 16 to 19 Years | 22,255 (35.5%) | 3,561 (16.0%) |
| 20 to 24 Years | 54,274 (75.6%) | 3,853 (7.1%) |
| 25 to 29 Years | 71,350 (88.2%) | 3,139 (4.4%) |
| 30 to 34 Years | 73,680 (87.2%) | 2,137 (2.9%) |
| 35 to 44 Years | 145,922 (86.0%) | 4,524 (3.1%) |
| 45 to 54 Years | 137,676 (85.9%) | 4,130 (3.0%) |
| 55 to 59 Years | 54,491 (78.5%) | 1,907 (3.5%) |
| 60 to 64 Years | 39,790 (64.6%) | 1,751 (4.4%) |
| 65 to 74 Years | 24,828 (28.9%) | 1,167 (4.7%) |
| 75 Years and over | 4,055 (7.7%) | 215 (5.3%) |
| Total | 628,681 (69.9%) | 26,405 (4.2%) |
Employment Status by Educational Attainment in Wake County
According to labor force statistics for Wake County, 83.5% of individuals (523,004) out of the total population between 25 and 64 years of age (626,352) are in the labor force, with 3.3% or 17,259 of them being unemployed. The group with the highest labor force participation rate are those with the educational attainment of bachelor's degree or higher, with 87.2% or 316,712 individuals in the labor force. Within the labor force, individuals with less than high school education have the highest percentage of unemployment, with 7.4% or 1,770 of them being unemployed.
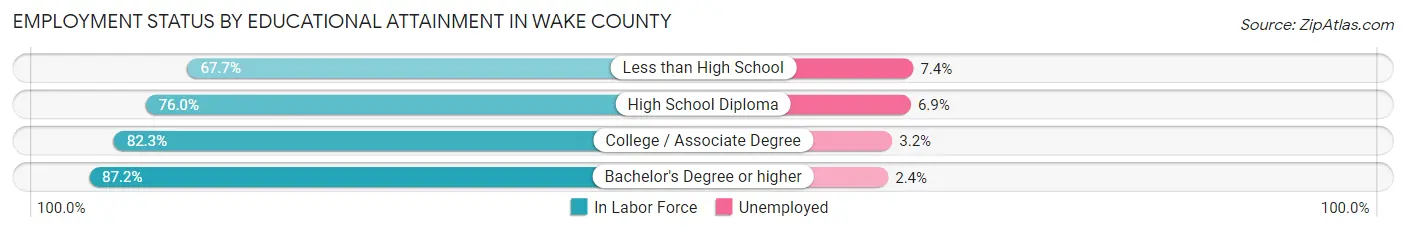
| Educational Attainment | In Labor Force | Unemployed |
| Less than High School | 23,921 (67.7%) | 2,615 (7.4%) |
| High School Diploma | 62,594 (76.0%) | 5,683 (6.9%) |
| College / Associate Degree | 119,710 (82.3%) | 4,655 (3.2%) |
| Bachelor's Degree or higher | 316,712 (87.2%) | 8,717 (2.4%) |
| Total | 523,004 (83.5%) | 20,670 (3.3%) |
Employment Occupations by Sex in Wake County
Management, Business, Science and Arts Occupations
The most common Management, Business, Science and Arts occupations in Wake County are Management (88,918 | 14.8%), Computers, Engineering & Science (82,348 | 13.7%), Community & Social Service (71,388 | 11.9%), Business & Financial (55,519 | 9.2%), and Computers & Mathematics (50,129 | 8.3%).
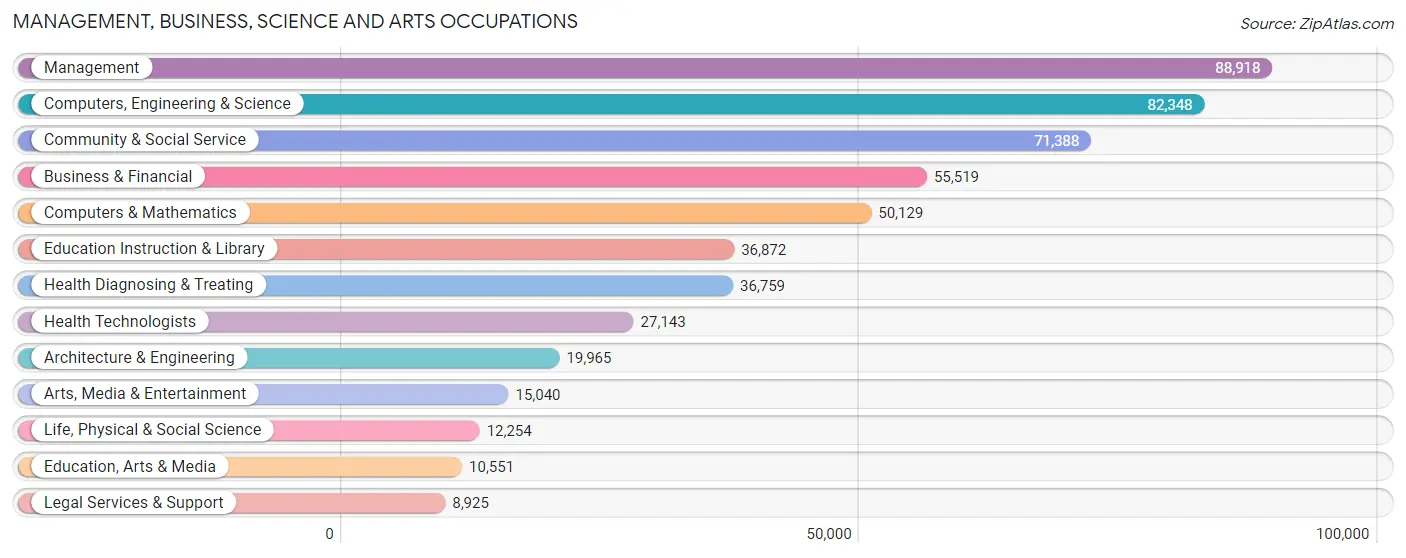
Management, Business, Science and Arts Occupations by Sex
Within the Management, Business, Science and Arts occupations in Wake County, the most male-oriented occupations are Architecture & Engineering (80.2%), Computers & Mathematics (73.7%), and Computers, Engineering & Science (71.4%), while the most female-oriented occupations are Health Diagnosing & Treating (75.0%), Health Technologists (73.9%), and Education Instruction & Library (70.6%).
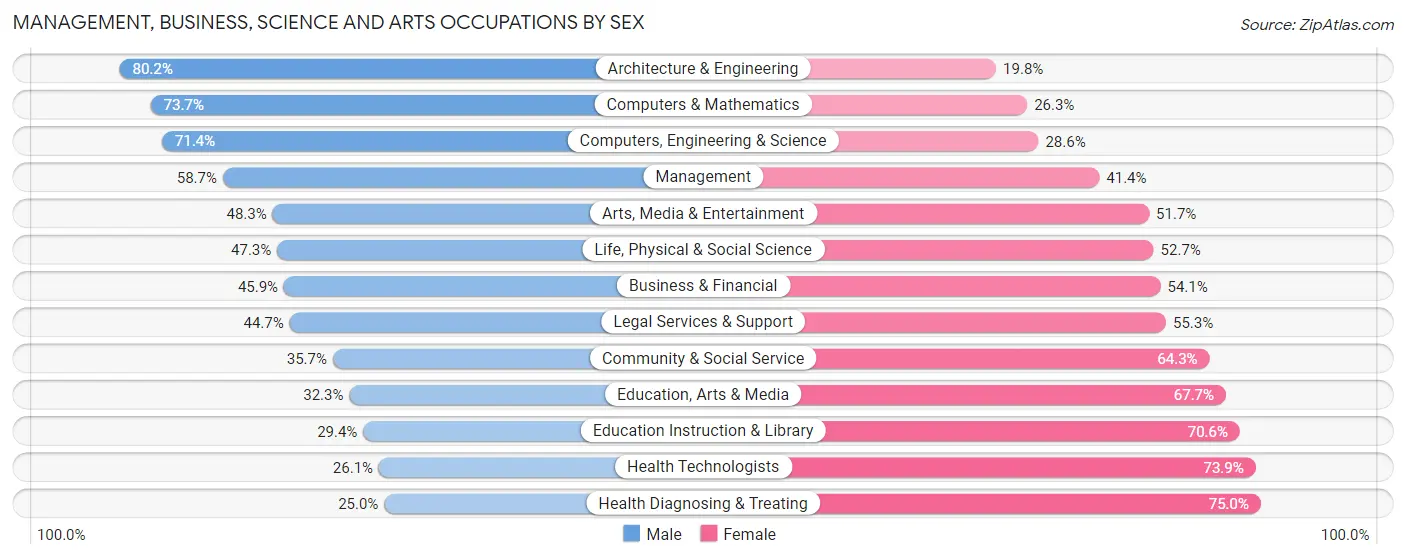
| Occupation | Male | Female |
| Management | 52,147 (58.7%) | 36,771 (41.3%) |
| Business & Financial | 25,483 (45.9%) | 30,036 (54.1%) |
| Computers, Engineering & Science | 58,762 (71.4%) | 23,586 (28.6%) |
| Computers & Mathematics | 36,952 (73.7%) | 13,177 (26.3%) |
| Architecture & Engineering | 16,010 (80.2%) | 3,955 (19.8%) |
| Life, Physical & Social Science | 5,800 (47.3%) | 6,454 (52.7%) |
| Community & Social Service | 25,488 (35.7%) | 45,900 (64.3%) |
| Education, Arts & Media | 3,405 (32.3%) | 7,146 (67.7%) |
| Legal Services & Support | 3,993 (44.7%) | 4,932 (55.3%) |
| Education Instruction & Library | 10,830 (29.4%) | 26,042 (70.6%) |
| Arts, Media & Entertainment | 7,260 (48.3%) | 7,780 (51.7%) |
| Health Diagnosing & Treating | 9,186 (25.0%) | 27,573 (75.0%) |
| Health Technologists | 7,082 (26.1%) | 20,061 (73.9%) |
| Total (Category) | 171,066 (51.1%) | 163,866 (48.9%) |
| Total (Overall) | 318,509 (53.0%) | 282,780 (47.0%) |
Services Occupations
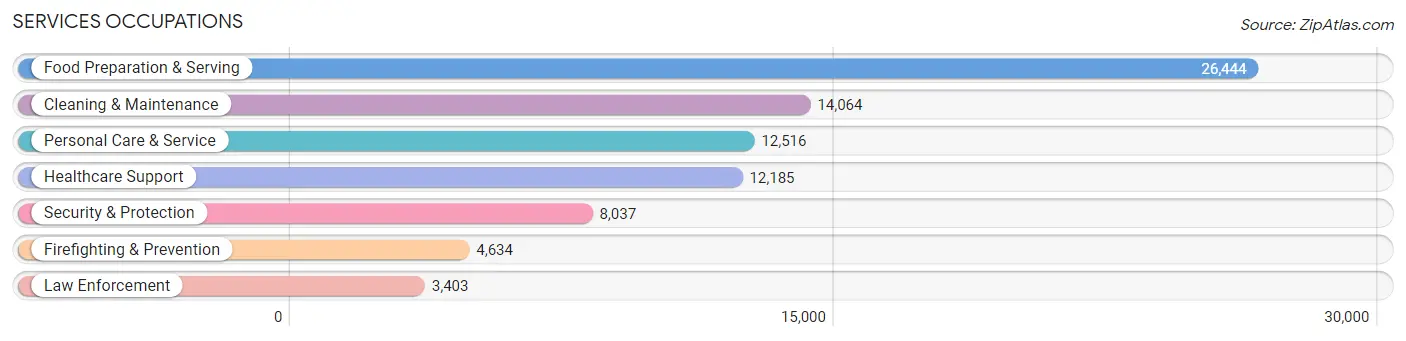
The most common Services occupations in Wake County are Food Preparation & Serving (26,444 | 4.4%), Cleaning & Maintenance (14,064 | 2.3%), Personal Care & Service (12,516 | 2.1%), Healthcare Support (12,185 | 2.0%), and Security & Protection (8,037 | 1.3%).
Services Occupations by Sex
Within the Services occupations in Wake County, the most male-oriented occupations are Law Enforcement (74.1%), Security & Protection (70.8%), and Firefighting & Prevention (68.3%), while the most female-oriented occupations are Healthcare Support (83.3%), Personal Care & Service (77.3%), and Food Preparation & Serving (48.7%).
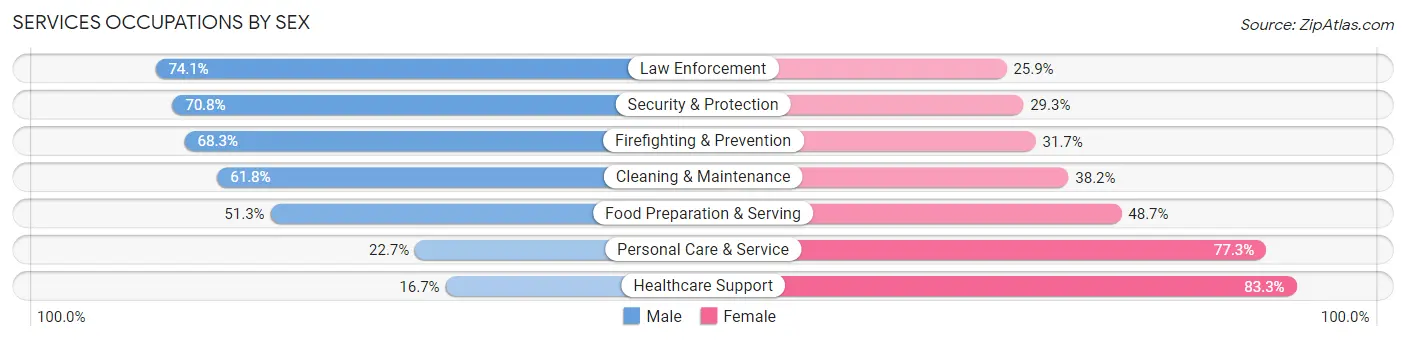
| Occupation | Male | Female |
| Healthcare Support | 2,031 (16.7%) | 10,154 (83.3%) |
| Security & Protection | 5,686 (70.8%) | 2,351 (29.2%) |
| Firefighting & Prevention | 3,165 (68.3%) | 1,469 (31.7%) |
| Law Enforcement | 2,521 (74.1%) | 882 (25.9%) |
| Food Preparation & Serving | 13,573 (51.3%) | 12,871 (48.7%) |
| Cleaning & Maintenance | 8,694 (61.8%) | 5,370 (38.2%) |
| Personal Care & Service | 2,838 (22.7%) | 9,678 (77.3%) |
| Total (Category) | 32,822 (44.8%) | 40,424 (55.2%) |
| Total (Overall) | 318,509 (53.0%) | 282,780 (47.0%) |
Sales and Office Occupations
The most common Sales and Office occupations in Wake County are Sales & Related (59,852 | 10.0%), and Office & Administration (54,544 | 9.1%).

Sales and Office Occupations by Sex
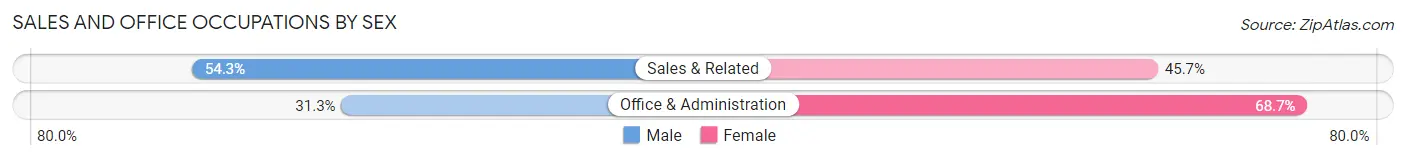
| Occupation | Male | Female |
| Sales & Related | 32,473 (54.3%) | 27,379 (45.7%) |
| Office & Administration | 17,049 (31.3%) | 37,495 (68.7%) |
| Total (Category) | 49,522 (43.3%) | 64,874 (56.7%) |
| Total (Overall) | 318,509 (53.0%) | 282,780 (47.0%) |
Natural Resources, Construction and Maintenance Occupations
The most common Natural Resources, Construction and Maintenance occupations in Wake County are Construction & Extraction (20,426 | 3.4%), Installation, Maintenance & Repair (10,264 | 1.7%), and Farming, Fishing & Forestry (909 | 0.2%).

Natural Resources, Construction and Maintenance Occupations by Sex
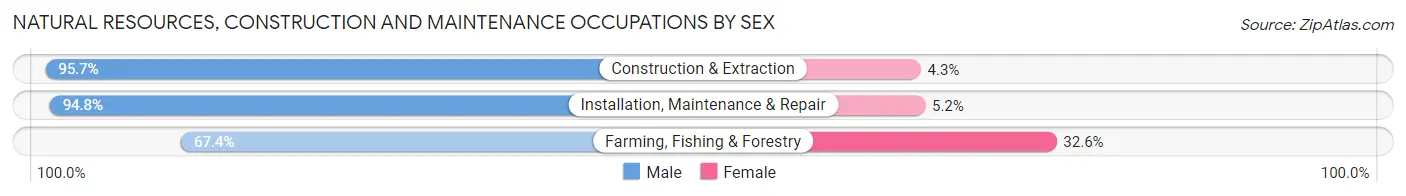
| Occupation | Male | Female |
| Farming, Fishing & Forestry | 613 (67.4%) | 296 (32.6%) |
| Construction & Extraction | 19,545 (95.7%) | 881 (4.3%) |
| Installation, Maintenance & Repair | 9,727 (94.8%) | 537 (5.2%) |
| Total (Category) | 29,885 (94.6%) | 1,714 (5.4%) |
| Total (Overall) | 318,509 (53.0%) | 282,780 (47.0%) |
Production, Transportation and Moving Occupations
The most common Production, Transportation and Moving occupations in Wake County are Production (17,433 | 2.9%), Transportation (15,434 | 2.6%), and Material Moving (14,249 | 2.4%).
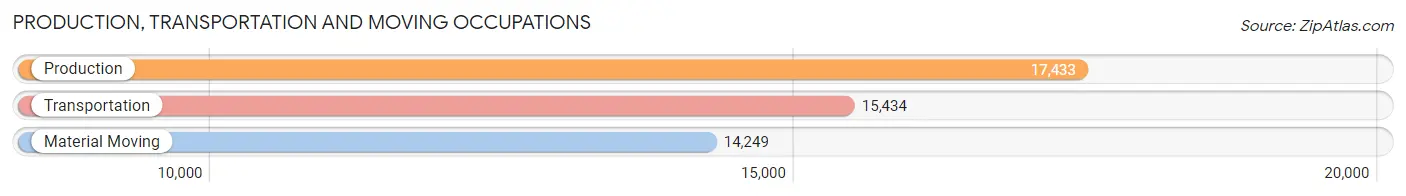
Production, Transportation and Moving Occupations by Sex
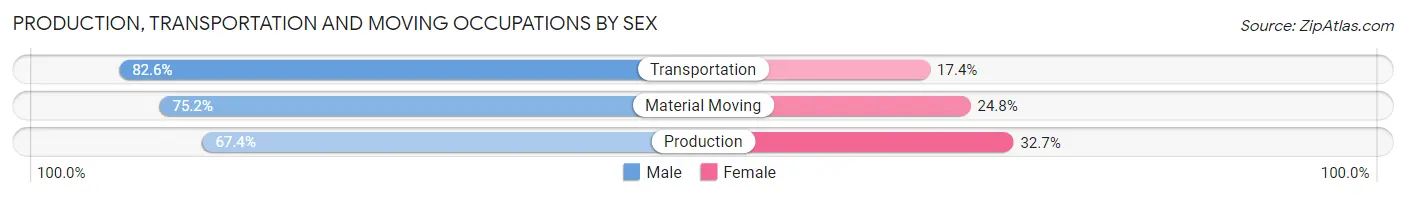
| Occupation | Male | Female |
| Production | 11,741 (67.3%) | 5,692 (32.7%) |
| Transportation | 12,754 (82.6%) | 2,680 (17.4%) |
| Material Moving | 10,719 (75.2%) | 3,530 (24.8%) |
| Total (Category) | 35,214 (74.7%) | 11,902 (25.3%) |
| Total (Overall) | 318,509 (53.0%) | 282,780 (47.0%) |
Employment Industries by Sex in Wake County
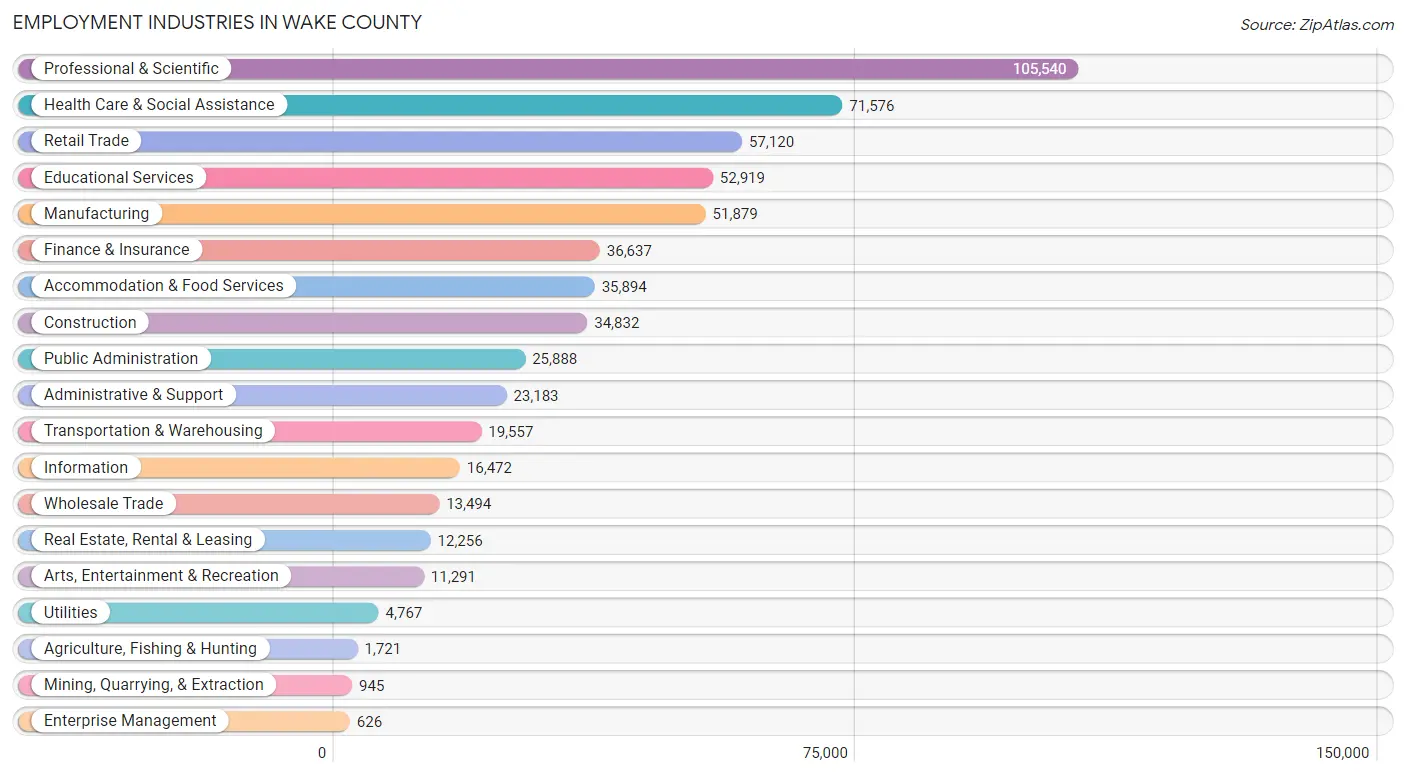
Employment Industries in Wake County
The major employment industries in Wake County include Professional & Scientific (105,540 | 17.5%), Health Care & Social Assistance (71,576 | 11.9%), Retail Trade (57,120 | 9.5%), Educational Services (52,919 | 8.8%), and Manufacturing (51,879 | 8.6%).
Employment Industries by Sex in Wake County
The Wake County industries that see more men than women are Construction (86.2%), Mining, Quarrying, & Extraction (76.1%), and Transportation & Warehousing (73.4%), whereas the industries that tend to have a higher number of women are Health Care & Social Assistance (76.6%), Educational Services (67.1%), and Public Administration (53.3%).
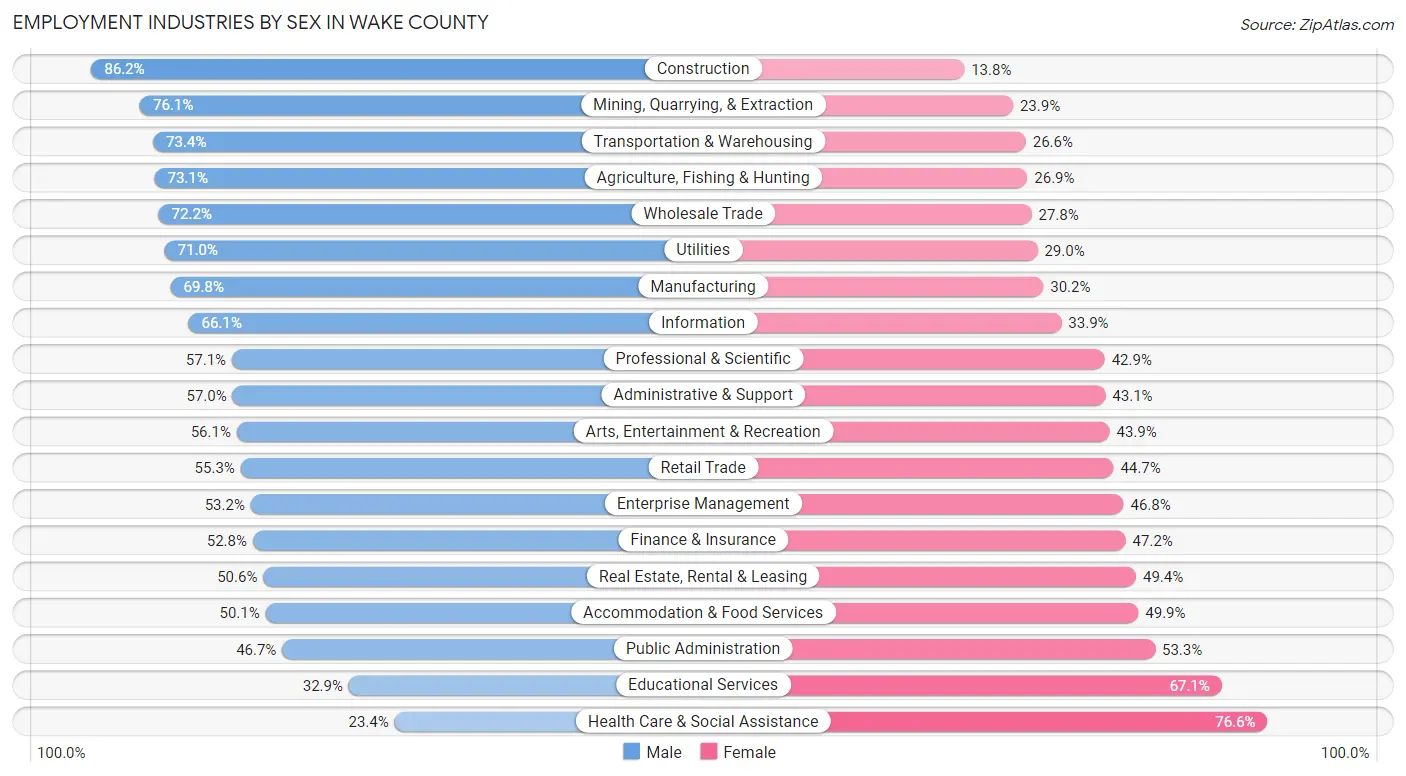
| Industry | Male | Female |
| Agriculture, Fishing & Hunting | 1,258 (73.1%) | 463 (26.9%) |
| Mining, Quarrying, & Extraction | 719 (76.1%) | 226 (23.9%) |
| Construction | 30,016 (86.2%) | 4,816 (13.8%) |
| Manufacturing | 36,214 (69.8%) | 15,665 (30.2%) |
| Wholesale Trade | 9,748 (72.2%) | 3,746 (27.8%) |
| Retail Trade | 31,576 (55.3%) | 25,544 (44.7%) |
| Transportation & Warehousing | 14,358 (73.4%) | 5,199 (26.6%) |
| Utilities | 3,385 (71.0%) | 1,382 (29.0%) |
| Information | 10,881 (66.1%) | 5,591 (33.9%) |
| Finance & Insurance | 19,330 (52.8%) | 17,307 (47.2%) |
| Real Estate, Rental & Leasing | 6,203 (50.6%) | 6,053 (49.4%) |
| Professional & Scientific | 60,252 (57.1%) | 45,288 (42.9%) |
| Enterprise Management | 333 (53.2%) | 293 (46.8%) |
| Administrative & Support | 13,203 (57.0%) | 9,980 (43.0%) |
| Educational Services | 17,405 (32.9%) | 35,514 (67.1%) |
| Health Care & Social Assistance | 16,760 (23.4%) | 54,816 (76.6%) |
| Arts, Entertainment & Recreation | 6,333 (56.1%) | 4,958 (43.9%) |
| Accommodation & Food Services | 17,992 (50.1%) | 17,902 (49.9%) |
| Public Administration | 12,085 (46.7%) | 13,803 (53.3%) |
| Total | 318,509 (53.0%) | 282,780 (47.0%) |
Education in Wake County
School Enrollment in Wake County
The most common levels of schooling among the 297,079 students in Wake County are middle school (62,047 | 20.9%), high school (61,860 | 20.8%), and college / undergraduate (60,680 | 20.4%).
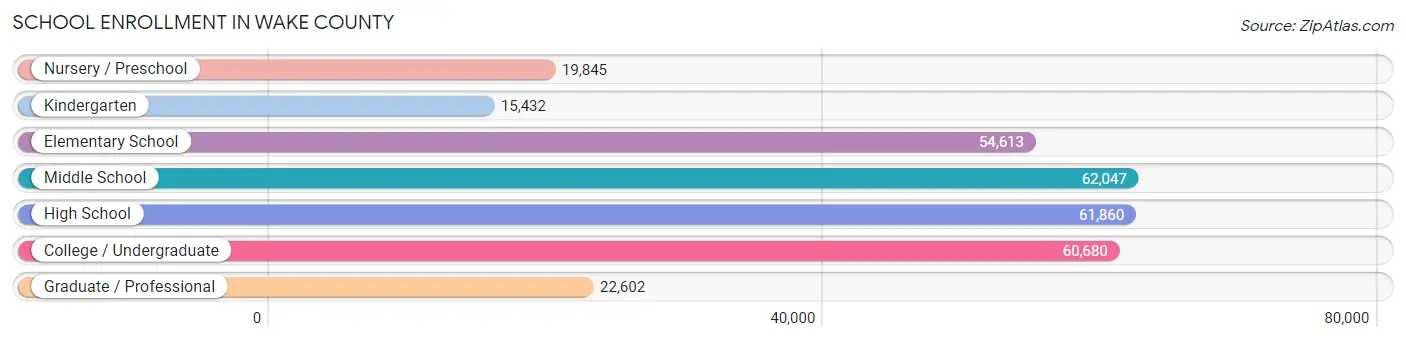
| School Level | # Students | % Students |
| Nursery / Preschool | 19,845 | 6.7% |
| Kindergarten | 15,432 | 5.2% |
| Elementary School | 54,613 | 18.4% |
| Middle School | 62,047 | 20.9% |
| High School | 61,860 | 20.8% |
| College / Undergraduate | 60,680 | 20.4% |
| Graduate / Professional | 22,602 | 7.6% |
| Total | 297,079 | 100.0% |
School Enrollment by Age by Funding Source in Wake County
Out of a total of 297,079 students who are enrolled in schools in Wake County, 57,039 (19.2%) attend a private institution, while the remaining 240,040 (80.8%) are enrolled in public schools. The age group of 3 to 4 year olds has the highest likelihood of being enrolled in private schools, with 10,914 (72.0% in the age bracket) enrolled. Conversely, the age group of 15 to 17 year olds has the lowest likelihood of being enrolled in a private school, with 40,531 (87.9% in the age bracket) attending a public institution.
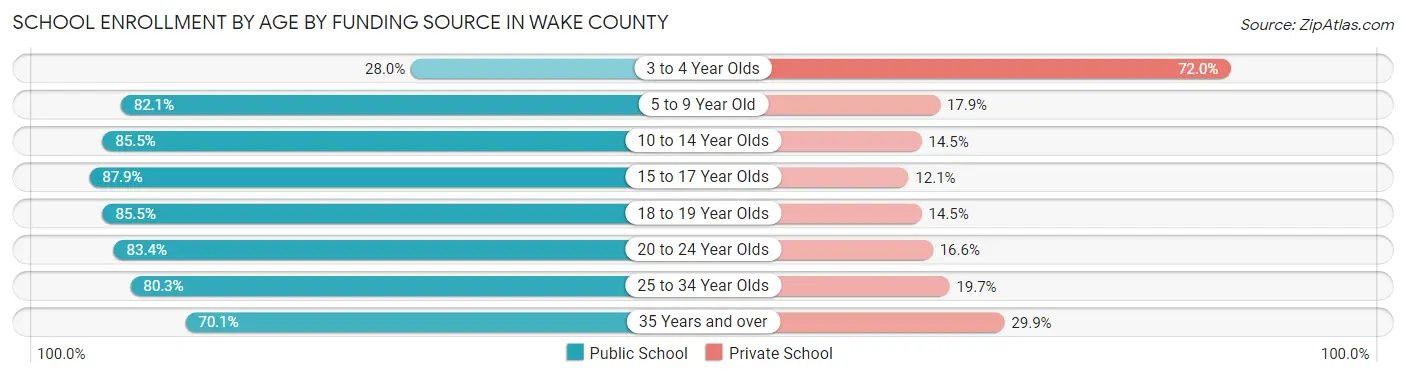
| Age Bracket | Public School | Private School |
| 3 to 4 Year Olds | 4,247 (28.0%) | 10,914 (72.0%) |
| 5 to 9 Year Old | 56,086 (82.1%) | 12,252 (17.9%) |
| 10 to 14 Year Olds | 64,825 (85.5%) | 10,993 (14.5%) |
| 15 to 17 Year Olds | 40,531 (87.9%) | 5,560 (12.1%) |
| 18 to 19 Year Olds | 21,860 (85.5%) | 3,713 (14.5%) |
| 20 to 24 Year Olds | 26,097 (83.4%) | 5,189 (16.6%) |
| 25 to 34 Year Olds | 15,869 (80.3%) | 3,894 (19.7%) |
| 35 Years and over | 10,543 (70.1%) | 4,506 (29.9%) |
| Total | 240,040 (80.8%) | 57,039 (19.2%) |
Educational Attainment by Field of Study in Wake County
Business (88,320 | 19.2%), engineering (49,333 | 10.7%), science & technology (38,665 | 8.4%), bio, nature & agricultural (36,123 | 7.9%), and social sciences (35,864 | 7.8%) are the most common fields of study among 460,218 individuals in Wake County who have obtained a bachelor's degree or higher.
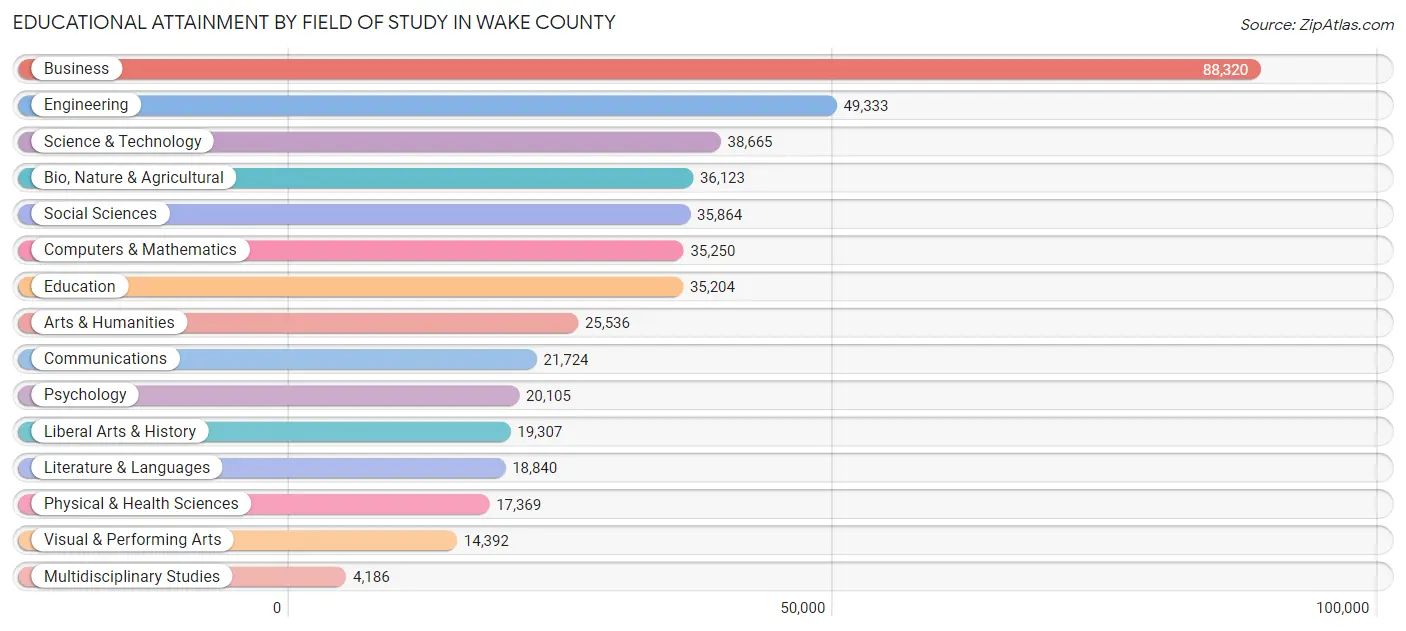
| Field of Study | # Graduates | % Graduates |
| Computers & Mathematics | 35,250 | 7.7% |
| Bio, Nature & Agricultural | 36,123 | 7.9% |
| Physical & Health Sciences | 17,369 | 3.8% |
| Psychology | 20,105 | 4.4% |
| Social Sciences | 35,864 | 7.8% |
| Engineering | 49,333 | 10.7% |
| Multidisciplinary Studies | 4,186 | 0.9% |
| Science & Technology | 38,665 | 8.4% |
| Business | 88,320 | 19.2% |
| Education | 35,204 | 7.6% |
| Literature & Languages | 18,840 | 4.1% |
| Liberal Arts & History | 19,307 | 4.2% |
| Visual & Performing Arts | 14,392 | 3.1% |
| Communications | 21,724 | 4.7% |
| Arts & Humanities | 25,536 | 5.6% |
| Total | 460,218 | 100.0% |
Transportation & Commute in Wake County
Vehicle Availability by Sex in Wake County
The most prevalent vehicle ownership categories in Wake County are males with 2 vehicles (150,392, accounting for 47.8%) and females with 2 vehicles (123,667, making up 54.5%).
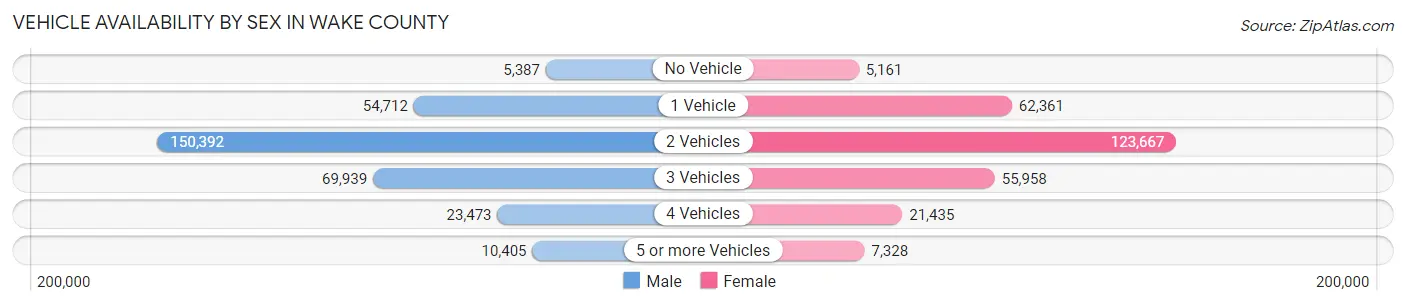
| Vehicles Available | Male | Female |
| No Vehicle | 5,387 (1.7%) | 5,161 (1.9%) |
| 1 Vehicle | 54,712 (17.4%) | 62,361 (22.6%) |
| 2 Vehicles | 150,392 (47.8%) | 123,667 (44.8%) |
| 3 Vehicles | 69,939 (22.3%) | 55,958 (20.3%) |
| 4 Vehicles | 23,473 (7.5%) | 21,435 (7.8%) |
| 5 or more Vehicles | 10,405 (3.3%) | 7,328 (2.7%) |
| Total | 314,308 (100.0%) | 275,910 (100.0%) |
Commute Time in Wake County
The most frequently occuring commute durations in Wake County are 15 to 19 minutes (77,619 commuters, 16.9%), 20 to 24 minutes (76,067 commuters, 16.6%), and 30 to 34 minutes (70,792 commuters, 15.4%).
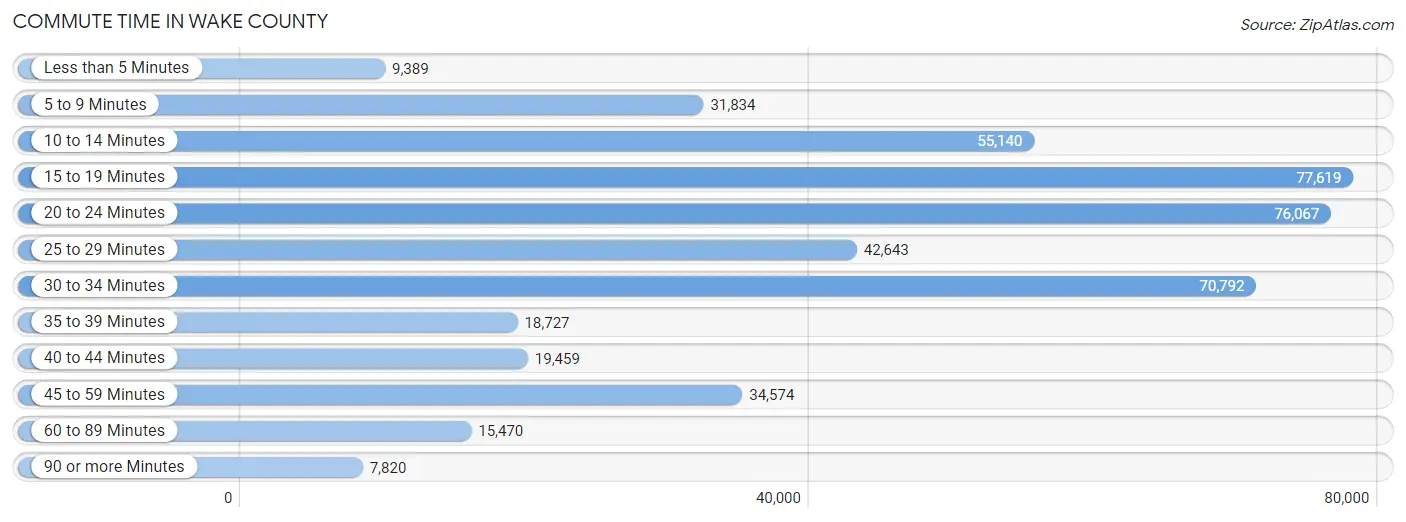
| Commute Time | # Commuters | % Commuters |
| Less than 5 Minutes | 9,389 | 2.0% |
| 5 to 9 Minutes | 31,834 | 6.9% |
| 10 to 14 Minutes | 55,140 | 12.0% |
| 15 to 19 Minutes | 77,619 | 16.9% |
| 20 to 24 Minutes | 76,067 | 16.6% |
| 25 to 29 Minutes | 42,643 | 9.3% |
| 30 to 34 Minutes | 70,792 | 15.4% |
| 35 to 39 Minutes | 18,727 | 4.1% |
| 40 to 44 Minutes | 19,459 | 4.2% |
| 45 to 59 Minutes | 34,574 | 7.5% |
| 60 to 89 Minutes | 15,470 | 3.4% |
| 90 or more Minutes | 7,820 | 1.7% |
Commute Time by Sex in Wake County
The most common commute times in Wake County are 15 to 19 minutes (42,132 commuters, 17.1%) for males and 20 to 24 minutes (36,802 commuters, 17.3%) for females.
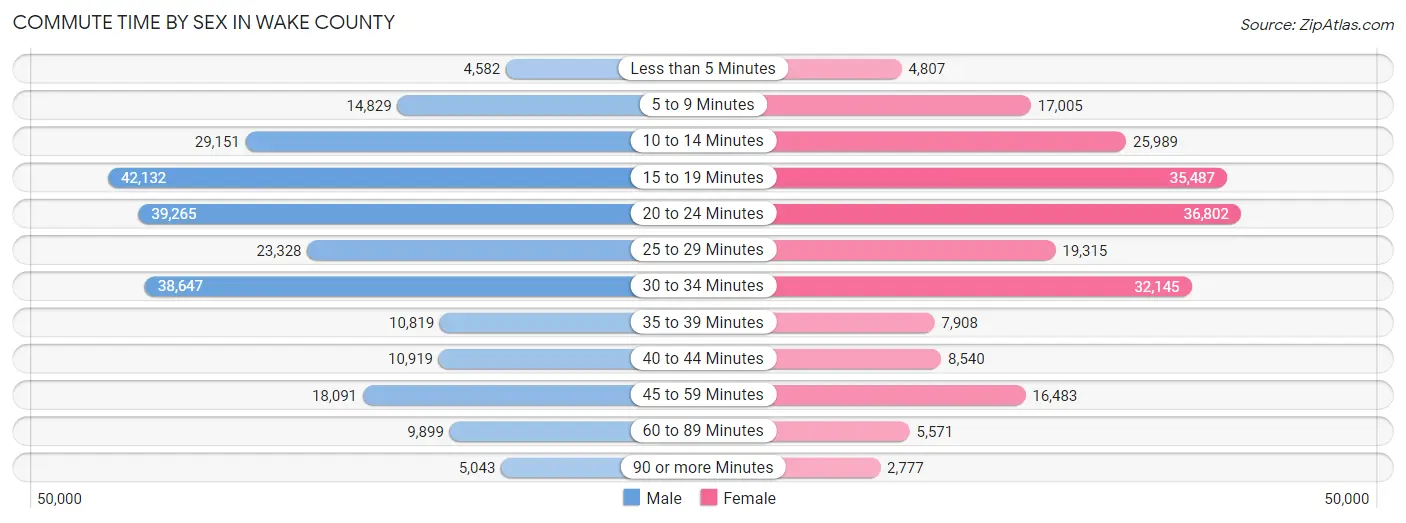
| Commute Time | Male | Female |
| Less than 5 Minutes | 4,582 (1.9%) | 4,807 (2.3%) |
| 5 to 9 Minutes | 14,829 (6.0%) | 17,005 (8.0%) |
| 10 to 14 Minutes | 29,151 (11.8%) | 25,989 (12.2%) |
| 15 to 19 Minutes | 42,132 (17.1%) | 35,487 (16.7%) |
| 20 to 24 Minutes | 39,265 (15.9%) | 36,802 (17.3%) |
| 25 to 29 Minutes | 23,328 (9.5%) | 19,315 (9.1%) |
| 30 to 34 Minutes | 38,647 (15.7%) | 32,145 (15.1%) |
| 35 to 39 Minutes | 10,819 (4.4%) | 7,908 (3.7%) |
| 40 to 44 Minutes | 10,919 (4.4%) | 8,540 (4.0%) |
| 45 to 59 Minutes | 18,091 (7.3%) | 16,483 (7.7%) |
| 60 to 89 Minutes | 9,899 (4.0%) | 5,571 (2.6%) |
| 90 or more Minutes | 5,043 (2.0%) | 2,777 (1.3%) |
Time of Departure to Work by Sex in Wake County
The most frequent times of departure to work in Wake County are 7:00 AM to 7:29 AM (35,812, 14.5%) for males and 8:00 AM to 8:29 AM (33,133, 15.6%) for females.
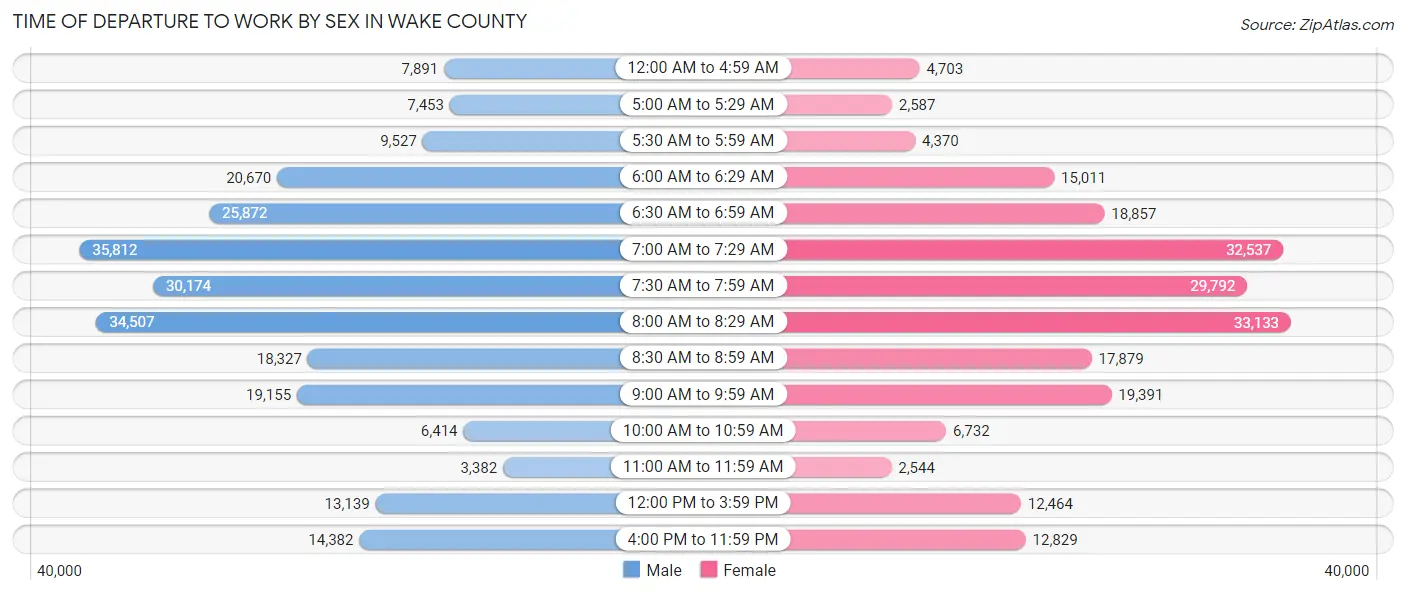
| Time of Departure | Male | Female |
| 12:00 AM to 4:59 AM | 7,891 (3.2%) | 4,703 (2.2%) |
| 5:00 AM to 5:29 AM | 7,453 (3.0%) | 2,587 (1.2%) |
| 5:30 AM to 5:59 AM | 9,527 (3.9%) | 4,370 (2.1%) |
| 6:00 AM to 6:29 AM | 20,670 (8.4%) | 15,011 (7.0%) |
| 6:30 AM to 6:59 AM | 25,872 (10.5%) | 18,857 (8.9%) |
| 7:00 AM to 7:29 AM | 35,812 (14.5%) | 32,537 (15.3%) |
| 7:30 AM to 7:59 AM | 30,174 (12.2%) | 29,792 (14.0%) |
| 8:00 AM to 8:29 AM | 34,507 (14.0%) | 33,133 (15.6%) |
| 8:30 AM to 8:59 AM | 18,327 (7.4%) | 17,879 (8.4%) |
| 9:00 AM to 9:59 AM | 19,155 (7.8%) | 19,391 (9.1%) |
| 10:00 AM to 10:59 AM | 6,414 (2.6%) | 6,732 (3.2%) |
| 11:00 AM to 11:59 AM | 3,382 (1.4%) | 2,544 (1.2%) |
| 12:00 PM to 3:59 PM | 13,139 (5.3%) | 12,464 (5.9%) |
| 4:00 PM to 11:59 PM | 14,382 (5.8%) | 12,829 (6.0%) |
| Total | 246,705 (100.0%) | 212,829 (100.0%) |
Housing Occupancy in Wake County
Occupancy by Ownership in Wake County
Of the total 430,497 dwellings in Wake County, owner-occupied units account for 276,942 (64.3%), while renter-occupied units make up 153,555 (35.7%).
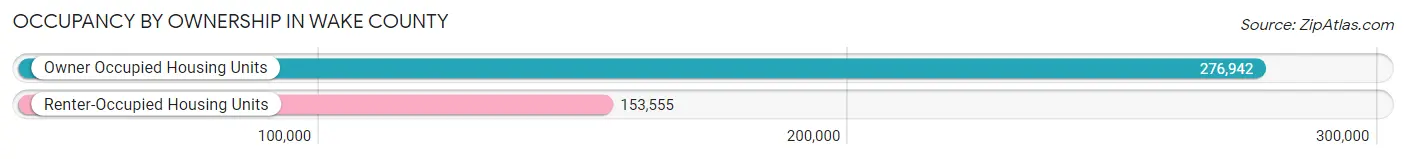
| Occupancy | # Housing Units | % Housing Units |
| Owner Occupied Housing Units | 276,942 | 64.3% |
| Renter-Occupied Housing Units | 153,555 | 35.7% |
| Total Occupied Housing Units | 430,497 | 100.0% |
Occupancy by Household Size in Wake County
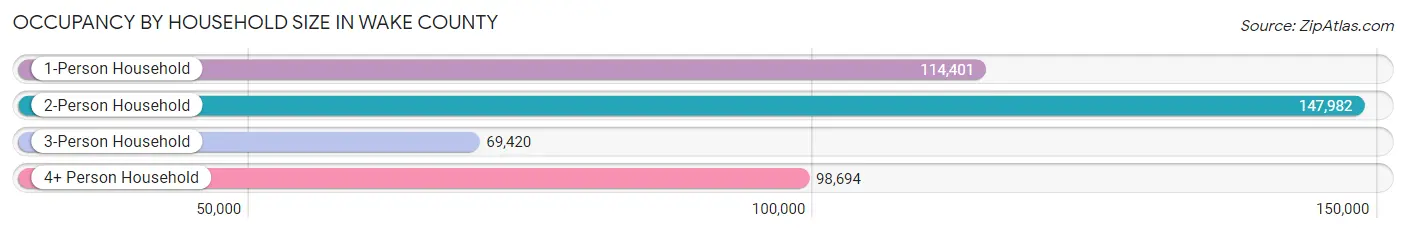
| Household Size | # Housing Units | % Housing Units |
| 1-Person Household | 114,401 | 26.6% |
| 2-Person Household | 147,982 | 34.4% |
| 3-Person Household | 69,420 | 16.1% |
| 4+ Person Household | 98,694 | 22.9% |
| Total Housing Units | 430,497 | 100.0% |
Occupancy by Ownership by Household Size in Wake County
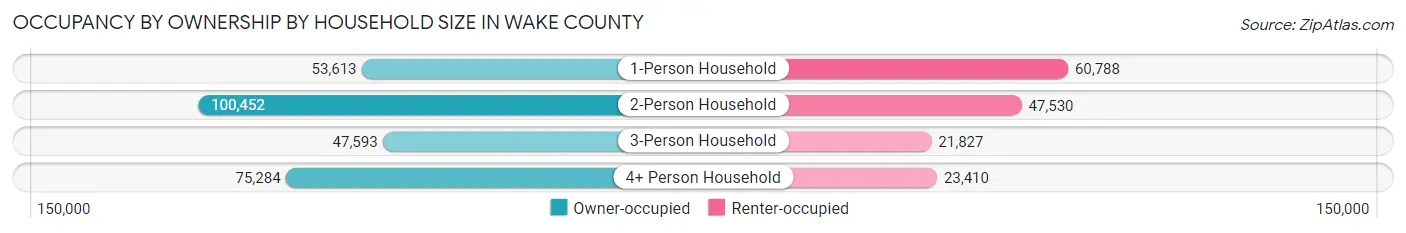
| Household Size | Owner-occupied | Renter-occupied |
| 1-Person Household | 53,613 (46.9%) | 60,788 (53.1%) |
| 2-Person Household | 100,452 (67.9%) | 47,530 (32.1%) |
| 3-Person Household | 47,593 (68.6%) | 21,827 (31.4%) |
| 4+ Person Household | 75,284 (76.3%) | 23,410 (23.7%) |
| Total Housing Units | 276,942 (64.3%) | 153,555 (35.7%) |
Occupancy by Educational Attainment in Wake County
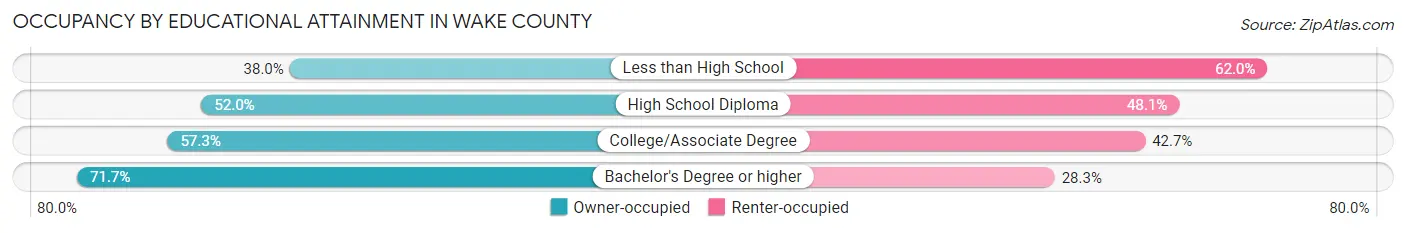
| Household Size | Owner-occupied | Renter-occupied |
| Less than High School | 7,082 (38.0%) | 11,572 (62.0%) |
| High School Diploma | 27,498 (51.9%) | 25,434 (48.0%) |
| College/Associate Degree | 59,577 (57.3%) | 44,338 (42.7%) |
| Bachelor's Degree or higher | 182,785 (71.7%) | 72,211 (28.3%) |
Occupancy by Age of Householder in Wake County
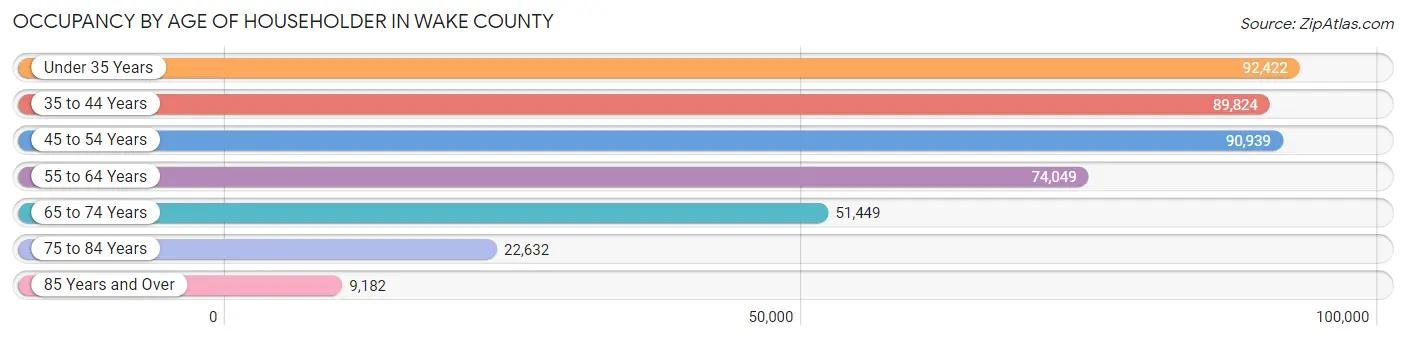
| Age Bracket | # Households | % Households |
| Under 35 Years | 92,422 | 21.5% |
| 35 to 44 Years | 89,824 | 20.9% |
| 45 to 54 Years | 90,939 | 21.1% |
| 55 to 64 Years | 74,049 | 17.2% |
| 65 to 74 Years | 51,449 | 11.9% |
| 75 to 84 Years | 22,632 | 5.3% |
| 85 Years and Over | 9,182 | 2.1% |
| Total | 430,497 | 100.0% |
Housing Finances in Wake County
Median Income by Occupancy in Wake County
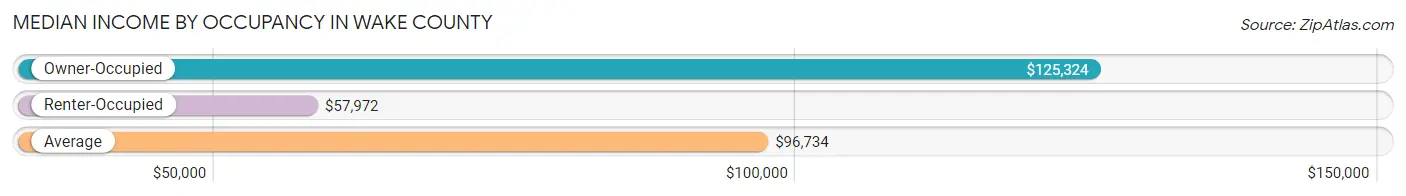
| Occupancy Type | # Households | Median Income |
| Owner-Occupied | 276,942 (64.3%) | $125,324 |
| Renter-Occupied | 153,555 (35.7%) | $57,972 |
| Average | 430,497 (100.0%) | $96,734 |
Occupancy by Householder Income Bracket in Wake County
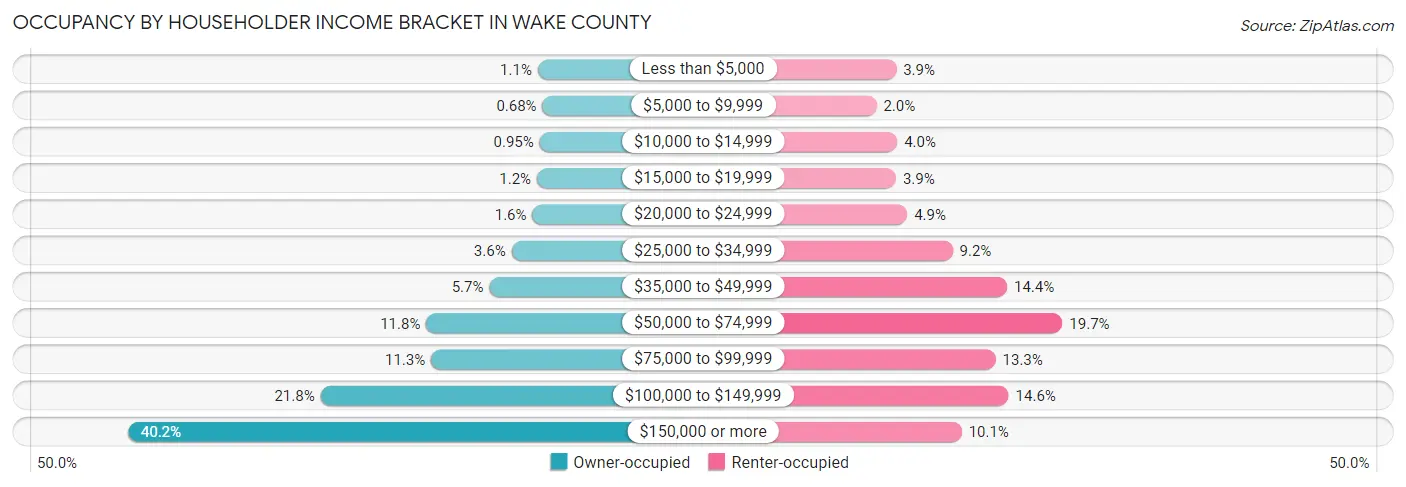
| Income Bracket | Owner-occupied | Renter-occupied |
| Less than $5,000 | 3,135 (1.1%) | 5,944 (3.9%) |
| $5,000 to $9,999 | 1,888 (0.7%) | 3,053 (2.0%) |
| $10,000 to $14,999 | 2,629 (0.9%) | 6,102 (4.0%) |
| $15,000 to $19,999 | 3,344 (1.2%) | 5,905 (3.8%) |
| $20,000 to $24,999 | 4,539 (1.6%) | 7,556 (4.9%) |
| $25,000 to $34,999 | 10,059 (3.6%) | 14,196 (9.2%) |
| $35,000 to $49,999 | 15,891 (5.7%) | 22,162 (14.4%) |
| $50,000 to $74,999 | 32,541 (11.7%) | 30,243 (19.7%) |
| $75,000 to $99,999 | 31,277 (11.3%) | 20,483 (13.3%) |
| $100,000 to $149,999 | 60,423 (21.8%) | 22,383 (14.6%) |
| $150,000 or more | 111,216 (40.2%) | 15,528 (10.1%) |
| Total | 276,942 (100.0%) | 153,555 (100.0%) |
Monthly Housing Cost Tiers in Wake County
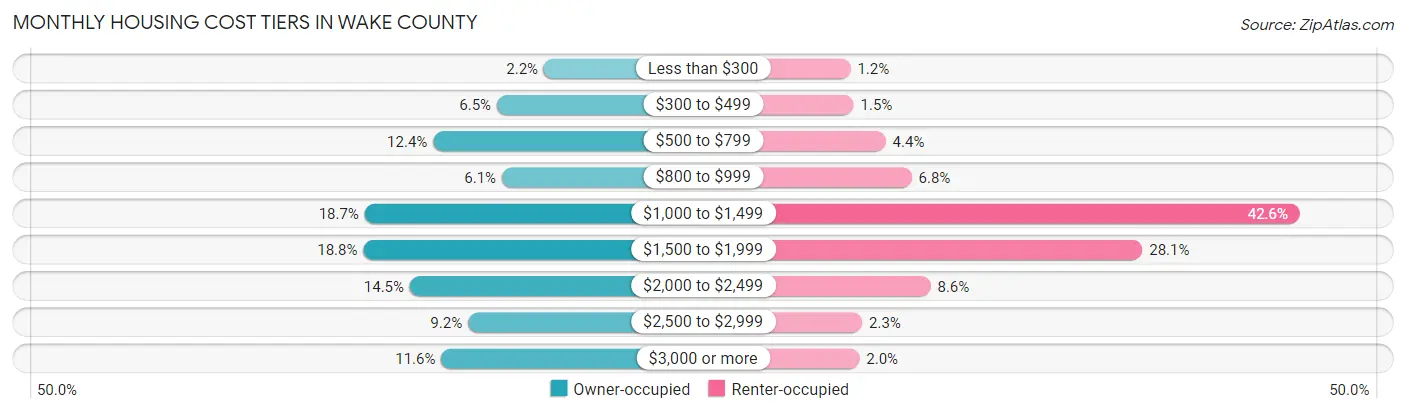
| Monthly Cost | Owner-occupied | Renter-occupied |
| Less than $300 | 6,060 (2.2%) | 1,846 (1.2%) |
| $300 to $499 | 18,048 (6.5%) | 2,288 (1.5%) |
| $500 to $799 | 34,303 (12.4%) | 6,821 (4.4%) |
| $800 to $999 | 16,773 (6.1%) | 10,488 (6.8%) |
| $1,000 to $1,499 | 51,747 (18.7%) | 65,351 (42.6%) |
| $1,500 to $1,999 | 52,130 (18.8%) | 43,101 (28.1%) |
| $2,000 to $2,499 | 40,228 (14.5%) | 13,162 (8.6%) |
| $2,500 to $2,999 | 25,416 (9.2%) | 3,491 (2.3%) |
| $3,000 or more | 32,237 (11.6%) | 3,102 (2.0%) |
| Total | 276,942 (100.0%) | 153,555 (100.0%) |
Physical Housing Characteristics in Wake County
Housing Structures in Wake County
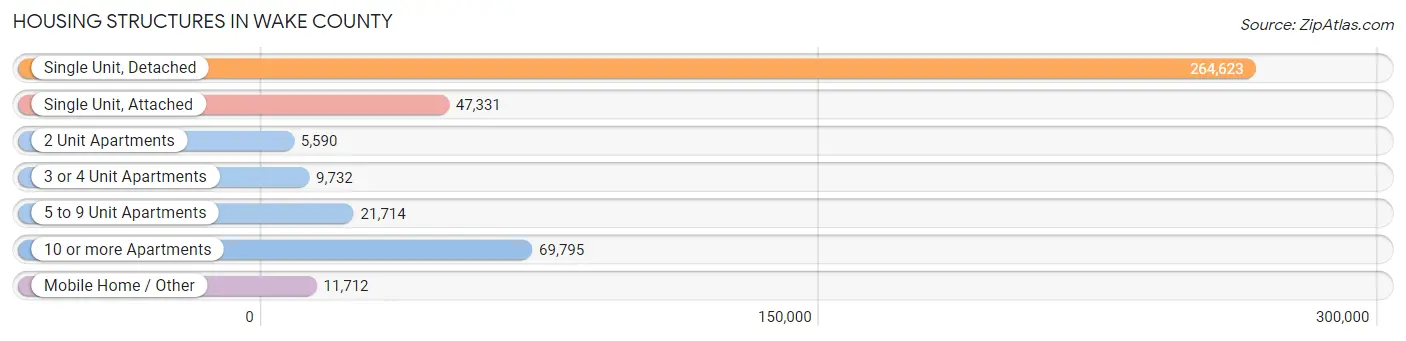
| Structure Type | # Housing Units | % Housing Units |
| Single Unit, Detached | 264,623 | 61.5% |
| Single Unit, Attached | 47,331 | 11.0% |
| 2 Unit Apartments | 5,590 | 1.3% |
| 3 or 4 Unit Apartments | 9,732 | 2.3% |
| 5 to 9 Unit Apartments | 21,714 | 5.0% |
| 10 or more Apartments | 69,795 | 16.2% |
| Mobile Home / Other | 11,712 | 2.7% |
| Total | 430,497 | 100.0% |
Housing Structures by Occupancy in Wake County
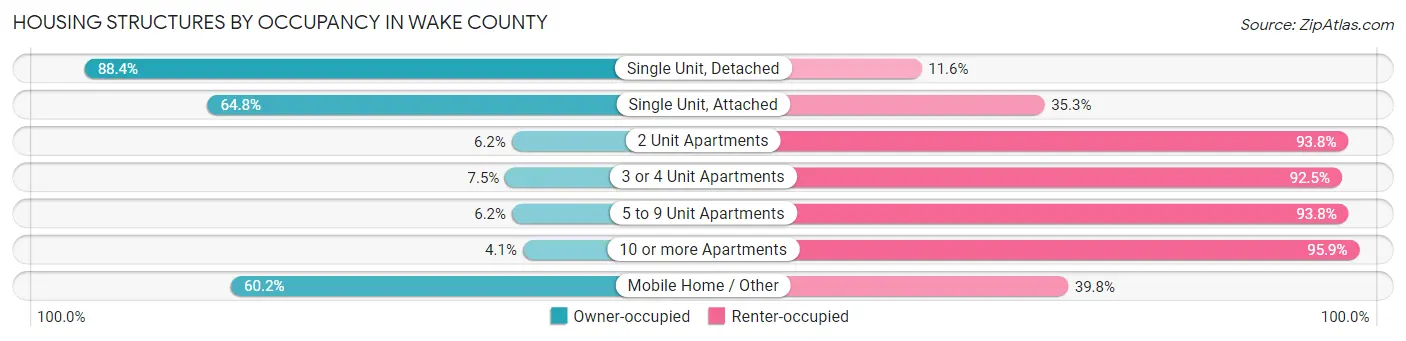
| Structure Type | Owner-occupied | Renter-occupied |
| Single Unit, Detached | 233,974 (88.4%) | 30,649 (11.6%) |
| Single Unit, Attached | 30,646 (64.7%) | 16,685 (35.2%) |
| 2 Unit Apartments | 348 (6.2%) | 5,242 (93.8%) |
| 3 or 4 Unit Apartments | 727 (7.5%) | 9,005 (92.5%) |
| 5 to 9 Unit Apartments | 1,341 (6.2%) | 20,373 (93.8%) |
| 10 or more Apartments | 2,853 (4.1%) | 66,942 (95.9%) |
| Mobile Home / Other | 7,053 (60.2%) | 4,659 (39.8%) |
| Total | 276,942 (64.3%) | 153,555 (35.7%) |
Housing Structures by Number of Rooms in Wake County
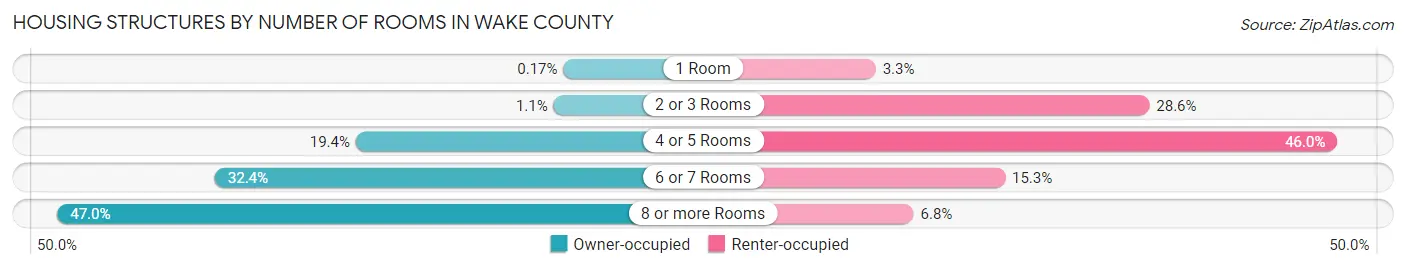
| Number of Rooms | Owner-occupied | Renter-occupied |
| 1 Room | 484 (0.2%) | 5,076 (3.3%) |
| 2 or 3 Rooms | 2,993 (1.1%) | 43,954 (28.6%) |
| 4 or 5 Rooms | 53,646 (19.4%) | 70,624 (46.0%) |
| 6 or 7 Rooms | 89,737 (32.4%) | 23,449 (15.3%) |
| 8 or more Rooms | 130,082 (47.0%) | 10,452 (6.8%) |
| Total | 276,942 (100.0%) | 153,555 (100.0%) |
Housing Structure by Heating Type in Wake County
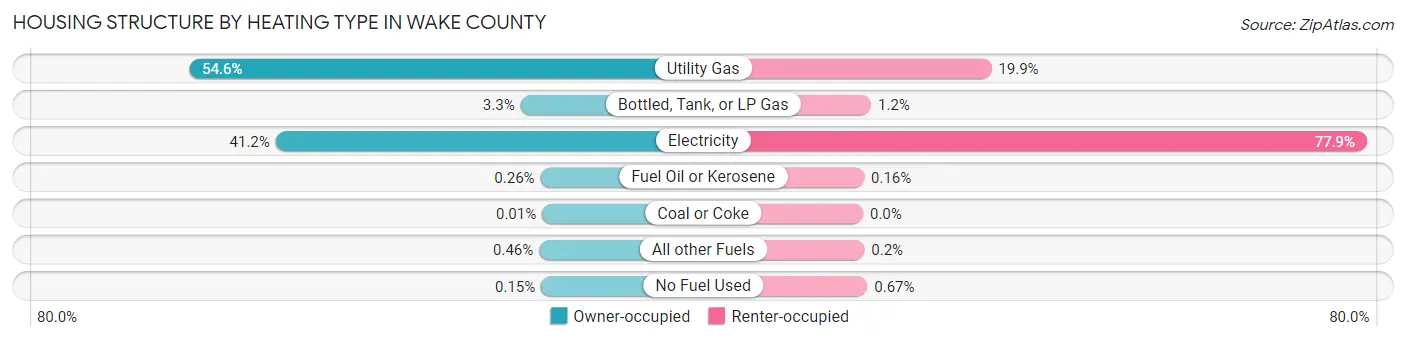
| Heating Type | Owner-occupied | Renter-occupied |
| Utility Gas | 151,144 (54.6%) | 30,476 (19.9%) |
| Bottled, Tank, or LP Gas | 9,256 (3.3%) | 1,906 (1.2%) |
| Electricity | 114,100 (41.2%) | 119,594 (77.9%) |
| Fuel Oil or Kerosene | 733 (0.3%) | 246 (0.2%) |
| Coal or Coke | 19 (0.0%) | 0 (0.0%) |
| All other Fuels | 1,280 (0.5%) | 303 (0.2%) |
| No Fuel Used | 410 (0.2%) | 1,030 (0.7%) |
| Total | 276,942 (100.0%) | 153,555 (100.0%) |
Household Vehicle Usage in Wake County
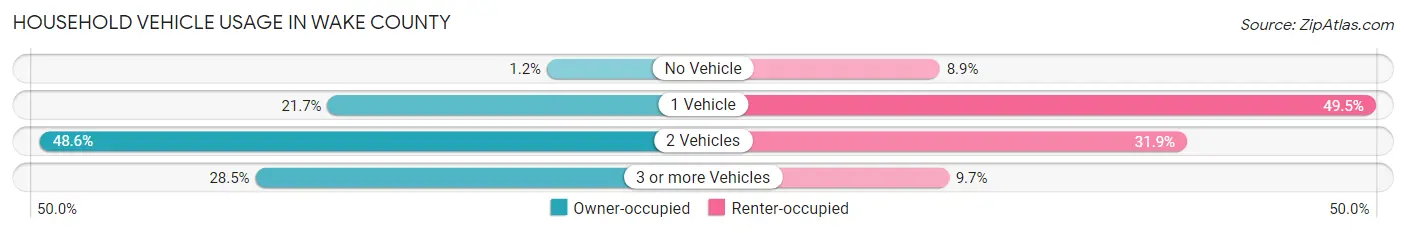
| Vehicles per Household | Owner-occupied | Renter-occupied |
| No Vehicle | 3,428 (1.2%) | 13,594 (8.8%) |
| 1 Vehicle | 60,173 (21.7%) | 76,066 (49.5%) |
| 2 Vehicles | 134,538 (48.6%) | 49,016 (31.9%) |
| 3 or more Vehicles | 78,803 (28.4%) | 14,879 (9.7%) |
| Total | 276,942 (100.0%) | 153,555 (100.0%) |
Real Estate & Mortgages in Wake County
Real Estate and Mortgage Overview in Wake County
| Characteristic | Without Mortgage | With Mortgage |
| Housing Units | 70,776 | 206,166 |
| Median Property Value | $370,200 | $390,800 |
| Median Household Income | $95,382 | $90,590 |
| Monthly Housing Costs | $614 | $32,097 |
| Real Estate Taxes | $2,864 | $1,841 |
Property Value by Mortgage Status in Wake County
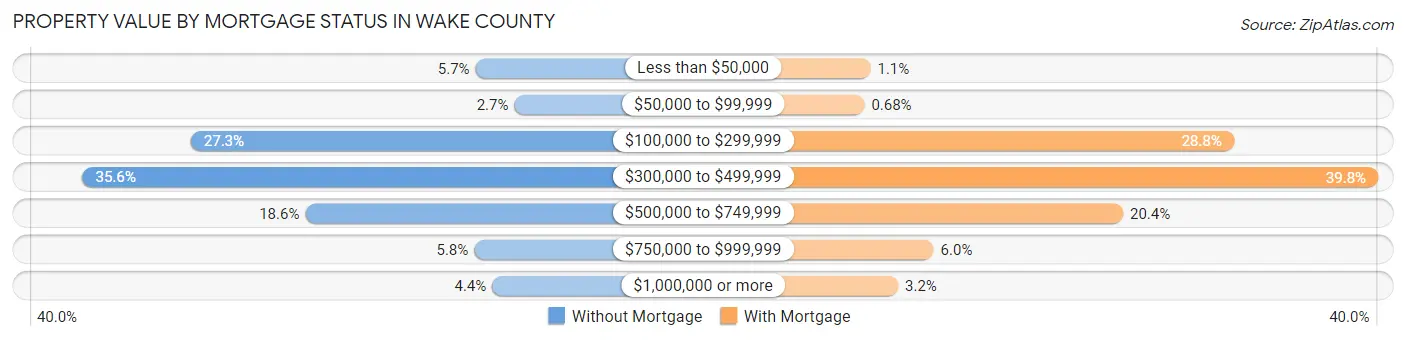
| Property Value | Without Mortgage | With Mortgage |
| Less than $50,000 | 4,001 (5.7%) | 2,356 (1.1%) |
| $50,000 to $99,999 | 1,904 (2.7%) | 1,411 (0.7%) |
| $100,000 to $299,999 | 19,342 (27.3%) | 59,389 (28.8%) |
| $300,000 to $499,999 | 25,181 (35.6%) | 82,045 (39.8%) |
| $500,000 to $749,999 | 13,178 (18.6%) | 42,017 (20.4%) |
| $750,000 to $999,999 | 4,073 (5.8%) | 12,261 (5.9%) |
| $1,000,000 or more | 3,097 (4.4%) | 6,687 (3.2%) |
| Total | 70,776 (100.0%) | 206,166 (100.0%) |
Household Income by Mortgage Status in Wake County
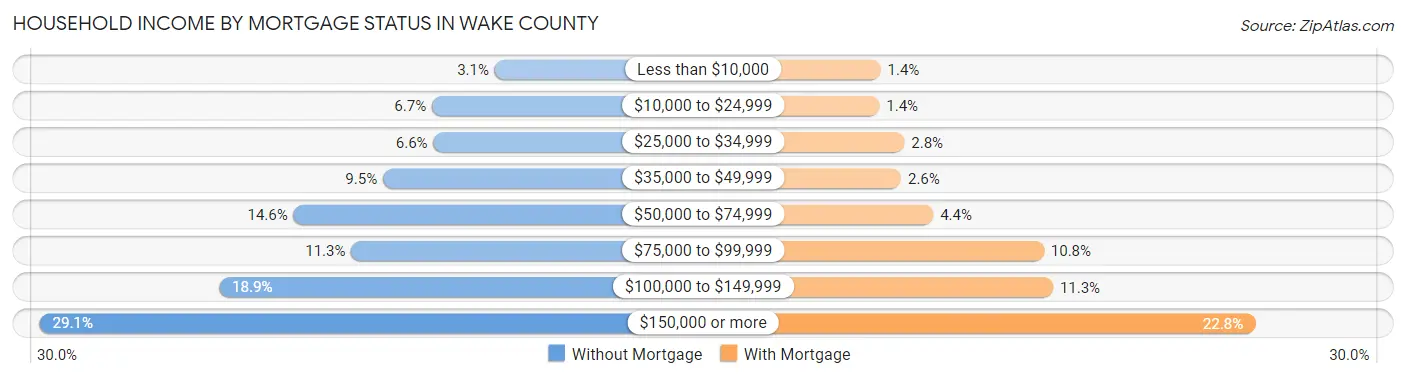
| Household Income | Without Mortgage | With Mortgage |
| Less than $10,000 | 2,213 (3.1%) | 2,950 (1.4%) |
| $10,000 to $24,999 | 4,759 (6.7%) | 2,810 (1.4%) |
| $25,000 to $34,999 | 4,698 (6.6%) | 5,753 (2.8%) |
| $35,000 to $49,999 | 6,739 (9.5%) | 5,361 (2.6%) |
| $50,000 to $74,999 | 10,356 (14.6%) | 9,152 (4.4%) |
| $75,000 to $99,999 | 8,022 (11.3%) | 22,185 (10.8%) |
| $100,000 to $149,999 | 13,363 (18.9%) | 23,255 (11.3%) |
| $150,000 or more | 20,626 (29.1%) | 47,060 (22.8%) |
| Total | 70,776 (100.0%) | 206,166 (100.0%) |
Property Value to Household Income Ratio in Wake County
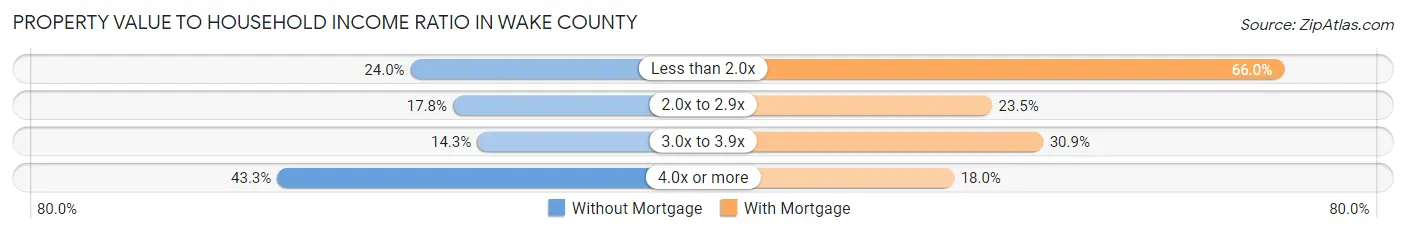
| Value-to-Income Ratio | Without Mortgage | With Mortgage |
| Less than 2.0x | 16,949 (23.9%) | 136,003 (66.0%) |
| 2.0x to 2.9x | 12,592 (17.8%) | 48,435 (23.5%) |
| 3.0x to 3.9x | 10,095 (14.3%) | 63,745 (30.9%) |
| 4.0x or more | 30,650 (43.3%) | 37,066 (18.0%) |
| Total | 70,776 (100.0%) | 206,166 (100.0%) |
Real Estate Taxes by Mortgage Status in Wake County

| Property Taxes | Without Mortgage | With Mortgage |
| Less than $800 | 5,827 (8.2%) | 654 (0.3%) |
| $800 to $1,499 | 8,086 (11.4%) | 6,452 (3.1%) |
| $800 to $1,499 | 55,404 (78.3%) | 23,603 (11.5%) |
| Total | 70,776 (100.0%) | 206,166 (100.0%) |
Health & Disability in Wake County
Health Insurance Coverage by Age in Wake County
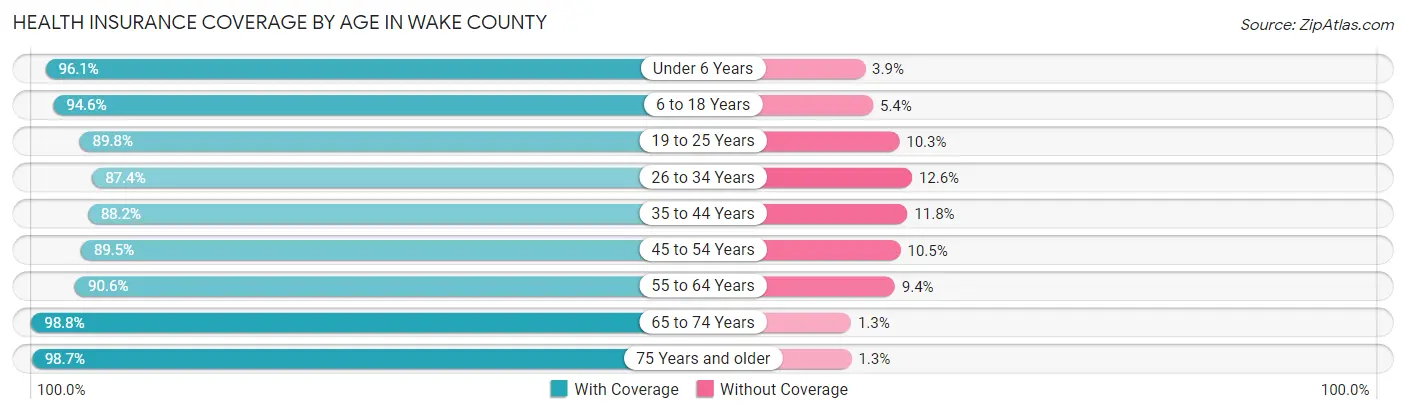
| Age Bracket | With Coverage | Without Coverage |
| Under 6 Years | 78,744 (96.1%) | 3,190 (3.9%) |
| 6 to 18 Years | 189,457 (94.6%) | 10,724 (5.4%) |
| 19 to 25 Years | 89,827 (89.7%) | 10,264 (10.2%) |
| 26 to 34 Years | 128,958 (87.4%) | 18,628 (12.6%) |
| 35 to 44 Years | 148,591 (88.2%) | 19,828 (11.8%) |
| 45 to 54 Years | 142,528 (89.5%) | 16,699 (10.5%) |
| 55 to 64 Years | 117,944 (90.6%) | 12,285 (9.4%) |
| 65 to 74 Years | 84,268 (98.8%) | 1,067 (1.3%) |
| 75 Years and older | 50,376 (98.7%) | 678 (1.3%) |
| Total | 1,030,693 (91.7%) | 93,363 (8.3%) |
Health Insurance Coverage by Citizenship Status in Wake County

| Citizenship Status | With Coverage | Without Coverage |
| Native Born | 78,744 (96.1%) | 3,190 (3.9%) |
| Foreign Born, Citizen | 189,457 (94.6%) | 10,724 (5.4%) |
| Foreign Born, not a Citizen | 89,827 (89.7%) | 10,264 (10.2%) |
Health Insurance Coverage by Household Income in Wake County
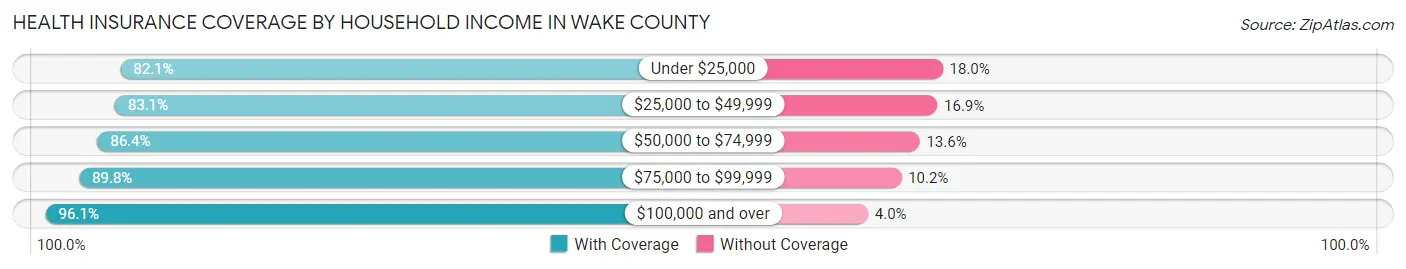
| Household Income | With Coverage | Without Coverage |
| Under $25,000 | 64,181 (82.1%) | 14,039 (17.9%) |
| $25,000 to $49,999 | 106,721 (83.1%) | 21,727 (16.9%) |
| $50,000 to $74,999 | 119,503 (86.4%) | 18,847 (13.6%) |
| $75,000 to $99,999 | 117,465 (89.8%) | 13,326 (10.2%) |
| $100,000 and over | 609,123 (96.1%) | 25,074 (4.0%) |
Public vs Private Health Insurance Coverage by Age in Wake County
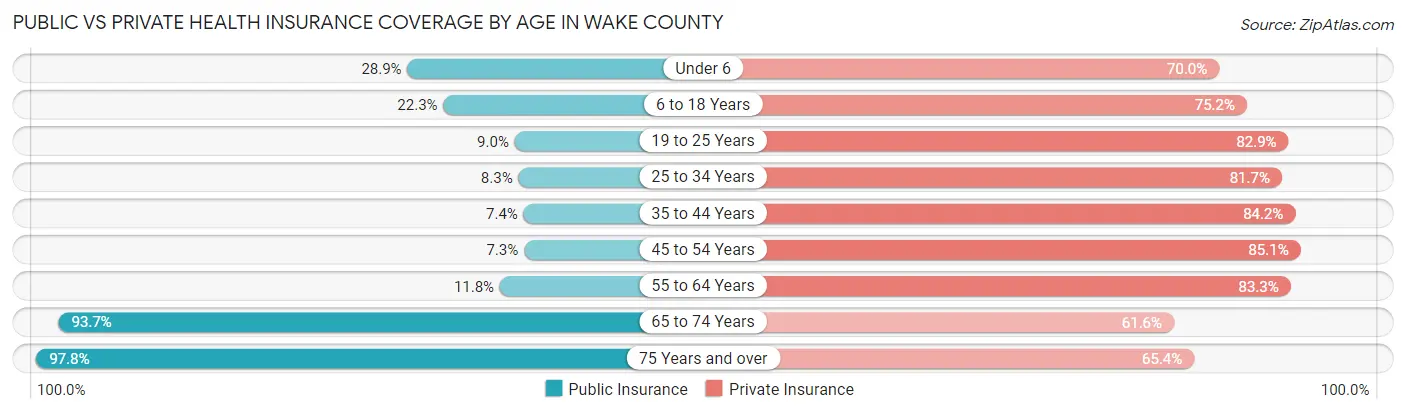
| Age Bracket | Public Insurance | Private Insurance |
| Under 6 | 23,710 (28.9%) | 57,379 (70.0%) |
| 6 to 18 Years | 44,551 (22.3%) | 150,486 (75.2%) |
| 19 to 25 Years | 9,027 (9.0%) | 82,975 (82.9%) |
| 25 to 34 Years | 12,297 (8.3%) | 120,504 (81.7%) |
| 35 to 44 Years | 12,393 (7.4%) | 141,728 (84.2%) |
| 45 to 54 Years | 11,616 (7.3%) | 135,547 (85.1%) |
| 55 to 64 Years | 15,333 (11.8%) | 108,484 (83.3%) |
| 65 to 74 Years | 79,965 (93.7%) | 52,592 (61.6%) |
| 75 Years and over | 49,948 (97.8%) | 33,382 (65.4%) |
| Total | 258,840 (23.0%) | 883,077 (78.6%) |
Disability Status by Sex by Age in Wake County
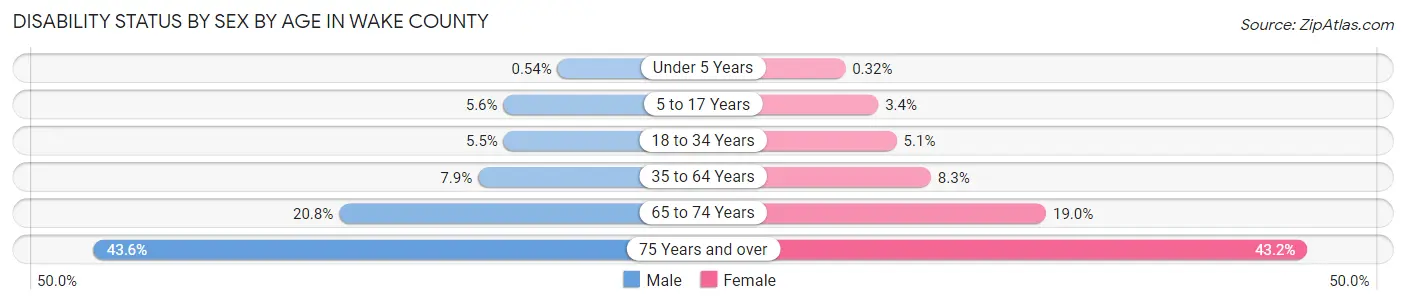
| Age Bracket | Male | Female |
| Under 5 Years | 182 (0.5%) | 103 (0.3%) |
| 5 to 17 Years | 5,621 (5.6%) | 3,286 (3.4%) |
| 18 to 34 Years | 7,257 (5.5%) | 6,841 (5.1%) |
| 35 to 64 Years | 17,849 (7.9%) | 19,232 (8.3%) |
| 65 to 74 Years | 8,028 (20.8%) | 8,870 (19.0%) |
| 75 Years and over | 9,157 (43.6%) | 12,973 (43.2%) |
Disability Class by Sex by Age in Wake County
Disability Class: Hearing Difficulty
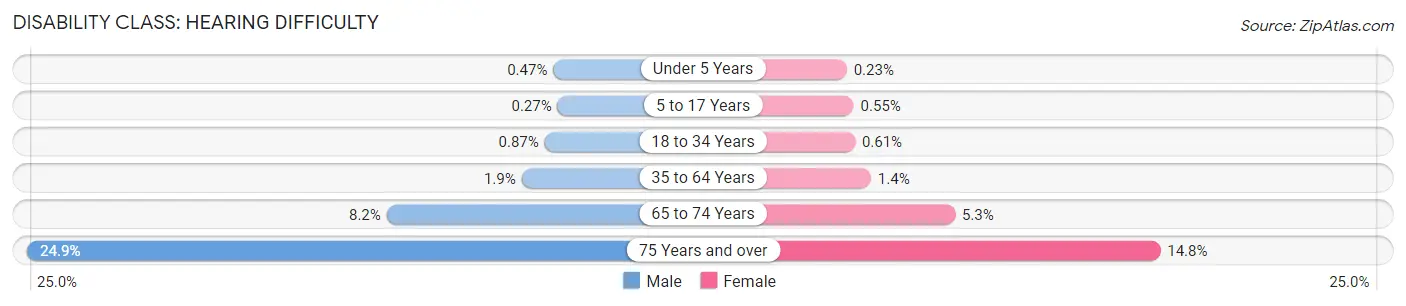
| Age Bracket | Male | Female |
| Under 5 Years | 159 (0.5%) | 73 (0.2%) |
| 5 to 17 Years | 272 (0.3%) | 534 (0.5%) |
| 18 to 34 Years | 1,138 (0.9%) | 818 (0.6%) |
| 35 to 64 Years | 4,370 (1.9%) | 3,142 (1.3%) |
| 65 to 74 Years | 3,161 (8.2%) | 2,458 (5.2%) |
| 75 Years and over | 5,230 (24.9%) | 4,439 (14.8%) |
Disability Class: Vision Difficulty
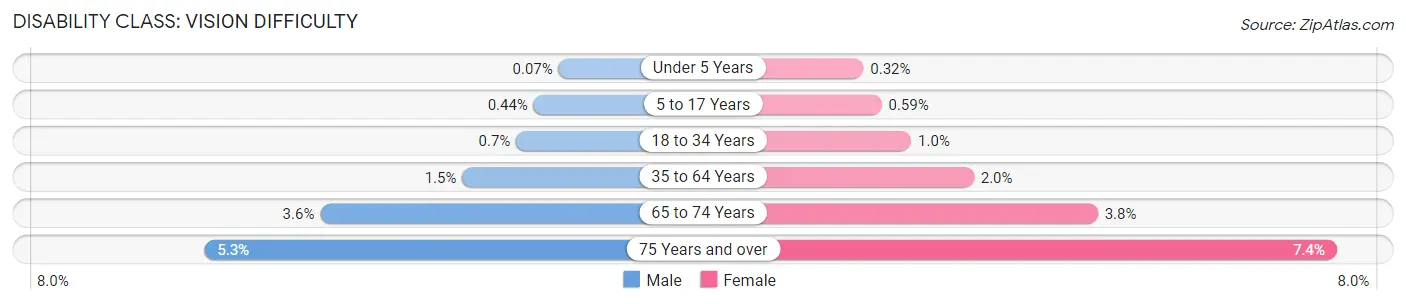
| Age Bracket | Male | Female |
| Under 5 Years | 23 (0.1%) | 103 (0.3%) |
| 5 to 17 Years | 448 (0.4%) | 569 (0.6%) |
| 18 to 34 Years | 915 (0.7%) | 1,380 (1.0%) |
| 35 to 64 Years | 3,371 (1.5%) | 4,545 (2.0%) |
| 65 to 74 Years | 1,391 (3.6%) | 1,777 (3.8%) |
| 75 Years and over | 1,121 (5.3%) | 2,209 (7.3%) |
Disability Class: Cognitive Difficulty
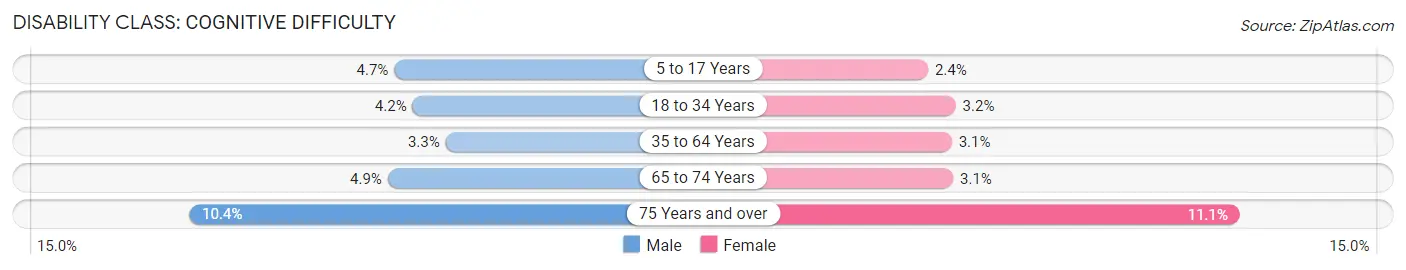
| Age Bracket | Male | Female |
| 5 to 17 Years | 4,752 (4.7%) | 2,330 (2.4%) |
| 18 to 34 Years | 5,507 (4.2%) | 4,265 (3.2%) |
| 35 to 64 Years | 7,395 (3.3%) | 7,102 (3.1%) |
| 65 to 74 Years | 1,887 (4.9%) | 1,448 (3.1%) |
| 75 Years and over | 2,191 (10.4%) | 3,329 (11.1%) |
Disability Class: Ambulatory Difficulty
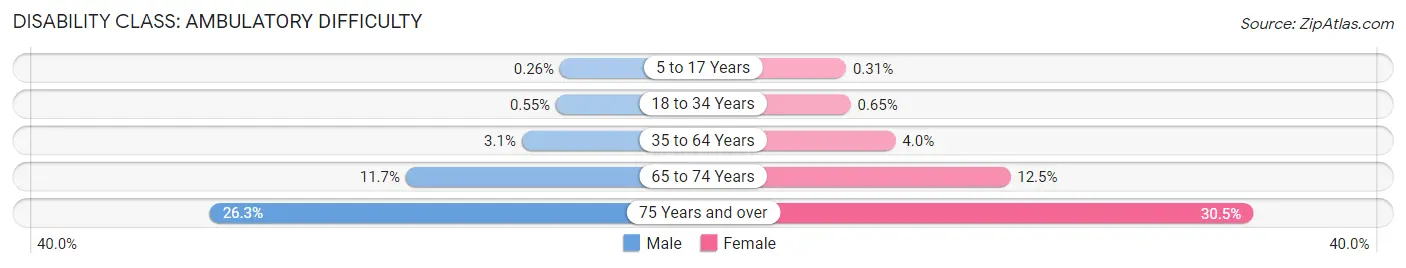
| Age Bracket | Male | Female |
| 5 to 17 Years | 265 (0.3%) | 298 (0.3%) |
| 18 to 34 Years | 723 (0.5%) | 873 (0.6%) |
| 35 to 64 Years | 6,971 (3.1%) | 9,263 (4.0%) |
| 65 to 74 Years | 4,510 (11.7%) | 5,853 (12.5%) |
| 75 Years and over | 5,518 (26.3%) | 9,169 (30.5%) |
Disability Class: Self-Care Difficulty
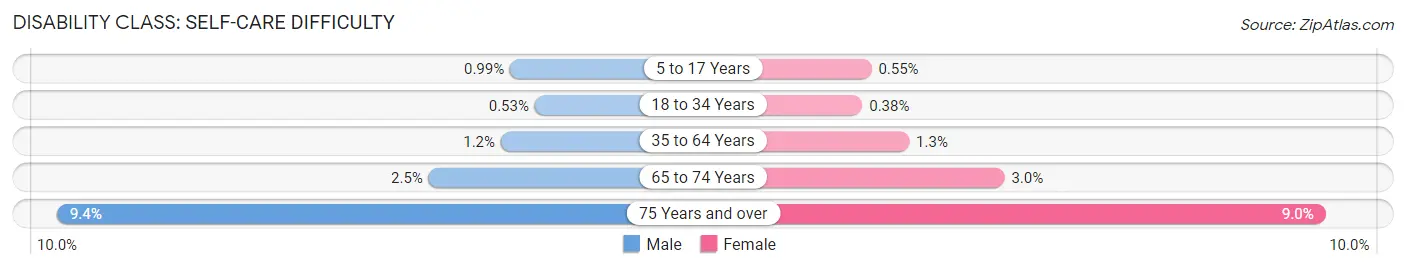
| Age Bracket | Male | Female |
| 5 to 17 Years | 997 (1.0%) | 537 (0.5%) |
| 18 to 34 Years | 694 (0.5%) | 515 (0.4%) |
| 35 to 64 Years | 2,615 (1.2%) | 2,912 (1.3%) |
| 65 to 74 Years | 963 (2.5%) | 1,414 (3.0%) |
| 75 Years and over | 1,975 (9.4%) | 2,696 (9.0%) |
Technology Access in Wake County
Computing Device Access in Wake County
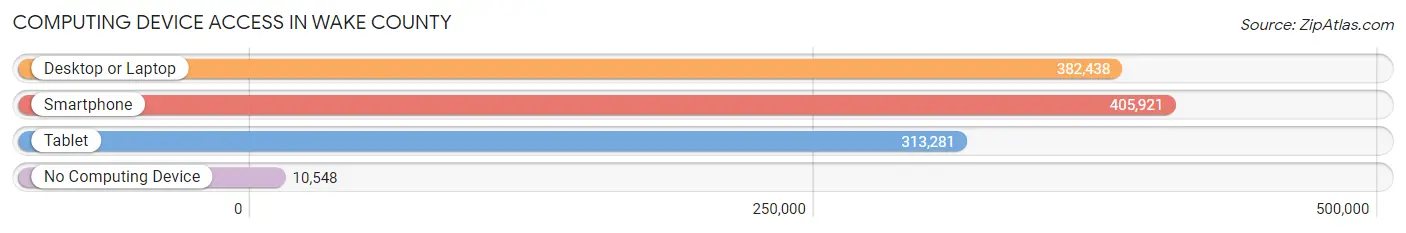
| Device Type | # Households | % Households |
| Desktop or Laptop | 382,438 | 88.8% |
| Smartphone | 405,921 | 94.3% |
| Tablet | 313,281 | 72.8% |
| No Computing Device | 10,548 | 2.5% |
| Total | 430,497 | 100.0% |
Internet Access in Wake County

| Internet Type | # Households | % Households |
| Dial-Up Internet | 350 | 0.1% |
| Broadband Home | 365,384 | 84.9% |
| Cellular Data Only | 29,690 | 6.9% |
| Satellite Internet | 27,177 | 6.3% |
| No Internet | 24,816 | 5.8% |
| Total | 430,497 | 100.0% |
Wake County Summary
Wake County, North Carolina is located in the central part of the state and is part of the Research Triangle region. It is the second most populous county in the state, with an estimated population of 1,072,567 in 2019. The county seat is Raleigh, the state capital. Wake County is home to a diverse population, with a mix of urban and rural areas, and is known for its strong economy, excellent schools, and vibrant culture.
Geography
Wake County is located in the Piedmont region of North Carolina, and is bordered by Chatham, Durham, Franklin, Granville, Harnett, Johnston, and Vance counties. The county covers an area of 857 square miles, with a population density of 1,250 people per square mile. The county is divided into two distinct regions: the urbanized area of Raleigh and the rural areas of the county. The county is home to several major rivers, including the Neuse, Tar, and Cape Fear.
The terrain of Wake County is mostly flat, with some rolling hills in the northern and western parts of the county. The county is home to several state parks, including Falls Lake State Recreation Area, William B. Umstead State Park, and Jordan Lake State Recreation Area.
Economy
Wake County has a strong and diverse economy, with a mix of industries including technology, finance, healthcare, education, and government. The county is home to several major employers, including WakeMed Health & Hospitals, SAS Institute, and Red Hat. The county is also home to several universities, including North Carolina State University, Duke University, and the University of North Carolina at Chapel Hill.
The county has a strong tourism industry, with attractions such as the North Carolina Museum of Art, the North Carolina Museum of Natural Sciences, and the North Carolina Zoo. The county is also home to several major shopping centers, including Crabtree Valley Mall and Triangle Town Center.
Demographics
As of 2019, Wake County had an estimated population of 1,072,567, making it the second most populous county in the state. The population is diverse, with a mix of races and ethnicities. The largest racial group is White (63.3%), followed by Black or African American (20.2%), Hispanic or Latino (10.2%), Asian (4.3%), and other (2.0%).
The median household income in Wake County is $71,845, and the median home value is $269,400. The county has a poverty rate of 11.2%, and the unemployment rate is 3.7%.
Conclusion
Wake County, North Carolina is a vibrant and diverse county located in the central part of the state. It is home to a strong economy, excellent schools, and a vibrant culture. The county is divided into two distinct regions: the urbanized area of Raleigh and the rural areas of the county. The county is home to several major employers, universities, and attractions, and has a strong tourism industry. The population is diverse, with a mix of races and ethnicities, and the median household income is $71,845. Wake County is an excellent place to live, work, and visit.
Common Questions
What is the Total Population of Wake County?
Total Population of Wake County is 1,132,103.
What is the Total Male Population of Wake County?
Total Male Population of Wake County is 555,563.
What is the Total Female Population of Wake County?
Total Female Population of Wake County is 576,540.
What is the Ratio of Males per 100 Females in Wake County?
There are 96.36 Males per 100 Females in Wake County.
What is the Ratio of Females per 100 Males in Wake County?
There are 103.78 Females per 100 Males in Wake County.
What is the Median Population Age in Wake County?
Median Population Age in Wake County is 37.0 Years.
What is the Average Family Size in Wake County
Average Family Size in Wake County is 3.2 People.
What is the Average Household Size in Wake County
Average Household Size in Wake County is 2.6 People.
What is Per Capita Income in Wake County?
Per Capita income in Wake County is $50,188.
What is the Median Family Income in Wake County?
Median Family Income in Wake County is $121,682.
What is the Median Household income in Wake County?
Median Household Income in Wake County is $96,734.
What is Income or Wage Gap in Wake County?
Income or Wage Gap in Wake County is 26.7%.
Women in Wake County earn 73.3 cents for every dollar earned by a man.
What is Family Income Deficit in Wake County?
Family Income Deficit in Wake County is $10,955.
Families that are below poverty line in Wake County earn $10,955 less on average than the poverty threshold level.
What is Inequality or Gini Index in Wake County?
Inequality or Gini Index in Wake County is 0.45.
How Large is the Labor Force in Wake County?
There are 628,681 People in the Labor Forcein in Wake County.
What is the Percentage of People in the Labor Force in Wake County?
69.9% of People are in the Labor Force in Wake County.
What is the Unemployment Rate in Wake County?
Unemployment Rate in Wake County is 4.2%.