Vance County, NC
Vance County Overview
42,492
TOTAL POPULATION
19,917
MALE POPULATION
22,575
FEMALE POPULATION
88.23
MALES / 100 FEMALES
113.35
FEMALES / 100 MALES
40.7
MEDIAN AGE
3.3
AVG FAMILY SIZE
2.6
AVG HOUSEHOLD SIZE
$26,771
PER CAPITA INCOME
$58,310
AVG FAMILY INCOME
$48,340
AVG HOUSEHOLD INCOME
23.4%
WAGE / INCOME GAP [ % ]
76.6¢/ $1
WAGE / INCOME GAP [ $ ]
$11,843
FAMILY INCOME DEFICIT
0.46
INEQUALITY / GINI INDEX
19,523
LABOR FORCE [ PEOPLE ]
57.9%
PERCENT IN LABOR FORCE
7.0%
UNEMPLOYMENT RATE
Vance County Area Codes
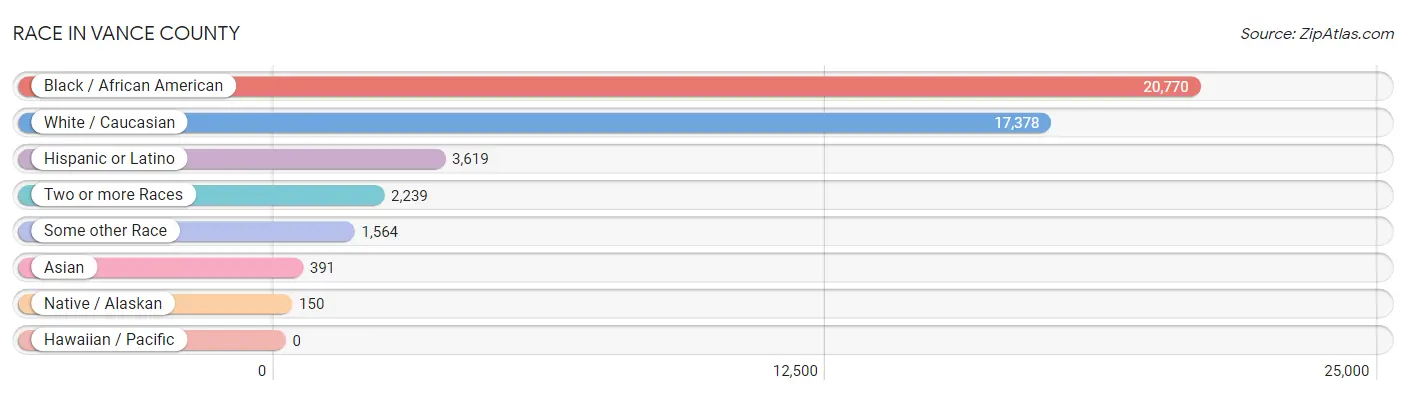
Race in Vance County
The most populous races in Vance County are Black / African American (20,770 | 48.9%), White / Caucasian (17,378 | 40.9%), and Hispanic or Latino (3,619 | 8.5%).
| Race | # Population | % Population |
| Asian | 391 | 0.9% |
| Black / African American | 20,770 | 48.9% |
| Hawaiian / Pacific | 0 | 0.0% |
| Hispanic or Latino | 3,619 | 8.5% |
| Native / Alaskan | 150 | 0.4% |
| White / Caucasian | 17,378 | 40.9% |
| Two or more Races | 2,239 | 5.3% |
| Some other Race | 1,564 | 3.7% |
| Total | 42,492 | 100.0% |
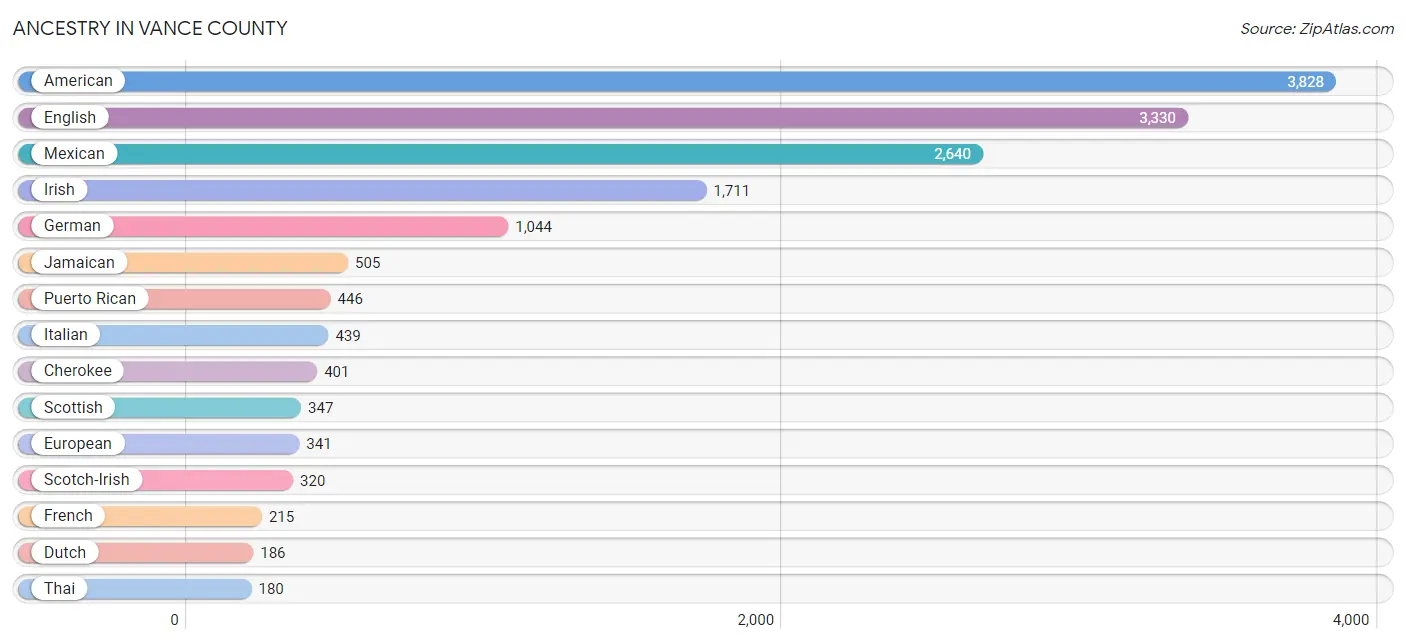
Ancestry in Vance County
The most populous ancestries reported in Vance County are American (3,828 | 9.0%), English (3,330 | 7.8%), Mexican (2,640 | 6.2%), Irish (1,711 | 4.0%), and German (1,044 | 2.5%), together accounting for 29.5% of all Vance County residents.
| Ancestry | # Population | % Population |
| African | 113 | 0.3% |
| American | 3,828 | 9.0% |
| Arab | 41 | 0.1% |
| Austrian | 30 | 0.1% |
| Blackfeet | 60 | 0.1% |
| British | 74 | 0.2% |
| Burmese | 18 | 0.0% |
| Canadian | 27 | 0.1% |
| Central American | 144 | 0.3% |
| Central American Indian | 118 | 0.3% |
| Cherokee | 401 | 0.9% |
| Chilean | 18 | 0.0% |
| Colombian | 94 | 0.2% |
| Cuban | 68 | 0.2% |
| Czechoslovakian | 14 | 0.0% |
| Dominican | 100 | 0.2% |
| Dutch | 186 | 0.4% |
| Dutch West Indian | 33 | 0.1% |
| Eastern European | 50 | 0.1% |
| Ecuadorian | 63 | 0.2% |
| Egyptian | 35 | 0.1% |
| English | 3,330 | 7.8% |
| European | 341 | 0.8% |
| Finnish | 19 | 0.0% |
| French | 215 | 0.5% |
| French Canadian | 87 | 0.2% |
| German | 1,044 | 2.5% |
| Greek | 63 | 0.2% |
| Guatemalan | 129 | 0.3% |
| Haitian | 42 | 0.1% |
| Indian (Asian) | 31 | 0.1% |
| Irish | 1,711 | 4.0% |
| Israeli | 29 | 0.1% |
| Italian | 439 | 1.0% |
| Jamaican | 505 | 1.2% |
| Korean | 132 | 0.3% |
| Lumbee | 27 | 0.1% |
| Mexican | 2,640 | 6.2% |
| Northern European | 9 | 0.0% |
| Norwegian | 47 | 0.1% |
| Panamanian | 15 | 0.0% |
| Polish | 115 | 0.3% |
| Portuguese | 19 | 0.0% |
| Potawatomi | 44 | 0.1% |
| Puerto Rican | 446 | 1.1% |
| Russian | 28 | 0.1% |
| Scandinavian | 6 | 0.0% |
| Scotch-Irish | 320 | 0.7% |
| Scottish | 347 | 0.8% |
| Sioux | 76 | 0.2% |
| Slovak | 15 | 0.0% |
| South American | 175 | 0.4% |
| Spanish | 10 | 0.0% |
| Subsaharan African | 113 | 0.3% |
| Swedish | 113 | 0.3% |
| Swiss | 18 | 0.0% |
| Thai | 180 | 0.4% |
| Turkish | 67 | 0.2% |
| Ukrainian | 6 | 0.0% |
| Welsh | 56 | 0.1% | View All 60 Rows |
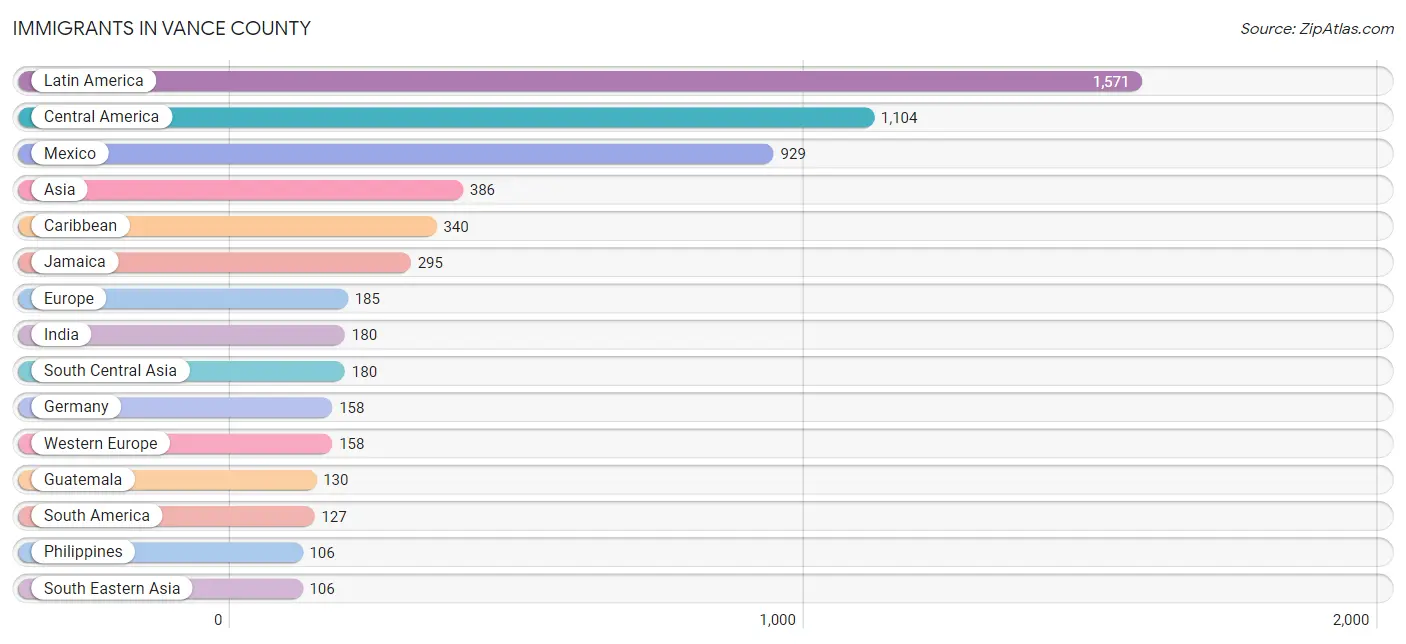
Immigrants in Vance County
The most numerous immigrant groups reported in Vance County came from Latin America (1,571 | 3.7%), Central America (1,104 | 2.6%), Mexico (929 | 2.2%), Asia (386 | 0.9%), and Caribbean (340 | 0.8%), together accounting for 10.2% of all Vance County residents.
| Immigration Origin | # Population | % Population |
| Africa | 59 | 0.1% |
| Argentina | 15 | 0.0% |
| Asia | 386 | 0.9% |
| Canada | 14 | 0.0% |
| Caribbean | 340 | 0.8% |
| Central America | 1,104 | 2.6% |
| Chile | 18 | 0.0% |
| China | 9 | 0.0% |
| Colombia | 94 | 0.2% |
| Cuba | 14 | 0.0% |
| Dominican Republic | 31 | 0.1% |
| Eastern Asia | 9 | 0.0% |
| Eastern Europe | 27 | 0.1% |
| Egypt | 59 | 0.1% |
| El Salvador | 30 | 0.1% |
| Europe | 185 | 0.4% |
| Germany | 158 | 0.4% |
| Guatemala | 130 | 0.3% |
| India | 180 | 0.4% |
| Jamaica | 295 | 0.7% |
| Latin America | 1,571 | 3.7% |
| Mexico | 929 | 2.2% |
| Northern Africa | 59 | 0.1% |
| Panama | 15 | 0.0% |
| Philippines | 106 | 0.3% |
| Poland | 25 | 0.1% |
| Russia | 2 | 0.0% |
| South America | 127 | 0.3% |
| South Central Asia | 180 | 0.4% |
| South Eastern Asia | 106 | 0.3% |
| Turkey | 85 | 0.2% |
| Western Asia | 91 | 0.2% |
| Western Europe | 158 | 0.4% |
| Yemen | 6 | 0.0% | View All 34 Rows |
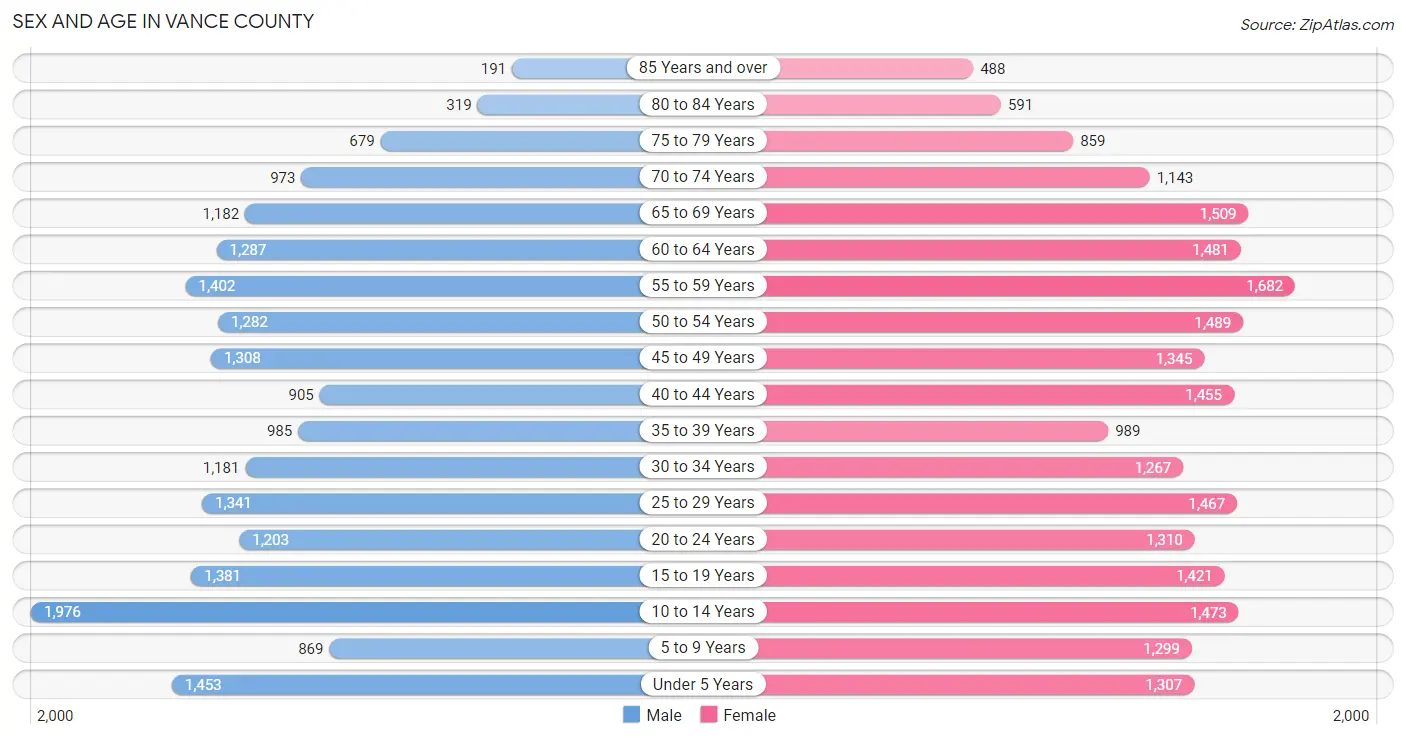
Sex and Age in Vance County
Sex and Age in Vance County
The most populous age groups in Vance County are 10 to 14 Years (1,976 | 9.9%) for men and 55 to 59 Years (1,682 | 7.4%) for women.
| Age Bracket | Male | Female |
| Under 5 Years | 1,453 (7.3%) | 1,307 (5.8%) |
| 5 to 9 Years | 869 (4.4%) | 1,299 (5.8%) |
| 10 to 14 Years | 1,976 (9.9%) | 1,473 (6.5%) |
| 15 to 19 Years | 1,381 (6.9%) | 1,421 (6.3%) |
| 20 to 24 Years | 1,203 (6.0%) | 1,310 (5.8%) |
| 25 to 29 Years | 1,341 (6.7%) | 1,467 (6.5%) |
| 30 to 34 Years | 1,181 (5.9%) | 1,267 (5.6%) |
| 35 to 39 Years | 985 (5.0%) | 989 (4.4%) |
| 40 to 44 Years | 905 (4.5%) | 1,455 (6.5%) |
| 45 to 49 Years | 1,308 (6.6%) | 1,345 (6.0%) |
| 50 to 54 Years | 1,282 (6.4%) | 1,489 (6.6%) |
| 55 to 59 Years | 1,402 (7.0%) | 1,682 (7.4%) |
| 60 to 64 Years | 1,287 (6.5%) | 1,481 (6.6%) |
| 65 to 69 Years | 1,182 (5.9%) | 1,509 (6.7%) |
| 70 to 74 Years | 973 (4.9%) | 1,143 (5.1%) |
| 75 to 79 Years | 679 (3.4%) | 859 (3.8%) |
| 80 to 84 Years | 319 (1.6%) | 591 (2.6%) |
| 85 Years and over | 191 (1.0%) | 488 (2.2%) |
| Total | 19,917 (100.0%) | 22,575 (100.0%) |
Families and Households in Vance County
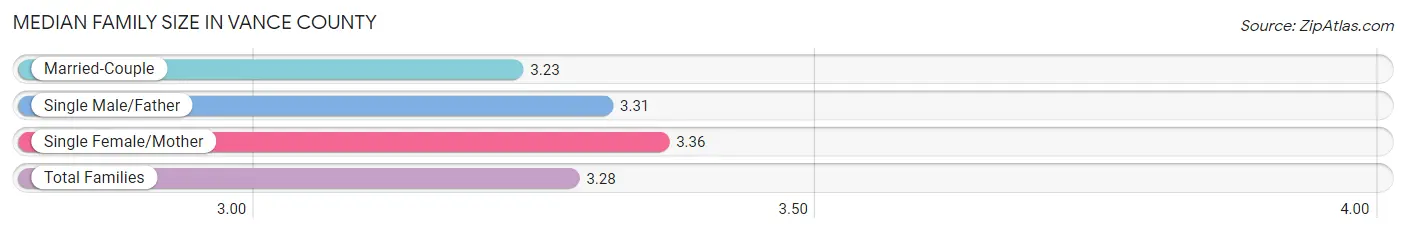
Median Family Size in Vance County
The median family size in Vance County is 3.28 persons per family, with single female/mother families (3,488 | 33.3%) accounting for the largest median family size of 3.36 persons per family. On the other hand, married-couple families (6,043 | 57.8%) represent the smallest median family size with 3.23 persons per family.
| Family Type | # Families | Family Size |
| Married-Couple | 6,043 (57.8%) | 3.23 |
| Single Male/Father | 932 (8.9%) | 3.31 |
| Single Female/Mother | 3,488 (33.3%) | 3.36 |
| Total Families | 10,463 (100.0%) | 3.28 |
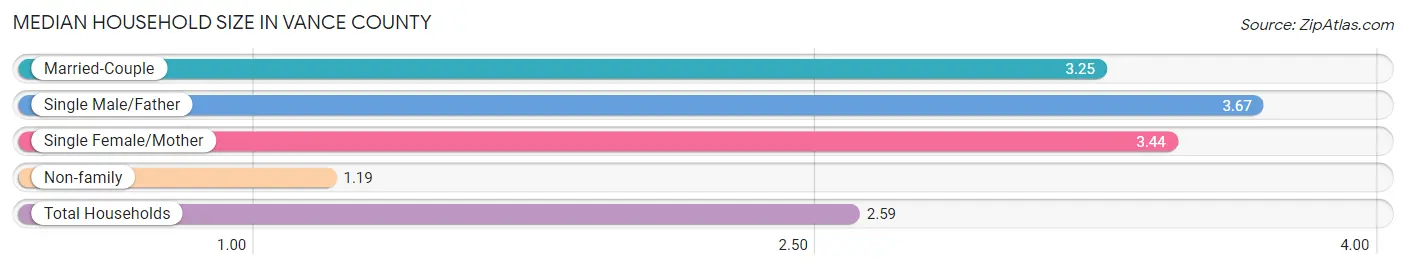
Median Household Size in Vance County
The median household size in Vance County is 2.59 persons per household, with single male/father households (932 | 5.8%) accounting for the largest median household size of 3.67 persons per household. non-family households (5,660 | 35.1%) represent the smallest median household size with 1.19 persons per household.
| Household Type | # Households | Household Size |
| Married-Couple | 6,043 (37.5%) | 3.25 |
| Single Male/Father | 932 (5.8%) | 3.67 |
| Single Female/Mother | 3,488 (21.6%) | 3.44 |
| Non-family | 5,660 (35.1%) | 1.19 |
| Total Households | 16,123 (100.0%) | 2.59 |
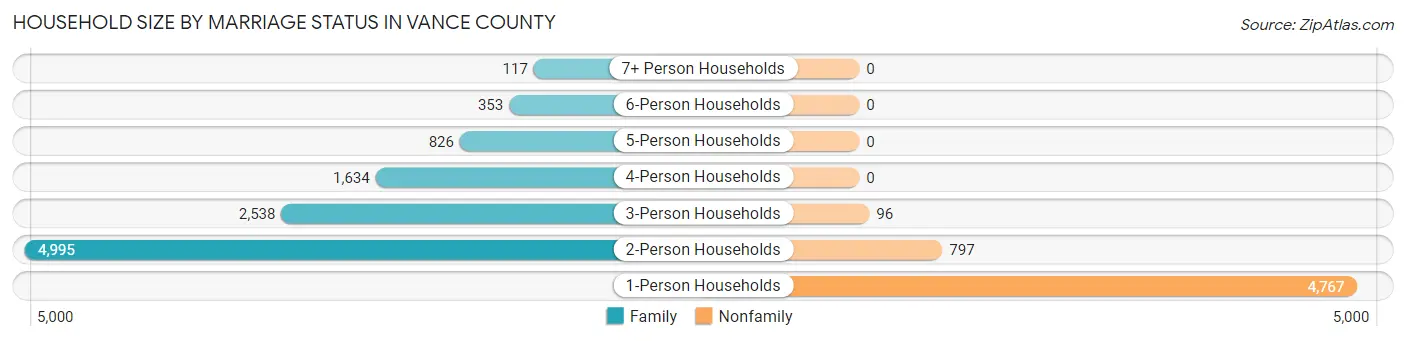
Household Size by Marriage Status in Vance County
Out of a total of 16,123 households in Vance County, 10,463 (64.9%) are family households, while 5,660 (35.1%) are nonfamily households. The most numerous type of family households are 2-person households, comprising 4,995, and the most common type of nonfamily households are 1-person households, comprising 4,767.
| Household Size | Family Households | Nonfamily Households |
| 1-Person Households | - | 4,767 (29.6%) |
| 2-Person Households | 4,995 (31.0%) | 797 (4.9%) |
| 3-Person Households | 2,538 (15.7%) | 96 (0.6%) |
| 4-Person Households | 1,634 (10.1%) | 0 (0.0%) |
| 5-Person Households | 826 (5.1%) | 0 (0.0%) |
| 6-Person Households | 353 (2.2%) | 0 (0.0%) |
| 7+ Person Households | 117 (0.7%) | 0 (0.0%) |
| Total | 10,463 (64.9%) | 5,660 (35.1%) |
Female Fertility in Vance County
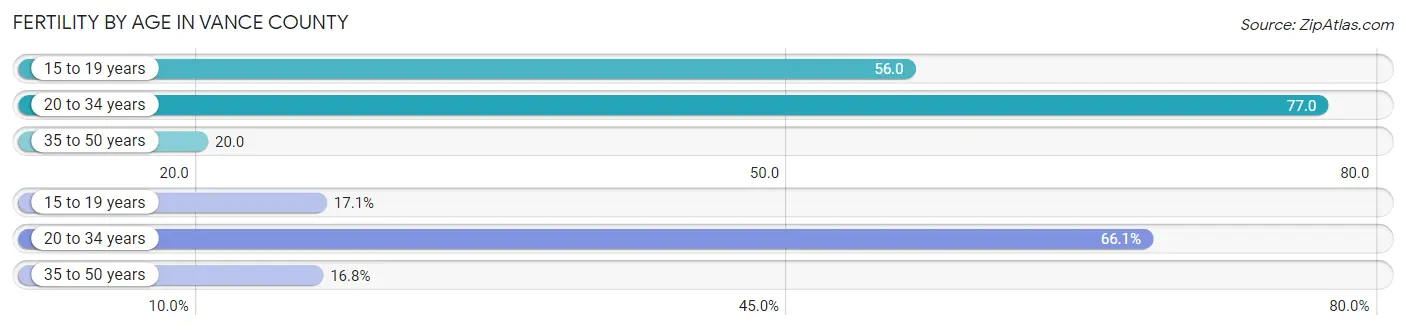
Fertility by Age in Vance County
Average fertility rate in Vance County is 49.0 births per 1,000 women. Women in the age bracket of 20 to 34 years have the highest fertility rate with 77.0 births per 1,000 women. Women in the age bracket of 20 to 34 years acount for 66.1% of all women with births.
| Age Bracket | Women with Births | Births / 1,000 Women |
| 15 to 19 years | 80 (17.1%) | 56.0 |
| 20 to 34 years | 310 (66.1%) | 77.0 |
| 35 to 50 years | 79 (16.8%) | 20.0 |
| Total | 469 (100.0%) | 49.0 |
Fertility by Age by Marriage Status in Vance County
16.0% of women with births (469) in Vance County are married. The highest percentage of unmarried women with births falls into 15 to 19 years age bracket with 100.0% of them unmarried at the time of birth, while the lowest percentage of unmarried women with births belong to 35 to 50 years age bracket with 72.2% of them unmarried.
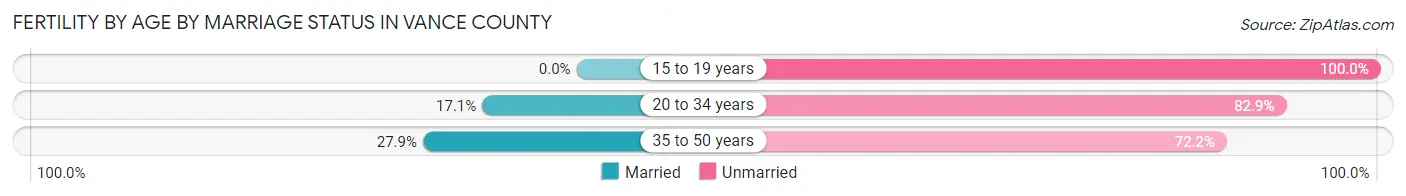
| Age Bracket | Married | Unmarried |
| 15 to 19 years | 0 (0.0%) | 80 (100.0%) |
| 20 to 34 years | 53 (17.1%) | 257 (82.9%) |
| 35 to 50 years | 22 (27.9%) | 57 (72.2%) |
| Total | 75 (16.0%) | 394 (84.0%) |
Fertility by Education in Vance County
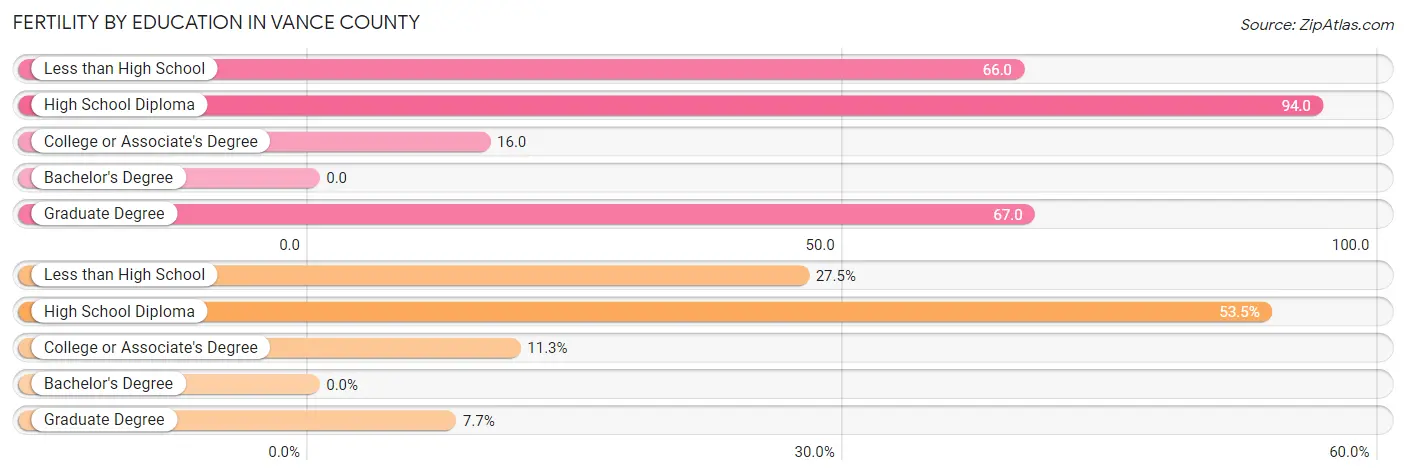
| Educational Attainment | Women with Births | Births / 1,000 Women |
| Less than High School | 129 (27.5%) | 66.0 |
| High School Diploma | 251 (53.5%) | 94.0 |
| College or Associate's Degree | 53 (11.3%) | 16.0 |
| Bachelor's Degree | 0 (0.0%) | 0.0 |
| Graduate Degree | 36 (7.7%) | 67.0 |
| Total | 469 (100.0%) | 49.0 |
Fertility by Education by Marriage Status in Vance County
84.0% of women with births in Vance County are unmarried. Women with the educational attainment of college or associate's degree are most likely to be married with 41.5% of them married at childbirth, while women with the educational attainment of less than high school are least likely to be married with 100.0% of them unmarried at childbirth.
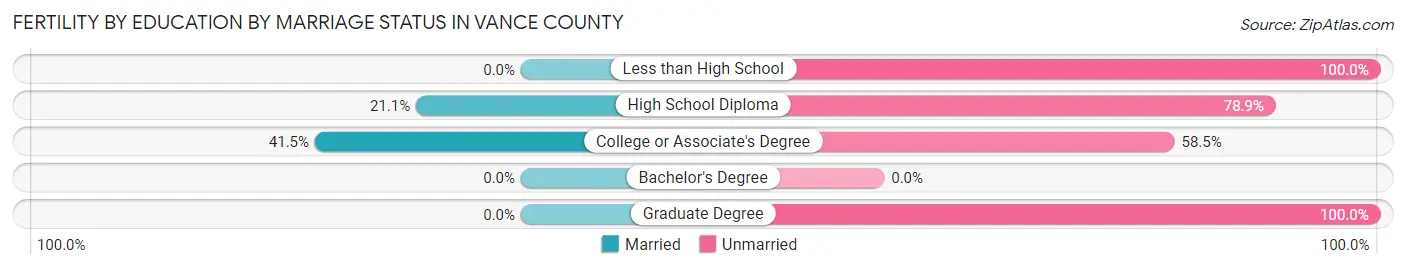
| Educational Attainment | Married | Unmarried |
| Less than High School | 0 (0.0%) | 129 (100.0%) |
| High School Diploma | 53 (21.1%) | 198 (78.9%) |
| College or Associate's Degree | 22 (41.5%) | 31 (58.5%) |
| Bachelor's Degree | 0 (0.0%) | 0 (0.0%) |
| Graduate Degree | 0 (0.0%) | 36 (100.0%) |
| Total | 75 (16.0%) | 394 (84.0%) |
Income in Vance County
Income Overview in Vance County
Per Capita Income in Vance County is $26,771, while median incomes of families and households are $58,310 and $48,340 respectively.
| Characteristic | Number | Measure |
| Per Capita Income | 42,492 | $26,771 |
| Median Family Income | 10,463 | $58,310 |
| Mean Family Income | 10,463 | $76,704 |
| Median Household Income | 16,123 | $48,340 |
| Mean Household Income | 16,123 | $65,186 |
| Income Deficit | 10,463 | $11,843 |
| Wage / Income Gap (%) | 42,492 | 23.39% |
| Wage / Income Gap ($) | 42,492 | 76.61¢ per $1 |
| Gini / Inequality Index | 42,492 | 0.46 |
Earnings by Sex in Vance County
Average Earnings in Vance County are $30,567, $34,585 for men and $26,495 for women, a difference of 23.4%.
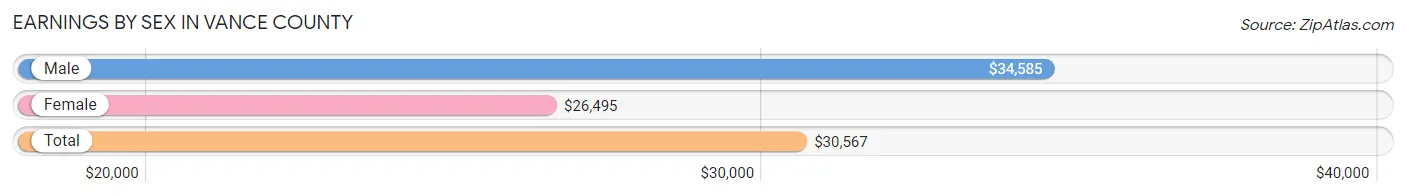
| Sex | Number | Average Earnings |
| Male | 9,450 (46.9%) | $34,585 |
| Female | 10,717 (53.1%) | $26,495 |
| Total | 20,167 (100.0%) | $30,567 |
Earnings by Sex by Income Bracket in Vance County
The most common earnings brackets in Vance County are $100,000+ for men (893 | 9.5%) and $25,000 to $29,999 for women (878 | 8.2%).

| Income | Male | Female |
| $2,499 or less | 422 (4.5%) | 682 (6.4%) |
| $2,500 to $4,999 | 292 (3.1%) | 463 (4.3%) |
| $5,000 to $7,499 | 520 (5.5%) | 641 (6.0%) |
| $7,500 to $9,999 | 286 (3.0%) | 558 (5.2%) |
| $10,000 to $12,499 | 477 (5.1%) | 543 (5.1%) |
| $12,500 to $14,999 | 163 (1.7%) | 449 (4.2%) |
| $15,000 to $17,499 | 251 (2.7%) | 488 (4.5%) |
| $17,500 to $19,999 | 260 (2.8%) | 329 (3.1%) |
| $20,000 to $22,499 | 286 (3.0%) | 435 (4.1%) |
| $22,500 to $24,999 | 279 (2.9%) | 471 (4.4%) |
| $25,000 to $29,999 | 726 (7.7%) | 878 (8.2%) |
| $30,000 to $34,999 | 803 (8.5%) | 740 (6.9%) |
| $35,000 to $39,999 | 610 (6.5%) | 581 (5.4%) |
| $40,000 to $44,999 | 715 (7.6%) | 599 (5.6%) |
| $45,000 to $49,999 | 309 (3.3%) | 599 (5.6%) |
| $50,000 to $54,999 | 396 (4.2%) | 606 (5.7%) |
| $55,000 to $64,999 | 638 (6.8%) | 563 (5.2%) |
| $65,000 to $74,999 | 575 (6.1%) | 506 (4.7%) |
| $75,000 to $99,999 | 549 (5.8%) | 454 (4.2%) |
| $100,000+ | 893 (9.5%) | 132 (1.2%) |
| Total | 9,450 (100.0%) | 10,717 (100.0%) |
Earnings by Sex by Educational Attainment in Vance County
Average earnings in Vance County are $38,489 for men and $29,824 for women, a difference of 22.5%. Men with an educational attainment of bachelor's degree enjoy the highest average annual earnings of $57,354, while those with less than high school education earn the least with $28,635. Women with an educational attainment of graduate degree earn the most with the average annual earnings of $59,271, while those with less than high school education have the smallest earnings of $8,134.
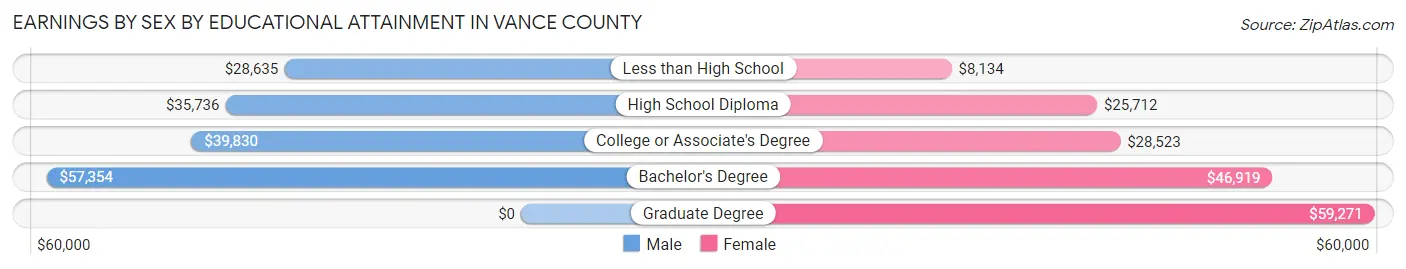
| Educational Attainment | Male Income | Female Income |
| Less than High School | $28,635 | $8,134 |
| High School Diploma | $35,736 | $25,712 |
| College or Associate's Degree | $39,830 | $28,523 |
| Bachelor's Degree | $57,354 | $46,919 |
| Graduate Degree | - | - |
| Total | $38,489 | $29,824 |
Family Income in Vance County
Family Income Brackets in Vance County
According to the Vance County family income data, there are 1,957 families falling into the $100,000 to $149,999 income range, which is the most common income bracket and makes up 18.7% of all families. Conversely, the $200,000+ income bracket is the least frequent group with only 293 families (2.8%) belonging to this category.
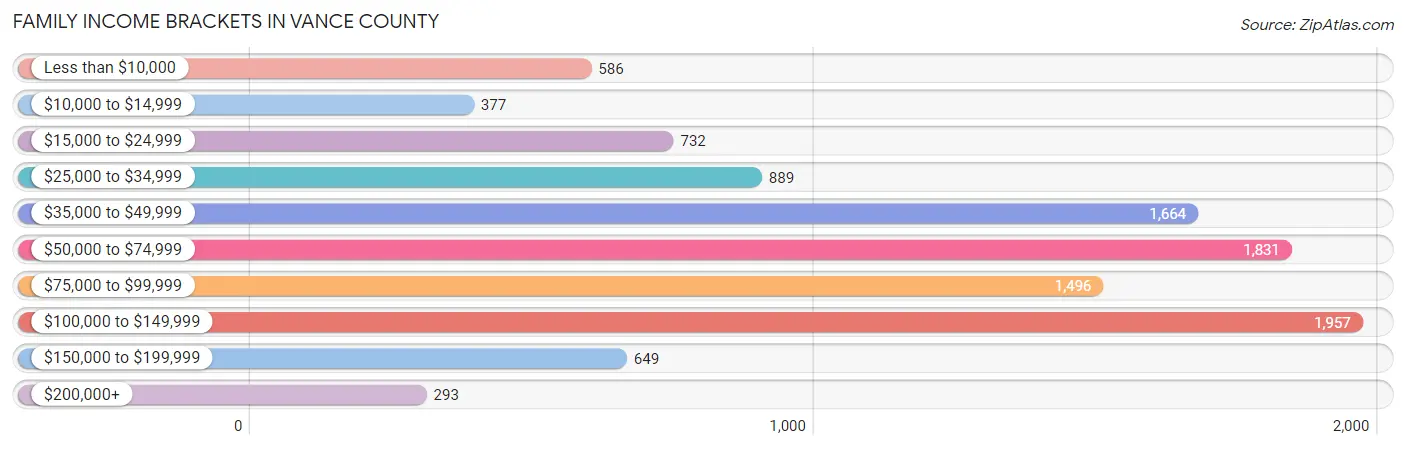
| Income Bracket | # Families | % Families |
| Less than $10,000 | 586 | 5.6% |
| $10,000 to $14,999 | 377 | 3.6% |
| $15,000 to $24,999 | 732 | 7.0% |
| $25,000 to $34,999 | 889 | 8.5% |
| $35,000 to $49,999 | 1,664 | 15.9% |
| $50,000 to $74,999 | 1,831 | 17.5% |
| $75,000 to $99,999 | 1,496 | 14.3% |
| $100,000 to $149,999 | 1,957 | 18.7% |
| $150,000 to $199,999 | 649 | 6.2% |
| $200,000+ | 293 | 2.8% |
Family Income by Famaliy Size in Vance County
6-person families (232 | 2.2%) account for the highest median family income in Vance County with $108,030 per family, while 2-person families (5,137 | 49.1%) have the highest median income of $27,389 per family member.
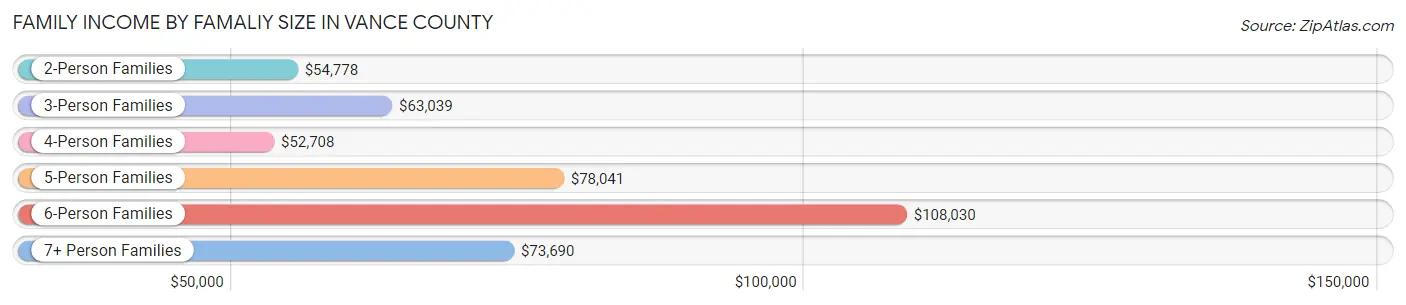
| Income Bracket | # Families | Median Income |
| 2-Person Families | 5,137 (49.1%) | $54,778 |
| 3-Person Families | 2,551 (24.4%) | $63,039 |
| 4-Person Families | 1,745 (16.7%) | $52,708 |
| 5-Person Families | 686 (6.6%) | $78,041 |
| 6-Person Families | 232 (2.2%) | $108,030 |
| 7+ Person Families | 112 (1.1%) | $73,690 |
| Total | 10,463 (100.0%) | $58,310 |
Family Income by Number of Earners in Vance County
The median family income in Vance County is $58,310, with families comprising 3+ earners (689) having the highest median family income of $99,329, while families with no earners (1,845) have the lowest median family income of $40,578, accounting for 6.6% and 17.6% of families, respectively.
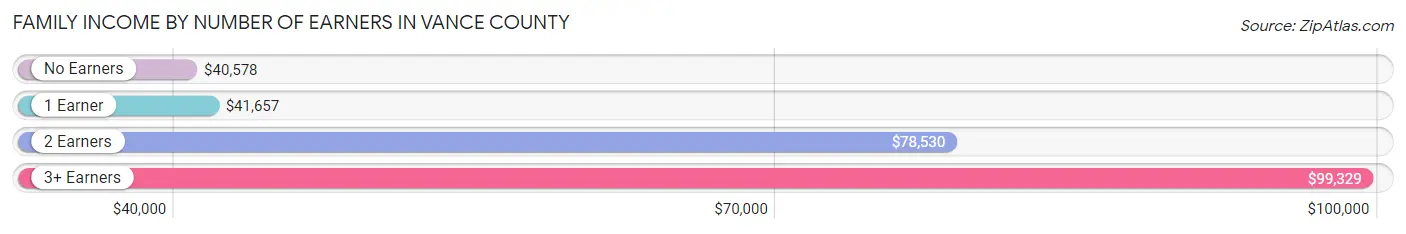
| Number of Earners | # Families | Median Income |
| No Earners | 1,845 (17.6%) | $40,578 |
| 1 Earner | 3,892 (37.2%) | $41,657 |
| 2 Earners | 4,037 (38.6%) | $78,530 |
| 3+ Earners | 689 (6.6%) | $99,329 |
| Total | 10,463 (100.0%) | $58,310 |
Household Income in Vance County
Household Income Brackets in Vance County
With 2,838 households falling in the category, the $50,000 to $74,999 income range is the most frequent in Vance County, accounting for 17.6% of all households. In contrast, only 322 households (2.0%) fall into the $200,000+ income bracket, making it the least populous group.
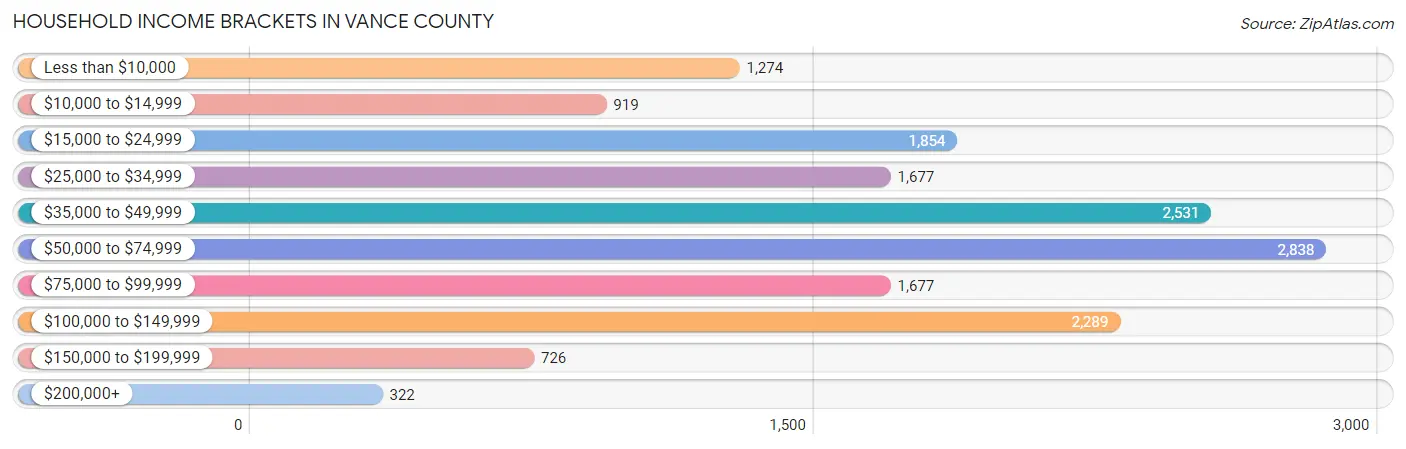
| Income Bracket | # Households | % Households |
| Less than $10,000 | 1,274 | 7.9% |
| $10,000 to $14,999 | 919 | 5.7% |
| $15,000 to $24,999 | 1,854 | 11.5% |
| $25,000 to $34,999 | 1,677 | 10.4% |
| $35,000 to $49,999 | 2,531 | 15.7% |
| $50,000 to $74,999 | 2,838 | 17.6% |
| $75,000 to $99,999 | 1,677 | 10.4% |
| $100,000 to $149,999 | 2,289 | 14.2% |
| $150,000 to $199,999 | 726 | 4.5% |
| $200,000+ | 322 | 2.0% |
Household Income by Householder Age in Vance County
The median household income in Vance County is $48,340, with the highest median household income of $53,954 found in the 45 to 64 years age bracket for the primary householder. A total of 6,525 households (40.5%) fall into this category. Meanwhile, the 15 to 24 years age bracket for the primary householder has the lowest median household income of $0, with 520 households (3.2%) in this group.
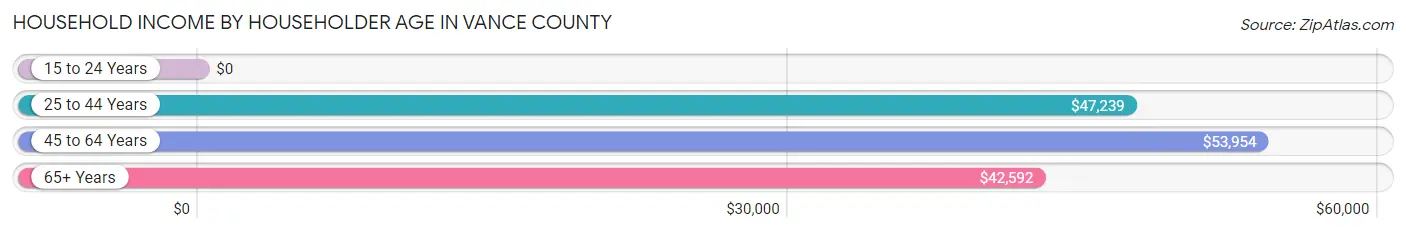
| Income Bracket | # Households | Median Income |
| 15 to 24 Years | 520 (3.2%) | $0 |
| 25 to 44 Years | 4,096 (25.4%) | $47,239 |
| 45 to 64 Years | 6,525 (40.5%) | $53,954 |
| 65+ Years | 4,982 (30.9%) | $42,592 |
| Total | 16,123 (100.0%) | $48,340 |
Poverty in Vance County
Income Below Poverty by Sex and Age in Vance County
With 16.2% poverty level for males and 20.9% for females among the residents of Vance County, under 5 year old males and 15 year old females are the most vulnerable to poverty, with 433 males (31.0%) and 124 females (54.4%) in their respective age groups living below the poverty level.
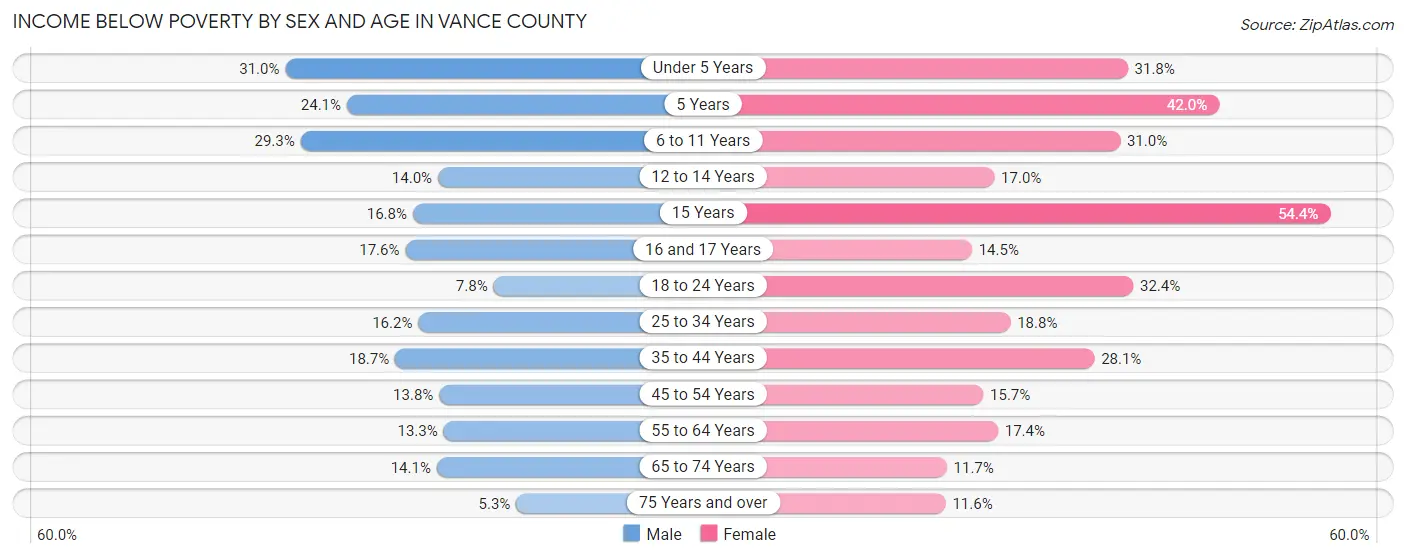
| Age Bracket | Male | Female |
| Under 5 Years | 433 (31.0%) | 416 (31.8%) |
| 5 Years | 27 (24.1%) | 92 (42.0%) |
| 6 to 11 Years | 458 (29.3%) | 521 (31.0%) |
| 12 to 14 Years | 157 (14.0%) | 147 (17.0%) |
| 15 Years | 28 (16.8%) | 124 (54.4%) |
| 16 and 17 Years | 107 (17.6%) | 102 (14.5%) |
| 18 to 24 Years | 137 (7.8%) | 581 (32.4%) |
| 25 to 34 Years | 401 (16.2%) | 513 (18.8%) |
| 35 to 44 Years | 349 (18.7%) | 687 (28.1%) |
| 45 to 54 Years | 357 (13.8%) | 446 (15.7%) |
| 55 to 64 Years | 358 (13.3%) | 547 (17.4%) |
| 65 to 74 Years | 300 (14.1%) | 306 (11.7%) |
| 75 Years and over | 58 (5.2%) | 210 (11.6%) |
| Total | 3,170 (16.2%) | 4,692 (20.9%) |
Income Above Poverty by Sex and Age in Vance County
According to the poverty statistics in Vance County, males aged 75 years and over and females aged 75 years and over are the age groups that are most secure financially, with 94.8% of males and 88.4% of females in these age groups living above the poverty line.
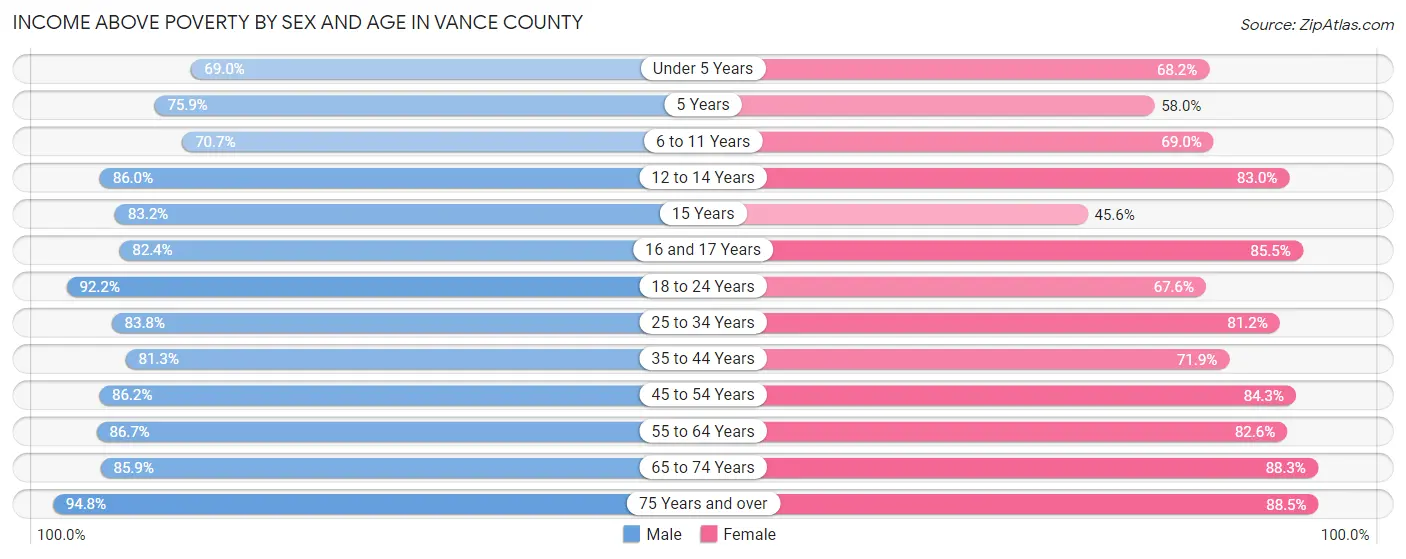
| Age Bracket | Male | Female |
| Under 5 Years | 965 (69.0%) | 891 (68.2%) |
| 5 Years | 85 (75.9%) | 127 (58.0%) |
| 6 to 11 Years | 1,107 (70.7%) | 1,161 (69.0%) |
| 12 to 14 Years | 967 (86.0%) | 719 (83.0%) |
| 15 Years | 139 (83.2%) | 104 (45.6%) |
| 16 and 17 Years | 501 (82.4%) | 603 (85.5%) |
| 18 to 24 Years | 1,625 (92.2%) | 1,210 (67.6%) |
| 25 to 34 Years | 2,080 (83.8%) | 2,221 (81.2%) |
| 35 to 44 Years | 1,513 (81.3%) | 1,757 (71.9%) |
| 45 to 54 Years | 2,225 (86.2%) | 2,388 (84.3%) |
| 55 to 64 Years | 2,326 (86.7%) | 2,603 (82.6%) |
| 65 to 74 Years | 1,827 (85.9%) | 2,317 (88.3%) |
| 75 Years and over | 1,046 (94.8%) | 1,608 (88.4%) |
| Total | 16,406 (83.8%) | 17,709 (79.0%) |
Income Below Poverty Among Married-Couple Families in Vance County
The poverty statistics for married-couple families in Vance County show that 4.9% or 298 of the total 6,043 families live below the poverty line. Families with 3 or 4 children have the highest poverty rate of 14.9%, comprising of 39 families. On the other hand, families with 5 or more children have the lowest poverty rate of 0.0%, which includes 0 families.
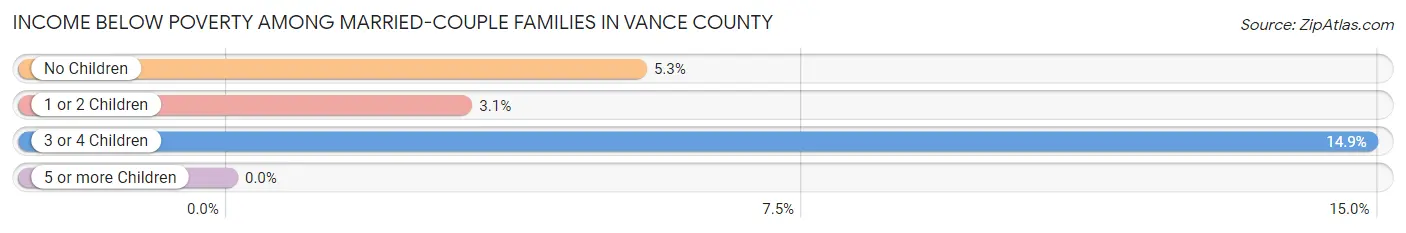
| Children | Above Poverty | Below Poverty |
| No Children | 3,440 (94.7%) | 194 (5.3%) |
| 1 or 2 Children | 2,061 (96.9%) | 65 (3.1%) |
| 3 or 4 Children | 223 (85.1%) | 39 (14.9%) |
| 5 or more Children | 21 (100.0%) | 0 (0.0%) |
| Total | 5,745 (95.1%) | 298 (4.9%) |
Income Below Poverty Among Single-Parent Households in Vance County
According to the poverty data in Vance County, 14.1% or 131 single-father households and 30.4% or 1,060 single-mother households are living below the poverty line. Among single-father households, those with 1 or 2 children have the highest poverty rate, with 100 households (20.4%) experiencing poverty. Likewise, among single-mother households, those with 5 or more children have the highest poverty rate, with 54 households (100.0%) falling below the poverty line.
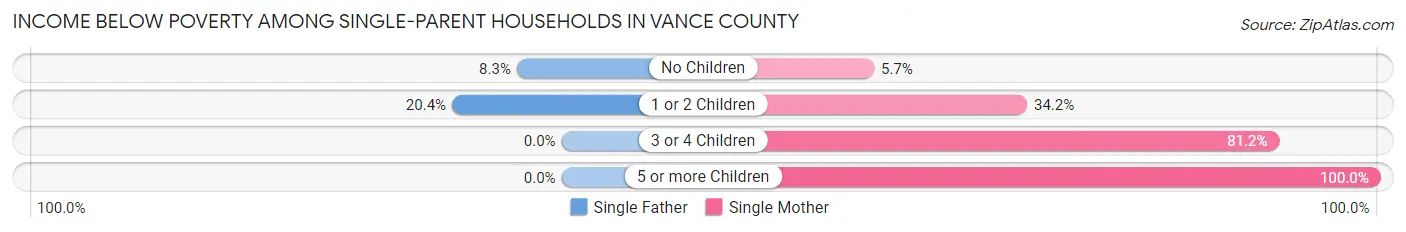
| Children | Single Father | Single Mother |
| No Children | 31 (8.3%) | 69 (5.7%) |
| 1 or 2 Children | 100 (20.4%) | 627 (34.2%) |
| 3 or 4 Children | 0 (0.0%) | 310 (81.1%) |
| 5 or more Children | 0 (0.0%) | 54 (100.0%) |
| Total | 131 (14.1%) | 1,060 (30.4%) |
Income Below Poverty Among Married-Couple vs Single-Parent Households in Vance County
The poverty data for Vance County shows that 298 of the married-couple family households (4.9%) and 1,191 of the single-parent households (27.0%) are living below the poverty level. Within the married-couple family households, those with 3 or 4 children have the highest poverty rate, with 39 households (14.9%) falling below the poverty line. Among the single-parent households, those with 5 or more children have the highest poverty rate, with 54 household (100.0%) living below poverty.
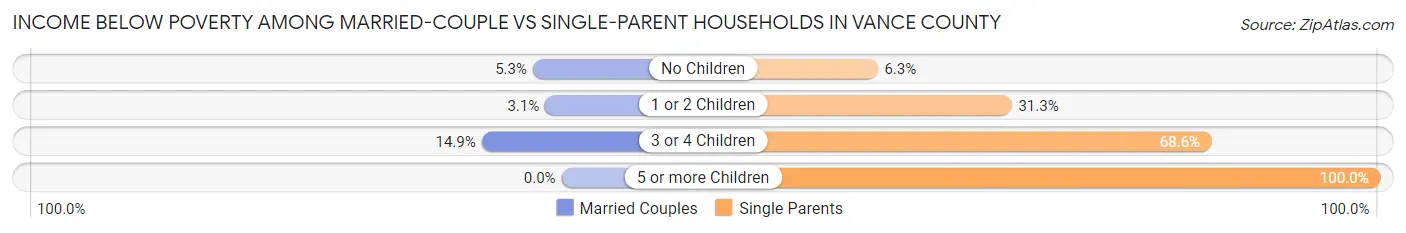
| Children | Married-Couple Families | Single-Parent Households |
| No Children | 194 (5.3%) | 100 (6.3%) |
| 1 or 2 Children | 65 (3.1%) | 727 (31.3%) |
| 3 or 4 Children | 39 (14.9%) | 310 (68.6%) |
| 5 or more Children | 0 (0.0%) | 54 (100.0%) |
| Total | 298 (4.9%) | 1,191 (27.0%) |
Employment Characteristics in Vance County
Employment by Class of Employer in Vance County
Among the 17,668 employed individuals in Vance County, private company employees (12,677 | 71.8%), state government employees (1,478 | 8.4%), and local government employees (985 | 5.6%) make up the most common classes of employment.
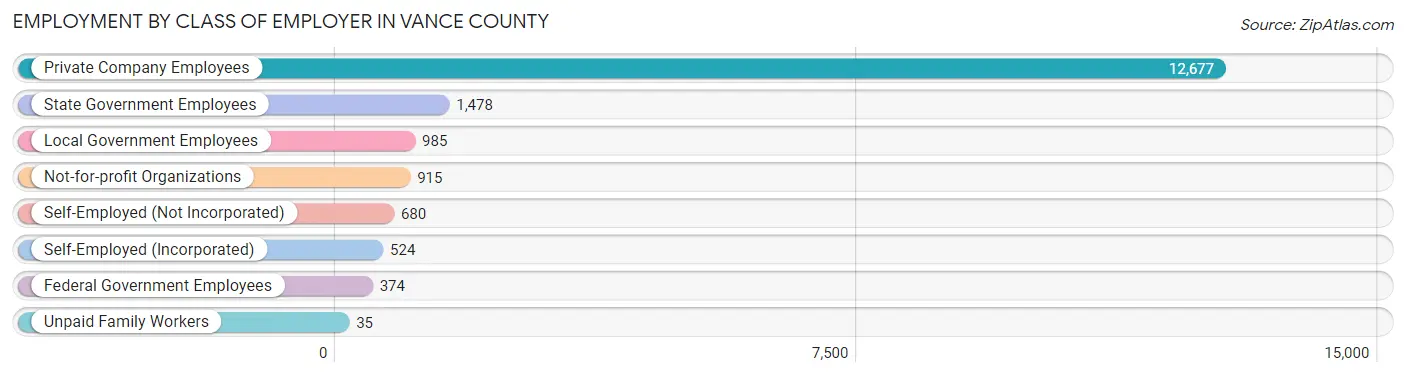
| Employer Class | # Employees | % Employees |
| Private Company Employees | 12,677 | 71.8% |
| Self-Employed (Incorporated) | 524 | 3.0% |
| Self-Employed (Not Incorporated) | 680 | 3.8% |
| Not-for-profit Organizations | 915 | 5.2% |
| Local Government Employees | 985 | 5.6% |
| State Government Employees | 1,478 | 8.4% |
| Federal Government Employees | 374 | 2.1% |
| Unpaid Family Workers | 35 | 0.2% |
| Total | 17,668 | 100.0% |
Employment Status by Age in Vance County
According to the labor force statistics for Vance County, out of the total population over 16 years of age (33,719), 57.9% or 19,523 individuals are in the labor force, with 7.0% or 1,367 of them unemployed. The age group with the highest labor force participation rate is 30 to 34 years, with 79.9% or 1,956 individuals in the labor force. Within the labor force, the 16 to 19 years age range has the highest percentage of unemployed individuals, with 29.5% or 262 of them being unemployed.
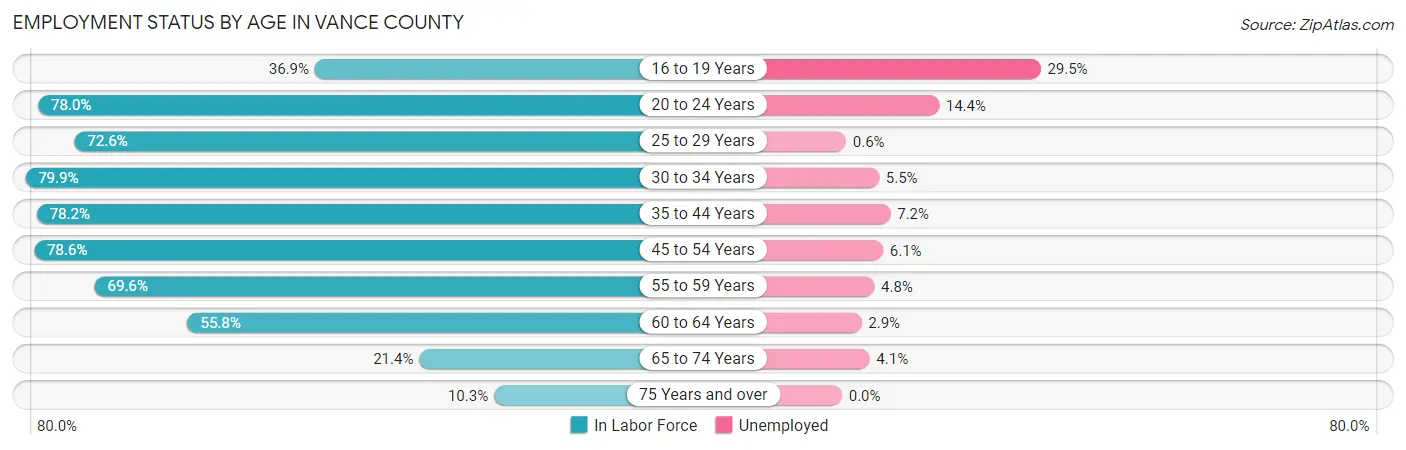
| Age Bracket | In Labor Force | Unemployed |
| 16 to 19 Years | 888 (36.9%) | 262 (29.5%) |
| 20 to 24 Years | 1,960 (78.0%) | 282 (14.4%) |
| 25 to 29 Years | 2,039 (72.6%) | 12 (0.6%) |
| 30 to 34 Years | 1,956 (79.9%) | 108 (5.5%) |
| 35 to 44 Years | 3,389 (78.2%) | 244 (7.2%) |
| 45 to 54 Years | 4,263 (78.6%) | 260 (6.1%) |
| 55 to 59 Years | 2,146 (69.6%) | 103 (4.8%) |
| 60 to 64 Years | 1,545 (55.8%) | 45 (2.9%) |
| 65 to 74 Years | 1,029 (21.4%) | 42 (4.1%) |
| 75 Years and over | 322 (10.3%) | 0 (0.0%) |
| Total | 19,523 (57.9%) | 1,367 (7.0%) |
Employment Status by Educational Attainment in Vance County
According to labor force statistics for Vance County, 73.5% of individuals (15,337) out of the total population between 25 and 64 years of age (20,866) are in the labor force, with 5.0% or 767 of them being unemployed. The group with the highest labor force participation rate are those with the educational attainment of bachelor's degree or higher, with 82.6% or 3,106 individuals in the labor force. Within the labor force, individuals with less than high school education have the highest percentage of unemployment, with 14.9% or 246 of them being unemployed.
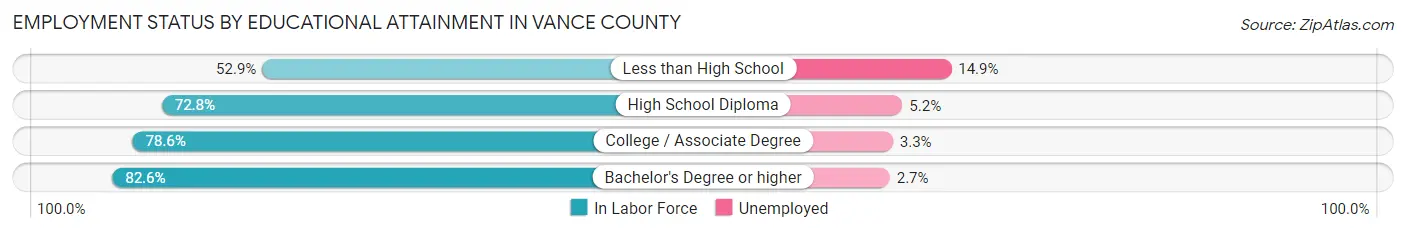
| Educational Attainment | In Labor Force | Unemployed |
| Less than High School | 1,651 (52.9%) | 465 (14.9%) |
| High School Diploma | 5,234 (72.8%) | 374 (5.2%) |
| College / Associate Degree | 5,342 (78.6%) | 224 (3.3%) |
| Bachelor's Degree or higher | 3,106 (82.6%) | 102 (2.7%) |
| Total | 15,337 (73.5%) | 1,043 (5.0%) |
Employment Occupations by Sex in Vance County
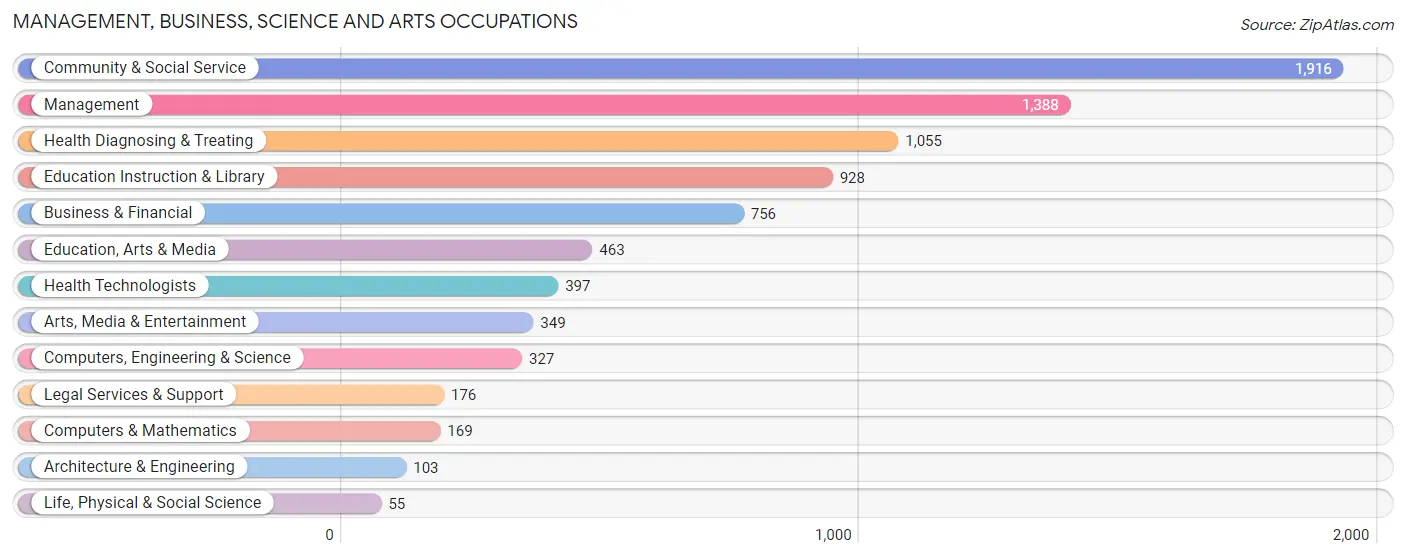
Management, Business, Science and Arts Occupations
The most common Management, Business, Science and Arts occupations in Vance County are Community & Social Service (1,916 | 10.5%), Management (1,388 | 7.6%), Health Diagnosing & Treating (1,055 | 5.8%), Education Instruction & Library (928 | 5.1%), and Business & Financial (756 | 4.2%).
Management, Business, Science and Arts Occupations by Sex
Within the Management, Business, Science and Arts occupations in Vance County, the most male-oriented occupations are Arts, Media & Entertainment (64.2%), Management (54.8%), and Life, Physical & Social Science (45.5%), while the most female-oriented occupations are Education Instruction & Library (83.7%), Health Diagnosing & Treating (81.5%), and Health Technologists (81.4%).
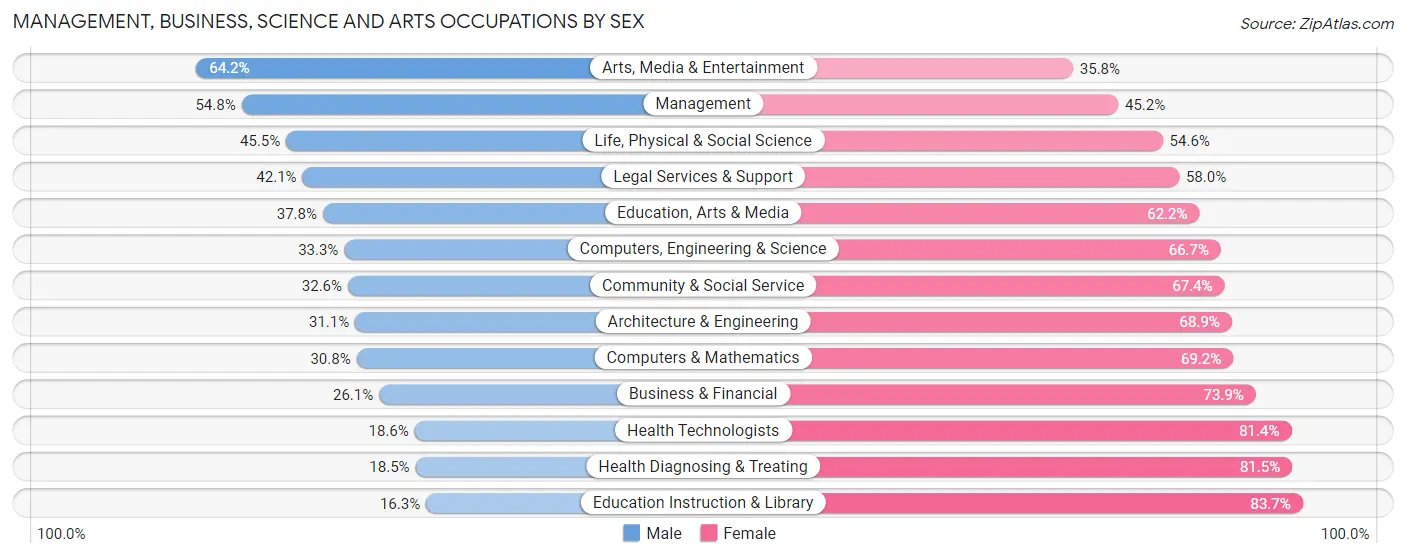
| Occupation | Male | Female |
| Management | 760 (54.8%) | 628 (45.2%) |
| Business & Financial | 197 (26.1%) | 559 (73.9%) |
| Computers, Engineering & Science | 109 (33.3%) | 218 (66.7%) |
| Computers & Mathematics | 52 (30.8%) | 117 (69.2%) |
| Architecture & Engineering | 32 (31.1%) | 71 (68.9%) |
| Life, Physical & Social Science | 25 (45.5%) | 30 (54.5%) |
| Community & Social Service | 624 (32.6%) | 1,292 (67.4%) |
| Education, Arts & Media | 175 (37.8%) | 288 (62.2%) |
| Legal Services & Support | 74 (42.0%) | 102 (58.0%) |
| Education Instruction & Library | 151 (16.3%) | 777 (83.7%) |
| Arts, Media & Entertainment | 224 (64.2%) | 125 (35.8%) |
| Health Diagnosing & Treating | 195 (18.5%) | 860 (81.5%) |
| Health Technologists | 74 (18.6%) | 323 (81.4%) |
| Total (Category) | 1,885 (34.6%) | 3,557 (65.4%) |
| Total (Overall) | 8,437 (46.4%) | 9,740 (53.6%) |
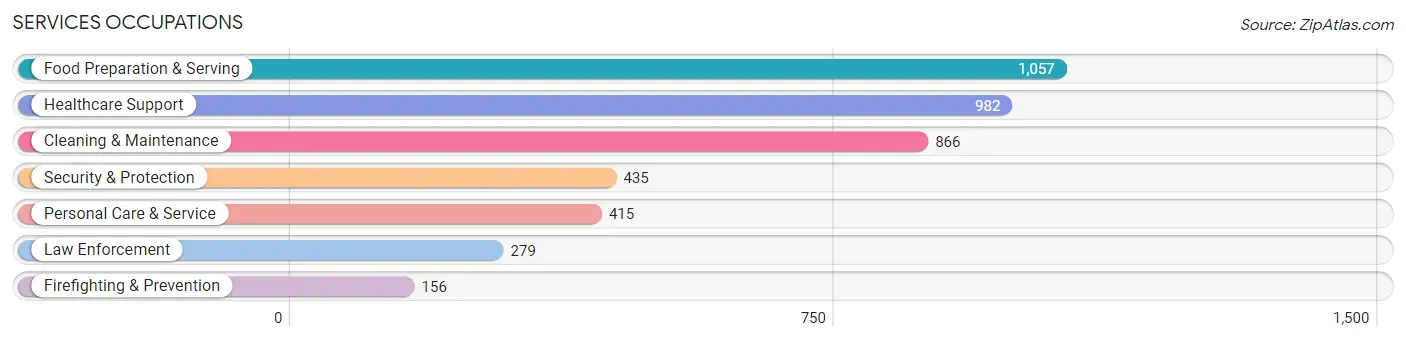
Services Occupations
The most common Services occupations in Vance County are Food Preparation & Serving (1,057 | 5.8%), Healthcare Support (982 | 5.4%), Cleaning & Maintenance (866 | 4.8%), Security & Protection (435 | 2.4%), and Personal Care & Service (415 | 2.3%).
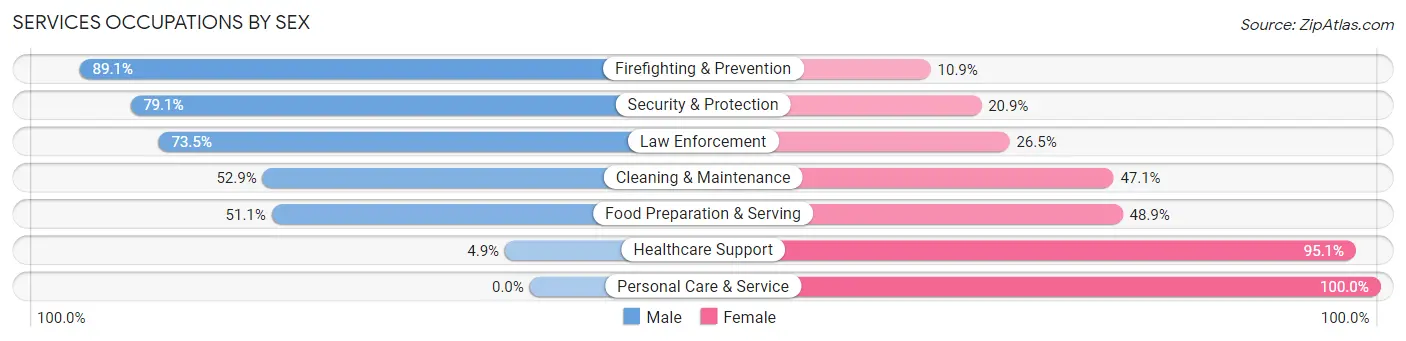
Services Occupations by Sex
Within the Services occupations in Vance County, the most male-oriented occupations are Firefighting & Prevention (89.1%), Security & Protection (79.1%), and Law Enforcement (73.5%), while the most female-oriented occupations are Personal Care & Service (100.0%), Healthcare Support (95.1%), and Food Preparation & Serving (48.9%).
| Occupation | Male | Female |
| Healthcare Support | 48 (4.9%) | 934 (95.1%) |
| Security & Protection | 344 (79.1%) | 91 (20.9%) |
| Firefighting & Prevention | 139 (89.1%) | 17 (10.9%) |
| Law Enforcement | 205 (73.5%) | 74 (26.5%) |
| Food Preparation & Serving | 540 (51.1%) | 517 (48.9%) |
| Cleaning & Maintenance | 458 (52.9%) | 408 (47.1%) |
| Personal Care & Service | 0 (0.0%) | 415 (100.0%) |
| Total (Category) | 1,390 (37.0%) | 2,365 (63.0%) |
| Total (Overall) | 8,437 (46.4%) | 9,740 (53.6%) |
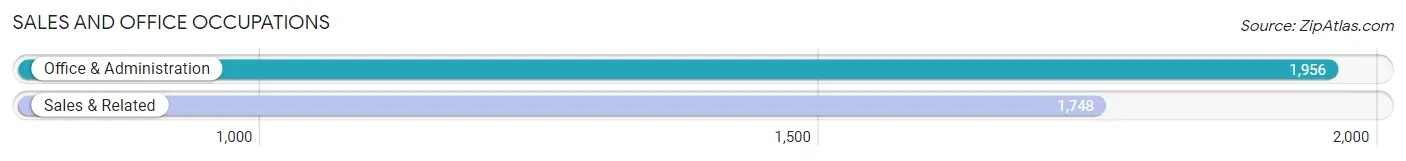
Sales and Office Occupations
The most common Sales and Office occupations in Vance County are Office & Administration (1,956 | 10.8%), and Sales & Related (1,748 | 9.6%).
Sales and Office Occupations by Sex

| Occupation | Male | Female |
| Sales & Related | 764 (43.7%) | 984 (56.3%) |
| Office & Administration | 372 (19.0%) | 1,584 (81.0%) |
| Total (Category) | 1,136 (30.7%) | 2,568 (69.3%) |
| Total (Overall) | 8,437 (46.4%) | 9,740 (53.6%) |
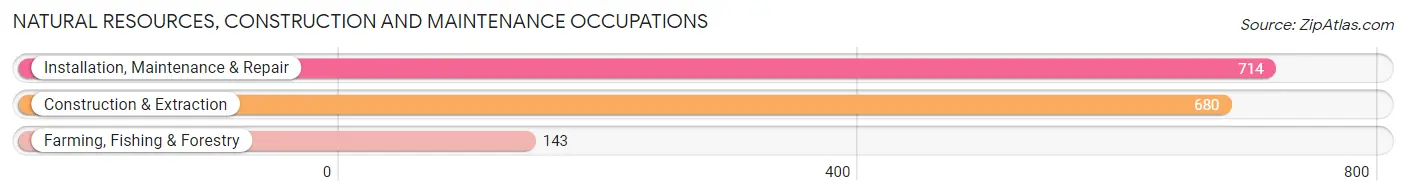
Natural Resources, Construction and Maintenance Occupations
The most common Natural Resources, Construction and Maintenance occupations in Vance County are Installation, Maintenance & Repair (714 | 3.9%), Construction & Extraction (680 | 3.7%), and Farming, Fishing & Forestry (143 | 0.8%).
Natural Resources, Construction and Maintenance Occupations by Sex
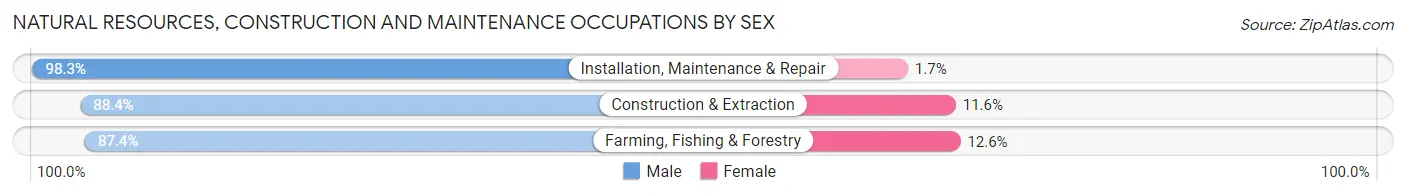
| Occupation | Male | Female |
| Farming, Fishing & Forestry | 125 (87.4%) | 18 (12.6%) |
| Construction & Extraction | 601 (88.4%) | 79 (11.6%) |
| Installation, Maintenance & Repair | 702 (98.3%) | 12 (1.7%) |
| Total (Category) | 1,428 (92.9%) | 109 (7.1%) |
| Total (Overall) | 8,437 (46.4%) | 9,740 (53.6%) |
Production, Transportation and Moving Occupations
The most common Production, Transportation and Moving occupations in Vance County are Material Moving (1,635 | 9.0%), Production (1,587 | 8.7%), and Transportation (517 | 2.8%).
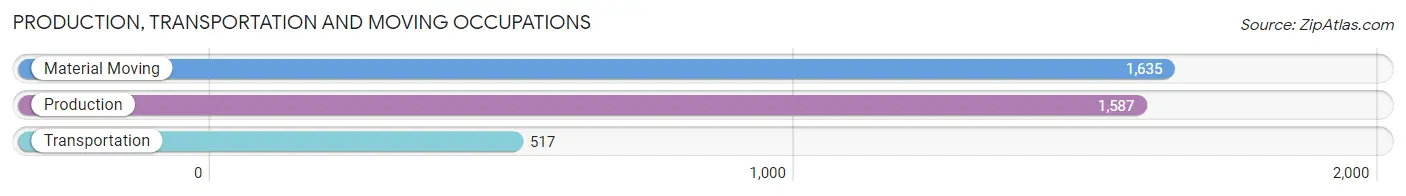
Production, Transportation and Moving Occupations by Sex
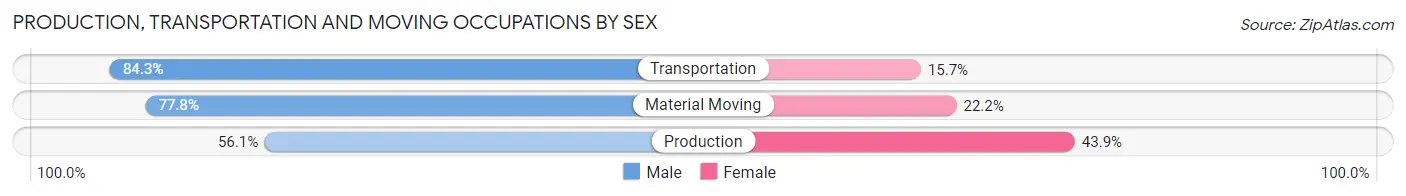
| Occupation | Male | Female |
| Production | 890 (56.1%) | 697 (43.9%) |
| Transportation | 436 (84.3%) | 81 (15.7%) |
| Material Moving | 1,272 (77.8%) | 363 (22.2%) |
| Total (Category) | 2,598 (69.5%) | 1,141 (30.5%) |
| Total (Overall) | 8,437 (46.4%) | 9,740 (53.6%) |
Employment Industries by Sex in Vance County
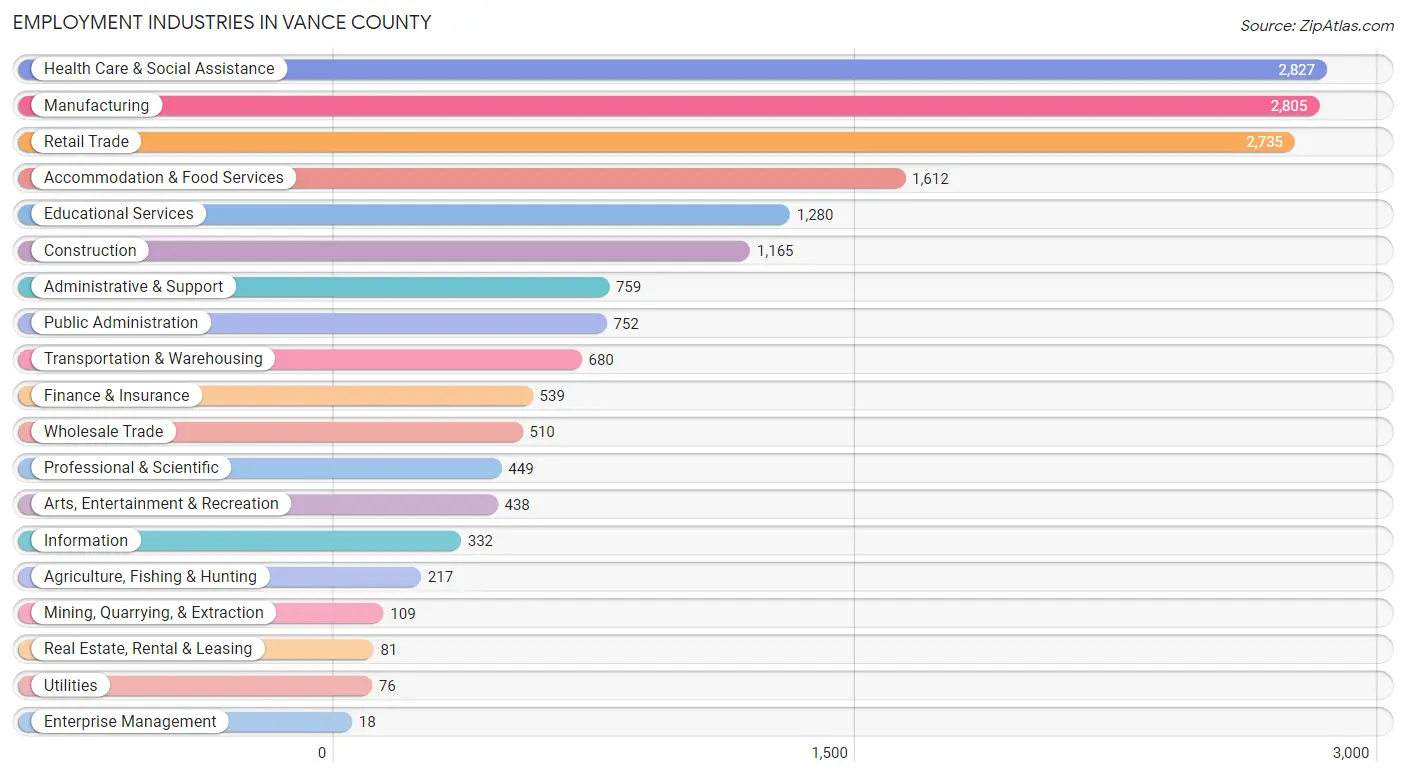
Employment Industries in Vance County
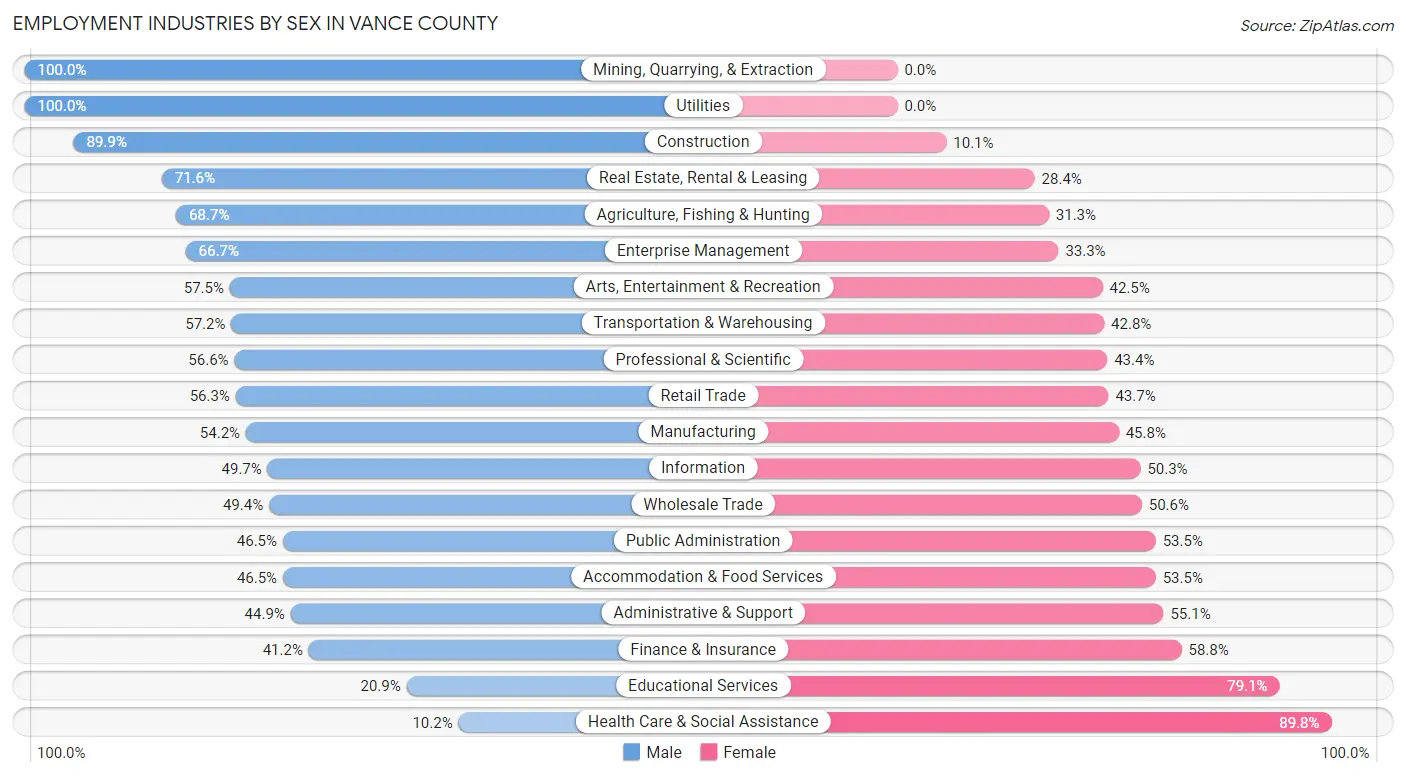
The major employment industries in Vance County include Health Care & Social Assistance (2,827 | 15.5%), Manufacturing (2,805 | 15.4%), Retail Trade (2,735 | 15.0%), Accommodation & Food Services (1,612 | 8.9%), and Educational Services (1,280 | 7.0%).
Employment Industries by Sex in Vance County
The Vance County industries that see more men than women are Mining, Quarrying, & Extraction (100.0%), Utilities (100.0%), and Construction (89.9%), whereas the industries that tend to have a higher number of women are Health Care & Social Assistance (89.8%), Educational Services (79.1%), and Finance & Insurance (58.8%).
| Industry | Male | Female |
| Agriculture, Fishing & Hunting | 149 (68.7%) | 68 (31.3%) |
| Mining, Quarrying, & Extraction | 109 (100.0%) | 0 (0.0%) |
| Construction | 1,047 (89.9%) | 118 (10.1%) |
| Manufacturing | 1,520 (54.2%) | 1,285 (45.8%) |
| Wholesale Trade | 252 (49.4%) | 258 (50.6%) |
| Retail Trade | 1,540 (56.3%) | 1,195 (43.7%) |
| Transportation & Warehousing | 389 (57.2%) | 291 (42.8%) |
| Utilities | 76 (100.0%) | 0 (0.0%) |
| Information | 165 (49.7%) | 167 (50.3%) |
| Finance & Insurance | 222 (41.2%) | 317 (58.8%) |
| Real Estate, Rental & Leasing | 58 (71.6%) | 23 (28.4%) |
| Professional & Scientific | 254 (56.6%) | 195 (43.4%) |
| Enterprise Management | 12 (66.7%) | 6 (33.3%) |
| Administrative & Support | 341 (44.9%) | 418 (55.1%) |
| Educational Services | 268 (20.9%) | 1,012 (79.1%) |
| Health Care & Social Assistance | 288 (10.2%) | 2,539 (89.8%) |
| Arts, Entertainment & Recreation | 252 (57.5%) | 186 (42.5%) |
| Accommodation & Food Services | 750 (46.5%) | 862 (53.5%) |
| Public Administration | 350 (46.5%) | 402 (53.5%) |
| Total | 8,437 (46.4%) | 9,740 (53.6%) |
Education in Vance County
School Enrollment in Vance County
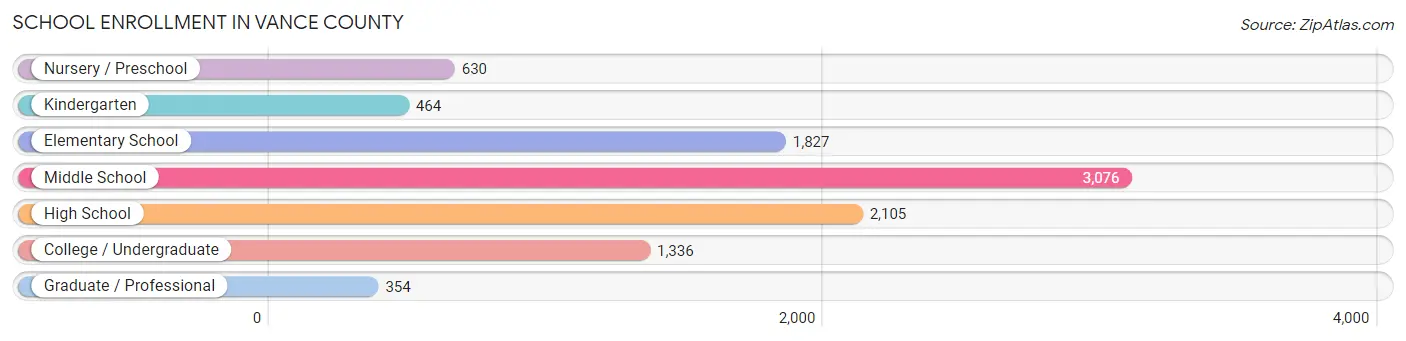
The most common levels of schooling among the 9,792 students in Vance County are middle school (3,076 | 31.4%), high school (2,105 | 21.5%), and elementary school (1,827 | 18.7%).
| School Level | # Students | % Students |
| Nursery / Preschool | 630 | 6.4% |
| Kindergarten | 464 | 4.7% |
| Elementary School | 1,827 | 18.7% |
| Middle School | 3,076 | 31.4% |
| High School | 2,105 | 21.5% |
| College / Undergraduate | 1,336 | 13.6% |
| Graduate / Professional | 354 | 3.6% |
| Total | 9,792 | 100.0% |
School Enrollment by Age by Funding Source in Vance County
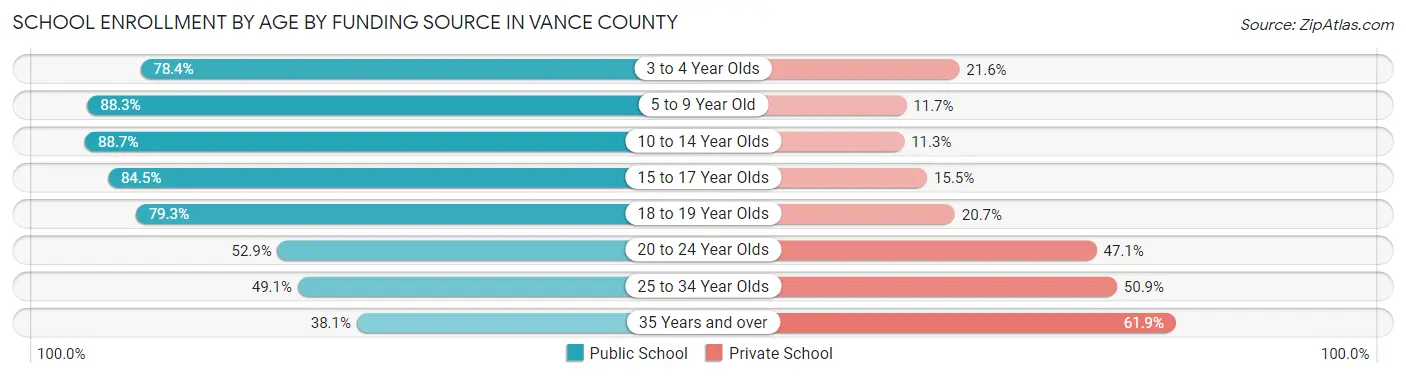
Out of a total of 9,792 students who are enrolled in schools in Vance County, 1,900 (19.4%) attend a private institution, while the remaining 7,892 (80.6%) are enrolled in public schools. The age group of 35 years and over has the highest likelihood of being enrolled in private schools, with 370 (61.9% in the age bracket) enrolled. Conversely, the age group of 10 to 14 year olds has the lowest likelihood of being enrolled in a private school, with 3,060 (88.7% in the age bracket) attending a public institution.
| Age Bracket | Public School | Private School |
| 3 to 4 Year Olds | 411 (78.4%) | 113 (21.6%) |
| 5 to 9 Year Old | 1,913 (88.3%) | 253 (11.7%) |
| 10 to 14 Year Olds | 3,060 (88.7%) | 389 (11.3%) |
| 15 to 17 Year Olds | 1,299 (84.5%) | 239 (15.5%) |
| 18 to 19 Year Olds | 559 (79.3%) | 146 (20.7%) |
| 20 to 24 Year Olds | 311 (52.9%) | 277 (47.1%) |
| 25 to 34 Year Olds | 110 (49.1%) | 114 (50.9%) |
| 35 Years and over | 228 (38.1%) | 370 (61.9%) |
| Total | 7,892 (80.6%) | 1,900 (19.4%) |
Educational Attainment by Field of Study in Vance County
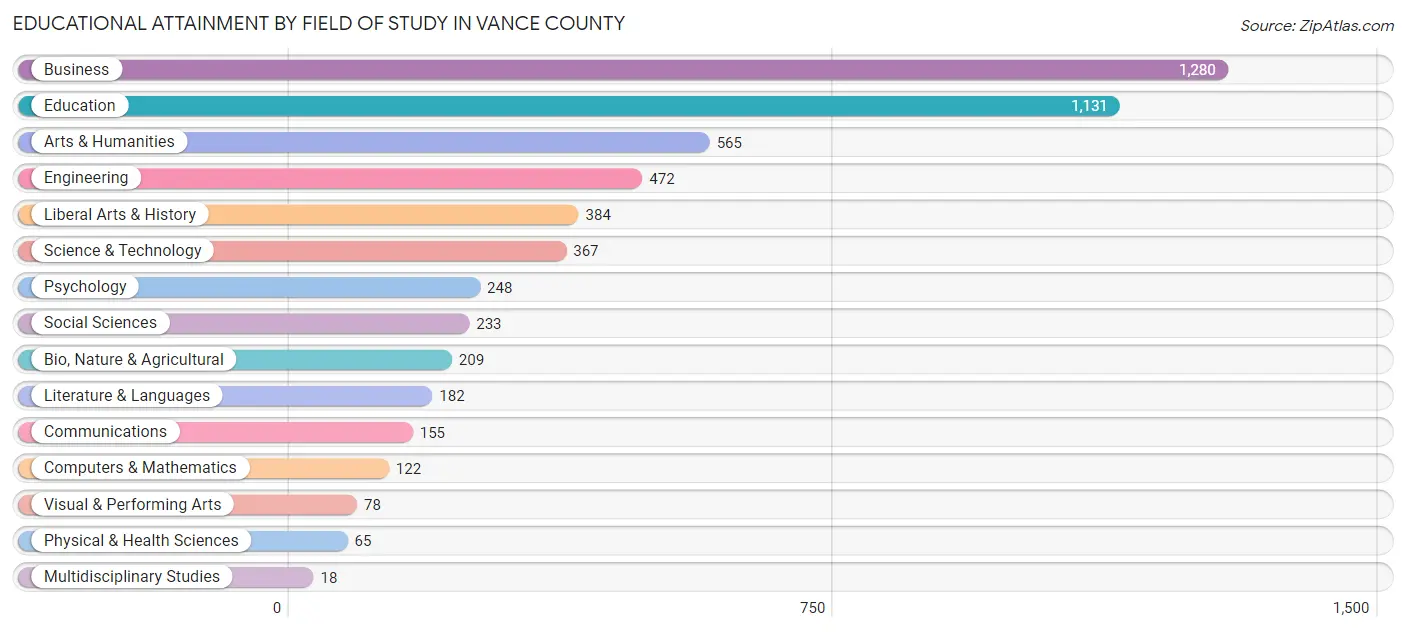
Business (1,280 | 23.2%), education (1,131 | 20.5%), arts & humanities (565 | 10.3%), engineering (472 | 8.6%), and liberal arts & history (384 | 7.0%) are the most common fields of study among 5,509 individuals in Vance County who have obtained a bachelor's degree or higher.
| Field of Study | # Graduates | % Graduates |
| Computers & Mathematics | 122 | 2.2% |
| Bio, Nature & Agricultural | 209 | 3.8% |
| Physical & Health Sciences | 65 | 1.2% |
| Psychology | 248 | 4.5% |
| Social Sciences | 233 | 4.2% |
| Engineering | 472 | 8.6% |
| Multidisciplinary Studies | 18 | 0.3% |
| Science & Technology | 367 | 6.7% |
| Business | 1,280 | 23.2% |
| Education | 1,131 | 20.5% |
| Literature & Languages | 182 | 3.3% |
| Liberal Arts & History | 384 | 7.0% |
| Visual & Performing Arts | 78 | 1.4% |
| Communications | 155 | 2.8% |
| Arts & Humanities | 565 | 10.3% |
| Total | 5,509 | 100.0% |
Transportation & Commute in Vance County
Vehicle Availability by Sex in Vance County
The most prevalent vehicle ownership categories in Vance County are males with 2 vehicles (2,604, accounting for 31.9%) and females with 2 vehicles (3,119, making up 27.6%).
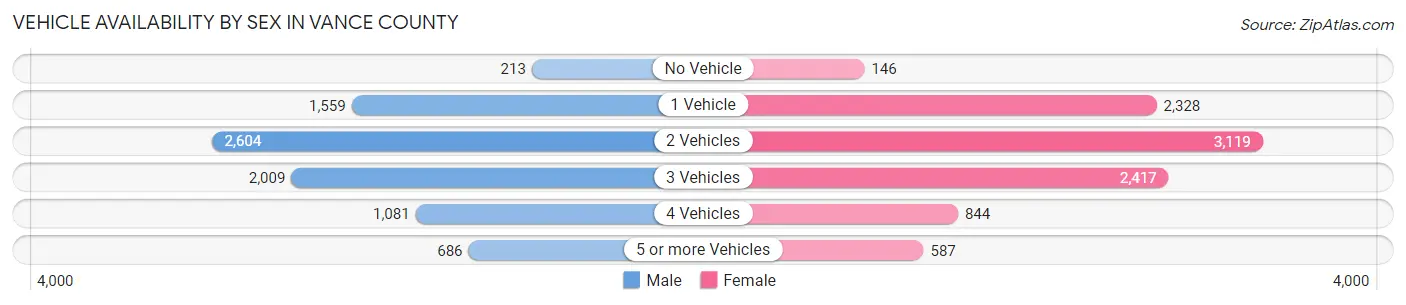
| Vehicles Available | Male | Female |
| No Vehicle | 213 (2.6%) | 146 (1.5%) |
| 1 Vehicle | 1,559 (19.1%) | 2,328 (24.7%) |
| 2 Vehicles | 2,604 (31.9%) | 3,119 (33.0%) |
| 3 Vehicles | 2,009 (24.6%) | 2,417 (25.6%) |
| 4 Vehicles | 1,081 (13.3%) | 844 (8.9%) |
| 5 or more Vehicles | 686 (8.4%) | 587 (6.2%) |
| Total | 8,152 (100.0%) | 9,441 (100.0%) |
Commute Time in Vance County
The most frequently occuring commute durations in Vance County are 10 to 14 minutes (2,959 commuters, 18.3%), 15 to 19 minutes (2,695 commuters, 16.7%), and 5 to 9 minutes (2,041 commuters, 12.6%).
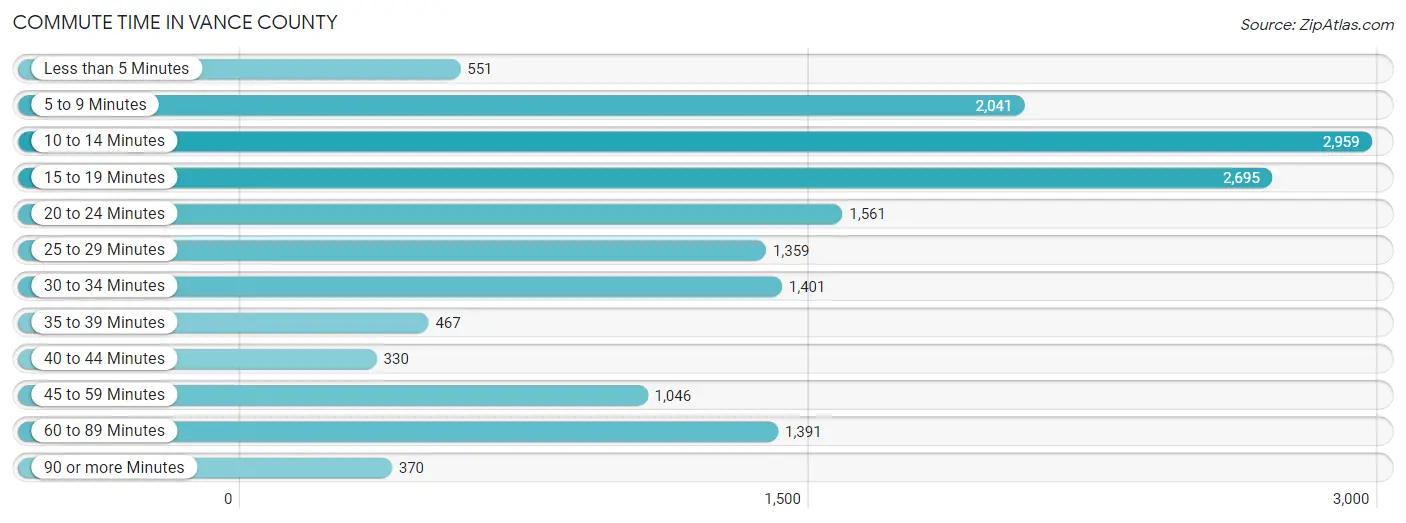
| Commute Time | # Commuters | % Commuters |
| Less than 5 Minutes | 551 | 3.4% |
| 5 to 9 Minutes | 2,041 | 12.6% |
| 10 to 14 Minutes | 2,959 | 18.3% |
| 15 to 19 Minutes | 2,695 | 16.7% |
| 20 to 24 Minutes | 1,561 | 9.7% |
| 25 to 29 Minutes | 1,359 | 8.4% |
| 30 to 34 Minutes | 1,401 | 8.7% |
| 35 to 39 Minutes | 467 | 2.9% |
| 40 to 44 Minutes | 330 | 2.0% |
| 45 to 59 Minutes | 1,046 | 6.5% |
| 60 to 89 Minutes | 1,391 | 8.6% |
| 90 or more Minutes | 370 | 2.3% |
Commute Time by Sex in Vance County
The most common commute times in Vance County are 15 to 19 minutes (1,442 commuters, 19.2%) for males and 10 to 14 minutes (1,759 commuters, 20.3%) for females.
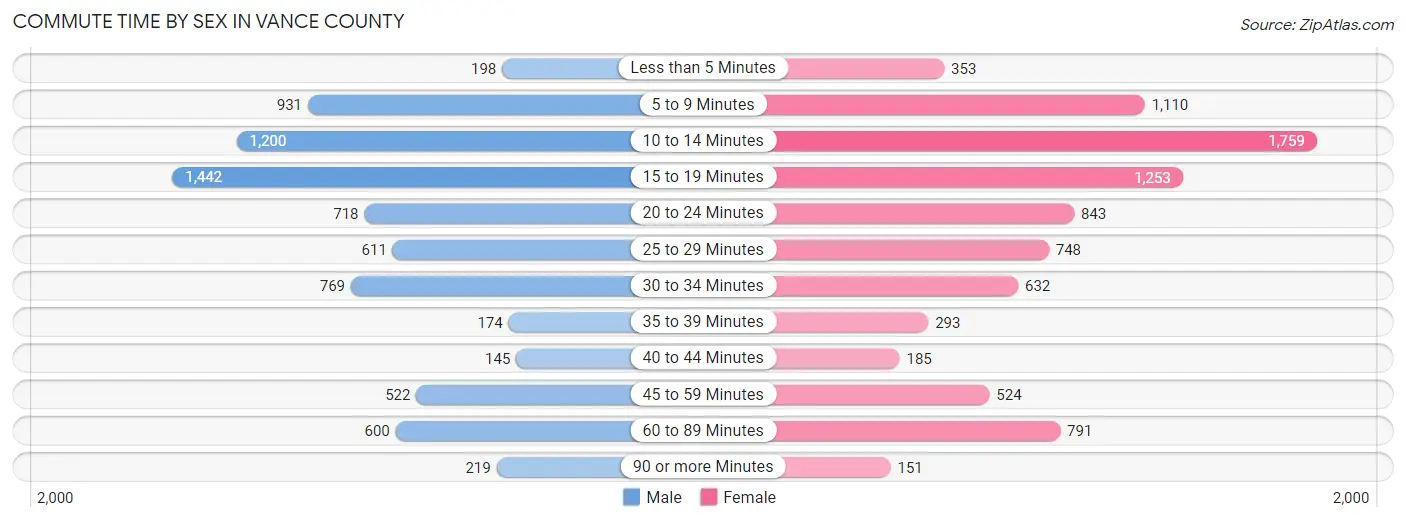
| Commute Time | Male | Female |
| Less than 5 Minutes | 198 (2.6%) | 353 (4.1%) |
| 5 to 9 Minutes | 931 (12.4%) | 1,110 (12.8%) |
| 10 to 14 Minutes | 1,200 (15.9%) | 1,759 (20.3%) |
| 15 to 19 Minutes | 1,442 (19.2%) | 1,253 (14.5%) |
| 20 to 24 Minutes | 718 (9.5%) | 843 (9.8%) |
| 25 to 29 Minutes | 611 (8.1%) | 748 (8.7%) |
| 30 to 34 Minutes | 769 (10.2%) | 632 (7.3%) |
| 35 to 39 Minutes | 174 (2.3%) | 293 (3.4%) |
| 40 to 44 Minutes | 145 (1.9%) | 185 (2.1%) |
| 45 to 59 Minutes | 522 (6.9%) | 524 (6.1%) |
| 60 to 89 Minutes | 600 (8.0%) | 791 (9.1%) |
| 90 or more Minutes | 219 (2.9%) | 151 (1.8%) |
Time of Departure to Work by Sex in Vance County
The most frequent times of departure to work in Vance County are 7:00 AM to 7:29 AM (918, 12.2%) for males and 7:00 AM to 7:29 AM (1,488, 17.2%) for females.
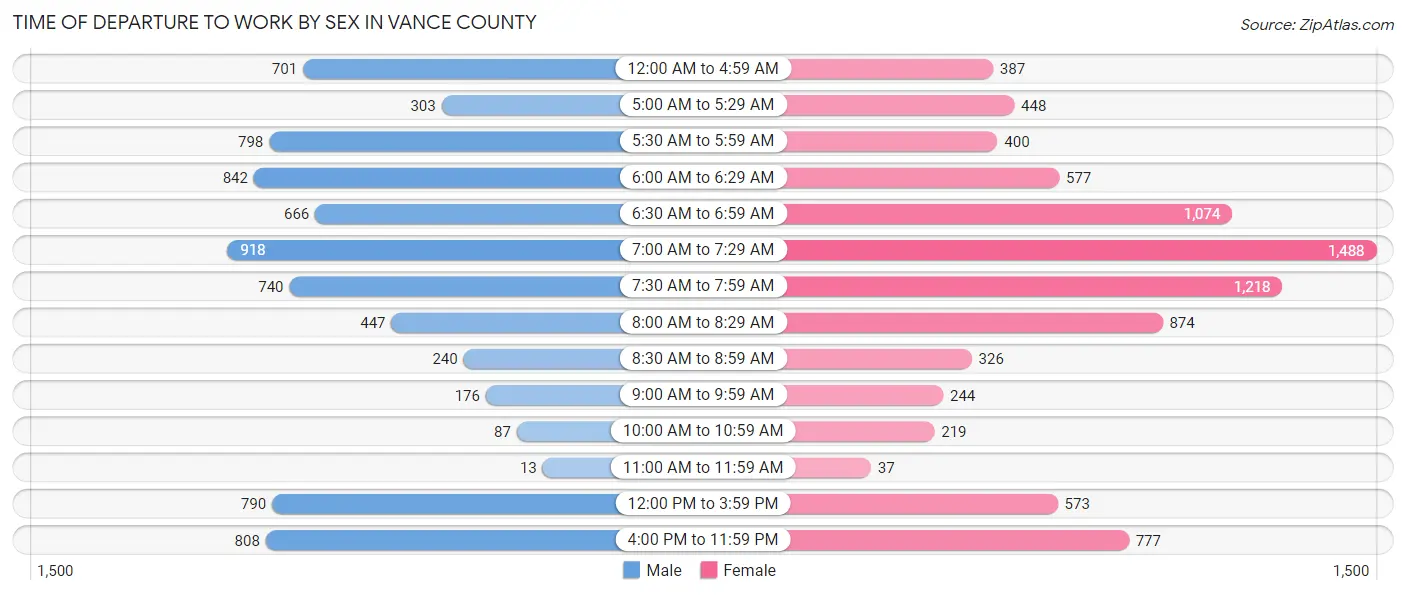
| Time of Departure | Male | Female |
| 12:00 AM to 4:59 AM | 701 (9.3%) | 387 (4.5%) |
| 5:00 AM to 5:29 AM | 303 (4.0%) | 448 (5.2%) |
| 5:30 AM to 5:59 AM | 798 (10.6%) | 400 (4.6%) |
| 6:00 AM to 6:29 AM | 842 (11.2%) | 577 (6.7%) |
| 6:30 AM to 6:59 AM | 666 (8.8%) | 1,074 (12.4%) |
| 7:00 AM to 7:29 AM | 918 (12.2%) | 1,488 (17.2%) |
| 7:30 AM to 7:59 AM | 740 (9.8%) | 1,218 (14.1%) |
| 8:00 AM to 8:29 AM | 447 (5.9%) | 874 (10.1%) |
| 8:30 AM to 8:59 AM | 240 (3.2%) | 326 (3.8%) |
| 9:00 AM to 9:59 AM | 176 (2.3%) | 244 (2.8%) |
| 10:00 AM to 10:59 AM | 87 (1.2%) | 219 (2.5%) |
| 11:00 AM to 11:59 AM | 13 (0.2%) | 37 (0.4%) |
| 12:00 PM to 3:59 PM | 790 (10.5%) | 573 (6.6%) |
| 4:00 PM to 11:59 PM | 808 (10.7%) | 777 (9.0%) |
| Total | 7,529 (100.0%) | 8,642 (100.0%) |
Housing Occupancy in Vance County
Occupancy by Ownership in Vance County
Of the total 16,123 dwellings in Vance County, owner-occupied units account for 9,518 (59.0%), while renter-occupied units make up 6,605 (41.0%).
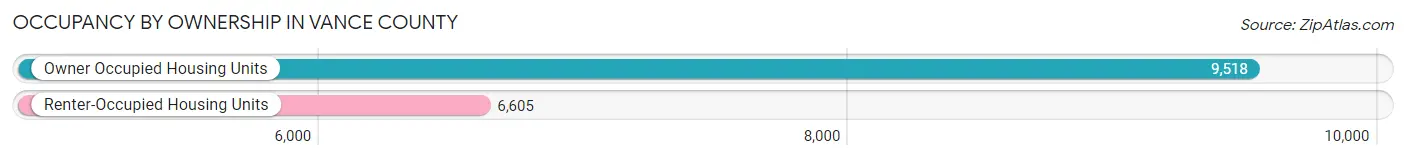
| Occupancy | # Housing Units | % Housing Units |
| Owner Occupied Housing Units | 9,518 | 59.0% |
| Renter-Occupied Housing Units | 6,605 | 41.0% |
| Total Occupied Housing Units | 16,123 | 100.0% |
Occupancy by Household Size in Vance County
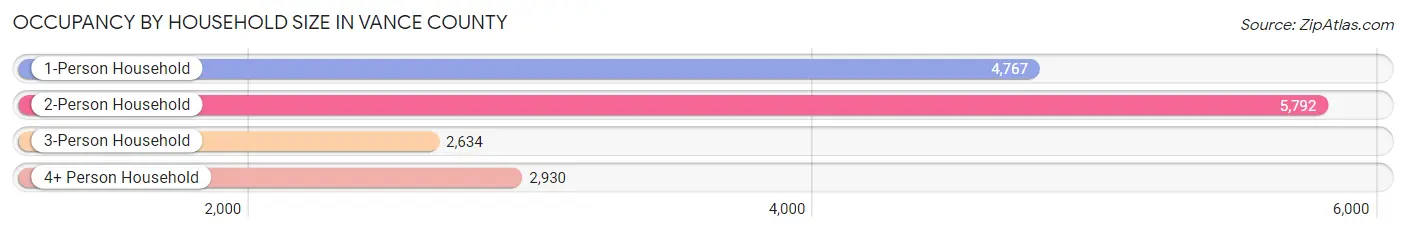
| Household Size | # Housing Units | % Housing Units |
| 1-Person Household | 4,767 | 29.6% |
| 2-Person Household | 5,792 | 35.9% |
| 3-Person Household | 2,634 | 16.3% |
| 4+ Person Household | 2,930 | 18.2% |
| Total Housing Units | 16,123 | 100.0% |
Occupancy by Ownership by Household Size in Vance County
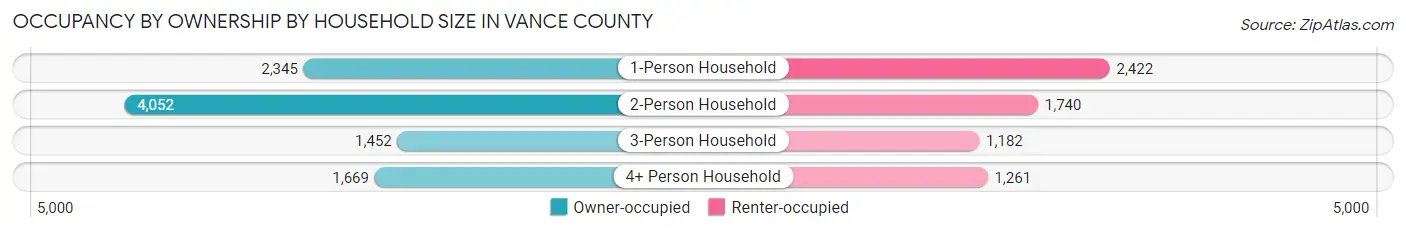
| Household Size | Owner-occupied | Renter-occupied |
| 1-Person Household | 2,345 (49.2%) | 2,422 (50.8%) |
| 2-Person Household | 4,052 (70.0%) | 1,740 (30.0%) |
| 3-Person Household | 1,452 (55.1%) | 1,182 (44.9%) |
| 4+ Person Household | 1,669 (57.0%) | 1,261 (43.0%) |
| Total Housing Units | 9,518 (59.0%) | 6,605 (41.0%) |
Occupancy by Educational Attainment in Vance County
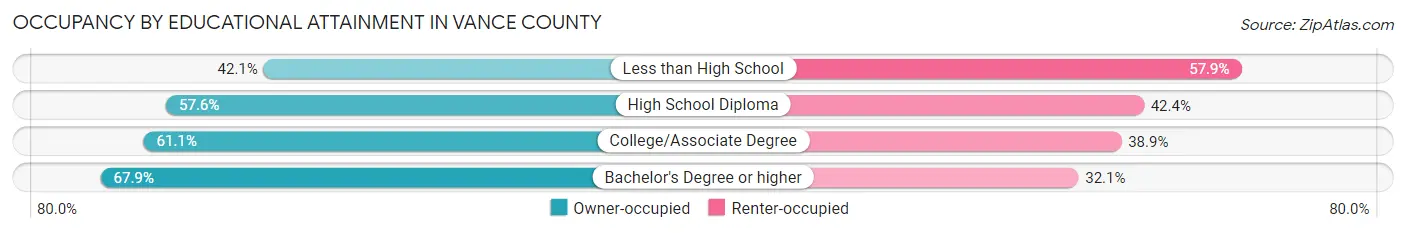
| Household Size | Owner-occupied | Renter-occupied |
| Less than High School | 790 (42.1%) | 1,087 (57.9%) |
| High School Diploma | 3,157 (57.6%) | 2,328 (42.4%) |
| College/Associate Degree | 3,422 (61.1%) | 2,176 (38.9%) |
| Bachelor's Degree or higher | 2,149 (67.9%) | 1,014 (32.1%) |
Occupancy by Age of Householder in Vance County
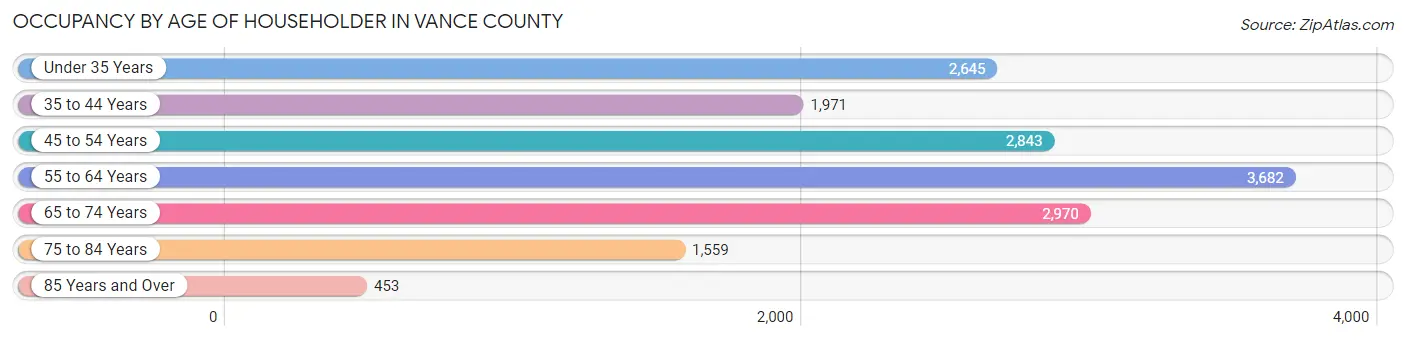
| Age Bracket | # Households | % Households |
| Under 35 Years | 2,645 | 16.4% |
| 35 to 44 Years | 1,971 | 12.2% |
| 45 to 54 Years | 2,843 | 17.6% |
| 55 to 64 Years | 3,682 | 22.8% |
| 65 to 74 Years | 2,970 | 18.4% |
| 75 to 84 Years | 1,559 | 9.7% |
| 85 Years and Over | 453 | 2.8% |
| Total | 16,123 | 100.0% |
Housing Finances in Vance County
Median Income by Occupancy in Vance County
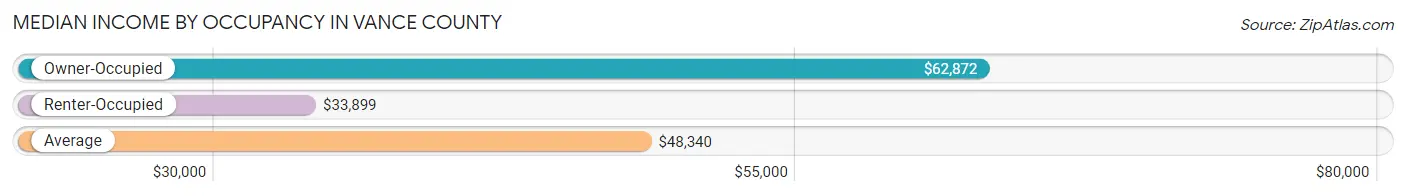
| Occupancy Type | # Households | Median Income |
| Owner-Occupied | 9,518 (59.0%) | $62,872 |
| Renter-Occupied | 6,605 (41.0%) | $33,899 |
| Average | 16,123 (100.0%) | $48,340 |
Occupancy by Householder Income Bracket in Vance County
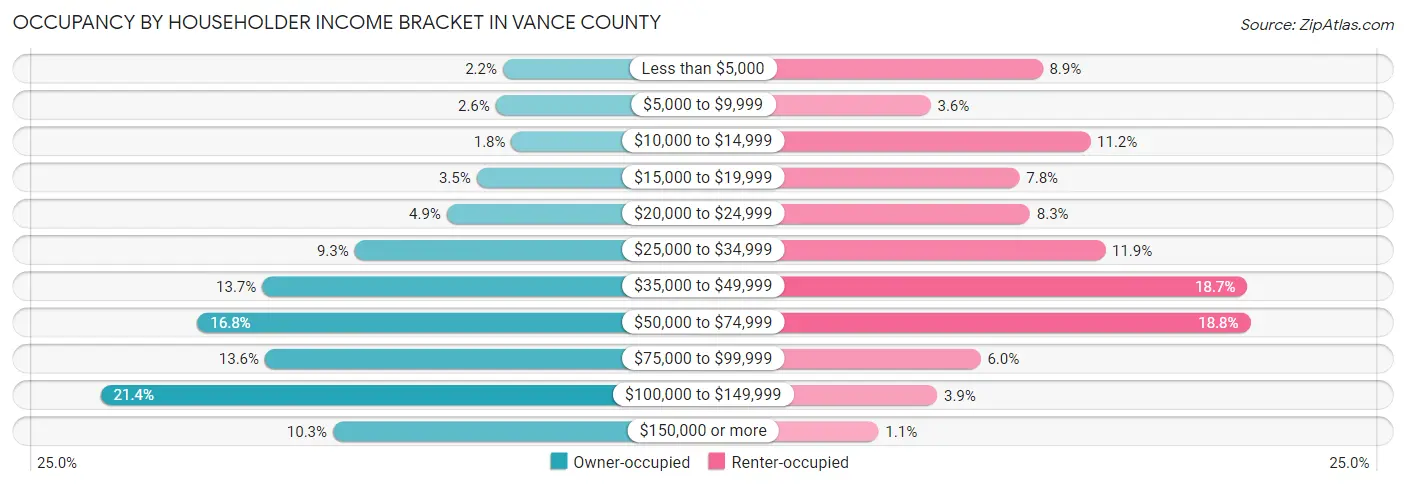
| Income Bracket | Owner-occupied | Renter-occupied |
| Less than $5,000 | 212 (2.2%) | 588 (8.9%) |
| $5,000 to $9,999 | 245 (2.6%) | 236 (3.6%) |
| $10,000 to $14,999 | 173 (1.8%) | 738 (11.2%) |
| $15,000 to $19,999 | 331 (3.5%) | 515 (7.8%) |
| $20,000 to $24,999 | 466 (4.9%) | 548 (8.3%) |
| $25,000 to $34,999 | 884 (9.3%) | 785 (11.9%) |
| $35,000 to $49,999 | 1,303 (13.7%) | 1,232 (18.6%) |
| $50,000 to $74,999 | 1,596 (16.8%) | 1,242 (18.8%) |
| $75,000 to $99,999 | 1,291 (13.6%) | 393 (5.9%) |
| $100,000 to $149,999 | 2,035 (21.4%) | 256 (3.9%) |
| $150,000 or more | 982 (10.3%) | 72 (1.1%) |
| Total | 9,518 (100.0%) | 6,605 (100.0%) |
Monthly Housing Cost Tiers in Vance County
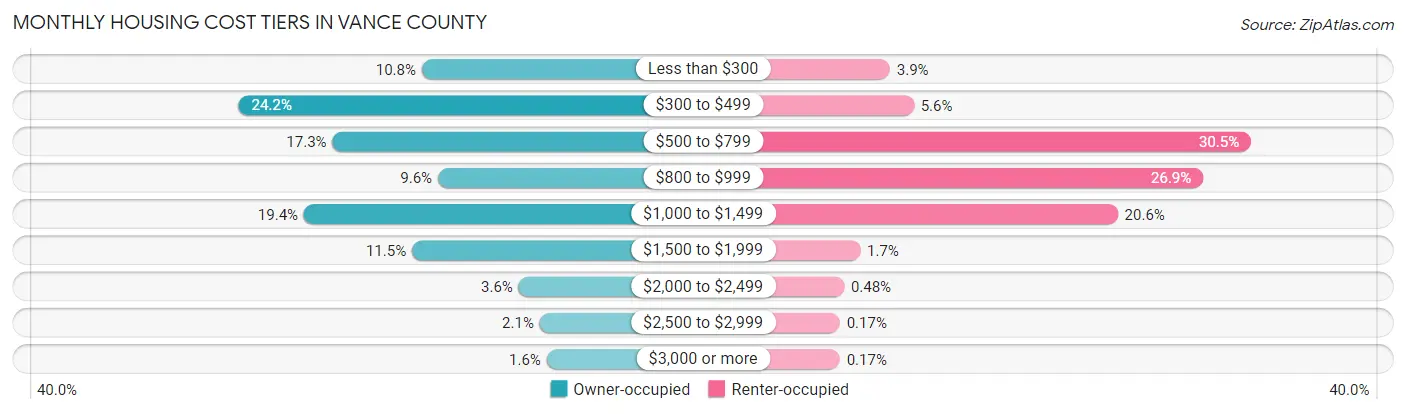
| Monthly Cost | Owner-occupied | Renter-occupied |
| Less than $300 | 1,023 (10.7%) | 255 (3.9%) |
| $300 to $499 | 2,307 (24.2%) | 371 (5.6%) |
| $500 to $799 | 1,649 (17.3%) | 2,012 (30.5%) |
| $800 to $999 | 910 (9.6%) | 1,779 (26.9%) |
| $1,000 to $1,499 | 1,849 (19.4%) | 1,363 (20.6%) |
| $1,500 to $1,999 | 1,092 (11.5%) | 110 (1.7%) |
| $2,000 to $2,499 | 344 (3.6%) | 32 (0.5%) |
| $2,500 to $2,999 | 196 (2.1%) | 11 (0.2%) |
| $3,000 or more | 148 (1.5%) | 11 (0.2%) |
| Total | 9,518 (100.0%) | 6,605 (100.0%) |
Physical Housing Characteristics in Vance County
Housing Structures in Vance County
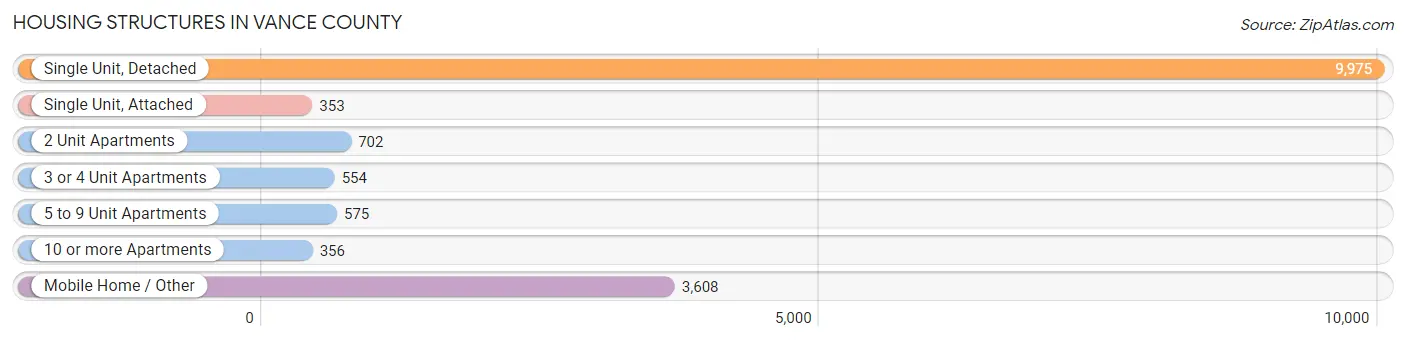
| Structure Type | # Housing Units | % Housing Units |
| Single Unit, Detached | 9,975 | 61.9% |
| Single Unit, Attached | 353 | 2.2% |
| 2 Unit Apartments | 702 | 4.3% |
| 3 or 4 Unit Apartments | 554 | 3.4% |
| 5 to 9 Unit Apartments | 575 | 3.6% |
| 10 or more Apartments | 356 | 2.2% |
| Mobile Home / Other | 3,608 | 22.4% |
| Total | 16,123 | 100.0% |
Housing Structures by Occupancy in Vance County
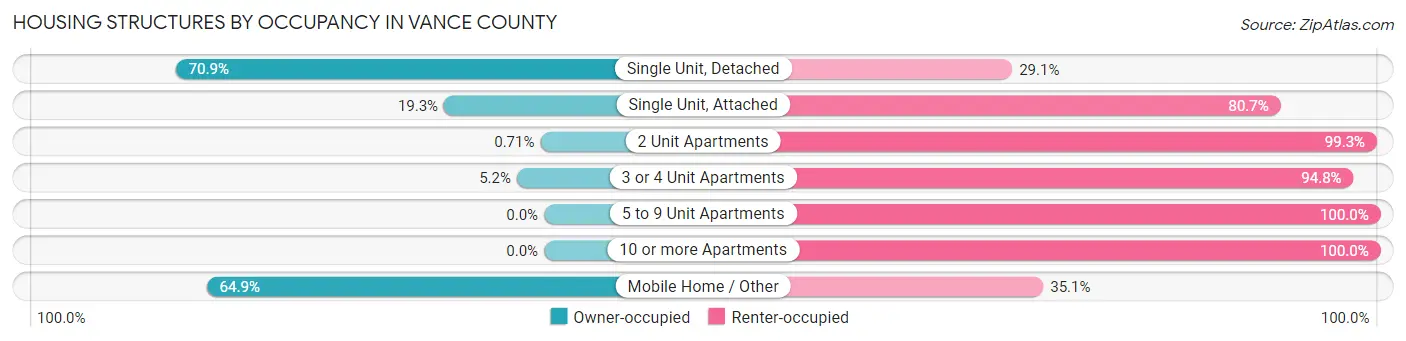
| Structure Type | Owner-occupied | Renter-occupied |
| Single Unit, Detached | 7,073 (70.9%) | 2,902 (29.1%) |
| Single Unit, Attached | 68 (19.3%) | 285 (80.7%) |
| 2 Unit Apartments | 5 (0.7%) | 697 (99.3%) |
| 3 or 4 Unit Apartments | 29 (5.2%) | 525 (94.8%) |
| 5 to 9 Unit Apartments | 0 (0.0%) | 575 (100.0%) |
| 10 or more Apartments | 0 (0.0%) | 356 (100.0%) |
| Mobile Home / Other | 2,343 (64.9%) | 1,265 (35.1%) |
| Total | 9,518 (59.0%) | 6,605 (41.0%) |
Housing Structures by Number of Rooms in Vance County
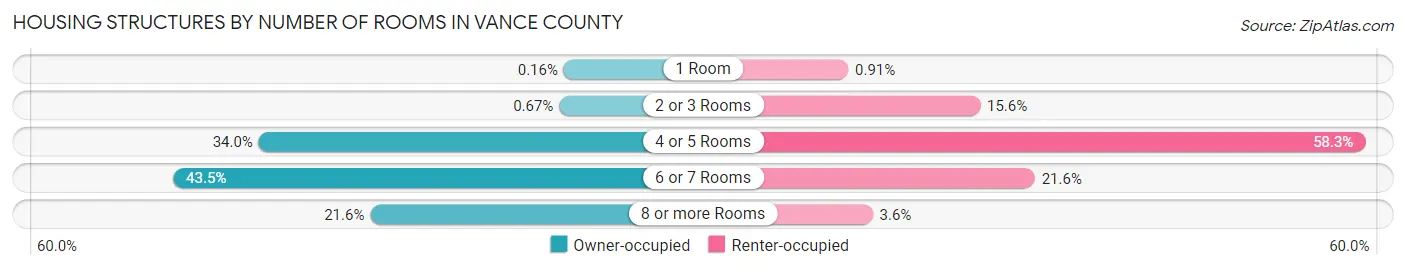
| Number of Rooms | Owner-occupied | Renter-occupied |
| 1 Room | 15 (0.2%) | 60 (0.9%) |
| 2 or 3 Rooms | 64 (0.7%) | 1,027 (15.5%) |
| 4 or 5 Rooms | 3,238 (34.0%) | 3,850 (58.3%) |
| 6 or 7 Rooms | 4,141 (43.5%) | 1,428 (21.6%) |
| 8 or more Rooms | 2,060 (21.6%) | 240 (3.6%) |
| Total | 9,518 (100.0%) | 6,605 (100.0%) |
Housing Structure by Heating Type in Vance County
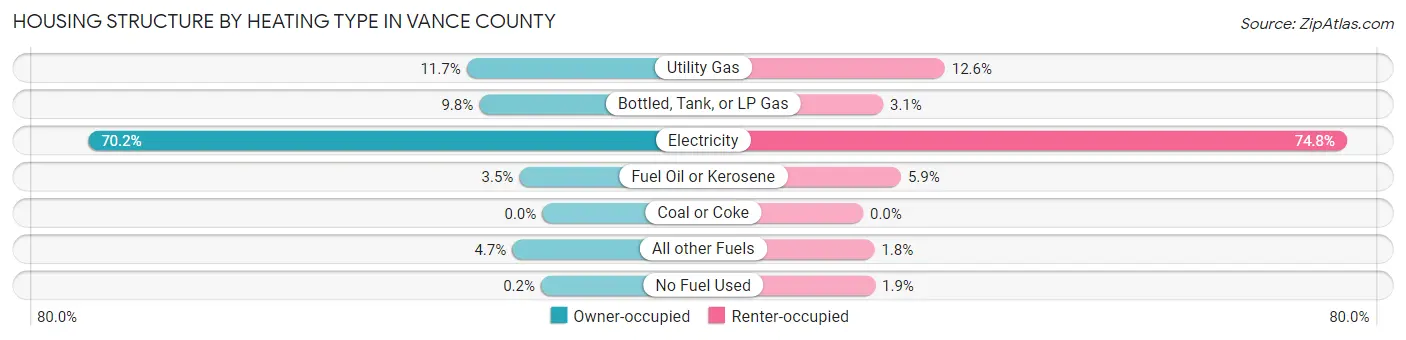
| Heating Type | Owner-occupied | Renter-occupied |
| Utility Gas | 1,113 (11.7%) | 835 (12.6%) |
| Bottled, Tank, or LP Gas | 928 (9.8%) | 204 (3.1%) |
| Electricity | 6,678 (70.2%) | 4,939 (74.8%) |
| Fuel Oil or Kerosene | 337 (3.5%) | 387 (5.9%) |
| Coal or Coke | 0 (0.0%) | 0 (0.0%) |
| All other Fuels | 443 (4.6%) | 117 (1.8%) |
| No Fuel Used | 19 (0.2%) | 123 (1.9%) |
| Total | 9,518 (100.0%) | 6,605 (100.0%) |
Household Vehicle Usage in Vance County
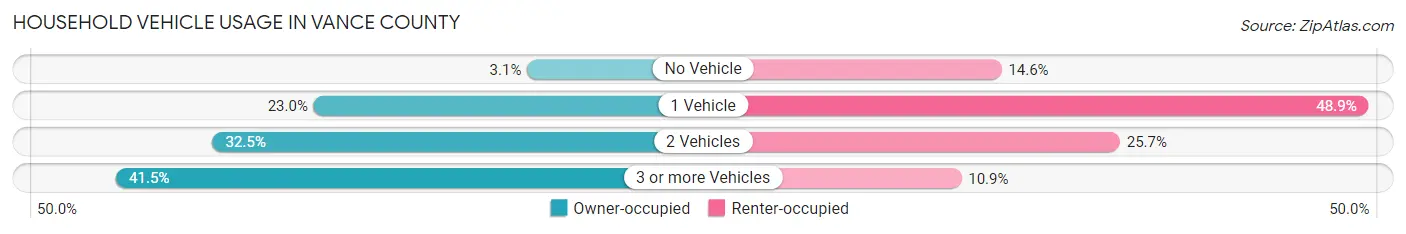
| Vehicles per Household | Owner-occupied | Renter-occupied |
| No Vehicle | 293 (3.1%) | 965 (14.6%) |
| 1 Vehicle | 2,190 (23.0%) | 3,228 (48.9%) |
| 2 Vehicles | 3,090 (32.5%) | 1,695 (25.7%) |
| 3 or more Vehicles | 3,945 (41.4%) | 717 (10.9%) |
| Total | 9,518 (100.0%) | 6,605 (100.0%) |
Real Estate & Mortgages in Vance County
Real Estate and Mortgage Overview in Vance County
| Characteristic | Without Mortgage | With Mortgage |
| Housing Units | 4,817 | 4,701 |
| Median Property Value | $107,400 | $156,100 |
| Median Household Income | $53,962 | $649 |
| Monthly Housing Costs | $428 | $137 |
| Real Estate Taxes | $1,029 | $119 |
Property Value by Mortgage Status in Vance County
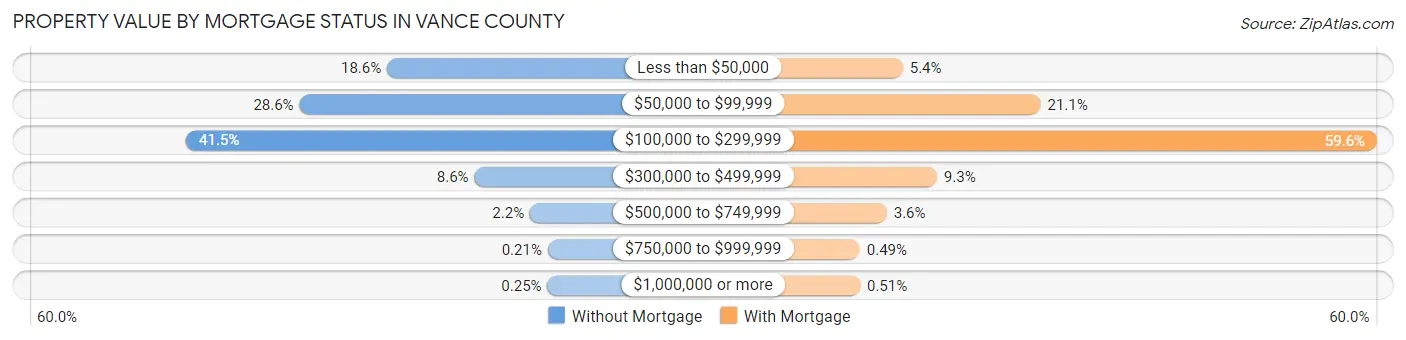
| Property Value | Without Mortgage | With Mortgage |
| Less than $50,000 | 895 (18.6%) | 254 (5.4%) |
| $50,000 to $99,999 | 1,377 (28.6%) | 994 (21.1%) |
| $100,000 to $299,999 | 2,001 (41.5%) | 2,801 (59.6%) |
| $300,000 to $499,999 | 414 (8.6%) | 437 (9.3%) |
| $500,000 to $749,999 | 108 (2.2%) | 168 (3.6%) |
| $750,000 to $999,999 | 10 (0.2%) | 23 (0.5%) |
| $1,000,000 or more | 12 (0.3%) | 24 (0.5%) |
| Total | 4,817 (100.0%) | 4,701 (100.0%) |
Household Income by Mortgage Status in Vance County
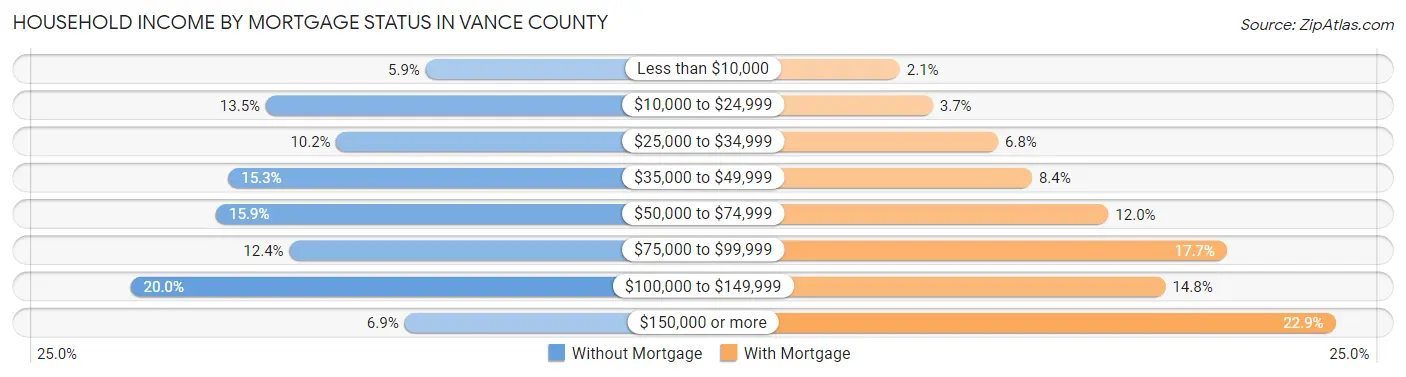
| Household Income | Without Mortgage | With Mortgage |
| Less than $10,000 | 284 (5.9%) | 99 (2.1%) |
| $10,000 to $24,999 | 651 (13.5%) | 173 (3.7%) |
| $25,000 to $34,999 | 489 (10.2%) | 319 (6.8%) |
| $35,000 to $49,999 | 737 (15.3%) | 395 (8.4%) |
| $50,000 to $74,999 | 765 (15.9%) | 566 (12.0%) |
| $75,000 to $99,999 | 597 (12.4%) | 831 (17.7%) |
| $100,000 to $149,999 | 961 (20.0%) | 694 (14.8%) |
| $150,000 or more | 333 (6.9%) | 1,074 (22.9%) |
| Total | 4,817 (100.0%) | 4,701 (100.0%) |
Property Value to Household Income Ratio in Vance County
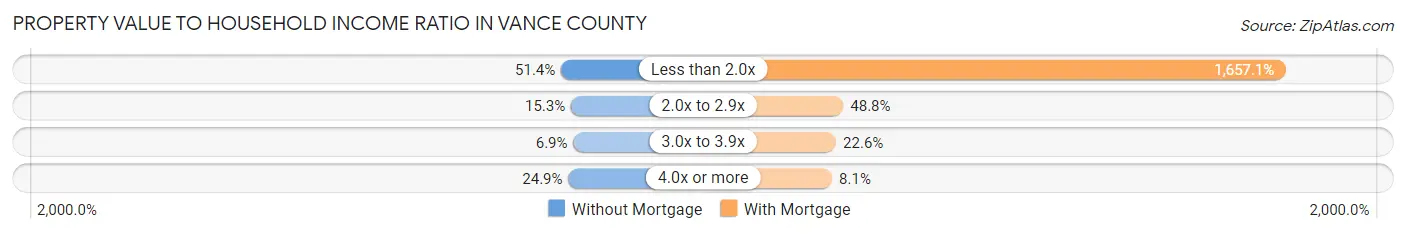
| Value-to-Income Ratio | Without Mortgage | With Mortgage |
| Less than 2.0x | 2,474 (51.4%) | 77,899 (1,657.1%) |
| 2.0x to 2.9x | 738 (15.3%) | 2,293 (48.8%) |
| 3.0x to 3.9x | 331 (6.9%) | 1,063 (22.6%) |
| 4.0x or more | 1,200 (24.9%) | 382 (8.1%) |
| Total | 4,817 (100.0%) | 4,701 (100.0%) |
Real Estate Taxes by Mortgage Status in Vance County
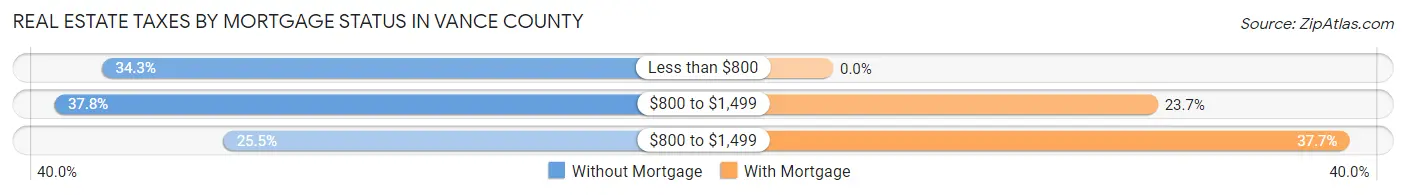
| Property Taxes | Without Mortgage | With Mortgage |
| Less than $800 | 1,652 (34.3%) | 0 (0.0%) |
| $800 to $1,499 | 1,820 (37.8%) | 1,115 (23.7%) |
| $800 to $1,499 | 1,226 (25.5%) | 1,773 (37.7%) |
| Total | 4,817 (100.0%) | 4,701 (100.0%) |
Health & Disability in Vance County
Health Insurance Coverage by Age in Vance County
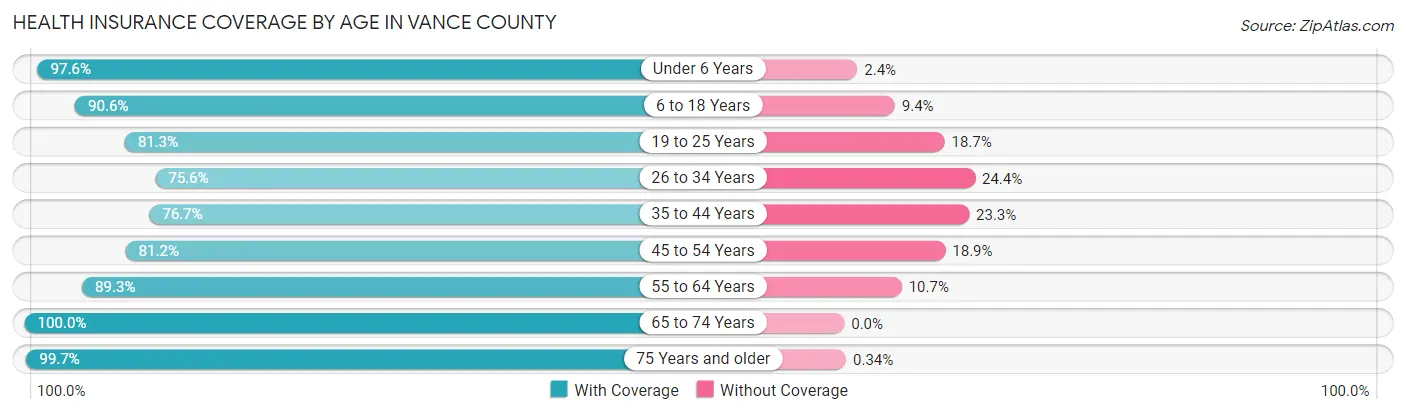
| Age Bracket | With Coverage | Without Coverage |
| Under 6 Years | 3,016 (97.6%) | 75 (2.4%) |
| 6 to 18 Years | 6,762 (90.6%) | 704 (9.4%) |
| 19 to 25 Years | 2,876 (81.3%) | 661 (18.7%) |
| 26 to 34 Years | 3,598 (75.6%) | 1,160 (24.4%) |
| 35 to 44 Years | 3,304 (76.7%) | 1,002 (23.3%) |
| 45 to 54 Years | 4,395 (81.1%) | 1,021 (18.9%) |
| 55 to 64 Years | 5,209 (89.3%) | 625 (10.7%) |
| 65 to 74 Years | 4,750 (100.0%) | 0 (0.0%) |
| 75 Years and older | 2,912 (99.7%) | 10 (0.3%) |
| Total | 36,822 (87.5%) | 5,258 (12.5%) |
Health Insurance Coverage by Citizenship Status in Vance County
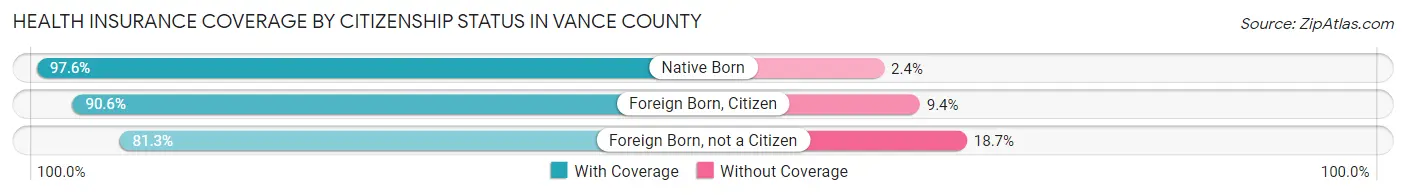
| Citizenship Status | With Coverage | Without Coverage |
| Native Born | 3,016 (97.6%) | 75 (2.4%) |
| Foreign Born, Citizen | 6,762 (90.6%) | 704 (9.4%) |
| Foreign Born, not a Citizen | 2,876 (81.3%) | 661 (18.7%) |
Health Insurance Coverage by Household Income in Vance County
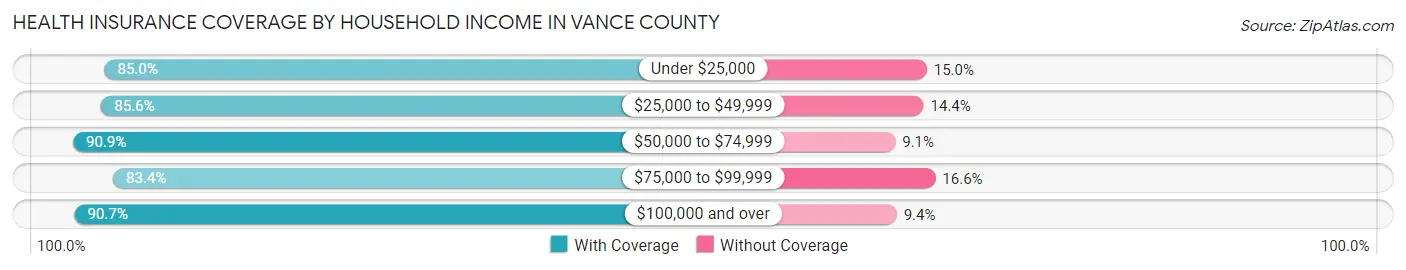
| Household Income | With Coverage | Without Coverage |
| Under $25,000 | 6,719 (85.0%) | 1,185 (15.0%) |
| $25,000 to $49,999 | 8,496 (85.6%) | 1,428 (14.4%) |
| $50,000 to $74,999 | 6,803 (90.9%) | 679 (9.1%) |
| $75,000 to $99,999 | 4,301 (83.4%) | 856 (16.6%) |
| $100,000 and over | 10,299 (90.6%) | 1,062 (9.3%) |
Public vs Private Health Insurance Coverage by Age in Vance County
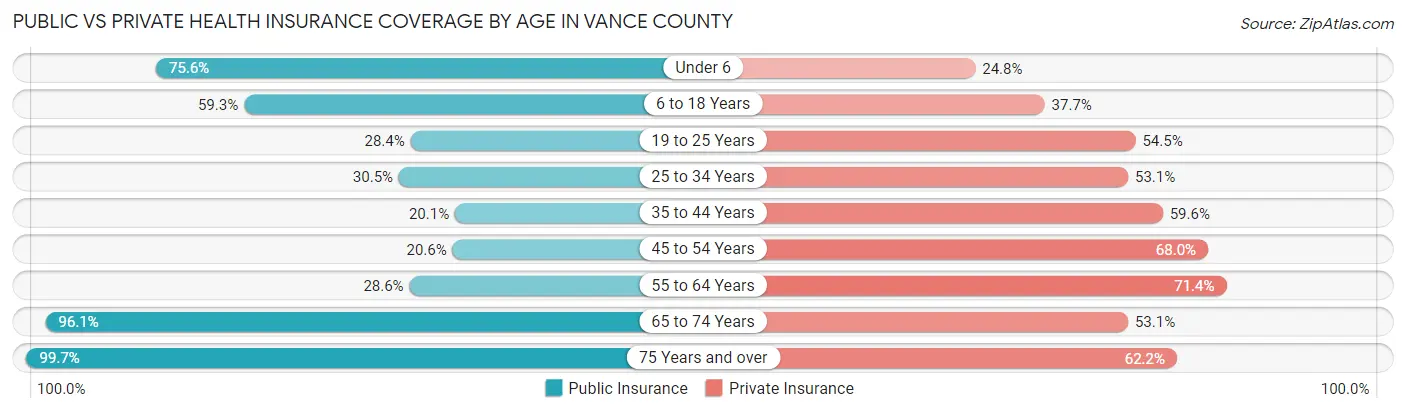
| Age Bracket | Public Insurance | Private Insurance |
| Under 6 | 2,337 (75.6%) | 766 (24.8%) |
| 6 to 18 Years | 4,426 (59.3%) | 2,811 (37.7%) |
| 19 to 25 Years | 1,003 (28.4%) | 1,928 (54.5%) |
| 25 to 34 Years | 1,452 (30.5%) | 2,528 (53.1%) |
| 35 to 44 Years | 866 (20.1%) | 2,565 (59.6%) |
| 45 to 54 Years | 1,114 (20.6%) | 3,680 (67.9%) |
| 55 to 64 Years | 1,667 (28.6%) | 4,164 (71.4%) |
| 65 to 74 Years | 4,566 (96.1%) | 2,523 (53.1%) |
| 75 Years and over | 2,912 (99.7%) | 1,817 (62.2%) |
| Total | 20,343 (48.3%) | 22,782 (54.1%) |
Disability Status by Sex by Age in Vance County
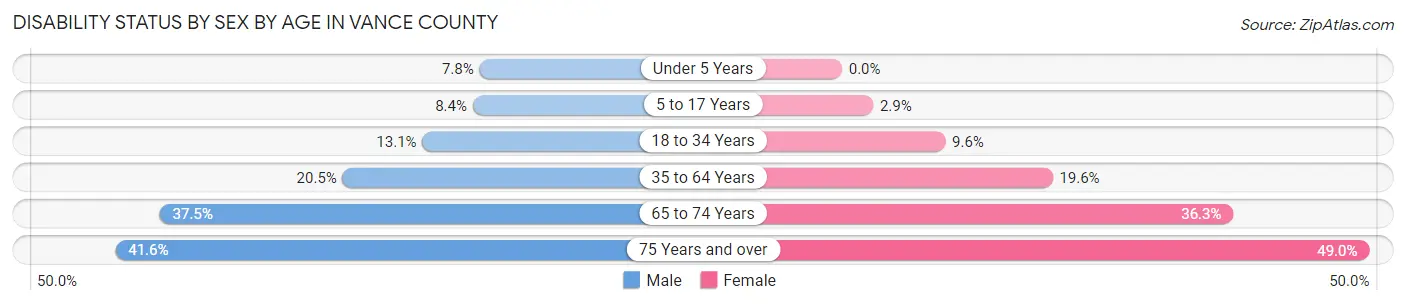
| Age Bracket | Male | Female |
| Under 5 Years | 113 (7.8%) | 0 (0.0%) |
| 5 to 17 Years | 304 (8.4%) | 107 (2.9%) |
| 18 to 34 Years | 555 (13.1%) | 434 (9.6%) |
| 35 to 64 Years | 1,460 (20.5%) | 1,648 (19.6%) |
| 65 to 74 Years | 797 (37.5%) | 953 (36.3%) |
| 75 Years and over | 459 (41.6%) | 890 (48.9%) |
Disability Class by Sex by Age in Vance County
Disability Class: Hearing Difficulty
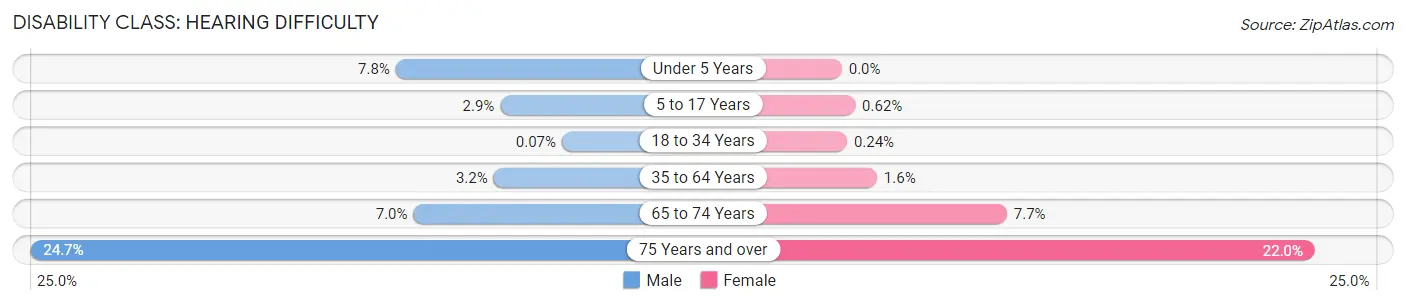
| Age Bracket | Male | Female |
| Under 5 Years | 113 (7.8%) | 0 (0.0%) |
| 5 to 17 Years | 106 (2.9%) | 23 (0.6%) |
| 18 to 34 Years | 3 (0.1%) | 11 (0.2%) |
| 35 to 64 Years | 231 (3.2%) | 137 (1.6%) |
| 65 to 74 Years | 148 (7.0%) | 201 (7.7%) |
| 75 Years and over | 273 (24.7%) | 399 (22.0%) |
Disability Class: Vision Difficulty
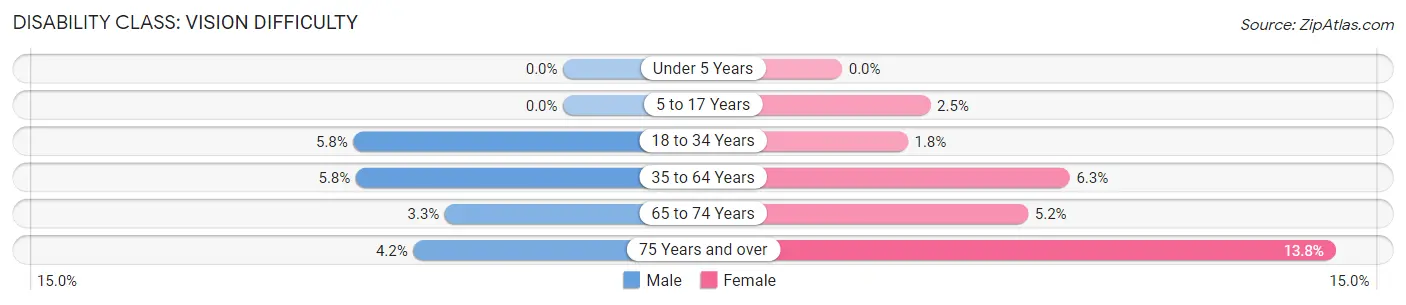
| Age Bracket | Male | Female |
| Under 5 Years | 0 (0.0%) | 0 (0.0%) |
| 5 to 17 Years | 0 (0.0%) | 91 (2.5%) |
| 18 to 34 Years | 248 (5.8%) | 83 (1.8%) |
| 35 to 64 Years | 411 (5.8%) | 534 (6.3%) |
| 65 to 74 Years | 70 (3.3%) | 136 (5.2%) |
| 75 Years and over | 46 (4.2%) | 250 (13.8%) |
Disability Class: Cognitive Difficulty
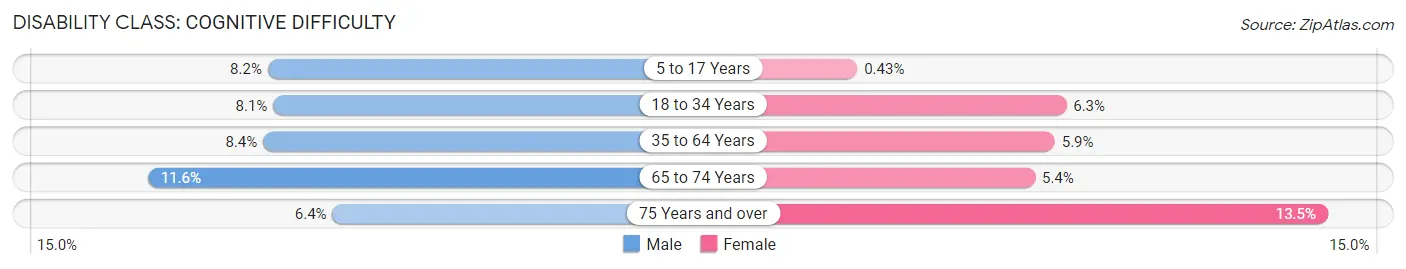
| Age Bracket | Male | Female |
| 5 to 17 Years | 298 (8.2%) | 16 (0.4%) |
| 18 to 34 Years | 343 (8.1%) | 283 (6.2%) |
| 35 to 64 Years | 596 (8.4%) | 500 (5.9%) |
| 65 to 74 Years | 246 (11.6%) | 141 (5.4%) |
| 75 Years and over | 71 (6.4%) | 246 (13.5%) |
Disability Class: Ambulatory Difficulty
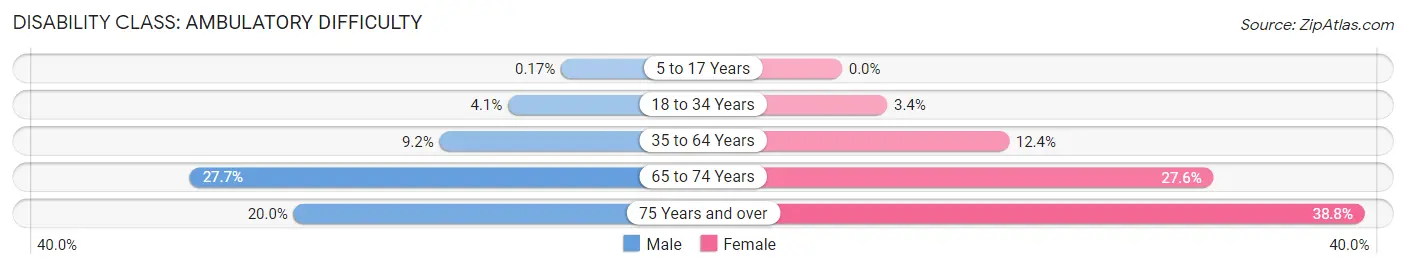
| Age Bracket | Male | Female |
| 5 to 17 Years | 6 (0.2%) | 0 (0.0%) |
| 18 to 34 Years | 174 (4.1%) | 152 (3.4%) |
| 35 to 64 Years | 655 (9.2%) | 1,045 (12.4%) |
| 65 to 74 Years | 590 (27.7%) | 724 (27.6%) |
| 75 Years and over | 221 (20.0%) | 706 (38.8%) |
Disability Class: Self-Care Difficulty
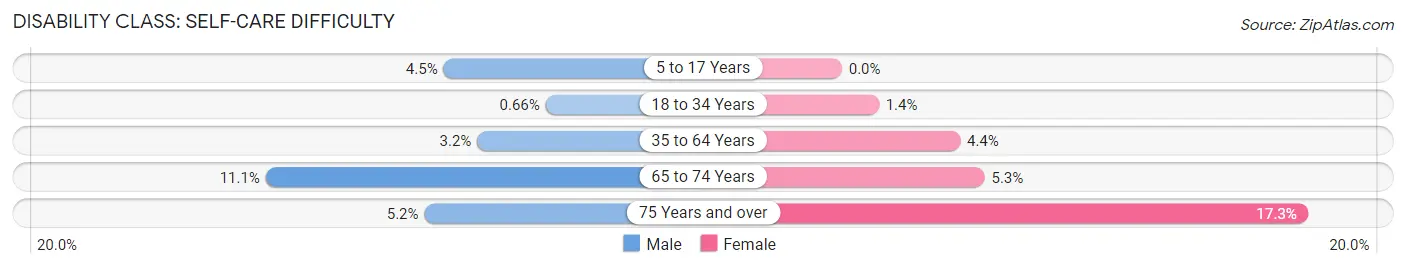
| Age Bracket | Male | Female |
| 5 to 17 Years | 161 (4.4%) | 0 (0.0%) |
| 18 to 34 Years | 28 (0.7%) | 62 (1.4%) |
| 35 to 64 Years | 228 (3.2%) | 370 (4.4%) |
| 65 to 74 Years | 235 (11.1%) | 139 (5.3%) |
| 75 Years and over | 57 (5.2%) | 315 (17.3%) |
Technology Access in Vance County
Computing Device Access in Vance County
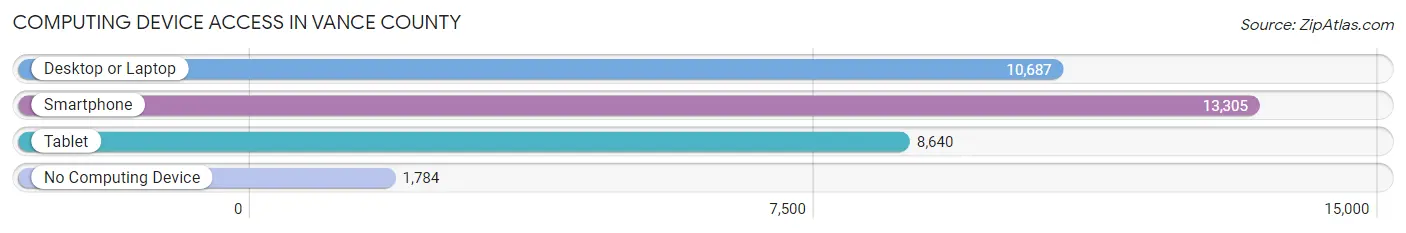
| Device Type | # Households | % Households |
| Desktop or Laptop | 10,687 | 66.3% |
| Smartphone | 13,305 | 82.5% |
| Tablet | 8,640 | 53.6% |
| No Computing Device | 1,784 | 11.1% |
| Total | 16,123 | 100.0% |
Internet Access in Vance County
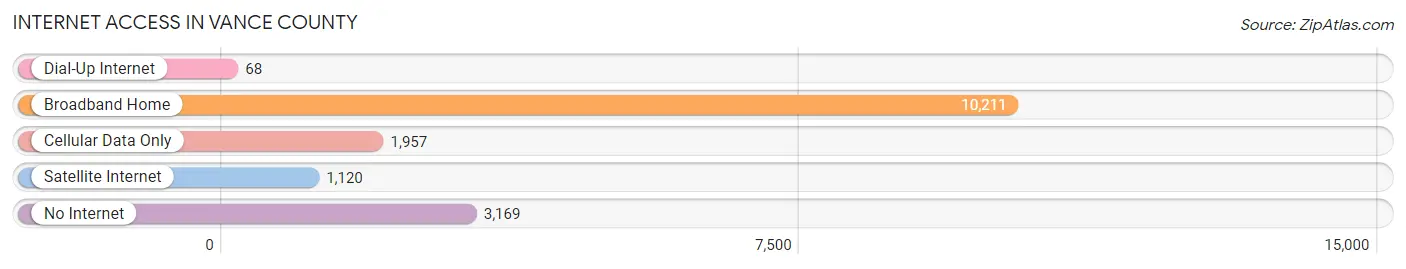
| Internet Type | # Households | % Households |
| Dial-Up Internet | 68 | 0.4% |
| Broadband Home | 10,211 | 63.3% |
| Cellular Data Only | 1,957 | 12.1% |
| Satellite Internet | 1,120 | 7.0% |
| No Internet | 3,169 | 19.7% |
| Total | 16,123 | 100.0% |
Vance County Summary
Vance County is located in the central part of North Carolina, and is part of the Raleigh-Durham-Chapel Hill metropolitan area. It is bordered by Granville, Franklin, Warren, and Halifax counties. The county seat is Henderson, and the county is named after Zebulon Baird Vance, a Confederate Civil War general and Governor of North Carolina.
Geography
Vance County covers an area of approximately 437 square miles, and is located in the Piedmont region of North Carolina. The terrain is mostly flat, with some rolling hills in the northern part of the county. The county is drained by the Tar River, which flows through the center of the county. The county is also home to Kerr Lake, a large reservoir on the Roanoke River.
Climate
Vance County has a humid subtropical climate, with hot, humid summers and mild winters. The average annual temperature is around 61°F, and the average annual precipitation is around 44 inches.
Demographics
As of the 2010 census, Vance County had a population of 45,422. The racial makeup of the county was 57.3% White, 37.2% African American, 0.5% Native American, 1.2% Asian, 0.1% Pacific Islander, 2.2% from other races, and 1.7% from two or more races. Hispanic or Latino of any race were 4.3% of the population.
Economy
Vance County has a diverse economy, with a mix of manufacturing, agriculture, and services. The county is home to several large employers, including the Kerr-Vance Academy, a private school, and the Vance County Schools, the county's public school system. The county is also home to several manufacturing companies, including the Henderson-based Eaton Corporation, which produces electrical components and systems.
Agriculture is also an important part of the county's economy. The county is home to several large farms, and is a major producer of tobacco, corn, soybeans, and other crops.
The county is also home to several tourist attractions, including the Kerr Lake State Recreation Area, which offers camping, fishing, and other outdoor activities. The county is also home to several historic sites, including the Vance County Courthouse, which was built in 1876.
Conclusion
Vance County is a diverse and vibrant county in central North Carolina. It is home to a mix of manufacturing, agriculture, and services, and is a major producer of tobacco, corn, and soybeans. The county is also home to several tourist attractions, including the Kerr Lake State Recreation Area, and several historic sites. With its diverse economy and rich history, Vance County is an attractive place to live and work.
Common Questions
What is the Total Population of Vance County?
Total Population of Vance County is 42,492.
What is the Total Male Population of Vance County?
Total Male Population of Vance County is 19,917.
What is the Total Female Population of Vance County?
Total Female Population of Vance County is 22,575.
What is the Ratio of Males per 100 Females in Vance County?
There are 88.23 Males per 100 Females in Vance County.
What is the Ratio of Females per 100 Males in Vance County?
There are 113.35 Females per 100 Males in Vance County.
What is the Median Population Age in Vance County?
Median Population Age in Vance County is 40.7 Years.
What is the Average Family Size in Vance County
Average Family Size in Vance County is 3.3 People.
What is the Average Household Size in Vance County
Average Household Size in Vance County is 2.6 People.
What is Per Capita Income in Vance County?
Per Capita income in Vance County is $26,771.
What is the Median Family Income in Vance County?
Median Family Income in Vance County is $58,310.
What is the Median Household income in Vance County?
Median Household Income in Vance County is $48,340.
What is Income or Wage Gap in Vance County?
Income or Wage Gap in Vance County is 23.4%.
Women in Vance County earn 76.6 cents for every dollar earned by a man.
What is Family Income Deficit in Vance County?
Family Income Deficit in Vance County is $11,843.
Families that are below poverty line in Vance County earn $11,843 less on average than the poverty threshold level.
What is Inequality or Gini Index in Vance County?
Inequality or Gini Index in Vance County is 0.46.
How Large is the Labor Force in Vance County?
There are 19,523 People in the Labor Forcein in Vance County.
What is the Percentage of People in the Labor Force in Vance County?
57.9% of People are in the Labor Force in Vance County.
What is the Unemployment Rate in Vance County?
Unemployment Rate in Vance County is 7.0%.